Static and Nonlinear Analysis of a Transmission Tower
14
Static and Nonlinear Analysis of a Transmission Tower
Transcript of Static and Nonlinear Analysis of a Transmission Tower

Static and Nonlinear Analysis
of a Transmission Tower
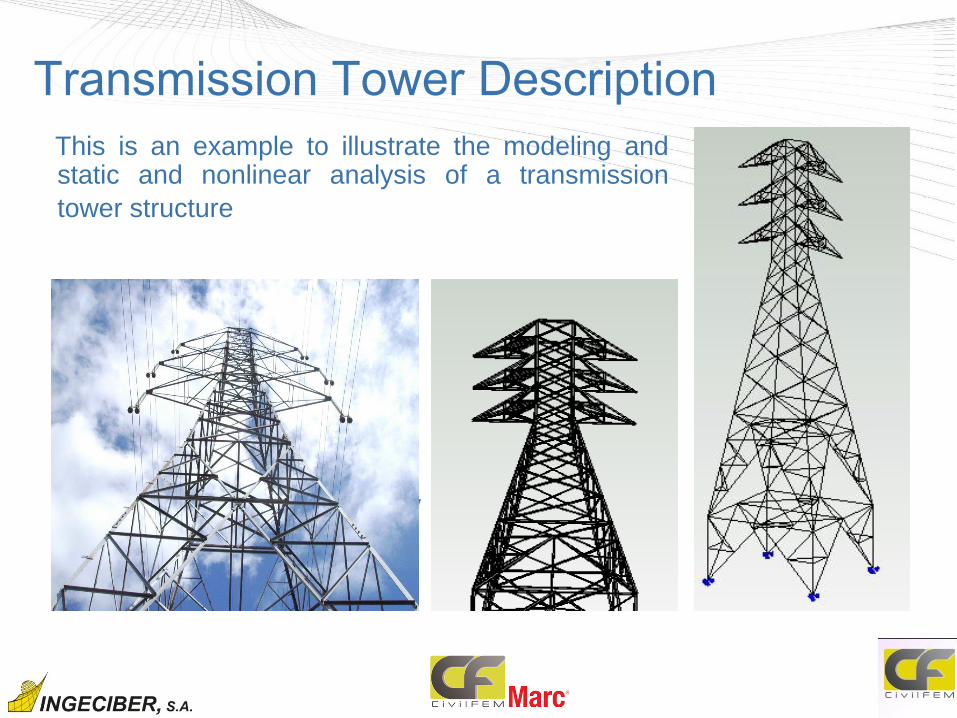
Transmission Tower Description
This is an example to illustrate the modeling and static and nonlinear analysis of a transmission
tower structure
The arches are connected by
bracing members form truss.

Transmission Tower Description
The tower is 68 feet high, 18 feet square at the base, 4 feet at
the top and has 6 cable-arms of 6 feet wide each.
The tower is made of
steel angles
(L3x3x1/2 and
L2x2x1/4). The loads
to consider are self-
weight, wind, and
cable loads.
The feet at the base of
the tower are fixed.

Transmission Tower Description
CivilFEM has a library that contains different types of steel materials and the most common steel sections (L, C, Double T, pipes, box) according to US and European standards.

Transmission Tower Description
All bars are created as single element beams,
working primarily under axial force
• Bars with section L3x3x1/4

Static Analysis The cables are simulated as point loads applied at the tip of the arms.
A load of 500 lbf in -z direction is applied to each of the six arm ends.
Wind load is divided in two levels with different pressures depending on height: High wind and Low wind.
Low wind
Wind Load Cable Load
High
wind
In the boundary conditions menu you
can enter the point constrains at the
bottom of the tower.

Static Analysis
CivilFEM allows the user to apply safety factors for different load groups
on each load case.
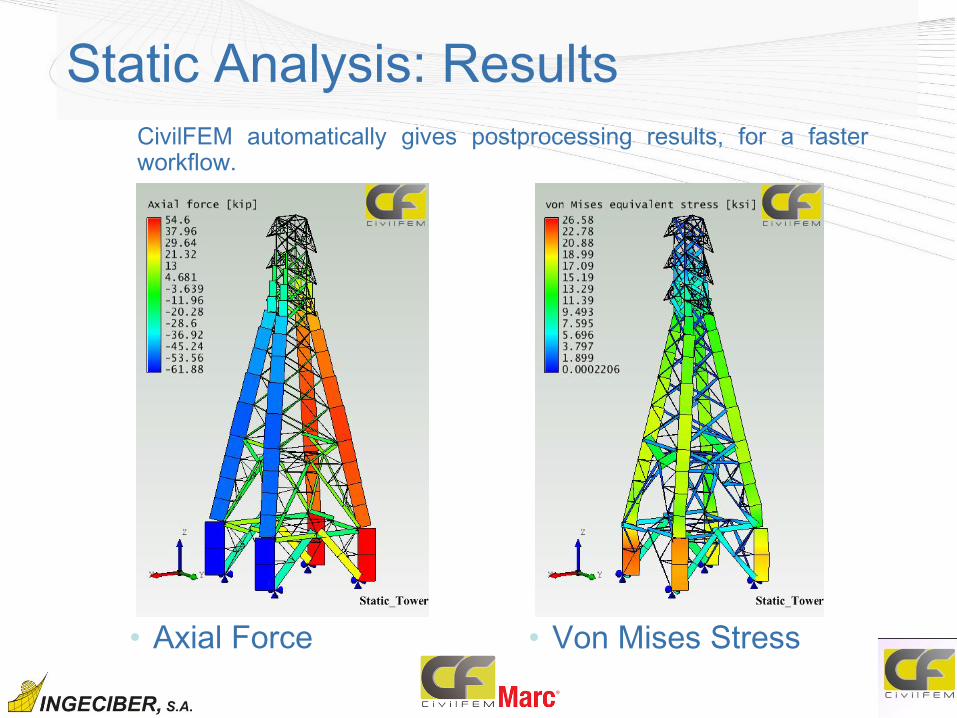
Static Analysis: Results
CivilFEM automatically gives postprocessing results, for a faster workflow.
• Axial Force
• Von Mises Stress

Static Analysis: Results
• Z-Component of Reaction
• X Displacement

Nonlinear Analysis
With CivilFEM, the user can perform a nonlinear analysis and obtain
the ratio of the collapsing force and the design load.
Wind load increases under different factors. We try to find the step in
which the analysis does not converge
Nonlinear Analysis
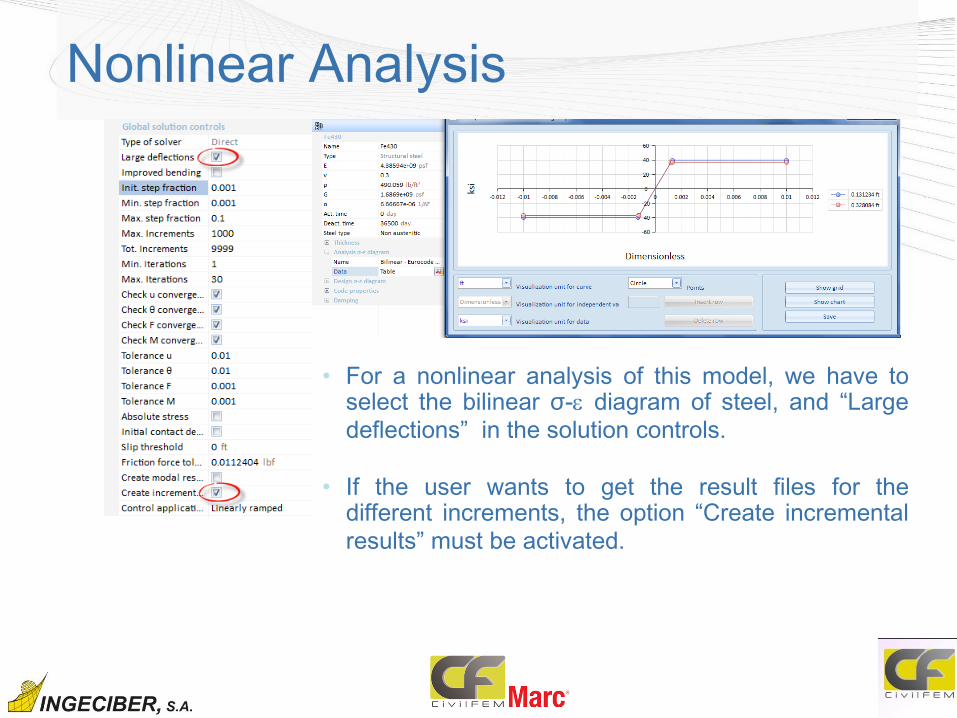
• For a nonlinear analysis of this model, we have to select the bilinear σ- diagram of steel, and “Large
deflections” in the solution controls.
• If the user wants to get the result files for the
different increments, the option “Create incremental
results” must be activated.

Nonlinear Analysis
• The load calculation time matches the load factor so a one to one correspondence between the last increment time and the load factor that caused the collapse exists (1.8 in this analysis)
Nonlinear Analysis
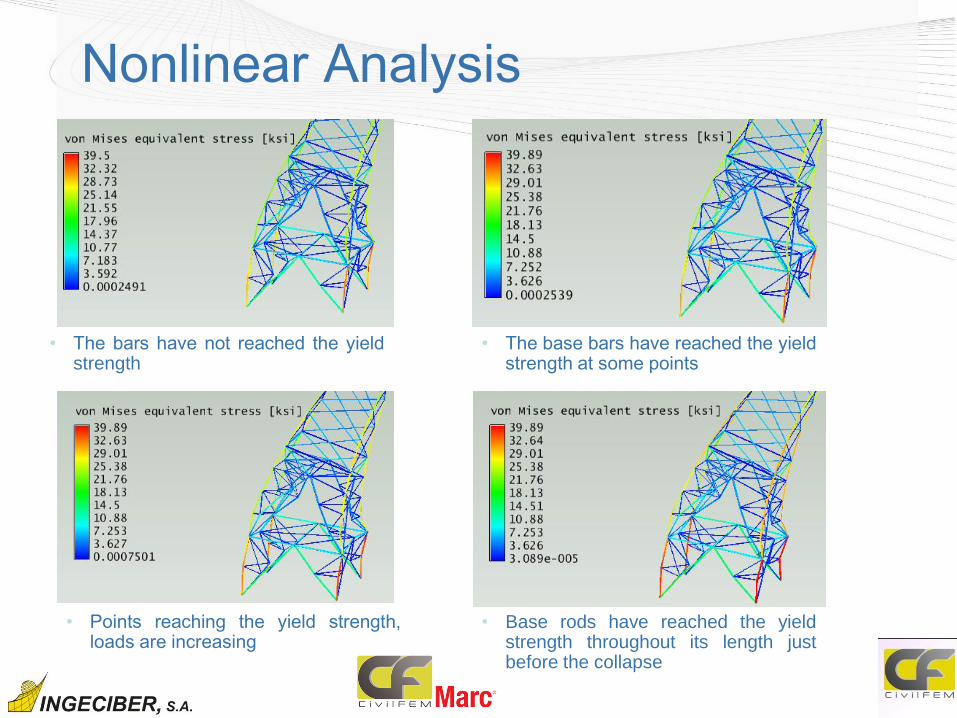
• The bars have not reached the yield strength
• The base bars have reached the yield strength at some points
• Points reaching the yield strength, loads are increasing
• Base rods have reached the yield strength throughout its length just before the collapse

Nonlinear Analysis
• X Displacement before collapse