static-content.springer.com10.1007... · Web viewWe propose a more resource-saving hierarchical...
17
Supplementary table 3 illustrates the classification rules for the novel classification: For a given sample, scores for staining percentage P and intensity I are obtained as usual. The grey region of the table indicates the PI combinations for which no definite decision is possible, i.e. samples where only a small percentage of cells show any staining. On the other hand, extreme PI combinations are assigned to one of the groups, e.g. for no staining at all to ICC (red cell) and for a large number of cells with intense staining to PDAC (blue cells). The optimal assignment of the hatched cells to one of the groups is marker dependent. The decision on the optimal rule is made analogously to cut-off optimization for the IRS based method: for each possible assignment combination, sensitivity and specificity are calculated and the assignment with highest sum of sensitivity and specificity is chosen as the final classification rule (again prone to over optimism). For indecisive cases, the application of a different marker could be helpful in the decision process and gradually increase diagnostic accuracy.
Transcript of static-content.springer.com10.1007... · Web viewWe propose a more resource-saving hierarchical...

Supplementary table 3 illustrates the classification rules for the novel classification: For a
given sample, scores for staining percentage P and intensity I are obtained as usual. The grey
region of the table indicates the PI combinations for which no definite decision is possible, i.e.
samples where only a small percentage of cells show any staining. On the other hand, extreme
PI combinations are assigned to one of the groups, e.g. for no staining at all to ICC (red cell)
and for a large number of cells with intense staining to PDAC (blue cells).
The optimal assignment of the hatched cells to one of the groups is marker dependent. The
decision on the optimal rule is made analogously to cut-off optimization for the IRS based
method: for each possible assignment combination, sensitivity and specificity are calculated
and the assignment with highest sum of sensitivity and specificity is chosen as the final
classification rule (again prone to over optimism). For indecisive cases, the application of a
different marker could be helpful in the decision process and gradually increase diagnostic
accuracy.
Supplementary figure 1 shows examples of mPDAC rated either staining intensity=1-2,
staining percentage=1-2 therefore according to the evaluated IRS of 2 (as calculated product)
classified as mPDAC.
This hierarchical approach is preferable over a marker panel in terms of saving resources, as
not the complete set of markers needs to be tested on each sample. The estimates for
sensitivity and specificity for this approach are based on the samples yielding a conclusive
decision only. Please note that differences in diagnostic performance between the approaches
that do or do not account for indecisive cases is small, if a small number of samples falls into
the indecisive region (grey cells).
We propose a more resource-saving hierarchical approach for the clinical practice that best
mimics the decision making process of the pathologists. First, the best univariate marker

ANXA10 is applied, and scores for intensity and staining percentage are obtained as usual. In
case of either few and/or weakly stained tumor cells, the staining is considered inconclusive.
Otherwise the sample is classified as mPDAC, if the percentage of stained cells exceeds 10%
at a moderate to strong intensity or ICC if no staining is observed. For the clinical condition
set, this method yields a correct classification of 76.7% for mPDAC and 86.4% for ICC
respectively. Among the 63 samples, no final decision could be made for 11 samples (17.5%).
Following the idea of the hierarchical approach, these samples would be evaluated by means
of a second marker. Unfortunately, none of the markers tested in the clinical condition set was
able to classify those samples with sufficient accuracy.
Figure 1: Heatmap: visualization of the best five markers´performance in clinical condition set

Figure 2: Boxplots of performance in ICC and PDAC for A: ANXA 1, B: ANXA 10, C: MUC5 AC, D: CK17, E: N-Cadherin in training and clinical condition set

Figure 3: Triple-panel (ANXA1, ANXA10, and CK17) in ICC and mPDAC (all images original magnification x400).
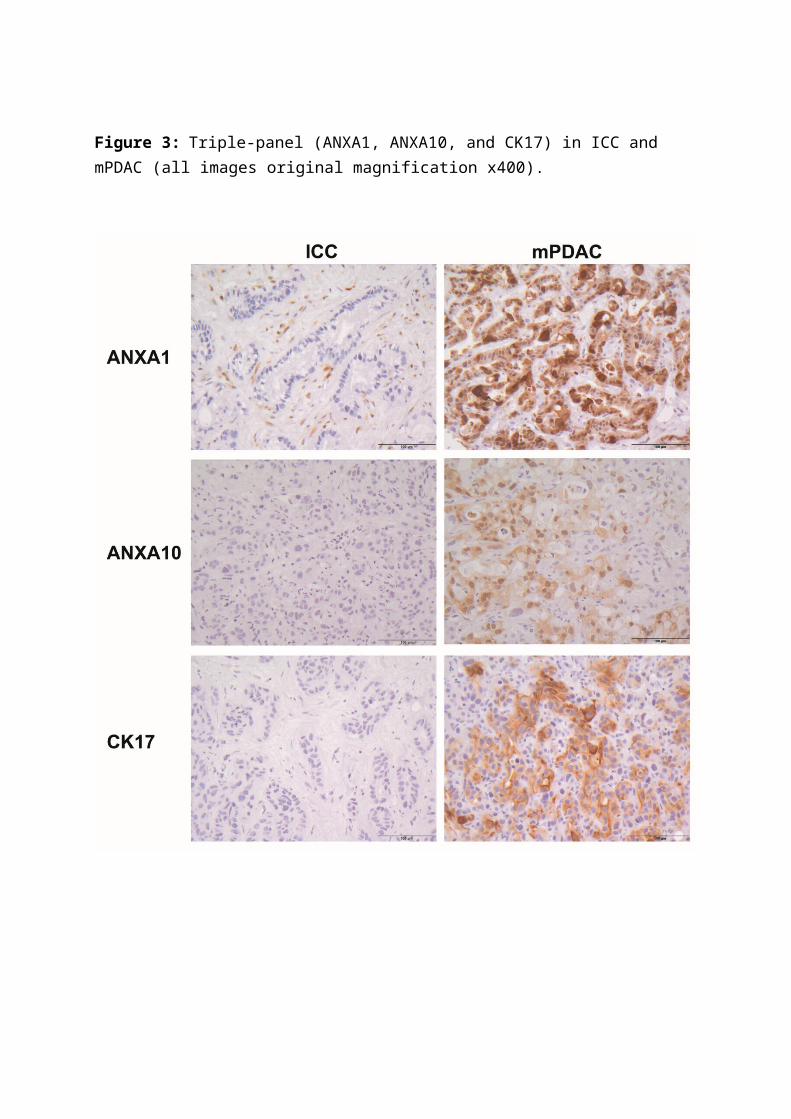
Table 1: Characteristics of univariate biomarkers comparing intrahepatic cholangiocarcinoma (ICC) tumor samples to metastatic pancreatic ductal adenocarcinoma (mPDAC) within the clinical condition set.
AUC
CI
lower, upper
p- value Classified
as mPDAC
if
percentage correctly classified
ICC
*Specificity
percentage correctly classified
PDAC
*Sensitivity
Annexin A1 0.750.619, 0.881
0.001> 3 55.6 91.7
Annexin A10
0.8300.733, 0.926
0.000> 1 85.2 75.0
MUC5 AC 0.7950.682, 0.907
0.000> 7 77.8 76.5
CK 17 0.6340.499, 0.769
0.077> 2 81.5 52.8
N-Cadherin 0.590.433, 0.746
0.230< 10 26.9 100

Supplementary Figure 1: ANXA10, weak staining in less than 10 % positive tumor cells (A: IRS=2; P= (percentage) 2, I (intensity)= 1; B: IRS = 2; P = (percentage) 1, I (intensity)= 2), all images original magnification x400

Supplementary Figure 2: Expression of ANXA1, ANXA10, MUC5-AC, CK17 and N-Cadherin in ICC and pPDAC (all images original magnification x200).

Supplementary Table 1:
Demographic patient data of tumor tissue in training set (ICC, pPDAC) and clinical condition
(ICC, mPDAC) set.
Set Entity Number Mean age (range) Male:Female
Training ICC 87 62 (28-81) 30:57
pPDAC 88 68 (45-94) 39:49
Clinical condition ICC 27 68 (50-88) 13:14
mPDAC 36 66 (50-80) 22:14

Antibody Company Clonality Clone HIER Dilution IncubationSecondary Antibody Company Dilution Incubation
PODXL Atlas Rb poly.pH9,0 20min.
WB /500 60min. RT - - - -
AGRN Abnova Rb poly.pH9,0 20min.
WB /75 30min. RT - - - -
Mucin 1 US Biological Ms mono Ma552pH9,0 20min.
WB /100 30min. RT - - - -
S100P BD Transduction Ms mono 16/S100PpH9,0 20min.
WB /100 30min. RT - - - -
VHL Santa Cruz Rb poly.pH9,0 20min.
WB /200 30min. RT - - - -
Muc5AC Glyco Vector Ms mono CLH2
pH9,0 20min. WB /100 30min. RT - - - -
CK17 Dako Ms mono E3pH9,0 20min.
WB /100 60min. RT - - - -
Laminin Dako Rb poly.pH9,0 20min.
WB /100 30min. RT - - - -
N Cadherin Invitrogen Ms mono 3B9pH9,0 20min.
WB /200 30min. RT - - - -
ELAC2 Atlas Rb poly.pH9,0 20min.
WB /50 30min. RT - - - -
HSPG2 Boster Rb poly.pH9,0 20min.
WB /750 30min. RT - - - -
Annexin A1 LS-Biosciences Ms mono 3A8pH9,0 20min.
WB /800 30min. RT
Annexin A10 Abnova Gt polypH9,0 20min.
WB /1000 30min. RTRb Anti
GtChemicon
AP106 /1000 30min.RT
Annexin A13 Atlas Rb polypH9,0 20min.
WB /500 30min. RT
Supplementary table 2

Supplementary data 2:
Each carcinoma specimen of the training set was punched for three 1-mm-thick tissue cores. All
TMAs were set up with three corresponding tumor-free liver tissue cores as controls. The biopsies
representing the clinical condition set were used as whole-mount sections.
After fixation in 4% buffered formalin, specimen were paraffin embedded (FFPE). From each FFPE
tissue 1-to-2 µm-thick sections were cut, dewaxed and pre-treated for further processing in an
automated staining device (Dako Autostainer, Dako Glostrup Denkmark and Ventana Benchmark,
Hoffmann-La Roche Basel, Switzerland). Antibodies and staining protocols in detail are given in
supplementary table 1. Equal in concentration and staining protocol, negative controls were incubated
with non-immune immunoglobulin instead of the primary antibody. Positive controls were taken from
tumor sections presenting a specific staining result during antibody establishment, respectively
included in every subsequent run.

Supplementary table 3:Diagnostic panel-chart for clinical
condition set
Score intensity (I)no stain weak moderate intense
Score percentage
(P)0 1 2 3
0 % 01-5 % 1
6-10 % 211-50 % 3>50 % 4
decision ICCindecision no definite diagnosisdecision marker dependingdecision PDAC

AUC
CI lower,
upper
p-value
classified as
PDAC
if
IRS
percentage correctly classified
ICC*Specificit
y
percentage
correctly
classified
PDAC*Sensitivity
Annexin A1 0.892 0.841, 0.942 0.000 >3.5 81.2 89.7
Annexin A10 0.805 0.739, 0.870 0.000 >0.5 65.5 88.5
Annexin A13 0.731 0.659, 0.803 0.000 <2.5 63.1 77.0
Mucin 1 0.498 0.412, 0.584 0.967 >0.5 16.7 94.3
AGRN 0.594 0.512, 0.676 0.030 <3.5 84.5 41.9
S100P 0.623 0.542, 0.703 0.005 >0.5 57.1 69.0
MUC5 AC 0.821 0.755, 0.886 0.000 >0.5 79.5 87.1
Laminin 0.651 0.574, 0.729 0.000 <3.5 96.4 34.1
VHL 0.711 0.634, 0.789 0.000 <7 50.0 86.7
CK 17 0.789 0.724, 0.853 0.000 >0.5 79.8 71.8
N-Cadherin 0.786 0.723, 0.848 0.000 <1.5 59.0 94.0
ELAC2 0.685 0.614, 0.757 0.000 <0.5 60.7 73.6
PODXL 0.594 0.521, 0.668 0.015 <10 44.6 77.4
HSPG2 0.588 0.508, 0.668 0.032 >0.5 63.5 58.6
Supplementary Table 4: Characteristics of univariate biomarkers comparing intrahepatic
cholangiocarcinoma (ICC) tumor samples to primary pancreatic ductal
adenocarcinoma (pPDAC) within the training set. Specificity is the rate of
correctly classified ICC samples and sensitivity the rate of correctly classified
pPDAC samples.


Supplementary Table 5
IRS 0 1 2 3 4 6 8 12
ICC 19 4 1 1 1 1 0 0
mPDAC 7 2 3 4 5 6 7 2