Statgraphics Online User Guide - Data Analysis Solutions online.pdf · 3.1 General Settings ......
39
STATGRAPHICS Online Statistical Analysis and Data Visualization System Revised 6/21/2012 Copyright 2012 by StatPoint Technologies, Inc. All rights reserved.
Transcript of Statgraphics Online User Guide - Data Analysis Solutions online.pdf · 3.1 General Settings ......

STATGRAPHICS Online
Statistical Analysis and Data Visualization
System
Revised 6212012
Copyright 2012 by StatPoint Technologies Inc
All rights reserved
ii
Table of Contents
Introduction 1
Chapter 1 Getting Started 2
11 Creating a User Account 2
Chapter 2 Entering and Manipulating Data 4
21 Entering Data into the Data Editor 4 22 Opening a Sample Dataset 9 23 Opening a User File 9
24 Formatting Data 11 25 Managing Data Files 11
Chapter 3 Selecting System Preferences 13
31 General Settings 13 32 Internationalization 15
33 Fonts 16 34 Graphics 17 35 Fills 18
36 Lines 19 37 Points 20
Chapter 4 ndash Running Statistical Procedures 21
41 Data Input 21
42 Analysis Options 24 43 Tables and Graphs 25
44 Results to Save 28 45 Calculate 28 46 Preferences 30
47 Save Script 30
Chapter 5 ndash Working with Scripts 31
Chapter 6 ndash STATLETS 33
Index 37
1
Introduction
STATGRAPHICS Online is a statistical package that allows you to perform a wide
variety of statistical analyses from within your web browser There is no need to
download any software since all calculations are done on a remote server Using
ASPNET data is submitted to a STATGRAPHICS XML web service running on a
remote computer which analyzes the data and returns both tabular and graphical results
to the web browser Data may reside anywhere including your local computer
To use STATGRAPHICS Online go to wwwstatgraphicsonlinecom The introductory
page gives several hints about using the program
Click on the Terms and Conditions link to read the conditions under which the software
is provided If you accept the terms and conditions check the indicated box and press the
Begin button to start analyzing data
2
Chapter 1 Getting Started STATGRAPHICS Online can analyze data residing in various types of files including
Excel workbooks XML files or delimited text files The main page which is displayed
when you start the program shows the name of the current data file together with a
summary of the variables that it contains
Initially an empty data file named Untitled is created containing 10 columns and 100
rows If you wish to try out the statistical procedures using sample datasets provided by
StatPoint Technologies you can select any menu item from the main item If you wish to
analyze your own data you must first login using the link in the upper right corner of the
page
11 Creating a User Account
In order to analyze your own data you must first create a user account When you press
the Login link you will see the following input fields
3
If you have already created a user account enter your user name and password
Otherwise click on Create a new account
User names contain 1 to 16 characters and are used to identify data files belonging to an
individual user Both your user name and e-mail address cannot already be in use If you
have forgotten your user name andor password use the links on the first login screen
When you press the Create User button a password for your account will be
automatically generated and sent to the e-mail address that you enter Once your
password is received return to the first Login screen and enter it After you login you
will be returned to the main page You can change your password by selecting My
Account under Edit on the main menu
4
Chapter 2 Entering and Manipulating Data
To enter data into STATGRAPHICS Online you have several choices
1 Press the Edit Data button on the main page to load the data editor This will
display a datasheet of rows and columns into which you may type data You can
also use your systemrsquos clipboard to copy and paste data from other applications
2 Select File ndash Open Sample Dataset to load one of StatPointrsquos sample datasets
3 Select File ndash Open User Data File ndash From Client to load a data file residing on
your computer
4 Select File ndash Open User Data File ndash From Server to load a data file that you have
previously saved on the server
5 Leave the data file as Untitled and select a statistical procedure from the main
menu A sample dataset with data appropriate for the procedure you selected will
then automatically be loaded
21 Entering Data into the Data Editor
When you press the Edit Data menu on the main page the Data Editor page shown
below will be displayed
5
The Data Editor contains a data book with two sheets one sheet for Input data that you
wish to analyze and a second sheet into which calculated Results will be placed You can
switch between the two sheets using the toolbar along the bottom of the page To enter
data simply type it into the cells of the table You should also assign meaningful names
to the columns of the table Column names are used to select data while in the statistical
procedures and are displayed on tables and graphs You can also use the row beneath to
column names to indicate additional information about each column such as the unit of
measurement A typical completed data sheet is shown below
6
The menu across the top of the Data Editor page allows you to perform several important
operations To save data you have entered select Save File As which will display the
following page
You may save data in any of the indicated formats If you plan to use the data only with
STATGRAPHICS Online we recommend that you save it as a STATGRAPHICS sgd
file SGD files are XML files designed to contain information in a format that can be
easily manipulated by the statistical procedures A typical example is shown below
7
ltxml version=10gt
ltstatgraphics_datagt
ltFORMATgt
ltDateOrdergtMDYltDateOrdergt
ltDateSeparatorgtltDateSeparatorgt
ltDecimalSymbolgtltDecimalSymbolgt
ltFORMATgt
ltCOLUMNSgt
ltC1 name=Make type=Cgt
ltC2 name=Model type=Cgt
ltC3 name=Type type=Cgt
ltC4 name=Min Price type=N comment=price for basic version in $1000gt
ltC5 name=Mid Price type=N comment=average of min and max pricesgt
ltCOLUMNSgt
ltROWgt
ltC1gtAcuraltC1gt
ltC2gtIntegraltC2gt
ltC3gtSmallltC3gt
ltC4gt129ltC4gt
ltC5gt159ltC5gt
ltROWgt
ltROWgt
ltC1gtAcuraltC1gt
ltC2gtLegendltC2gt
ltC3gtMidsizeltC3gt
ltC4gt292ltC4gt
ltC5gt339ltC5gt
ltROWgt
ltstatgraphics_datagt
It contains information about how the data is formatted column names and comments
and the raw data You can also edit SGD files in any text editor provided you maintain
the same basic format
Other operations that you can perform in the Data Editor include
1 Pasting columns of data from other applications ndash First copy data from the
other applications to the system clipboard In the STATGRAPHICS data sheet
highlight the location at which you wish to paste the data Then click on the Copy
button in the lower toolbar
2 Paging within large datasets ndash To reduce the amount of information that must be
sent between your browser and the server large datasets are displayed in blocks
of 100 rows each You can page between blocks using the arrows on the lower
toolbar
8
3 Printing data ndash Click on the printer icon on the lower toolbar to send a copy of
the data to your printer
4 Cancel entries ndash As you make changes to your data they are changed within the
browser but not sent to the server until
a You perform an operation such as selecting something from the menu that
causes a new page to be posted
b You click on Update on the lower toolbar
To undo all input since the last post to the server click on Cancel on the lower
toolbar NOTE changes posted to the server are not permanent until you select
File Save from the top menu
5 Delete rows columns or cells ndash Highlight the data to be deleted and select Delete
from the top menu
6 Insert rows columns or cells ndash Highlight the data after which space is to be
added and select Insert from the top menu
7 Sort data ndash Highlight a single column and select Rows ndash Sort to sort data
according to the values in the highlighted column
After you enter and save the data press Cancel to return to the main page The name of
the saved file and a summary of its contents will be displayed
9
The summary shows
1 Nonmissing values ndash the number of rows in the column for which an entry has
been made Empty cells will be treated as missing values by the statistical
procedures
2 Numeric values ndash the number of rows in the column that have valid numeric
entries When performing a statistical operation that requires numeric values only
these cells will be used in the analysis
3 Minimum and maximum ndash the smallest and largest values in the column For
columns with no numeric values this is based on an alphanumeric comparison
22 Opening a Sample Dataset
StatPoint Technologies has provided a collection of sample datasets that may be loaded
by selecting File ndash Open Sample Dataset Choose the file to be loaded and press Open
Dataset
23 Opening a User File
Users may also open data files from their client machine by selecting File ndash Open User
Data File ndash From Client This will display the page shown below
10
Press the Browse button to search your computer for the file that you wish to load
Indicate the type of file it is and press Open File This will
1 Upload a copy of the file to the STATGRAPHICS Online server
2 Make the selected data file the active file for access by the statistical procedures
You will then be returned to the main page
NOTES
1 If you wish to restrict the program (and yourself) from making changes to the
input file select Open in readonly mode You will still be able to display the data
in the data editor but you will not be able to make changes to it
2 If you read an Excel file only the data in the first sheet of the Excel workbook
will be copied to the server and loaded If you make changes to the file and resave
it on the server please remember that it contains only that one sheet
3 The first two rows of Excel files and text files are assumed to contain column
names and comments If they do not you may have to make adjustments to the
data in the data editor by inserting additional blank rows at the top of the file
11
24 Formatting Data
When you read data from external files (non-STATGRAPHICS files) the data is
assumed to follow the formatting conventions of your current locale This is also true
when you type data into the Data Editor The settings that affect how data are read are
1 Decimal separator ndash the symbol placed to the left of the first decimal digit (either
a period or a comma)
2 Date delimiter ndash usually a slash () period () or dash (-)
3 Date order ndash usually Month-Day-Year or Day-Month-Year
You should be sure that the data in your files follows the conventions of your locale
NOTE you can specify a different format for the statistical output if desired by changing
the setting under Edit ndash Preferences on the main menu
25 Managing Data Files
The File menu contains a selection titled Manage Data Files that allows you to perform
common operations on user data files that have been saved on the server It displays the
page shown below
The buttons perform the following operations
12
Rename ndash To rename a file select the file you wish to rename from the drop down list
Then enter a new name for the file NOTE since this option does not change the contents
of the file the file extension should usually not be changed
Copy ndash To create a copy of a file select the file you wish to copy from the drop down
list Then enter a name for the new file NOTE since this option does not change the
contents of the file the file extension of the new file should usually be the same as the
original file
Delete ndash To delete a file select the file you wish to copy from the drop down list Check
the Okay to delete file box and press Delete
Download ndash This option is designed to allow you to download a file from the server to
your client computer Select the file you wish to copy from the drop down list When you
press download a link will be added to the page specifying the URL necessary to access
that file You can then use your browserrsquos capabilities to download the file to your
computer
Upload - This option is designed to allow you to upload a file from your client computer
to the server Use the Browse button to locate the file you wish to upload and then press
Upload
13
Chapter 3 Selecting System Preferences
The Edit menu contains a selection titled Set Preferences that allows you to change the
default settings used by STATGRAPHICS Online It consists of multiple pages each
similar to the page shown below
31 General Settings
The General Settings page allows you to specify the following settings
Significant digits ndash the number of significant digits shown when displaying
numeric values
Default confidence level ndash the confidence level used by default when creating
interval estimates and hypothesis tests and that used by the StatAdvisor when
interpreting statistical results
Rows to display in tables ndash the maximum number of rows displayed when a table
is created This prevents tables from becoming excessively large when analyzing
large datasets
14
Table width in characters ndash the maximum number of characters displayed across
the page when outputting a table Tables exceeding this width will be displayed in
multiple segments
StatAdvisor ndash controls whether StatAdvisor information is displayed after tables
and graphs The StatAdvisor interprets the statistical output
Missing value indicator ndash a special indicator used in user data files to indicate
missing data if any Empty cells are always interpreted as containing missing
values
15
32 Internationalization
Output language ndash the language used in output tables and graphs Currently input
pages are only available in English
Decimal separator ndash the decimal separator to be used in displaying output All
numeric values on input pages and in user data files are assumed to follow the
conventions of the current locale setting for your computer
Date separator - the date separator to be used in displaying output All date and
date-time values on input pages and in user data files are assumed to follow the
conventions of the current locale setting for your computer
Date format - the format for months days and years to be used in displaying
output A double letter such as mm requests that numbers below 10 be written
with a leading zero All date and date-time values on input pages and in user data
files are assumed to follow the conventions of the current locale setting for your
computer
16
33 Fonts
This page controls the fonts used when outputting tables and graphs Press the
Foreground and Background buttons to display the available colors that may be selected
in the dropdown lists
17
34 Graphics
Graph width and height ndash the size of graphs in pixels
Function resolution ndash the number of X values at which functions will be
evaluated when drawn on a graph Higher resolution results in smoother curves
Contour plot resolution ndash the number of X and Y values at which a function will
be evaluated when contour plots are created Higher resolution results in smoother
divisions between the contour levels
Graph background color ndash the color displayed within the axes of a graph
Graph border color ndash the color displayed outside the axes of a graph
3D effects ndash whether 3D effects are used around the frame of a graph and when
displaying filled areas such as bars and pie slices
18
35 Fills
Graphs may contain up to 20 different types of filled areas You may change the color
andor type of fill used in each area
19
36 Lines
Graphs may contain up to 20 different line types You may change the color andor type
of each line
20
37 Points
Graphs may contain up to 20 different point types You may change the size color andor
type of each point set
21
Chapter 4 ndash Running Statistical Procedures
The main menu provides access to a large collection of statistical procedures After
opening the file containing the data you wish to analyze use the menu to select the
desired procedure For example suppose you wished to analyze the data contained in the
sample dataset titled ldquoShelf Life Studyrdquo This dataset contains 44 samples of different
ages For each sample the number of weeks since it was produced is recorded as is the
concentration of chlorine Select File ndash Open Sample Dataset to open the desired file
Then select Relate ndash Simple Regression from the main menu as shown below
41 Data Input
Whenever you select a statistical procedure from the main menu a page will be displayed
on which to specify the columns containing the data that you wish to analyze The initial
page for the Simple Regression procedure is shown below
22
You can specify the name of a variable in either of two ways
1 Press the arrow to dropdown the list of variables and select the desired column
2 Press the Edit button to the right of the column to display an edit field to the right
of the button as shown below
You can type any valid STATGRAPHICS expression into the edit field such as the
expression above which will calculate the natural logarithms of chlorine Then press
the arrow button to put the edit field contents into the dropdown list
STATGRAPHICS expressions are described in detail in the document
wwwstatpointcomSTATGRAPHICS Operatorspdf
Each Data Input page also contains a Select field which can be used to select a subset
of the rows in the file Typical entries include
23
Entry Use Example
FIRST (k) Selects the first k rows FIRST(25)
LAST (k) Selects the last k rows LAST(25)
ROWS (startend) Selects rows between start and end inclusive
ROWS(2130)
RANDOM (k) Selects a random set of k rows RANDOM(25)
EXCLUDE(k) Selects all rows except row k EXCLUDE(25)
column = value Selects only rows for which column equals value
weeks = 30
column ltgt value Selects only rows for which column does not equal value
weeks ltgt 30
column gt value Selects only rows for which column is greater than value
weeks gt 30
column lt value Selects only rows for which column is less than value
weeks lt 30
column gt= value Selects only rows for which column is greater than or equal to value
weeks gt= 30
column lt= value Selects only rows for which column is less than or equal to value
weeks lt= 30
condition1 amp condition2 Selects only rows that meet both conditions
weeks gt= 20 amp weeks lt= 40
condition1 | condition2 Selects only rows that meet at least one of the conditions
weeks = 30 | weeks = 40
If you push the Help button next to the Select field it will display a list showing typical
structures
24
If you select a radio button and then press Help again an entry will be placed in the
Select field as shown below
Replace any rsquos with your desired entries
42 Analysis Options
After specifying the columns containing the data to be analyzed click on Analysis
Options to display a second page containing overall options for the selected statistical
procedure
You can stick with the default settings or make any desired changes
25
43 Tables and Graphs
The third page lists all of the tables and graphs that can be generated by the selected
statistical procedure together with any options
Press All to select all of the available output or check only the tables and graphs that you
want
For each graph there is a button labeled Titles and Scaling that allows you to override the
default selections These buttons display the page shown below
26
27
To override the title or scaling for an axis enter the desired information Otherwise
default settings will be applied Some of the special options available on this page are
Log scale ndash Check this box to draw an axis using a logarithmic scale Note that
graphs on which logarithmic scaling does not make sense will ignore this setting
No power ndash Check this box to suppress scaling axes using a notation such as (X
1000) for very large or very small numbers
Skip repeats ndash Check this box to indicate that consecutive axis labels that are
identical should not be drawn This applies only to non-numeric axes
X and Y offset ndash This indicates the desired position of the legend block (if any)
with respect to the axes For offset purposes the axes are considered to extend
from (0 0) at the bottom left corner to (1 1) at the upper right corner A value
such as 11 for the X offset indicates that the legend block should be offset by
10 to the right of the axes If a legend block is partially offscreen use this
setting and the page margins to adjust its position
Margins ndash This indicates the offset of each axis from the edge of the graphics
drawing area
3D viewpoint ndash These angles specify the location of the viewer with respect to the
origin of a 3D graph Increasing the angles moves the viewer further to the right
and further above the graph
28
44 Results to Save
The fourth page indicates which results if any should be saved for later access
When results are saved they are placed in an XML file and a link to that file is added to
the bottom of the output page In addition the results are loaded into the second page of
the Data Editor
45 Calculate
Once all desired options have been selected press the Calculate button to begin the
statistical calculations An XML script is automatically created and sent to the server
The server reads the indicated data performs the calculations and sends back an HTML
page to the web browser for display The HTML page contains tabular output and
imbedded images as in the example below
29
30
Once in the browser you can scroll though the output You can also use the browser to
print the output copy it to your systemrsquos clipboard or save the graphics images on your
computer
46 Preferences
At any time while in a statistical procedure you can press the Preferences button to
change system preferences This accesses each of the pages described earlier in Chapter
3 which include settings such as the output language If the Calculate button has already
been pressed it will be executed again using the new settings
47 Save Script
If you wish to view or save the XML script generated by the statistical procedure press
the Save Script button This will display the following page
Scripts are normally saved with the extension sgs Once a script has been saved it can be
executed again at a later time by selecting File - Execute Script from the main menu
31
Chapter 5 ndash Working with Scripts
The instructions sent to the server when the Calculate button is pressed within a
statistical procedure are contained in an XML script The script tells the NET Web
Services where to locate the data to be analyzed which procedure to execute and what
options are desired As outlined in Chapter 4 these scripts may be saved for later
reexecution
A typical script contains several sections The top section indicates the identity of the
script and specifies the values of any global settings
ltxml version=10 gt
- ltstatgraphicsgt
- ltglobalsgt
ltBorderColor Value=SpringGreen gt
ltInputDateFormat Value=MDYYYY gt
ltOutputDateFormat Value=MDYYYY gt
ltThreeDFrameEffects Value=Yes gt
ltFillColor1 Value=SteelBlue gt
ltPointType1 Value=Plus gt
ltglobalsgt
Each global settings is followed by its desired value
The second section of the script indicates the name of the data source and information
about how the data is formatted
ltdata Alias=nonlinxml Source=tempnonlinsgdgt ltDecimalSeparator Value= gt
ltDateFormat Value=MDYYYY gt
ltMissingValue Value= gt
ltdatagt
The Alias is the name of the original data file Source specifies the relative location where
the data is stored on the server Data not contained in STATGRAPHICS SGD files on
the server is copied to a STATGRAPHICS data file when it is first loaded
The last part of the script specifies information about the procedure to be run
ltproc name=SREGgt
ltinputgt ltY Value=chlorine gt
ltX Value=weeks gt
ltinputgt
ltoptionsgt
ltModel Value=SquaredYReciprocalX gt
ltoptionsgt
32
ltoutputgt lttable Name=Summary gt
ltgraph Name=Modelgt
ltResolution Value=101 gt
ltgraphgt
lttable Name=Forecastsgt ltX Value=10 gt
ltX Value=20 gt
ltX Value=30 gt
ltX Value=40 gt
lttablegt ltgraph Name=Observed gt
lttable Name=LackOfFit gt
lttable Name=Comparison gt
lttable Name=Residuals gt
ltgraph Name=ResidsVsX gt
ltgraph Name=ResidsVsPred gt
ltgraph Name=ResidsVsRow gt
lttable Name=Influential gt
ltoutputgt ltresultsgt
ltResiduals Name=RESIDS gt
ltresultsgt
ltprocgt
ltstatgraphicsgt
The Input section specifies the columns containing the data to be analyzed The Options
section sets the values of any analysis options The Output section identifies the tables
and graphs to be created The Results section indicates which numerical results should be
saved for later use
Currently there are two procedures on the STATGRAPHICS Online menu that deal with
scripts
1 Execute script ndash This option reexecutes a saved script When the script is
executed it will look for the original data file specified in the Alias tag If the data
has changed the results will be different
2 Manage Scripts ndash The option allows scripts to be copies renamed deleted or
downloaded to your client machine
Beginning with Version XVI of STATGRAPHICS Centurion these scripts will also be
executable by the desktop Windows program
33
Chapter 6 ndash STATLETS
The main menu contains a special section labeled Statlets that provides access to special
procedures that allow you to interact with your data For example select File - Open
Sample Dataset from the main menu and open the sample dataset for the Shelf life study
Then select Statlets - Regression Analysis - Curve Fitting from the menu This will
display the page shown below
Select the Y and X variables and then press Update Plot This will add the graph shown
below to the page
34
If your web browser supports HTML5 canvases you may click on or touch any point on
the graph to display its row number and coordinates
35
After clicking on a point you may then press the Excludeinclude selected point button to
remove it from the fit
Excluded points are displayed in red
If your web browser supports Java you may press the Use Java button to load a Java
applet in place of the canvas
36
Java applets allow changes to be made to the graph without posting the page back to the
server With the Curve Fitting applet you may
1 Click on a point to display its row number or label The coordinates of the point
and its predicted value will be displayed in the right margin of the graph
2 Drag a point to a new location with your mouse and observe the effect on the
fitted line (You must first uncheck Lock points)
3 Click on a point and press the ExcludeInclude button to remove that point
completely from the fit
4 Click on any location of the graph to display a vertical cursor at the selected value
of X The predicted response and limits at that X will be displayed in the right
margin of the graph
5 Use the X power and Y power sliders to fit a nonlinear regression model involving
powers of the variables
6 Use the Window slider to change the width of the LOWESS smoothing window
(if Add LOWESS smooth has been selected)
By interacting with the applet you can often see interesting features of your data
37
Index
column names 5
confidence level 13
data
copy and paste 7
delete 8
editor 4
entry 4
formatting 11
insert 8
paging 7
printing 8
saving 6
sorting 8
data files
copying 12
deleting 12
downloading 12
renaming 12
SGD files 7
uploading 12
date format 15
decimal separator 15
Excel files 10
fonts 16
graphs
3D effects 17
3D viewpoint 27
background color 17
fills 18
function resolution 17
legend block offset 27
lines 19
margins 27
points 20
titles and scaling 25
width and height 17
language setting 15
main page 2
missing values 14
passwords 3
preferences 13
sample datasets 9
scripts 31
select field
Boolean expressions 23
EXCLUDE 23
FIRST 23
LAST 23
RANDOM 23
ROWS 23
significant digits 13
StatAdvisor 14
STATGRAPHICS expressions 22
statistical procedures
analysis options 24
calculate 28
data input 21
preferences 30
results to save 28
save script 30
tables and graphs 25
Statlets 33
tables
maximum rows 13
maximum width 14
terms and conditions 1
user accounts 2
user data files 9
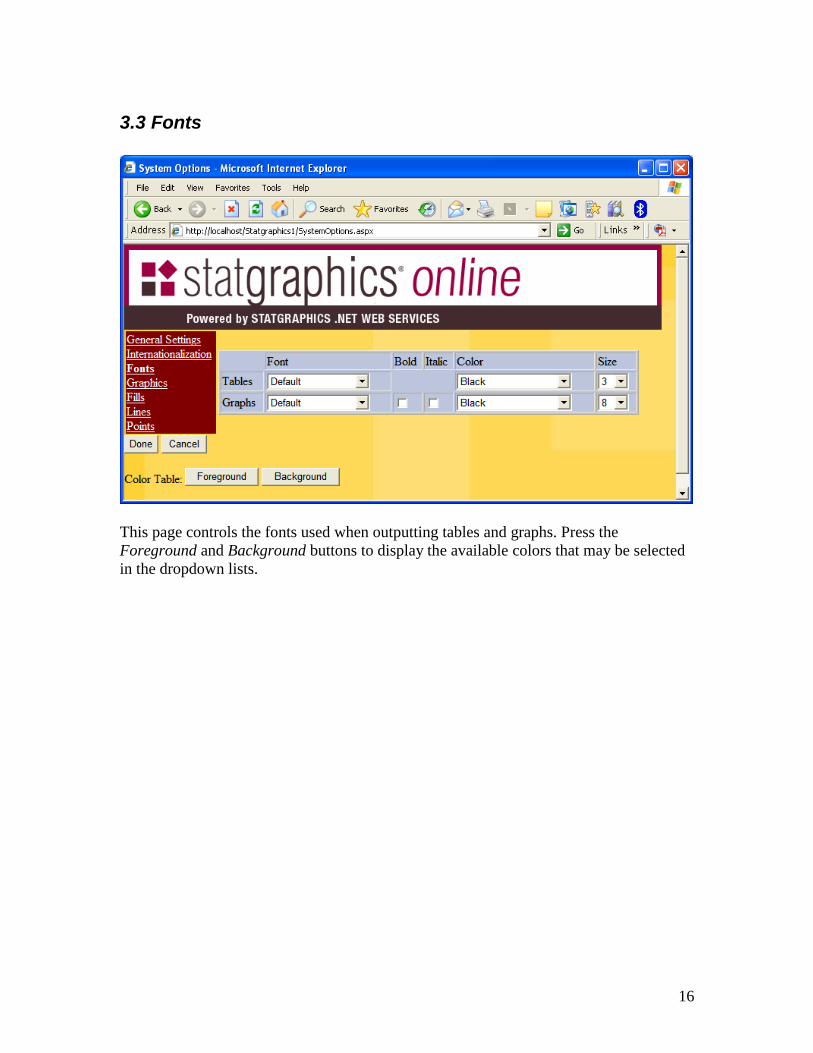
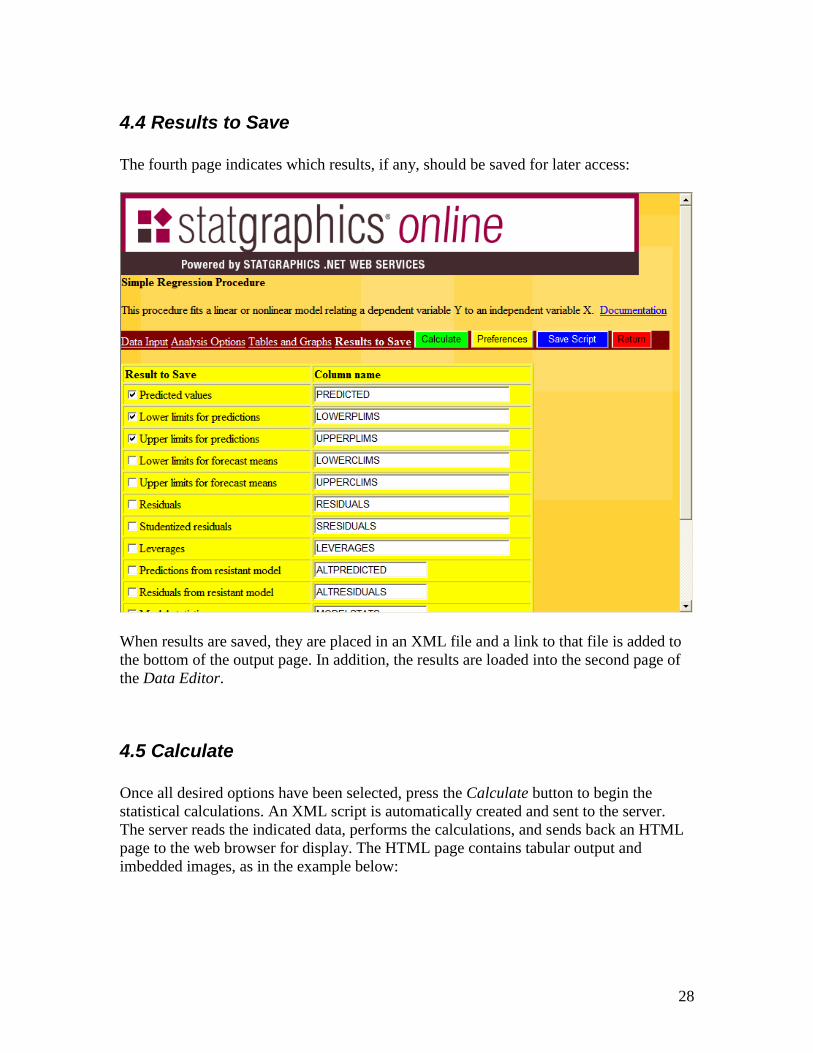