State!of!Kansas!! eSolutions!Benchmarking!Report!...
81
State of Kansas eSolutions Benchmarking Report 2015 Strategic Networks Group. Inc. 2015 www.sngroup.com Page 1 of 48 State of Kansas eSolutions Benchmarking Report January 2015 Prepared for:
Transcript of State!of!Kansas!! eSolutions!Benchmarking!Report!...
State of Kansas eSolutions Benchmarking Report 2015
Strategic Networks Group. Inc. 2015 www.sngroup.com Page 1 of 48
State of Kansas
eSolutions Benchmarking Report
January 2015
Prepared for:

State of Kansas eSolutions Benchmarking Report 2015
Strategic Networks Group. Inc. 2015 www.sngroup.com Page 2 of 48
Table of Contents
Executive Summary .................................................................................................................. 4
1 Kansas Businesses ............................................................................................................. 8 1.1 Respondent Profile ........................................................................................................... 8 1.2 Business Connectivity Characteristics ............................................................................ 10 1.2.1 Internet Speeds ....................................................................................................... 10 1.2.2 Cost ......................................................................................................................... 14 1.2.3 Satisfaction .............................................................................................................. 14
1.3 Broadband Utilization and Benefits ............................................................................... 15 1.3.1 Utilization Patterns ................................................................................................. 15 1.3.2 Broadband and Deciding Where to Locate ............................................................. 19 1.3.3 Broadband Benefits and Impacts ............................................................................ 19
1.4 Barriers and Adoption Issues .......................................................................................... 20 1.4.1 Barriers to Adoption ................................................................................................ 20 1.4.2 Expertise and Knowledge Issues ............................................................................. 20 1.4.3 Skills Acquisition ...................................................................................................... 21
1.5 Financial and Employment Impacts from Internet Use .................................................. 23
2 Kansas Households ......................................................................................................... 25 2.1 Household Profiles and Connectivity ............................................................................. 25 2.1.1 Respondent Characteristics .................................................................................... 25 2.1.2 Connectivity Characteristics .................................................................................... 26
2.2 Broadband Utilization and Benefits ............................................................................... 29 2.2.1 Broadband Utilization ............................................................................................. 29 2.2.2 Mobile Uses ............................................................................................................ 31 2.2.3 Household Benefits ................................................................................................. 33
2.3 Barriers and Adoption Issues .......................................................................................... 34
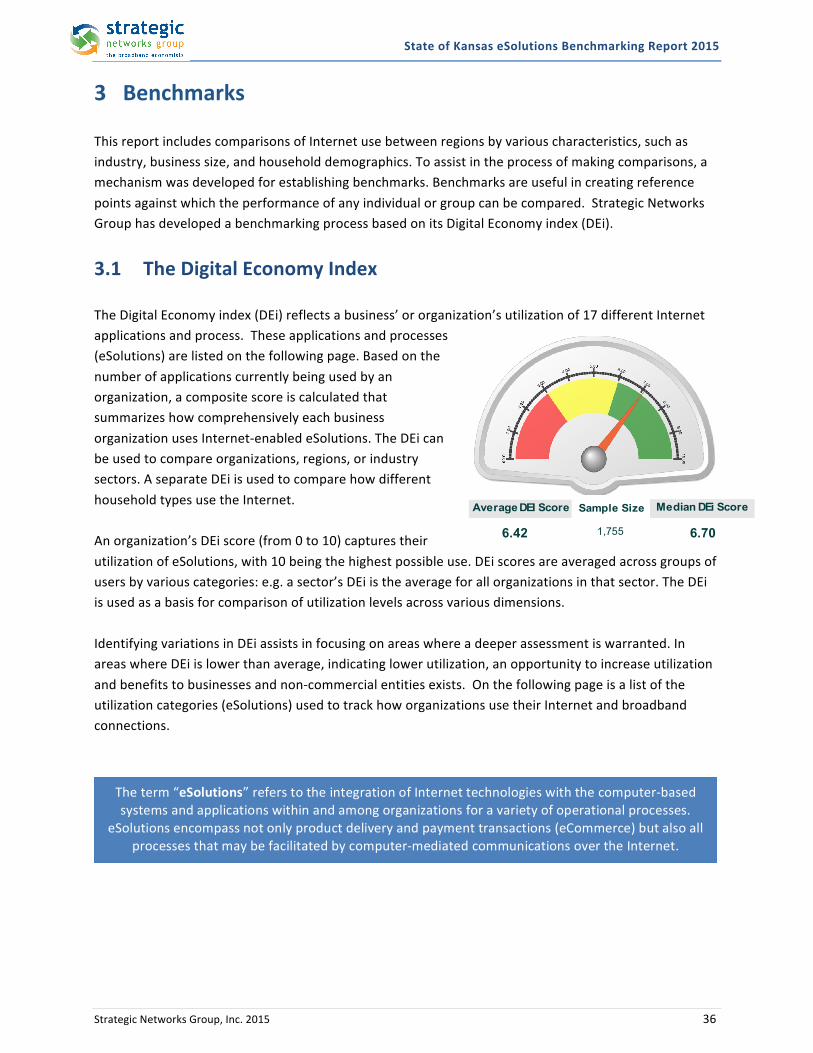
3 Benchmarks .................................................................................................................... 36 3.1 The Digital Economy Index ............................................................................................. 36 3.2 Business Benchmarks ..................................................................................................... 37
4 Comparative Analysis ...................................................................................................... 40
Data Collection Methods and Results ................................................................ 46 Appendix A -‐
Glossary ............................................................................................................ 48 Appendix B -‐

State of Kansas eSolutions Benchmarking Report 2015
Strategic Networks Group. Inc. 2015 www.sngroup.com Page 3 of 48
Table of Figures
Figure 1 – Survey Responses by Employment Size of Business (Number of Employees) .............................. 8 Figure 2 – Survey Responses by Industry Sector ........................................................................................... 9 Figure 3 – How Kansas Businesses Connect to the Internet ....................................................................... 10 Figure 4 – Speed-‐Test Results for Average Upload Speeds ......................................................................... 11 Figure 5 – Speed-‐Test Results for Average Download Speeds .................................................................... 11 Figure 6 – Speed-‐Test Results by Type of Connectivity ............................................................................... 12 Figure 7 – Speed-‐Test Download Speeds (mbps) by Connection and Level of Urbanization ...................... 13 Figure 8 – Speed-‐Test Upload Speeds (mbps) by Connection and Level of Urbanization ........................... 13 Figure 9 – Internet Costs by Type of Connection ........................................................................................ 14 Figure 10 – eCommerce Uses of Broadband ............................................................................................... 15 Figure 11 – eProcess Uses of Broadband .................................................................................................... 15 Figure 12 – Utilization of Mobile Internet ................................................................................................... 16 Figure 13 – Use of Web-‐enabled Mobile Devices ....................................................................................... 17 Figure 14 – Percentage of Businesses Using Cloud Based Services ............................................................ 17 Figure 15 – Motivating Drivers of Adoption of Cloud Services ................................................................... 18 Figure 16 – Mobile applications used by businesses .................................................................................. 18 Figure 17 – Importance of Broadband Benefits for Businesses .................................................................. 20 Figure 18 – Barriers to Increase Business Internet Utilization .................................................................... 21 Figure 19 – Preferred Methods for Acquiring Internal Knowledge ............................................................. 22 Figure 20 – Annual Revenues and Cost Savings from Internet Utilization .................................................. 23 Figure 21 – Summary of Employment Impacts of Business Responses ...................................................... 24 Figure 22 – Summary of Employment Impacts Specific to Internet Use ..................................................... 24 Figure 23 – Distribution of Respondents by Urban / Rural ......................................................................... 25 Figure 24 – Computer Skills by Age Group .................................................................................................. 26 Figure 25 – How Households Connect to the Internet ................................................................................ 26 Figure 26 – Speed-‐Test Upload Results for Households ............................................................................. 27 Figure 27 – Speed-‐Test Download Results for Households ......................................................................... 27 Figure 28 – Speed (Megabits per second) by Connection Type .................................................................. 28 Figure 29 – Broadband Productivity Uses by Community Population Density ........................................... 30 Figure 30 – Types of Mobile Applications use by Households .................................................................... 31 Figure 31 – Home-‐based Business Uses of the Internet ............................................................................ 32 Figure 32 – Distance to Telework Employer ............................................................................................... 33 Figure 33 – Significance of Broadband for Household Benefits .................................................................. 34 Figure 34 – Barriers to Enhanced Use of the Internet ................................................................................. 35 Figure 35 – Preferred Means for Increasing Broadband Skills .................................................................... 35 Figure 36 – Utilization Benchmarks (DEi) for Businesses by Level of Urbanization .................................... 37 Figure 37 – Utilization Benchmarks (DEi) for Businesses by Region ........................................................... 38 Figure 38 – Utilization Benchmarks (DEi) for Businesses by Size of Firm .................................................... 38 Figure 39 – Utilization Benchmarks (DEi) by Industry Sector ...................................................................... 39 Figure 40 – Different industry sectors from metropolitan areas ................................................................ 41 Figure 41 – Different industry sectors from non-‐metropolitan areas ......................................................... 42 Figure 42 – Businesses from five different size ranges in metropolitan areas ............................................ 43 Figure 43 – Businesses from five different size ranges in metropolitan areas ............................................ 43 Figure 44 – Households by age ................................................................................................................... 44 Figure 45 – Households by level of urbanization ........................................................................................ 44

State of Kansas eSolutions Benchmarking Report 2015
Strategic Networks Group, Inc. 2015 4
Executive Summary This eSolutions Benchmarking (eSB) Report is a documentation of data collected in Kansas during December 2014 and January 2015. This summary provides an understanding of current broadband access, adoption and utilization patterns around the state.
Response Levels: A total of 2,532 organizations and 1,449 households contributed to the broadband benchmarking effort. The organizations consisted of 1,755 commercial businesses, 409 government entities and 368 non-‐for profits. Businesses and Organizations Connectivity: While connectivity speeds failed to meet the original FCC definition of broadband (768 kbps or more in at least one direction) for only 1.6% of respondents, 19.8% of those taking the speed test had upload speeds of less than 768 kbps. With the FCC poised to redefine broadband as 25 down, 3 up, only 19% of respondents meet the download while 37% meet the upload requirements of the anticipated redefining of broadband. Section 1.2 outlines the types of connectivity of respondents, as well as their levels of satisfaction. In recent years, wireless networks and mobile devices have increasingly become a factor in how people communicate, and how businesses and organizations bring efficiency to their operations. Over 80% of business respondents use a smart phone and 74.8% use a web-‐enabled laptop computer. Looking to capitalize on these newer channels of communications, 42.3% of businesses have recognized the importance of mobiles apps and have tailored their existing websites to mobile devices. Further, 29.7% of businesses are planning to optimize their websites for mobile browsers. Interestingly, over 70% of mobile users have made an online purchase with their mobile device. Additionally, over 43% of households with mobile device say they used their mobile device to purchase from a business for the first time. This is a remarkable indicator of the ability and importance of mobile communications to help businesses reach new markets and customers in non-‐traditional locations. Internet Utilization Patterns: Over 79% of businesses use the Internet to purchase goods and services online. In contrast, only 52.6% of organizations sell goods and services online. Section 1.3 looks at the level of adoption of different types of Internet applications, as well as cloud solutions, use of mobile services, and which impacts of Internet use are most valued by their users. Barriers: Security and privacy concerns are the two barriers to Internet utilization that rate the highest in importance, with almost 40% and 29% of businesses, respectively, rating them as very important. Financial and Employment Impacts of Internet Use: While reporting businesses created 1,852 new positions in the preceding 12 months, the same businesses experienced job reductions, resulting in a net job increase of 1,032 positions. The net job increase attributed to using the Internet was 628 positions. Respondents report that use of the Internet facilitated the creation of 37.6% of all new jobs created and
State of Kansas eSolutions Benchmarking Report 2015
Strategic Networks Group, Inc. 2015 5
constituted 60.8% of net jobs created. Section 1.5 outlines employment impacts, as well as reported impacts on revenues and costs in responding organizations.
Households Connectivity: of the 556 households that took the speed test, 29% of recorded less than 768kbps on the upload speed test, 4.8% failed to record 768kbps or higher on the download speed test. Section 2.1. outlines the connectivity characteristics of respondents, including costs. Utilization: Broadband households using the Internet for a home-‐based business or for teleworking were a significant group at just over 18.7% and 18% respectively of all responding households. Section 2.2 explores how household use the Internet to increase their economic well being, with particular attention to home-‐based businesses and teleworking. Barriers: 58.1% of households expressed a desire to increase or improve their use of the Internet. The two main barriers are concerns over privacy and security (50.5% say this is a very important barrier), followed by an inadequate Internet connection (48%). See Section 2.3 for a more detailed review of this issue, including the methods that household prefer to acquire additional skills. For example, online information, webinars, and training courses are favored by over 80% of households. Classroom courses are the least preferred learning method, with 38% of respondents saying they would never take classroom courses to acquire Internet skills. Home-‐based business:
! 37.4% of home businesses (narrowly defined, see page 33) strongly agree that they would not be in business without the Internet
! 23.6% would need to relocate to get broadband if it was not available ! 88.5% of home-‐based businesses agree broadband is essential for their business to function.
Telework:
! Almost half (44.8%) of teleworkers are employed by organizations more than 30 miles (one-‐way) from their residence
! 19% would need to travel over 100 miles to their workplace if they were unable to telework ! The most important motivation factors cited for teleworking households are:
a. More family time (67%) b. Life-‐work balance (60.7%) c. Reducing commute time to their work location (59.8%) and d. Increased productivity (59.8%).
! The largest industry category for teleworking is “Professional and Technical Services” at 24%, followed by “Health Care” at 15.2%. However, teleworkers are found in a broad range of other industries.

State of Kansas eSolutions Benchmarking Report 2015
Strategic Networks Group, Inc. 2015 6
Benchmarks for Organizations and Household: Section 3 provides statewide benchmarking to compare how different regions, industry sectors and types of households utilize the Internet. Key conclusions are that size of business and geographic location are key factors in the level of Internet utilization. Larger and more metropolitan businesses utilize the Internet more than smaller and more rural businesses. In essence, there is a digital divide or utilization gap, between small and large businesses.
Introduction This eSolutions Benchmarking (eSB) Report is a summary report that provides insights into current Internet access, adoption and utilization patterns across the state. On behalf of the State of Kansas Department of Commerce, SNG reached out to households, community institutions, and small-‐to-‐medium sized businesses across the state to encourage participation in the online assessment. Households, organizations, and businesses were asked to complete a self-‐assessment in the form of an online survey that collected information on the availability of broadband (high-‐speed Internet access), how broadband is being used in the business or the home, along with questions that would help identify benefits, drivers and barriers to adoption and utilization. While it is not possible to include every question and response from the assessment here, this eSB report provides insights into key findings that will point to gaps and opportunities for increasing broadband utilization. In addition to the information presented in this report, all the data collected through this initiative is available through an online platform called the Digital Economy Analytics Platform (DEAP), which the staff of the Department of Commerce can access. The broad insights contained within this eSB report should be used as a guide for developing an overall broadband utilization strategy. The report is organized into the following sections:
• Introduction and Methodology Overview – A brief description of the benchmarking initiative, an overview of the key methods used, and scope of research and analysis.
• Key Findings for Businesses – Summary and highlights from data provided by businesses.
• Key Findings for Households – Summary of highlights from data provided by households.
• Benchmarks for Analysis of Internet Utilization – As a benchmarking process, SNG has created
the Digital Economy Index (DEi) to compare Internet use between groups by various characteristics, such as industry, business size, and geographic location. Benchmarks create reference points against which the performance of any establishment or group can be compared.

State of Kansas eSolutions Benchmarking Report 2015
Strategic Networks Group, Inc. 2015 7
Methodology Overview – The core methodology is founded on primary research consisting of data collection through an online self-‐assessment of businesses, organizations and households. Due to the distinct nature of the uses and benefits of different categories of Internet users, separate and distinct surveys were used for businesses and organizations and for households. Information was collected directly from Internet users in the following categories: user profile, Internet utilization, Internet benefits and barriers to Internet use. The business assessments were made available for online access through one of two means:
• Individual businesses, non-‐commercial organizations, and households were invited to participate via direct email invitations sent from a large, statewide contact list.
• Businesses and other organizations were encouraged through a variety of communications channels to access a web link to the survey.
Email invitations were sent directly to roughly 51,000 businesses and organizations across Kansas. Surveys were deployed using direct email invitation to households and organizations providing access to online surveys. The initial email invitation was sent on December 10, 2014 and reminder emails were sent roughly every seven days with the last email reminder sent on January 8th, 2015. For households, over 80,000 invitations were sent out, starting on December 15th and closing January 13th, with four reminders in between. A total of 2,532 organizations and 1,449 households contributed to the broadband benchmarking effort. The organizations consisted of 1,755 commercial businesses, 409 government entities and 368 non-‐for profits. This eSolutions Benchmarking Report provides an overview of the Internet connectivity and utilization characteristics of businesses and households. Additional data is provided through the Kansas DEAP website. The majority of respondents fully completed the surveys. However, partially completed surveys are included in the analysis on the basis that the responses provided are valid and useful even if the respondent chose not to complete the entire survey. Therefore, every data chart in this report indicates the N= value that provides the number of data points included to generate each particular figure. Further details on methodology is provided in Appendix A with a brief Glossary of report terminology in Appendix B.

State of Kansas eSolutions Benchmarking Report 2015
Strategic Networks Group, Inc. 2015 8
1 Kansas Businesses Access to and effective use of the Internet has become an essential element in the survival and success of businesses in today’s economy. This section identifies key findings related to how businesses use the Internet, what types of benefits they value most, and which barriers prevent more effective use. The findings are broken down by key respondent characteristics such as industry sector, employment size and connectivity type.
1.1 Respondent Profile The sample set outlined in this section includes data from businesses across the state. The sample includes survey responses from businesses across all 20 industries classified by NAICS.1 Unless otherwise noted, Section 1 only includes data from respondents that identified themselves as commercial businesses. Previous studies conducted by SNG have shown that that the size of a business is correlated to how business access and use the Internet. Figure 1 shows the breakdown of survey responses by size of establishment, as measured by number of employees. The chart provides a comparison to the state profile of establishments. The survey sample is very similar to the state profile as reported by the Census Bureau, with a very slight under-‐representation of micro businesses (those with less than 10 employees).
Figure 1 -‐ Survey Responses by Employment Size of Business (Number of Employees)
1 North American Industry Classification System. Industry breakdowns are at the 2-‐digit NAICS code level. Some survey responses did not have an industry classification.
49.9%
17.0%
14.1%
10.7%
4.4%
2.5%
.6%
.8%
53.3%
19.5%
13.2%
8.8%
2.9%
1.6%
.4%
.2%
0% 10% 20% 30% 40% 50% 60%
1 -‐ 4
5 -‐ 9
10 -‐ 19
20 -‐ 49
50 -‐ 99
100 -‐ 249
250 -‐ 499
500 or more
State Profile Survey Sample N = 1,629
State of Kansas eSolutions Benchmarking Report 2015
Strategic Networks Group, Inc. 2015 9
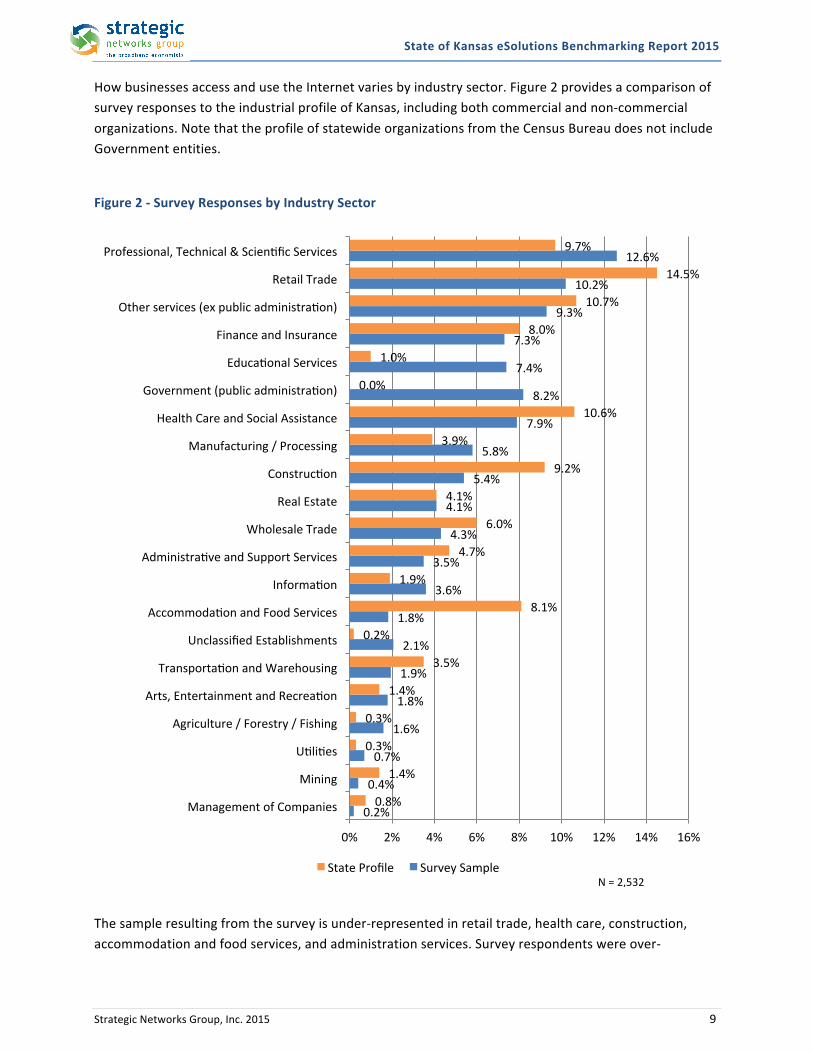
How businesses access and use the Internet varies by industry sector. Figure 2 provides a comparison of survey responses to the industrial profile of Kansas, including both commercial and non-‐commercial organizations. Note that the profile of statewide organizations from the Census Bureau does not include Government entities.
Figure 2 -‐ Survey Responses by Industry Sector
The sample resulting from the survey is under-‐represented in retail trade, health care, construction, accommodation and food services, and administration services. Survey respondents were over-‐
0.2%
0.4%
0.7%
1.6%
1.8%
1.9%
2.1%
1.8%
3.6%
3.5%
4.3%
4.1%
5.4%
5.8%
7.9%
8.2%
7.4%
7.3%
9.3%
10.2%
12.6%
0.8%
1.4%
0.3%
0.3%
1.4%
3.5%
0.2%
8.1%
1.9%
4.7%
6.0%
4.1%
9.2%
3.9%
10.6%
0.0%
1.0%
8.0%
10.7%
14.5%
9.7%
0% 2% 4% 6% 8% 10% 12% 14% 16%
Management of Companies
Mining
Uiliies
Agriculture / Forestry / Fishing
Arts, Entertainment and Recreaion
Transportaion and Warehousing
Unclassified Establishments
Accommodaion and Food Services
Informaion
Administraive and Support Services
Wholesale Trade
Real Estate
Construcion
Manufacturing / Processing
Health Care and Social Assistance
Government (public administraion)
Educaional Services
Finance and Insurance
Other services (ex public administraion)
Retail Trade
Professional, Technical & Scienific Services
State Profile Survey Sample N = 2,532

State of Kansas eSolutions Benchmarking Report 2015
Strategic Networks Group, Inc. 2015 10
represented in Information, Educational Services, Professional and Technical, and Manufacturing. State profile data does not include data on Public Administration.2
1.2 Business Connectivity Characteristics The speed and quality of business Internet connections strongly impact many uses of the Internet, such as video conferencing and real time collaboration. As seen in Figure 3, the survey includes responses from users of a mix of Internet connectivity technologies. The use of broadband is very high across all types and locations of businesses. While over 98% of responding businesses have connectivity other than dial-‐up or satellite, many still lack broadband level connections in at least one direction. As of 2010, broadband speeds are defined by the U.S. Federal Government as being 4 megabits per second (4Mb/s) for downloads, and at least 1 megabit per second (1Mb/s) for uploads. A raise in these minimums is anticipated in 2015 to 25 and 3 megabits respectively. As seen in Figure 3 below, cable, DSL, and fiber are the predominant technologies for connectivity. A small percentage of businesses use dial-‐up (0.7%) and satellite (2.1%) connections as their primary connection. These are predominantly very small businesses. Businesses with less than 50 employees are more likely than larger businesses to use cable, DSL and fixed wireless. Larger businesses are far more likely to have a T1 connection. Fiber connections are spread across all sizes of businesses.
Figure 3 – How Kansas Businesses Connect to the Internet
1.2.1 Internet Speeds The survey included an opportunity for respondents to take a live speed test that assessed their actual upload and download speeds. The survey responses, indicated by N in each chart, vary because
2 State data source: US Census Bureau County Business Patterns 2011 – Number of establishments shown for sample do not include Public Administration in the totals for comparative purposes.
.6%
.7% 2.1% 2.6% 3.2% 4.1%
7.6% 8.1%
13.9% 23.1%
34.0%
0% 5% 10% 15% 20% 25% 30% 35% 40%
No Internet Dial-‐up Satellite
Mobile Wireless Other High-‐speed Internet
Not Sure Fixed Wireless
T1 Fiber DSL
Cable
Pct. Establishments N = 1,775 N =

State of Kansas eSolutions Benchmarking Report 2015
Strategic Networks Group, Inc. 2015 11
completion of the speed test portion was optional. Figures 4 through 6 summarize the results of the speed test portion of the business survey. While connectivity speeds failed to meet the original FCC definition of broadband (768 kbps or more in at least one direction) for only 1.6% of respondents merely reporting their speed of service, 19.8% of those taking the speed test had upload speeds of less than 768 kbps. Important to note is that SNG’s internal analysis shows a stronger correlation with Internet utilization and upload speeds than with download speeds. Thus, for businesses to get the most out of broadband, upload speed is proving to be the critical direction.
Figure 4 – Speed-‐Test Results for Average Upload Speeds
Figure 5 – Speed-‐Test Results for Average Download Speeds
.8%
19.0%
26.0%
17.0%
17.8%
7.9%
6.9%
2.2%
1.7%
.7%
0% 5% 10% 15% 20% 25% 30%
Less than 200 kbps
200 kbps up to 768
768 kbps up to 1.5
1.5 mbps up to 3
3 mbps up to 6 mbps
6 mbps up to 10 mbps
10 mbps up to 25
25 mbps up to 50
50 mbps up to 100
100 mbps or more
Pct. of Users N = 872
1.6%
6.1%
7.6%
20.5%
15.1%
30.5%
10.6%
7.0%
1.0%
0% 5% 10% 15% 20% 25% 30% 35%
Less than 768 kbps
768 kbps up to 1.5 mbps
1.5 mbps up to 3 mbps
3 mbps up to 6 mbps
6 mbps up to 10 mbps
10 mbps up to 25 mbps
25 mbps up to 50 mbps
50 mbps up to 100 mbps
100 mbps up to 1 gbps
Pct. of Users N = 876

State of Kansas eSolutions Benchmarking Report 2015
Strategic Networks Group, Inc. 2015 12
As seen in Figure 6, the speed test results varied significantly between different technologies, with fiber leading by a wide margin. Cable and fixed wireless formed the second fastest tier of service, while T1, DSL, mobile wireless and satellite recorded the slowest speeds. However, it is worth noting that based on SNG data collected since 2010, speeds are increasing rapidly for fiber, cable, and both fixed and mobile wireless. Figure 6 – Speed-‐Test Results by Type of Connectivity
7.8
8.8
10.2
10.7
13.5
20.6
37.2
2.0
1.7
4.4
3.9
6.5
4.8
27.7
0.0 5.0 10.0 15.0 20.0 25.0 30.0 35.0 40.0
Satellite
DSL
Mobile Wireless
Fixed Wireless
T1
Cable
Fiber
Megabits per second
Ave. Upload Speed (Mbps) Ave. Download Speed (Mbps) N = 872
State of Kansas eSolutions Benchmarking Report 2015
Strategic Networks Group, Inc. 2015 13
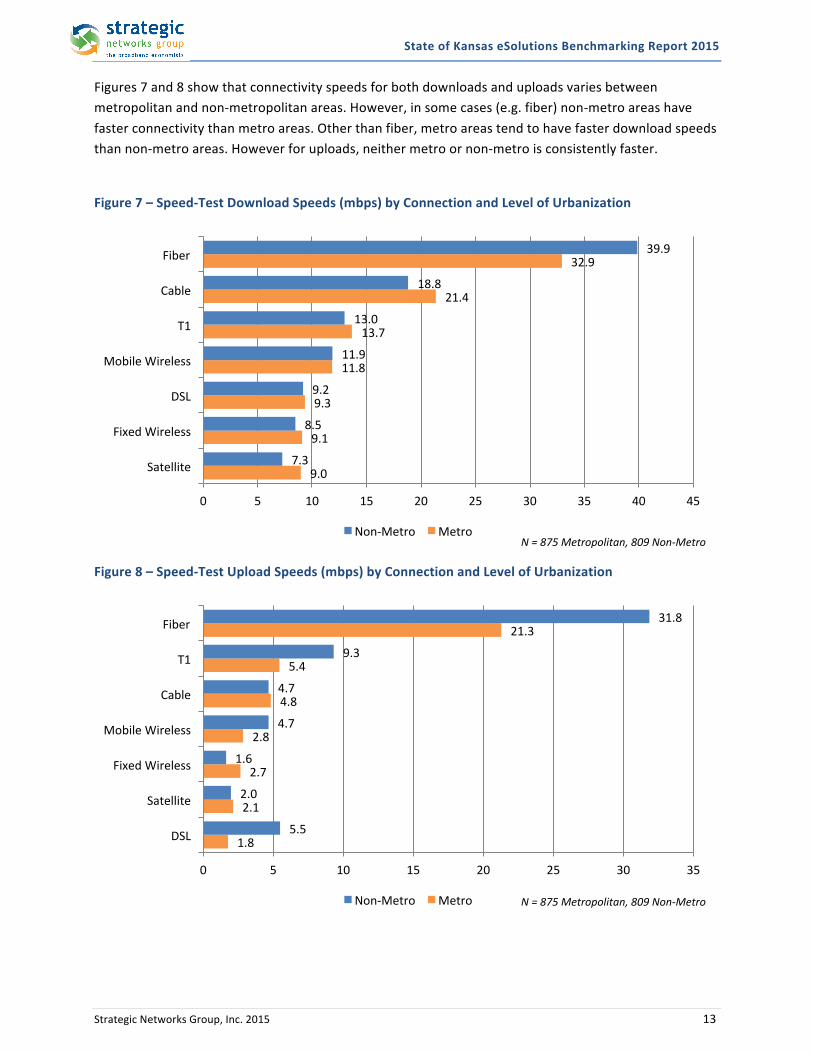
Figures 7 and 8 show that connectivity speeds for both downloads and uploads varies between metropolitan and non-‐metropolitan areas. However, in some cases (e.g. fiber) non-‐metro areas have faster connectivity than metro areas. Other than fiber, metro areas tend to have faster download speeds than non-‐metro areas. However for uploads, neither metro or non-‐metro is consistently faster.
Figure 7 – Speed-‐Test Download Speeds (mbps) by Connection and Level of Urbanization
Figure 8 – Speed-‐Test Upload Speeds (mbps) by Connection and Level of Urbanization
9.0
9.1
9.3
11.8
13.7
21.4
32.9
7.3
8.5
9.2
11.9
13.0
18.8
39.9
0 5 10 15 20 25 30 35 40 45
Satellite
Fixed Wireless
DSL
Mobile Wireless
T1
Cable
Fiber
Non-‐Metro Metro N = 875 Metropolitan, 809 Non-‐Metro
1.8
2.1
2.7
2.8
4.8
5.4
21.3
5.5
2.0
1.6
4.7
4.7
9.3
31.8
0 5 10 15 20 25 30 35
DSL
Satellite
Fixed Wireless
Mobile Wireless
Cable
T1
Fiber
Non-‐Metro Metro N = 875 Metropolitan, 809 Non-‐Metro
State of Kansas eSolutions Benchmarking Report 2015
Strategic Networks Group, Inc. 2015 14
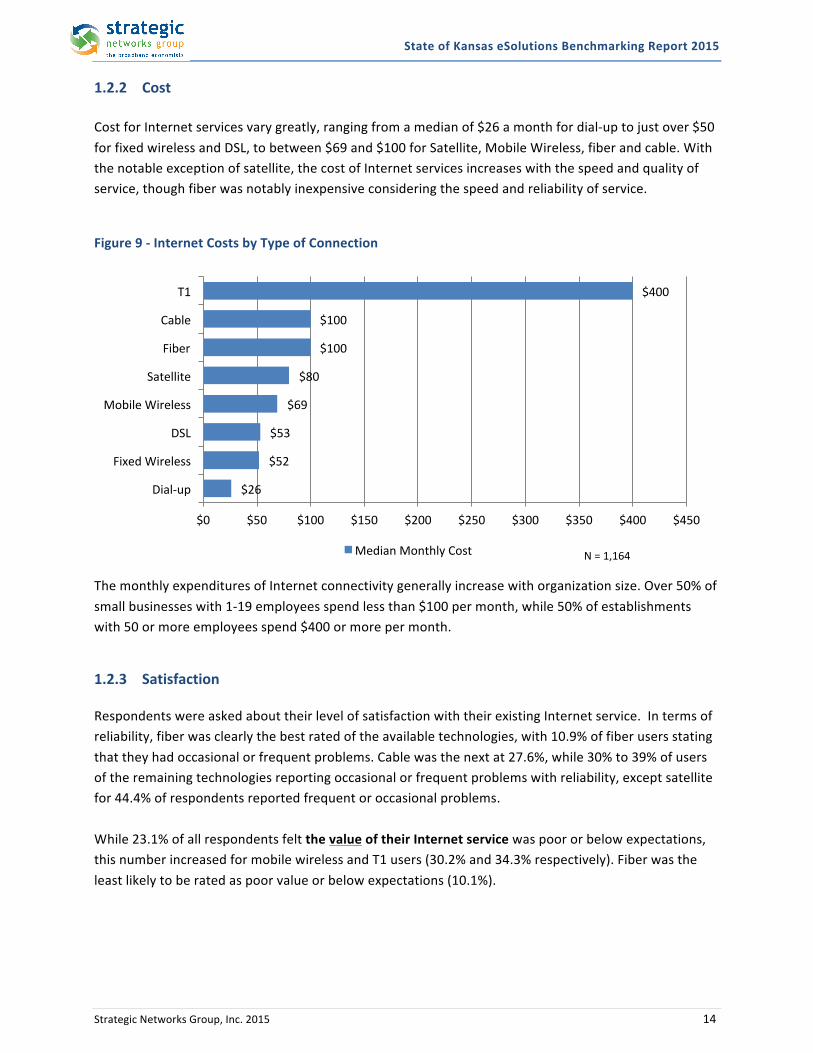
1.2.2 Cost Cost for Internet services vary greatly, ranging from a median of $26 a month for dial-‐up to just over $50 for fixed wireless and DSL, to between $69 and $100 for Satellite, Mobile Wireless, fiber and cable. With the notable exception of satellite, the cost of Internet services increases with the speed and quality of service, though fiber was notably inexpensive considering the speed and reliability of service.
Figure 9 -‐ Internet Costs by Type of Connection
The monthly expenditures of Internet connectivity generally increase with organization size. Over 50% of small businesses with 1-‐19 employees spend less than $100 per month, while 50% of establishments with 50 or more employees spend $400 or more per month.
1.2.3 Satisfaction Respondents were asked about their level of satisfaction with their existing Internet service. In terms of reliability, fiber was clearly the best rated of the available technologies, with 10.9% of fiber users stating that they had occasional or frequent problems. Cable was the next at 27.6%, while 30% to 39% of users of the remaining technologies reporting occasional or frequent problems with reliability, except satellite for 44.4% of respondents reported frequent or occasional problems. While 23.1% of all respondents felt the value of their Internet service was poor or below expectations, this number increased for mobile wireless and T1 users (30.2% and 34.3% respectively). Fiber was the least likely to be rated as poor value or below expectations (10.1%).
$26
$52
$53
$69
$80
$100
$100
$400
$0 $50 $100 $150 $200 $250 $300 $350 $400 $450
Dial-‐up
Fixed Wireless
DSL
Mobile Wireless
Satellite
Fiber
Cable
T1
Median Monthly Cost N = 1,164
State of Kansas eSolutions Benchmarking Report 2015
Strategic Networks Group, Inc. 2015 15
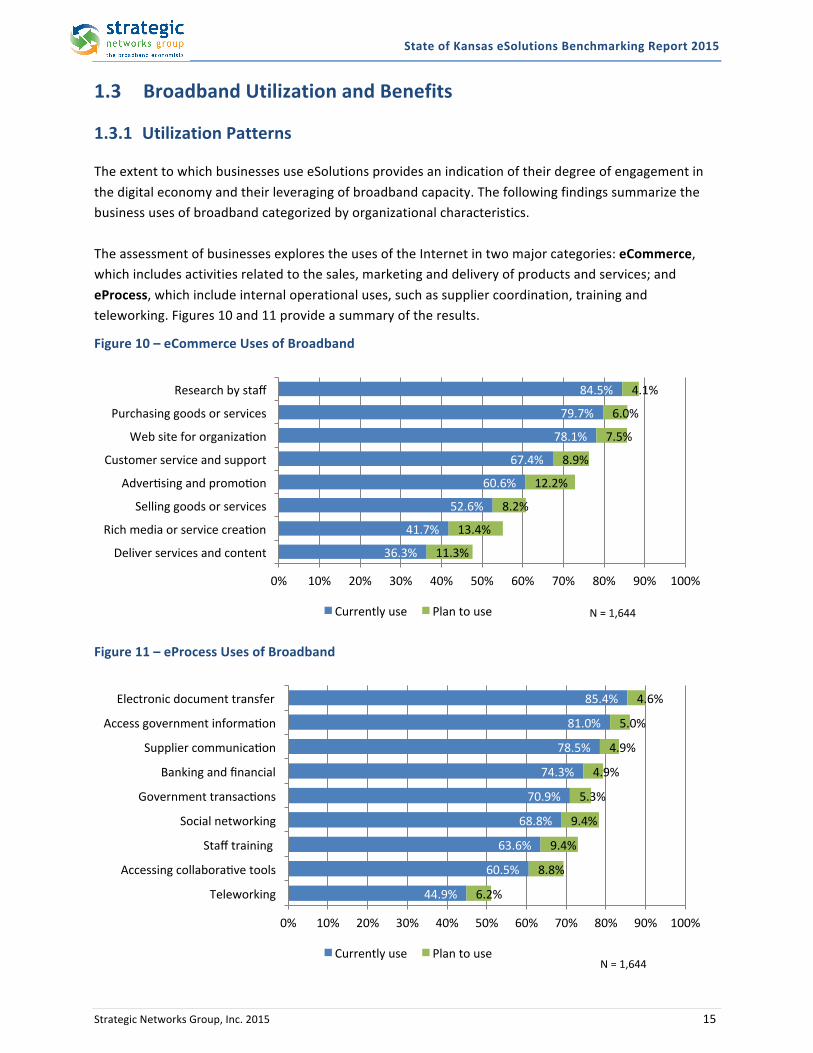
1.3 Broadband Utilization and Benefits 1.3.1 Utilization Patterns The extent to which businesses use eSolutions provides an indication of their degree of engagement in the digital economy and their leveraging of broadband capacity. The following findings summarize the business uses of broadband categorized by organizational characteristics. The assessment of businesses explores the uses of the Internet in two major categories: eCommerce, which includes activities related to the sales, marketing and delivery of products and services; and eProcess, which include internal operational uses, such as supplier coordination, training and teleworking. Figures 10 and 11 provide a summary of the results.
Figure 10 – eCommerce Uses of Broadband
Figure 11 – eProcess Uses of Broadband
36.3%
41.7%
52.6%
60.6%
67.4%
78.1%
79.7%
84.5%
11.3%
13.4%
8.2%
12.2%
8.9%
7.5%
6.0%
4.1%
0% 10% 20% 30% 40% 50% 60% 70% 80% 90% 100%
Deliver services and content
Rich media or service creaion
Selling goods or services
Adverising and promoion
Customer service and support
Web site for organizaion
Purchasing goods or services
Research by staff
Currently use Plan to use N = 1,644
44.9%
60.5%
63.6%
68.8%
70.9%
74.3%
78.5%
81.0%
85.4%
6.2%
8.8%
9.4%
9.4%
5.3%
4.9%
4.9%
5.0%
4.6%
0% 10% 20% 30% 40% 50% 60% 70% 80% 90% 100%
Teleworking
Accessing collaboraive tools
Staff training
Social networking
Government transacions
Banking and financial
Supplier communicaion
Access government informaion
Electronic document transfer
Currently use Plan to use N = 1,644
State of Kansas eSolutions Benchmarking Report 2015
Strategic Networks Group, Inc. 2015 16
Utilization of Internet-‐enabled applications and operations is still evolving. Simpler processes that have long been available, such as email, are heavily accessed by all user types. Differentiation emerges in utilization patterns as more complex business and transactional processes come “online,” and more current technologies spawn enhanced or new capabilities. The two most significant factors in broadband utilization levels are size of organization and industrial classification to which an organization belongs. Broadband offers uses that can transform the way businesses conduct their operations. Over 79% of businesses use broadband for coordination with suppliers, while over 62% use broadband for employee training and another 66% for improving customer service. Likewise, 78.6% of businesses use the Internet to purchase goods and services online. In contrast, only 52.8% of organizations sell goods and services online and just over 36.8% deliver services and content online.
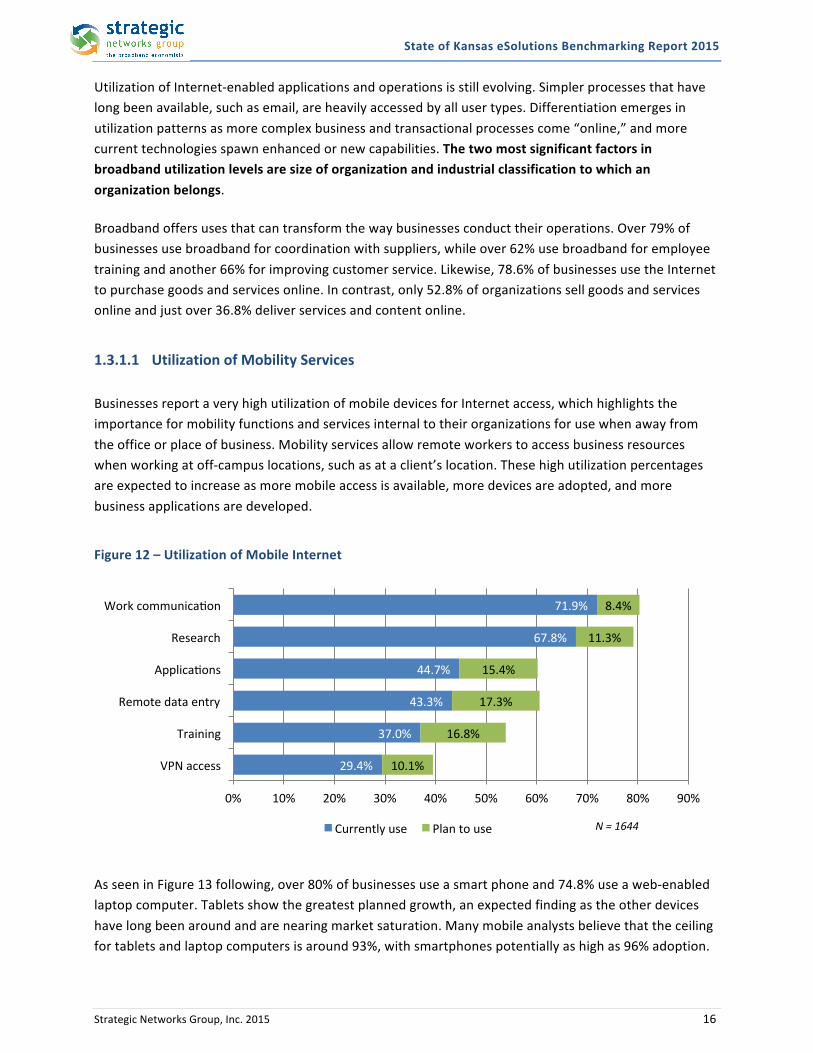
1.3.1.1 Utilization of Mobility Services Businesses report a very high utilization of mobile devices for Internet access, which highlights the importance for mobility functions and services internal to their organizations for use when away from the office or place of business. Mobility services allow remote workers to access business resources when working at off-‐campus locations, such as at a client’s location. These high utilization percentages are expected to increase as more mobile access is available, more devices are adopted, and more business applications are developed.
Figure 12 – Utilization of Mobile Internet
As seen in Figure 13 following, over 80% of businesses use a smart phone and 74.8% use a web-‐enabled laptop computer. Tablets show the greatest planned growth, an expected finding as the other devices have long been around and are nearing market saturation. Many mobile analysts believe that the ceiling for tablets and laptop computers is around 93%, with smartphones potentially as high as 96% adoption.
29.4%
37.0%
43.3%
44.7%
67.8%
71.9%
10.1%
16.8%
17.3%
15.4%
11.3%
8.4%
0% 10% 20% 30% 40% 50% 60% 70% 80% 90%
VPN access
Training
Remote data entry
Applicaions
Research
Work communicaion
Currently use Plan to use N = 1644
State of Kansas eSolutions Benchmarking Report 2015
Strategic Networks Group, Inc. 2015 17
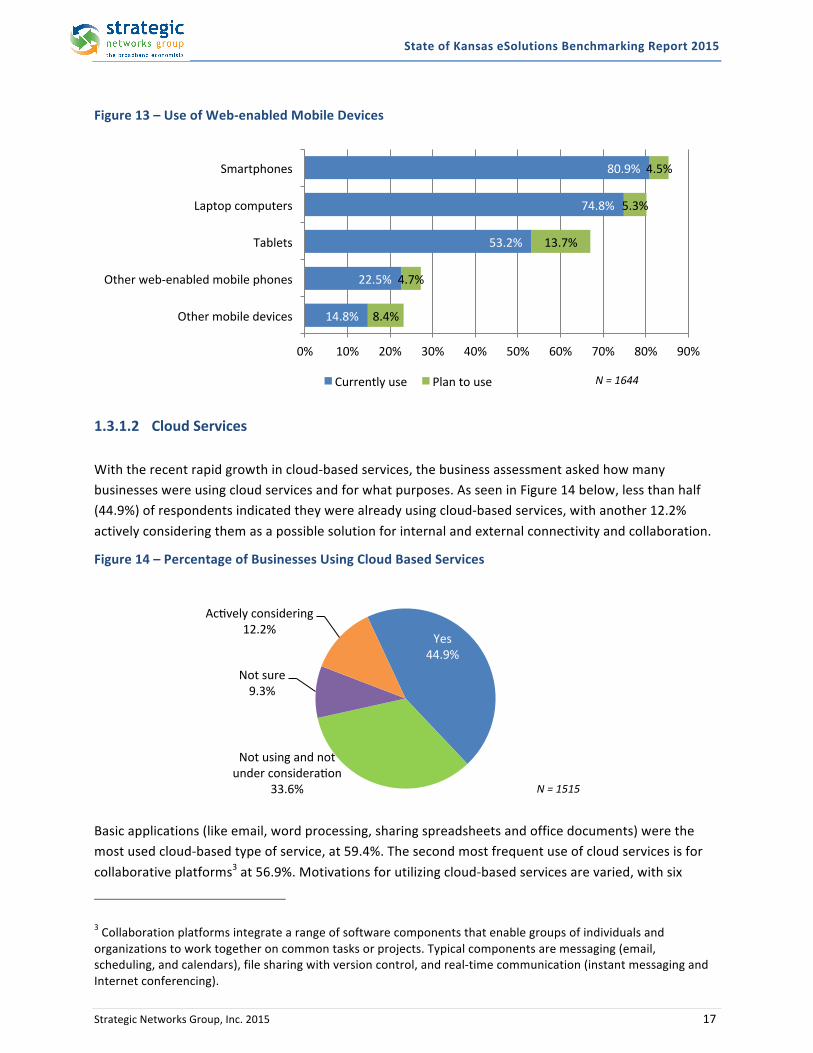
Figure 13 – Use of Web-‐enabled Mobile Devices
1.3.1.2 Cloud Services With the recent rapid growth in cloud-‐based services, the business assessment asked how many businesses were using cloud services and for what purposes. As seen in Figure 14 below, less than half (44.9%) of respondents indicated they were already using cloud-‐based services, with another 12.2% actively considering them as a possible solution for internal and external connectivity and collaboration.
Figure 14 – Percentage of Businesses Using Cloud Based Services
Basic applications (like email, word processing, sharing spreadsheets and office documents) were the most used cloud-‐based type of service, at 59.4%. The second most frequent use of cloud services is for collaborative platforms3 at 56.9%. Motivations for utilizing cloud-‐based services are varied, with six
3 Collaboration platforms integrate a range of software components that enable groups of individuals and organizations to work together on common tasks or projects. Typical components are messaging (email, scheduling, and calendars), file sharing with version control, and real-‐time communication (instant messaging and Internet conferencing).
14.8%
22.5%
53.2%
74.8%
80.9%
8.4%
4.7%
13.7%
5.3%
4.5%
0% 10% 20% 30% 40% 50% 60% 70% 80% 90%
Other mobile devices
Other web-‐enabled mobile phones
Tablets
Laptop computers
Smartphones
Currently use Plan to use N = 1644
Yes 44.9%
Not using and not under consideraion
33.6%
Not sure 9.3%
Acively considering 12.2%
N = 1515
State of Kansas eSolutions Benchmarking Report 2015
Strategic Networks Group, Inc. 2015 18
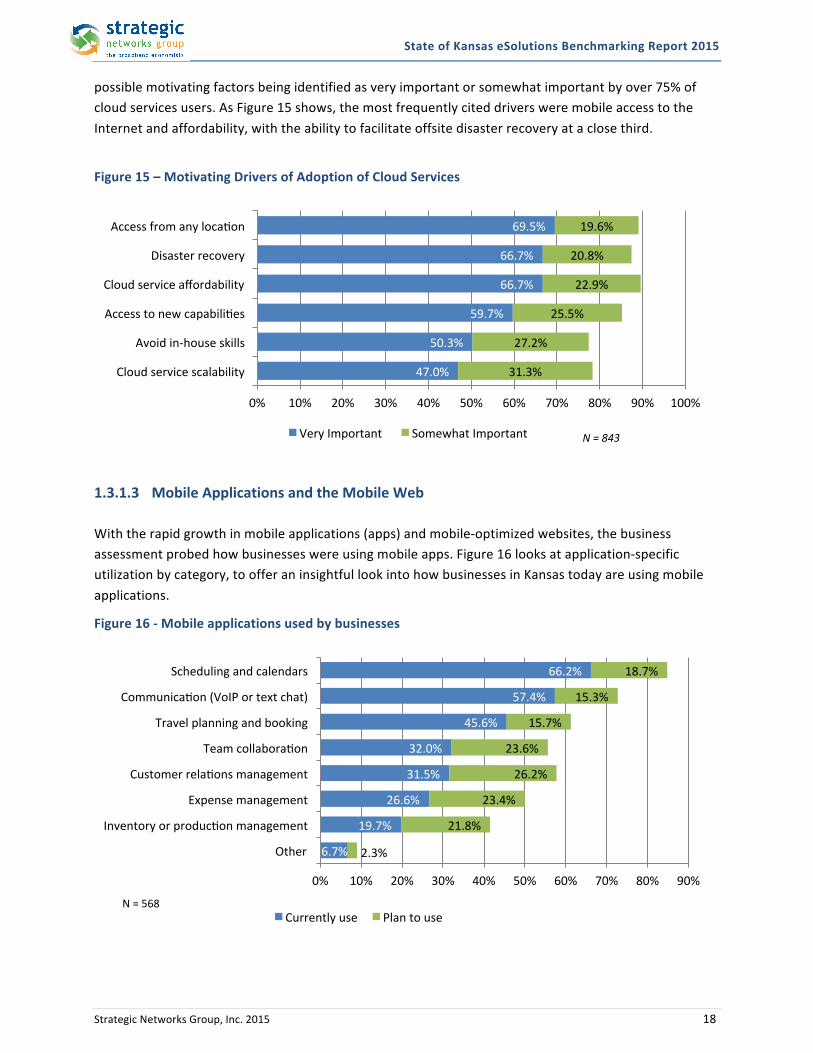
possible motivating factors being identified as very important or somewhat important by over 75% of cloud services users. As Figure 15 shows, the most frequently cited drivers were mobile access to the Internet and affordability, with the ability to facilitate offsite disaster recovery at a close third.
Figure 15 – Motivating Drivers of Adoption of Cloud Services
1.3.1.3 Mobile Applications and the Mobile Web With the rapid growth in mobile applications (apps) and mobile-‐optimized websites, the business assessment probed how businesses were using mobile apps. Figure 16 looks at application-‐specific utilization by category, to offer an insightful look into how businesses in Kansas today are using mobile applications.
Figure 16 -‐ Mobile applications used by businesses
47.0%
50.3%
59.7%
66.7%
66.7%
69.5%
31.3%
27.2%
25.5%
22.9%
20.8%
19.6%
0% 10% 20% 30% 40% 50% 60% 70% 80% 90% 100%
Cloud service scalability
Avoid in-‐house skills
Access to new capabiliies
Cloud service affordability
Disaster recovery
Access from any locaion
Very Important Somewhat Important N = 843
6.7%
19.7%
26.6%
31.5%
32.0%
45.6%
57.4%
66.2%
2.3%
21.8%
23.4%
26.2%
23.6%
15.7%
15.3%
18.7%
0% 10% 20% 30% 40% 50% 60% 70% 80% 90%
Other
Inventory or producion management
Expense management
Customer relaions management
Team collaboraion
Travel planning and booking
Communicaion (VoIP or text chat)
Scheduling and calendars
Currently use Plan to use N = 568

State of Kansas eSolutions Benchmarking Report 2015
Strategic Networks Group, Inc. 2015 19
If a business did not have a stand-‐alone app for their business, 42.3% of businesses have nonetheless recognized the importance of mobiles apps and have tailored their existing websites to mobile devices. Further, 29.7% percent of businesses are planning to optimize their websites for mobile browsers. Typically, a mobile-‐optimized website will contain most of the same content and information that a traditional browser-‐based website has, only organized and presented in a format suitable for smaller screens, touch controls, and intuitive navigation. An app would also integrate interactive map functionality for mobile customers to drive directly to the business location, and click to call function for quicker means of communication, as opposed to a traditional website that would perhaps offer a static map graphic with links to email the business. 1.3.2 Broadband and Deciding Where to Locate To better determine the impact of broadband on physical business locations, businesses were asked about the importance of broadband for both selecting their location and for remaining in their current location. Responses to the survey clearly indicate that availability and suitability of broadband play an important role in corporate decisions to remain in a community, and if a business is moving, which areas it is willing to consider. Over 33% of businesses say that broadband service was “essential” in selecting their business location, and over 53% say broadband is “essential” for remaining in their current location.
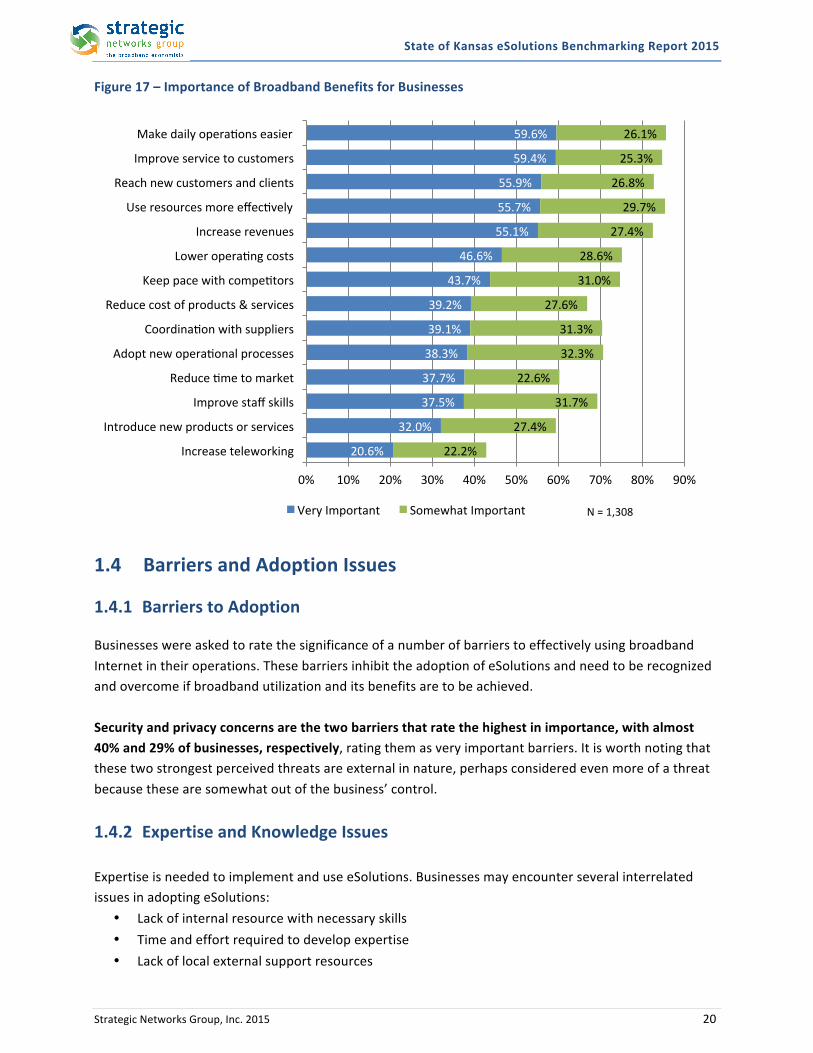
1.3.3 Broadband Benefits and Impacts Overall, the majority of businesses recognize broadband as important across all benefits dimensions. The most generally recognized benefits are related to improved efficiency and productivity, as well as improving service to customers. Productivity-‐related benefits are slightly more valued by businesses than the revenue-‐related benefits, such as market reach, competitiveness, increasing revenues, and introducing new products. The net effect of these benefits is to increase competitiveness, productivity and revenues, while reducing costs and improving profitability. Understanding broadband’s importance in contributing specific benefits allows for a more complete understand of broadband’s impact.
State of Kansas eSolutions Benchmarking Report 2015
Strategic Networks Group, Inc. 2015 20
Figure 17 – Importance of Broadband Benefits for Businesses
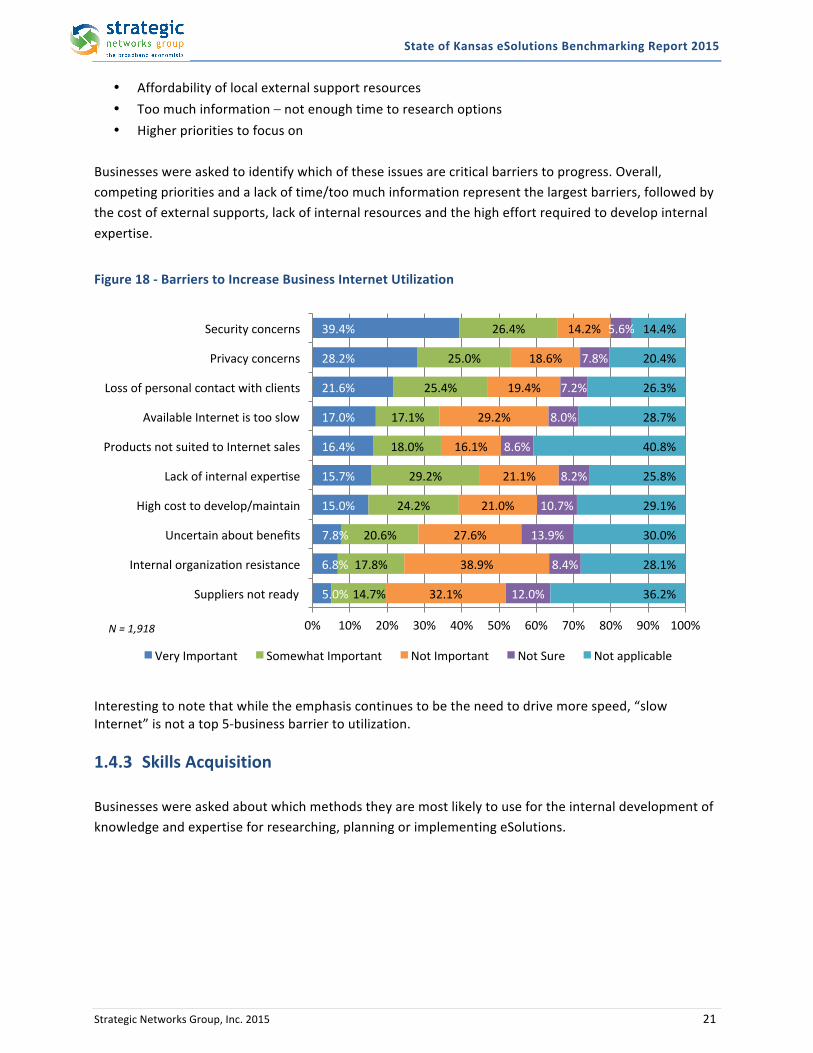
1.4 Barriers and Adoption Issues 1.4.1 Barriers to Adoption Businesses were asked to rate the significance of a number of barriers to effectively using broadband Internet in their operations. These barriers inhibit the adoption of eSolutions and need to be recognized and overcome if broadband utilization and its benefits are to be achieved. Security and privacy concerns are the two barriers that rate the highest in importance, with almost 40% and 29% of businesses, respectively, rating them as very important barriers. It is worth noting that these two strongest perceived threats are external in nature, perhaps considered even more of a threat because these are somewhat out of the business’ control.
1.4.2 Expertise and Knowledge Issues Expertise is needed to implement and use eSolutions. Businesses may encounter several interrelated issues in adopting eSolutions:
• Lack of internal resource with necessary skills • Time and effort required to develop expertise • Lack of local external support resources
20.6%
32.0%
37.5%
37.7%
38.3%
39.1%
39.2%
43.7%
46.6%
55.1%
55.7%
55.9%
59.4%
59.6%
22.2%
27.4%
31.7%
22.6%
32.3%
31.3%
27.6%
31.0%
28.6%
27.4%
29.7%
26.8%
25.3%
26.1%
0% 10% 20% 30% 40% 50% 60% 70% 80% 90%
Increase teleworking
Introduce new products or services
Improve staff skills
Reduce ime to market
Adopt new operaional processes
Coordinaion with suppliers
Reduce cost of products & services
Keep pace with compeitors
Lower operaing costs
Increase revenues
Use resources more effecively
Reach new customers and clients
Improve service to customers
Make daily operaions easier
Very Important Somewhat Important N = 1,308
State of Kansas eSolutions Benchmarking Report 2015
Strategic Networks Group, Inc. 2015 21
• Affordability of local external support resources • Too much information – not enough time to research options • Higher priorities to focus on
Businesses were asked to identify which of these issues are critical barriers to progress. Overall, competing priorities and a lack of time/too much information represent the largest barriers, followed by the cost of external supports, lack of internal resources and the high effort required to develop internal expertise.
Figure 18 -‐ Barriers to Increase Business Internet Utilization
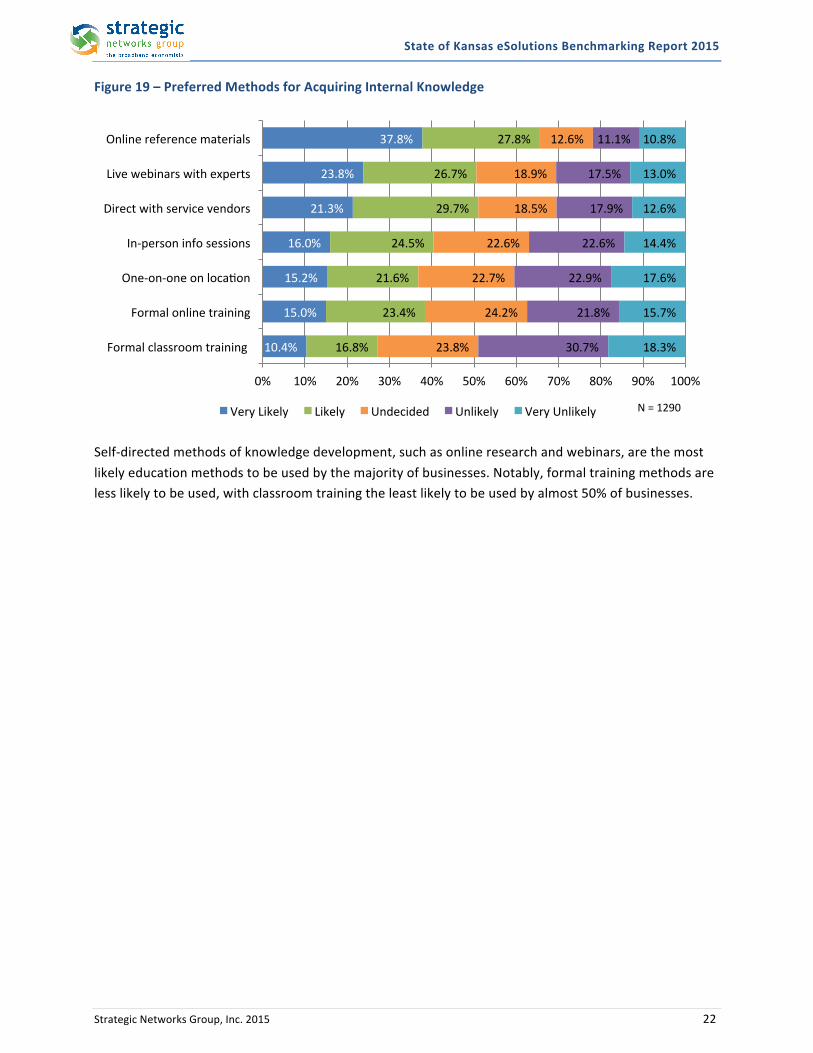
Interesting to note that while the emphasis continues to be the need to drive more speed, “slow Internet” is not a top 5-‐business barrier to utilization. 1.4.3 Skills Acquisition Businesses were asked about which methods they are most likely to use for the internal development of knowledge and expertise for researching, planning or implementing eSolutions.
5.0%
6.8%
7.8%
15.0%
15.7%
16.4%
17.0%
21.6%
28.2%
39.4%
14.7%
17.8%
20.6%
24.2%
29.2%
18.0%
17.1%
25.4%
25.0%
26.4%
32.1%
38.9%
27.6%
21.0%
21.1%
16.1%
29.2%
19.4%
18.6%
14.2%
12.0%
8.4%
13.9%
10.7%
8.2%
8.6%
8.0%
7.2%
7.8%
5.6%
36.2%
28.1%
30.0%
29.1%
25.8%
40.8%
28.7%
26.3%
20.4%
14.4%
0% 10% 20% 30% 40% 50% 60% 70% 80% 90% 100%
Suppliers not ready
Internal organizaion resistance
Uncertain about benefits
High cost to develop/maintain
Lack of internal experise
Products not suited to Internet sales
Available Internet is too slow
Loss of personal contact with clients
Privacy concerns
Security concerns
Very Important Somewhat Important Not Important Not Sure Not applicable
N = 1,918
State of Kansas eSolutions Benchmarking Report 2015
Strategic Networks Group, Inc. 2015 22
Figure 19 – Preferred Methods for Acquiring Internal Knowledge
Self-‐directed methods of knowledge development, such as online research and webinars, are the most likely education methods to be used by the majority of businesses. Notably, formal training methods are less likely to be used, with classroom training the least likely to be used by almost 50% of businesses.
10.4%
15.0%
15.2%
16.0%
21.3%
23.8%
37.8%
16.8%
23.4%
21.6%
24.5%
29.7%
26.7%
27.8%
23.8%
24.2%
22.7%
22.6%
18.5%
18.9%
12.6%
30.7%
21.8%
22.9%
22.6%
17.9%
17.5%
11.1%
18.3%
15.7%
17.6%
14.4%
12.6%
13.0%
10.8%
0% 10% 20% 30% 40% 50% 60% 70% 80% 90% 100%
Formal classroom training
Formal online training
One-‐on-‐one on locaion
In-‐person info sessions
Direct with service vendors
Live webinars with experts
Online reference materials
Very Likely Likely Undecided Unlikely Very Unlikely N = 1290

State of Kansas eSolutions Benchmarking Report 2015
Strategic Networks Group, Inc. 2015 23
1.5 Financial and Employment Impacts from Internet Use To gauge the impacts of Internet use on the operations, businesses were asked to quantify how using the Internet has affected revenue generation, operating cost savings and employment. Due to the proprietary and sensitive nature of this information, these questions were optional for survey respondents. As a result, the sample sizes for usable data in these areas is significantly less than for the total survey response set. The business assessment reached approximately 1,892 commercial establishments, but the largest amount of data collected was in relation to employment and the impacts of the Internet, on which 585 establishments reported data. For other metrics, 345 and 167 businesses reported data for revenues and operating cost savings related to the Internet, respectively. Businesses were asked to provide their total annual4 revenues, operating costs, and current employment to provide a baseline for assessment of impacts. They were also asked to provide the changes as a result of using the Internet, specifically:
• Number of new jobs created in the past 12-‐month period and the number of new jobs created that can be attributed to using the Internet. Example: Consider the difference to job creation if your organization did not use the Internet.
• Total Annual Revenue from the Internet over the past 12-‐month period. Example: This may include direct Internet (online) and income enabled by using the Internet to interact with customers.
• Total Annual Cost Savings from using the Internet over the same period. Example: This may include direct labor costs and other operating cost savings through efficiencies in purchasing and new operating processes.
In terms of the impact of the Internet on generating both revenues and cost savings, 233 Kansas businesses reported 63.3% of 12-‐month revenues generated through the Internet, and 136 businesses in the state reported a 12-‐month operating cost savings of 3.8% due to their use of the Internet.
Figure 20 – Annual Revenues and Cost Savings from Internet Utilization
Annual Revenue Impacts Number of
Establishments Total Annual Revenue
($M) Annual Revenue from
Internet ($M) Percent Internet
Revenue
233 $1,696 $1,073 63.3%
Annual Operating Cost Impacts
Number of Establishments
Total Annual Operating Cost ($M)
Cost Saving from Internet ($M) Percent Cost Saving
136 $232 $9.3 3.8%
4 Annual figures were requested for the past 12 month reporting period.
State of Kansas eSolutions Benchmarking Report 2015
Strategic Networks Group, Inc. 2015 24
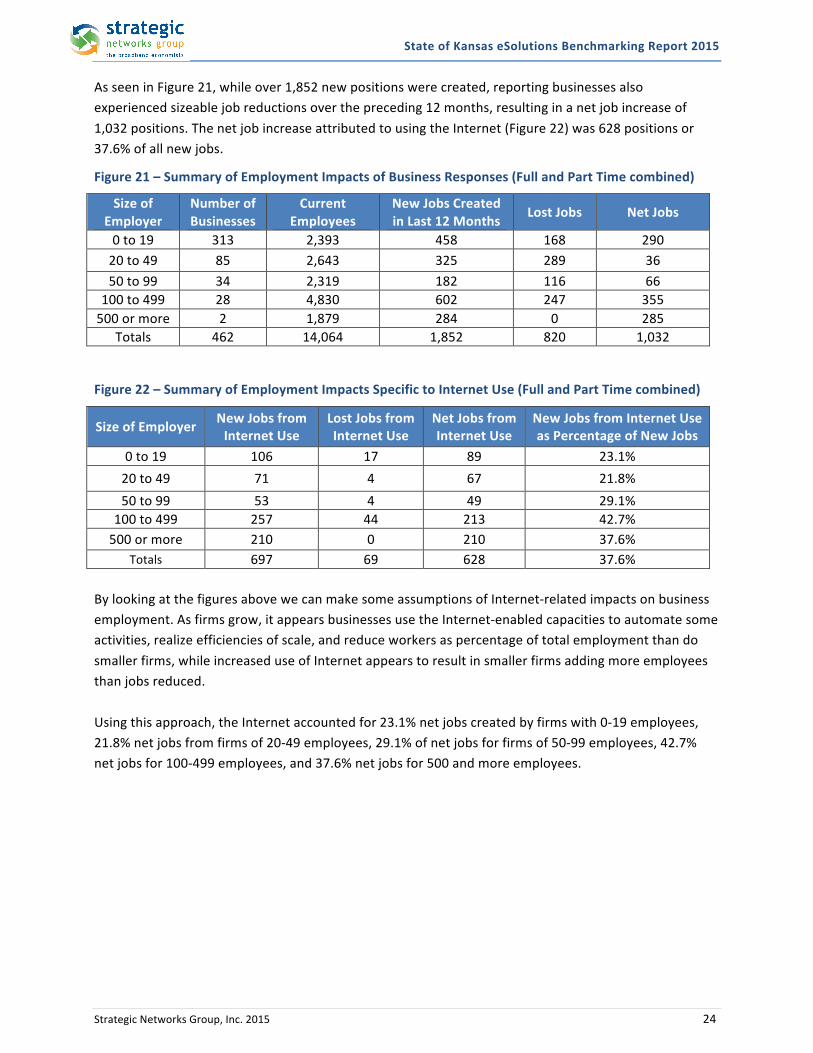
As seen in Figure 21, while over 1,852 new positions were created, reporting businesses also experienced sizeable job reductions over the preceding 12 months, resulting in a net job increase of 1,032 positions. The net job increase attributed to using the Internet (Figure 22) was 628 positions or 37.6% of all new jobs.
Figure 21 – Summary of Employment Impacts of Business Responses (Full and Part Time combined)
Size of Employer
Number of Businesses
Current Employees
New Jobs Created in Last 12 Months Lost Jobs Net Jobs
0 to 19 313 2,393 458 168 290 20 to 49 85 2,643 325 289 36 50 to 99 34 2,319 182 116 66
100 to 499 28 4,830 602 247 355 500 or more 2 1,879 284 0 285
Totals 462 14,064 1,852 820 1,032
Figure 22 – Summary of Employment Impacts Specific to Internet Use (Full and Part Time combined)
Size of Employer New Jobs from Internet Use
Lost Jobs from Internet Use
Net Jobs from Internet Use
New Jobs from Internet Use as Percentage of New Jobs
0 to 19 106 17 89 23.1% 20 to 49 71 4 67 21.8% 50 to 99 53 4 49 29.1%
100 to 499 257 44 213 42.7% 500 or more 210 0 210 37.6%
Totals 697 69 628 37.6% By looking at the figures above we can make some assumptions of Internet-‐related impacts on business employment. As firms grow, it appears businesses use the Internet-‐enabled capacities to automate some activities, realize efficiencies of scale, and reduce workers as percentage of total employment than do smaller firms, while increased use of Internet appears to result in smaller firms adding more employees than jobs reduced. Using this approach, the Internet accounted for 23.1% net jobs created by firms with 0-‐19 employees, 21.8% net jobs from firms of 20-‐49 employees, 29.1% of net jobs for firms of 50-‐99 employees, 42.7% net jobs for 100-‐499 employees, and 37.6% net jobs for 500 and more employees.
State of Kansas eSolutions Benchmarking Report 2015
Strategic Networks Group, Inc. 2015 25
2 Kansas Households
The following analysis is based on assessment responses from 1,449 households from across Kansas. The assessment results presented in this chapter focus on key findings related to Internet usage, benefits and barriers, with selected results broken down by key respondent characteristics, such as household income, Internet connectivity type, and rural versus non-‐rural regions.
2.1 Household Profiles and Connectivity
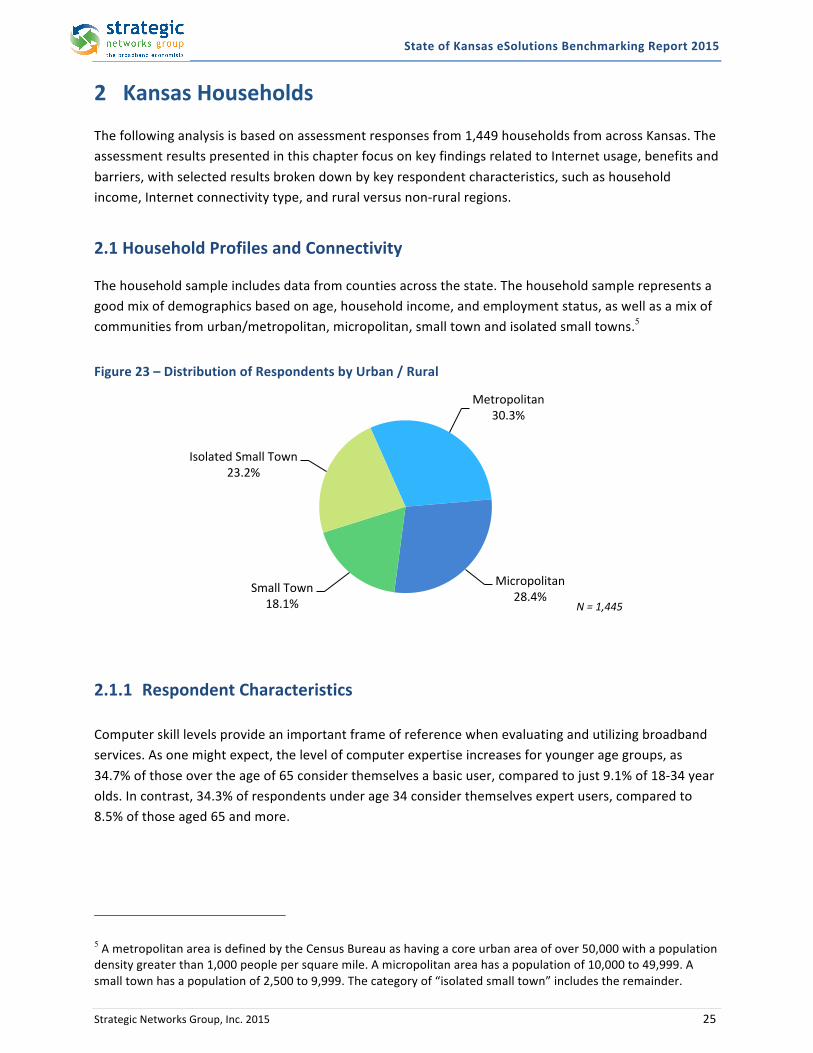
The household sample includes data from counties across the state. The household sample represents a good mix of demographics based on age, household income, and employment status, as well as a mix of communities from urban/metropolitan, micropolitan, small town and isolated small towns.5
Figure 23 – Distribution of Respondents by Urban / Rural
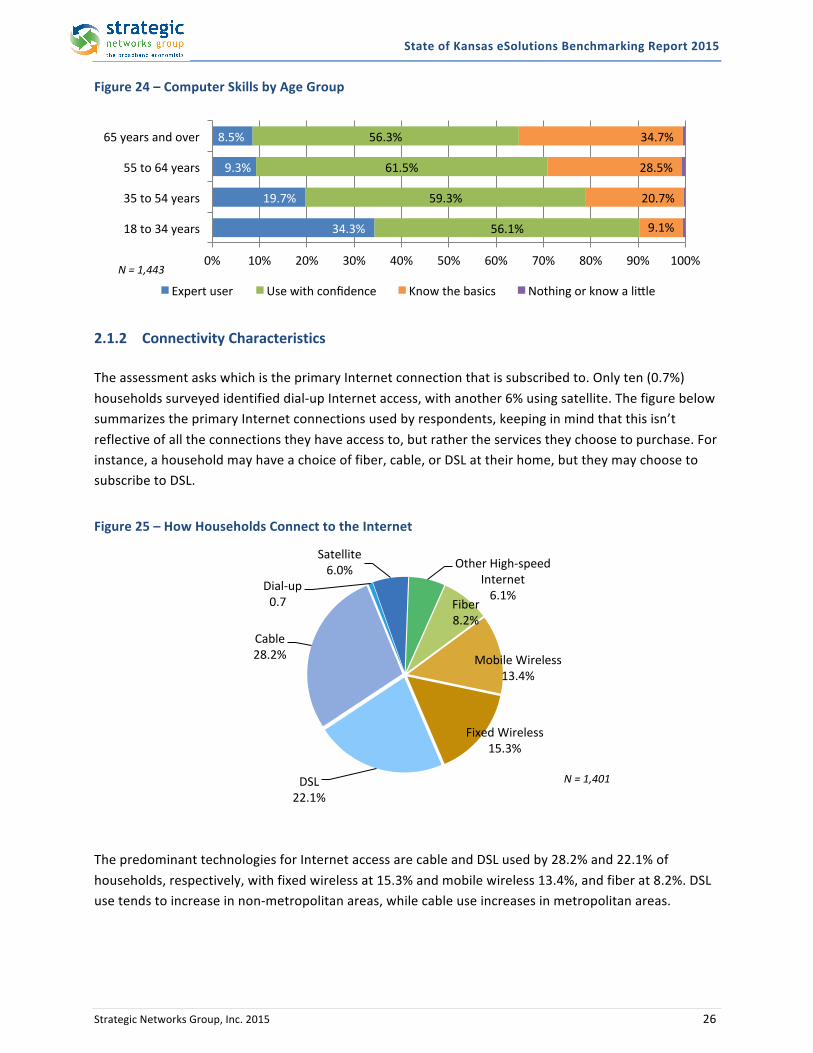
2.1.1 Respondent Characteristics Computer skill levels provide an important frame of reference when evaluating and utilizing broadband services. As one might expect, the level of computer expertise increases for younger age groups, as 34.7% of those over the age of 65 consider themselves a basic user, compared to just 9.1% of 18-‐34 year olds. In contrast, 34.3% of respondents under age 34 consider themselves expert users, compared to 8.5% of those aged 65 and more.
5 A metropolitan area is defined by the Census Bureau as having a core urban area of over 50,000 with a population density greater than 1,000 people per square mile. A micropolitan area has a population of 10,000 to 49,999. A small town has a population of 2,500 to 9,999. The category of “isolated small town” includes the remainder.
Metropolitan 30.3%
Micropolitan 28.4%
Small Town 18.1%
Isolated Small Town 23.2%
N = 1,445
State of Kansas eSolutions Benchmarking Report 2015
Strategic Networks Group, Inc. 2015 26
Figure 24 – Computer Skills by Age Group
2.1.2 Connectivity Characteristics The assessment asks which is the primary Internet connection that is subscribed to. Only ten (0.7%) households surveyed identified dial-‐up Internet access, with another 6% using satellite. The figure below summarizes the primary Internet connections used by respondents, keeping in mind that this isn’t reflective of all the connections they have access to, but rather the services they choose to purchase. For instance, a household may have a choice of fiber, cable, or DSL at their home, but they may choose to subscribe to DSL.
Figure 25 – How Households Connect to the Internet
The predominant technologies for Internet access are cable and DSL used by 28.2% and 22.1% of households, respectively, with fixed wireless at 15.3% and mobile wireless 13.4%, and fiber at 8.2%. DSL use tends to increase in non-‐metropolitan areas, while cable use increases in metropolitan areas.
34.3%
19.7%
9.3%
8.5%
56.1%
59.3%
61.5%
56.3%
9.1%
20.7%
28.5%
34.7%
0% 10% 20% 30% 40% 50% 60% 70% 80% 90% 100%
18 to 34 years
35 to 54 years
55 to 64 years
65 years and over
Expert user Use with confidence Know the basics Nothing or know a liple
N = 1,443
Dial-‐up 0.7%
Satellite 6.0% Other High-‐speed
Internet 6.1%
Fiber 8.2%
Mobile Wireless 13.4%
Fixed Wireless 15.3%
DSL 22.1%
Cable 28.2%
N = 1,401

State of Kansas eSolutions Benchmarking Report 2015
Strategic Networks Group, Inc. 2015 27
Internet Access Speeds6 Households were provided the option to perform a speed test to measure the upload and download speeds of their connections. While only 4.8% (five households) recorded less than 768kbps on the download speed test, 29% of households recorded less than 768kbps on the upload speed test. The following charts provide a summary of the speed test results for download and upload speed ranges and average download and upload speed by connectivity type. The findings are also consistent with data reported on the NTIA Broadband Map site, which reports a median upload speed for households of 0.7 mbps and download speed of 4.4mbps http://www.broadbandmap.gov/summarize/state/kansas.
Figure 26 – Speed-‐Test Upload Results for Households
Figure 27 – Speed-‐Test Download Results for Households
6 Speed test results should be used with great care. Different broadband mapping exercises have produced markedly different results, largely because they measure different outputs. Key points to keep in mind in using speed test data from this assessment include the measured actual upload and download speeds at the time the test was taken. Most broadband mapping exercises report speeds available in these same areas. Many consumers purchase Internet service with less than the maximum available speed, usually due to cost. Moreover, reported available speeds often reflect the maximum speed in a larger geographic area, not necessarily the speed available at that specific location.
2.8%
26.2%
23.6%
13.0%
15.8%
10.6%
7.1%
0.5%
0.4%
Less than 200 kbps
200 kbps up to 768 kbps
768 kbps up to 1.5 mbps
1.5 mbps up to 3 mbps
3 mbps up to 6 mbps
6 mbps up to 10 mbps
10 mbps up to 25 mbps
25 mbps up to 50 mbps
50 mbps or more
0% 5% 10% 15% 20% 25% 30% N = 576
4.8% 7.5%
11.7% 19.7%
14.6% 26.5%
7.8% 6.8%
0.7%
Less than 768 kbps 768 kbps up to 1.5 mbps 1.5 mbps up to 3 mbps 3 mbps up to 6 mbps
6 mbps up to 10 mbps 10 mbps up to 25 mbps 25 mbps up to 50 mbps 50 mbps up to 100 mbps 100 mbps up to 1 gbps
0% 5% 10% 15% 20% 25% 30% N = 589

State of Kansas eSolutions Benchmarking Report 2015
Strategic Networks Group, Inc. 2015 28
For residential service, cable connectivity provides the fastest access, followed by fiber and mobile wireless. No dial-‐up respondents took the speed test, but dial-‐up is logically the slowest access choice, followed by satellite.
Figure 28 -‐ Speed (Megabits per second) by Connection Type
Internet Costs The median cost for household Internet access fell into the $50-‐$60 range. The median DSL and Fixed Wireless cost fell into the $40 to $50 range, while satellite fell in to the $60 to $70 range. The monthly costs for Internet service tends to be similar in rural versus non-‐rural areas. Internet Reliability and Satisfaction Levels Households were asked to rate how well their current Internet service meets their needs in terms of speed, reliability and value. Fiber has by far the best reliability of the broadband connection options. Cable, DSL and fixed wireless are comparable in terms of meeting household needs and expectations for speed, reliability and value. Reliability is generally poor for both dial-‐up and satellite Internet, with each contributing to poor ratings on price/value expectations. Satellite service shows occasional or frequent problems by 57.3% of households that subscribe to satellite, while dial-‐up also proves to be the most problematic with occasional or frequent problems cited by 62.5% of the 8 dial-‐up households, with none describing reliability as “always excellent.”
5.5
8.0
9.6
9.7
11.4
25.0
0.9
2.0
4.5
2.4
4.9
5.4
0 5 10 15 20 25 30
Satellite
DSL
Mobile Wireless
Fixed Wireless
Fiber
Cable
Ave. Upload (mbps) Ave. Download (mbps) N = 542
State of Kansas eSolutions Benchmarking Report 2015
Strategic Networks Group, Inc. 2015 29
2.2 Broadband Utilization and Benefits
2.2.1 Broadband Utilization Households were asked about their current uses of the Internet as well as their planned use over the next 12 months. This report focuses primarily on household utilization in the productivity category7. Households were asked about how they use the Internet for personal productivity for:
• Educational or training courses (remote learning or supplemental courses from home) • Accessing workplace from home (occasional use) • Teleworking (formal workplace all or part of normal work hours) • Home-‐based business (full-‐time or part-‐time)
The most frequent productivity (Figure 29) use for broadband households statewide is for accessing their workplace, with 42.7% of broadband households currently using the Internet for remote access and 18% for telework. Another 7.2% plan to use the Internet for remote access, and 6.7% plan to telework. Education and training was the next most frequent productivity use, with 38.2% currently using and another 13.6% planning to do so. Home-‐based business currently using the Internet as part of their business were a significantly smaller group at just over 18.7%, with planned use at 9.1%. Figure 29 also shows population density impacts households’ productive uses of broadband. Respondents from metropolitan areas are more likely to use the Internet for all four productivity activities. However, non-‐metro areas have reasonably high activity levels as well. Isolated small towns show almost as high current use of the Internet for home-‐based businesses as metro areas, and exceed micropolitan and small town respondents in their frequency of use of the Internet for telework and home based business.
7 In addition to questions of use of the Internet for personal productivity, household were asked to identify if they used the Internet for four other five major categories: Communication; Research and information; Online transactions; Entertainment and recreation. The results of utilization in these five categories can be found in the online Digital Economy Analytics Platform (DEAP), which is described in Appendix B.

State of Kansas eSolutions Benchmarking Report 2015
Strategic Networks Group, Inc. 2015 30
Figure 29 – Broadband Productivity Uses by Community Population Density
Higher population density linked to the use of the Internet to telecommute and access the workplace, speaks to the power of broadband being an equalizer of opportunity. Unfortunately, households in rural areas are more likely to be limited to dial-‐up connectivity and some productivity activities simply cannot be realized with dial-‐up. SNG data collected from multiple states over the last four years shows that there is a very significant difference in utilization between dial-‐up and broadband users. For these users, the lack of broadband becomes a meaningful impediment to practical Internet benefits to personal and household efficiencies and productivity. Lower quality dial-‐up connectivity has a major negative impact on a household’s productive use of the Internet. In all instances, significant percentages of broadband households are more productive in specific areas over their dial-‐up counterparts. SNG multi-‐state data indicate that many dial-‐up customers would plan to use more productive activities if they had broadband available for use. This indicates a level of awareness and latent demand for personal productivity uses through broadband.
25.4%
16.5%
9.4%
16.3%
21.5%
16.5%
16.3%
19.5%
54.1%
40.1%
36.9%
34.9%
42.2%
38.5%
36.5%
34.2%
7.9%
5.4%
6.4%
6.8%
8.1%
8.0%
8.2%
12.4%
6.4%
4.7%
8.2%
10.7%
13.1%
13.2%
17.6%
12.1%
0% 10% 20% 30% 40% 50% 60% 70%
Metropolitan
Micropolitan
Small Town
Isolated Small Town
Metropolitan
Micropolitan
Small Town
Isolated Small Town
Metropolitan
Micropolitan
Small Town
Isolated Small Town
Metropolitan
Micropolitan
Small Town
Isolated Small Town
Teleworking
Home bu
siness
Accessing workplace E
ducaio
n/training
Percent of Households
Currently use Plan to use N = 1,332

State of Kansas eSolutions Benchmarking Report 2015
Strategic Networks Group, Inc. 2015 31
2.2.2 Mobile Uses As with businesses and other organizations, the impact of mobile Internet on households is important to recognize. During the online assessment, households were asked to respond to questions to think about the services and applications used most with their mobile devices. The results are in Figure 30 below.
Figure 30 -‐ Types of Mobile Applications use by Households
2.2.2.1 Online Transactions and Spending The survey reveals that:
• 63% of households spending more than $500 per year online • 92.5% of broadband households use the Internet to purchase goods and services online
o 68.7% of these households conducting more than 10 purchase transactions per year While on the topic of online purchases, mobile is becoming a growing segment of the digital economy. Households that own at least one mobile device were asked what percentage of online purchases they make through a mobile device. Interestingly, over 70% of mobile users have made an online purchase with their mobile device. Additionally, over 43% of households with mobile device say they used their mobile device to purchase from a business for the first time.
2.2.2.2 Home-‐based Business One somewhat surprising finding was the percentage of households that generated income over the Internet, particularly through a home-‐based business. Of particular interest is that 18.7% of broadband households stated that they currently operate a home-‐based business. These households were further asked if they operate a home-‐based business under the following definition:
43.6%
43.9%
49.2%
71.3%
71.3%
76.7%
11.1%
11.2%
12.3%
11.1%
9.9%
7.4%
45.3%
44.8%
38.5%
17.6%
18.8%
15.9%
0% 10% 20% 30% 40% 50% 60% 70% 80% 90% 100%
Write review or share product opinions
Applicaions needed for work
Pay for goods or services on the spot
Compare prices or reviews while shopping
Order goods or services online
Find service close to locaion
Currently use Plan to use No plan to use N = 1,202

State of Kansas eSolutions Benchmarking Report 2015
Strategic Networks Group, Inc. 2015 32
“A home-‐based business may be part-‐time or full-‐time activity by one or more household members that operate their business exclusively from home. This may include self-‐employed professionals and many other types of entrepreneurial business activities.”
Using this tighter definition, 13.1% of households surveyed operate a home-‐based business. Based on this more precise definition, 70% of the original 18.7% of respondents who initially stated that they ran a home-‐based business confirmed operating a home-‐based business using broadband. Taking this further, 37.4% of home businesses (narrowly defined) strongly agree that they would not be in business without the Internet, and 23.6% would need to relocate to get broadband if it was not available. A vast majority (88.5%) of home-‐based businesses agree broadband is essential for their business to function. The most frequent uses for home-‐based businesses are Online Banking and Research, which are each used by over 80% of home-‐based businesses. Over half (54.9%) of home businesses have a business website, while a majority of home businesses currently use the Internet as a tool for making day-‐to-‐day operations easier and making more effective use of their resources (productivity). Home-‐based businesses are more likely to sell online (61.7%) compared to all businesses (52.6%).
Figure 31 – Home-‐based Business Uses of the Internet
2.2.2.3 Teleworking In response to questions concerning use of the Internet for personal productivity 18% of households stated that teleworking is currently practiced. These households were further asked if one or more household member’s telework under the following definition:
54.9%
60.0%
60.0%
61.7%
63.4%
70.3%
70.3%
76.0%
83.4%
85.1%
11.4%
8.6%
7.4%
6.3%
11.4%
8.6%
6.9%
3.4%
2.9%
6.3%
8.0%
12.0%
8.6%
5.7%
8.0%
5.1%
6.9%
3.4%
4.6%
2.9%
25.7%
19.4%
24.0%
26.3%
17.1%
16.0%
16.0%
17.1%
9.1%
5.7%
0% 10% 20% 30% 40% 50% 60% 70% 80% 90% 100%
Website
Adverising
Supplier Communicaion
Online Sales
Skills Development
Customer Service
Document Transfer
Online Purchasing
Research
Online Banking
Currently use Plan to use No plan to use Not applicable N = 1,190
State of Kansas eSolutions Benchmarking Report 2015
Strategic Networks Group, Inc. 2015 33
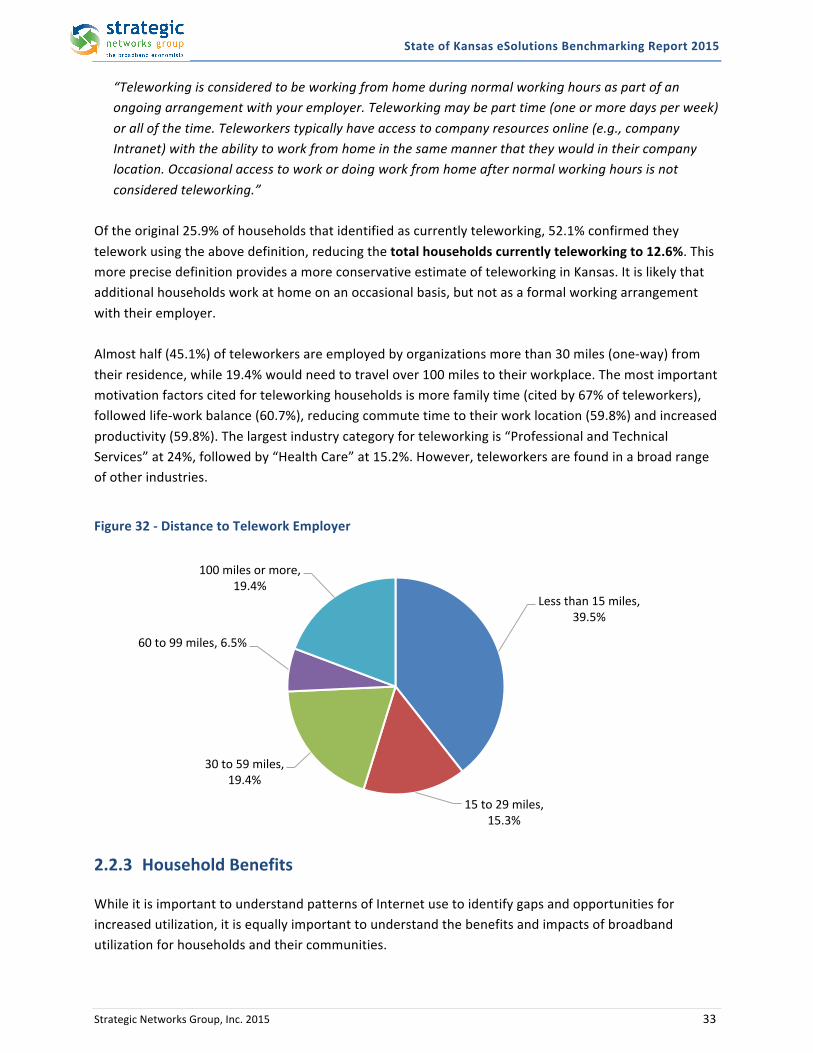
“Teleworking is considered to be working from home during normal working hours as part of an ongoing arrangement with your employer. Teleworking may be part time (one or more days per week) or all of the time. Teleworkers typically have access to company resources online (e.g., company Intranet) with the ability to work from home in the same manner that they would in their company location. Occasional access to work or doing work from home after normal working hours is not considered teleworking.”
Of the original 25.9% of households that identified as currently teleworking, 52.1% confirmed they telework using the above definition, reducing the total households currently teleworking to 12.6%. This more precise definition provides a more conservative estimate of teleworking in Kansas. It is likely that additional households work at home on an occasional basis, but not as a formal working arrangement with their employer. Almost half (45.1%) of teleworkers are employed by organizations more than 30 miles (one-‐way) from their residence, while 19.4% would need to travel over 100 miles to their workplace. The most important motivation factors cited for teleworking households is more family time (cited by 67% of teleworkers), followed life-‐work balance (60.7%), reducing commute time to their work location (59.8%) and increased productivity (59.8%). The largest industry category for teleworking is “Professional and Technical Services” at 24%, followed by “Health Care” at 15.2%. However, teleworkers are found in a broad range of other industries.
Figure 32 -‐ Distance to Telework Employer
2.2.3 Household Benefits
While it is important to understand patterns of Internet use to identify gaps and opportunities for increased utilization, it is equally important to understand the benefits and impacts of broadband utilization for households and their communities.
Less than 15 miles, 39.5%
15 to 29 miles, 15.3%
30 to 59 miles, 19.4%
60 to 99 miles, 6.5%
100 miles or more, 19.4%

State of Kansas eSolutions Benchmarking Report 2015
Strategic Networks Group, Inc. 2015 34
To provide a perspective on the overall importance of broadband, households were asked, “Assuming you could never get broadband service, how likely is it that you would leave to relocate to a community that offers broadband?” Nearly one in three (30.9%) would relocate to another community if they needed access to broadband services. This breaks out as 13.5% of households saying they would definitely relocate with 17.4% saying relocation would be “very likely.” Households were also asked to rate the significance of the Internet for achieving the following household benefits:
• Improves knowledge and skills (through online education and/or research) • Enhances ability to earn additional income • Enhances school learning (through research and study) • Enhances awareness of what is happening in the community • Supports better balance of personal and work time • Supports choice of living location (e.g., for selecting or remaining in your community)
The following figure shows the perceived benefits of using the Internet for households.
Figure 33 – Significance of Broadband for Household Benefits
2.3 Barriers and Adoption Issues The data collected examines how households can get the most out of broadband by looking at their aspirations, barriers to achieving aspirations, and how they can acquire the skills to overcome those barriers. The first question is whether households are satisfied with their current level of Internet use, including the level of benefits they derive from using the Internet. 58.1% of household respondents want to increase their level of Internet use, while 40.2% feel their current level of use is about right, with only 1.7% desiring to reduce their use. With over half of all households wishing to increase or improve their use of the Internet, the next question is “what barriers do they see in striving to achieve that objective.” As seen in Figure 34, the two main barriers are concerns over privacy and security (50.5%) followed by an inadequate Internet
27.0%
32.4%
33.1%
38.4%
40.6%
56.4%
22.6%
31.5%
21.0%
41.3%
26.4%
30.6%
0% 10% 20% 30% 40% 50% 60% 70% 80% 90% 100%
Addiional income
Life-‐work balance
Choice of locaion
Connecing with community
School learning
Knowledge and skills
Very Important Somewhat Important N = 1,280

State of Kansas eSolutions Benchmarking Report 2015
Strategic Networks Group, Inc. 2015 35
connection (48% of households say this is a very important barrier). While speed is not a top barrier for utilization for businesses (number 7 barrier with 34% citing), it is clear that the “need for speed” is felt and recognized by households. Lack of skills or knowledge and awareness of online benefits is a far smaller group, with over two thirds of households reporting those are not important or applicable issues.
Figure 34 – Barriers to Enhanced Use of the Internet
For those 30% of households interested in increasing their skill levels, the preferred learning methods, as seen in Figure 35, are self-‐directed, either by accessing online resources or talking with other people who have experience. The least favored methods are formal classroom activities. These statistics are important for initiatives designed to deliver training and support to households for increasing broadband utilization. In particular, providing access to online training would be favored by an overwhelming percentage of households, while also being a cost-‐effective method for delivering information and support for using broadband services.
Figure 35 – Preferred Means for Increasing Broadband Skills
10.1%
13.8%
22.2%
48.0%
50.5%
20.6%
27.4%
44.3%
29.5%
32.1%
0% 10% 20% 30% 40% 50% 60% 70% 80% 90%
Lack of skills
Awareness of Internet benefits
Not enough ime
Connecion speed or reliability
Privacy and security concerns
Very Important Somewhat Important N = 733
19.2%
20.2%
24.5%
37.9%
41.0%
48.9%
49.9%
42.7%
43.5%
56.1%
39.4%
40.6%
43.0%
41.3%
38.1%
36.3%
19.3%
22.6%
18.4%
8.1%
8.8%
0% 10% 20% 30% 40% 50% 60% 70% 80% 90% 100%
Classroom courses
Workshops or seminars
Books or manuals
Online courses
Webinars
Talking to others
Online informaion
Preferred Someimes Never N = 1,263
State of Kansas eSolutions Benchmarking Report 2015
Strategic Networks Group, Inc. 2015 36
3 Benchmarks This report includes comparisons of Internet use between regions by various characteristics, such as industry, business size, and household demographics. To assist in the process of making comparisons, a mechanism was developed for establishing benchmarks. Benchmarks are useful in creating reference points against which the performance of any individual or group can be compared. Strategic Networks Group has developed a benchmarking process based on its Digital Economy index (DEi).
3.1 The Digital Economy Index The Digital Economy index (DEi) reflects a business’ or organization’s utilization of 17 different Internet applications and process. These applications and processes (eSolutions) are listed on the following page. Based on the number of applications currently being used by an organization, a composite score is calculated that summarizes how comprehensively each business organization uses Internet-‐enabled eSolutions. The DEi can be used to compare organizations, regions, or industry sectors. A separate DEi is used to compare how different household types use the Internet. An organization’s DEi score (from 0 to 10) captures their utilization of eSolutions, with 10 being the highest possible use. DEi scores are averaged across groups of users by various categories: e.g. a sector’s DEi is the average for all organizations in that sector. The DEi is used as a basis for comparison of utilization levels across various dimensions. Identifying variations in DEi assists in focusing on areas where a deeper assessment is warranted. In areas where DEi is lower than average, indicating lower utilization, an opportunity to increase utilization and benefits to businesses and non-‐commercial entities exists. On the following page is a list of the utilization categories (eSolutions) used to track how organizations use their Internet and broadband connections.
The term “eSolutions” refers to the integration of Internet technologies with the computer-‐based systems and applications within and among organizations for a variety of operational processes.
eSolutions encompass not only product delivery and payment transactions (eCommerce) but also all processes that may be facilitated by computer-‐mediated communications over the Internet.
Average DEI Score Sample Size Median DEi Score
6.42 6.70 1,755
State of Kansas eSolutions Benchmarking Report 2015
Strategic Networks Group, Inc. 2015 37
eSolutions Categories for Businesses and non-‐commercial entities
eCommerce Related eProcess Related
Selling goods or services Purchasing goods or services
Deliver services and content Supplier communication and coordination
Rich media or service creation Electronic document transfer
Customer service and support Staff training and skills development
Advertising and promotion Teleworking
Social networking Accessing collaborative tools
Web site for organization Banking and financial
Research by staff Government transactions
Access government information
3.2 Business Benchmarks This report uses both average (mean) and median as benchmarks. For businesses in Kansas, the average DEi was 6.42 while the median average was 6.70.8 These scores indicate a middle-‐of-‐the-‐road (median) business in Kansas was using about 11 of the 17 eSolutions noted on the previous page. Looking at the differences between geographic areas, Figure 36 shows that more urban areas have higher Internet utilization levels than less urban areas (as measured by DEi). Using US Census Bureau categories, the data shows that businesses in isolated small towns9 have a median DEI score that is 1.2 less than businesses in Metropolitan areas (equal to approximately 2 eSolutions).
Figure 36 – Utilization Benchmarks (DEi) for Businesses by Level of Urbanization
Utilization (DEi) by Level of Urbanization Region Median DEi Average DEI Score Number of Firms Metropolitan 7.0 6.6 875 Micropolitan 6.7 6.5 415 Small Town 6.3 6.3 280 Isolated Small Town 5.9 5.8 184
8 The terms mean and average refer to the sum of all values divided by the total number of values. The median is the central point of a data set. To find the median, list all data points in ascending order and simply pick the entry in the middle of that list. 9 A metropolitan area is defined by the Census Bureau as having a core urban area of over 50,000 with a population density greater than 1,000 people per square mile. A micropolitan area has a population of 10,000 to 49,999. A small town has a population of 2,500 to 9,999. The category of “isolated small town” includes the remainder.
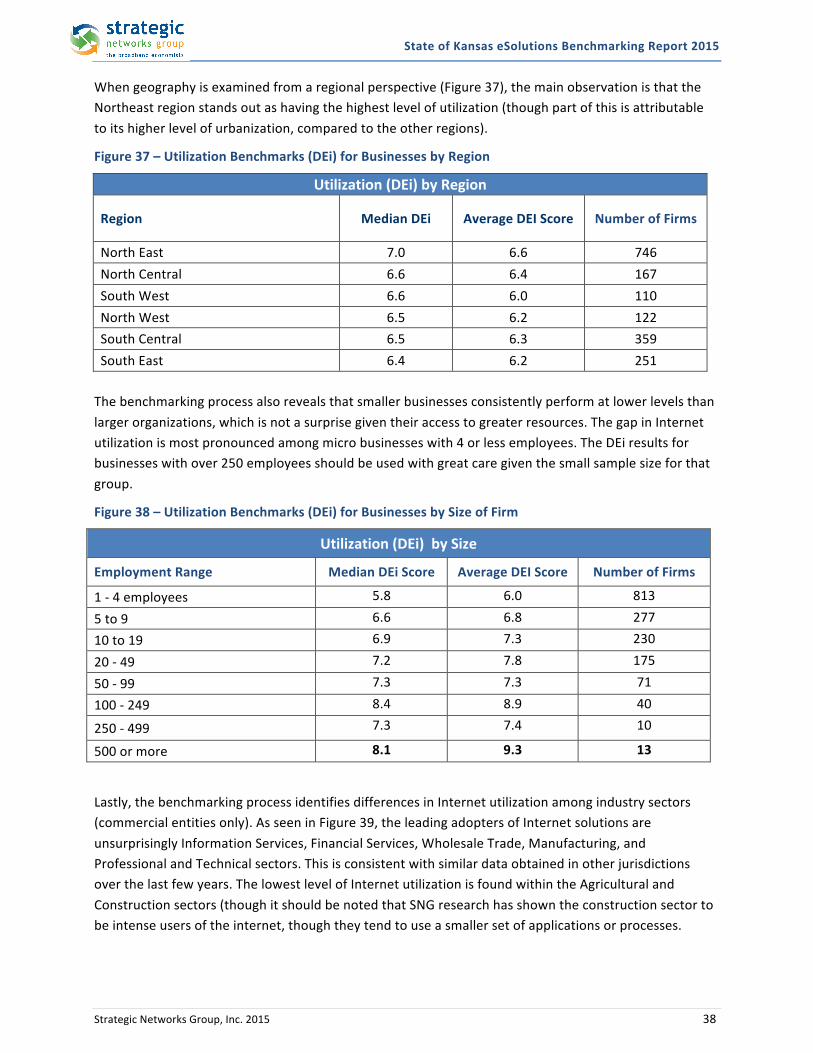
State of Kansas eSolutions Benchmarking Report 2015
Strategic Networks Group, Inc. 2015 38
When geography is examined from a regional perspective (Figure 37), the main observation is that the Northeast region stands out as having the highest level of utilization (though part of this is attributable to its higher level of urbanization, compared to the other regions).
Figure 37 – Utilization Benchmarks (DEi) for Businesses by Region
Utilization (DEi) by Region
Region Median DEi Average DEI Score Number of Firms
North East 7.0 6.6 746 North Central 6.6 6.4 167 South West 6.6 6.0 110 North West 6.5 6.2 122 South Central 6.5 6.3 359 South East 6.4 6.2 251 The benchmarking process also reveals that smaller businesses consistently perform at lower levels than larger organizations, which is not a surprise given their access to greater resources. The gap in Internet utilization is most pronounced among micro businesses with 4 or less employees. The DEi results for businesses with over 250 employees should be used with great care given the small sample size for that group.
Figure 38 – Utilization Benchmarks (DEi) for Businesses by Size of Firm
Utilization (DEi) by Size Employment Range Median DEi Score Average DEI Score Number of Firms
1 -‐ 4 employees 5.8 6.0 813
5 to 9 6.6 6.8 277
10 to 19 6.9 7.3 230
20 -‐ 49 7.2 7.8 175
50 -‐ 99 7.3 7.3 71
100 -‐ 249 8.4 8.9 40
250 -‐ 499 7.3 7.4 10
500 or more 8.1 9.3 13
Lastly, the benchmarking process identifies differences in Internet utilization among industry sectors (commercial entities only). As seen in Figure 39, the leading adopters of Internet solutions are unsurprisingly Information Services, Financial Services, Wholesale Trade, Manufacturing, and Professional and Technical sectors. This is consistent with similar data obtained in other jurisdictions over the last few years. The lowest level of Internet utilization is found within the Agricultural and Construction sectors (though it should be noted that SNG research has shown the construction sector to be intense users of the internet, though they tend to use a smaller set of applications or processes.
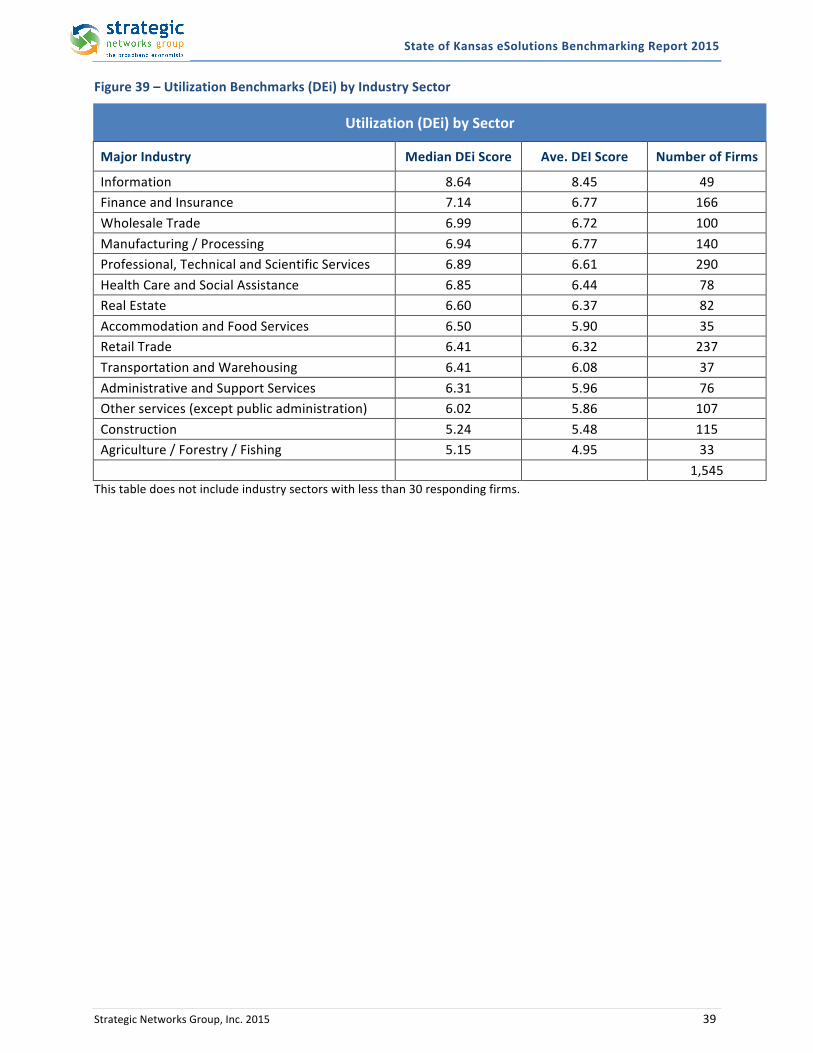
State of Kansas eSolutions Benchmarking Report 2015
Strategic Networks Group, Inc. 2015 39
Figure 39 – Utilization Benchmarks (DEi) by Industry Sector
Utilization (DEi) by Sector
Major Industry Median DEi Score Ave. DEI Score Number of Firms
Information 8.64 8.45 49 Finance and Insurance 7.14 6.77 166 Wholesale Trade 6.99 6.72 100 Manufacturing / Processing 6.94 6.77 140 Professional, Technical and Scientific Services 6.89 6.61 290 Health Care and Social Assistance 6.85 6.44 78 Real Estate 6.60 6.37 82 Accommodation and Food Services 6.50 5.90 35 Retail Trade 6.41 6.32 237 Transportation and Warehousing 6.41 6.08 37 Administrative and Support Services 6.31 5.96 76 Other services (except public administration) 6.02 5.86 107 Construction 5.24 5.48 115 Agriculture / Forestry / Fishing 5.15 4.95 33 1,545 This table does not include industry sectors with less than 30 responding firms.

State of Kansas eSolutions Benchmarking Report 2015
Strategic Networks Group, Inc. 2015 40
4 Comparative Analysis This section provides a comparative analysis of the levels of Internet utilization by businesses, organizations and households in Kansas as compared to four benchmark states. The tables in this document include results from an assessment carried out across Kansas in December 2014 and January 2015. These results compare statewide assessments carried out in four states between 2012 and 2014. These four states are referred to as “benchmark states,” and include one eastern seaboard state and three Midwestern states. Results from these comparisons need to be used cautiously. Each state has different socioeconomic profiles that strongly influence Internet use. Moreover, data collected in Kansas is more recent than the benchmark states. SNG analysis shows that Internet utilization increases over time, so numbers in 2012 should be lower than 2013, and 2013 lower than 2014, and so on. In a vacuum, if all states were the same (they are not), one would expect results from Kansas to show higher levels of Internet utilization than that of the benchmark states. The tables in this section are designed to compare results from Kansas and the benchmark states while controlling for key factors that impact utilization of the Internet. For organizations and businesses, those factors are size, industry sector, and degree of urbanization. For households, the key factors addressed are level of urbanization and age of respondent. With the preceding design considerations in mind, this addendum contains six tables with comparisons of:
1. Different industry sectors10 from metropolitan areas (populations over 50,000) 2. Different industry sectors from non-‐metropolitan areas (populations under 50,000) 3. Businesses from five different size ranges (number of employees) in metropolitan areas 4. Businesses from five different size ranges in non-‐metropolitan areas 5. Households by age 6. Households by level of urbanization (four categories of urbanization)11
In order to make comparisons of Internet utilization, SNG uses a Digital Economy index (DEi). An organization or household DEi score (from 0 to 10) captures their utilization of eSolutions, with 10 being the highest possible use. DEi scores are averaged across groups of users by various categories: e.g., a sector’s DEi is the average for all organizations in that sector. The DEi is then used as a basis for comparison of utilization levels across various dimensions. The color-‐coding for DEi scores: To better show relative utilization, the DEi tables in this report are color coded from the highest (green) to lowest (red) to highlight how DEi scores compare. The color-‐coding allows one to quickly compare groups based on how utilization varies.
10 Industries are based on 2-‐digit NAICS code level data from USCB County Business Patterns 2011. Full names of industries from NAICS definitions are abbreviated for this table. 11 A metropolitan area is defined by the Census Bureau as having a core urban area of over 50,000 with a population density greater than 1,000 people per square mile. A Micropolitan area has a population of 10,000 to 49,999. A small town has a population of 2,500 to 9,999. The category of “isolated small town” includes the remainder.
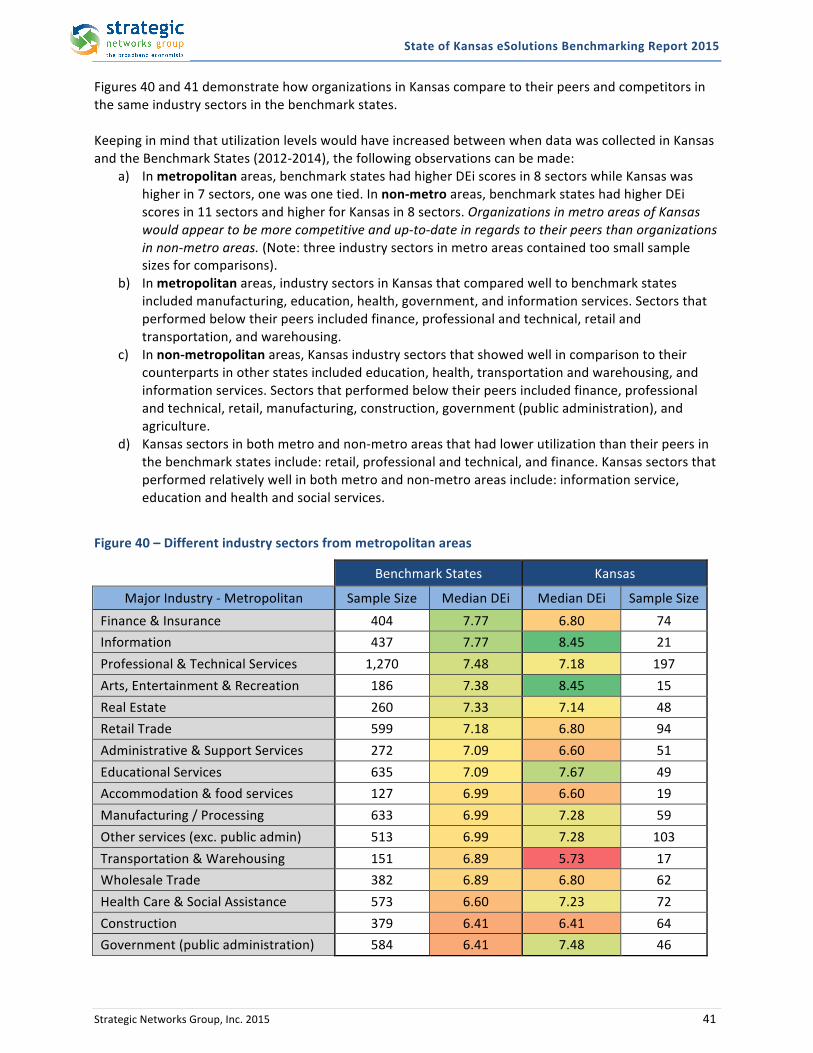
State of Kansas eSolutions Benchmarking Report 2015
Strategic Networks Group, Inc. 2015 41
Figures 40 and 41 demonstrate how organizations in Kansas compare to their peers and competitors in the same industry sectors in the benchmark states. Keeping in mind that utilization levels would have increased between when data was collected in Kansas and the Benchmark States (2012-‐2014), the following observations can be made:
a) In metropolitan areas, benchmark states had higher DEi scores in 8 sectors while Kansas was higher in 7 sectors, one was one tied. In non-‐metro areas, benchmark states had higher DEi scores in 11 sectors and higher for Kansas in 8 sectors. Organizations in metro areas of Kansas would appear to be more competitive and up-‐to-‐date in regards to their peers than organizations in non-‐metro areas. (Note: three industry sectors in metro areas contained too small sample sizes for comparisons).
b) In metropolitan areas, industry sectors in Kansas that compared well to benchmark states included manufacturing, education, health, government, and information services. Sectors that performed below their peers included finance, professional and technical, retail and transportation, and warehousing.
c) In non-‐metropolitan areas, Kansas industry sectors that showed well in comparison to their counterparts in other states included education, health, transportation and warehousing, and information services. Sectors that performed below their peers included finance, professional and technical, retail, manufacturing, construction, government (public administration), and agriculture.
d) Kansas sectors in both metro and non-‐metro areas that had lower utilization than their peers in the benchmark states include: retail, professional and technical, and finance. Kansas sectors that performed relatively well in both metro and non-‐metro areas include: information service, education and health and social services.
Figure 40 – Different industry sectors from metropolitan areas
Benchmark States Kansas
Major Industry -‐ Metropolitan Sample Size Median DEi Median DEi Sample Size Finance & Insurance 404 7.77 6.80 74 Information 437 7.77 8.45 21 Professional & Technical Services 1,270 7.48 7.18 197 Arts, Entertainment & Recreation 186 7.38 8.45 15 Real Estate 260 7.33 7.14 48 Retail Trade 599 7.18 6.80 94 Administrative & Support Services 272 7.09 6.60 51 Educational Services 635 7.09 7.67 49 Accommodation & food services 127 6.99 6.60 19 Manufacturing / Processing 633 6.99 7.28 59 Other services (exc. public admin) 513 6.99 7.28 103 Transportation & Warehousing 151 6.89 5.73 17 Wholesale Trade 382 6.89 6.80 62 Health Care & Social Assistance 573 6.60 7.23 72 Construction 379 6.41 6.41 64 Government (public administration) 584 6.41 7.48 46
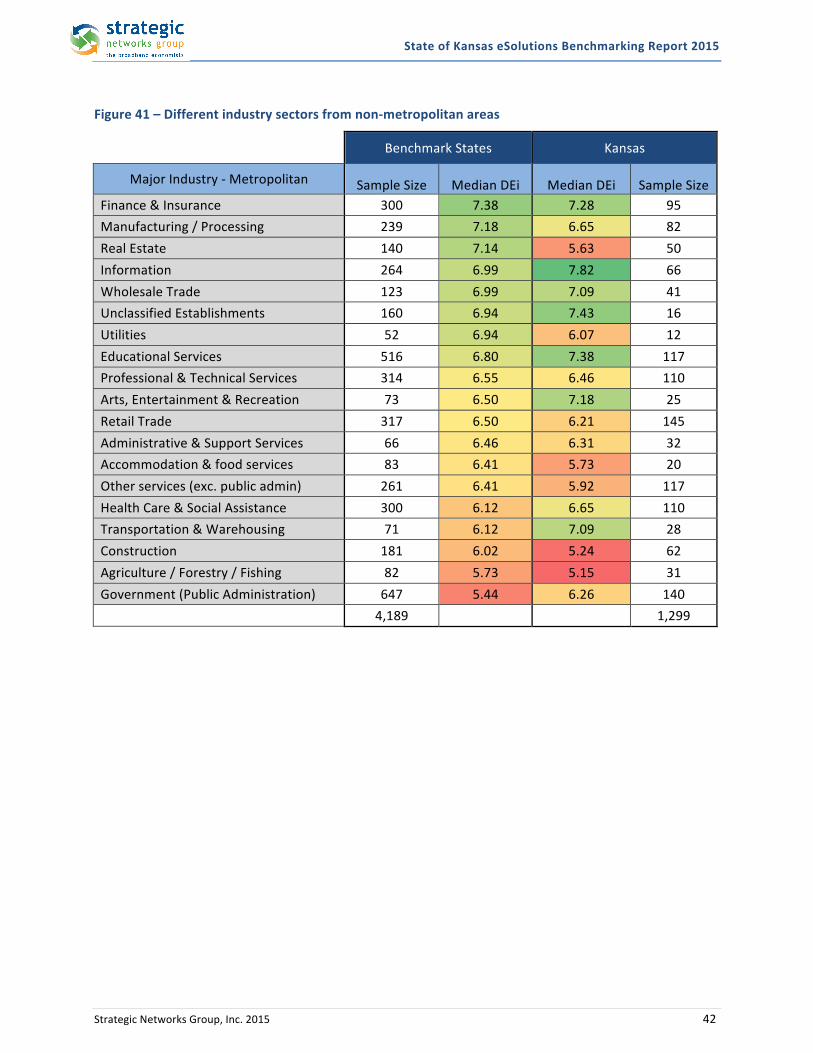
State of Kansas eSolutions Benchmarking Report 2015
Strategic Networks Group, Inc. 2015 42
Figure 41 – Different industry sectors from non-‐metropolitan areas
Benchmark States Kansas
Major Industry -‐ Metropolitan Sample Size Median DEi Median DEi Sample Size Finance & Insurance 300 7.38 7.28 95 Manufacturing / Processing 239 7.18 6.65 82 Real Estate 140 7.14 5.63 50 Information 264 6.99 7.82 66 Wholesale Trade 123 6.99 7.09 41 Unclassified Establishments 160 6.94 7.43 16 Utilities 52 6.94 6.07 12 Educational Services 516 6.80 7.38 117 Professional & Technical Services 314 6.55 6.46 110 Arts, Entertainment & Recreation 73 6.50 7.18 25 Retail Trade 317 6.50 6.21 145 Administrative & Support Services 66 6.46 6.31 32 Accommodation & food services 83 6.41 5.73 20 Other services (exc. public admin) 261 6.41 5.92 117 Health Care & Social Assistance 300 6.12 6.65 110 Transportation & Warehousing 71 6.12 7.09 28 Construction 181 6.02 5.24 62 Agriculture / Forestry / Fishing 82 5.73 5.15 31 Government (Public Administration) 647 5.44 6.26 140 4,189 1,299
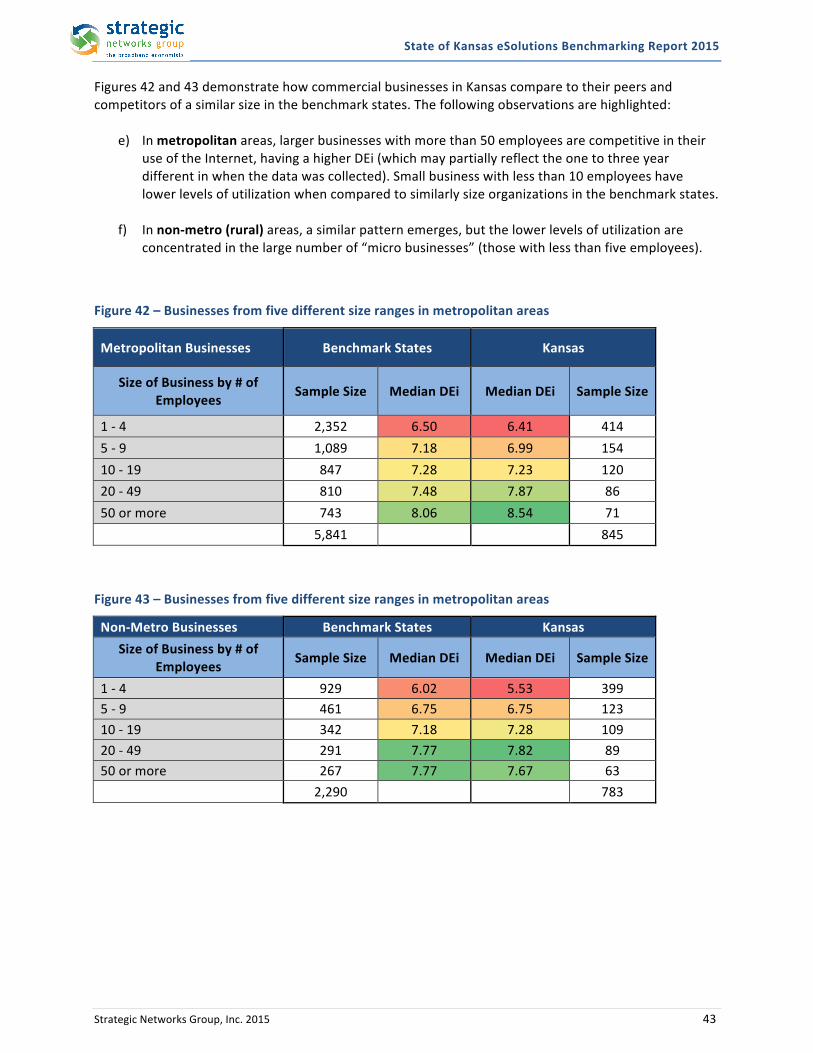
State of Kansas eSolutions Benchmarking Report 2015
Strategic Networks Group, Inc. 2015 43
Figures 42 and 43 demonstrate how commercial businesses in Kansas compare to their peers and competitors of a similar size in the benchmark states. The following observations are highlighted:
e) In metropolitan areas, larger businesses with more than 50 employees are competitive in their use of the Internet, having a higher DEi (which may partially reflect the one to three year different in when the data was collected). Small business with less than 10 employees have lower levels of utilization when compared to similarly size organizations in the benchmark states.
f) In non-‐metro (rural) areas, a similar pattern emerges, but the lower levels of utilization are
concentrated in the large number of “micro businesses” (those with less than five employees).
Figure 42 – Businesses from five different size ranges in metropolitan areas
Metropolitan Businesses Benchmark States Kansas
Size of Business by # of Employees Sample Size Median DEi Median DEi Sample Size
1 -‐ 4 2,352 6.50 6.41 414 5 -‐ 9 1,089 7.18 6.99 154 10 -‐ 19 847 7.28 7.23 120 20 -‐ 49 810 7.48 7.87 86 50 or more 743 8.06 8.54 71
5,841 845
Figure 43 – Businesses from five different size ranges in metropolitan areas
Non-‐Metro Businesses Benchmark States Kansas Size of Business by # of
Employees Sample Size Median DEi Median DEi Sample Size
1 -‐ 4 929 6.02 5.53 399 5 -‐ 9 461 6.75 6.75 123 10 -‐ 19 342 7.18 7.28 109 20 -‐ 49 291 7.77 7.82 89 50 or more 267 7.77 7.67 63 2,290 783

State of Kansas eSolutions Benchmarking Report 2015
Strategic Networks Group, Inc. 2015 44
Figures 44 and 45 demonstrate how households in Kansas compare to their peers in the benchmark states. The following observations are highlighted:
g) Households in Kansas generally have lower Internet utilization levels than households in the benchmark states.
h) When examining the age of the respondent, the largest difference in Internet utilization
between Kansas and the benchmark states is among respondents 65 years and older. This is already the group with the lowest level of Internet utilization among households.
i) Examining the impact of urbanization on household Internet utilization, on average, Kansas’s households in all but the most rural areas (isolated small towns) have lower utilization levels. The relatively good performance of Kansas’s households in the most rural areas is notable.
Figure 44 – Households by age
Benchmark States Kansas
Age of Household Respondent Sample Size Median DEi Median DEi Sample Size
18 to 34 years 1,231 6.99 6.70 198 35 to 54 years 3,547 6.79 6.79 614 55 to 64 years 1,885 6.09 5.96 418 65 years and over 940 5.45 5.16 213
Figure 45 – Households by level of urbanization
Benchmark States Kansas Urban -‐ Rural Location of Household Sample Size Median DEi Median DEi Sample Size
Urban 3,451 6.73 6.47 438 Micropolitan 1,691 6.54 6.22 411 Small Town 1,453 6.28 6.03 261 Isolated Small Town 1,029 6.03 6.09 335

State of Kansas eSolutions Benchmarking Report 2015
Strategic Networks Group, Inc. 2015 45

State of Kansas eSolutions Benchmarking Report 2015
Strategic Networks Group, Inc. 2015 46
Data Collection Methods and Results Appendix A -‐ The core methodology is founded on primary research via data collection through online surveys of businesses, non-‐commercial entities and households. The businesses, CAI and household surveys collect information directly from Internet users in the following categories: User Profile – information that characterize each respondent for purposes of statistical analysis based on user characteristics, e.g. organization size by employment, time of Internet use; or household age, income, education and location. Internet Utilization – the current and planned uses of the Internet across multiple categories relevant to how businesses, non-‐commercial entities and households may use the Internet. The primary type of Internet connection used is also identified for selected cross tabulations with other response data. Internet Benefits – information on how businesses, non-‐commercial entities and households assess the benefits of using the Internet. Barriers -‐ information on the importance of factors that prevent or inhibit businesses, non-‐commercial entities and households from taking full advantage of the Internet. The surveys are made available for online access through one of two means: • Individual businesses, non-‐commercial entities and households were invited to participate via direct
email invitations sent from a large, statewide contact list. • In addition, businesses, non-‐commercial entities and households were encouraged through a variety
of other communications channels to access a link to the survey through numerous websites including www.ncbroadband.gov.
The overall error margin for statistical analysis is +/-‐ 2.9% (with a 95% Confidence Interval).12 The sample error margin indicates the accuracy of the statistics derived in relation to how they represent the larger population. Using a 95% Confidence Interval, a statistic should fall within the error margin for 95% of any random samples of the population. The sample error margin is calculated based on the sample size, the population size, and the confidence interval. For 95% confidence interval and for populations much larger than the sample, the sampling error is 0.98 divided by the square root of N, where N is the sample size. For this report all population sizes are much larger than the sample sizes. The following is an example for interpretation of statistics provided in this report: • 61.9% of organizations use the Internet for selling goods or services online. • The sample size for organizations reporting Internet utilization is 745, providing a sample error
margin of +/-‐ 3.6% with a 95% confidence interval. This means that any similar sample of the population of organizations across the state will result in a statistic for selling goods or services one between 58.3% and 65.5% (61.9% +/-‐ 3.6%) 95% of the time. The statistic would fall outside this range 5% of the time for other random samples of the population. In
12 The error margin at 95% Confidence Interval is often referred to as +/-‐ X% accuracy, 19 times out of 20. Error margins increase for detailed analysis that uses subsets of the overall sample. Where applicable, sample sizes and sample error margins are indicated – example: N= 1,428 [2.6%].

State of Kansas eSolutions Benchmarking Report 2015
Strategic Networks Group, Inc. 2015 47
practical terms, the sampling error can be taken as the accuracy of the statistic as it applies to the entire population. Smaller sample sizes result in larger sampling errors. When comparing statistics between two independent samples, the sample errors for each sample must be considered to determine if the difference is significant. Where the higher end of a statistic (X% + error margin) for sample A is less than the lower end of the same statistic (Y% – error margin) for sample B, the difference can be considered statistically significant. Where the difference between statistics is within the sampling error margin ranges, then such differences may not be real or significant for other random samples of the same sizes. For simplicity of reporting the statistics are stated as given with sample sizes and sampling error margins provided for interpretation.

State of Kansas eSolutions Benchmarking Report 2015
Strategic Networks Group, Inc. 2015 48
Glossary Appendix B -‐ Kansas eSolutions Benchmarking Report: This report presents the results of survey-‐based research carried out for the State of Kansas. The surveys collected information from businesses and community anchor institutions (non-‐commercial entities) on the availability of broadband (high speed Internet access) and its uses, benefits, drivers and barriers. This largely descriptive report results provide insight into gaps and opportunities for increasing broadband utilization by businesses and non-‐commercial entities. Digital Economy Analysis Platform (DEAP): The DEAP has been developed as an online resource that provides clients with access to the data collection results and the ability to customize their analysis across a range of variables, including industry sector or geographic region. The DEAP is accessed online by authorized users. Users are presented with dashboards for businesses and for households. Each dashboard is organized around a series of pages focused on specific topics, e.g. Connectivity, Utilization, DEi, Impacts, etc. Within each page is a set of predefined reports that present a chart and/or table of processed results from the datasets. eSolutions: refers to the integration of Internet technologies with the internal computer-‐based systems and applications within or among organizations for a variety of operational processes. eSolutions encompass not only product delivery and payment transactions (e-‐commerce) but also all processes that may be facilitated by computer-‐mediated communications over the Internet. eProcess: uses of the Internet which include internal operational uses, such as supplier coordination, training and teleworking. eCommerce: uses of the Internet which include activities related to the sales, marketing and delivery of products and services; and, Kansas Digital Economy Index (DEi): The Digital Economy index (DEi) is part of the benchmarking process and provides reference points against which the performance of any individual or group can be compared. The DEi summarizes an organization’s or household’s utilization of 17 Internet applications and process. Based on the number of applications currently being used by a businesses or CAI, a composite score is calculated that summarizes how comprehensively each organization uses Internet-‐enabled eSolutions. The DEi can be used to compare organizations, regions, or industry sectors. Utilization refers to the third stage in the broadband development process. The first stage is providing a community, household or organization with access (availability) to the Internet. The second stage is adoption or the process whereby a person or organization starts to actually use the Internet. The third stage is utilization whereby a person or organization uses their Internet connection to create value. Many people and organizations have access and have adopted the Internet, but are relatively ineffective in how they use and derive benefits from the Internet. The field of analysis labeled “utilization” explores patterns of Internet use and how these patterns can be enhanced.


State of Kansas eStrategy Report
January 2015
Prepared for:

State of Kansas e-‐Strategy Report 2015
Strategic Networks Group. Inc. 2015 www.sngroup.com Page 2 of 32
Table of Contents
Summary and Recommendations .......................................................................... 4
1. Starting Points ............................................................................................... 11 1.1 Organization and Objectives of the Report .......................................................................... 11 1.2 What is Broadband? ............................................................................................................ 12 1.3 The Digital Economy index (DEi) .......................................................................................... 13
2. Broadband Utilization by Businesses .............................................................. 15 2.2 How Sectors Differ in Broadband Utilization ........................................................................ 17 2.3 What Contributes to the Different Levels of Utilization? ...................................................... 18 2.4 Identifying Priority Internet Applications ............................................................................. 20 2.5 The Adoption Process .......................................................................................................... 21 2.6 Barriers to Improved Utilization .......................................................................................... 22
3. Households .................................................................................................... 24 3.1 Differences in Household Utilization .................................................................................... 24 3.2 eSolutions with High Difference in Utilization Levels ........................................................... 26 3.3 The Impact of Lower Utilization on Households ................................................................... 27 3.4 Learning Preferences ........................................................................................................... 27
4. Summary and Next Steps ............................................................................... 29
Appendix 1: Glossary .......................................................................................... 30
State of Kansas e-‐Strategy Report 2015
Strategic Networks Group. Inc. 2015 www.sngroup.com Page 3 of 32
Table of Figures Figure 1: Top Industry Sectors In Kansas .................................................................................................... 16 Figure 2: Average Internet Utilization by Industry Sector .......................................................................... 16 Figure 3: Average Internet Utilization by Commercial and Non-‐Commercial Organizations ..................... 17 Figure 4: Business Internet Usage by Level of Urbanization ...................................................................... 18 Figure 5: Business Internet Usage by Region ............................................................................................. 18 Figure 6: Utilization (median DEi Score) by Business Size .......................................................................... 19 Figure 7: Impact of Location on Utilization, by Size of Organization .......................................................... 19 Figure 8: Difference in Utilization of Specific eSolutions by Size of Organization ...................................... 20 Figure 9: Planned Adoption of Specific eSolutions by Small Businesses .................................................... 21 Figure 10: Barriers to Adoption of eSolutions among Businesses with less than 50 Employees ............... 23 Figure 11: Household Utilization (DEi) by Age and Income ........................................................................ 24 Figure 12: Computer Skills by Age .............................................................................................................. 24 Figure 13: Household Utilization by Level of Urbanization ........................................................................ 25 Figure 14: Household Utilization by Region ............................................................................................... 25 Figure 11: Percentage of Houses Currently Using Internet for Productivity Uses ..................................... 27 Figure 12: Preferred Learning Methods for Seniors (65+) ......................................................................... 28

State of Kansas e-‐Strategy Report 2015
Strategic Networks Group. Inc. 2015 www.sngroup.com Page 4 of 32
Summary and Recommendations Many communities and counties across Kansas are dealing with economic dislocation and an aging population. Most rural areas face the additional challenge of the steady shift of population from rural to urban areas.1 In the face of these challenges, how can communities and businesses maximize their competitiveness, while improving their quality of life? One area with significant potential is broadband (see Section 1.2 for a definition), which can be leveraged into tangible benefits for communities, businesses, and households. This report and its companion document, Kansas eSolutions Benchmarking,2 demonstrate that businesses can become more productive, competitive, and reach into new markets. Households can access services more easily and often more cheaply. Governments can delivery services more cost effectively. The first step in benefiting from broadband is acquiring connectivity or access to the Internet. Once access is acquired, the second step is adoption, whereby households, businesses, and other organizations begin to use their high-‐speed Internet access on a regular basis. The third stage in broadband development is utilization of the Internet in increasingly productive ways that bring concrete benefits, such as jobs, new savings and revenues, and improved quality of life. This report focuses on utilization as the third stage of broadband development.
Utilizing Broadband This report shows that the ability to utilize or leverage broadband varies significantly across businesses, organizations, and households. Not all communities have been able to turn the potential of broadband into measurable success in terms of jobs, company attraction and retention, an increased tax base and more efficient and effective citizen services. Many businesses struggle in their efforts to use the Internet to generate increased revenues. Turning potential into reality requires skills, training, and both formal and informal support. In those industry sectors and communities that already have a large, diverse, and modern economy and work force, building broadband infrastructure may be sufficient to realize the potential of broadband. However, many industry sectors, communities, businesses, and households have limited Internet related skills and capacity. Benchmarking data shows that for these groups, leveraging broadband often lags,
1 See various publications of David McGranahan from the USDA: http://www.ers.usda.gov/ers-‐staff-‐directory/david-‐mcgranahan.aspx. 2 A summary of the findings from the 2015 benchmarking effort can be found in the Kansas eSolutions Benchmarking Report (January 2015) which is largely descriptive and does not include some of the analysis nor the recommendations in this report.

State of Kansas e-‐Strategy Report 2015
Strategic Networks Group. Inc. 2015 www.sngroup.com Page 5 of 32
even with state-‐of-‐the-‐art connectivity.3 The consequence is that these communities (and households and businesses) lose out on many of the benefits of broadband. More importantly, over time, these communities are at risk of becoming economically less competitive and generally less attractive to households and businesses. This report examines how businesses, organizations and households in Kansas differ in their utilization of broadband and where they can look to make improvements. The report shows in detail how different industry sectors and household types compare to each other, especially between and within regions. The report provides insights and data that allow communities, businesses, and households to assess where they stand and to identify what kinds of actions will improve their performance and benefits. The report includes recommendations for how the State of Kansas and its communities can improve utilization of broadband by its businesses and households, thereby improving their economies and quality of life. Recommendations are broken down into three areas:
1. Gaps and opportunities in use of the Internet and broadband; 2. Key barriers to improving the use and benefits of the Internet and broadband; and 3. The best ways to build skills and abilities.
Analysis and recommendations are identified for both businesses and households. A more detailed description of the impacts of Internet utilization on business revenues and employment can be found in the Kansas eSolutions Benchmarking Report (January 2015) which is a more complete and descriptive presentation of the assessment/survey results, unlike this document which is more strategic and prescriptive in focus.
3 This statement is supported by data from eSolutions Benchmarking efforts undertaken by Strategic Networks Groups (SNG) in non-‐metropolitan communities that have had broadband for an extended period of time. The statement is also supported by comments made by Internet Service Providers during rural broadband planning workshops facilitated by SNG.
This report uses data collected in December 2014 and January 2015 across Kansas. A total of 2,532 organizations and 1,449 households contributed to the broadband benchmarking effort. The organizations consisted of 1,755 commercial businesses, 409 government entities and 368
non-‐for profits.

State of Kansas e-‐Strategy Report 2015
Strategic Networks Group. Inc. 2015 www.sngroup.com Page 6 of 32
Recommendations To help stakeholders and communities better understand and use this report, the recommendations of the report have been structured around fundamental questions that leaders and decision-‐makers face in terms of leveraging broadband for the socio-‐economic benefit of their communities and constituents. 1. How important is high-‐speed Internet access to Kansas, its communities, and its residents? In the twenty-‐first century, broadband access has become an essential part of a community’s infrastructure, a business’ internal and external operations, and a household’s participation in their community life. Availability and meaningful use of high-‐speed Internet access are directly tied to a community’s viability, competitiveness, and quality of life. However, there are significant differences between communities in quality of Internet connectivity and their productive use of the Internet. Current Internet usage varies widely and is explored in the various sections of this report. Each county or community has its own unique characteristics, assets, and challenges. Consequently, each county or community requires strategies and initiatives that address its unique situation. Recommendation #1: Each county or community should develop its
own strategy and initiatives based on its own characteristics, values, and priorities. Priorities and targets should include infrastructure coverage and capabilities, as well as high levels of adoption of those eSolutions needed to remain competitive. While focus tends to revolve around attracting better availability and speed – spend time to drive utilization of what is available.
2. Is availability of high-‐speed Internet access still an issue for many areas of Kansas? While the vast majority of businesses and organizations report that they have Internet connectivity, much of the physical Internet infrastructure in non-‐metro areas consists of older technology that provides Internet speeds and capacity well below that of most metropolitan areas. The issue of poor or no Internet services also remains a critical issue in some rural residential areas. To remain competitive, communities need robust connectivity that also supports mobile devices. The use of mobile devices and applications for “untethered access” is expected to continue to grow and become increasingly integrated into how organizations use the Internet to enable additional opportunities for increasing work effectiveness and productivity. The availability of effective mobile
Over 13.5% of households would “definitely” relocate to another
community for broadband service if it was not available to them in their current location. Another 17.4% would consider relocation “very
likely.”
Broadband was also considered “essential” for selecting location by
33.6% of businesses and other organizations, as well as “essential” for remaining in location by 53.5%
of organizations. Benchmarking Data for Kansas,
January 2015.
State of Kansas e-‐Strategy Report 2015
Strategic Networks Group. Inc. 2015 www.sngroup.com Page 7 of 32
Internet access will become increasingly important as an adjunct to wired access for many organizations, especially those with mobile workers. Recommendation #2: Undertake efforts at the local level to identify areas without high-‐speed Internet
and to develop local solutions that address the problem. Local and regional initiatives should encourage mobile wireless Internet Service Providers and telecommunications companies to extend 4G and LTE capabilities to areas currently without such service.
3. Where are the major gaps or weaknesses in utilization of the Internet? Key gaps in Internet utilization are related to household income, age, and skill level, degree of “rurality,” and business size and industry sector. Prioritizing industry sectors and other economic groups must be done within a local or regional context. Local and county level planning will need to consider additional factors and considerations, such as industry sectors in decline or regional strategies for developing specific sectors. In general, focus should be on industry sectors that make the largest contribution to the economy and that have the greatest growth potential. Recommendation #3: Rather than undertaking broad but untargeted efforts, broadband
initiatives should focus on industries that have the highest economic contribution and highest growth potential within each region. One sector that should be given priority is the retail sector.
4. How do we use the potential of the Internet to maximize job creation? Small to medium sized organizations with 1 to 49 employees should be a focus for all regions. This segment is important for the following reasons:
• Includes 94.8% of all establishments in Kansas. • Experiences the weakest utilization levels compared to organizations with larger numbers of
employees. • Segment is a dynamic engine for employment growth, especially through use of the Internet. • It has the least internal capacity and expertise to adopt more sophisticated and productive
Internet applications. Recommendation #4: Focus on the small-‐medium enterprise segment, especially 1-‐19
employees, to increase Internet utilization, drive competitiveness, revenues, and job creation. Particular focus should be on businesses in non-‐metropolitan areas.
State of Kansas e-‐Strategy Report 2015
Strategic Networks Group. Inc. 2015 www.sngroup.com Page 8 of 32
5. In what areas do small to medium sized businesses need help? The Kansas eSolutions Benchmarking (eSB) process identifies which types of Internet enabled applications and processes are easiest or hardest to adopt, as evidenced in the tables in the latter part of Section 2. By using data on barriers to adoption, action plans can be defined at the regional level to address target groups. Recommendation #5: Initiatives aimed at increasing
utilization among the small to medium enterprise segment should focus on the following 8 utilization categories:
1. Delivery of services and content 2. Rich media or service creation 3. Teleworking 4. Selling goods or services 5. Accessing collaborative tools 6. Advertising and promotion 7. Staff training and skills development
8. Customer service and support 6. How can we reach households that use the Internet only minimally? Many households that use the Internet still do not use the Internet very productively. Low utilization households are very similar to non-‐adopting households. They are disproportionately older and lower income. Households with low Internet adoption represent an important group due to the social and economic benefits that can be accessed through the Internet. As governments and businesses move their services to the Internet to achieve better reach and cost efficiencies, it is increasingly important that citizens have the ability to access and benefit from these online services. However, large portions of lower income and older households have difficulty adopting and using the Internet, as described in Section 3. Given that low adoption and utilization are strongly tied to age and income, programming should be targeted at people over 64 and households with lower incomes. Recommendation #6: Develop training programs and resources that target households over the age of
64 or have below average incomes.
The poorer one is and the older one is, the less likely one uses
the Internet and the less productively one uses it.
eSolutions is the term used in this report to refer to the integration of
Internet technologies with the internal computer-‐based systems and applications within or among organizations for a variety of
operational processes. eSolutions encompass not only product delivery
and payment transactions (e-‐commerce) but also all processes
that may be facilitated by computer-‐mediated
communications over the Internet.

State of Kansas e-‐Strategy Report 2015
Strategic Networks Group. Inc. 2015 www.sngroup.com Page 9 of 32
7. Is it true that households in rural areas have a particularly hard time in adopting and using the Internet? In a word… Yes! While both urban and rural households may struggle to use and benefit from the Internet, information in Section 3 reveals that rural households are relatively disadvantaged, with households being generally older and having lower average incomes. Figure 11 shows that non-‐metropolitan areas have significantly lower utilization levels compared to metropolitan areas. Consequently, non-‐metropolitan households tend to have greater difficultly in accessing educational, health and government services, all of which are increasingly available online. Figures 4, 5, and 7 shows that businesses in non-‐metropolitan areas also have lower levels of Internet utilization when compared to metropolitan areas. Recommendation #7: Non-‐metropolitan areas should be a priority for Internet training initiatives. 8. How can we help citizens of Kansas make better use of the Internet? Rather than trying to entice target populations into traditional training programs, such as classroom courses, eSolution adoption initiatives should reflect the preference for both self-‐directed online resources, as well as existing informal networks that already have participation by these target groups. These can include seniors’ centers, libraries, churches and community centers. Recommendation #8: In designing initiatives to increase and
improve Internet utilization by households and organizations, considerable weight should be given to those learning methods that are preferred by the target populations.
9. The importance of developing leadership for broadband initiatives. The strategic framework presented in this document relies on communities and regional entities to provide initiative in addressing the digital divide in their area. In non-‐metropolitan areas, lack of capacity and leadership has the potential to limit the effectiveness of a community-‐based approach. Consequently, a strategic objective for adequate broadband service is the development of motivated leadership and institutional capacity for broadband initiatives. “Local champions” are a critical component for the success of broadband initiatives. It is increasingly rare for local government leaders to be unaware or uninterested in the desirability of having good
The preferred learning methods of those over 64 in Kansas are “talking to others” (56%) and “online information” (49%). The least preferred learning method was “classrooms courses”
(preferred by 21%).
State of Kansas e-‐Strategy Report 2015
Strategic Networks Group. Inc. 2015 www.sngroup.com Page 10 of 32
Internet access throughout their jurisdiction. However, interest and awareness has frequently not translated into action in communities where financial resources are constrained, technical knowledge is missing, and leadership is in short supply. Recommendation #9: Communities and counties should facilitate broadband leadership. Important
elements of leadership and capacity development at the community level include: • Recruitment of individuals with the interest, energy, and time needed to
provide leadership. • Empowerment of leaders by providing official sanction and support from
elected officials and key community organizations. • A mechanism for accountability for leaders to ensure they receive the support
needed from participating organizations. • Educational and learning opportunities for leadership so they can acquire the
knowledge and skills for developing goals, actions and tasks related to the digital divide in their area.
• Institutional support from organizations with the capacity for organizing meetings, ensuring effective communications, and providing logistical support.
Checklist for Developing Community Leadership Individual leadership
• Community leaders and elected officials understanding benefits and impacts of broadband • At least three committed leaders • Leaders that have the influence to enlist community support • Leaders committed to obtaining the resources for implementation.
Organizational leadership and capacity
• One or more lead organizations have been identified • The lead organization(s) are willing to develop partnerships for implementation and operation • Personnel within lead organization are identified and available to provide leadership and support.
Shared Vision
• Leadership (individual and organizational) has a shared vision of the broadband initiative Community support:
• Benefits of broadband are understood and supported by local businesses and key organizations • There has been community engagement on the benefits of broadband and in the level of support
for a broadband initiative.

State of Kansas e-‐Strategy Report 2015
Strategic Networks Group. Inc. 2015 www.sngroup.com Page 11 of 32
1. Starting Points
1.1 Organization and Objectives of the Report This report is designed to be a catalyst for leveraging broadband through actionable intelligence. The chart below outlines the steps used in this report to move from descriptive data to detailed information on targets, priorities, and strategies. The goal of the regional analysis of broadband in Kansas is to:
1. Identify which segments of the economy utilize the Internet to a greater or lesser degree. 2. Prioritize the segments that show utilization gaps based on importance to the economy and
opportunity to address the gaps. 3. Identify specific uses of the Internet that should be addressed to close the gaps, resulting in
effective actions that are targeted where they will have the most impact. 4. Identify the barriers to improved Internet utilization, as well as the best means to overcome
them.
Leveraging Broadband for Economic and Social Development
Comparison of Utilization in Kansas
Understanding Utilization by Businesses and Households Characteristics
Identify Gaps and Opportunities; prioritize industry sectors
For priority industries and households, identify specific gaps and opportunities
Identify barriers and learning preferences specific to those industries and households
Kansas e-‐Strategy: A Foundation for Broadband Initiatives
Increasing focus on priority issues and effective action plans for greatest impact
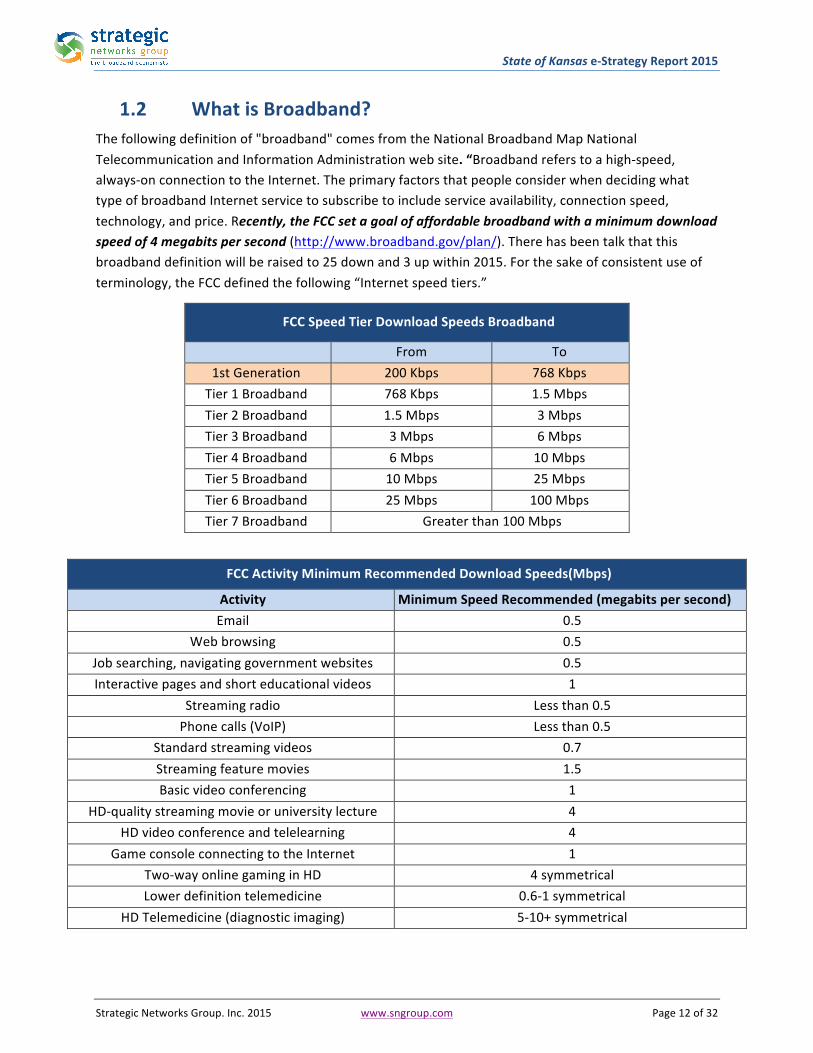
State of Kansas e-‐Strategy Report 2015
Strategic Networks Group. Inc. 2015 www.sngroup.com Page 12 of 32
1.2 What is Broadband? The following definition of "broadband" comes from the National Broadband Map National Telecommunication and Information Administration web site. “Broadband refers to a high-‐speed, always-‐on connection to the Internet. The primary factors that people consider when deciding what type of broadband Internet service to subscribe to include service availability, connection speed, technology, and price. Recently, the FCC set a goal of affordable broadband with a minimum download speed of 4 megabits per second (http://www.broadband.gov/plan/). There has been talk that this broadband definition will be raised to 25 down and 3 up within 2015. For the sake of consistent use of terminology, the FCC defined the following “Internet speed tiers.”
FCC Speed Tier Download Speeds Broadband
From To 1st Generation 200 Kbps 768 Kbps Tier 1 Broadband 768 Kbps 1.5 Mbps Tier 2 Broadband 1.5 Mbps 3 Mbps Tier 3 Broadband 3 Mbps 6 Mbps Tier 4 Broadband 6 Mbps 10 Mbps Tier 5 Broadband 10 Mbps 25 Mbps Tier 6 Broadband 25 Mbps 100 Mbps Tier 7 Broadband Greater than 100 Mbps
FCC Activity Minimum Recommended Download Speeds(Mbps)
Activity Minimum Speed Recommended (megabits per second) Email 0.5
Web browsing 0.5 Job searching, navigating government websites 0.5 Interactive pages and short educational videos 1
Streaming radio Less than 0.5 Phone calls (VoIP) Less than 0.5
Standard streaming videos 0.7 Streaming feature movies 1.5 Basic video conferencing 1
HD-‐quality streaming movie or university lecture 4 HD video conference and telelearning 4
Game console connecting to the Internet 1 Two-‐way online gaming in HD 4 symmetrical Lower definition telemedicine 0.6-‐1 symmetrical
HD Telemedicine (diagnostic imaging) 5-‐10+ symmetrical

State of Kansas e-‐Strategy Report 2015
Strategic Networks Group. Inc. 2015 www.sngroup.com Page 13 of 32
1.3 The Digital Economy index (DEi) This report includes comparisons of Internet use between regions by various characteristics, such as industry, business size, and household demographics. To assist in the process of making comparisons, a mechanism was developed for establishing benchmarks. Benchmarks are useful in creating reference points against which the performance of any individual or group can be compared. Strategic Networks Group has developed a benchmarking process based on its Digital Economy index (DEi). The Digital Economy index (DEi) reflects an organization’s or household’s utilization of a range of Internet applications and process: 17 for organizations and 30 for households. These applications and processes (eSolutions) are listed below. Based on the number of applications currently being used by an organization or household, a composite score is calculated that summarizes how comprehensively each organization or household uses Internet-‐enabled eSolutions. The DEi can be used to compare organizations, regions, or industry sectors. A separate DEi is used to compare how different types of households use the Internet.
An organization’s or household’s DEi score (from 0 to 10) captures their utilization of eSolutions, with 10 being the highest possible use. DEi scores are averaged across groups of users by various categories: e.g., a sector’s DEi is the average for all organizations in that sector. The DEi is used as a basis for comparison of utilization levels across various dimensions. Identifying differences in DEi assists in focusing on areas where a deeper assessment is warranted. In areas where DEi is lower than average, indicating lower utilization, there is an opportunity to increase utilization and benefits. The Color Coding for DEi Scores: To better show how industry sectors perform, the DEi tables in this report are color coded from the highest (green) to lowest (red) to highlight how DEi scores compare. The color-‐coding (green to red) allows one to quickly compare groups based on how utilization varies. DEi comparisons can be useful for different purposes, for example:
• Broadband planners and economic development agencies can compare DEi benchmarks between different types of organizations, e.g., industry sectors or size of businesses. This can provide insights into which businesses have low utilization and could benefit from “catching up” to their peers. They can also compare DEi benchmarks on a regional basis to prioritize geographic areas.
Highest 2 3 4 5 6
Lowest Insufficient Data
DEi Meter from dashboard of the Digital Economy Analytics Platform reflecting businesses in Kansas.
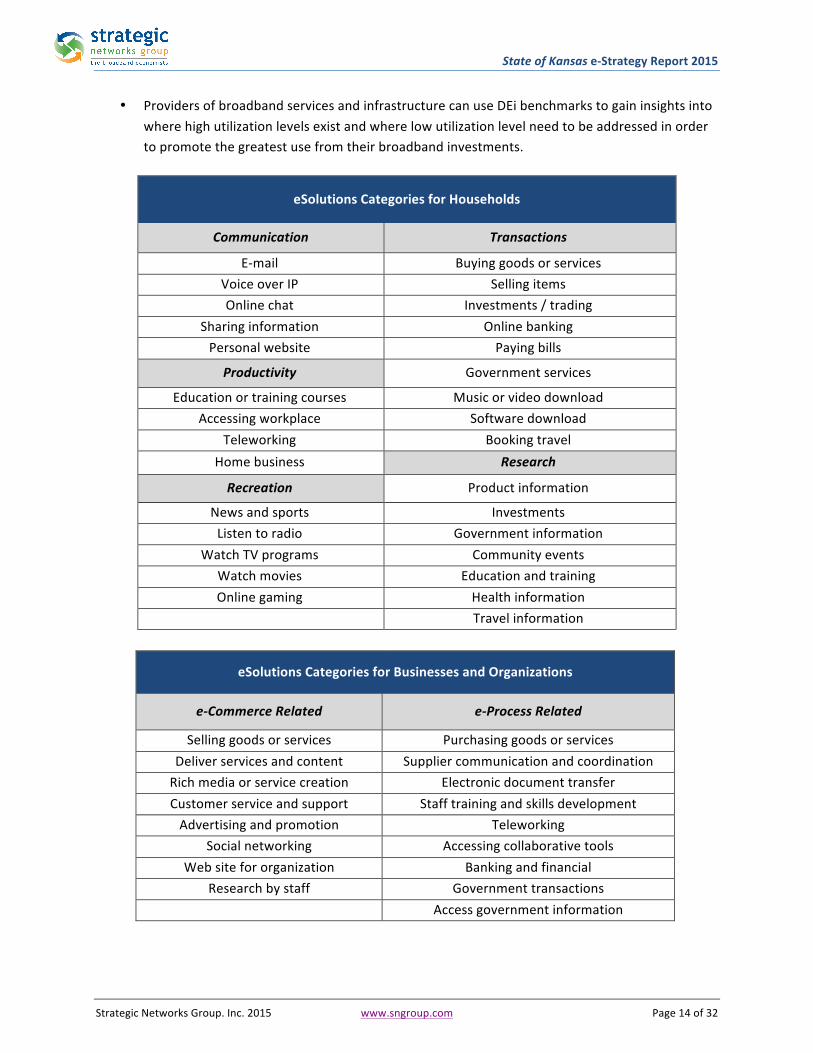
State of Kansas e-‐Strategy Report 2015
Strategic Networks Group. Inc. 2015 www.sngroup.com Page 14 of 32
• Providers of broadband services and infrastructure can use DEi benchmarks to gain insights into where high utilization levels exist and where low utilization level need to be addressed in order to promote the greatest use from their broadband investments.
eSolutions Categories for Households
Communication Transactions
E-‐mail Buying goods or services Voice over IP Selling items Online chat Investments / trading
Sharing information Online banking Personal website Paying bills
Productivity Government services
Education or training courses Music or video download Accessing workplace Software download
Teleworking Booking travel Home business Research
Recreation Product information
News and sports Investments Listen to radio Government information
Watch TV programs Community events Watch movies Education and training Online gaming Health information
Travel information
eSolutions Categories for Businesses and Organizations
e-‐Commerce Related e-‐Process Related
Selling goods or services Purchasing goods or services Deliver services and content Supplier communication and coordination Rich media or service creation Electronic document transfer Customer service and support Staff training and skills development Advertising and promotion Teleworking
Social networking Accessing collaborative tools Web site for organization Banking and financial
Research by staff Government transactions Access government information
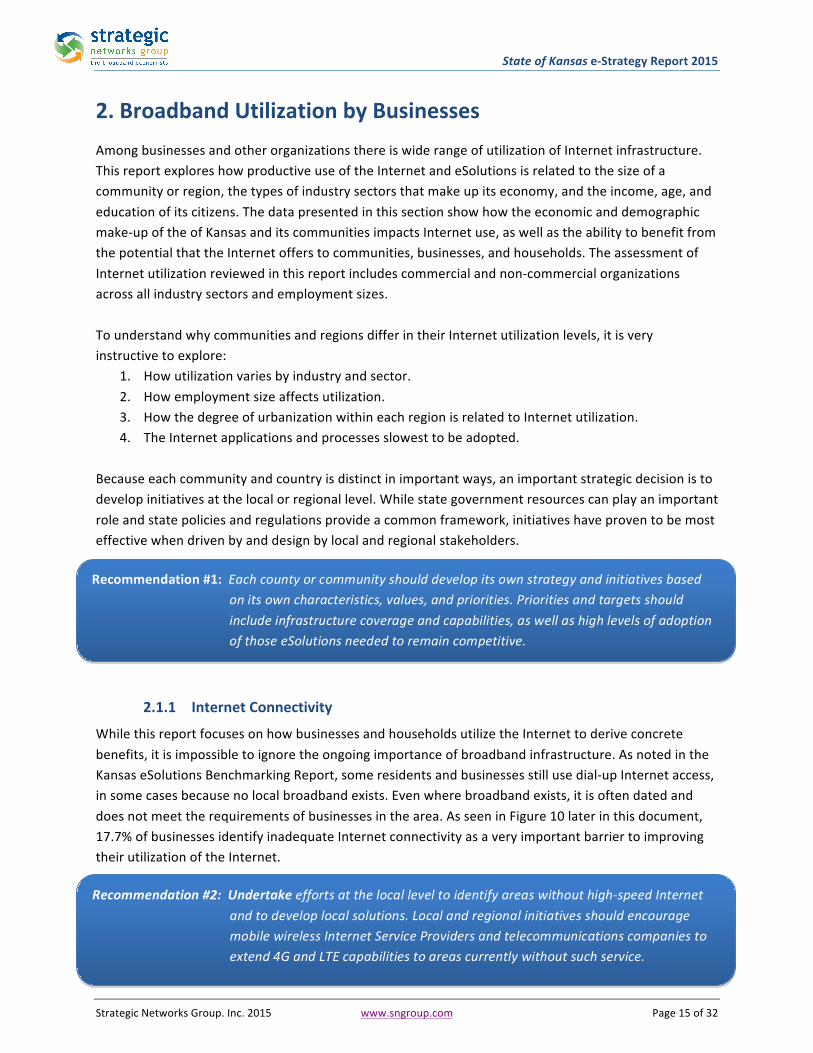
State of Kansas e-‐Strategy Report 2015
Strategic Networks Group. Inc. 2015 www.sngroup.com Page 15 of 32
Recommendation #1: Each county or community should develop its own strategy and initiatives based on its own characteristics, values, and priorities. Priorities and targets should include infrastructure coverage and capabilities, as well as high levels of adoption of those eSolutions needed to remain competitive.
Recommendation #2: Undertake efforts at the local level to identify areas without high-‐speed Internet and to develop local solutions. Local and regional initiatives should encourage mobile wireless Internet Service Providers and telecommunications companies to extend 4G and LTE capabilities to areas currently without such service.
2. Broadband Utilization by Businesses Among businesses and other organizations there is wide range of utilization of Internet infrastructure. This report explores how productive use of the Internet and eSolutions is related to the size of a community or region, the types of industry sectors that make up its economy, and the income, age, and education of its citizens. The data presented in this section show how the economic and demographic make-‐up of the of Kansas and its communities impacts Internet use, as well as the ability to benefit from the potential that the Internet offers to communities, businesses, and households. The assessment of Internet utilization reviewed in this report includes commercial and non-‐commercial organizations across all industry sectors and employment sizes. To understand why communities and regions differ in their Internet utilization levels, it is very instructive to explore:
1. How utilization varies by industry and sector. 2. How employment size affects utilization. 3. How the degree of urbanization within each region is related to Internet utilization. 4. The Internet applications and processes slowest to be adopted.
Because each community and country is distinct in important ways, an important strategic decision is to develop initiatives at the local or regional level. While state government resources can play an important role and state policies and regulations provide a common framework, initiatives have proven to be most effective when driven by and design by local and regional stakeholders.
2.1.1 Internet Connectivity
While this report focuses on how businesses and households utilize the Internet to derive concrete benefits, it is impossible to ignore the ongoing importance of broadband infrastructure. As noted in the Kansas eSolutions Benchmarking Report, some residents and businesses still use dial-‐up Internet access, in some cases because no local broadband exists. Even where broadband exists, it is often dated and does not meet the requirements of businesses in the area. As seen in Figure 10 later in this document, 17.7% of businesses identify inadequate Internet connectivity as a very important barrier to improving their utilization of the Internet.
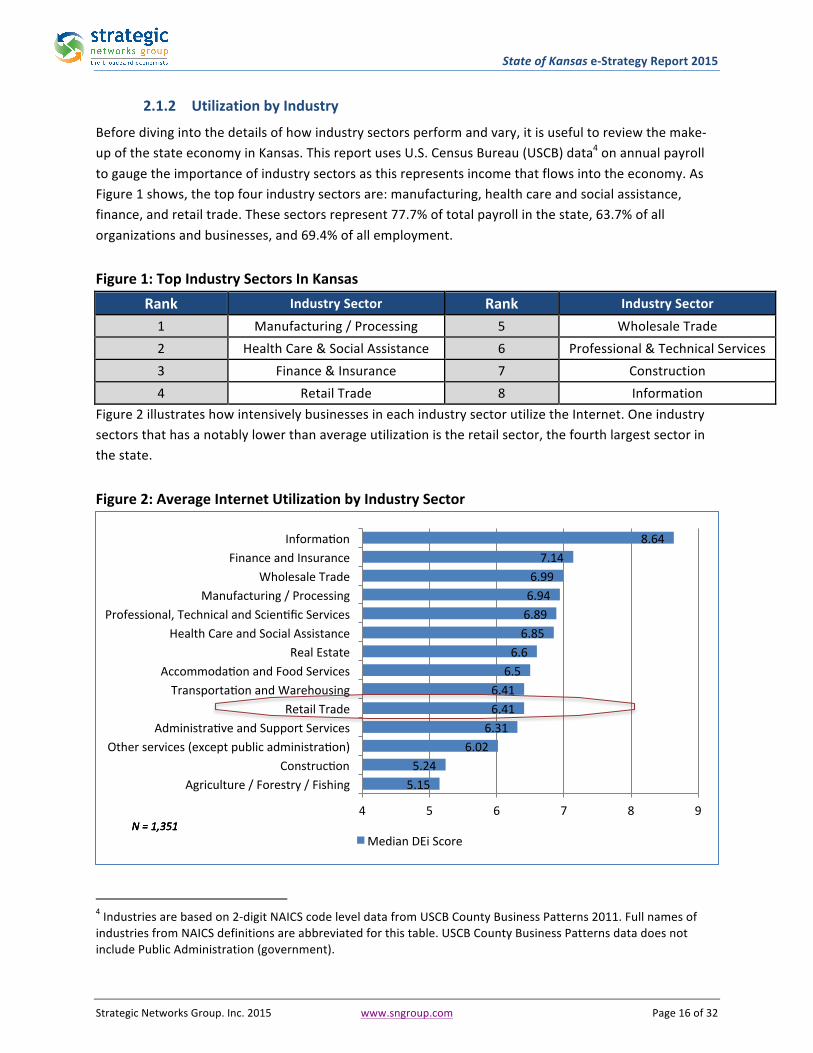
State of Kansas e-‐Strategy Report 2015
Strategic Networks Group. Inc. 2015 www.sngroup.com Page 16 of 32
2.1.2 Utilization by Industry
Before diving into the details of how industry sectors perform and vary, it is useful to review the make-‐up of the state economy in Kansas. This report uses U.S. Census Bureau (USCB) data4 on annual payroll to gauge the importance of industry sectors as this represents income that flows into the economy. As Figure 1 shows, the top four industry sectors are: manufacturing, health care and social assistance, finance, and retail trade. These sectors represent 77.7% of total payroll in the state, 63.7% of all organizations and businesses, and 69.4% of all employment. Figure 1: Top Industry Sectors In Kansas
Rank Industry Sector Rank Industry Sector 1 Manufacturing / Processing 5 Wholesale Trade 2 Health Care & Social Assistance 6 Professional & Technical Services 3 Finance & Insurance 7 Construction 4 Retail Trade 8 Information
Figure 2 illustrates how intensively businesses in each industry sector utilize the Internet. One industry sectors that has a notably lower than average utilization is the retail sector, the fourth largest sector in the state. Figure 2: Average Internet Utilization by Industry Sector
4 Industries are based on 2-‐digit NAICS code level data from USCB County Business Patterns 2011. Full names of industries from NAICS definitions are abbreviated for this table. USCB County Business Patterns data does not include Public Administration (government).
5.15 5.24
6.02 6.31 6.41 6.41 6.5 6.6 6.85 6.89 6.94 6.99 7.14
8.64
4 5 6 7 8 9
Agriculture / Forestry / Fishing Construcoon
Other services (except public administraoon) Administraove and Support Services
Retail Trade Transportaoon and Warehousing
Accommodaoon and Food Services Real Estate
Health Care and Social Assistance Professional, Technical and Scienofic Services
Manufacturing / Processing Wholesale Trade
Finance and Insurance Informaoon
Median DEi Score N = 1,351 N = 1,351 N = 1,351
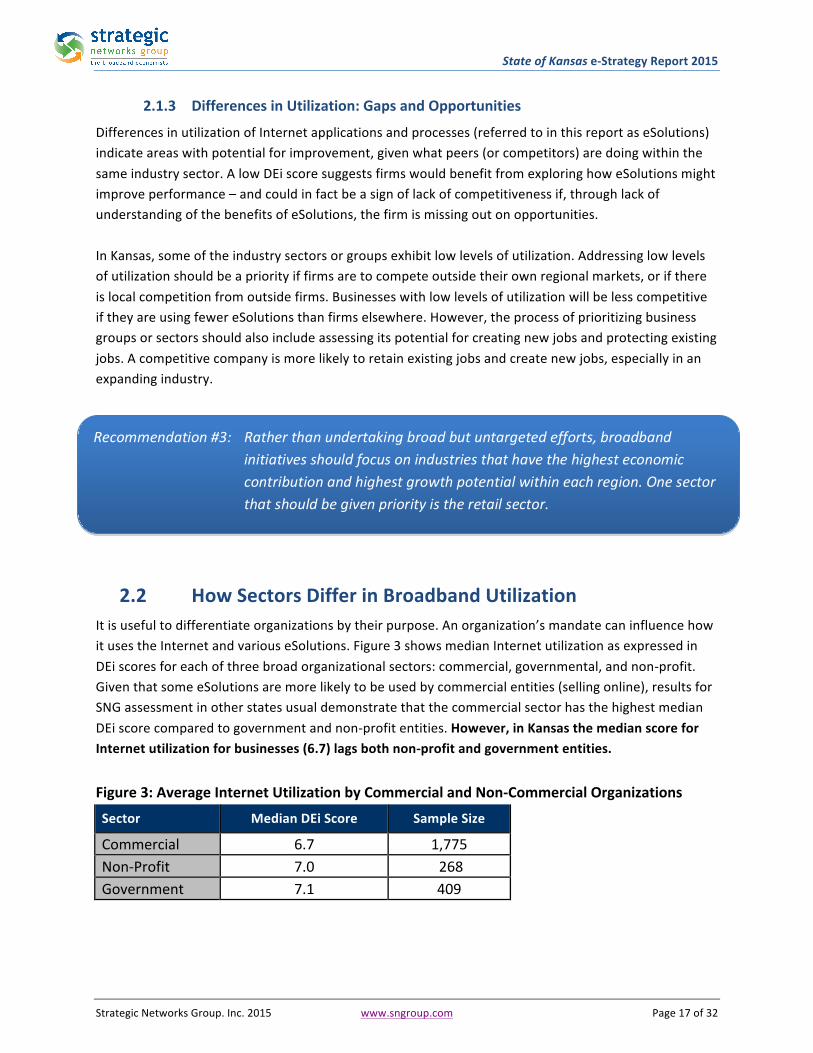
State of Kansas e-‐Strategy Report 2015
Strategic Networks Group. Inc. 2015 www.sngroup.com Page 17 of 32
Recommendation #3: Rather than undertaking broad but untargeted efforts, broadband initiatives should focus on industries that have the highest economic contribution and highest growth potential within each region. One sector that should be given priority is the retail sector.
2.1.3 Differences in Utilization: Gaps and Opportunities
Differences in utilization of Internet applications and processes (referred to in this report as eSolutions) indicate areas with potential for improvement, given what peers (or competitors) are doing within the same industry sector. A low DEi score suggests firms would benefit from exploring how eSolutions might improve performance – and could in fact be a sign of lack of competitiveness if, through lack of understanding of the benefits of eSolutions, the firm is missing out on opportunities. In Kansas, some of the industry sectors or groups exhibit low levels of utilization. Addressing low levels of utilization should be a priority if firms are to compete outside their own regional markets, or if there is local competition from outside firms. Businesses with low levels of utilization will be less competitive if they are using fewer eSolutions than firms elsewhere. However, the process of prioritizing business groups or sectors should also include assessing its potential for creating new jobs and protecting existing jobs. A competitive company is more likely to retain existing jobs and create new jobs, especially in an expanding industry.
2.2 How Sectors Differ in Broadband Utilization It is useful to differentiate organizations by their purpose. An organization’s mandate can influence how it uses the Internet and various eSolutions. Figure 3 shows median Internet utilization as expressed in DEi scores for each of three broad organizational sectors: commercial, governmental, and non-‐profit. Given that some eSolutions are more likely to be used by commercial entities (selling online), results for SNG assessment in other states usual demonstrate that the commercial sector has the highest median DEi score compared to government and non-‐profit entities. However, in Kansas the median score for Internet utilization for businesses (6.7) lags both non-‐profit and government entities. Figure 3: Average Internet Utilization by Commercial and Non-‐Commercial Organizations
Sector Median DEi Score Sample Size
Commercial 6.7 1,775 Non-‐Profit 7.0 268 Government 7.1 409

State of Kansas e-‐Strategy Report 2015
Strategic Networks Group. Inc. 2015 www.sngroup.com Page 18 of 32
2.3 What Contributes to the Different Levels of Utilization? A number of factors help to explain differences in utilization between businesses and between regions. Location of a business in a non-‐metropolitan area is one such factor. Businesses outside of a metropolitan area do not benefit from a dense network of supports and skilled labor pools. Consequently, as Figures 4 and 5 show, businesses located outside of a metropolitan area5 or in a less densely populated region experience a distinct disadvantage, with lower levels of utilization of eSolutions. Knowing which geography areas are likely to have the lower utilization allows governments and industry organization to target their broadband initiatives. Figure 4: Business Internet Usage by Level of Urbanization
Business DEi Score
Metropolitan 7.0 Micropolitan 6.7 Small Town 6.3
Isolated Small Town 5.9 Figure 5: Business Internet Usage by Region
Region Median DEi # of Businesses
North East 7.0 746 North Central 6.6 167 South West 6.6 110 North West 6.5 122 South Central 6.5 359 South East 6.4 251
Figure 6 highlights a second important factor, business size. Utilization tends to increase as businesses increase in size. This tendency is most pronounced at the two ends of the spectrum – for very small firms with less than 20 employees, and for large firms with over 100 employees. This pattern of lower utilization by smaller firms appears related to the greater resources available to larger entities. The importance of organizational size as a factor in eSolutions utilization is highlighted by the fact that organizations with 1 to 19 employees make up 86 percent of organizations in Kansas. Lower utilization among this major segment provides a strong argument for making this segment a focus for promoting broadband utilization. Using data from the 2011 U.S. Census, the following table demonstrates the importance of smaller organizations to the regional and state economies. 5 A metropolitan area is defined by the Census Bureau as having a core urban area of over 50,000 with a population density greater than 1,000 people per square mile. A Micropolitan area has a population of 10,000 to 49,999. A small town has a population of 2,500 to 9,999. The category of “isolated small town” includes the remainder.

State of Kansas e-‐Strategy Report 2015
Strategic Networks Group. Inc. 2015 www.sngroup.com Page 19 of 32
Recommendation #4: Focus on the small-‐medium enterprise segment, especially 1-‐19 employees, to increase Internet utilization, drive competitiveness, revenues, and job creation. Particular focus should be on businesses in non-‐metropolitan areas.
Figure 6: Utilization (median DEi Score) by Business Size
1 to 19 employees 20 to 49 50 to 99 100 +
Median Dei Score 6.5 7.8 7.3 8.6 % of all Organizations in Kansas 86% 8.8% 2.9% 2.3% The small to medium enterprise (SME) segment is a significant component of statewide and regional economies and tends to be a primary source of new job growth. This segment has the significant opportunity to increase utilization levels for productivity and competitiveness. In general, larger businesses have had access to information and communications technology (ICT) for much longer periods and have the internal resources to take advantage of these technologies, resulting in higher utilization. As such, larger organizations already have high utilization levels and are less likely to be influenced by external broadband adoption and utilization initiatives. Taking the two factors of business size and geographic location, it becomes evident that non-‐smaller metropolitan businesses are at a distinct disadvantage in their efforts to use the Internet as part of their business. Figure 7 graphically demonstrates the impact of size and location on Internet utilization. Figure 7: Impact of Location on Utilization, by Size of Organization
5.53
6.75 7.28
7.81 7.28
8.11
6.41 6.99 7.23
7.86 7.67
9.22
4
5
6
7
8
9
10
1 -‐ 4 employees 5 -‐ 9 10 -‐ 19 20 -‐ 49 50 -‐ 99 100 or more
Med
ian DE
i Score
Uelizaeon Levels by # of Employees and Urbanizaeon
Non-‐Metro Metropolitan N = 1,628

State of Kansas e-‐Strategy Report 2015
Strategic Networks Group. Inc. 2015 www.sngroup.com Page 20 of 32
2.4 Identifying Priority Internet Applications Some processes and applications are easier to adopt than others, such as electronic document transfer, staff research, and accessing government information. Adoption levels of these utilizations are high and there is not much difference between sophisticated and less sophisticated users. While some types of utilization may be less appropriate for small businesses, it is instructive to observe where differences exist in utilization between small and large businesses. The higher utilization levels of larger businesses can provide motivation and potential targets for smaller businesses to achieve. Figure 8 shows utilization levels of different eSolutions for different sizes of businesses: 1-‐19 employees, 20 to 99 employees, and 100 or more employees. In every case, smaller businesses have lower utilization of eSolutions than larger businesses. Figure 8: Difference in Utilization of Specific eSolutions by Size of Organization
Currently Used Applications and Processes 0 to 19 20 to 99 100 + Level of
Variance*
Electronic document transfer 83.8% 91.7% 98.1% 14.3% Research by staff 82.4% 90.8% 96.3% 13.9%
Supplier coordination 76.3% 86.4% 96.3% 20.0% Accessing collaborative tools 55.8% 74.6% 94.4% 38.6% Web site for organization 75.2% 90.8% 92.6% 17.4%
Access government information 80.2% 85.5% 90.7% 10.5% Staff training and skills 59.7% 77.2% 88.9% 29.2%
Purchasing goods or services 78.7% 85.5% 85.2% 6.5% Customer service and support 66.0% 70.2% 85.2% 19.2%
Social networking 67.3% 74.1% 79.6% 12.3% Teleworking 40.0% 63.2% 77.8% 37.8%
Government transactions 70.1% 75.0% 75.9% 5.8% Banking and financial 73.7% 77.2% 74.1% 0.4%
Rich media or service creation 37.2% 53.5% 72.2% 35.0% Advertising and promotion 57.6% 73.2% 72.2% 14.6% Selling goods or services 51.7% 51.8% 66.7% 15.0%
Deliver services and content 33.4% 43.0% 63.0% 29.6% *Variance is calculated as the difference between small firms (0-‐19 employees) compared to firms with 100+
employees.
It is very instructive to note where the differences are greatest, for these represent areas where small businesses could potentially make the greatest gains. As the table above shows, these areas include: accessing collaborative tools; teleworking; rich media (video) or service creation; delivering services and content online; and staff training.
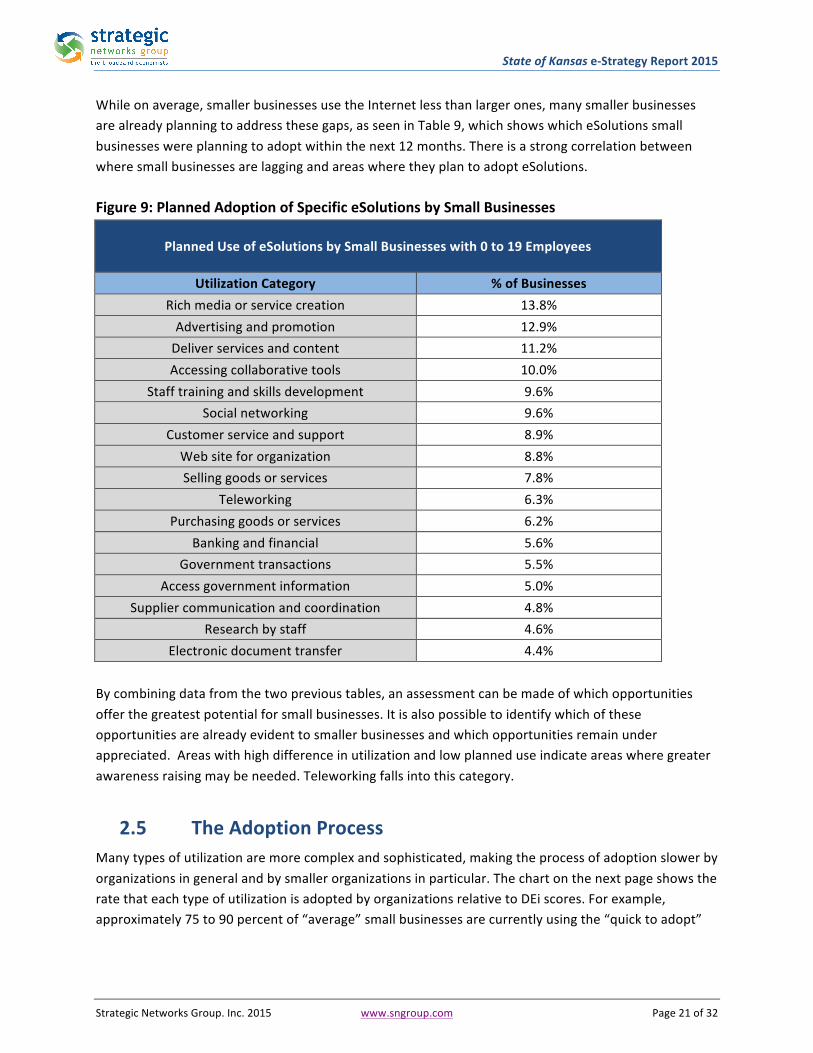
State of Kansas e-‐Strategy Report 2015
Strategic Networks Group. Inc. 2015 www.sngroup.com Page 21 of 32
While on average, smaller businesses use the Internet less than larger ones, many smaller businesses are already planning to address these gaps, as seen in Table 9, which shows which eSolutions small businesses were planning to adopt within the next 12 months. There is a strong correlation between where small businesses are lagging and areas where they plan to adopt eSolutions. Figure 9: Planned Adoption of Specific eSolutions by Small Businesses
Planned Use of eSolutions by Small Businesses with 0 to 19 Employees
Utilization Category % of Businesses Rich media or service creation 13.8% Advertising and promotion 12.9% Deliver services and content 11.2% Accessing collaborative tools 10.0%
Staff training and skills development 9.6% Social networking 9.6%
Customer service and support 8.9% Web site for organization 8.8% Selling goods or services 7.8%
Teleworking 6.3% Purchasing goods or services 6.2%
Banking and financial 5.6% Government transactions 5.5%
Access government information 5.0% Supplier communication and coordination 4.8%
Research by staff 4.6% Electronic document transfer 4.4%
By combining data from the two previous tables, an assessment can be made of which opportunities offer the greatest potential for small businesses. It is also possible to identify which of these opportunities are already evident to smaller businesses and which opportunities remain under appreciated. Areas with high difference in utilization and low planned use indicate areas where greater awareness raising may be needed. Teleworking falls into this category.
2.5 The Adoption Process Many types of utilization are more complex and sophisticated, making the process of adoption slower by organizations in general and by smaller organizations in particular. The chart on the next page shows the rate that each type of utilization is adopted by organizations relative to DEi scores. For example, approximately 75 to 90 percent of “average” small businesses are currently using the “quick to adopt”
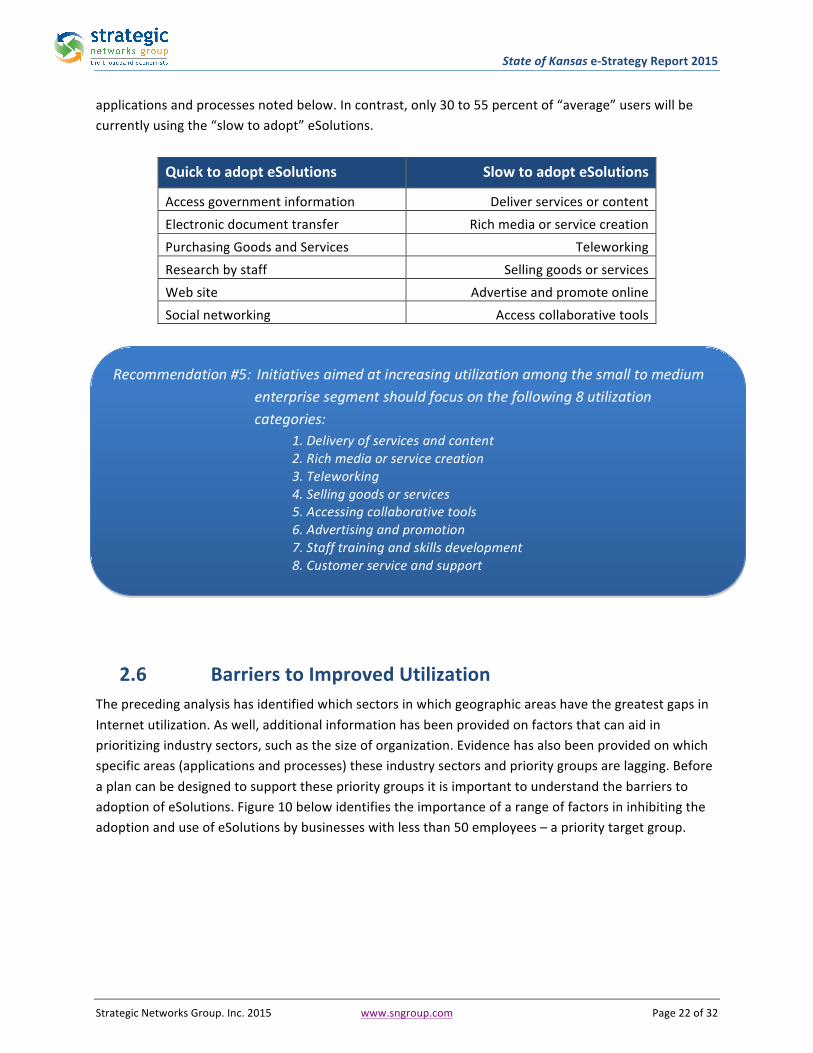
State of Kansas e-‐Strategy Report 2015
Strategic Networks Group. Inc. 2015 www.sngroup.com Page 22 of 32
applications and processes noted below. In contrast, only 30 to 55 percent of “average” users will be currently using the “slow to adopt” eSolutions.
Quick to adopt eSolutions Slow to adopt eSolutions
Access government information Deliver services or content Electronic document transfer Rich media or service creation Purchasing Goods and Services Teleworking Research by staff Selling goods or services Web site Advertise and promote online Social networking Access collaborative tools
2.6 Barriers to Improved Utilization The preceding analysis has identified which sectors in which geographic areas have the greatest gaps in Internet utilization. As well, additional information has been provided on factors that can aid in prioritizing industry sectors, such as the size of organization. Evidence has also been provided on which specific areas (applications and processes) these industry sectors and priority groups are lagging. Before a plan can be designed to support these priority groups it is important to understand the barriers to adoption of eSolutions. Figure 10 below identifies the importance of a range of factors in inhibiting the adoption and use of eSolutions by businesses with less than 50 employees – a priority target group.
Recommendation #5: Initiatives aimed at increasing utilization among the small to medium enterprise segment should focus on the following 8 utilization categories:
1. Delivery of services and content 2. Rich media or service creation 3. Teleworking 4. Selling goods or services 5. Accessing collaborative tools 6. Advertising and promotion 7. Staff training and skills development 8. Customer service and support 8.
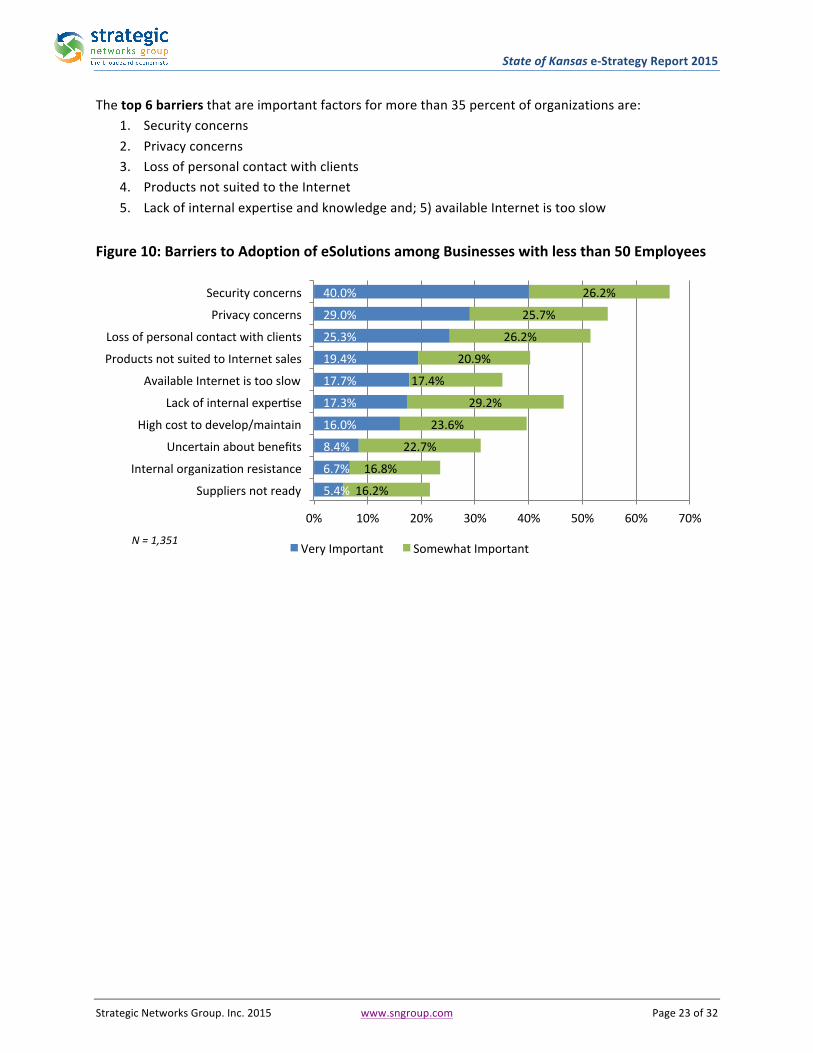
State of Kansas e-‐Strategy Report 2015
Strategic Networks Group. Inc. 2015 www.sngroup.com Page 23 of 32
The top 6 barriers that are important factors for more than 35 percent of organizations are: 1. Security concerns 2. Privacy concerns 3. Loss of personal contact with clients 4. Products not suited to the Internet 5. Lack of internal expertise and knowledge and; 5) available Internet is too slow
Figure 10: Barriers to Adoption of eSolutions among Businesses with less than 50 Employees
5.4%
6.7%
8.4%
16.0%
17.3%
17.7%
19.4%
25.3%
29.0%
40.0%
16.2%
16.8%
22.7%
23.6%
29.2%
17.4%
20.9%
26.2%
25.7%
26.2%
0% 10% 20% 30% 40% 50% 60% 70%
Suppliers not ready
Internal organizaoon resistance
Uncertain about benefits
High cost to develop/maintain
Lack of internal experose
Available Internet is too slow
Products not suited to Internet sales
Loss of personal contact with clients
Privacy concerns
Security concerns
Very Important Somewhat Important N = 1,351
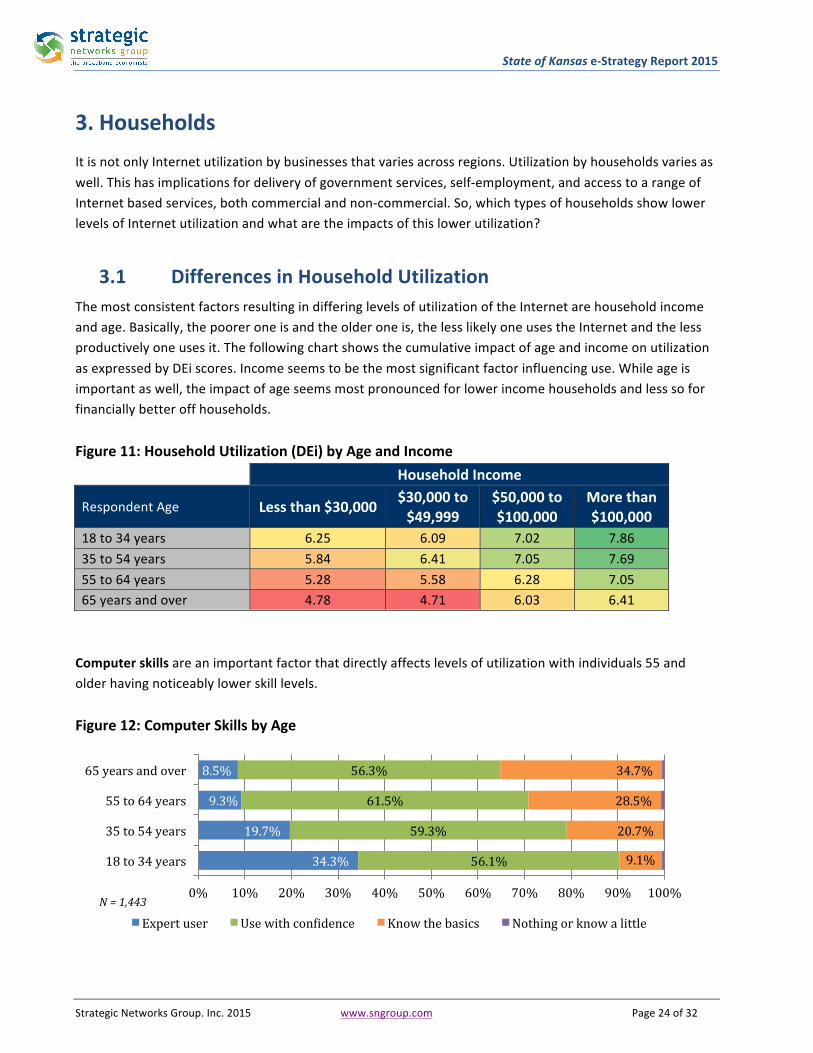
State of Kansas e-‐Strategy Report 2015
Strategic Networks Group. Inc. 2015 www.sngroup.com Page 24 of 32
3. Households It is not only Internet utilization by businesses that varies across regions. Utilization by households varies as well. This has implications for delivery of government services, self-‐employment, and access to a range of Internet based services, both commercial and non-‐commercial. So, which types of households show lower levels of Internet utilization and what are the impacts of this lower utilization?
3.1 Differences in Household Utilization The most consistent factors resulting in differing levels of utilization of the Internet are household income and age. Basically, the poorer one is and the older one is, the less likely one uses the Internet and the less productively one uses it. The following chart shows the cumulative impact of age and income on utilization as expressed by DEi scores. Income seems to be the most significant factor influencing use. While age is important as well, the impact of age seems most pronounced for lower income households and less so for financially better off households. Figure 11: Household Utilization (DEi) by Age and Income Household Income
Respondent Age Less than $30,000 $30,000 to $49,999
$50,000 to $100,000
More than $100,000
18 to 34 years 6.25 6.09 7.02 7.86 35 to 54 years 5.84 6.41 7.05 7.69 55 to 64 years 5.28 5.58 6.28 7.05 65 years and over 4.78 4.71 6.03 6.41 Computer skills are an important factor that directly affects levels of utilization with individuals 55 and older having noticeably lower skill levels. Figure 12: Computer Skills by Age
34.3%
19.7%
9.3%
8.5%
56.1%
59.3%
61.5%
56.3%
9.1%
20.7%
28.5%
34.7%
0% 10% 20% 30% 40% 50% 60% 70% 80% 90% 100%
18 to 34 years
35 to 54 years
55 to 64 years
65 years and over
Expert user Use with conAidence Know the basics Nothing or know a little N = 1,443

State of Kansas e-‐Strategy Report 2015
Strategic Networks Group. Inc. 2015 www.sngroup.com Page 25 of 32
Location Matters: Similar to businesses, household use of eSolutions is impacted by where they are located. Using categories developed by the U.S. Census Bureau, based on population size, density, and commuting patterns, Figure 13 shows that more urbanized areas generally have higher levels of Internet utilization. Part of this difference in utilization levels between metropolitan and non-‐metropolitan areas can probably be attributed to the lower average incomes and higher incidence of older individuals in rural areas. Lower levels of educational attainment in rural areas are also likely to be a contributing factor. However, regional factors are also a factor. When comparing utilization by region (Figure 14), it is evident that some of the least densely populated regions have low utilization (Southeast and Southwest), consistent with the findings noted in the preceding paragraph. However, the Northwest region showed high levels of utilization by its households, even though all but five its respondents came from non-‐metro areas. Figure 13: Household Utilization by Level of Urbanization
Rural-‐Urban Category Median DEi Score # Households
Metropolitan 6.47 438 Micropolitan 6.22 411 Small Town 6.03 261 Isolated Small Town 6.09 335 Figure 14: Household Utilization by Region Region Median DEi # Households North West 6.41 175 South Central 6.41 231 North East 6.28 407 North Central 6.22 223 South East 6.09 259 South West 6.09 154
Recommendation #6: Develop training programs and resources that target lower to middle income households over the age of 64.
Households with low computer skills represent an important group due to the social and economic benefits that can be accessed through the Internet. As governments and businesses move their services to the Internet to achieve better reach and cost efficiencies, it is critical that citizens have the ability to access and benefit from these online services. However, a large portion of lower income and older households have difficulty adopting and using the Internet. Given that low adoption and utilization is strongly tied to age and income, training should be targeted at people over 64 with low to moderate income.

State of Kansas e-‐Strategy Report 2015
Strategic Networks Group. Inc. 2015 www.sngroup.com Page 26 of 32
3.2 eSolutions with High Difference in Utilization Levels Many types of Internet utilization by households are more complex and sophisticated in nature, requiring above average skill levels. These complex eSolutions tend to be slower to be adopted. The chart below shows the rate that each type of utilization is adopted by households relative to their DEi scores. For example, approximately 84 to 96 percent of users will be currently using the “quick to adopt” applications and process noted below. In contrast, less than 27% of users are currently using more sophisticated and difficult applications that tend to be adopted later, especially by those that already have high utilization.
Quick to adopt eSolutions Slow to adopt eSolutions
E-‐mail Teleworking
Obtain product information Home-‐based business
Buy online Voice over IP
News and sports Investing online
Health information
Travel Information
Recommendation #7: Non-‐metropolitan areas are a priority for Internet training programs and resources.
While both urban and rural households struggle to use and benefit from the Internet, rural households are relatively disadvantaged, being generally older and having lower average incomes. Lastly, rural households tend to have greater difficultly in accessing educational, health and government services, all of which are increasingly available online.

State of Kansas e-‐Strategy Report 2015
Strategic Networks Group. Inc. 2015 www.sngroup.com Page 27 of 32
3.3 The Impact of Lower Utilization on Households Looking at the different regions in Kansas, it is clear that areas with the lowest skill levels and utilization have the lowest use of the Internet for personal productivity and earning income. The table shows how population density has major impact on employment and earning income. Areas shaded in green have higher than average utilization, while those in red have lower than average utilization. Figure 15: Percentage of Houses Currently Using Internet for Productivity Uses
Productivity Category Metropolitan Micropolitan Small Town Isolated Small Town
Teleworking 25.4% 16.5% 9.4% 16.3% Home business 21.5% 16.5% 16.3% 19.5% Accessing workplace 54.1% 40.1% 36.9% 34.9% Education/training 42.2% 38.5% 36.5% 34.2%
3.4 Learning Preferences In the previous section, the issue of gaps in utilization by household and regional characteristics was explored. Closely related is the issue of how households acquire the skills required to overcome those gaps, especially their lack of technical skills and discomfort with technology. So what are the preferred means for people to acquire the skills and knowledge needed to overcome gaps in utilization? The following chart outlines the preferences for seniors. What is evident across all groups is the strong preference for informal means of acquiring information, either through talking to others and self-‐directed online information. Formal courses and face-‐to-‐face classes are by far the least preferred means of learning for all groups.
Addressing expertise and knowledge related to eSolutions can mitigate other barriers, especially
privacy concerns.
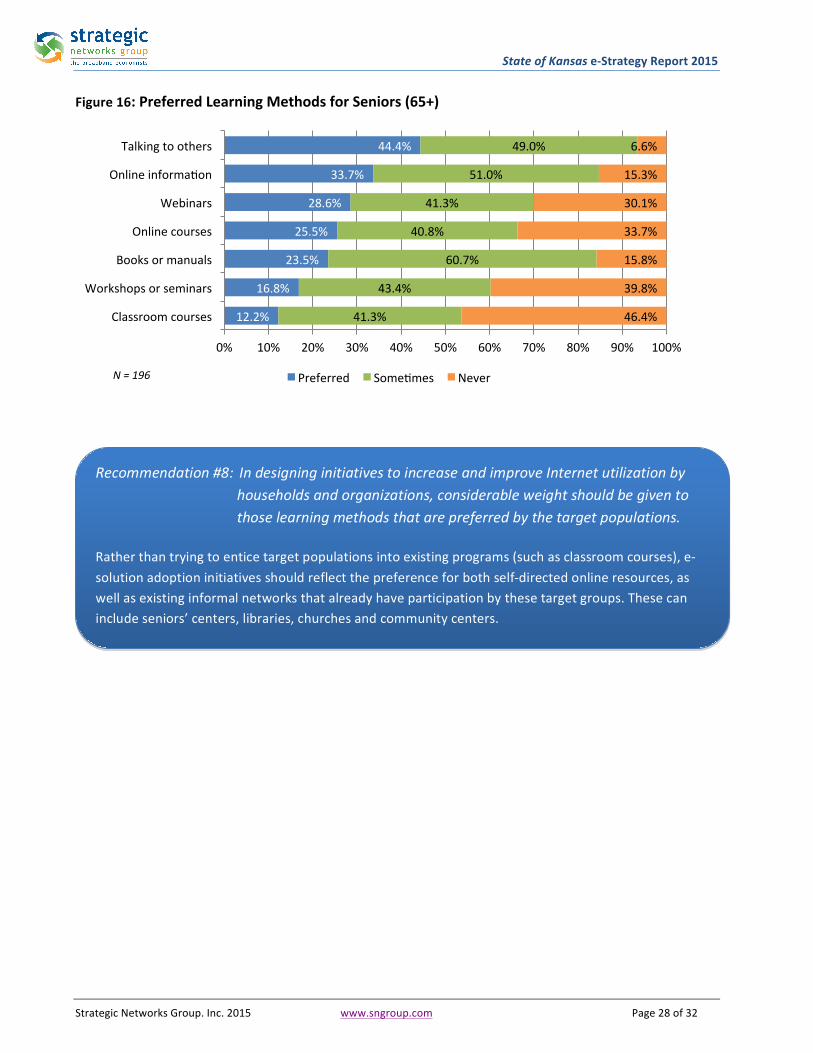
State of Kansas e-‐Strategy Report 2015
Strategic Networks Group. Inc. 2015 www.sngroup.com Page 28 of 32
Figure 16: Preferred Learning Methods for Seniors (65+)
12.2%
16.8%
23.5%
25.5%
28.6%
33.7%
44.4%
41.3%
43.4%
60.7%
40.8%
41.3%
51.0%
49.0%
46.4%
39.8%
15.8%
33.7%
30.1%
15.3%
6.6%
0% 10% 20% 30% 40% 50% 60% 70% 80% 90% 100%
Classroom courses
Workshops or seminars
Books or manuals
Online courses
Webinars
Online informaoon
Talking to others
Preferred Someomes Never N = 196
Recommendation #8: In designing initiatives to increase and improve Internet utilization by households and organizations, considerable weight should be given to those learning methods that are preferred by the target populations.
Rather than trying to entice target populations into existing programs (such as classroom courses), e-‐solution adoption initiatives should reflect the preference for both self-‐directed online resources, as well as existing informal networks that already have participation by these target groups. These can include seniors’ centers, libraries, churches and community centers.

State of Kansas e-‐Strategy Report 2015
Strategic Networks Group. Inc. 2015 www.sngroup.com Page 29 of 32
4. Summary and Next Steps This report analyzes how organizations and households in Kansas utilize broadband. It considers different industry sectors and household types and regional differences within those groupings. It also considers what kinds of actions will improve their performance and how they could benefit further from broadband. The objective of benchmarking utilization of the Internet is to provide “actionable intelligence” to governments, stakeholders, and individuals. Taking action on the recommendations included in this report will enable Kansas to move towards the realization of further benefits from broadband. However, the strategic framework presented in this document relies on communities and regional entities to provide initiative in addressing the digital divide in their area. In non-‐metropolitan areas, lack of capacity and leadership has the potential to limit the effectiveness of a community-‐based approach. Consequently, a strategic objective for adequate broadband service is the development of motivated leadership and institutional capacity for broadband initiatives. “Local champions” are a critical component for the success of broadband initiatives. It is increasingly rare for local government leaders to be unaware or uninterested in the desirability of having good Internet access throughout their jurisdiction. However, interest and awareness has frequently not translated into action in communities where financial resources are constrained, technical knowledge is missing, and leadership is in short supply. Recommendation #9: communities and counties should facilitate broadband leadership. Important elements of leadership and capacity development at the community level include:
• Recruitment of individuals with the interest, energy, and time needed to provide leadership. • Empowerment of leaders by providing official sanction and support from elected officials and key
community organizations. • A mechanism for accountability for leaders back to organizations providing support and sanction. • Educational and learning opportunities for leadership so they can acquire the knowledge and skills
for developing goals, actions and tasks related to the digital divide in their area. • Institutional support from organizations with the capacity for organizing meetings, ensuring
effective communications, and providing logistical support.
“One common characteristic of all Virginia’s current
broadband projects is the presence of strong, dedicated leadership (individual and/or committee) who understand the broadband imperative and are willing to commit time,
energy and scarce resources to insure that their community is
not left behind.”
Appendix 1: Glossary e-‐Strategy Report: This report examines how organizations and households in Kansas differ in their utilization of broadband and where they can look to make improvements. The report shows in detail how different industry sectors and household types compare to each other, especially between and within regions. The report provides insights and hard evidence that allows regions, businesses, and households to assess where they stand. The report provides recommendations on strategies for improving their Internet performance and benefits. eSolutions Benchmarking Technical Report: This report presents the results of survey-‐based research carried out for the State of Kansas. The surveys collected information from businesses, organizations and households on the availability of broadband (high speed Internet access) and its uses, benefits, drivers and barriers. This largely descriptive report results provide insight into gaps and opportunities for increasing broadband utilization by organizations and households. The policy, planning and program implications for Kansas and its regions are dealt with in a separate report: the Broadband KY e-‐Strategy Report. Digital Economy Analysis Platform (DEAP): The DEAP has been developed as an online resource that provides clients with access to the data collection results and the ability to customize their analysis across a range of variables, including industry sector or geographic region. The DEAP is accessed online by authorized users. Users are presented with dashboards for businesses and for households. Each dashboard is organized around a series of pages focused on specific topics, e.g. Connectivity, Utilization, DEi, Impacts, etc. Within each page is a set of predefined reports that present a chart and/or table of processed results from the datasets. eStrategies: e-‐Strategies are high level plans for achieving one or more goals related to improved access to and utilization of broadband Internet. eStrategies define a course of action that is most likely to successful address opportunities, challenges or barriers related. Strategies are usually seen as distinct from detailed action plans which deal with specific issues of “who, what, when and how”. eSolutions: refers to the integration of Internet technologies with the internal computer-‐based systems and applications within or among organizations for a variety of operational processes. eSolutions encompass not only product delivery and payment transactions (e-‐commerce) but also all processes that may be facilitated by computer-‐mediated communications over the Internet. e-‐Process: uses of the Internet which include internal operational uses, such as supplier coordination, training and teleworking. e-‐Commerce: uses of the Internet which include activities related to the sales, marketing and delivery of products and services; and, Kansas Digital Economy Index (DEi): The Digital Economy index (DEi) is part of the benchmarking process and provides reference points against which the performance of any individual or group can be compared. The DEi summarizes an organization’s or household’s utilization of a range of Internet applications and process – 17 for organizations and 30 for households. Based on the number of applications currently being used by an organization or household, a composite score is calculated that summarizes how comprehensively each organization or household uses Internet-‐enabled eSolutions. The DEi can be used to compare organizations, regions, or industry sectors.

State of Kansas e-‐Strategy Report 2015
Strategic Networks Group. Inc. 2015 www.sngroup.com Page 31 of 32
Utilization refers to the third stage in the broadband development process. The first stage is providing a community, household or organization with access (availability) to the Internet. The second stage is adoption or the process whereby a person or organization starts to actually use the Internet. The third stage is utilization whereby a person or organization uses their Internet connection to create value. Many people and organizations have access and have adopted the Internet, but are relatively ineffective in how they use and derive benefits from the Internet. The field of analysis labeled “utilization” explores patterns of Internet use and how these patterns can be enhanced.
State of Kansas e-‐Strategy Report 2015
Strategic Networks Group. Inc. 2015 www.sngroup.com Page 32 of 32