Statements and Schedules of Financial Information - icbc.com · Mark Blucher Bill Carpenter...
134
15 Months Ended March 31, 2017 Statements and Schedules of Financial Information Insurance Corporation of British Columbia
Transcript of Statements and Schedules of Financial Information - icbc.com · Mark Blucher Bill Carpenter...

15 Months Ended March 31, 2017
Statements and Schedules of Financial Information
Insurance Corporation of British Columbia
Statement of Financial Information Approval 1
Management’s Responsibility for Financial Statements 2
Independent Auditor’s Report 4
Actuary’s Report 5
Consolidated Statement of Financial Position 6
Consolidated Statement of Comprehensive Loss 7
Consolidated Statement of Changes In Equity 8
Consolidated Statement of Cash Flows 9
Notes to Consolidated Financial Statements 10
Corporate Governance 70
Schedule of Guarantees and Indemnities 71
Schedule of Debts 72
Financial Information Reconciliation 73
Remuneration and Expenses Paid to Employees 74
Remuneration and Expenses Paid to Members of the Board of Directors 100
Amounts Paid to Suppliers for Goods and Services 101
Table of Contents
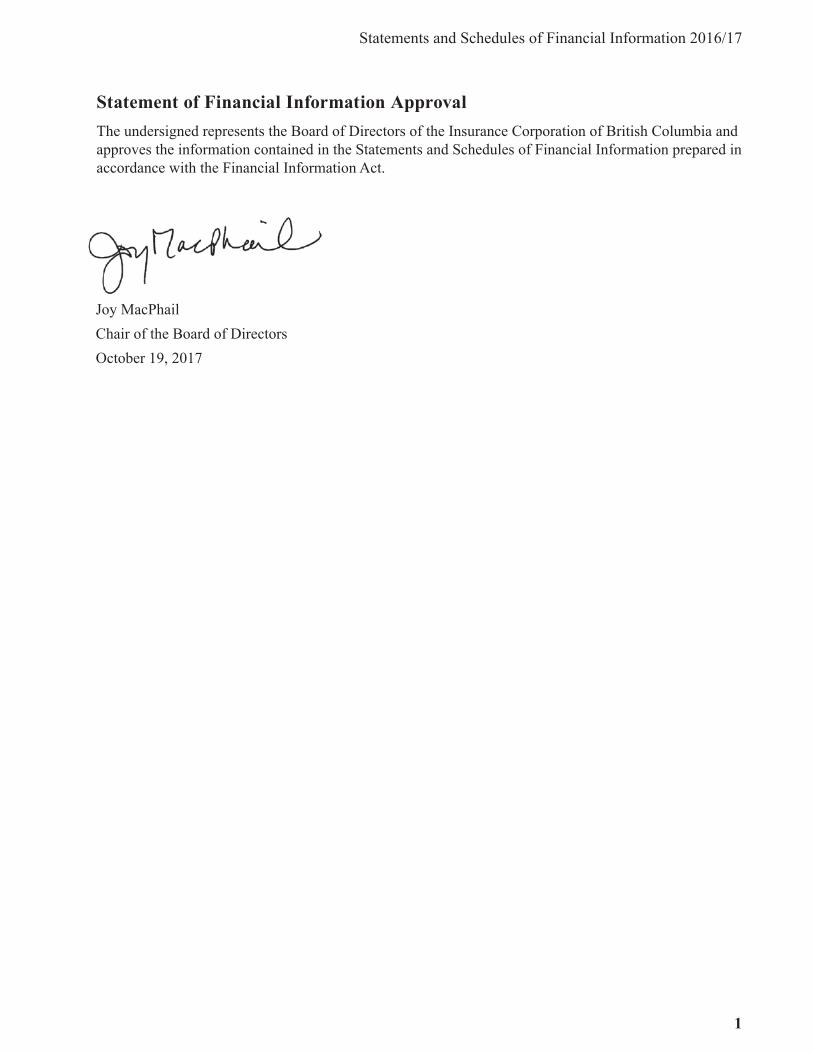
Statements and Schedules of Financial Information 2016/17
1
Statement of Financial Information ApprovalThe undersigned represents the Board of Directors of the Insurance Corporation of British Columbia and approves the information contained in the Statements and Schedules of Financial Information prepared in accordance with the Financial Information Act.
Joy MacPhailChair of the Board of DirectorsOctober 19, 2017
Insurance Corporation of British Columbia
2
Insurance Corporation of British Columbia
2016/17 Annual Service Plan Report 32
Management’s Responsibility for Financial Statements
Scope of Responsibility Management prepares the accompanying consolidated financial statements and related information and is responsible for their integrity and objectivity. The statements are prepared in conformity with International Financial Reporting Standards. These consolidated financial statements include amounts that are based on management’s estimates and judgements, particularly our reserves for unpaid claims. We believe that these statements present fairly ICBC’s financial position, results of operations and cash flows, and that the other information contained in the annual report is consistent with the consolidated financial statements.
Internal Controls We maintain and rely on a system of internal accounting controls designed to provide reasonable assurance that assets are safeguarded and transactions are properly authorized and recorded. The system includes written policies and procedures, an organizational structure that segregates duties, and a comprehensive program of periodic audits by the internal auditors, who independently review and evaluate these controls. There is a quarterly risk assessment process, the results of which influence the development of the internal audit program. We continually monitor these internal accounting controls, modifying and improving them as business conditions and operations change. Policies that require employees to maintain the highest ethical standards have also been instituted. We recognize the inherent limitations in all control systems and believe our systems provide an appropriate balance between costs and benefits desired. We believe our systems of internal accounting controls provide reasonable assurance that errors or irregularities that would be material to the financial statements are prevented or detected in the normal course of business.
Board of Directors and Audit Committee The Audit Committee, composed of members of the Board of Directors, oversees management’s discharge of its financial reporting responsibilities. The Committee recommends for approval to the Board of Directors the appointment of the external auditors and the external actuaries. The Committee meets no less than quarterly with management, our internal auditors and representatives of our external auditors to discuss auditing, financial reporting and internal control matters. The Audit Committee receives regular reports on the internal audit results and evaluation of internal control systems and it reviews and approves major accounting policies including alternatives and potential key management estimates or judgments. Both internal and external auditors and the appointed actuary have access to the Audit Committee without management’s presence. The Audit Committee has reviewed these financial statements prior to recommending approval by the Board of Directors. The Board of Directors has reviewed and approved the financial statements.
Independent Auditor and Actuary Our independent auditor, PricewaterhouseCoopers LLP, have audited the financial statements. Their audit was conducted in accordance with Canadian generally accepted auditing standards, which includes the consideration of our internal controls to the extent necessary to form an independent opinion on the financial statements prepared by management.
William T. Weiland of Eckler Ltd. is engaged as the appointed actuary and is responsible for carrying out an annual valuation of ICBC’s policy liabilities which include a provision for claims and claims expenses, unearned premiums and deferred premium acquisition costs. The valuation is carried out in

Statements and Schedules of Financial Information 2016/17
3
Insurance Corporation of British Columbia
2016/17 Annual Service Plan Report 33
accordance with accepted actuarial practice and regulatory requirements. In performing the evaluation, the appointed actuary makes assumptions as to the future rates of claims frequency and severity, inflation, reinsurance recoveries and expenses taking into consideration the circumstances of ICBC and the insurance policies in force. The appointed actuary, in his verification of the underlying data used in the valuation, also makes use of the work of the external auditor.
Mr. Weiland meets every year with PricewaterhouseCoopers’ valuation actuaries and ICBC’s management to discuss business developments, changes in claims processing and claims trends. These discussions assist the independent parties in developing expectations around and assessing management’s estimate of the claims provision.
Mark Blucher Bill Carpenter President and Chief Executive Officer Chief Financial Officer and Chief Actuary
June 8, 2017 June 8, 2017

Insurance Corporation of British Columbia
4
Insurance Corporation of British Columbia
2016/17 Annual Service Plan Report 34
Independent Auditor’s Report
Minister Responsible for the Insurance Corporation of British Columbia andThe Board of Directors for the Insurance Corporation of British Columbia
We have audited the accompanying consolidated financial statements of Insurance Corporation of British Columbia and its subsidiaries, which comprise the consolidated statement of financial positionas at March 31, 2017 and the consolidated statement of comprehensive income, changes in equity andcash flows for the 15 month period then ended, and the related notes, which comprise a summary ofsignificant accounting policies and other explanatory information.
Management’s responsibility for the consolidated financial statements Management is responsible for the preparation and fair presentation of these consolidated financial statements in accordance with International Financial Reporting Standards, and for such internal control as management determines is necessary to enable the preparation of consolidated financial statements that are free from material misstatement, whether due to fraud or error.
Auditor’s responsibilityOur responsibility is to express an opinion on these consolidated financial statements based on ouraudit. We conducted our audit in accordance with Canadian generally accepted auditing standards.Those standards require that we comply with ethical requirements and plan and perform the audit to obtain reasonable assurance about whether the consolidated financial statements are free frommaterial misstatement. An audit involves performing procedures to obtain audit evidence about the amounts and disclosuresin the consolidated financial statements. The procedures selected depend on the auditor’s judgment, including the assessment of the risks of material misstatement of the consolidated financialstatements, whether due to fraud or error. In making those risk assessments, the auditor considersinternal control relevant to the entity’s preparation and fair presentation of the consolidated financial statements in order to design audit procedures that are appropriate in the circumstances, but not for thepurpose of expressing an opinion on the effectiveness of the entity’s internal control. An audit also includes evaluating the appropriateness of accounting policies used and the reasonableness of accounting estimates made by management, as well as evaluating the overall presentation of theconsolidated financial statements.
We believe that the audit evidence we have obtained is sufficient and appropriate to provide a basisfor our audit opinion.
Opinion In our opinion, the consolidated financial statements present fairly, in all material respects, the financial position of Insurance Corporation of British Columbia and its subsidiaries as at March 31, 2017 and their financial performance and their cash flows for the 15 month period then ended in accordance with International Financial Reporting Standards.
Chartered Professional Accountants
Vancouver, British Columbia June 8, 2017

Statements and Schedules of Financial Information 2016/17
5
Insurance Corporation of British Columbia
2016/17 Annual Service Plan Report 35
Actuary’s ReportI have valued the policy liabilities, including reinsurance recoverables, in the consolidated statement of financial position of the Insurance Corporation of British Columbia as at March 31, 2017 and their changes in its consolidated statement of comprehensive loss for the 15 month period ended in accordance with accepted actuarial practice in Canada, including selection of appropriate assumptions and methods. In my opinion, the amount of the policy liabilities, including reinsurance recoverables, makes appropriate provision for all policy obligations, and the consolidated financial statements fairly present the results of the valuation.
William T. Weiland
Fellow, Canadian Institute of Actuaries Eckler Ltd.
Vancouver, British Columbia June 8, 2017

Insurance Corporation of British Columbia
6
The accompanying notes are an integral part of these consolidated financial statements.
Approved by the Board
Barry Penner, QC William DavidsonChair of the Board of Directors Director
($ THOUSANDS)March 31
2017December 31
2015
AssetsCash and cash equivalents 27,128$ 45,815$Accrued interest 75,863 55,327Assets held for sale (note 5) 25,712 - Financial investments (note 5) 14,411,033 13,946,347Premiums and other receivables (note 9) 1,455,676 1,301,648Reinsurance assets (note 9) 18,070 10,447Investment properties (note 5) 1,048,549 772,183Property and equipment (note 11) 106,286 103,433Intangible assets (note 12) 302,508 279,555Accrued pension benefits (note 16) 37,302 - Deferred premium acquisition costs and prepaids (note 18) 36,502 182,780
17,544,629$ 16,697,535$Liabilities and Equity
LiabilitiesCheques outstanding 78,540$ 64,762$Accounts payable and accrued charges 267,773 265,021Excess Optional capital payable to Province of BC (notes 19 and 20) - 138,118Derivative financial instrument liabilit ies (note 7) 10,702 - Bond repurchase agreements, investment related, and other liabilit ies (note 8) 1,346,749 1,180,744Premium deficiency (note 18) - 75,822Premiums and fees received in advance 51,809 44,499Unearned premiums (note 14) 2,414,503 2,210,364Pension and post-retirement benefits (note 16) 410,396 479,034Provision for unpaid claims (note 13) 10,517,971 9,093,140
15,098,443 13,551,504Equity
Retained earnings 2,458,480 3,371,371Other components of equity (31,865) (261,800)Equity attributable to parent corporation 2,426,615 3,109,571Non-controlling interest (note 6) 19,571 36,460
2,446,186 3,146,031
17,544,629$ 16,697,535$
Contingent liabilit ies and commitments (note 21)
Insurance Corporation of British Columbia
Consolidated Statement of Financial Position
2016/17 Annual Service Plan Report 36
Statements and Schedules of Financial Information 2016/17
7
Insurance Corporation of British Columbia
2016/17 Annual Service Plan Report 37
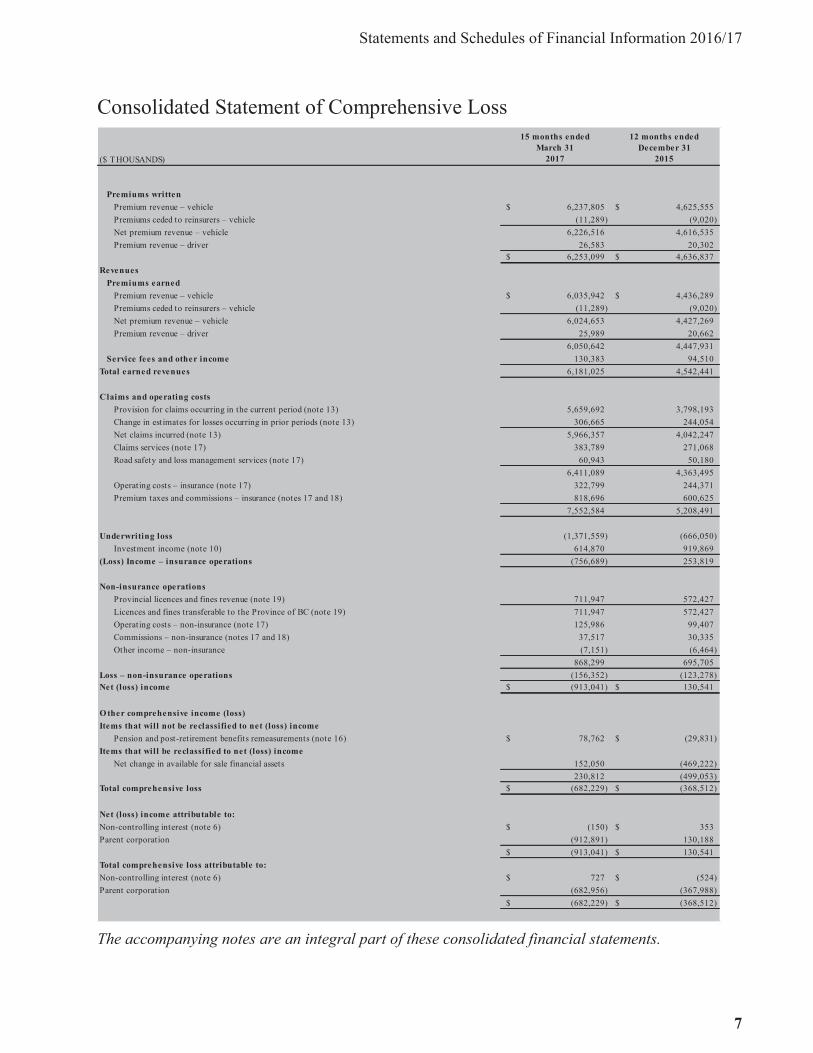
Consolidated Statement of Comprehensive Loss
The accompanying notes are an integral part of these consolidated financial statements.
($ THOUSANDS)
15 months endedMarch 31
2017
12 months ended December 31
2015
Premiums writtenPremium revenue – vehicle 6,237,805$ 4,625,555$ Premiums ceded to reinsurers – vehicle (11,289) (9,020) Net premium revenue – vehicle 6,226,516 4,616,535 Premium revenue – driver 26,583 20,302
6,253,099$ 4,636,837$ Revenues
Premiums earnedPremium revenue – vehicle 6,035,942$ 4,436,289$ Premiums ceded to reinsurers – vehicle (11,289) (9,020) Net premium revenue – vehicle 6,024,653 4,427,269 Premium revenue – driver 25,989 20,662
6,050,642 4,447,931 Service fees and other income 130,383 94,510
Total earned revenues 6,181,025 4,542,441
Claims and operating costsProvision for claims occurring in the current period (note 13) 5,659,692 3,798,193 Change in estimates for losses occurring in prior periods (note 13) 306,665 244,054 Net claims incurred (note 13) 5,966,357 4,042,247 Claims services (note 17) 383,789 271,068 Road safety and loss management services (note 17) 60,943 50,180
6,411,089 4,363,495 Operating costs – insurance (note 17) 322,799 244,371 Premium taxes and commissions – insurance (notes 17 and 18) 818,696 600,625
7,552,584 5,208,491
Underwriting loss (1,371,559) (666,050) Investment income (note 10) 614,870 919,869
(Loss) Income – insurance operations (756,689) 253,819
Non-insurance operationsProvincial licences and fines revenue (note 19) 711,947 572,427 Licences and fines transferable to the Province of BC (note 19) 711,947 572,427 Operating costs – non-insurance (note 17) 125,986 99,407 Commissions – non-insurance (notes 17 and 18) 37,517 30,335 Other income – non-insurance (7,151) (6,464)
868,299 695,705 Loss – non-insurance operations (156,352) (123,278) Net (loss) income (913,041)$ 130,541$
O ther comprehensive income (loss) Items that will not be reclassified to net (loss) income
Pension and post-retirement benefits remeasurements (note 16) 78,762$ (29,831)$ Items that will be reclassified to net (loss) income
Net change in available for sale financial assets 152,050 (469,222) 230,812 (499,053)
Total comprehensive loss (682,229)$ (368,512)$
Net (loss) income attributable to:Non-controlling interest (note 6) (150)$ 353$ Parent corporation (912,891) 130,188
(913,041)$ 130,541$ Total comprehensive loss attributable to:Non-controlling interest (note 6) 727$ (524)$ Parent corporation (682,956) (367,988)
(682,229)$ (368,512)$

Insurance Corporation of British Columbia
8
Insurance Corporation of British Columbia
2016/17 Annual Service Plan Report 38
Consolidated Statement of Changes in Equity
The accompanying notes are an integral part of these consolidated financial statements.
($ THOUSANDS)Retained Earnings
Net change in available for sale financial
assets
Pension and post-retirement
benefits remeasurements
Total O ther Components
of Equity
Total attributable
to parent corporation
Non-Controlling
Interest Total Equity
Balance, beginning of period 3,371,371$ (51,233)$ (210,567)$ (261,800)$ 3,109,571$ 36,460$ 3,146,031$Acquisition of entities with non-controlling interest (note 6) 7,927 7,927Loss of control of Canadian pooled fund (note 6) (24,974) (24,974)Distributions (569) (569)
Comprehensive (loss) incomeNet loss (912,891) - - - (912,891) (150) (913,041)Other comprehensive (loss) income
Net gains reclassified to investment income - (196,526) - (196,526) (196,526) - (196,526)Net gains arising on available for sale financial assets in the period - 347,699 - 347,699 347,699 877 348,576Pension and post-retirement benefits remeasurements (note 16) - - 78,762 78,762 78,762 - 78,762
Total other comprehensive income - 151,173 78,762 229,935 229,935 877 230,812
Total comprehensive (loss) income (912,891) 151,173 78,762 229,935 (682,956) 727 (682,229)
Balance, end of period 2,458,480$ 99,940$ (131,805)$ (31,865)$ 2,426,615$ 19,571$ 2,446,186$
($ THOUSANDS)Retained Earnings
Net change in available for sale financial
assets
Pension and post-retirement
benefits remeasurements
Total O ther Components
of Equity
Total attributable
to parent corporation
Non-Controlling
Interest Total Equity
Balance, beginning of period 3,379,301$ 417,112$ (180,736)$ 236,376$ 3,615,677$ -$ 3,615,677$ Acquisition of entities with non-controlling interest (note 6) 37,069 37,069Distributions (85) (85)
Comprehensive (loss) incomeNet income 130,188 - - - 130,188 353 130,541Other comprehensive (loss) income
Net gains reclassified to investment income - (488,286) - (488,286) (488,286) - (488,286)Net gains arising on available for sale financial assets in the period - 19,941 - 19,941 19,941 (877) 19,064Pension and post-retirement benefits remeasurements (note 16) - - (29,831) (29,831) (29,831) - (29,831)
Total other comprehensive loss - (468,345) (29,831) (498,176) (498,176) (877) (499,053)
Total comprehensive income (loss) 130,188 (468,345) (29,831) (498,176) (367,988) (524) (368,512)Excess O ptional capital transfer to Province of BC (notes 19 and 20) (138,118) - - - (138,118) - (138,118)
Balance, end of period 3,371,371$ (51,233)$ (210,567)$ (261,800)$ 3,109,571$ 36,460$ 3,146,031$
12 months ended December 31, 2015O ther Components of Equity
15 months ended March 31, 2017O ther Components of Equity
Statements and Schedules of Financial Information 2016/17
9
Insurance Corporation of British Columbia
2016/17 Annual Service Plan Report 39
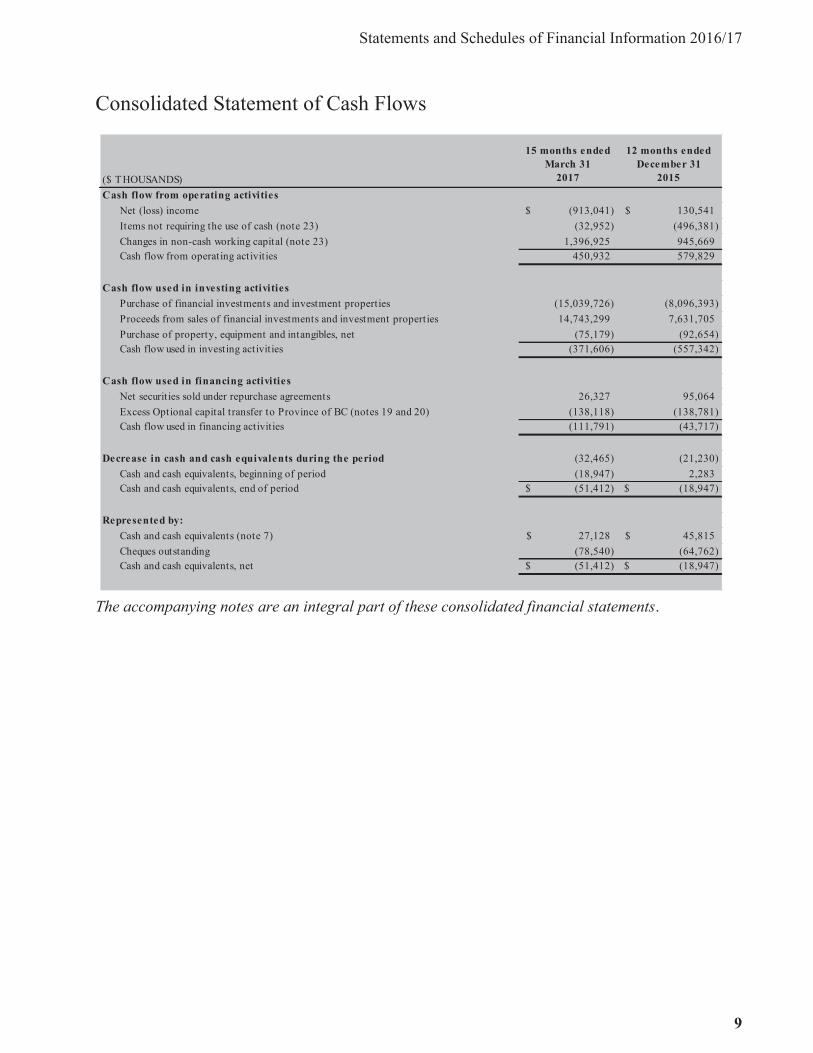
Consolidated Statement of Cash Flows
The accompanying notes are an integral part of these consolidated financial statements.
($ THOUSANDS)
15 months ended March 31
2017
12 months ended December 31
2015Cash flow from operating activities
Net (loss) income (913,041)$ 130,541$ Items not requiring the use of cash (note 23) (32,952) (496,381)Changes in non-cash working capital (note 23) 1,396,925 945,669Cash flow from operating activities 450,932 579,829
Cash flow used in investing activitiesPurchase of financial investments and investment properties (15,039,726) (8,096,393)Proceeds from sales of financial investments and investment properties 14,743,299 7,631,705Purchase of property, equipment and intangibles, net (75,179) (92,654)Cash flow used in investing activities (371,606) (557,342)
Cash flow used in financing activitiesNet securities sold under repurchase agreements 26,327 95,064Excess Optional capital transfer to Province of BC (notes 19 and 20) (138,118) (138,781)Cash flow used in financing activities (111,791) (43,717)
Decrease in cash and cash equivalents during the period (32,465) (21,230)Cash and cash equivalents, beginning of period (18,947) 2,283Cash and cash equivalents, end of period (51,412)$ (18,947)$
Represented by:Cash and cash equivalents (note 7) 27,128$ 45,815$ Cheques outstanding (78,540) (64,762)Cash and cash equivalents, net (51,412)$ (18,947)$

Insurance Corporation of British Columbia
10
Insurance Corporation of British Columbia
2016/17 Annual Service Plan Report 40
Notes to Consolidated Financial Statements
For the 15 month period ended March 31, 2017
1. Corporate InformationThe Insurance Corporation of British Columbia (the Corporation) is a wholly-owned Crown corporation of the Province of B.C., not subject to income taxes under the Income Tax Act (Canada),incorporated in 1973 and continued under the Insurance Corporation Act, R.S.B.C. 1996 Chapter 228. The head office of the Corporation is 151 West Esplanade, North Vancouver, British Columbia. The Corporation operates and administers plans of universal compulsory vehicle insurance (Basic) and optional vehicle insurance as set out under the Insurance (Vehicle) Act, and is also responsible for non-insurance services under the Insurance Corporation Act and the Motor Vehicle Act. Non-insurance services include driver licensing, vehicle registration and licensing, violation ticketadministration and government fines collection. As a result of amendments to the Insurance Corporation Act in 2003, the Corporation is subject to regulation by the British Columbia Utilities Commission (BCUC) with respect to universal compulsory vehicle insurance rates and services (note 22).
Basic insurance includes the following coverages: $200,000 third party liability protection (higher for some commercial vehicles), access to accident benefits including a maximum of $150,000 for medical and rehabilitation expenses and up to $300 per week for wage loss, $1,000,000 underinsured motorist protection, and also protection against uninsured and unidentified motorists within and outside the Province of B.C. The Corporation also offers insurance in a competitive environment (Optional), which includes, but is not limited to, the following coverages: extended third party liability, comprehensive, collision, and loss of use. The Corporation’s Basic and Optional insurance products are distributed by approximately 900 independent brokers located throughout the Province of B.C. The Corporation has the power and capacity to act as an insurer and reinsurer in all classes of insurance; however, the Corporation currently only acts as a vehicle insurer.
In January 2016, the Corporation’s Board of Directors approved a change to the Corporation’s fiscal year-end from December 31 to March 31 to align with the Province of B.C.’s March 31 fiscal year-end date. This was followed by a change to the Insurance Corporation Act effective March 10, 2016 setting the Corporation’s fiscal year-end at March 31. These consolidated financial statements represent the first complete fiscal period subsequent to this decision. To transition to the new fiscal year-end, the current period includes the 15 months ended March 31, 2017, with comparative financial statements for the 12 months ended December 31, 2015. As a result, information contained in these consolidated financial statements may not be comparable.
These consolidated financial statements have been authorized for issue by the Board of Directors on June 8, 2017.

Statements and Schedules of Financial Information 2016/17
11
Insurance Corporation of British Columbia
2016/17 Annual Service Plan Report 41
2. Summary of Significant Accounting PoliciesThe significant accounting policies applied in preparation of these consolidated financial statements are set out below. They have been prepared under the historical cost convention, as modified by the revaluation of certain financial assets at fair value. These policies have been consistently applied to all periods presented, unless otherwise stated.
a) Basis of reporting
The consolidated financial statements of the Corporation have been prepared in accordance with the International Financial Reporting Standards (IFRS) as issued by the International Accounting Standards Board (IASB) and required by the Budget Transparency and Accountability Act. The consolidated financial statements include the accounts of the Corporation and its subsidiary companies. The Corporation’s reporting currency and functional currency for all of its operations is the Canadian dollar, unless otherwise stated.
The Corporation reports revenues and expenses attributable to Basic insurance separately from the other operations of the Corporation (note 22). The Corporation presents investment income separately from underwriting results as this reflects how the business operations are managed and provides more relevant, reliable, comparable and understandable information of these consolidated financial statements and reflects the Corporation’s results from underwriting activities and investment activities. The Corporation also provides a number of non-insurance services on behalf of the Province of B.C. The costs associated with these non-insurance activities are borne by the Corporation. The amounts collected and remitted as well as the related costs are accounted for and disclosed separately in the consolidated statement of comprehensive loss under non-insurance operations for greater transparency (note 19). During the period, the Corporation changed its consolidated statement of cash flows to the indirect method due to preparation efficiency and is a more commonly used financial reporting practice (note 23).
The preparation of consolidated financial statements in conformity with IFRS requires the use of certain critical accounting estimates. It also requires management to exercise its judgment in the process of applying the Corporation’s accounting policies. The estimates and assumptions that have a significant risk of causing a material adjustment to the carrying amounts of assets and liabilities within the next financial period are disclosed in note 3.
b) Basis of consolidationControlThe Corporation consolidates the financial statements of all subsidiary companies over which ithas control. Control is achieved when the Corporation has the power to govern the financial andoperating policies of an entity so as to obtain benefits from its activities. Entities are fullyconsolidated from the date on which control is transferred to the Corporation. All but two of theCorporation’s investment properties are held individually in fully-owned nominee holdingcompanies. The Corporation does not have any active operating subsidiary companies. All inter-company transactions and balances are eliminated.
Non-controlling interest (NCI), presented as part of equity, represents the portion of an entity’s profit or loss and net assets that are not attributable to the Corporation. The Corporation attributes
Insurance Corporation of British Columbia
12
Insurance Corporation of British Columbia
2016/17 Annual Service Plan Report 42
total comprehensive income or loss of entities between the parent and the NCI based on their respective ownership interests. All subsidiaries are wholly-owned except for a few, which are Canadian limited partnerships (note 6).
When the Corporation loses control over an entity, it derecognizes the assets and liabilities of the entity, and any related NCI and other components of equity. Any resulting gain or loss is recognized in profit or loss. Any interest retained in the entity is measured at fair value when control is lost.
In 2015, the Corporation had control of one Canadian equity pooled fund investment (the Fund). The Fund was fully consolidated, with the NCI portion attributed to NCI within equity. In May 2016, the Corporation ceased to control the Fund (note 6).
Significant influence
Associates are entities over which the Corporation has significant influence, which means it has the power to participate in the financial and operating decisions of the investee but does not have control or joint control over the financial or operating policies. Associates generally involve a shareholding of 20% to 50% of the voting rights. In some cases, voting rights in themselves are not sufficient to assess power or significant influence over the relevant activities of the investee. In such cases, judgment is applied through the analysis of management agreements, the effectiveness of voting rights, the significance of the benefits to which the Corporation is exposed and the degree to which the Corporation can use its power or significant influence to affect its returns from investees. Associates are accounted for using the equity method. The Corporation has determined that it does not have significant influence in an investment in a limited partnership for real estate (note 3d), thus the investment is not classified as an associate.
Joint operation
The Corporation accounts for its interest in joint operations by recognizing its share of assets, liabilities, revenues and expenses in accordance with its contractually conferred rights and obligations. The Corporation owns 50% share of each of its three joint operations, one of which is with a Limited Partner. All joint operations are investment properties in Canada.
c) Service fees
Service fees on the Corporation’s payment plan are recognized monthly over the term of the policy. For six or twelve month term Autoplan policies, the Corporation’s payment plan enables customers to make monthly or quarterly payments. The related interest bearing receivables are carried at amortized cost as determined using the effective interest method.
d) Insurance contracts
The Corporation issues insurance contracts that transfer insurance risk which results in the possibility of having to pay benefits on the occurrence of an insured event. The Corporation accounts for insurance contracts as follows:

Statements and Schedules of Financial Information 2016/17
13
Insurance Corporation of British Columbia
2016/17 Annual Service Plan Report 43
Premiums earned
The Corporation recognizes vehicle premiums on a straight-line basis over the term of each vehicle policy written. Driver premiums are earned over 12 months. Unearned premiums are the portion of premiums relating to the unexpired term, net of any premium refunds.
Deferred premium acquisition costs
To the extent premium acquisition costs such as commissions and premium taxes are recoverable from unearned premiums, they are deferred and amortized to income over the term of the related policies. An actuarial evaluation is performed to determine the amount allowable for deferral. The method followed in determining the deferred costs limits the amount of the deferral to the amount recoverable from unearned premiums, after giving consideration to the investment income, claims costs, and adjustment expenses expected to be incurred as the premiums are earned. A premium deficiency exists when future claims and related expenses are expected to exceed unearned premiums. When this occurs, the premium deficiency is recognized as a liability and any deferred premium acquisition costs are written down.
Provision for unpaid claims
The provision for unpaid claims represents the estimated amounts required to settle all unpaid claims. It includes amounts for claims that are incurred but not reported (IBNR) plus development on known case reserves and loss adjustment expenses, and is gross of recoveries from reinsurance. The provision for unpaid claims is established according to accepted actuarial practice in Canada. It is carried on a discounted basis and therefore reflects the time value of money, and includes a provision for adverse deviations (PfAD).
As with any insurance company, the provision for unpaid claims is an estimate subject to volatility, which could be material in the near term. The estimation of claims development involves assessing the future behaviour of claims, taking into consideration the consistency of the Corporation’s claims handling procedures, the amount of information available, and historical delays in reporting claims. In general, the more time required for the settlement of a group of claims, the more variable the estimates will be. Variability can be caused by receipt of additional information, significant changes in the average cost or frequency of claims over time, significant changes in the Corporation’s claims operations, the timing of claims payments, and future rates of investment return.
The ultimate cost of long settlement term claims is particularly challenging to predict for several reasons, which include some claims not being reported until many years after a policy term, or changes in the legal environment, case law or legislative amendments. The Corporation is subject to litigation arising in the normal course of conducting its insurance business, which is taken into account in establishing the provision for unpaid claims and other liabilities. Provisions for such liabilities are established by examining the facts of tendered claims and are adjusted in the aggregate for ultimate loss expectations based upon historical experience patterns, current socio-economic trends and structured settlements provided in the form of consistent periodic payments as opposed to lump-sum payments.

Insurance Corporation of British Columbia
14
Insurance Corporation of British Columbia
2016/17 Annual Service Plan Report 44
To recognize the uncertainty in establishing best estimates, as set out in the Standards of Practice of the Canadian Institute of Actuaries, the Corporation includes a PfAD, consisting of three elements: an interest rate margin, a reinsurance margin, and a claims development margin. The interest rate margin reduces the expected investment rate of return used for discounting to make allowance for i) asset liability mismatch risk, ii) uncertainty in the timing of claims settlement, and iii) credit risk within the investment portfolio. The reinsurance margin makes allowance for the collectability of recoverable amounts from reinsurers and is a reduction in the expected amount of reinsurance recoverable. The claims development margin makes allowance for the various factors that can create greater uncertainty in the estimates of ultimate claims costs, including i) changes in the Corporation’s operations (e.g. claims practices), ii) the underlying data upon which the unpaid claims estimates are based, and iii) the nature of the lines of business written. The claims development margin is a percentage of the unpaid claims, gross of reinsurance, and is larger for injury lines that generally require more time for claims to settle and close.
The Corporation also assesses the adequacy of its insurance liabilities at the end of each reporting period to ensure that they are sufficient to cover expected future cash flows. All changes to the estimate since the end of the last reporting period are recorded in the current period as a ‘Change in estimates for losses occurring in prior periods’. Methods of estimation have been used which the Corporation believes produce reasonable results given current information.
Reinsurance
Reinsurance balances are presented separately on the consolidated statement of financial position to indicate the extent of credit risk related to reinsurance and its obligations to policyholders, and on the consolidated statement of comprehensive loss to indicate the results of its retention of premiums written.
Reinsurance assets, including both reinsurance recoverable and reinsurance receivable, are shown on the consolidated statement of financial position. A PfAD is included in the discounted amount recoverable from reinsurers. The PfAD is applied on a consistent basis with the underlying provision for unpaid claims and includes a reinsurance recovery portion that reflects considerations relating to potential collectability issues with reinsurers.
e) Cash and cash equivalents
Cash and cash equivalents are short-term, highly liquid investments that are subject to insignificant changes in fair value, including cash on hand, deposits with financial institutions that can be withdrawn without prior notice or penalty, and money market securities with a term less than 90 days from the date of acquisition.
f) Assets held for sale
Non-current assets that are expected to be recovered primarily through sale rather than through continuing use, and the sale is considered to be highly probable, are classified as held for sale. Immediately before classification as held for sale, the assets are remeasured at cost less accumulated depreciation and impairment losses. Thereafter, the assets are measured at the lower of their carrying amount and fair value less costs to sell. Impairment losses on initial classification as held for sale and

Statements and Schedules of Financial Information 2016/17
15
Insurance Corporation of British Columbia
2016/17 Annual Service Plan Report 45
subsequent gains and losses on remeasurement are recognized in profit or loss; these gains are not recognized in excess of any cumulative impairment loss. Once classified as held for sale, non-current assets are no longer amortized or depreciated (note 5).
g) Financial assets
The Corporation designates its financial instruments as fair value through profit or loss (FVTPL), loans and receivables (Loans) or available for sale (AFS) depending upon the purpose for which the financial assets were acquired. Monetary assets are assets that are to be received in a fixed or determinable number of units of currency. Monetary financial assets include bonds and non-monetary financial assets include equities. The Corporation’s financial assets are accounted for based on their classification as follows:
Fair value through profit or loss The Corporation’s cash and cash equivalents (note 2e) and derivative financial instruments (note 2j) are accounted for as FVTPL. A financial asset is classified in this category if it is acquired principally for the purpose of selling in the short-term. The Corporation’s derivative financial instruments are forward contracts that are not in a hedging relationship, which are classified as FVTPL.
FVTPL financial assets are recorded at fair value on initial recognition and for subsequent measurement. Transaction costs and changes in the fair value are recognized in investment income on the consolidated statement of comprehensive loss.
Loans and receivables Loans are non-derivative financial assets with fixed or determinable payments that are not quoted in an active market. The Corporation has classified its mortgage portfolio, loan, and premiums and other receivables as Loans. The mortgage portfolio consists of mortgages and mortgage bonds. The Corporation currently has one loan to a Canadian operation to acquire a non-controlling interest in a Canadian limited partnership.
Loans are recorded at fair value on initial recognition and subsequently measured at amortized cost using the effective interest rate method. Transaction costs are included in the initial carrying amount of the assets. Impairment losses on loans are recognized in investment income on the consolidated statement of comprehensive loss.
Available for sale Non-derivative financial assets that are not classified as Loans or FVTPL are accounted for as AFS. The Corporation has designated its money market securities with a term greater than 90 days from the date of acquisition, and its bond and equity portfolios as AFS.
AFS financial assets are recorded at fair value on initial recognition or the trade date and for subsequent measurement. Transaction costs are included in the initial carrying amount of the assets.
Insurance Corporation of British Columbia
16
Insurance Corporation of British Columbia
2016/17 Annual Service Plan Report 46
Changes in the fair value, other than due to foreign exchange, of an AFS financial asset are recorded in other comprehensive income (OCI), until the financial asset is disposed of or becomes impaired, at which time the gain or loss will be recognized in investment income. Changes in the fair value due to foreign exchange on a non-monetary AFS financial asset are recorded in OCI. Changes in fair value due to foreign exchange on a monetary AFS financial asset are recorded in investment income. Interest calculated using the effective interest method is accrued daily and recognized in investment income. Dividends are recognized in investment income when the right to receive payments is established on the ex-dividend date.
Financial assets are derecognized when the rights to receive cash flows have expired or have been transferred along with substantially all of the risks and rewards of ownership.
h) Translation of foreign currencies
Foreign currency transactions are translated at exchange rates at the date of the sale or purchase. Foreign currency assets and liabilities considered as monetary items are translated at exchange rates in effect at the period end date. Foreign exchange gains and losses resulting from the settlement of such transactions and from the translation at period end exchange rates of monetary assets and liabilities denominated in foreign currencies are recognized in investment income.
Translation differences on non-monetary AFS financial assets, such as equity securities, are recognized as part of the change in fair value in OCI until the security is disposed of or impairment is recorded. Translation differences on monetary AFS financial assets are recorded in investment income.
i) Fair value of financial assets
In accordance with IFRS 13 Fair Value Measurement, the Corporation defines fair value as the price that would be received to sell an asset or paid to transfer a liability in an orderly transaction between market participants at the measurement date. Fair value measurement is classified as Level 1, 2 or 3 based on the degree to which fair value is observable:
Level 1 inputs to the valuation methodology are quoted prices (unadjusted) in active markets for identical assets or liabilities.
Level 2 inputs to the valuation methodology include inputs other than quoted prices included within Level 1 that are observable for the asset or liability, either directly or indirectly.
Level 3 inputs to the valuation methodology are not based on observable market data. Where an active market does not exist, and quoted prices are unavailable, fair values are determined using valuation techniques that refer to observable market data. Where observable market data is unavailable, the estimated fair value is determined using valuation techniques.
The estimated fair value of money market securities greater than 90 days, which are not considered cash and cash equivalents, is approximated by cost. The estimated fair value for bonds and equities is based on quoted prices or on other observable market information, where available. The estimated fair value for mortgages is determined by referencing the yield curve of Government of Canada bonds to the corresponding maturity dates of the underlying mortgages, plus an estimated risk premium. The

Statements and Schedules of Financial Information 2016/17
17
Insurance Corporation of British Columbia
2016/17 Annual Service Plan Report 47
risk premium is determined by factors such as the location of the property, tenant profile, and degree of leverage of the property.
These valuations are reviewed each reporting date by management.
j) Derivative financial instruments
The Corporation uses derivative financial instruments to manage the foreign exchange risks related to its US bond portfolio (note 7).
Foreign exchange related derivative instruments that are not designated as hedges are recorded using the mark-to-market method of accounting whereby instruments are recorded at fair value as an asset or liability with changes in fair value recognized in investment income in the period of change. The related foreign exchange gains or losses on the bond portfolio are included in investment income on the consolidated statement of comprehensive loss.
k) Investment properties
Properties held for rental income or capital appreciation that are not occupied by the Corporation are classified as investment properties.
The estimated fair value of the Corporation’s investment properties is based on independent appraisals by professionally qualified external valuators made during the period or on a combination of discounted cash flows using current market capitalization rates and the direct capitalization method. The estimated fair value as calculated using the direct capitalization method is determined by dividing the net operating income by the capitalization rate.
The Corporation has certain properties that serve dual purposes, investment and own-use portions. If the investment and own-use portions can be sold separately or leased out separately under a finance lease, the portions are accounted for separately. If the portions cannot be sold separately, the property is investment property only if an insignificant portion is held for own-use in the supply of services or for administrative purposes. Where the portion held for own-use is significant then it would be treated as property and equipment. The Corporation has two properties that serve dual purposes, both of which are classified as investment properties.
Investment properties comprise of land and buildings and are initially recognized at the fair value of the purchase consideration plus directly attributable costs. Subsequent to initial recognition, the investment properties are carried at cost less accumulated depreciation for the building portion and impairment, if any.
Depreciation is provided on a straight-line basis at 2.5% to 5.0% annually over the investment properties’ useful life.
l) Investment-related liabilities
Investment-related liabilities include mortgage debt associated with investment properties (note 2k) and are initially recognized at fair value and subsequently measured at amortized cost.

Insurance Corporation of British Columbia
18
Insurance Corporation of British Columbia
2016/17 Annual Service Plan Report 48
m) Bond repurchase agreements
The Corporation participates in the sale and repurchase of Government of Canada and Provincial bonds which are sold and simultaneously agreed to be repurchased at a future date with the market repurchase rate determining the forward contract price. These sale and repurchase arrangements are accounted for as financial liabilities and are initially recognized at fair value and subsequently measured at cost. The difference between the sale price and the agreed repurchase price on a repurchase contract is recognized as interest expense. Assets transferred under repurchase agreements are not derecognized as substantially all the risks and rewards of ownership are retained by the Corporation and a liability equal to the consideration received has been recorded.
n) Accounts payable and accrued charges
Accounts payable and accrued charges are obligations to pay for goods and services that have been acquired in the ordinary course of business from suppliers. Accounts payable and accruals are recognized initially at fair value and subsequently measured at amortized cost.
o) Provisions
Provisions are recognized when the Corporation has a present legal or constructive obligation as a result of past events, and it is probable that an outflow of resources will be required to settle the obligation and the amount can be reliably estimated. These costs are included in the accounts payable and accrued charges presented on the consolidated statement of financial position. Future operating losses are not recognized.
Where these amounts are due more than 12 months after the reporting date, they are measured at the present value of the expenditures expected to settle the obligation using a discount rate that reflects current market assessments of the time value of money and the risks specific to the obligation.
p) Pension and post-retirement benefits
The amounts recognized in net income in respect of defined benefit pension plans and post-retirement benefits are as follows:
The Corporation’s portion of the current service costs; Non-investment costs; Interest costs; Past service costs; and Impact of any curtailment or settlements during the period.
The current service cost is equal to the present value of benefits earned by members during the reporting period.
The non-investment costs are equal to expenses paid from the plans in the reporting period relating to the administration of the plans.

Statements and Schedules of Financial Information 2016/17
19
Insurance Corporation of British Columbia
2016/17 Annual Service Plan Report 49
The interest costs are calculated using the discount rate at the beginning of the reporting period and applied to the net liability at the beginning of the reporting period.
Past service costs arise from plan amendments that increase or decrease the obligation. Past service costs are recognized immediately in net income.
The changes in the defined benefit obligation and the changes in the fair value of plan assets that result from a curtailment or settlement of plan liabilities during the reporting period are recognized in net income.
A plan’s surplus is equal to the excess, if any, of the plan’s assets over its obligations. For plans in surplus, an asset is recognized on the consolidated statement of financial position to the extent that the Corporation can realize an economic benefit, in the form of a refund or a reduction in future contributions, at some point during the life of the plan or when the plan liabilities are settled. For plans in deficit, the resulting net liability is recognized on the consolidated statement of financial position.
The value recognized on the consolidated statement of financial position for each defined benefit pension plan and for post-retirement benefits is calculated at the end of the reporting period as follows:
The defined benefit obligation of the plan; Less the fair value of the plan assets out of which the obligations are to be settled directly; and Adjusted for the net change of any surplus derecognized.
The Corporation recognizes all actuarial remeasurements in the reporting period in which they arise, through OCI on the consolidated statement of comprehensive loss.
Certain current and former employees of the Corporation who were formerly employed in the Motor Vehicle Branch are members of a separate plan, the BC Public Service Pension Plan. This is a multi-employer defined benefit plan for which the Corporation applies defined contribution accounting. Since the BC Public Service Pension Plan pools risks amongst the current and former members of many employers, there is no consistent or reliable basis for allocating the Corporation’s portion of the obligation, assets, and costs. As a result, the Corporation expenses the contributions made. Contributions are subject to change in the future depending on the funded status of the plan.
q) Property and equipment
Property and equipment are initially recorded at fair value and subsequently measured at cost less accumulated depreciation and impairment losses. Cost includes expenditures that are directly attributable to the acquisition or construction of the items including retirement costs. Subsequent costs such as betterments are included in the asset only when it is probable that future economic benefits associated with the item will flow to the Corporation. All other subsequent expenditures are recognized as repairs and maintenance. Capitalized software that is an integral part of the equipment is accounted for as equipment.
Insurance Corporation of British Columbia
20
Insurance Corporation of British Columbia
2016/17 Annual Service Plan Report 50
Property and equipment are depreciated when they are available for use on a straight-line basis over the estimated useful life of each asset, taking into account the residual value, at the following annual rates:
Buildings 2.5% to 10% Furniture and equipment 10% to 33% Leasehold improvements Term of the lease
The assets’ residual values and useful lives are reviewed annually and adjusted, if appropriate, at each reporting date.
Gains and losses on disposals are determined by comparing the proceeds with the carrying amount and recorded in net income.
r) Intangible assets
Capitalized software that is not an integral part of the equipment is accounted for as an intangible asset. Software development costs, which are comprised of labour and material costs for design, construction, testing, and other costs directly attributable to bringing the asset to a condition where it can be applied in its intended use, are capitalized for infrastructure projects expected to be of continuing benefit to the Corporation, or expensed where the potential future benefits are uncertain or not quantifiable.
Finite life intangible assets are initially recorded at fair value and subsequently carried at cost less accumulated amortization and impairment losses. Intangible assets with finite useful lives are amortized over their estimated useful lives when they are available for use on a straight-line basis at 10% to 33%, taking into account the residual value.
Indefinite life and not available for use intangible assets are not subject to amortization, but are assessed for indicators of impairment at each reporting date.
s) Impairment of assets
Impairment of financial assetsFinancial assets not carried at FVTPL are assessed at each reporting date to determine if there is objective evidence of impairment such as deterioration in the financial health of the investee, industry and sector performance, changes in technology, financing and operational cash flows, and the significance of deterioration in the fair value of the asset below cost. In addition, for equity investments, a prolonged decline is also considered objective evidence of impairment. Where objective evidence of impairment exists, an impairment loss will be recognized as follows:
For AFS financial assets, the related unrealized loss charged to OCI is reclassified to investmentincome.
For Loans, the related difference between the amortized cost carrying amount and the fair value,calculated as the present value of the estimated future cash flows, directly from the loan or the saleof collateral, discounted at the asset’s original effective interest rate, is recognized in investmentincome.
Statements and Schedules of Financial Information 2016/17
21
Insurance Corporation of British Columbia
2016/17 Annual Service Plan Report 51
If the fair value of a previously impaired debt instrument classified as AFS or a financial asset measured at amortized cost increases and the increase can be objectively related to an event occurring after the impairment loss was recognized, the impairment loss is reversed in investment income. Impairment losses on equity instruments are not reversed.
Impairment of non-financial assetsThe Corporation’s non-financial assets consist primarily of investment properties, property and equipment, and intangible assets. An impairment review is carried out at the end of each reporting period to determine if there are any indicators of impairment. When indicators of impairment exist, the Corporation assesses the asset for impairment. Investment properties are assessed for impairment as separate and identifiable cash-generating units, distinct from the other operations of the Corporation. All other assets are assessed as a group as their cash flows are generated from the operations of the Corporation. If an asset is impaired, the Corporation’s carrying amount is written down to its estimated recoverable amount when material. Recoverable amount is the higher of fair value less costs to sell and value in use. Non-financial assets that suffered an impairment are reviewed for possible reversal of the impairment at each reporting date. If there is a change in estimate of the recoverable amount, an impairment loss is reversed to net income only to the extent that the asset’s carrying value does not exceed the carrying value that would have been determined, net of depreciation, if no impairment loss had been recognized.
t) Leases
Leases in which a significant portion of the risks and rewards of ownership are retained by the lessor are classified as operating leases. Payments made under operating leases are charged to net income on the consolidated statement of comprehensive loss on a straight-line basis over the period of the lease. Where substantially all of the risks and rewards have been transferred to the lessee, the lease is classified as a finance lease. In these cases, an obligation and an asset are recognized based on the present value of the future minimum lease payments and balances are amortized over the lease term or useful life, as applicable.
u) Current and non-current classification of assets and liabilities
Assets are classified as current when expected to be realized within one year of the reporting date. Liabilities are classified as current when expected to be settled within one year of the reporting date. All other assets and liabilities are classified as non-current.
v) Restricted Cash
Restricted cash includes cash balances which the Company does not have immediate access to as they have been pledged to counterparties as security for investments or trade obligations. These balances are available to the Company only upon settlement of the trade obligations for which they have been pledged as security.

Insurance Corporation of British Columbia
22
Insurance Corporation of British Columbia
2016/17 Annual Service Plan Report 52
3. Critical Accounting Estimates and Judgments
The Corporation makes estimates and judgments that affect the reported amounts of assets and liabilities. These are continually evaluated and based on historical experience and other facts, including expectations of future events that are believed to be reasonable under the circumstances. Management believes its estimates and judgments to be appropriate; however, actual results may be materially different and would be reflected in future periods.
Significant accounting estimates and judgments include:
a) Actuarial methods and assumptions
The Corporation typically employs three standard actuarial methods to analyze the ultimate claims costs, augmented by more in-depth analyses as needed:
The incurred development method; The paid development method; and The Bornhuetter-Ferguson method.
The standard methods call for a review of historical loss and count development patterns. As part of this review, the Corporation calculates loss and count development factors, which represent the period-to-period changes in a given loss year’s incurred loss amount. Based on an examination of the loss development factors, the Corporation’s Chief Actuary selects a best estimate of development factors that forecast future loss development.
The loss and count development factors rely on a selected baseline. The baseline for the majority of the coverages is the average of the most recent four loss years. The use of a baseline helps maintain consistency in the loss and count development factors from one reserve review to another. Circumstances may arise when the standard methods are no longer appropriate to use. In these cases, and in accordance with accepted actuarial practice, modifications to the methods are made or alternative methods are employed that are specific and appropriate to the circumstances. Circumstances may include a change in the claims settlement environment, a change in the handling or reserving of claims, or an emerging trend in the statistical data used in the analysis.
An additional method is employed to address the increasingly complex bodily injury claims environment, which includes a growing legal representation rate, a shifting frequency mix of bodily injury claims by severity of injury, and a slowdown in the settlement of claims. This additional method used legal status and severity of injury to separate bodily injury claims data into segments of similar complexity and is based on the Adler-Kline claim closure model. It has allowed the Corporation’s Chief Actuary to capture changes in the claim settlement rates within each segment, and changes in the mix of claims by segment, which impacts the bodily injury severity trend rate.
The timing of when the unpaid ultimate claims costs will be paid depends on both the line of business and historical data. Bodily injury lines of business generally take longer to settle than the material damage claims and exhibit greater variability as to the timing and amount ultimately paid to settle a claim. Historical patterns of claims payment data are used to estimate the future claims payment pattern. Expected future paid amounts are then discounted, using the discounted cash flow method, to
Statements and Schedules of Financial Information 2016/17
23
Insurance Corporation of British Columbia
2016/17 Annual Service Plan Report 53
determine a present value as of the reporting date. The discount rate is based upon the expected return on the Corporation’s current investment portfolio, the expected asset default risk of its investment portfolio, and assumptions for interest rates relating to reinvestment of maturing investments. These estimates are based on current market returns as well as expectations about future economic and financial developments.
A PfAD is then added to the estimate to recognize sources of uncertainty in the assumptions behind the provision for unpaid claims (note 2d). The PfAD is calculated according to accepted actuarial practice in Canada (note 13).
b) Impairment of financial assets
Judgment is required to determine if there is objective evidence of impairment for financial assets. The Corporation evaluates, among other factors, the financial health of the investee, industry and sector performance, changes in technology, financing and operational cash flows, and the significance of deterioration in the fair value of the asset below cost. In addition, for equity investments a prolonged decline is also considered objective evidence of impairment (note 10).
c) Pension and post-retirement benefits
The cost of pension and post-retirement benefits earned by employees is actuarially determined using the Projected Unit Credit Method and management’s best estimate of future compensation levels and healthcare costs.
The key assumptions used in calculating the cost of pension and post-retirement benefits are the discount rate, rate of compensation increase, inflation rate, life expectancies, Medical Services Plan trends, and extended healthcare cost trends. Together with plan member data, these and other assumptions are used to estimate future benefit eligibility, amount and duration of payments. The rate determined for each of the key assumptions is disclosed in note 16.
The discount rate is used to calculate the present value of the expected future benefit payments and to calculate interest on the net liability. The discount rate is based on high-grade corporate bond yields at the measurement date.
The rate of compensation increase reflects individual job progression, general price level increases, productivity, seniority, promotion, and other factors.
The inflation rate assumption is based on an assessment of historical data, the Bank of Canada target inflation range and the inflation expectations implied by the Government of Canada nominal and real return long-term bond yields.
Life expectancies are based on Canadian mortality tables, and contain a provision for future longevity improvements.
The Medical Services Plan trend rate is based on expected increases reflected in the provincial budget. The future potential cuts to Medical Service Premiums announced on February 21, 2017 as part of the 2017 B.C. provincial pre-election budget have not been reflected.
Insurance Corporation of British Columbia
24
Insurance Corporation of British Columbia
2016/17 Annual Service Plan Report 54
The extended healthcare trend rate is based on an analysis of plan experience, assumptions about the trend in total healthcare costs, and the proportion that will be covered by private plans.
With the exception of the discount rate, which is based on market conditions at the financial statement date, all other assumptions are management’s best estimate (note 16).
d) Significant influence
The Corporation owns more than 20% of the nominal voting interests in an investment in a limited partnership for real estate. The factors the Corporation considered in making the determination that the Corporation does not have significant influence include the following:
Each limited partner does not have control or power over the operations of this investment; The Corporation does not have voting power in the investment; The Investment Committee of this investment is responsible for overseeing the investing
activities. The Corporation does not have any influence over the Investment Committee; and Although the Corporation has one of five seats on the Governance Committee, the Governance
Committee itself has no power over the Investment Committee. The role of the GovernanceCommittee is to provide protective rights and is to ensure the investments are compliant withthe Statement of Investment Policy. Further, the Governance Committee does not have anyinfluence over the investing activities or over the management and operation of thepartnership.
e) Deferred Premium Acquisition Costs
IFRS 4 Insurance Contracts specifies “the financial reporting for insurance contracts by any entity that issues such contracts until the Board completes the second phase of its project on insurance contracts”. Until the new Insurance Contracts IFRS standard becomes effective, insurance companies follow the current IFRS 4 standard for reporting/disclosure guidelines and the former Canadian Generally Accepted Accounting Principles (GAAP) Accounting Guideline (AcG) 3 Financial Reporting by Property & Casualty Insurance Companies. AcG-3.6 states that Deferred Premium Acquisition Costs (DPAC) should be determined by reasonable groupings of business, consistent with an insurer's manner of acquiring, servicing and measuring the profitability of its business. Judgment is required to determine what would qualify as reasonable groupings of business.
Previously, Basic and Optional insurance were viewed as two separate lines of business: rates for each line were set independent of each other; profitability of each line was viewed independently; there were no income transfers between the lines of business; management of pricing and risks related to Basic and Optional insurance being separate business groupings. Therefore, they were classified as two business groupings under AcG-3.
Income transfers have now been initiated from Optional to Basic insurance to help keep Basic insurance rates as low as possible (note 22). Therefore, management has now determined that, effective January 1, 2016, a reasonable grouping of business is considered to be at the combined Corporate level. This results in calculating DPAC at a combined Corporate level as opposed to separate calculations for Basic and Optional insurance (note 18).
Statements and Schedules of Financial Information 2016/17
25
Insurance Corporation of British Columbia
2016/17 Annual Service Plan Report 55
4. New Accounting Pronouncements
a) Standards and interpretations effective for the period ended March 31, 2017
The Corporation has adopted the standards and interpretations that are relevant to the operations of the Corporation and effective for the 15 month period ended March 31, 2017. There were no material impacts from the adoption of new standards.
b) Standards and interpretations issued but not yet effective and not early adopted
Standards and interpretations issued that are relevant to the operations of the Corporation, but not yet effective include:
IFRS 9 Financial Instruments. Effective for annual periods beginning on or after January 1,2018; early adoption is permitted. IFRS 9 brings together the classification and measurement,impairment and hedge accounting to replace IAS 39 Financial Instruments: Recognition andMeasurement. IFRS 9 introduces a principles-based approach to the classification of financialassets based on an entity’s business model and the nature of the cash flows of the asset. Allfinancial assets, including hybrid contracts, are measured at FVTPL, fair value through OCI oramortized cost. For financial liabilities, IFRS 9 includes the requirements for classification andmeasurement previously included in IAS 39. IFRS 9 also introduces an expected lossimpairment model for all financial assets at amortized costs. The model has three stages: (1)on initial recognition, 12-month expected credit losses are recognized in profit or loss and aloss allowance is established; (2) if credit risk increases significantly and the resulting creditrisk is not considered to be low, full lifetime expected credit losses are recognized; and (3)when a financial asset is considered impaired, interest revenue is calculated based on thecarrying amount of the asset, net of the loss allowance, rather than its gross carrying amount.Finally, IFRS 9 introduces a new hedge accounting model that aligns the accounting for hedgerelationships more closely with an entity’s risk management activities, permits hedgeaccounting to be applied more broadly to a greater variety of hedging instruments and risksand requires additional disclosures. The Corporation will defer the implementation of IFRS 9until its fiscal period beginning April 1, 2021, as allowed under the amendments to IFRS 4Insurance Contracts outlined below.
IFRS 4 (Amendment) Insurance Contracts. Effective for annual periods beginning on or afterJanuary 1, 2018. The amendments introduce two approaches to address concerns about thediffering effective dates of IFRS 9 Financial Instruments and the forthcoming new insurancecontracts standard: the overlay approach and the deferral approach. The overlay approachprovides an option for all issuers of insurance contracts to adjust profit or loss for eligiblefinancial assets by removing any additional accounting volatility that may arise from applyingIFRS 9 before the new insurance contracts standard. The deferral approach providescompanies whose activities are predominantly related to insurance an optional temporaryexemption from applying IFRS 9 until January 1, 2021. By adopting the new insurancestandard and IFRS 9 conjunctively, there will not be any unintended interactions that mayresult from accounting mismatches. The Corporation will defer IFRS 9 until the fiscal period

Insurance Corporation of British Columbia
26
Insurance Corporation of British Columbia
2016/17 Annual Service Plan Report 56
beginning April 1, 2021. The Corporation will be evaluating the impact of this amendment on its consolidated financial statements.
IFRS 15 Revenue Recognition. Effective for annual periods beginning on or after January 1,2018; early adoption is permitted. The standard establishes a comprehensive framework fordetermining how much and when revenue is recognized. It replaces existing revenuerecognition guidance. IFRS 15 contains a scope exception which excludes insurance contractswithin the scope of IFRS 4. The Corporation has performed an impact analysis and does notexpect the standard to have a material impact to the consolidated financial statements.
IFRS 17 Insurance Contracts. Effective for annual periods beginning on or after January 1,2021. Early adoption is permitted for entities that apply IFRS 9 and IFRS 15 on or before theinitial application of IFRS 17. The standard establishes the principles of recognition,measurement, presentation and disclosure of insurance contracts and supersedes IFRS 4. Thestandard was issued in May 2017 and requires all insurance contracts to be accounted for in aconsistent manner, benefiting both investors and insurance companies. Insurance obligationswill be accounted for using current values, instead of historical cost. The information will beupdated regularly, providing more useful information to users of financial statements. TheCorporation will be evaluating the impact of this standard on its consolidated financialstatements.
IFRS 16 Leases. Effective for annual periods beginning on or after January 1, 2019; earlyadoption permitted. IFRS 16 was issued in January 2016 and is intended to replace IAS 17Leases, and related IFRICs. The standard provides a single lessee accounting model, requiringlessees to recognize assets and liabilities for all leases unless the lease term is 12 months orless or the underlying asset has a low value. Lessor accounting will remain largely unchangedwith previous classifications of operating and finance lease being maintained. The Corporationis in the process of evaluating the impact of this standard on its consolidated financialstatements.
IAS 7 (Amendment) Statement of Cash Flows. Effective for annual periods beginning on orafter January 1, 2017. A disclosure initiative amendment to IAS 7 was issued in January 2017to add additional disclosure requirements regarding changes in liabilities arising fromfinancing activities. As the amendments are for additional disclosure only, the adoption ofthese amendments is not expected to have a material impact to the Corporation’s consolidatedfinancial statements.
IAS 40 (Amendment) Investment Properties. Effective for annual periods beginning on orafter January 1, 2018. The amendment clarified that to transfer to, or from, investmentproperties there must be a change in use. To conclude if a property has changed use thereshould be an assessment of whether the property meets the definition. This change must besupported by evidence. A change in intention, in isolation, is not enough to support a transfer.The adoption of this amendment is not expected to have a material impact to the Corporation’sconsolidated financial statements.
The Corporation has not early adopted these standards.
Statements and Schedules of Financial Information 2016/17
27
Insurance Corporation of British Columbia
2016/17 Annual Service Plan Report 57
5. Investments
a) Financial investments
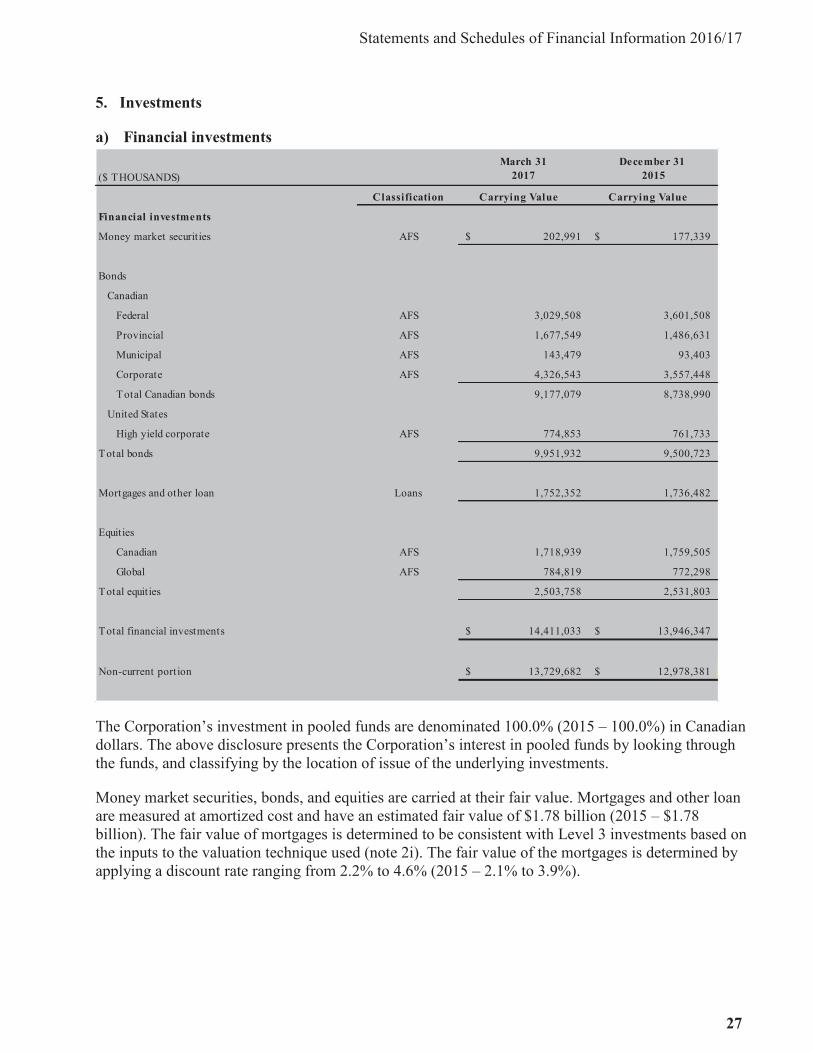
The Corporation’s investment in pooled funds are denominated 100.0% (2015 – 100.0%) in Canadian dollars. The above disclosure presents the Corporation’s interest in pooled funds by looking through the funds, and classifying by the location of issue of the underlying investments.
Money market securities, bonds, and equities are carried at their fair value. Mortgages and other loan are measured at amortized cost and have an estimated fair value of $1.78 billion (2015 – $1.78 billion). The fair value of mortgages is determined to be consistent with Level 3 investments based on the inputs to the valuation technique used (note 2i). The fair value of the mortgages is determined by applying a discount rate ranging from 2.2% to 4.6% (2015 – 2.1% to 3.9%).
($ THOUSANDS)March 31
2017December 31
2015
Classification Carrying Value Carrying Value
Financial investments
Money market securities AFS 202,991$ 177,339$
Bonds
Canadian
Federal AFS 3,029,508 3,601,508
Provincial AFS 1,677,549 1,486,631
Municipal AFS 143,479 93,403
Corporate AFS 4,326,543 3,557,448
Total Canadian bonds 9,177,079 8,738,990
United States
High yield corporate AFS 774,853 761,733
Total bonds 9,951,932 9,500,723
Mortgages and other loan Loans 1,752,352 1,736,482
Equities
Canadian AFS 1,718,939 1,759,505
Global AFS 784,819 772,298
Total equities 2,503,758 2,531,803
Total financial investments 14,411,033$ 13,946,347$
Non-current portion 13,729,682$ 12,978,381$

Insurance Corporation of British Columbia
28
Insurance Corporation of British Columbia
2016/17 Annual Service Plan Report 58
Pooled fundsThe Corporation invests in several pooled funds; the investment strategies of some of these funds include the use of leverage. As at March 31, 2017, the Corporation’s interests range from 8.7% to 94.1% (2015 – 20.4% to 95.7%) of the net assets of the respective funds. The funds are managed by unrelated asset managers. The Corporation holds redeemable units in each of the pooled funds that entitle the holder to a proportional share in the respective fund’s net assets. The carrying value of the Corporation’s investments in pooled funds as at March 31, 2017 is $1.88 billion (2015 – $2.35billion).
Pooled fund investments are included in financial investments as equities. The change in fair value of each pooled fund is included in the OCI section within the consolidated statement of comprehensive loss in ‘Net change in available for sale financial assets’.
The Corporation’s maximum loss exposure from its interests in the pooled funds is equal to the total fair value of these investments.
Asset-backed securitiesThe Corporation purchases bonds that are secured by various assets as part of its investment strategy. The majority of the bonds are issued by Canadian corporate entities and are secured by credit card, auto, or equipment receivables. The Corporation invests mainly in securitization trusts with AAA rated securities that have a first lien on assets and have no exposure to junior or subordinate tranches. The weighted-average duration of the asset-backed securities in the Corporation’s portfolio is 2.5 years (2015 – 2.5 years) and the coupon interest rates range from 1.2% to 2.8% (2015 – 1.1% to 3.5%).
As at March 31, 2017, the carrying value of asset-backed securities included in financial investments in the consolidated statement of financial position is $482.9 million (2015 – $495.2 million). This amount also represents the maximum exposure to losses at that date.
The Corporation also has mortgage backed securities with a carrying value of $72.5 million (2015 –$74.3 million) with an estimated fair value of $76.5 million (2015 – $79.0 million). These mortgage bonds are included in financial investments as mortgages and each bond is secured by a first priority mortgage charge on a Class A real estate property. The fixed interest rates on the mortgage backed securities range from 3.0% to 4.9% (2015 – 3.0% to 4.9%) and the mortgages will mature between one to seven years.

Statements and Schedules of Financial Information 2016/17
29
Insurance Corporation of British Columbia
2016/17 Annual Service Plan Report 59
b) Investment properties
The movement in the carrying value of investment properties is as follows:
The fair value of investment properties is $1.35 billion (2015 – $1.03 billion) and has been categorized as a Level 3 investment based on the inputs to the valuation technique used. As at March 31, 2017 and December 31, 2015, the estimated fair value is based on independent appraisals, either full appraisals or interim update appraisals, by professionally qualified external valuators.
Two investment properties were reclassified to assets held for sale as the Corporation has entered into contracts to sell these properties in the next fiscal period.
c) Lease income
The Corporation leases out its investment properties. As of March 31, 2017, the future minimum lease income under non-cancellable leases over the next five years and beyond is as follows:
($ THOUSANDS)March 31
2017December 31
2015
Cost
Balance, beginning of period 874,357$ 703,786$
Additions 320,000 159,255
Capital improvements 9,677 5,660
Reclassification (34,225) -
Acquisitions in progress 412 3,092
Impairment reversal 1,345 2,564
Balance, end of period 1,171,566 874,357
Accumulated depreciation
Balance, beginning of period 102,174 84,965
Depreciation 29,356 17,209
Reclassification (8,513) -
Balance, end of period 123,017 102,174
Carrying value, end of period 1,048,549$ 772,183$
($ THOUSANDS)
Lease IncomeNet Present
Value Lease IncomeNet Present
Value
Up to 1 year 60,576$ 58,955$ 49,785$ 48,354$
Greater than 1 year, up to 5 years 155,688 142,522 136,376 124,285
Greater than 5 years 104,611 88,897 73,921 58,737
320,875$ 290,374$ 260,082$ 231,376$
March 312017
December 312015

Insurance Corporation of British Columbia
30
Insurance Corporation of British Columbia
2016/17 Annual Service Plan Report 60
6. Entities with Non-Controlling Interest (NCI)
The following table presents the summarized financial information for the NCI in the Corporation’s Canadian limited partnership subsidiaries. The amounts disclosed are based on those amounts included in the consolidated financial statements before inter-company eliminations. In 2015, the table represents NCI for the Corporation’s Canadian limited partnership subsidiary and the Fund.
In May 2016, the Corporation ceased to control the Fund. The Fund is no longer consolidated and the Corporation’s remaining ownership is measured at fair value and recorded as an equity investment. A gain of $32.5 million was recorded as investment income as a result of the cessation of control (note 10).
($ THOUSANDS)
Canadian Limited
Partnership I
Canadian Limited
Partnership IICanadian
Pooled Fund Total
March 31, 2017
NCI percentage 10.0% 10.0% 0.0%
Revenue $ 13,731 -$ $ 2,524 $ 16,255
Expenses 10,809 203 12,343 23,355
Net income (loss) 2,922 (203) (9,819) (7,100)
Other comprehensive income - - 20,402 20,402
Total other comprehensive income (loss) $ 2,922 $ (203) $ 10,583 $ 13,302
Net income (loss) attributable to NCI $ 292 $ (20) $ (422) $ (150)
O ther comprehensive income attributable to NCI -$ -$ 877$ 877$
Current assets $ 6,846 -$ -$ $ 6,846
Non-current assets 110,732 171,115 - 281,847
Current liabilities (1,134) - - (1,134)
Non-current liabilities - (91,850) - (91,850)
Net assets $ 116,444 $ 79,265 -$ 195,709 Net assets attributable to NCI 11,644$ 7,927$ -$ 19,571$

Statements and Schedules of Financial Information 2016/17
31
Insurance Corporation of British Columbia
2016/17 Annual Service Plan Report 61
7. Financial Assets and Liabilities
a) Fair value hierarchy
The following table presents the fair value hierarchy for financial assets and liabilities measured at fair value in the consolidated statement of financial position. During fiscal 2016/17 and 2015, there were no transfers between Level 1, Level 2 and Level 3. The Corporation’s policy is to recognize transfers into and out of fair value hierarchy levels as of the date of the event or change in circumstances that caused the transfer.
($ THOUSANDS)
Canadian Limited
PartnershipCanadian
Pooled Fund Total
December 31, 2015
NCI percentage 10.0% 4.3%
Revenue $ 3,426 $ 10,927 $ 14,353
Expenses 2,632 4,558 7,190
Net income 794 6,369 7,163
Other comprehensive loss - (20,402) (20,402)
Total other comprehensive income (loss) $ 794 $ (14,033) $ (13,239)
Net income attributable to NCI $ 79 $ 274 $ 353
O ther comprehensive loss attributable to NCI -$ (877)$ (877)$
Current assets 1,252$ -$ 1,252$
Non-current assets 114,545 580,777 695,322
Current liabilities (934) - (934)
Net assets 114,863 580,777 695,640Net assets attributable to NCI 11,486$ 24,974$ 36,460$
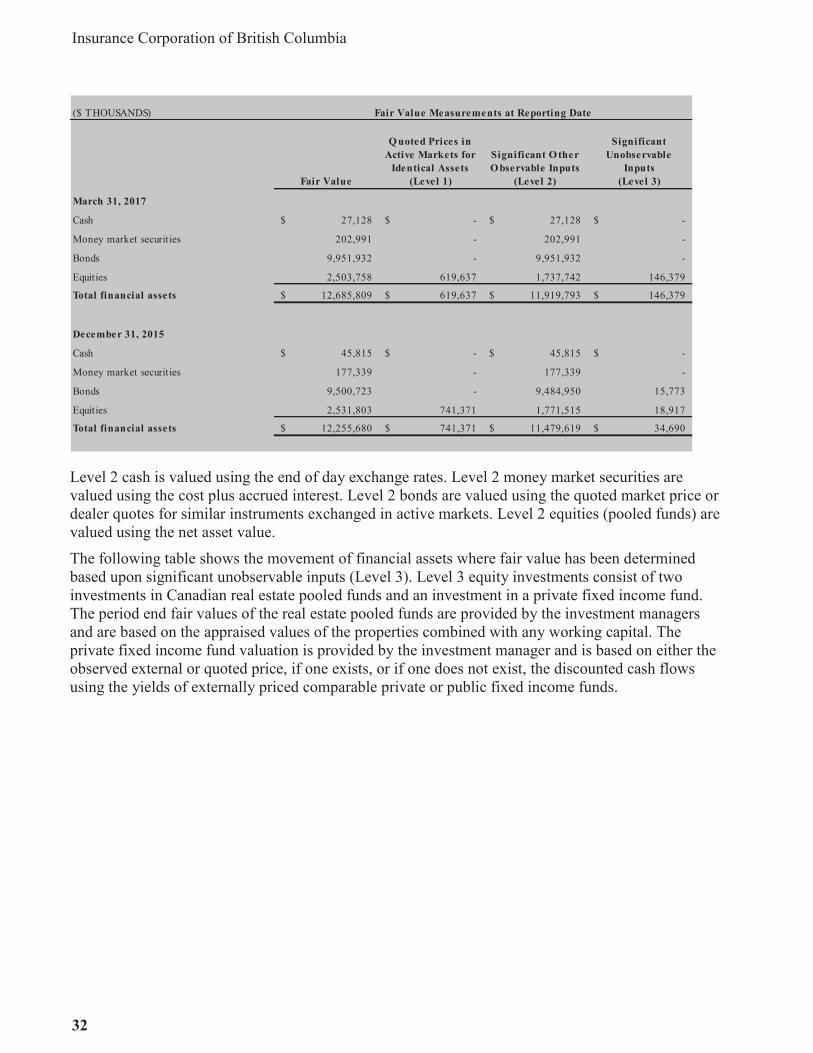
Insurance Corporation of British Columbia
32
Insurance Corporation of British Columbia
2016/17 Annual Service Plan Report 62
Level 2 cash is valued using the end of day exchange rates. Level 2 money market securities are valued using the cost plus accrued interest. Level 2 bonds are valued using the quoted market price or dealer quotes for similar instruments exchanged in active markets. Level 2 equities (pooled funds) are valued using the net asset value.
The following table shows the movement of financial assets where fair value has been determined based upon significant unobservable inputs (Level 3). Level 3 equity investments consist of two investments in Canadian real estate pooled funds and an investment in a private fixed income fund. The period end fair values of the real estate pooled funds are provided by the investment managers and are based on the appraised values of the properties combined with any working capital. The private fixed income fund valuation is provided by the investment manager and is based on either the observed external or quoted price, if one exists, or if one does not exist, the discounted cash flows using the yields of externally priced comparable private or public fixed income funds.
($ THOUSANDS)
Fair Value
Q uoted Prices in Active Markets for
Identical Assets (Level 1)
Significant O ther O bservable Inputs
(Level 2)
Significant Unobservable
Inputs (Level 3)
March 31, 2017
Cash 27,128$ -$ 27,128$ -$
Money market securities 202,991 - 202,991 -
Bonds 9,951,932 - 9,951,932 -
Equities 2,503,758 619,637 1,737,742 146,379
Total financial assets 12,685,809$ 619,637$ 11,919,793$ 146,379$
December 31, 2015
Cash 45,815$ -$ 45,815$ -$
Money market securities 177,339 - 177,339 -
Bonds 9,500,723 - 9,484,950 15,773
Equities 2,531,803 741,371 1,771,515 18,917
Total financial assets 12,255,680$ 741,371$ 11,479,619$ 34,690$
Fair Value Measurements at Reporting Date

Statements and Schedules of Financial Information 2016/17
33
Insurance Corporation of British Columbia
2016/17 Annual Service Plan Report 63
The fair value of derivative instruments not designated as accounting hedges is as follows:
Beginning May 2016, the Corporation entered into contracts for derivative instruments not designated as accounting hedges, and a loss of $32.8 million (2015 – no derivative instrument) was recognized in investment income for the period ended March 31, 2017 with respect to foreign currency forward contracts on the US bond portfolio. These economic hedges offset $24.3 million in foreign exchange currency gains (2015 – no derivative instrument) recorded with respect to the US bond portfolio for the period ended March 31, 2017.
The non-designated derivative financial instruments are classified as Level 2 and are valued based on the difference between the forward rate at the contract initiation date and the prevailing forward rate on the reporting date.
b) Other financial assetsOther financial assets include accrued interest, premiums and other receivables, and reinsurance assets. The fair values of the majority of other financial assets approximate their carrying values due to their short-term nature. The non-current portion of these other financial assets is $45.6 million (2015 – $40.0 million).
($ THOUSANDS)
Bonds Equities
March 31, 2017
Balance, beginning of period 15,773$ 18,917$
Additions - 121,113
Principal repayments (15,773) -
Market value adjustment - 6,349
Balance, end of period -$ 146,379$
December 31, 2015
Balance, beginning of period 1,638$ 16,100$
Additions 25,000 2,817
Principal repayments (10,865) -
Balance, end of period 15,773$ 18,917$
Fair Value Measurements using Level 3 Inputs
($ THOUSANDS)Notional Fair Value Notional Fair Value Amount Liabilities Amount Liabilities
Non-designated derivative instruments
Forward contracts 412,396$ 10,499$ -$ -$
Interest rate swap 91,850 203 - -
Total derivative financial instrument liabilities 504,246$ 10,702$ -$ -$
March 312017
December 312015
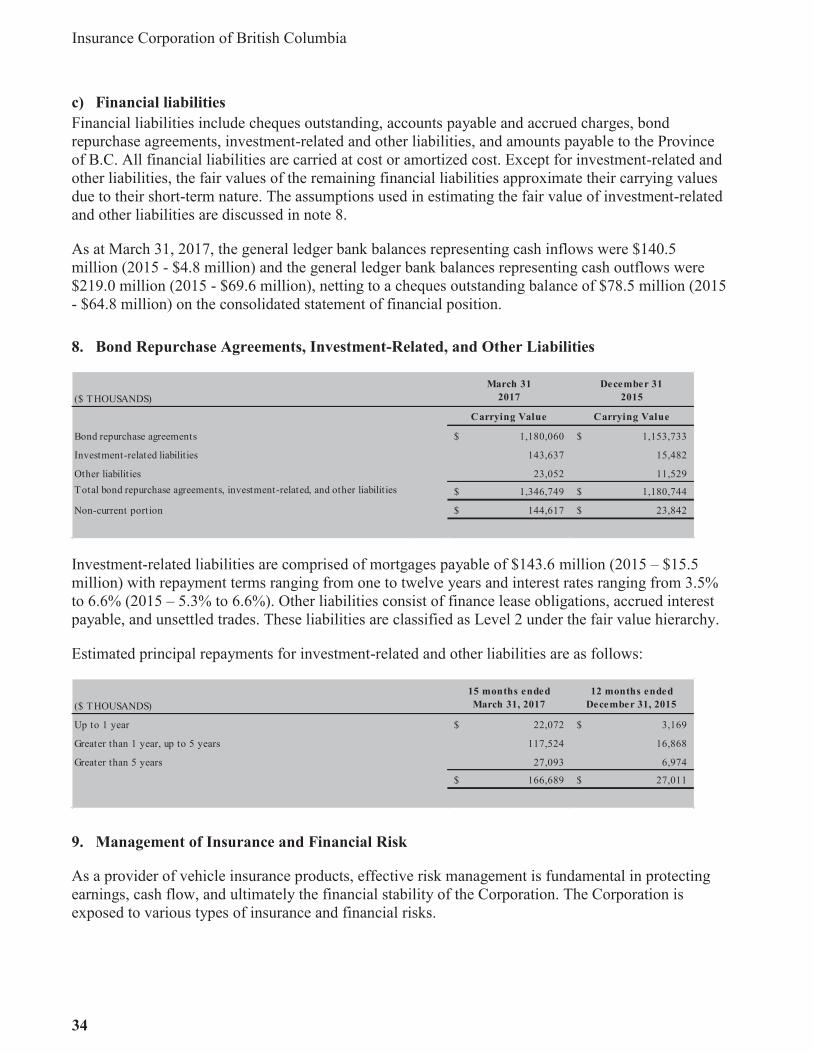
Insurance Corporation of British Columbia
34
Insurance Corporation of British Columbia
2016/17 Annual Service Plan Report 64
c) Financial liabilitiesFinancial liabilities include cheques outstanding, accounts payable and accrued charges, bond repurchase agreements, investment-related and other liabilities, and amounts payable to the Province of B.C. All financial liabilities are carried at cost or amortized cost. Except for investment-related and other liabilities, the fair values of the remaining financial liabilities approximate their carrying values due to their short-term nature. The assumptions used in estimating the fair value of investment-related and other liabilities are discussed in note 8.
As at March 31, 2017, the general ledger bank balances representing cash inflows were $140.5 million (2015 - $4.8 million) and the general ledger bank balances representing cash outflows were $219.0 million (2015 - $69.6 million), netting to a cheques outstanding balance of $78.5 million (2015 - $64.8 million) on the consolidated statement of financial position.
8. Bond Repurchase Agreements, Investment-Related, and Other Liabilities
Investment-related liabilities are comprised of mortgages payable of $143.6 million (2015 – $15.5million) with repayment terms ranging from one to twelve years and interest rates ranging from 3.5% to 6.6% (2015 – 5.3% to 6.6%). Other liabilities consist of finance lease obligations, accrued interest payable, and unsettled trades. These liabilities are classified as Level 2 under the fair value hierarchy.
Estimated principal repayments for investment-related and other liabilities are as follows:
9. Management of Insurance and Financial Risk
As a provider of vehicle insurance products, effective risk management is fundamental in protecting earnings, cash flow, and ultimately the financial stability of the Corporation. The Corporation is exposed to various types of insurance and financial risks.
($ THOUSANDS)March 31
2017December 31
2015
Carrying Value Carrying Value
Bond repurchase agreements 1,180,060$ 1,153,733$
Investment-related liabilities 143,637 15,482
Other liabilities 23,052 11,529Total bond repurchase agreements, investment-related, and other liabilities 1,346,749$ 1,180,744$
Non-current portion 144,617$ 23,842$
($ THOUSANDS)15 months ended March 31, 2017
12 months ended December 31, 2015
Up to 1 year 22,072$ 3,169$
Greater than 1 year, up to 5 years 117,524 16,868
Greater than 5 years 27,093 6,974
166,689$ 27,011$
Statements and Schedules of Financial Information 2016/17
35
Insurance Corporation of British Columbia
2016/17 Annual Service Plan Report 65
a) Insurance risk
The risk under any one insurance contract is the possibility that the insured event occurs and the uncertainty of the amount of the resulting claim. By the very nature of an insurance contract, this risk is random and therefore unpredictable.
The principal risk that the Corporation faces under its insurance contracts is that the actual claims and benefit payments exceed the carrying amount of the insurance liabilities. This could occur when the frequency or severity of claims and benefits are greater than estimated. Insurance events have an element of randomness and the actual number and amount of claims and benefits will vary each year from the level established using statistical techniques.
Frequency and severity of claims There are a number of factors that influence the frequency and severity of claims, some of which the Corporation has some control over. Frequency is the average number of claims per policy, calculated by dividing the total number of claims by the total number of policies. Severity is the average cost of a claim calculated by dividing the total cost of claims by the total number of claims. A number of strategies are used to control cost pressures created by these factors, including claims operational changes, road safety programs, programs to influence driver behaviour such as impaired driving and distracted driving programs, public awareness campaigns, auto crime reduction initiatives, and fraud detection and investigation.
Factors that impact both frequency and severity that the Corporation has little or no control over include: weather, demographics, court issued settlement awards, plaintiff legal fees, and economic changes, including vehicle parts/repair inflation and medical expense inflation that influence the cost of claims.
Sources of uncertainty in the estimation of the provision for unpaid claims To manage the uncertainty associated with estimating the provision for unpaid claims, the Corporation’s Chief Actuary employs standard actuarial methods. The Corporation’s provision for unpaid claims estimate is determined in accordance with accepted actuarial practice in Canada and is based on reasonable assumptions and appropriate methods that are consistently applied (note 3a).
There is inherent uncertainty regarding the assumptions to estimate the amount and timing of future claims payments that make up the provision for unpaid claims. The Corporation is liable for all insured events that occurred during the term of the contract, even if the loss is reported after the end of the contract term. In addition, injury claims may take a long period of time to settle.
Injury claims include bodily injury, accident benefits, and death benefits, which account for approximately 65% (2015 – 67%) of total claims costs. The timing of injury claims can be extended due to delayed reporting, and the timing and amount of injury payments can exhibit considerable uncertainty because of the complex bodily injury claims environment, the subjective nature of pain and suffering damages, internal claims operational changes, the judicial environment, and settlement awards.
Insurance Corporation of British Columbia
36
Insurance Corporation of British Columbia
2016/17 Annual Service Plan Report 66
The provision for unpaid claims also includes having to estimate direct expenses to be incurred in settling claims net of the expected salvage and subrogation recoveries. The Corporation takes all reasonable steps to ensure that it has appropriate information regarding its individual claims. However, given the uncertainty during the early stages of a claim, it is likely that the final outcome will be different from the original estimate. The provision for unpaid claims includes a provision for reported claims not yet paid and an amount estimated for IBNR claims (note 2d).
The Corporation’s provision for unpaid claims can be affected by the frequency and severity of claims, the discount rate, and actuarial methods and assumptions. The frequency and severity of claims are discussed above, while the discount rate and the actuarial methods and assumptions are discussed in note 3.
A one percentage point increase in the discount rate would have a favourable impact on the provision for unpaid claims, net income, and equity of $252.8 million (2015 – $214.1 million), and a one percentage point decrease in the discount rate would have an unfavourable impact on the provision for unpaid claims, net income, and equity of $266.7 million (2015 – $225.7 million). A one percentage point change in the cost of unpaid claims, with all other variables held constant, would result in an estimated change to the provision for unpaid claims of $105.0 million (2015 – $90.8 million). The changes in selected loss and count development factors and actuarial assumptions in 2016/17 had an estimated 0.9% unfavourable impact (2015 – 1.0% unfavourable) on the 2016/17 provision for unpaid claims. This impact includes an actuarial methodology change on the unallocated loss adjustment expense (ULAE) reserve (note 13).
Concentration of insurance risk The Corporation has a diverse customer base as the sole provider of Basic insurance to all drivers in British Columbia. The Corporation operates in one jurisdiction and provides vehicle insurance only, so there is a concentration of insurance risk with respect to geography, jurisdiction, demographics, and product type.
The impact of the concentration of insurance risk is quantified through CAT (catastrophe) modeling that the Corporation’s reinsurance broker updates annually. This testing allows the Corporation to assess and manage these risks effectively. The concentration of insurance risk is also managed through a CAT reinsurance treaty, a casualty reinsurance treaty, and road safety programs such as road improvement strategies, the graduated licensing program, and the distracted driving campaign because as the sole provider of Basic insurance, the Corporation invests in and benefits the most from these programs.
Premium pricing risk The Corporation is the sole provider of Basic insurance and is not subject to competition risk for its Basic insurance product. However, the Basic insurance rate level is sensitive to investment market conditions and claims experience, which can result in premiums being insufficient to cover costs. The Corporation is subject to regulations over its Basic insurance and applies to BCUC for approval to change its Basic insurance rate. The Corporation is required to make Basic insurance rate applications on an annual basis, and BCUC is required to set rates according to accepted actuarial practice. These aspects of regulation mitigate the underwriting risk associated with pricing for the Basic insurance product (note 22).

Statements and Schedules of Financial Information 2016/17
37
Insurance Corporation of British Columbia
2016/17 Annual Service Plan Report 67
The Province of B.C. directs income transfers from Optional insurance to Basic insurance in order to keep Basic rates as low as possible. Also, the Province of B.C. may direct capital transfers from Optional insurance to bolster Basic insurance capital.
Regulation establishes the rate smoothing framework that allows for the use of capital to remove adverse rate volatility. As a result of the framework, the Corporation’s ability to set rates to cover costs can be impacted by BCUC setting rates below cost for a period of time. An independent review has been commissioned by the Corporation’s Board, tasked with examining all key cost drivers impacting the affordability and sustainability of Basic insurance rates, and potential mitigation strategies. Subject to the changes arising from the independent review and the other initiatives, the Corporation’s capital may continue to face added risk (note 22).
The Corporation’s Optional insurance products compete with other insurers and are subject to underwriting risk and competition risk.
b) Financial risk
Concentration of financial riskThe Corporation establishes investment portfolio level targets and limits with the objective of ensuring that portfolios are diversified across asset classes and individual investment risks. The Corporation monitors actual investment positions and risk exposures for concentration risk.
As at March 31, 2017, the equity portfolio was 27.9% (2015 – 31.2%) invested in the financial sector, 15.0% (2015 – 13.7%) in the energy sector, and 11.3% (2015 – 10.4%) in the industrial sector. The bond portfolio was 48.7% (2015 – 54.5%) invested in the government sector and 23.1% (2015 – 20.3%) invested in the financial sector. See credit risk for a discussion of the government bonds.
Concentration of geographical riskGeographical concentration risks are a result of the Corporation having investments from around the world. These risks include varying general economic conditions, political conditions, and other factors that could affect the fair value and liquidity of the investments. The Corporation has contracted external investment managers to manage its global investments in diversified global funds. As at March 31, 2017, the investment portfolio was 89.2% (2015 – 89.0%) invested in Canada, 8.78% (2015 – 8.78%) invested in the United States, and 2.0% (2015 – 2.2%) was invested elsewhere around the world.
Price riskGeneral economic conditions, political conditions, and other factors affect the equity markets, thereby also affecting the fair value of the securities and the pooled funds held by the Corporation. Fluctuations in the value of these securities impact the recognition of unrealized gains and losses on equity securities and on the units of funds held. As at March 31, 2017, the impact of a 10 per cent change in prices, with all other variables held constant, would result in an estimated corresponding change to OCI of approximately $250.3 million (2015 – $253.2 million).

Insurance Corporation of British Columbia
38
Insurance Corporation of British Columbia
2016/17 Annual Service Plan Report 68
The Corporation manages a widely diversified portfolio, diversified geographically, by sector, and by company, and has policies in place to limit and monitor total equity exposure and individual issuer exposure.
Interest rate risk
When interest rates increase or decrease, the market value of fixed income securities will decrease or increase respectively with a larger market value impact on instruments with a long duration compared to instruments with a short duration. Fluctuations in interest rates have a direct impact on the market valuation of the Corporation’s fixed income portfolio. A natural hedge exists between the Corporation’s fixed income portfolio and the provision for unpaid claims, as the Corporation’s investment yields are used to derive the discount rate for the provision for unpaid claims (note 9a).
The Corporation has policies in place to limit and monitor its exposure to interest rate risk to allow for duration matching of claim liabilities to bond assets.
The carrying values reported in the consolidated statement of financial position for cash and cash equivalents, premiums and other receivables, and accounts payable and accrued charges approximate their fair values and are not significantly impacted by fluctuations in interest rates.
In 2016/17, the Corporation did not use material (2015 – nil) derivative financial instruments to hedge interest rate risk on its investment portfolio.
As at March 31, 2017, a 100 basis point change in interest rates would result in a change of approximately $337.9 million (2015 – $294.8 million) in fair value of the Corporation’s fixed income portfolio and a corresponding impact of approximately $337.9 million (2015 – $294.8million) to OCI. Interest rate changes would also result in an inverse change to the provision for unpaid claims and the corresponding claims costs (note 9a).
Average Yield(%)
Duration (Years)
Average Yield(%)
Duration (Years)
Bonds
Canadian
Federal 1.1 3.2 0.9 2.5
Provincial 1.4 2.9 1.7 2.9
Municipal 1.6 2.5 1.8 3.0
Corporate 1.9 2.6 2.1 2.2
United States
High yield corporate 5.9 4.1 8.2 4.5
Total bonds 1.9 2.9 2.1 2.6
Mortgages and other loan 3.5 2.6 3.7 2.7
Total bonds, mortgages and other loan 2.1 2.9 2.3 2.6
March 312017
December 312015
Statements and Schedules of Financial Information 2016/17
39
Insurance Corporation of British Columbia
2016/17 Annual Service Plan Report 69
Credit riskCredit risk is the potential for financial loss to the Corporation if the counterparty in a transaction fails to meet its obligations. Financial instruments that potentially give rise to concentrations of credit risk include cash and cash equivalents, fixed income securities, accounts receivable, reinsurance receivables and recoverables, and structured settlements (note 21a). The total credit risk exposure is $10.24 billion (2015 – $9.05 billion).
Fixed income securitiesFixed income securities are comprised of Canadian investment grade bonds, US high yield corporate bonds, and mortgages. The Corporation mitigates its overall exposure to credit risk in its fixed income securities by holding the majority of its fixed income portfolio in investment grade bonds, and by limiting its exposure to US high yield bonds to a maximum of 6% (2015 –6%) of total investment assets and mortgages to a maximum of 14% (2015 – 14%) of total investment assets. The Corporation further limits the risk in its high yield corporate bonds by holding bonds that are rated B or better for at least 95% of the high yield bond portfolio. All high yield bonds are analyzed by external investment professionals who manage the portfolio for the Corporation. Credit risk in mortgages is mitigated by the security of the underlying mortgaged property. Mortgages are subject to an independent review annually. The risk is also addressed through a stringent underwriting process that incorporates an internal credit scoring mechanism.
The credit quality of financial assets that are neither past due nor impaired can be assessed by reference to external credit ratings, where available, or to historical information about counterparty default rates.
The maximum credit risk exposure for fixed income securities pertain to all bond investments and to mortgage investments; however the Corporation considers Canadian government bonds to be risk-free. Therefore, the total carrying amount is $8.67 billion (2015 – $7.64 billion). There is minimal credit risk exposure to cash.
The counterparty risk associated with repurchase agreements for 2016/17 and 2015 is not material.
The Corporation’s money market securities and bonds by credit quality according to Standard and Poor’s are as follows:

Insurance Corporation of British Columbia
40
Insurance Corporation of British Columbia
2016/17 Annual Service Plan Report 70
Premiums and other receivablesThe Corporation has a diverse customer base as it provides Basic insurance to all drivers in British Columbia. While there is no significant individual concentration of credit risk, the Corporation’s premiums and other receivables are comprised of customers with varying financial conditions.
The credit risk for premiums receivables is mitigated as a customer’s policy may be cancelled if the customer is in default of a payment. The maximum credit risk for all other receivables equals their carrying amount. As at March 31, 2017, the Corporation considered $64.1 million (2015 –$60.2 million) of its premiums and other receivables to be uncollectible and has provided for them. The allowance was determined by applying a percentage derived from four to five years of collection experience by receivable type to the total of current and prior periods’ gross billings.
The following table outlines the aging of premiums and other receivables as at March 31, 2017 and at December 31, 2015:
($ THOUSANDS)March 31
2017December 31
2015
Money market securities
AAA 202,991$ 177,339$
Bonds
AAA 3,881,943$ 4,448,306$
AA 1,201,331 923,511
A 2,943,512 2,566,890
BBB 1,175,212 817,586
Below BBB 749,934 744,430
9,951,932$ 9,500,723$
($ THOUSANDS)
CurrentPast Due
1 – 30 daysPast Due
31 – 60 daysO ver
60 days Total
March 31, 2017
Premiums and other receivables 1,427,302$ 4,094$ 3,401$ 85,003$ 1,519,800$
Provision (1,785) (1,490) (1,441) (59,408) (64,124)
Total premiums and other receivables 1,425,517$ 2,604$ 1,960$ 25,595$ 1,455,676$
December 31, 2015
Premiums and other receivables 1,277,446$ 2,635$ 2,389$ 79,353$ 1,361,823$
Provision (1,304) (1,365) (1,370) (56,136) (60,175)
Total premiums and other receivables 1,276,142$ 1,270$ 1,019$ 23,217$ 1,301,648$
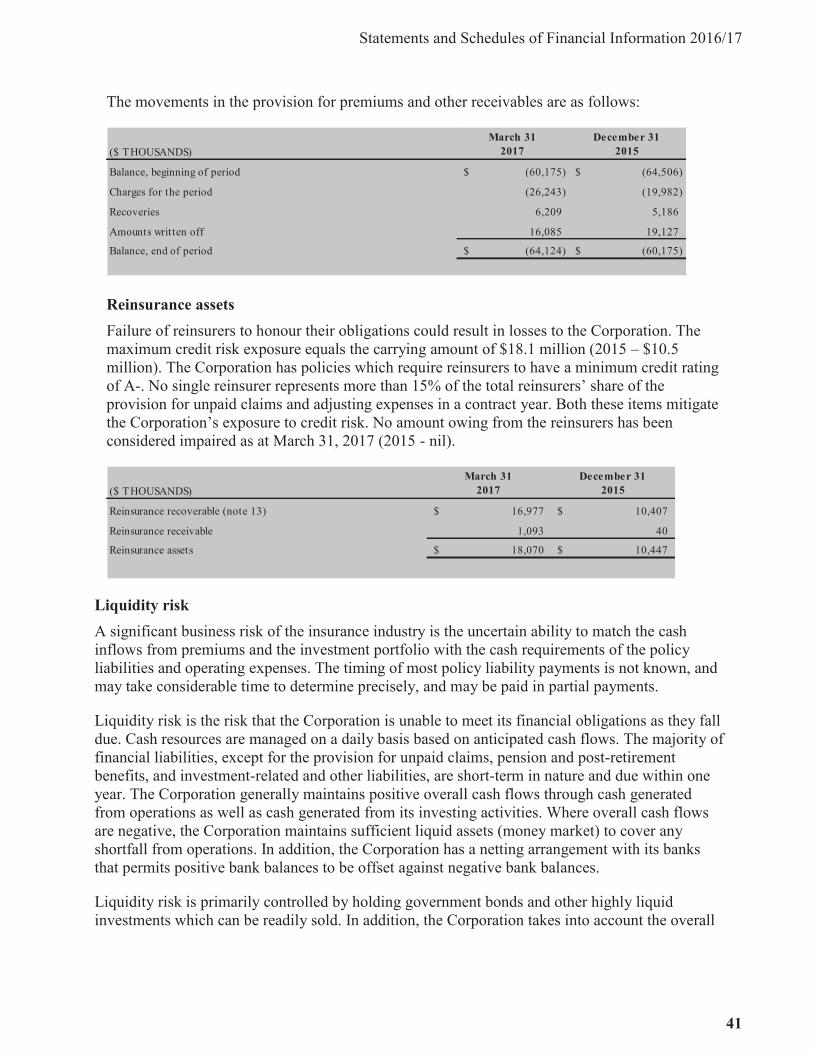
Statements and Schedules of Financial Information 2016/17
41
Insurance Corporation of British Columbia
2016/17 Annual Service Plan Report 71
The movements in the provision for premiums and other receivables are as follows:
Reinsurance assets Failure of reinsurers to honour their obligations could result in losses to the Corporation. The maximum credit risk exposure equals the carrying amount of $18.1 million (2015 – $10.5 million). The Corporation has policies which require reinsurers to have a minimum credit rating of A-. No single reinsurer represents more than 15% of the total reinsurers’ share of the provision for unpaid claims and adjusting expenses in a contract year. Both these items mitigate the Corporation’s exposure to credit risk. No amount owing from the reinsurers has been considered impaired as at March 31, 2017 (2015 - nil).
Liquidity risk A significant business risk of the insurance industry is the uncertain ability to match the cash inflows from premiums and the investment portfolio with the cash requirements of the policy liabilities and operating expenses. The timing of most policy liability payments is not known, and may take considerable time to determine precisely, and may be paid in partial payments.
Liquidity risk is the risk that the Corporation is unable to meet its financial obligations as they fall due. Cash resources are managed on a daily basis based on anticipated cash flows. The majority of financial liabilities, except for the provision for unpaid claims, pension and post-retirement benefits, and investment-related and other liabilities, are short-term in nature and due within one year. The Corporation generally maintains positive overall cash flows through cash generated from operations as well as cash generated from its investing activities. Where overall cash flows are negative, the Corporation maintains sufficient liquid assets (money market) to cover any shortfall from operations. In addition, the Corporation has a netting arrangement with its banks that permits positive bank balances to be offset against negative bank balances.
Liquidity risk is primarily controlled by holding government bonds and other highly liquid investments which can be readily sold. In addition, the Corporation takes into account the overall
($ THOUSANDS)March 31
2017December 31
2015
Balance, beginning of period (60,175)$ (64,506)$
Charges for the period (26,243) (19,982)
Recoveries 6,209 5,186
Amounts written off 16,085 19,127
Balance, end of period (64,124)$ (60,175)$
($ THOUSANDS)March 31
2017December 31
2015
Reinsurance recoverable (note 13) 16,977$ 10,407$
Reinsurance receivable 1,093 40
Reinsurance assets 18,070$ 10,447$

Insurance Corporation of British Columbia
42
Insurance Corporation of British Columbia
2016/17 Annual Service Plan Report 72
historical liability settlement pattern and the historical cash in-flows as a basis to broadly define diversification and duration characteristics of the investment portfolio.
The following table summarizes the maturity profile of the Corporation’s fixed income investments by contractual maturity or expected cash flow dates:
Currency riskCurrency risk is the risk that the fair value or future cash flows of a financial instrument will fluctuate because of changes in foreign exchange rates. The Corporation is exposed to direct foreign exchange risk on its US fixed income portfolios. However, this is partially mitigated through the use of economic hedges using foreign exchange forward contracts (note 7). A 10% change in the US exchange rate as at March 31, 2017 would change the fair value of these investments and result in a change to net income of approximately $39.1 million (2015 – $76.2million) related to the unhedged monetary AFS financial assets.
($ THOUSANDS)
Within O ne Year
O ne Yearto Five Years
AfterFive Years Total
March 31, 2017
Bonds
Canadian
Federal 10,115$ 2,891,340$ 128,053$ 3,029,508$
Provincial - 1,677,549 - 1,677,549
Municipal - 143,479 - 143,479
Corporate 187,746 4,065,062 73,735 4,326,543
United States
High yield corporate 3,465 186,780 584,608 774,853
Total bonds 201,326 8,964,210 786,396 9,951,932
Mortgages and other loan 277,034 1,426,941 48,377 1,752,352
478,360$ 10,391,151$ 834,773$ 11,704,284$
December 31, 2015
Bonds
Canadian
Federal 29,999$ 3,506,305$ 65,204$ 3,601,508$
Provincial 19,771 1,449,972 16,888 1,486,631
Municipal - 93,403 - 93,403
Corporate 531,988 3,006,300 19,160 3,557,448
United States
High yield corporate 1,883 179,338 580,512 761,733
Total bonds 583,641 8,235,318 681,764 9,500,723
Mortgages and other loan 206,986 1,398,444 131,052 1,736,482
790,627$ 9,633,762$ 812,816$ 11,237,205$
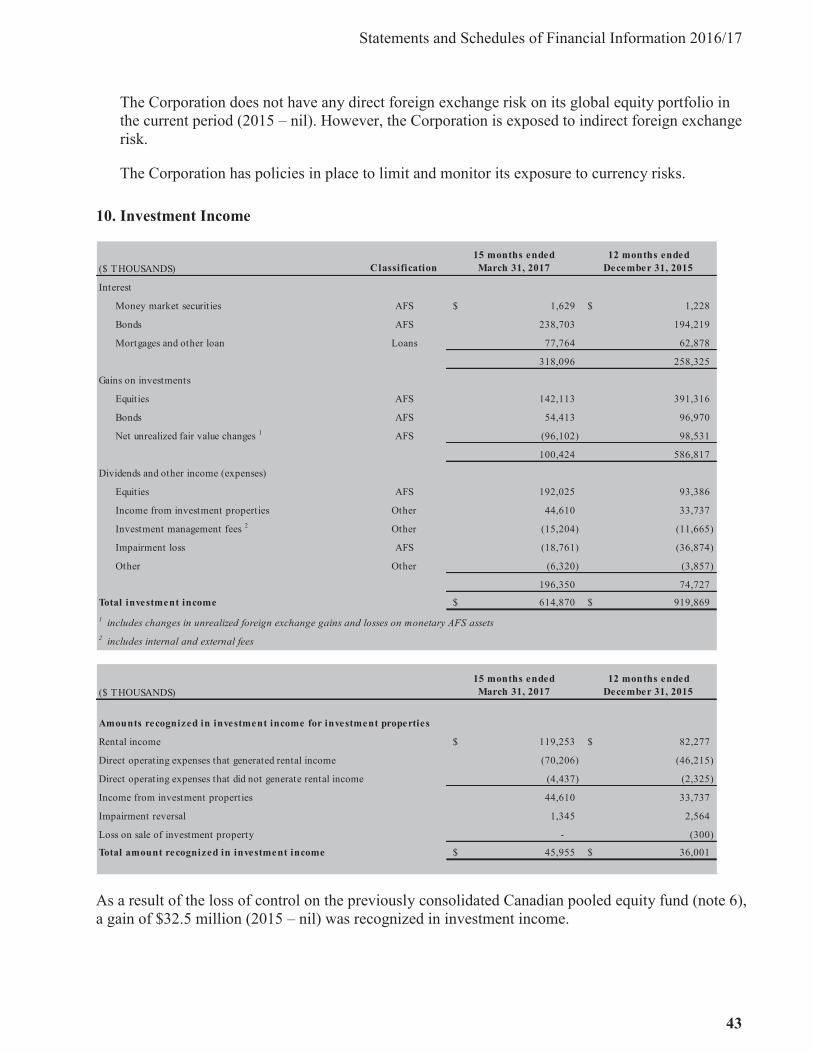
Statements and Schedules of Financial Information 2016/17
43
Insurance Corporation of British Columbia
2016/17 Annual Service Plan Report 73
The Corporation does not have any direct foreign exchange risk on its global equity portfolio in the current period (2015 – nil). However, the Corporation is exposed to indirect foreign exchange risk.
The Corporation has policies in place to limit and monitor its exposure to currency risks.
10. Investment Income
As a result of the loss of control on the previously consolidated Canadian pooled equity fund (note 6), a gain of $32.5 million (2015 – nil) was recognized in investment income.
($ THOUSANDS) Classification15 months ended March 31, 2017
12 months ended December 31, 2015
Interest
Money market securities AFS 1,629$ 1,228$
Bonds AFS 238,703 194,219
Mortgages and other loan Loans 77,764 62,878
318,096 258,325
Gains on investments
Equities AFS 142,113 391,316
Bonds AFS 54,413 96,970
Net unrealized fair value changes 1 AFS (96,102) 98,531
100,424 586,817
Dividends and other income (expenses)
Equities AFS 192,025 93,386
Income from investment properties Other 44,610 33,737
Investment management fees 2 Other (15,204) (11,665)
Impairment loss AFS (18,761) (36,874)
Other Other (6,320) (3,857)
196,350 74,727
Total investment income 614,870$ 919,869$ 1 includes changes in unrealized foreign exchange gains and losses on monetary AFS assets2 includes internal and external fees
($ THOUSANDS)15 months ended March 31, 2017
12 months ended December 31, 2015
Amounts recognized in investment income for investment properties
Rental income 119,253$ 82,277$
Direct operating expenses that generated rental income (70,206) (46,215)
Direct operating expenses that did not generate rental income (4,437) (2,325)
Income from investment properties 44,610 33,737
Impairment reversal 1,345 2,564
Loss on sale of investment property - (300)
Total amount recognized in investment income 45,955$ 36,001$

Insurance Corporation of British Columbia
44
Insurance Corporation of British Columbia
2016/17 Annual Service Plan Report 74
As at March 31, 2017, the ‘Net change in available for sale financial assets’ portion of other components of equity (OCE) is comprised of $166.2 million (2015 – $115.3 million) in unrealized gains and $66.2 million (2015 – $167.4 million) in unrealized losses.
11. Property and Equipment
The balances in property and equipment include $14.0 million (2015 – $13.9 million) in assets under development.
Property and equipment includes a net disposal of $1.7 million (2015 – $0.2 million) related to the Transformation Program (note 20).
($ THOUSANDS) Land BuildingsFurniture & Equipment
Leasehold Improvements Total
March 31, 2017
Cost
Balance, beginning of period 30,734$ 165,190$ 112,367$ 9,872$ 318,163$
Additions 25 5,466 12,521 5,603 23,615
Disposals - (392) (7,691) - (8,083)
Balance, end of period 30,759 170,264 117,197 15,475 333,695
Accumulated depreciation
Balance, beginning of period - 138,143 71,618 4,969 214,730
Disposals - - (7,691) - (7,691)
Depreciation charge for the period - 3,729 14,760 1,881 20,370
Balance, end of period - 141,872 78,687 6,850 227,409
Net book value, end of period 30,759$ 28,392$ 38,510$ 8,625$ 106,286$
December 31, 2015
Cost
Balance, beginning of period 30,885$ 164,973$ 99,722$ 8,987$ 304,567$
Additions 27 2,504 13,659 885 17,075
Disposals (178) (2,287) (1,014) - (3,479)
Balance, end of period 30,734 165,190 112,367 9,872 318,163
Accumulated depreciation
Balance, beginning of period - 136,627 58,820 3,539 198,986
Disposals - (1,488) (658) - (2,146)
Depreciation charge for the period - 3,004 13,456 1,430 17,890
Balance, end of period - 138,143 71,618 4,969 214,730
Net book value, end of period 30,734$ 27,047$ 40,749$ 4,903$ 103,433$

Statements and Schedules of Financial Information 2016/17
45
Insurance Corporation of British Columbia
2016/17 Annual Service Plan Report 75
12. Intangible Assets
The Corporation’s intangible assets consist of externally purchased software and any directly attributable costs required to bring the software to a condition where it is available for use.
The balance in intangible assets include $4.1 million (2015 – $156.6 million) in assets under development.
The additions in intangible assets include $31.7 million (2015 – $52.7 million) related to the Transformation Program (note 20). There were no indefinite life intangible assets as at March 31, 2017 and December 31, 2015.
($ THOUSANDS)March 31
2017December 31
2015
Cost
Balance, beginning of period 356,675$ 280,233$
Additions 57,991 76,777
Disposals (1,251) (335)
Balance, end of period 413,415 356,675
Accumulated amortization
Balance, beginning of period 77,120 57,931
Disposals (561) (335)
Amortization charge for the period 34,348 19,524
Balance, end of period 110,907 77,120
Net book value, end of period 302,508$ 279,555$

Insurance Corporation of British Columbia
46
Insurance Corporation of British Columbia
2016/17 Annual Service Plan Report 76
13. Provision for Unpaid Claims
The movements in the provision for unpaid claims and reinsurance recoveries and their impact on claims incurred for the period are as follows:
The Corporation discounts its provision for unpaid claims using a discount rate of 2.8% (2015 –3.0%). The Corporation determines the discount rate based upon the expected return on its investment portfolio, the expected asset default risk of its investment portfolio, and uses assumptions for interest rates relating to reinvestment of maturing investments. As a result of the decrease in the discount rate, there was an unfavourable adjustment to both current and prior periods’ provision of $54.2 million (2015 – $22.5 million unfavourable).
During 2016/17, the Corporation refined its ULAE reserve methodology for the additional cost of increased injury claims staffing. The impact of this change to the 2016/17 fiscal loss year net
($ THOUSANDS)
GrossReinsurance Recoverable Net Gross
Reinsurance Recoverable Net
Notified claims 5,343,964$ (10,407)$ 5,333,557$ 4,661,581$ (8,655)$ 4,652,926$
Incurred but not reported 3,749,176 - 3,749,176 3,543,851 - 3,543,851
Balance, beginning of period 9,093,140 (10,407) 9,082,733 8,205,432 (8,655) 8,196,777
Change in liabilit ies (assets):
Provision for claims occurring in the current period 5,662,515 (2,823) 5,659,692 3,798,193 - 3,798,193
Change in estimates for losses occurring in prior periods:
Prior periods' claims adjustments 298,086 (7,004) 291,082 229,276 (1,682) 227,594
Prior periods' changes in discounting provision 16,020 (437) 15,583 16,871 (411) 16,460
314,106 (7,441) 306,665 246,147 (2,093) 244,054
Net claims incurred per consolidated statement of comprehensive income 5,976,621 (10,264) 5,966,357 4,044,340 (2,093) 4,042,247
Cash (paid) recovered for claims settled in the period for:
Claims incurred in current period (1,866,522) - (1,866,522) (1,199,596) - (1,199,596)
Recoveries received on current period claims 104,468 - 104,468 66,401 - 66,401
(1,762,054) - (1,762,054) (1,133,195) - (1,133,195)
Claims incurred in prior periods (2,868,384) - (2,868,384) (2,089,324) - (2,089,324)
Recoveries received on prior periods' claims 78,648 3,694 82,342 65,887 341 66,228
(2,789,736) 3,694 (2,786,042) (2,023,437) 341 (2,023,096)
Total net payments (4,551,790) 3,694 (4,548,096) (3,156,632) 341 (3,156,291)Balance, end of period 10,517,971$ (16,977)$ 10,500,994$ 9,093,140$ (10,407)$ 9,082,733$
Notified claims 6,874,682$ (16,977)$ 6,857,705$ 5,343,964$ (10,407)$ 5,333,557$
Incurred but not reported 3,643,289 - 3,643,289$ 3,749,176 - 3,749,176Balance, end of period 10,517,971$ (16,977)$ 10,500,994$ 9,093,140$ (10,407)$ 9,082,733$
March 312017
December 312015
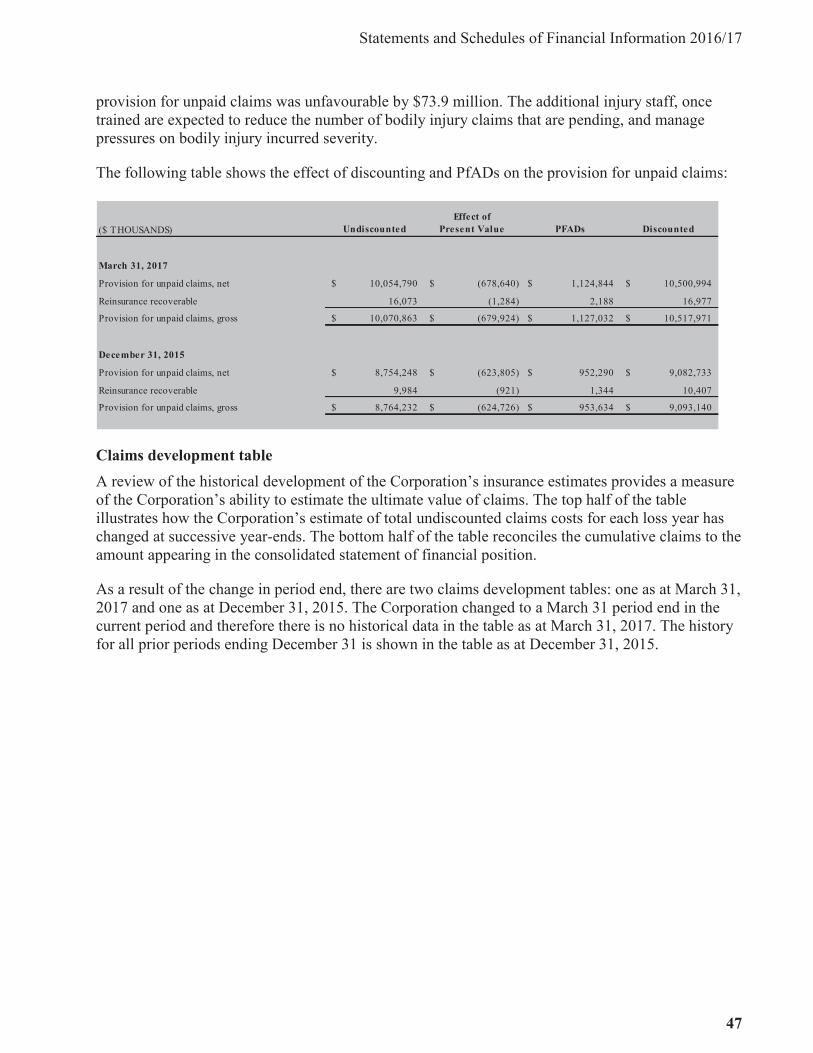
Statements and Schedules of Financial Information 2016/17
47
Insurance Corporation of British Columbia
2016/17 Annual Service Plan Report 77
provision for unpaid claims was unfavourable by $73.9 million. The additional injury staff, once trained are expected to reduce the number of bodily injury claims that are pending, and manage pressures on bodily injury incurred severity.
The following table shows the effect of discounting and PfADs on the provision for unpaid claims:
Claims development table A review of the historical development of the Corporation’s insurance estimates provides a measure of the Corporation’s ability to estimate the ultimate value of claims. The top half of the table illustrates how the Corporation’s estimate of total undiscounted claims costs for each loss year has changed at successive year-ends. The bottom half of the table reconciles the cumulative claims to the amount appearing in the consolidated statement of financial position.
As a result of the change in period end, there are two claims development tables: one as at March 31, 2017 and one as at December 31, 2015. The Corporation changed to a March 31 period end in the current period and therefore there is no historical data in the table as at March 31, 2017. The history for all prior periods ending December 31 is shown in the table as at December 31, 2015.
($ THOUSANDS) UndiscountedEffect of
Present Value PFADs Discounted
March 31, 2017
Provision for unpaid claims, net 10,054,790$ (678,640)$ 1,124,844$ 10,500,994$
Reinsurance recoverable 16,073 (1,284) 2,188 16,977
Provision for unpaid claims, gross 10,070,863$ (679,924)$ 1,127,032$ 10,517,971$
December 31, 2015
Provision for unpaid claims, net 8,754,248$ (623,805)$ 952,290$ 9,082,733$
Reinsurance recoverable 9,984 (921) 1,344 10,407
Provision for unpaid claims, gross 8,764,232$ (624,726)$ 953,634$ 9,093,140$

Insurance Corporation of British Columbia
48
Insurance Corporation of British Columbia
2016/17 Annual Service Plan Report 78
Claims development table as at March 31, 2017:
The cumulative payments for the 15 month period ended March 31, 2017 are $1.76 billion, which consists of the cumulative payments for the 12 month period ended March 31, 2017 (in the above table) and the cumulative payments for the three month period from January 1, 2016 to March 31, 2016 of $0.41 billion.
The table above reflects the total discounted provision for unpaid claims of $10.52 billion before the amount for reinsurance recoverable. The total discounted provision for unpaid claims after the amount for reinsurance recoverable of $0.02 billion would be $10.5 billion.
($ THOUSANDS)
Fiscal Loss Year* 2008 2009 2010 2011 2012 2013 2014 2015 2016 2017 Total
Estimate of undiscounted ultimate claims costs:
- At end of fiscal loss year 4,372,966$
- One year later 4,037,775$
- Two years later 3,695,574$
- Three years later 3,313,949$
- Four years later 3,042,291$
- Five years later 2,837,869$
- Six years later 2,863,073$
- Seven years later 2,677,669$
- Eight years later 2,710,932$
- Nine years later 2,591,256$
Current estimate of cumulative claims 2,591,256 2,710,932 2,677,669 2,863,073 2,837,869 3,042,291 3,313,949 3,695,574 4,037,775 4,372,966 32,143,354Cumulative payments to date (2,559,428) (2,642,522) (2,586,952) (2,675,283) (2,523,493) (2,392,418) (2,162,628) (1,938,918) (1,797,593) (1,348,594) (22,627,829)
Undiscounted provision for unpaid claims 31,828$ 68,410$ 90,717$ 187,790$ 314,376$ 649,873$ 1,151,321$ 1,756,656$ 2,240,182$ 3,024,372$ 9,515,525$
139,237$
416,101
10,070,863$
Discounting adjustment 447,108
Total discounted provision for unpaid claims (gross) 10,517,971$
*Fiscal Loss Year refers to the 12 month period ended March 31
Insurance Claims - Gross of Reinsurance
Undiscounted provision for unpaid claims in respect of 2007 and prior years
Undiscounted unallocated loss adjustment expense reserve
Total undiscounted provision for unpaid claims

Statements and Schedules of Financial Information 2016/17
49
Insurance Corporation of British Columbia
2016/17 Annual Service Plan Report 79
Claims development table as at December 31, 2015:
The cumulative payments for the 12 month period ended December 31, 2015 are $1.13 billion. The table above reflects the total discounted provision for unpaid claims as at December 31, 2015 of $9.09 billion before the amount for reinsurance recoverable. The total discounted provision for unpaid claims after the amount for reinsurance recoverable of $0.01 billion would be $9.08 billion.
The expected maturity of the provision for unpaid claims is analyzed below (undiscounted and gross of reinsurance):
The non-current portion of the undiscounted provision for unpaid claims is $7.31 billion (2015 - $6.42billion).
The weighted-average term to settlement of the discounted provision for unpaid claims as at March 31, 2017 is 2.5 years (2015 – 2.5 years).
($ THOUSANDS)
Accident Year 2006 2007 2008 2009 2010 2011 2012 2013 2014 2015 Total
Estimate of undiscounted ultimate claims costs:
- At end of accident year 2,578,431$ 2,709,658$ 2,676,918$ 2,657,831$ 2,743,503$ 2,866,833$ 3,030,779$ 3,146,388$ 3,372,304$ 3,765,040$
- One year later 2,598,087 2,647,830 2,682,830 2,640,001 2,732,070 2,863,942 3,065,562 3,194,080 3,518,858
- Two years later 2,517,961 2,651,655 2,692,277 2,626,760 2,730,183 2,830,063 2,985,690 3,200,324
- Three years later 2,513,261 2,632,885 2,654,416 2,587,367 2,699,473 2,815,440 3,024,045
- Four years later 2,508,005 2,633,582 2,621,457 2,594,054 2,779,267 2,841,115
- Five years later 2,498,790 2,623,784 2,641,489 2,656,694 2,778,347
- Six years later 2,496,837 2,612,371 2,676,603 2,639,312
- Seven years later 2,491,614 2,614,214 2,712,010
- Eight years later 2,499,350 2,613,146
- Nine years later 2,502,510
Current estimate of cumulative claims 2,502,510 2,613,146 2,712,010 2,639,312 2,778,347 2,841,115 3,024,045 3,200,324 3,518,858 3,765,040 29,594,707Cumulative payments to date (2,471,704) (2,572,228) (2,608,751) (2,494,717) (2,456,903) (2,224,008) (1,981,022) (1,717,805) (1,524,464) (1,133,195) (21,184,797)
Undiscounted provision for unpaid claims 30,806$ 40,918$ 103,259$ 144,595$ 321,444$ 617,107$ 1,043,023$ 1,482,519$ 1,994,394$ 2,631,845$ 8,409,910$
125,350
228,972
8,764,232$
Discounting adjustment 328,908
9,093,140$
Insurance Claims - Gross of Reinsurance
Undiscounted unallocated loss adjustment expense reserve
Undiscounted provision for unpaid claims in respect of 2005 and prior years
Total undiscounted provision for unpaid claims
Total discounted provision for unpaid claims (gross)
($ THOUSANDS)
Less than One Year
One toTwo Years
Two to Three Years
Three toFour Years
Four to Five Years
Over FiveYears Total
March 31, 2017 2,764,809$ 2,324,378$ 1,568,492$ 1,292,585$ 890,677$ 1,229,922$ 10,070,863$
December 31, 2015 2,349,180$ 1,895,885$ 1,616,192$ 1,227,851$ 730,170$ 944,954$ 8,764,232$

Insurance Corporation of British Columbia
50
Insurance Corporation of British Columbia
2016/17 Annual Service Plan Report 80
14. Unearned Premiums
All unearned premiums are earned within 12 months of the reporting date. The movements in unearned premiums net of reinsurance and the impact on premiums earned for the period are as follows:
15. Reinsurance
The Corporation maintains casualty and catastrophe reinsurance to protect against significant losses.
The Corporation entered into twelve months casualty and catastrophe reinsurance contracts beginning January 1, 2017, 2016 and 2015 as follows:
a) For both 2016 and 2017 calendar years, for catastrophic occurrences, portions of losses up to$225.0 million (2015 – $225.0 million) in excess of $25.0 million (2015 – $25.0 million); and
b) For both 2016 and 2017 calendar years, for individual casualty loss occurrences, portions oflosses up to $45.0 million (2015 – $45.0 million) in excess of $5.0 million (2015 – $5.0million).
These reinsurance arrangements do not discharge the Corporation’s obligation as primary insurer. The Corporation evaluates the financial condition of its reinsurers to minimize the exposure to significant loss from reinsurer insolvency.
($ THOUSANDS)March 31
2017December 31
2015
Balance, beginning of period 2,210,364$ 2,021,458$
Premiums written during the period 6,253,099 4,636,837
Premiums earned during the period (6,050,642) (4,447,931)
Premium adjustment 1,682 -
Balance, end of period 2,414,503$ 2,210,364$

Statements and Schedules of Financial Information 2016/17
51
Insurance Corporation of British Columbia
2016/17 Annual Service Plan Report 81
16. Pension and Post-Retirement Benefits
Plan information
The Corporation sponsors a defined benefit registered pension plan for its current and former management and confidential employees (the Management and Confidential Plan). Subject to the terms of the plan, the Management and Confidential Plan provides benefits to members based on their length of service and eligible earnings in the best five years of plan membership. Employees are required to contribute to the Management and Confidential Plan. In addition, it sponsors two supplemental pension plans for certain employees. The Corporation is the legal administrator of the Management and Confidential Plan and the two supplemental pension plans. Subject to the terms of the plans, pensions are indexed in line with increases in the Consumer Price Index (CPI).
The Corporation also contributes to two other defined benefit pension plans for which it is not the sole sponsor. Current and former employees of the Corporation who are or were members of the Canadian Office & Professional Employees Union (COPE) Local 378 are members of the COPE 378/Insurance Corporation of British Columbia Pension Plan (COPE Plan). Half of the Trustees of the COPE Plan are appointed by the Corporation and the other half by COPE Local 378. The Board of Trustees of the COPE Plan is the legal plan administrator. The COPE Plan provides benefits to members based on their length of service and eligible earnings in the best five years of plan membership. Subject to the terms of the plan, pensions are indexed in line with increases in the CPI. The Corporation’s former Motor Vehicle Branch employees participate in the BC Public Service Pension Plan. The Corporation has no fiduciary responsibility for, or role in the governance of, the COPE Plan or the BC Public Service Pension Plan.
The Management and Confidential Plan, COPE Plan, and the BC Public Service Pension Plan are subject to the statutory requirements (including minimum funding requirements) of the British Columbia Pension Benefits Standards Act (PBSA) and the Income Tax Act (Canada). Each plan’s pace of funding is set out in their respective funding policies.
The Corporation pays Medical Services Plan premiums, life insurance premiums, extended healthcare, and dental costs as post-retirement benefits for its qualifying retirees. The benefits are not prefunded. Benefit entitlements differ for management and confidential and bargaining unit employees, as stated within the terms of the plans.
The Corporation measures its defined benefit obligations and the fair value of plan assets for accounting purposes each period as at the end of the Corporation’s fiscal period. Defined benefit obligations are extrapolated from the most recent actuarial valuation date for each of the plans. The Management and Confidential Plan and the post-retirement benefits actuarial valuations are as of December 31, 2015 and the COPE Plan is as of December 31, 2014. Updated actuarial valuations for each plan will be as of no later than three years from their most recent actuarial valuation date.
On its consolidated statement of financial position, the Corporation derecognizes its portion of anysurplus assets held by the COPE Plan because it cannot realize a future economic benefit in respect of those assets.
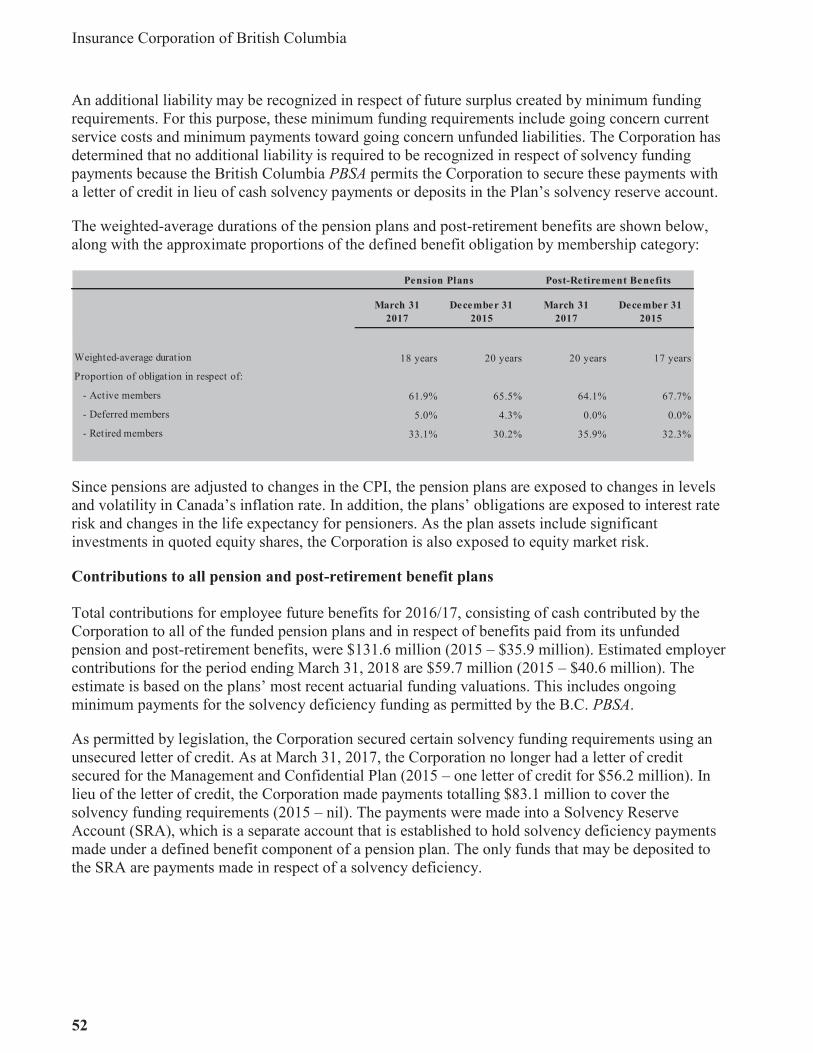
Insurance Corporation of British Columbia
52
Insurance Corporation of British Columbia
2016/17 Annual Service Plan Report 82
An additional liability may be recognized in respect of future surplus created by minimum funding requirements. For this purpose, these minimum funding requirements include going concern current service costs and minimum payments toward going concern unfunded liabilities. The Corporation has determined that no additional liability is required to be recognized in respect of solvency funding payments because the British Columbia PBSA permits the Corporation to secure these payments with a letter of credit in lieu of cash solvency payments or deposits in the Plan’s solvency reserve account.
The weighted-average durations of the pension plans and post-retirement benefits are shown below, along with the approximate proportions of the defined benefit obligation by membership category:
Since pensions are adjusted to changes in the CPI, the pension plans are exposed to changes in levels and volatility in Canada’s inflation rate. In addition, the plans’ obligations are exposed to interest rate risk and changes in the life expectancy for pensioners. As the plan assets include significant investments in quoted equity shares, the Corporation is also exposed to equity market risk.
Contributions to all pension and post-retirement benefit plans
Total contributions for employee future benefits for 2016/17, consisting of cash contributed by the Corporation to all of the funded pension plans and in respect of benefits paid from its unfunded pension and post-retirement benefits, were $131.6 million (2015 – $35.9 million). Estimated employer contributions for the period ending March 31, 2018 are $59.7 million (2015 – $40.6 million). The estimate is based on the plans’ most recent actuarial funding valuations. This includes ongoing minimum payments for the solvency deficiency funding as permitted by the B.C. PBSA.
As permitted by legislation, the Corporation secured certain solvency funding requirements using an unsecured letter of credit. As at March 31, 2017, the Corporation no longer had a letter of credit secured for the Management and Confidential Plan (2015 – one letter of credit for $56.2 million). In lieu of the letter of credit, the Corporation made payments totalling $83.1 million to cover the solvency funding requirements (2015 – nil). The payments were made into a Solvency Reserve Account (SRA), which is a separate account that is established to hold solvency deficiency payments made under a defined benefit component of a pension plan. The only funds that may be deposited to the SRA are payments made in respect of a solvency deficiency.
March 312017
December 312015
March 312017
December 312015
Weighted-average duration 18 years 20 years 20 years 17 years
Proportion of obligation in respect of:
- Active members 61.9% 65.5% 64.1% 67.7%
- Deferred members 5.0% 4.3% 0.0% 0.0%
- Retired members 33.1% 30.2% 35.9% 32.3%
Pension Plans Post-Retirement Benefits

Statements and Schedules of Financial Information 2016/17
53
Insurance Corporation of British Columbia
2016/17 Annual Service Plan Report 83
Financial information
These consolidated financial statements include the asset and liabilities of all plans sponsored by the Corporation. The amounts recorded on the statement of financial position are as follows:
One of the pension plans is in a net asset position and, as a result, that plan is required to be reported as an asset on the consolidated statement of financial position. The net total liability for all of the Corporation’s pension plans and post-retirement benefits as at March 31, 2017 is $373.1 million (2015 – $479.0 million), which is reflected in the consolidated statement of financial position as a $37.3 million asset and a $410.4 million liability as illustrated in the table above.
($ THOUSANDS)March 31
2017December 31
2015March 31
2017December 31
2015March 31
2017December 31
2015
Assets
Accrued pension benefits 37,302$ -$ -$ -$ 37,302$ -$
Liabilities
Pension and post-retirement benefits (60,945) (141,238) (349,451) (337,796) (410,396) (479,034)Net total liability (23,643)$ (141,238)$ (349,451)$ (337,796)$ (373,094)$ (479,034)$
Pension Plans Post-Retirement Benefits Total

Insurance Corporation of British Columbia
54
Insurance Corporation of British Columbia
2016/17 Annual Service Plan Report 84
Information regarding the pension plans and post-retirement benefits is as follows:
The net total expense for the pension plans and post-retirement benefits is $103.7 million (2015 – $76.2 million). In addition, the Corporation contributed $0.7 million in 2016/17 (2015 – $0.7 million) to the BC Public Service Pension Plan.
($ THOUSANDS)March 31
2017December 31
2015March 31
2017December 31
2015
Plan assetsFair value, beginning of period 1,883,824$ 1,799,375$ -$ -$ Interest on plan assets 93,963 71,957 - -
Actuarial gain on assets 88,557 27,852 - -
Employer contributions 123,397 28,497 7,451 6,672
Employee contributions 27,170 21,314 - -
Benefits paid (80,237) (64,271) (7,451) (6,672)
Non-investment expenses (750) (900) - -
Fair value, end of period 2,135,924 1,883,824 - -
Defined benefit obligation
Balance, beginning of period 2,025,062 1,876,248 337,796 320,166
Current service cost 88,966 67,082 14,481 11,182
Interest cost 103,328 76,712 17,278 13,120
Remeasurements on obligation
- due to changes in financial assumptions 23,430 - 14,560 -
- due to changes in demographic assumptions - 4,394 20,029 -
- due to participant experience (982) 64,897 (47,242) -
Benefits paid (80,237) (64,271) (7,451) (6,672)
Balance, end of period 2,159,567 2,025,062 349,451 337,796
Funded status – plans in deficit (60,945) (141,238) (349,451) (337,796) Funded status – plan in surplus 37,302 - - - Net funded status (23,643) (141,238) (349,451) (337,796)
Impact of surplus derecognition - - - - Net total liability (23,643)$ (141,238)$ (349,451)$ (337,796)$
Impact of surplus derecognition
Impact, beginning of period -$ (11,162)$ -$ -$
Interest on surplus derecognition - (446) - -
Remeasurements on surplus derecognition - 11,608 - - Impact, end of period -$ -$ -$ -$
Pension Plans Post-Retirement Benefits
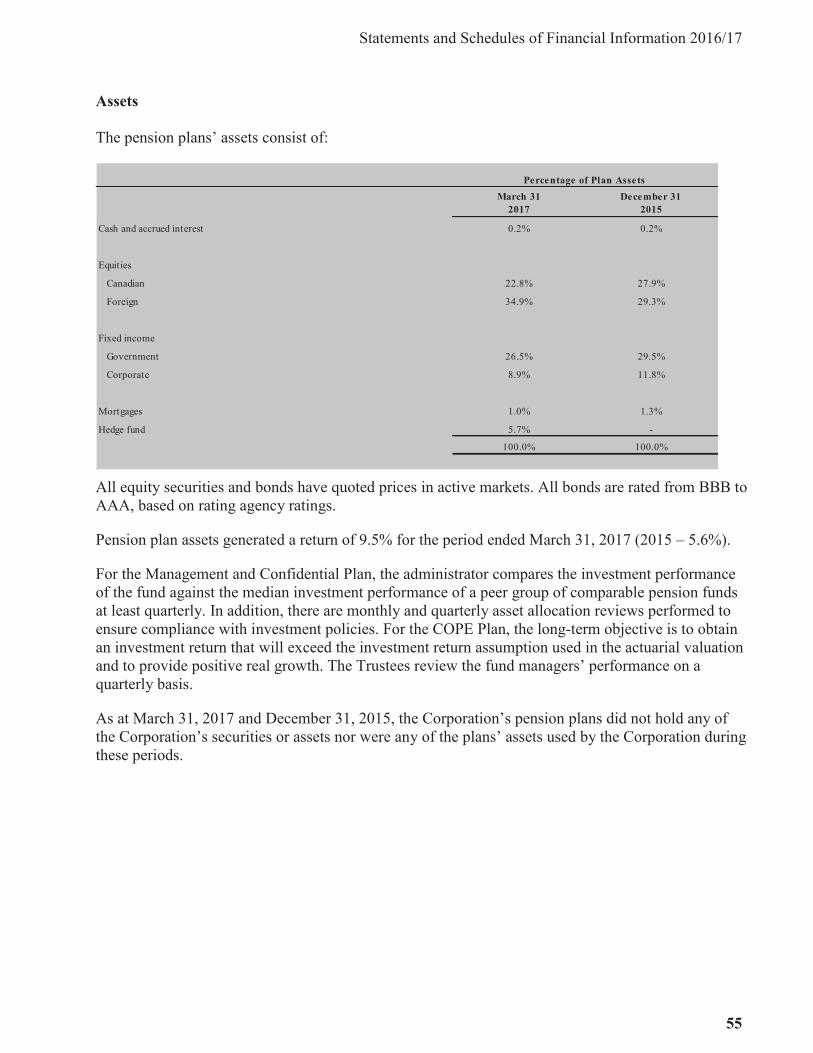
Statements and Schedules of Financial Information 2016/17
55
Insurance Corporation of British Columbia
2016/17 Annual Service Plan Report 85
Assets The pension plans’ assets consist of:
All equity securities and bonds have quoted prices in active markets. All bonds are rated from BBB to AAA, based on rating agency ratings.
Pension plan assets generated a return of 9.5% for the period ended March 31, 2017 (2015 – 5.6%).
For the Management and Confidential Plan, the administrator compares the investment performance of the fund against the median investment performance of a peer group of comparable pension funds at least quarterly. In addition, there are monthly and quarterly asset allocation reviews performed to ensure compliance with investment policies. For the COPE Plan, the long-term objective is to obtain an investment return that will exceed the investment return assumption used in the actuarial valuation and to provide positive real growth. The Trustees review the fund managers’ performance on a quarterly basis.
As at March 31, 2017 and December 31, 2015, the Corporation’s pension plans did not hold any of the Corporation’s securities or assets nor were any of the plans’ assets used by the Corporation during these periods.
March 312017
December 312015
Cash and accrued interest 0.2% 0.2%
Equities
Canadian 22.8% 27.9%
Foreign 34.9% 29.3%
Fixed income
Government 26.5% 29.5%
Corporate 8.9% 11.8%
Mortgages 1.0% 1.3%
Hedge fund 5.7% -
100.0% 100.0%
Percentage of Plan Assets
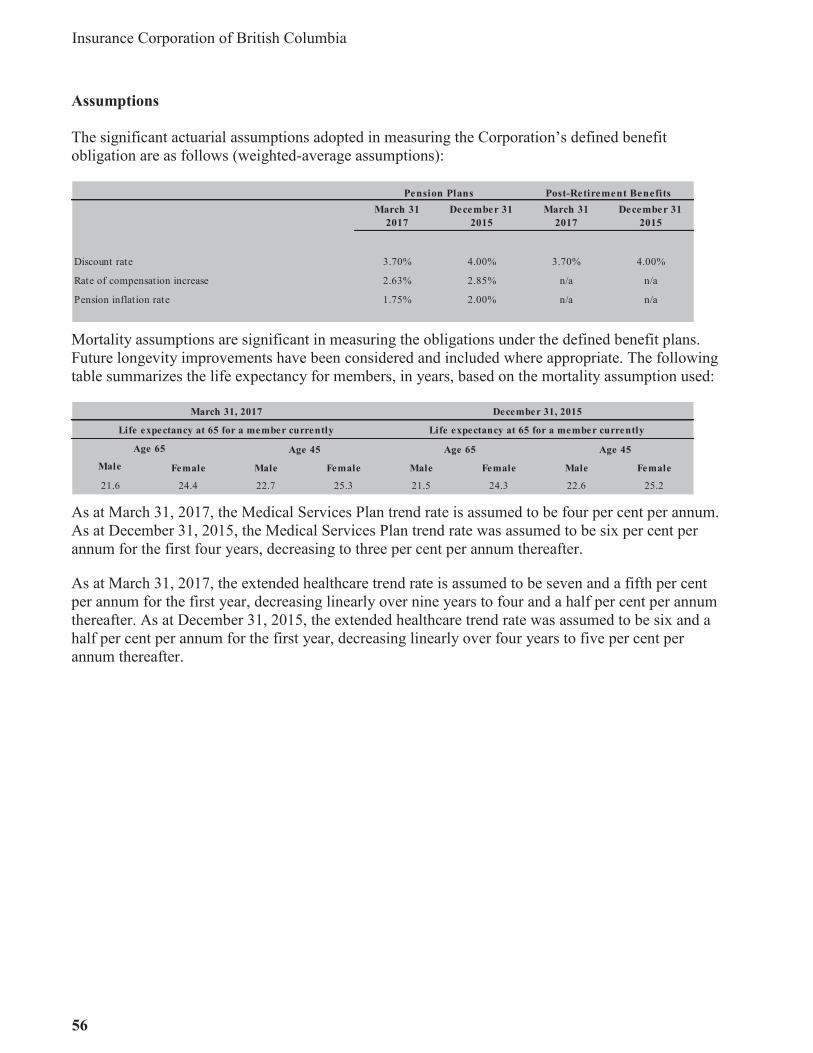
Insurance Corporation of British Columbia
56
Insurance Corporation of British Columbia
2016/17 Annual Service Plan Report 86
Assumptions The significant actuarial assumptions adopted in measuring the Corporation’s defined benefit obligation are as follows (weighted-average assumptions):
Mortality assumptions are significant in measuring the obligations under the defined benefit plans. Future longevity improvements have been considered and included where appropriate. The following table summarizes the life expectancy for members, in years, based on the mortality assumption used:
As at March 31, 2017, the Medical Services Plan trend rate is assumed to be four per cent per annum. As at December 31, 2015, the Medical Services Plan trend rate was assumed to be six per cent per annum for the first four years, decreasing to three per cent per annum thereafter.
As at March 31, 2017, the extended healthcare trend rate is assumed to be seven and a fifth per cent per annum for the first year, decreasing linearly over nine years to four and a half per cent per annum thereafter. As at December 31, 2015, the extended healthcare trend rate was assumed to be six and a half per cent per annum for the first year, decreasing linearly over four years to five per cent per annum thereafter.
March 312017
December 312015
March 312017
December 312015
Discount rate 3.70% 4.00% 3.70% 4.00%
Rate of compensation increase 2.63% 2.85% n/a n/a
Pension inflation rate 1.75% 2.00% n/a n/a
Pension Plans Post-Retirement Benefits
Male Female Male Female Male Female Male Female
21.6 24.4 22.7 25.3 21.5 24.3 22.6 25.2
March 31, 2017 December 31, 2015
Life expectancy at 65 for a member currently Life expectancy at 65 for a member currently
Age 65 Age 45 Age 65 Age 45
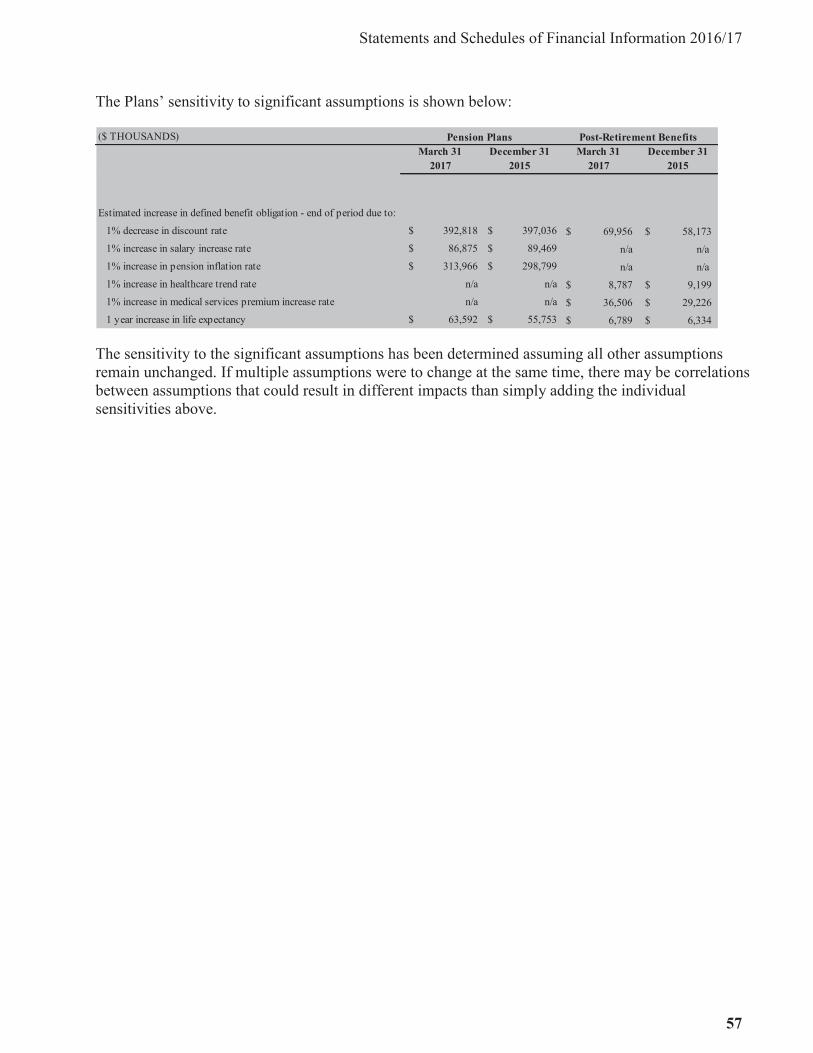
Statements and Schedules of Financial Information 2016/17
57
Insurance Corporation of British Columbia
2016/17 Annual Service Plan Report 87
The Plans’ sensitivity to significant assumptions is shown below:
The sensitivity to the significant assumptions has been determined assuming all other assumptions remain unchanged. If multiple assumptions were to change at the same time, there may be correlations between assumptions that could result in different impacts than simply adding the individual sensitivities above.
($ THOUSANDS)March 31
2017December 31
2015March 31
2017December 31
2015
Estimated increase in defined benefit obligation - end of period due to:
1% decrease in discount rate $ 392,818 $ 397,036 69,956$ 58,173$ 1% increase in salary increase rate $ 86,875 $ 89,469 n/a n/a 1% increase in pension inflation rate $ 313,966 $ 298,799 n/a n/a 1% increase in healthcare trend rate n/a n/a 8,787$ 9,199$ 1% increase in medical services premium increase rate n/a n/a 36,506$ 29,226$ 1 year increase in life expectancy $ 63,592 $ 55,753 6,789$ 6,334$
Pension Plans Post-Retirement Benefits
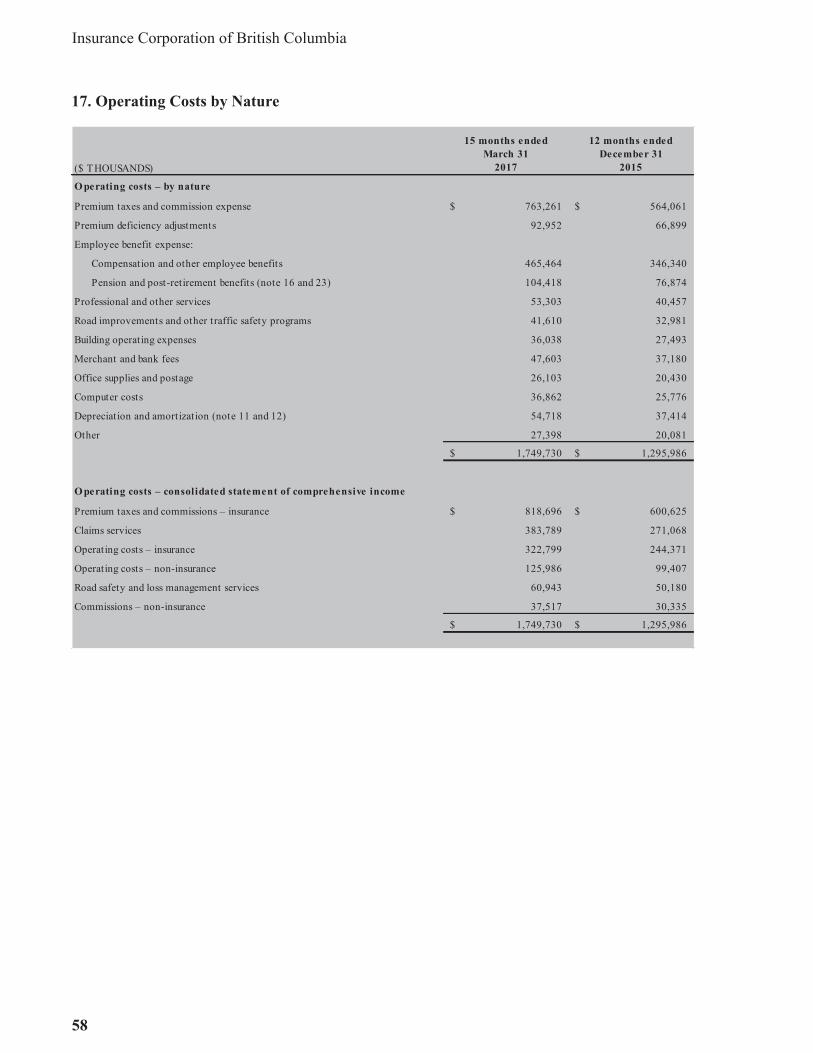
Insurance Corporation of British Columbia
58
Insurance Corporation of British Columbia
2016/17 Annual Service Plan Report 88
17. Operating Costs by Nature
($ THOUSANDS)
15 months ended March 31
2017
12 months ended December 31
2015
O perating costs – by nature
Premium taxes and commission expense 763,261$ 564,061$
Premium deficiency adjustments 92,952 66,899
Employee benefit expense:
Compensation and other employee benefits 465,464 346,340
Pension and post-retirement benefits (note 16 and 23) 104,418 76,874
Professional and other services 53,303 40,457
Road improvements and other traffic safety programs 41,610 32,981
Building operating expenses 36,038 27,493
Merchant and bank fees 47,603 37,180
Office supplies and postage 26,103 20,430
Computer costs 36,862 25,776
Depreciation and amortization (note 11 and 12) 54,718 37,414
Other 27,398 20,081
1,749,730$ 1,295,986$
O perating costs – consolidated statement of comprehensive income
Premium taxes and commissions – insurance 818,696$ 600,625$
Claims services 383,789 271,068
Operating costs – insurance 322,799 244,371
Operating costs – non-insurance 125,986 99,407
Road safety and loss management services 60,943 50,180
Commissions – non-insurance 37,517 30,335
1,749,730$ 1,295,986$

Statements and Schedules of Financial Information 2016/17
59
Insurance Corporation of British Columbia
2016/17 Annual Service Plan Report 89
18. Deferred Premium Acquisition Costs and Prepaids and Premium Deficiency
As stated in note 3e, the DPAC as at March 31, 2017 is calculated at a combined Corporate level as opposed to separate calculations for the Optional and Basic lines of business.
The Corporate DPAC as at March 31, 2017 is as follows:
As at December 31, 2015, the DPAC for the Optional and Basic lines of business were calculated separately. The DPAC for the Optional line of business as at December 31, 2015 was as follows:
($ THOUSANDS)March 31
2017
Deferred premium acquisition costs, beginning of period 86,776$
Acquisition costs related to future periods 16,481
Amortization of prior period acquisition costs (86,776) Deferred premium acquisition costs, end of period 16,481$
Deferred premium acquisition costs 16,481$
Prepaid expenses 20,021 Deferred premium acquisition costs and prepaids 36,502$
($ THOUSANDS)December 31
2015
Deferred premium acquisition costs, beginning of period 151,996$
Acquisition costs related to future periods 162,598
Amortization of prior period acquisition costs (151,996) Deferred premium acquisition costs, end of period 162,598$
Deferred premium acquisition costs 162,598$
Prepaid expenses 20,182 Deferred premium acquisition costs and prepaids 182,780$

Insurance Corporation of British Columbia
60
Insurance Corporation of British Columbia
2016/17 Annual Service Plan Report 90
The premium deficiency for the Basic line of business as at December 31, 2015 was as follows:
The commission and premium tax expenses reflected in the consolidated statement of comprehensive loss are as follows:
($ THOUSANDS)December 31
2015
Premium deficiency, beginning of period (15,794)$
Acquisition costs related to future periods 95,932
Amortization of prior period deficiency 15,794
Actuarial valuation adjustment (171,754)Premium deficiency, end of period (75,822)$
($ THOUSANDS) Commissions Premium Taxes Total
March 31, 2017
Amount payable 509,926$ 275,992$ 785,918$
Amortization of prior period deferred premium acquisition costs 93,165 (6,389) 86,776
Deferred premium acquisition costs (38,574) 22,093 (16,481)Premium taxes, commission expense and deferred premium acquisition costs $ 564,517 $ 291,696 $ 856,213
Represented as:
Insurance $ 527,000 291,696$ 818,696$
Non-insurance 37,517 - 37,517 $ 564,517 291,696$ 856,213$
December 31, 2015
Amount payable 378,287$ 203,247$ 581,534$
Amortization of prior period deferred premium acquisition costs 109,469 26,733 136,202
Deferred premium acquisition costs (123,232) (39,366) (162,598)
Premium deficiency 30,067 45,755 75,822Premium taxes, commission expense and deferred premium acquisition costs $ 394,591 $ 236,369 $ 630,960
Represented as:
Insurance $ 364,256 236,369$ 600,625$
Non-insurance 30,335 - 30,335 $ 394,591 236,369$ 630,960$

Statements and Schedules of Financial Information 2016/17
61
Insurance Corporation of British Columbia
2016/17 Annual Service Plan Report 91
19. Related Party Transactions
ICBC is a wholly-owned Crown corporation of the Province of B.C.
All transactions with the Province B.C.’s ministries, agencies, and Crown corporations occurred in the normal course of providing insurance, registration, and licensing for motor vehicles and are at arm’s length, which is representative of fair value unless otherwise disclosed in these notes. The Corporation has elected to apply the exemption for government-related entities under IAS 24 Related Party Disclosures.
All transactions with the Corporation’s subsidiary companies occurred in the normal course of investing in investment properties (note 2k).
The Corporation acts as an agent for the Ministry of Finance regarding the collection of provincial taxes on imported and privately sold used vehicles and motor vehicle-related debts. The Corporation is the sole provider of Basic insurance (note 1) in the Province of B.C. and, therefore, insures, at market rates, vehicles owned or leased by the Province of B.C. and its controlled entities. As a consequence of these relationships, the Corporation has, at any time, amounts owing to or from various government departments or ministries in the ordinary course of business.
The Corporation is also responsible for collecting and remitting in full to the Province of B.C. all driver license fees as well as vehicle-related fees for acquiring and distributing licence plates and decals including permits and other fees and fines. These collections are not revenue to the Corporation. The costs associated with the licensing and compliance activities conducted on behalf of the Province of B.C. are borne by the Corporation. These collections on behalf of and payments to the Province of B.C. are disclosed in the consolidated statement of comprehensive loss under non-insurance operations.
As at March 31, 2017, there is no Excess Optional capital to be transferred to the Province of B.C. (note 20) (2015 – $138.1 million accrued as a payable).
The Corporation has defined key management as members of the Board of Directors and management employees at the Senior Director and equivalent level and above. The compensation for key management is shown below:
As at March 31, 2017, $0.9 million (2015 – $0.5 million) was payable to key management.
The Corporation contributes to several defined benefit pension and post-retirement plans. Transactions with these entities are disclosed in note 16. During the period ended March 31, 2017, the
($ THOUSANDS)
15 months ended March 31
2017
12 months ended December 31
2015
Key management compensation
Compensation and other employee benefits including restructuring costs 5,756$ 4,631$
Pension and post-retirement benefits 932 480
6,688$ 5,111$
Insurance Corporation of British Columbia
62
Insurance Corporation of British Columbia
2016/17 Annual Service Plan Report 92
Corporation incurred $4.3 million (2015 – $3.4 million) in administrative expenses and investment management fees on behalf of these plans interest-free. In addition, the Corporation provides certain administrative, investment management, and office services to the plans at no charge. As at March 31, 2017, $0.6 million (2015 – $1.7 million) was payable to these plans for employer contributions.
Other related party transactions have been disclosed elsewhere in the notes to the consolidated financial statements.
20. Capital Management
The Corporation’s capital is comprised of retained earnings, other components of equity, and NCI. The Corporation’s objectives for managing capital are to maintain financial strength including the management of ongoing business risks and protect its ability to meet the obligations owed to policyholders and others.
As prescribed in the British Columbia Government’s Special Direction IC2 (IC2) for Basic and the Insurance Corporation Act (ICA) for Optional insurance, the Corporation is guided by the capital management framework of the Office of the Superintendent of Financial Institutions Canada (OSFI), adopting OSFI’s minimum capital test (MCT) as a means to measure and monitor the Corporation’s capital levels. The MCT utilizes a risk-based formula to assess the capital adequacy of an insurance company by defining the capital available that is required to meet the minimum standards.
The Corporation has an internal corporate management target for MCT which is comprised of two components being the Basic and Optional insurance business MCT targets. For the Basic insurance business, the IC2 requires the Corporation, through BCUC oversight, to maintain capital available equal to at least 100% of MCT. BCUC has approved a Capital Management Plan for Basic insurance that includes a Basic management target MCT ratio at a higher level, sufficient to prevent capital falling below the 100% minimum threshold in most years (note 22) and an additional margin for relatively smooth and predictable rates. In the interest of keeping rates as low and affordable as possible for British Columbians, the Province of B.C. directed transfers of income from Optional to Basic insurance, enabling the Corporation to file for a 4.9% Basic rate increase in the 2016 revenue requirements application, which was subsequently approved by BCUC. To maintain Basic capital above legislative minimums, the Province of B.C. further directed a transfer from Optional insurance capital to Basic insurance.
Amendments made to IC2 in 2016 suspend the capital build and release provisions of the existing Capital Management Plan and keep the capital maintenance provision stable so that there is no impact on the Basic insurance rate change.
For the Optional insurance business, the ICA requires the Corporation to determine a capital management target that either is calculated by the Corporation based on the MCT guideline and the Guideline on Stress Testing issued by OSFI or as directed by the Province of B.C. At period end, when Optional capital is in excess of the management target, that amount is to be transferred to the Province of B.C. by July 1 of the following year (notes 19 and 22).
During 2016/17, the Corporation successfully completed and implemented a business renewal program known as the Transformation Program (TP) to address key business issues, including
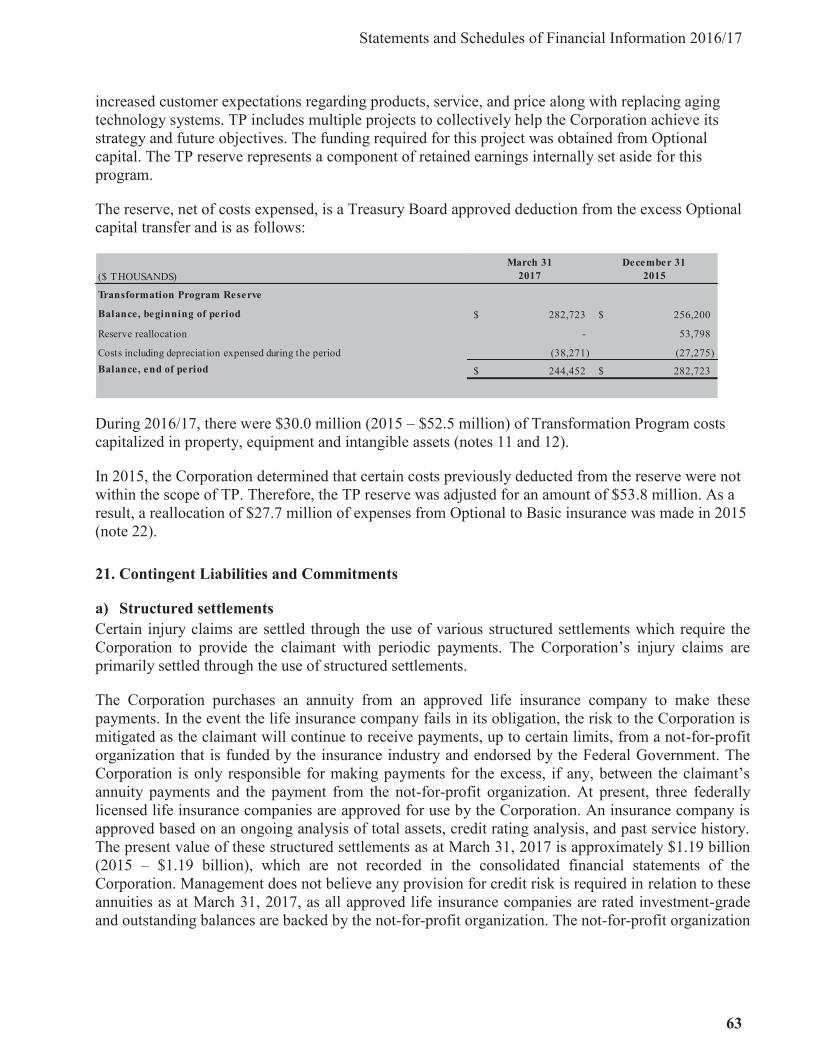
Statements and Schedules of Financial Information 2016/17
63
Insurance Corporation of British Columbia
2016/17 Annual Service Plan Report 93
increased customer expectations regarding products, service, and price along with replacing aging technology systems. TP includes multiple projects to collectively help the Corporation achieve its strategy and future objectives. The funding required for this project was obtained from Optional capital. The TP reserve represents a component of retained earnings internally set aside for this program.
The reserve, net of costs expensed, is a Treasury Board approved deduction from the excess Optional capital transfer and is as follows:
During 2016/17, there were $30.0 million (2015 – $52.5 million) of Transformation Program costs capitalized in property, equipment and intangible assets (notes 11 and 12).
In 2015, the Corporation determined that certain costs previously deducted from the reserve were not within the scope of TP. Therefore, the TP reserve was adjusted for an amount of $53.8 million. As a result, a reallocation of $27.7 million of expenses from Optional to Basic insurance was made in 2015 (note 22).
21. Contingent Liabilities and Commitments
a) Structured settlements Certain injury claims are settled through the use of various structured settlements which require the Corporation to provide the claimant with periodic payments. The Corporation’s injury claims are primarily settled through the use of structured settlements.
The Corporation purchases an annuity from an approved life insurance company to make these payments. In the event the life insurance company fails in its obligation, the risk to the Corporation is mitigated as the claimant will continue to receive payments, up to certain limits, from a not-for-profit organization that is funded by the insurance industry and endorsed by the Federal Government. The Corporation is only responsible for making payments for the excess, if any, between the claimant’s annuity payments and the payment from the not-for-profit organization. At present, three federally licensed life insurance companies are approved for use by the Corporation. An insurance company is approved based on an ongoing analysis of total assets, credit rating analysis, and past service history. The present value of these structured settlements as at March 31, 2017 is approximately $1.19 billion (2015 – $1.19 billion), which are not recorded in the consolidated financial statements of the Corporation. Management does not believe any provision for credit risk is required in relation to these annuities as at March 31, 2017, as all approved life insurance companies are rated investment-grade and outstanding balances are backed by the not-for-profit organization. The not-for-profit organization
($ THOUSANDS)March 31
2017December 31
2015
Transformation Program Reserve
Balance, beginning of period 282,723$ 256,200$
Reserve reallocation - 53,798
Costs including depreciation expensed during the period (38,271) (27,275) Balance, end of period 244,452$ 282,723$

Insurance Corporation of British Columbia
64
Insurance Corporation of British Columbia
2016/17 Annual Service Plan Report 94
provides guarantees of up to $2,000 a month or 85% of the promised monthly income benefit, whichever is higher. The Corporation’s exposure to credit risk beyond the guarantee is insignificant. To date, the Corporation has not experienced any losses resulting from these arrangements.
b) Lease paymentsThe Corporation has entered into operating leases of certain rental properties for varying terms. The annual rental payments pursuant to these leases over the next five years and beyond and the net present value are as follows:
The operating lease payments recognized as an expense during the period were $18.9 million (2015 –$14.7 million).
c) Other
As at March 31, 2017, the Corporation is committed to seven (2015 – seven) mortgage funding agreements totalling $150.7 million (2015 – $44.1 million).
In 2016/17, the Corporation invested into a real estate fund in which a commitment of $69.7 million was made and as at March 31, 2017, $53.7 million was funded.
In 2016/17, the Corporation has an investment in a limited partnership for bonds in which a commitment of $100.0 million was made. As at March 31, 2017, $40.0 million (2015 – nil) of the commitment was funded.
In 2016/17, the Corporation has made a commitment to invest $150.0 million USD in a limited partnership for mortgages.
In 2015, the Corporation entered into an annually managed mainframe hosting services contract until 2022, with a total contract value of $34.5 million.
In 2014, the Corporation has an investment in a limited partnership for real estate in which a commitment of $75.0 million was made. As at March 31, 2017, $46.0 million (2015 – $20.9 million) of the commitment was funded.
In 2011, the Corporation entered into a commitment for annual telecommunication services until 2021, with a total contract value of $50.6 million.
($ THOUSANDS)
Lease PaymentsNet Present
Value Lease PaymentsNet Present
Value
Up to 1 year $ 9,545 $ 9,290 $ 9,914 $ 9,629
Greater than 1 year, up to 5 years 23,581 21,648 19,017 17,386
Greater than 5 years 15,386 13,075 4,460 3,744
48,512$ 44,013$ 33,391$ 30,759$
March 312017
December 312015
Statements and Schedules of Financial Information 2016/17
65
Insurance Corporation of British Columbia
2016/17 Annual Service Plan Report 95
22. Regulation over Basic Insurance
As discussed in note 1, the Corporation is subject to regulation by BCUC. BCUC has jurisdiction over the Corporation’s rates and services for Basic insurance, and responsibility for ensuring that the Basic insurance business does not subsidize the Corporation’s Optional insurance business.
For the regulation of the Corporation’s Basic insurance rates, BCUC is required to ensure that the rates are just, reasonable, not unduly discriminatory, and not unduly preferential. BCUC is required to fix rates on the basis of accepted actuarial practice, to pay for certain specified costs, to ensure the Corporation maintains and/or builds the required Basic insurance capital, to ensure rates are not based on age, gender or marital status, and to ensure increases or decreases in rates are phased in, in a stable and predictable manner.
As required by the regulatory framework, the Corporation maintains a capital management plan that is reviewed and approved by BCUC. This plan was last amended in May 2016, to include both the existing capital management solvency target and an additional margin of capital for a rate smoothing framework. The capital management plan allowed for exclusion of some or all of that fiscal loss years’ loss costs forecast variance as a provision to release Basic insurance capital.
Basic insurance rate increases are also subject to the rate smoothing framework which limits the range of allowable rate changes, and instead uses Basic insurance capital to smooth through volatility in Basic insurance rates (note 9). The rate smoothing framework requires that, if circumstances should arise where, despite the capital management plan, Basic insurance capital is projected to fall below the regulatory minimum target, then in addition to filing with BCUC, the Corporation is also directed to immediately report to the Treasury Board and, in conjunction with the Treasury Board, develop an appropriate plan to address Basic insurance capital levels. As discussed below, these circumstances arose in both fiscal 2016/17 and 2015 periods.
BCUC initiates regulatory processes on its own initiative or upon application by the Corporation. It uses oral hearing, written hearing, or negotiated settlement processes to review applications and subsequently issue legally binding decisions.
The Corporation is required to incur a portion of BCUC’s general operating expenses as well as its costs associated with each ICBC proceeding. BCUC can also order the Corporation to reimburse other proceeding participants for specified costs such as legal and expert witness fees.
BCUC sets rates for Basic insurance that allow it to achieve the required regulatory minimum MCT which has been set at 100%. In any case where the estimate or outlook for the quarterly and/or period end Basic MCT level is below 100%, BCUC directs the Corporation to file, within 60 days, a plan for the restoration of Basic MCT to be at or above the 100% regulatory minimum.
The Corporation filed a plan with BCUC on November 26, 2015, as the outlook for the period end Basic MCT level as of the third quarter of 2015 was below 100%. The plan stated that the Corporation would transfer $450.0 million of capital from Optional insurance to Basic insurance in January 2016 in order to restore the Basic MCT level to be above the 100% regulatory minimum. This transfer was completed on January 1, 2016.

Insurance Corporation of British Columbia
66
Insurance Corporation of British Columbia
2016/17 Annual Service Plan Report 96
The Corporation filed another plan with BCUC on May 31, 2016, and further updated it on August 31, 2016, as the outlook for the period end Basic MCT level as of both the first and second quarters of 2016/17 was below 100%. The update stated that, in addition to the $300.0 million income transfer referred to below, the Corporation needed to transfer $172.0 million of capital from Optional insurance to Basic insurance during August 2016 in order to restore the Basic MCT level to be above the 100% regulatory minimum.
$300.0 million of current period’s income was transferred from the Corporation’s Optional insurance business to the Basic insurance business. This transfer ($201.0 million on November 1, 2016 and subsequent to period end, $99.0 million - see note 24) occurred under the Province of B.C.’s direction and was accepted by the Corporation’s Board of Directors. As a result of this transfer, the Corporation applied to the BCUC for a Basic insurance rate of 4.9%, which was lower than the otherwise required rate.
Allocation of Basic and Optional amounts The Corporation operates its business using an integrated business model. The majority of premium revenues and costs are specifically identifiable as Basic or Optional (see note 1). The Corporation also delivers non-insurance services on behalf of the Province of B.C. Non-insurance activities include driver licensing, vehicle registration and licensing, violation ticket administration and government fines collection all of which are reported as Basic costs.
BCUC requires the Corporation to follow an approved financial allocation methodology with respect to allocating costs between the Basic insurance business, the Optional insurance business, and non-insurance services. Therefore, for those revenues and costs that are not specifically identified, a pro-rata method is used to allocate to each line of business based on the drivers of those revenues and costs, the degree of causality, and any BCUC directives. BCUC directives have been applied on a prospective basis.

Statements and Schedules of Financial Information 2016/17
67
Insurance Corporation of British Columbia
2016/17 Annual Service Plan Report 97
($ THOUSANDS)
15 months ended March 31, 2017
12 months ended December 31, 2015
15 months ended March 31, 2017
12 months ended December 31, 2015
15 months ended March 31, 2017
12 months ended December 31, 2015
Net premiums written 3,720,692$ 2,770,742$ 2,532,407$ 1,866,095$ 6,253,099$ 4,636,837$
Revenues
Net premiums earned 3,601,709$ 2,655,979$ 2,448,933$ 1,791,952$ 6,050,642$ 4,447,931$
Service fees and other income 79,727 57,375 50,656 37,135 130,383 94,510
Total earned revenues 3,681,436 2,713,354 2,499,589 1,829,087 6,181,025 4,542,441
Claims and operating costs
Provision for claims occurring in the current period (note 13) 3,868,292 2,620,257 1,791,400 1,177,936 5,659,692 3,798,193
Change in estimates for losses occurring in prior periods (note 13) (12,198) 237,652 318,863 6,402 306,665 244,054
Claim services, road safety and loss management services 296,410 212,795 148,322 108,453 444,732 321,248
4,152,504 3,070,704 2,258,585 1,292,791 6,411,089 4,363,495
Operating costs – insurance (note 17) 149,439 114,807 173,360 129,564 322,799 244,371
Premium taxes and commissions – insurance (notes 17 and 18) 220,289 241,362 598,407 359,263 818,696 600,625
Transformation program reallocation (note 20) - 27,720 - (27,720) - -
4,522,232 3,454,593 3,030,352 1,753,898 7,552,584 5,208,491
Underwriting (loss) income (840,796) (741,239) (530,763) 75,189 (1,371,559) (666,050)
Investment income (note 10) 415,505 607,711 199,365 312,158 614,870 919,869
(Loss) Income – insurance operations (425,291) (133,528) (331,398) 387,347 (756,689) 253,819
Loss – non-insurance operations (156,352) (123,278) - - (156,352) (123,278)
Net (loss) income for the period before income transfer (581,643) (256,806) (331,398) 387,347 (913,041) 130,541
Optional net income transfer to Basic business 201,000 - (201,000) - - - Net (loss) income for the period after income transfer (380,643)$ (256,806)$ (532,398)$ 387,347$ (913,041)$ 130,541$
Net (loss) income attributable to:
Non-controlling interest (97)$ 233$ (53)$ 120$ (150)$ 353$
Parent corporation (380,546) (257,039) (532,345) 387,227 (912,891) 130,188 (380,643)$ (256,806)$ (532,398)$ 387,347$ (913,041)$ 130,541$
Equity
Retained earnings, beginning of period 1,218,425$ 1,475,464$ 2,152,946$ 1,903,837$ 3,371,371$ 3,379,301$
Net (loss) income for the period, parent corporation (380,546) (257,039) (532,345) 387,227 (912,891) 130,188
Optional Capital Transfer to Basic business (note 20) 622,000 - (622,000) - - -
Excess Optional Capital Transfer to Province of BC (notes 19 and 20) - - - (138,118) - (138,118)
Retained earnings, end of period 1,459,879 1,218,425 998,601 2,152,946 2,458,480 3,371,371
Other components of equity, beginning of period (171,613) 157,250 (90,187) 79,126 (261,800) 236,376
Net change in available for sale assets 102,157 (309,413) 49,016 (158,932) 151,173 (468,345)
Pension and post-retirement benefits remeasurements (note 16) 51,904 (19,450) 26,858 (10,381) 78,762 (29,831)
Other components of equity, end of period (17,552) (171,613) (14,313) (90,187) (31,865) (261,800)
Total equity attributable to parent corporation 1,442,327 1,046,812 984,288 2,062,759 2,426,615 3,109,571
Non-controlling interest, beginning of period 24,204 - 12,256 - 36,460 -
Non-controlling interest (disposed) acquired during the period (note 6) (11,276) 24,550 (6,340) 12,434 (17,616) 36,984
Net (loss) income for the period, non-controlling interest (note 6) (97) 233 (53) 120 (150) 353
Other comprehensive income (loss) for the period, non-controlling interest (note 6) 584 (579) 293 (298) 877 (877)
Total equity attributable to non-controlling interest, end of period (note 6) 13,415 24,204 6,156 12,256 19,571 36,460 Total Equity 1,455,742$ 1,071,016$ 990,444$ 2,075,015$ 2,446,186$ 3,146,031$
Basic Coverage Optional Coverage Total
($ THOUSANDS)
March 31, 2017 December 31, 2015 March 31, 2017 December 31, 2015 March 31, 2017 December 31, 2015
Liabilities
Unearned premiums (note 14) 1,430,000$ 1,311,016$ 984,503$ 899,348$ 2,414,503$ 2,210,364$
Provision for unpaid claims (note 13) 7,851,433$ 6,947,499$ 2,666,538$ 2,145,641$ 10,517,971$ 9,093,140$
Basic Coverage Optional Coverage Total
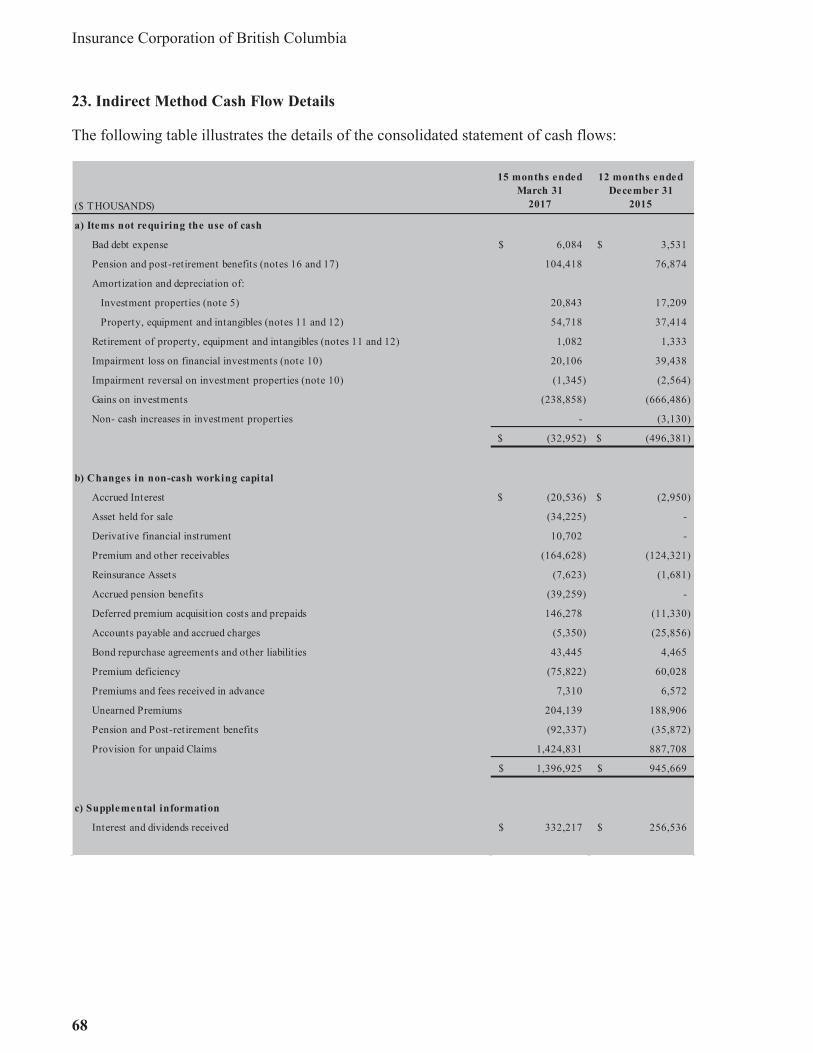
Insurance Corporation of British Columbia
68
Insurance Corporation of British Columbia
2016/17 Annual Service Plan Report 98
23. Indirect Method Cash Flow Details
The following table illustrates the details of the consolidated statement of cash flows:
($ THOUSANDS)
15 months ended March 31
2017
12 months ended December 31
2015
a) Items not requiring the use of cash
Bad debt expense 6,084$ 3,531$
Pension and post-retirement benefits (notes 16 and 17) 104,418 76,874
Amortization and depreciation of:
Investment properties (note 5) 20,843 17,209
Property, equipment and intangibles (notes 11 and 12) 54,718 37,414
Retirement of property, equipment and intangibles (notes 11 and 12) 1,082 1,333
Impairment loss on financial investments (note 10) 20,106 39,438
Impairment reversal on investment properties (note 10) (1,345) (2,564)
Gains on investments (238,858) (666,486)
Non- cash increases in investment properties - (3,130)
(32,952)$ (496,381)$
b) Changes in non-cash working capital
Accrued Interest (20,536)$ (2,950)$
Asset held for sale (34,225) -
Derivative financial instrument 10,702 -
Premium and other receivables (164,628) (124,321)
Reinsurance Assets (7,623) (1,681)
Accrued pension benefits (39,259) -
Deferred premium acquisition costs and prepaids 146,278 (11,330)
Accounts payable and accrued charges (5,350) (25,856)
Bond repurchase agreements and other liabilit ies 43,445 4,465
Premium deficiency (75,822) 60,028
Premiums and fees received in advance 7,310 6,572
Unearned Premiums 204,139 188,906
Pension and Post-retirement benefits (92,337) (35,872)
Provision for unpaid Claims 1,424,831 887,708
1,396,925$ 945,669$
c) Supplemental information
Interest and dividends received 332,217$ 256,536$

Statements and Schedules of Financial Information 2016/17
69
Insurance Corporation of British Columbia
2016/17 Annual Service Plan Report 99
24. Subsequent Events
On April 1, 2017, the Corporation transferred $99.0 million of Optional insurance income to its Basic insurance as directed by the Province of B.C.
On April 18, 2017, ICBC and a Limited Partner acquired a real estate investment property for $92.1 million, of which ICBC controls 90%.
Between April 1, 2017 and May 30, 2017, the Corporation entered into eleven agreements to provide mortgage funding totalling $190.9 million.

Insurance Corporation of British Columbia
70
Corporate GovernanceICBC is governed by a Board of Directors, CEO and management team. They are guided by the public sector guidelines for corporate governance, and must act in accordance with the provisions of the Insurance Corporation Act, the Insurance (Vehicle) Act and the Motor Vehicle Act, and other legislation applicable to ICBC. Changes to ICBC’s Basic insurance rates are regulated by the BC Utilities Commission. They ensure that Basic insurance rates are justified and reasonable. For additional information, please refer to the Corporate Governance section of our website. This includes links to information regarding:• Executive Committee• Board of Directors• ICBC Board of Directors Committees • ICBC Code of Ethics • Mandate Letter and Taxpayer Accountability Principles

Statements and Schedules of Financial Information 2016/17
71
Schedule of Guarantees and IndemnitiesAs at March 31, 2017
There were no guarantees or indemnities provided by the Corporation during the 15 month period ended March 31, 2017.

Insurance Corporation of British Columbia
72
Schedule of DebtsAs at March 31, 2017
There were no long term debts secured by the Corporation at March 31, 2017.

Statements and Schedules of Financial Information 2016/17
73
Amounts paid per Financial Information Schedules
Total Remuneration – Board of Directors $ 356
Total Remuneration – Employees 441,012
Total Remuneration Paid 441,368
Reconciling items:
Amounts paid to Board of Directors $ (356)
Amounts capitalized or recovered (18,159)
Severance 4,744
Benefits paid on behalf of employees 20,308
Timing and other differences 17,559
24,096
Total Compensation and Other Employee Benefits per Note 17 (page 58) $ 465,464
Note: A reconciliation of amounts reported in the Financial Information Act Return and the audited consolidated financial statements has not been prepared for amounts paid to suppliers for goods and services due to the significant volume and complexity of reporting for supplier payments. ICBC prepares its financial statements on an accrual basis while amounts reported in the Financial Information Act Return are based on cash payments in the fiscal period. This will result in timing differences between amounts recorded in the financial statements and amounts paid in the fiscal period. In addition to timing differences, the operating expenses in the financial statements will differ from the amounts paid to suppliers for goods and services due to non-operating and capital payments, and amounts paid to claims suppliers for goods and services.
Financial Information ReconciliationFor the 15 month period ended March 31, 2017
($ THOUSANDS)
Please note: ICBC changed its fiscal year-end from December 31st to March 31st and therefore, the fiscal period ending March 31, 2017 is a 15 month transitory fiscal period. The total amounts reported above represent 15 months of remuneration and expenses.

Insurance Corporation of British Columbia
74
Remuneration and expenses paid to employees for the 15 months period ended March 31, 2017
REMUNERATION EXPENSES
EMPLOYEE NAME2016
JAN-DEC (12 MOS.)
2017 JAN-MAR (3 MOS.)
TOTAL
(15 MOS.)
TOTAL
(15 MOS.)
ABALLINI R. 79,230 16,951 96,181 - ABBOTT M. 81,074 18,730 99,804 9,782 ABDULLA A. 65,656 16,429 82,085 - ABE I. 101,457 23,073 124,530 - ABEL E. 84,048 19,490 103,538 - ABELENDA P. 72,265 15,432 87,697 2,308 ACHADINHA D. 69,449 16,505 85,954 235 ACKERMANN D. 94,989 23,236 118,225 3,604 ADAM S. 61,942 13,637 75,579 96 ADAMS M. 60,915 15,219 76,134 - ADAMS R. 97,164 21,574 118,738 1,991 ADDISON D. 106,925 25,007 131,932 5,547 ADDISON Y. 77,418 16,909 94,327 - ADLEM B. 55,464 29,165 84,629 2,126 AGA S. 64,801 14,865 79,666 2,459 AGOSTI A. 85,420 8,747 94,167 1,996 AHERN P. 115,035 27,656 142,691 9,955 AHIRA D. 89,664 20,392 110,056 848 AIMERS K. 160,318 41,436 201,754 1,375 AKIZUKI M. 74,628 14,299 88,927 749 AKTAS N. 73,477 16,902 90,379 - AKYUREK A. 65,302 15,108 80,410 331 ALAMAR C. 75,230 16,899 92,129 - ALBAN M. 71,810 16,803 88,613 1,134 ALBANESE V. 165,790 46,310 212,100 8,325 ALDERSON B. 79,220 21,276 100,496 489 ALDERTON M. 67,732 15,426 83,158 - ALEXANDER B. 68,979 18,711 87,690 2,602 ALEXANDER K. 62,358 14,385 76,743 90 ALI R. 79,319 18,024 97,343 95 ALI S. 62,293 16,772 79,065 357 ALIKPALA E. 63,019 14,874 77,893 - ALLAN B. 73,111 18,853 91,964 20 ALLEN D. 77,895 21,185 99,080 - ALLEN M. 66,787 15,016 81,803 - ANDERSON B. 69,423 14,878 84,301 - ANDERSON C.R. 76,891 22,012 98,903 533 ANDERSON CE. 70,939 18,780 89,719 135 ANDERSON N. 68,705 15,923 84,628 7,133 ANDREW A. 80,915 18,062 98,977 987 ANDREWS C. 105,003 23,736 128,739 1,494 ANDREWS J. 60,939 14,307 75,246 - ANG S. 76,796 17,908 94,704 - ANGANU I. 84,167 19,082 103,249 4,064 ANNESS G. 105,794 23,858 129,652 636 ANTAO S. 72,973 16,949 89,922 166 AOKI S. 104,650 25,333 129,983 3,591 ARAI B. 102,050 23,040 125,090 511 ARARSO T. 81,212 19,682 100,894 6,017
REMUNERATION EXPENSES
EMPLOYEE NAME2016
JAN-DEC (12 MOS.)
2017 JAN-MAR (3 MOS.)
TOTAL
(15 MOS.)
TOTAL
(15 MOS.)
ARCHER L. 70,779 15,537 86,316 - ARCHIBALD J. 109,376 25,682 135,058 2,825 ARIAS L. 61,873 14,392 76,265 32 ARMITAGE S. 74,540 17,873 92,413 60 ARMSTRONG C. 99,616 22,328 121,944 1,556 ARMSTRONG K. 61,150 14,193 75,343 37 ARNDT E. 89,899 22,507 112,406 2,724 ARNDT J. 99,918 25,264 125,182 - ARNETT L. 94,610 22,943 117,553 - ARNETT W. 79,701 19,357 99,058 - ARTHUR J. 88,201 22,470 110,671 2,130 ARTHURS J. 78,623 18,269 96,892 417 ASHBROOK L. 79,585 18,221 97,806 519 ASHLEY A. 64,161 14,923 79,084 671 ASMUNDSON P. 76,080 16,666 92,746 - ASTLES L. 75,343 16,972 92,315 407 ATHERTON J. 119,091 28,880 147,971 2,359 ATKER J. 77,254 17,868 95,122 - ATKINS P. 91,417 20,931 112,348 83 ATTWELL T. 75,382 18,804 94,186 - ATWAL A. 62,965 17,255 80,220 962 ATWAL S. 69,864 16,059 85,923 52 AUGUSTINE B. 85,882 20,653 106,535 3,713 AUJLA S. 113,856 27,590 141,446 12,784 AUVACHE C. 90,484 21,684 112,168 2,081 AVEY A. 63,557 15,191 78,748 - AWAN A. 64,335 15,971 80,306 2,901 AY C. 61,391 14,302 75,693 - AYLING C. 62,607 16,301 78,908 2,735 BAADSVIK E. 108,876 30,734 139,610 6,483 BABEY L. 87,352 19,737 107,089 356 BABIC N. 61,146 14,464 75,610 - BABYUK A. 81,653 23,194 104,847 - BACCHUS J. 67,359 15,585 82,944 357 BADANIC D. 90,675 21,063 111,738 491 BAGHERI P. 79,479 23,084 102,563 5,032 BAGNALL S. 67,659 15,873 83,532 - BAHI J. 85,644 21,739 107,383 87 BAINBRIDGE J. 69,212 15,438 84,650 12 BAINS J. 123,298 35,156 158,454 275 BAINS S. 106,702 28,893 135,595 6,348 BAIRD P. 84,866 36,528 121,394 - BAITZ L. 72,708 17,873 90,581 150 BAKALI A. 92,581 23,189 115,770 29 BAKER H. 78,892 19,523 98,415 176 BAKER R. 62,641 13,732 76,373 - BALDWIN K. 131,253 31,322 162,575 2,825 BALDWIN L. 66,877 15,145 82,022 10 BALLANCE S. 77,769 18,054 95,823 172
Please note: ICBC changed its fiscal year-end from December 31st to March 31st and therefore, the fiscal period ending March 31, 2017 is a 15 month transitory fiscal period. The total amounts reported above represent 15 months of remuneration and expenses.

Statements and Schedules of Financial Information 2016/17
75
Remuneration and expenses paid to employees for the 15 month period ended March 31, 2017
REMUNERATION EXPENSES
EMPLOYEE NAME2016
JAN-DEC (12 MOS.)
2017 JAN-MAR (3 MOS.)
TOTAL
(15 MOS.)
TOTAL
(15 MOS.)
BANCOSTA F. 86,233 19,198 105,431 1,500 BARBARO T. 80,432 14,522 94,954 792 BARDUA B. 72,662 17,011 89,673 - BARICHELLO A. 73,355 17,270 90,625 - BARKLEY D. 81,736 16,695 98,431 86 BARLOW M. 93,594 20,366 113,960 - BARNES J. 75,974 18,332 94,306 1,157 BARNES S. 76,052 17,313 93,365 - BARNETT C. 69,836 15,426 85,262 45 BARRETT S. 85,185 19,899 105,084 811 BARRETTE C. 72,710 16,899 89,609 - BARRON K. 65,348 15,844 81,192 - BARUAH U. 77,000 18,429 95,429 206 BARUFFA A. 79,912 22,018 101,930 183 BASILE G. 85,139 20,615 105,754 25 BASRA S. 100,026 22,741 122,767 122 BASTILLO G. 66,898 19,129 86,027 3,240 BATCHELOR D. 63,331 15,581 78,912 235 BATISTINI P. 64,441 15,190 79,631 392 BATTER C. 62,407 17,999 80,406 1,479 BAUER G. 93,596 20,709 114,305 980 BAUER T. 61,693 14,289 75,982 - BAXTER A. 73,133 17,379 90,512 572 BAXTER H. 78,201 16,747 94,948 1,210 BAXTER N. 112,623 27,204 139,827 2,458 BAYFORD L. 66,647 15,259 81,906 5,462 BEACH R. 71,670 19,191 90,861 44 BEADLE S. 63,031 14,459 77,490 10 BEATTY D. 88,569 20,134 108,703 469 BEAUDET L. 86,269 17,287 103,556 - BEAUDOIN D. 131,245 30,039 161,284 2,713 BEAULIEU M. 79,670 19,527 99,197 1,120 BEAUREGARD G. 139,414 32,423 171,837 378 BECK J. 116,105 26,578 142,683 1,776 BECK K. 86,616 18,267 104,883 450 BECKER B. 68,019 18,002 86,021 1,065 BEHAN S. 81,170 17,530 98,700 - BEIER R. 64,338 15,426 79,764 329 BEISICK R. 82,360 19,018 101,378 1,620 BELL E. 78,954 19,248 98,202 3,093 BELLOPEDE G. 69,657 16,469 86,126 249 BELTRANO E. 67,218 15,855 83,073 211 BENETEAU C. 104,434 23,198 127,632 469 BENINCASA J. 88,558 20,009 108,567 2,631 BENIUSIS J. 65,944 17,609 83,553 - BENOIT J. 74,033 16,919 90,952 250 BENTLEY L. 97,008 23,256 120,264 - BERARD P. 67,877 16,062 83,939 - BERGLIND T. 80,572 22,601 103,173 32
REMUNERATION EXPENSES
EMPLOYEE NAME2016
JAN-DEC (12 MOS.)
2017 JAN-MAR (3 MOS.)
TOTAL
(15 MOS.)
TOTAL
(15 MOS.)
BERGMAN J. 72,667 12,827 85,494 11,995 BEST L. 103,201 23,607 126,808 300 BEST LI. 61,955 14,329 76,284 838 BEST V. 112,279 28,242 140,521 - BESZEDES D. 91,847 20,701 112,548 5,802 BETKER J. 90,996 20,692 111,688 889 BETZ B. 61,228 14,420 75,648 - BEVAN A. 98,975 23,564 122,539 5,353 BEZNA B. 66,169 14,867 81,036 134 BHULLAR A. 79,042 19,409 98,451 - BIEBER B. 65,214 16,871 82,085 85 BILODEAU S. 61,692 14,633 76,325 - BINSTEAD C. 110,143 27,810 137,953 1,444 BIRD W. 67,248 15,582 82,830 210 BISHOP C. 84,756 19,272 104,028 308 BISHOP P. 83,685 18,271 101,956 1,018 BISHOP R. 74,845 19,242 94,087 - BISHOP S. 142,770 30,487 173,257 202 BISLA-PEREIRA S. 72,367 14,382 86,749 - BLACK G. 131,899 30,197 162,096 4,214 BLACK J. 85,123 20,657 105,780 - BLACK M. 65,905 15,195 81,100 403 BLACKBURN M. 72,369 16,899 89,268 - BLACKEY F. 82,752 17,908 100,660 1,948 BLACKLOCK J. 100,512 26,536 127,048 4,847 BLACKSTOCK PEDROSO A. 70,168 17,120 87,288 1,070 BLADES T. 63,752 15,059 78,811 324 BLAIR C. 66,698 16,479 83,177 587 BLAIR L. 72,071 16,526 88,597 - BLUCHER M. 346,341 91,435 437,776 17,026 BOAL J. 66,347 15,739 82,086 132 BOAN D. 130,300 31,269 161,569 8,313 BOCHKE K. 69,468 17,550 87,018 - BODIN G. 91,173 20,719 111,892 7,202 BOGDANOVIC S. 80,939 18,949 99,888 1,548 BOGLARI S. 125,404 31,342 156,746 215 BOMBARA S. 75,397 17,204 92,601 123 BONDI R. 87,866 18,287 106,153 - BONNETT B. 82,059 17,042 99,101 10,562 BOORMAN R. 82,945 - 82,945 176 BOOTH B. 67,669 15,429 83,098 - BOOTH B.A. 92,950 21,135 114,085 - BOOTH C. 72,612 16,951 89,563 - BOOTH D. 65,406 15,647 81,053 76 BOOTH L. 71,373 16,487 87,860 45 BOOTY J. 81,793 17,020 98,813 176 BOOYENS J. 120,246 30,541 150,787 - BOPARAI S. 60,690 14,373 75,063 2,490 BORLAND I. 80,038 16,650 96,688 28
Please note: ICBC changed its fiscal year-end from December 31st to March 31st and therefore, the fiscal period ending March 31, 2017 is a 15 month transitory fiscal period. The total amounts reported above represent 15 months of remuneration and expenses.
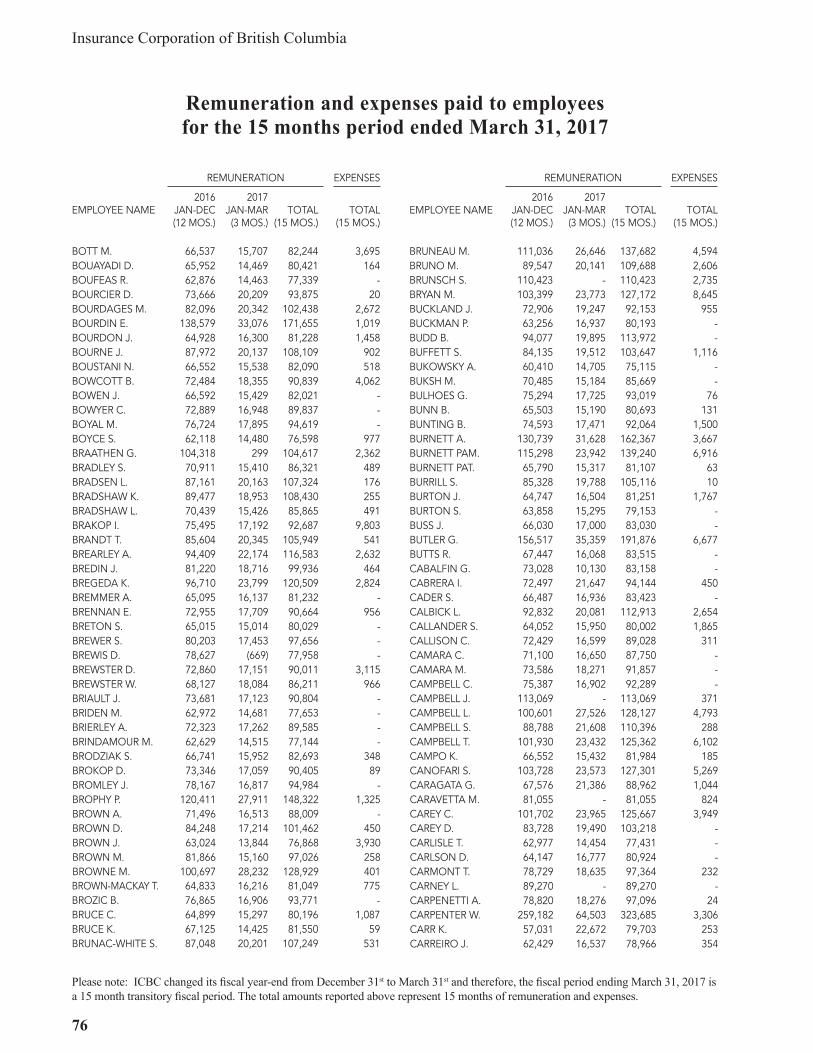
Insurance Corporation of British Columbia
76
Remuneration and expenses paid to employees for the 15 months period ended March 31, 2017
REMUNERATION EXPENSES
EMPLOYEE NAME2016
JAN-DEC (12 MOS.)
2017 JAN-MAR (3 MOS.)
TOTAL
(15 MOS.)
TOTAL
(15 MOS.)
BOTT M. 66,537 15,707 82,244 3,695 BOUAYADI D. 65,952 14,469 80,421 164 BOUFEAS R. 62,876 14,463 77,339 - BOURCIER D. 73,666 20,209 93,875 20 BOURDAGES M. 82,096 20,342 102,438 2,672 BOURDIN E. 138,579 33,076 171,655 1,019 BOURDON J. 64,928 16,300 81,228 1,458 BOURNE J. 87,972 20,137 108,109 902 BOUSTANI N. 66,552 15,538 82,090 518 BOWCOTT B. 72,484 18,355 90,839 4,062 BOWEN J. 66,592 15,429 82,021 - BOWYER C. 72,889 16,948 89,837 - BOYAL M. 76,724 17,895 94,619 - BOYCE S. 62,118 14,480 76,598 977 BRAATHEN G. 104,318 299 104,617 2,362 BRADLEY S. 70,911 15,410 86,321 489 BRADSEN L. 87,161 20,163 107,324 176 BRADSHAW K. 89,477 18,953 108,430 255 BRADSHAW L. 70,439 15,426 85,865 491 BRAKOP I. 75,495 17,192 92,687 9,803 BRANDT T. 85,604 20,345 105,949 541 BREARLEY A. 94,409 22,174 116,583 2,632 BREDIN J. 81,220 18,716 99,936 464 BREGEDA K. 96,710 23,799 120,509 2,824 BREMMER A. 65,095 16,137 81,232 - BRENNAN E. 72,955 17,709 90,664 956 BRETON S. 65,015 15,014 80,029 - BREWER S. 80,203 17,453 97,656 - BREWIS D. 78,627 (669) 77,958 - BREWSTER D. 72,860 17,151 90,011 3,115 BREWSTER W. 68,127 18,084 86,211 966 BRIAULT J. 73,681 17,123 90,804 - BRIDEN M. 62,972 14,681 77,653 - BRIERLEY A. 72,323 17,262 89,585 - BRINDAMOUR M. 62,629 14,515 77,144 - BRODZIAK S. 66,741 15,952 82,693 348 BROKOP D. 73,346 17,059 90,405 89 BROMLEY J. 78,167 16,817 94,984 - BROPHY P. 120,411 27,911 148,322 1,325 BROWN A. 71,496 16,513 88,009 - BROWN D. 84,248 17,214 101,462 450 BROWN J. 63,024 13,844 76,868 3,930 BROWN M. 81,866 15,160 97,026 258 BROWNE M. 100,697 28,232 128,929 401 BROWN-MACKAY T. 64,833 16,216 81,049 775 BROZIC B. 76,865 16,906 93,771 - BRUCE C. 64,899 15,297 80,196 1,087 BRUCE K. 67,125 14,425 81,550 59 BRUNAC-WHITE S. 87,048 20,201 107,249 531
REMUNERATION EXPENSES
EMPLOYEE NAME2016
JAN-DEC (12 MOS.)
2017 JAN-MAR (3 MOS.)
TOTAL
(15 MOS.)
TOTAL
(15 MOS.)
BRUNEAU M. 111,036 26,646 137,682 4,594 BRUNO M. 89,547 20,141 109,688 2,606 BRUNSCH S. 110,423 - 110,423 2,735 BRYAN M. 103,399 23,773 127,172 8,645 BUCKLAND J. 72,906 19,247 92,153 955 BUCKMAN P. 63,256 16,937 80,193 - BUDD B. 94,077 19,895 113,972 - BUFFETT S. 84,135 19,512 103,647 1,116 BUKOWSKY A. 60,410 14,705 75,115 - BUKSH M. 70,485 15,184 85,669 - BULHOES G. 75,294 17,725 93,019 76 BUNN B. 65,503 15,190 80,693 131 BUNTING B. 74,593 17,471 92,064 1,500 BURNETT A. 130,739 31,628 162,367 3,667 BURNETT PAM. 115,298 23,942 139,240 6,916 BURNETT PAT. 65,790 15,317 81,107 63 BURRILL S. 85,328 19,788 105,116 10 BURTON J. 64,747 16,504 81,251 1,767 BURTON S. 63,858 15,295 79,153 - BUSS J. 66,030 17,000 83,030 - BUTLER G. 156,517 35,359 191,876 6,677 BUTTS R. 67,447 16,068 83,515 - CABALFIN G. 73,028 10,130 83,158 - CABRERA I. 72,497 21,647 94,144 450 CADER S. 66,487 16,936 83,423 - CALBICK L. 92,832 20,081 112,913 2,654 CALLANDER S. 64,052 15,950 80,002 1,865 CALLISON C. 72,429 16,599 89,028 311 CAMARA C. 71,100 16,650 87,750 - CAMARA M. 73,586 18,271 91,857 - CAMPBELL C. 75,387 16,902 92,289 - CAMPBELL J. 113,069 - 113,069 371 CAMPBELL L. 100,601 27,526 128,127 4,793 CAMPBELL S. 88,788 21,608 110,396 288 CAMPBELL T. 101,930 23,432 125,362 6,102 CAMPO K. 66,552 15,432 81,984 185 CANOFARI S. 103,728 23,573 127,301 5,269 CARAGATA G. 67,576 21,386 88,962 1,044 CARAVETTA M. 81,055 - 81,055 824 CAREY C. 101,702 23,965 125,667 3,949 CAREY D. 83,728 19,490 103,218 - CARLISLE T. 62,977 14,454 77,431 - CARLSON D. 64,147 16,777 80,924 - CARMONT T. 78,729 18,635 97,364 232 CARNEY L. 89,270 - 89,270 - CARPENETTI A. 78,820 18,276 97,096 24 CARPENTER W. 259,182 64,503 323,685 3,306 CARR K. 57,031 22,672 79,703 253 CARREIRO J. 62,429 16,537 78,966 354
Please note: ICBC changed its fiscal year-end from December 31st to March 31st and therefore, the fiscal period ending March 31, 2017 is a 15 month transitory fiscal period. The total amounts reported above represent 15 months of remuneration and expenses.

Statements and Schedules of Financial Information 2016/17
77
Remuneration and expenses paid to employees for the 15 month period ended March 31, 2017
REMUNERATION EXPENSES
EMPLOYEE NAME2016
JAN-DEC (12 MOS.)
2017 JAN-MAR (3 MOS.)
TOTAL
(15 MOS.)
TOTAL
(15 MOS.)
CARRIER H. 72,893 16,902 89,795 176 CARRIERE S. 73,509 16,899 90,408 - CARROLL Y. 77,187 17,158 94,345 76 CARSTENS N. 95,462 21,744 117,206 1,410 CARSWELL A. 73,221 17,017 90,238 - CARSWELL G. 99,552 24,751 124,303 7,933 CARTER J. 140,073 33,169 173,242 1,653 CARTER L. 89,602 20,545 110,147 1,178 CARTER S. 72,765 16,899 89,664 76 CARTIER A. 84,645 19,788 104,433 - CARTWRIGHT K. 87,028 18,729 105,757 - CARUSI A. 80,352 18,332 98,684 738 CARUSI J. 104,107 24,457 128,564 11,140 CARVAJAL L. 109,501 - 109,501 - CARVELL W. 76,991 17,295 94,286 818 CASCON S. 85,946 18,265 104,211 76 CASTEL A. 69,205 15,893 85,098 267 CASTEL S. 79,841 18,433 98,274 176 CASTELLAN A. 71,627 16,584 88,211 315 CASWELL B. 96,649 - 96,649 235 CATLEY T. 92,273 20,980 113,253 - CAUSER M. 68,407 16,554 84,961 992 CAUSTON C. 74,388 18,370 92,758 706 CECILIA A. 78,223 23,797 102,020 - CENTRONE J. 67,494 16,563 84,057 - CHAGLANI A. 75,760 18,116 93,876 - CHAHAL KA. 98,933 16,149 115,082 1,881 CHAHAL KU. 77,099 17,430 94,529 30 CHAMBERLAIN P. 87,067 19,735 106,802 - CHAMBERS J. 61,477 14,534 76,011 76 CHAN AL. 101,255 24,442 125,697 3,040 CHAN AM. 65,801 16,374 82,175 46 CHAN AN. 88,777 20,754 109,531 955 CHAN AN. P.K. 54,078 21,952 76,030 419 CHAN ANN. 75,884 20,290 96,174 1,664 CHAN C. 69,232 16,287 85,519 1,232 CHAN DE. 64,240 13,061 77,301 76 CHAN DO. 83,681 19,079 102,760 279 CHAN HE. 69,013 16,263 85,276 - CHAN HO. 87,803 20,415 108,218 1,142 CHAN K. 55,421 21,503 76,924 - CHAN L. 84,963 20,405 105,368 3,302 CHAN MA. 88,594 22,256 110,850 9 CHAN MO. 64,348 13,398 77,746 - CHAN O. 61,174 13,864 75,038 - CHAN ROB. 101,149 28,702 129,851 25 CHAN RON. 100,129 23,469 123,598 6,666 CHAN S.Y. 121,754 539 122,293 943 CHAN SA. 73,623 20,836 94,459 955
REMUNERATION EXPENSES
EMPLOYEE NAME2016
JAN-DEC (12 MOS.)
2017 JAN-MAR (3 MOS.)
TOTAL
(15 MOS.)
TOTAL
(15 MOS.)
CHAN SE. 88,910 27,666 116,576 955 CHAN T. 143,064 34,062 177,126 1,333 CHAN V. 106,176 23,633 129,809 1,172 CHAN W. 78,921 18,351 97,272 5,316 CHAND A. 72,707 20,234 92,941 70 CHANDRA J. 80,744 19,405 100,149 413 CHANDRA L. 65,787 14,307 80,094 2,086 CHANDRA R. 79,290 17,944 97,234 196 CHANDRA S. 103,823 24,769 128,592 3,646 CHANDRA V. 65,980 15,135 81,115 - CHANG P. 87,030 20,318 107,348 1,356 CHANG R. 99,396 28,885 128,281 8,576 CHANG Z. 76,782 18,661 95,443 943 CHAPMAN S. 88,834 20,108 108,942 733 CHAPUT R. 107,174 296 107,470 255 CHARLESON A. 69,037 13,823 82,860 - CHASE P. 93,324 21,135 114,459 285 CHEADLE L. 78,326 18,269 96,595 1,457 CHEEMA P. 83,781 18,980 102,761 7,515 CHEEMA S. 69,963 16,185 86,148 444 CHELA S. 88,161 22,041 110,202 164 CHEN A. 63,226 12,777 76,003 176 CHEN K. 109,096 42,707 151,803 16 CHEN L. 90,725 23,892 114,617 3,186 CHENG BRA. 57,585 17,646 75,231 - CHENG BRI. 150,624 33,397 184,021 2,229 CHEUNG D. 68,999 20,587 89,586 - CHEUNG J. 71,290 18,051 89,341 3,008 CHEUNG P. 102,352 27,676 130,028 181 CHEUNG R. 74,107 3,810 77,917 571 CHIA N. 68,532 18,198 86,730 176 CHIANG S. 73,160 16,906 90,066 844 CHIN R. 86,560 18,276 104,836 178 CHIN S. 70,484 21,066 91,550 176 CHIU A. 72,511 17,774 90,285 2,498 CHIU C. 112,849 32,590 145,439 1,027 CHIU G. 83,979 19,160 103,139 5,114 CHIU G.L. 91,558 19,767 111,325 317 CHIU L. 61,703 14,307 76,010 - CHIU P. 85,124 22,163 107,287 419 CHIVU M. 63,618 15,218 78,836 943 CHORNEY L. 84,206 19,892 104,098 735 CHORNEY T. 77,296 18,475 95,771 444 CHOU A. 77,601 21,539 99,140 9,507 CHOU J. 67,607 15,917 83,524 2,289 CHOUINARD J. 63,929 15,078 79,007 62 CHOW B. 93,064 24,371 117,435 - CHOW C. 69,853 19,281 89,134 2,454 CHOW KE. 74,840 19,652 94,492 61
Please note: ICBC changed its fiscal year-end from December 31st to March 31st and therefore, the fiscal period ending March 31, 2017 is a 15 month transitory fiscal period. The total amounts reported above represent 15 months of remuneration and expenses.

Insurance Corporation of British Columbia
78
Remuneration and expenses paid to employees for the 15 months period ended March 31, 2017
REMUNERATION EXPENSES
EMPLOYEE NAME2016
JAN-DEC (12 MOS.)
2017 JAN-MAR (3 MOS.)
TOTAL
(15 MOS.)
TOTAL
(15 MOS.)
CHOW KI. 112,621 17,120 129,741 - CHOW M. 107,948 25,457 133,405 2,659 CHRISTENSEN M. 72,906 16,973 89,879 349 CHRISTENSEN ME. 85,357 18,833 104,190 1,005 CHU A. 99,697 24,352 124,049 1,210 CHU S. 74,015 18,013 92,028 181 CHUAH C. 94,488 23,358 117,846 502 CHUKA K. 67,074 15,414 82,488 - CHUNG C. 68,130 16,233 84,363 640 CHUNG D. 79,281 18,315 97,596 1,484 CHUNICK L. 66,075 14,053 80,128 - CIAMPELLETTI J. 88,588 21,398 109,986 1,595 CICHOWSKI J. 72,906 16,905 89,811 - CIOLFITTO T. 74,970 16,822 91,792 - CLANCY D. 162,670 36,742 199,412 670 CLARK C. 70,872 16,491 87,363 304 CLARK T. 63,707 14,522 78,229 573 CLARKE D. 90,200 21,794 111,994 - CLARKE E. 95,778 21,805 117,583 - CLARKE M. 87,178 20,917 108,095 17 CLARKE-SHERMAN C. 77,097 17,374 94,471 - CLIFFORD R. 140,096 32,026 172,122 549 CLINGWALL E. 62,666 18,924 81,590 89 CLOUGH ROB. 71,172 16,254 87,426 - CLOUGH ROD. 74,395 17,116 91,511 - CLUNK L. 63,916 15,730 79,646 - CO E. 65,653 15,623 81,276 - CO S. 63,649 15,496 79,145 - COADY A. 129,065 354 129,419 1,009 COATES W. 109,713 25,624 135,337 2,481 COATTA V. 89,683 20,252 109,935 955 COCKER R. 62,007 18,176 80,183 5,040 COLES D. 62,692 14,483 77,175 437 COLINS S. 72,029 16,663 88,692 375 COLLAZO C. 64,529 14,584 79,113 366 COLLIN R. 85,299 20,262 105,561 76 COLLINGS N. 67,784 16,726 84,510 396 COLLINS L. 68,812 16,937 85,749 121 COMEAU S. 83,153 19,059 102,212 1,690 COMMINS B. 87,183 20,572 107,755 - CONEJEROS STERNER S.
64,932 15,231 80,163 -
CONNOLLY A. 91,543 24,676 116,219 - CONSTABLE C. 87,775 19,997 107,772 262 COOK B. 91,143 25,413 116,556 - COOK C. 93,716 25,560 119,276 - COOKE C. 62,202 14,422 76,624 388 COOMBES S. 78,284 17,921 96,205 -
REMUNERATION EXPENSES
EMPLOYEE NAME2016
JAN-DEC (12 MOS.)
2017 JAN-MAR (3 MOS.)
TOTAL
(15 MOS.)
TOTAL
(15 MOS.)
COOMBS C. 64,041 13,764 77,805 166 COOPER D. 94,853 21,686 116,539 247 CORAPI G. 64,637 15,403 80,040 370 CORAY M. 74,005 17,166 91,171 176 CORDICK G. 62,805 14,283 77,088 134 COREA S. 63,252 19,741 82,993 - COSTER N. 72,659 3,893 76,552 454 COTE A. 61,295 14,427 75,722 - COUGHLAN C. 61,003 15,087 76,090 229 COULTHARD R. 73,873 16,796 90,669 - COWIE K. 82,382 18,223 100,605 119 COWLEY J. 65,836 15,874 81,710 - COX C. 75,448 17,209 92,657 253 COX M. 100,338 27,427 127,765 204 CRAIG B. 101,719 24,617 126,336 1,895 CRAVER S. 179,913 44,451 224,364 17,173 CRAWFORD L. 80,554 17,123 97,677 572 CRAWFORD N. 58,942 16,213 75,155 1,246 CREAMORE D. 64,362 15,606 79,968 - CREECH A. 61,089 14,302 75,391 20 CRIPPS L. 68,396 21,780 90,176 162 CRNKOVIC J. 61,512 15,189 76,701 152 CROMBIE S. 266,658 58,743 325,401 7,697 CROSBY A. 72,916 17,953 90,869 414 CROSS T. 93,555 22,416 115,971 1,109 CRYSLER E. 87,646 20,638 108,284 - CUDLIP A. 121,624 27,463 149,087 5,852 CULOS E. 98,219 23,633 121,852 516 CUMMINS R. 66,360 15,426 81,786 - CURLL S. 80,733 19,220 99,953 - CURRAN J. 78,236 19,165 97,401 - CURRAN P. 62,092 14,986 77,078 111 CURRIE C. 73,020 16,906 89,926 - CUTAIA D. 83,048 18,717 101,765 5,282 CUTHBERT B. 81,831 18,699 100,530 621 CYBULSKI V. 63,605 14,866 78,471 - DAC M. 68,074 17,050 85,124 45 DACOSTA T. 63,518 15,825 79,343 2,054 DALLA PACE G. 62,554 16,391 78,945 264 DALLA ZANNA D. 72,584 16,663 89,247 - DALMAN S. 74,344 17,748 92,092 346 DALUPANG R. 67,777 15,438 83,215 - DAME R. 73,201 16,902 90,103 206 DAMON C. 87,252 21,227 108,479 1,804 DANG B. 66,777 16,032 82,809 10,045 DANG M. 64,587 15,619 80,206 153 DANTU P. 75,069 16,669 91,738 - DAR SANTOS J. 80,485 17,371 97,856 79
Please note: ICBC changed its fiscal year-end from December 31st to March 31st and therefore, the fiscal period ending March 31, 2017 is a 15 month transitory fiscal period. The total amounts reported above represent 15 months of remuneration and expenses.

Statements and Schedules of Financial Information 2016/17
79
Remuneration and expenses paid to employees for the 15 month period ended March 31, 2017
REMUNERATION EXPENSES
EMPLOYEE NAME2016
JAN-DEC (12 MOS.)
2017 JAN-MAR (3 MOS.)
TOTAL
(15 MOS.)
TOTAL
(15 MOS.)
DARKE M. 97,159 22,048 119,207 - DAROUGH-HARDEKOPF B. 66,612 16,483 83,095 2,499 DAUZ C. 70,264 18,759 89,023 943 DAVIDSON B. 84,906 20,775 105,681 650 DAVIS K. 81,474 18,607 100,081 171 DAVIS L. 79,607 18,510 98,117 918 DAVIS S. 93,595 21,249 114,844 1,396 DAWKINS F. 74,906 17,111 92,017 300 DAY C. 66,539 17,211 83,750 210 DAY T. 87,884 20,481 108,365 3,351 DAYHOLOS W. 67,136 15,544 82,680 - DE ASIS L. 82,308 18,980 101,288 955 DE BEAUPRE J. 63,988 16,650 80,638 35 DE BOER J. 67,943 17,747 85,690 23,962 DE GOEDE T. 72,927 16,933 89,860 297 DE LEUR P. 116,572 30,028 146,600 16,881 DE SOUZA M. 57,881 19,401 77,282 - DE ZEN R. 113,858 25,887 139,745 1,768 DEAK M. 80,810 18,926 99,736 176 DEAN D. 110,414 29,534 139,948 30,147 DECICCO A. 74,210 17,131 91,341 98 DEERING S. 90,251 17,857 108,108 558 DEGROOT J. 77,991 18,496 96,487 328 DEKERF J. 70,862 16,142 87,004 - DELA CRUZ C. 69,633 14,926 84,559 176 DELA CRUZ F. 72,716 17,011 89,727 2,849 DELANEY D. 71,238 16,905 88,143 - DELANEY L. 61,572 15,806 77,378 - DELANY M. 66,552 15,432 81,984 610 DELLA-COLETTA B. 85,233 18,151 103,384 399 DELMARK R. 110,762 27,458 138,220 2,758 DEN OUDEN B. 61,684 25,287 86,971 204 DEPOURCQ J. 80,140 18,269 98,409 695 DER K. 84,137 10,749 94,886 - DERBY L. 86,327 19,720 106,047 133 DERINZY L. 77,295 17,214 94,509 40 DESABRAIS B. 129,427 32,690 162,117 1,113 DESHANE R. 94,351 21,457 115,808 193 DESJARLAIS M. 63,313 18,979 82,292 - DEVRIES K. 81,955 19,839 101,794 1,080 DHANANI S. 79,524 24,832 104,356 449 DHANANI Y. 116,213 36,097 152,310 2,007 DHILLON M. 68,313 17,584 85,897 76 DI POMPONIO F. 78,685 18,269 96,954 - DI TOSTO R. 97,542 25,537 123,079 2,143 DIAS R. 111,702 - 111,702 1,396 DICESARE J. 103,399 24,416 127,815 7,777 DICKINSON J. 170,621 38,562 209,183 7,343 DICKSON P. 111,513 25,430 136,943 4,794
REMUNERATION EXPENSES
EMPLOYEE NAME2016
JAN-DEC (12 MOS.)
2017 JAN-MAR (3 MOS.)
TOTAL
(15 MOS.)
TOTAL
(15 MOS.)
DICKSON VAN STOLK 73,650 17,940 91,590 - DIGGENS L. 60,658 14,582 75,240 - DILWORTH J. 117,084 27,689 144,773 4,754 DING P. 78,115 19,181 97,296 - DINGMAN L. 61,198 15,340 76,538 - DINNIE S. 73,555 17,168 90,723 398 DIRK T. 58,801 18,010 76,811 414 DIXON C. 79,405 18,460 97,865 396 DIXON P. 68,243 16,885 85,128 - DJURKOVIC J. 70,058 20,161 90,219 421 DOAN A. 72,711 16,899 89,610 176 DOAN G. 72,024 16,484 88,508 760 DOBROVOLNY J. 64,092 14,619 78,711 176 DOELL L. 77,909 17,735 95,644 114 DOLHANTY J. 66,525 15,916 82,441 488 DOLLARD R. 73,848 16,856 90,704 1,516 DOMES J. 93,108 21,210 114,318 176 DONALD C. 61,342 14,224 75,566 - DONALDSON C. 101,509 23,080 124,589 955 DONALDSON I. 61,573 14,665 76,238 3,514 DONG J. 102,729 23,349 126,078 2,825 DORADEA-CABRERA D. 71,674 17,081 88,755 935 DORAN E. 136,534 33,738 170,272 10,314 DORICIC J. 135,302 32,512 167,814 3,484 DOSANJH J. 86,128 20,943 107,071 206 DOTT J. 73,460 17,310 90,770 - DOUCETTE B. 72,508 18,271 90,779 - DOUGAN D. 71,377 15,435 86,812 101 DOUGLAS C. 72,391 16,727 89,118 371 DOWDELL A. 90,177 18,817 108,994 587 DOWNEY M. 88,827 21,672 110,499 7,310 DOYLE C. 84,048 20,451 104,499 - DRAGOI D. 63,378 14,144 77,522 - DRESKAI E. 67,346 18,085 85,431 - DREW J. 72,064 18,528 90,592 2,821 DREYER P. 139,172 37,669 176,841 8,983 DU PLESSIS A. 131,705 30,346 162,051 2,825 DUCHARME L. 65,968 15,641 81,609 121 DUDLEY A. 113,403 27,765 141,168 566 DUFFIELD J. 74,407 18,503 92,910 1,719 DUMENCU G. 92,173 21,295 113,468 1,033 DUNATOV M. 62,256 15,374 77,630 483 DUNBAR P. 66,928 16,053 82,981 - DUNFORD M. 63,022 14,865 77,887 815 DUONG D. 63,977 17,991 81,968 813 DUPUY C. 61,589 14,073 75,662 - DURKIN T. 61,622 14,884 76,506 1,285 DURRAD D. 80,912 20,888 101,800 - DUSSEAULT T. 82,850 19,134 101,984 10,916
Please note: ICBC changed its fiscal year-end from December 31st to March 31st and therefore, the fiscal period ending March 31, 2017 is a 15 month transitory fiscal period. The total amounts reported above represent 15 months of remuneration and expenses.

Insurance Corporation of British Columbia
80
Remuneration and expenses paid to employees for the 15 months period ended March 31, 2017
REMUNERATION EXPENSES
EMPLOYEE NAME2016
JAN-DEC (12 MOS.)
2017 JAN-MAR (3 MOS.)
TOTAL
(15 MOS.)
TOTAL
(15 MOS.)
DYCK J. 78,945 19,248 98,193 4,475 DYKSTRA J. 64,182 15,494 79,676 - DYNOWSKI R. 69,438 15,438 84,876 - EASTWOOD G. 230,710 54,113 284,823 10,605 ECCLES S. 73,628 16,471 90,099 816 EDEN G. 151,813 40,064 191,877 5,964 EDWARDS B. 106,981 24,310 131,291 2,759 EDWARDS C. 67,553 15,453 83,006 487 EDWARDS R. 72,619 17,817 90,436 - EEUWES J. 75,635 24,998 100,633 10,385 EGAN S. 93,178 25,815 118,993 122 EGLI C. 60,507 19,137 79,644 72 EIN G. 66,437 16,839 83,276 594 ELDEHIMI H. 70,766 16,788 87,554 - ELDER J. 174,105 52,128 226,233 1,753 ELIA J. 62,878 14,758 77,636 1,573 ELIASSON B. 63,389 12,747 76,136 30 ELIOPOULOS N. 61,964 14,307 76,271 - ELLIOTT D. 79,877 17,880 97,757 1,092 ELLIOTT G. 99,338 16,376 115,714 343 ELLIOTT R. 63,625 17,303 80,928 149 ELLIS J. 90,991 23,081 114,072 181 EMERSON J. 84,757 18,453 103,210 244 ENG M. 99,161 23,967 123,128 1,302 EPP T. 66,379 14,206 80,585 879 ERHARDT S. 76,514 16,725 93,239 50 ERICKSON D. 93,242 22,526 115,768 450 ERICKSON M. 71,401 16,487 87,888 - ESPERSEN T. 72,906 16,905 89,811 20 ESTRADA L. 62,589 14,240 76,829 67 ESTRADA M. 68,439 17,062 85,501 - EUPER V. 146,538 34,327 180,865 261 EUSTACE A. 81,412 19,915 101,327 5,287 EVANS C. 63,169 15,190 78,359 1,006 EVANS E. 67,087 15,647 82,734 2,362 EVANS H. 72,905 16,902 89,807 - EVERELL H. 100,148 23,748 123,896 630 EVERELL M. 71,768 16,510 88,278 - EVINGER P. 86,645 20,248 106,893 1,097 EWASIUK W. 78,445 17,290 95,735 28 FAIRBAIRN C. 66,478 16,490 82,968 246 FAIRBRIDGE C. 128,737 30,712 159,449 6,273 FAIRFAX D. 63,271 14,997 78,268 95 FAIRHURST R. 97,875 22,292 120,167 397 FANG M. 91,470 26,945 118,415 156 FANTINIC N. 78,060 22,582 100,642 176 FARR J. 108,417 26,625 135,042 1,617 FARRELL H. 82,284 18,326 100,610 211 FARRELL S. 60,892 14,612 75,504 131
REMUNERATION EXPENSES
EMPLOYEE NAME2016
JAN-DEC (12 MOS.)
2017 JAN-MAR (3 MOS.)
TOTAL
(15 MOS.)
TOTAL
(15 MOS.)
FAULCONER R. 98,660 20,349 119,009 2,044 FAY G. 73,583 21,354 94,937 91 FAZEKAS A. 86,312 20,244 106,556 2,614 FEARS E. 92,678 8,373 101,051 138 FEBBRAIO M. 63,145 15,168 78,313 - FEDERICO E. 91,825 20,222 112,047 - FEDOROFF G. 102,218 23,241 125,459 508 FELIX N. 107,403 24,424 131,827 508 FENGLER B. 69,933 18,274 88,207 24 FERGUSON G. 76,502 22,800 99,302 - FERRARI D. 106,304 24,029 130,333 955 FERTILE K. 72,903 17,136 90,039 40 FIALA P. 75,881 16,972 92,853 1,941 FILIPCHUK D. 89,389 22,175 111,564 276 FINCH S. 86,330 20,145 106,475 623 FINDLAY S. 61,813 14,572 76,385 76 FINK S. 63,715 15,819 79,534 - FINSTAD B. 74,793 16,909 91,702 311 FIORVENTO D. 96,174 23,477 119,651 3,003 FIPKE D. 66,549 15,432 81,981 - FISCHER P. 82,647 20,299 102,946 13 FISHER L. 68,795 15,661 84,456 2,573 FISHER R. 132,993 32,364 165,357 1,161 FLEMING G. 136,441 30,577 167,018 66 FLOTO S. 81,170 20,999 102,169 - FOLEY J. 88,609 21,008 109,617 272 FOLEY M. 94,033 18,569 112,602 803 FONTAINE A. 66,930 15,429 82,359 199 FOORT A. 88,117 20,493 108,610 4,275 FOOT D. 60,998 15,226 76,224 907 FORBES I. 110,775 - 110,775 5,346 FORD D. 91,326 29,009 120,335 1,119 FORMAN B. 70,202 17,286 87,488 2,391 FORMAN J. 107,438 29,303 136,741 4,670 FORREST D. 84,215 19,326 103,541 2,466 FORREST L. 88,898 20,517 109,415 475 FORSTER D. 81,465 18,202 99,667 88 FORSYTH J. 61,005 14,266 75,271 176 FORSYTH M. 66,267 15,429 81,696 11 FOWLER J. 86,672 21,589 108,261 261 FOWLER M. 64,529 14,616 79,145 12 FRAMST D. 76,558 16,902 93,460 176 FRANCIS M. 159,747 43,876 203,623 16,204 FRANCO M. 61,308 15,226 76,534 - FRANKS D. 86,391 26,286 112,677 2,860 FRANKS S. 77,225 17,976 95,201 132 FRANSSEN H. 83,170 18,065 101,235 76 FRANZKE I. 88,206 9,028 97,234 1,986 FRASER E. 84,954 20,429 105,383 387
Please note: ICBC changed its fiscal year-end from December 31st to March 31st and therefore, the fiscal period ending March 31, 2017 is a 15 month transitory fiscal period. The total amounts reported above represent 15 months of remuneration and expenses.
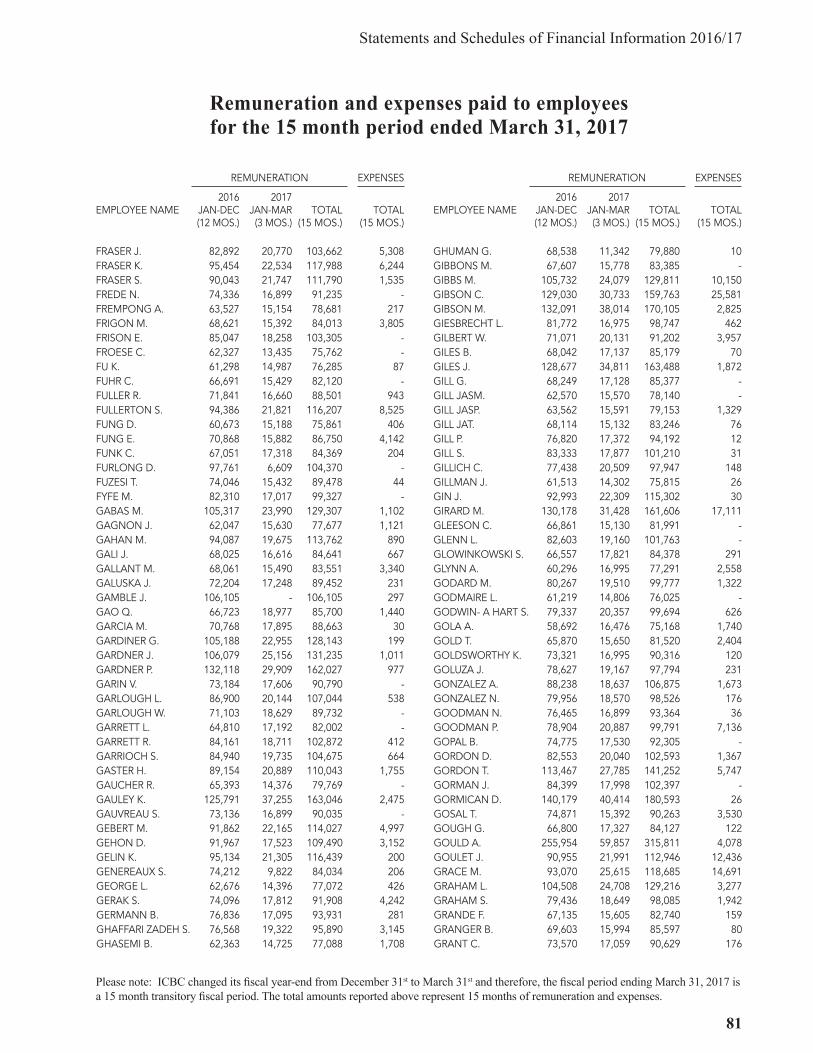
Statements and Schedules of Financial Information 2016/17
81
Remuneration and expenses paid to employees for the 15 month period ended March 31, 2017
REMUNERATION EXPENSES
EMPLOYEE NAME2016
JAN-DEC (12 MOS.)
2017 JAN-MAR (3 MOS.)
TOTAL
(15 MOS.)
TOTAL
(15 MOS.)
FRASER J. 82,892 20,770 103,662 5,308 FRASER K. 95,454 22,534 117,988 6,244 FRASER S. 90,043 21,747 111,790 1,535 FREDE N. 74,336 16,899 91,235 - FREMPONG A. 63,527 15,154 78,681 217 FRIGON M. 68,621 15,392 84,013 3,805 FRISON E. 85,047 18,258 103,305 - FROESE C. 62,327 13,435 75,762 - FU K. 61,298 14,987 76,285 87 FUHR C. 66,691 15,429 82,120 - FULLER R. 71,841 16,660 88,501 943 FULLERTON S. 94,386 21,821 116,207 8,525 FUNG D. 60,673 15,188 75,861 406 FUNG E. 70,868 15,882 86,750 4,142 FUNK C. 67,051 17,318 84,369 204 FURLONG D. 97,761 6,609 104,370 - FUZESI T. 74,046 15,432 89,478 44 FYFE M. 82,310 17,017 99,327 - GABAS M. 105,317 23,990 129,307 1,102 GAGNON J. 62,047 15,630 77,677 1,121 GAHAN M. 94,087 19,675 113,762 890 GALI J. 68,025 16,616 84,641 667 GALLANT M. 68,061 15,490 83,551 3,340 GALUSKA J. 72,204 17,248 89,452 231 GAMBLE J. 106,105 - 106,105 297 GAO Q. 66,723 18,977 85,700 1,440 GARCIA M. 70,768 17,895 88,663 30 GARDINER G. 105,188 22,955 128,143 199 GARDNER J. 106,079 25,156 131,235 1,011 GARDNER P. 132,118 29,909 162,027 977 GARIN V. 73,184 17,606 90,790 - GARLOUGH L. 86,900 20,144 107,044 538 GARLOUGH W. 71,103 18,629 89,732 - GARRETT L. 64,810 17,192 82,002 - GARRETT R. 84,161 18,711 102,872 412 GARRIOCH S. 84,940 19,735 104,675 664 GASTER H. 89,154 20,889 110,043 1,755 GAUCHER R. 65,393 14,376 79,769 - GAULEY K. 125,791 37,255 163,046 2,475 GAUVREAU S. 73,136 16,899 90,035 - GEBERT M. 91,862 22,165 114,027 4,997 GEHON D. 91,967 17,523 109,490 3,152 GELIN K. 95,134 21,305 116,439 200 GENEREAUX S. 74,212 9,822 84,034 206 GEORGE L. 62,676 14,396 77,072 426 GERAK S. 74,096 17,812 91,908 4,242 GERMANN B. 76,836 17,095 93,931 281 GHAFFARI ZADEH S. 76,568 19,322 95,890 3,145 GHASEMI B. 62,363 14,725 77,088 1,708
REMUNERATION EXPENSES
EMPLOYEE NAME2016
JAN-DEC (12 MOS.)
2017 JAN-MAR (3 MOS.)
TOTAL
(15 MOS.)
TOTAL
(15 MOS.)
GHUMAN G. 68,538 11,342 79,880 10 GIBBONS M. 67,607 15,778 83,385 - GIBBS M. 105,732 24,079 129,811 10,150 GIBSON C. 129,030 30,733 159,763 25,581 GIBSON M. 132,091 38,014 170,105 2,825 GIESBRECHT L. 81,772 16,975 98,747 462 GILBERT W. 71,071 20,131 91,202 3,957 GILES B. 68,042 17,137 85,179 70 GILES J. 128,677 34,811 163,488 1,872 GILL G. 68,249 17,128 85,377 - GILL JASM. 62,570 15,570 78,140 - GILL JASP. 63,562 15,591 79,153 1,329 GILL JAT. 68,114 15,132 83,246 76 GILL P. 76,820 17,372 94,192 12 GILL S. 83,333 17,877 101,210 31 GILLICH C. 77,438 20,509 97,947 148 GILLMAN J. 61,513 14,302 75,815 26 GIN J. 92,993 22,309 115,302 30 GIRARD M. 130,178 31,428 161,606 17,111 GLEESON C. 66,861 15,130 81,991 - GLENN L. 82,603 19,160 101,763 - GLOWINKOWSKI S. 66,557 17,821 84,378 291 GLYNN A. 60,296 16,995 77,291 2,558 GODARD M. 80,267 19,510 99,777 1,322 GODMAIRE L. 61,219 14,806 76,025 - GODWIN- A HART S. 79,337 20,357 99,694 626 GOLA A. 58,692 16,476 75,168 1,740 GOLD T. 65,870 15,650 81,520 2,404 GOLDSWORTHY K. 73,321 16,995 90,316 120 GOLUZA J. 78,627 19,167 97,794 231 GONZALEZ A. 88,238 18,637 106,875 1,673 GONZALEZ N. 79,956 18,570 98,526 176 GOODMAN N. 76,465 16,899 93,364 36 GOODMAN P. 78,904 20,887 99,791 7,136 GOPAL B. 74,775 17,530 92,305 - GORDON D. 82,553 20,040 102,593 1,367 GORDON T. 113,467 27,785 141,252 5,747 GORMAN J. 84,399 17,998 102,397 - GORMICAN D. 140,179 40,414 180,593 26 GOSAL T. 74,871 15,392 90,263 3,530 GOUGH G. 66,800 17,327 84,127 122 GOULD A. 255,954 59,857 315,811 4,078 GOULET J. 90,955 21,991 112,946 12,436 GRACE M. 93,070 25,615 118,685 14,691 GRAHAM L. 104,508 24,708 129,216 3,277 GRAHAM S. 79,436 18,649 98,085 1,942 GRANDE F. 67,135 15,605 82,740 159 GRANGER B. 69,603 15,994 85,597 80 GRANT C. 73,570 17,059 90,629 176
Please note: ICBC changed its fiscal year-end from December 31st to March 31st and therefore, the fiscal period ending March 31, 2017 is a 15 month transitory fiscal period. The total amounts reported above represent 15 months of remuneration and expenses.
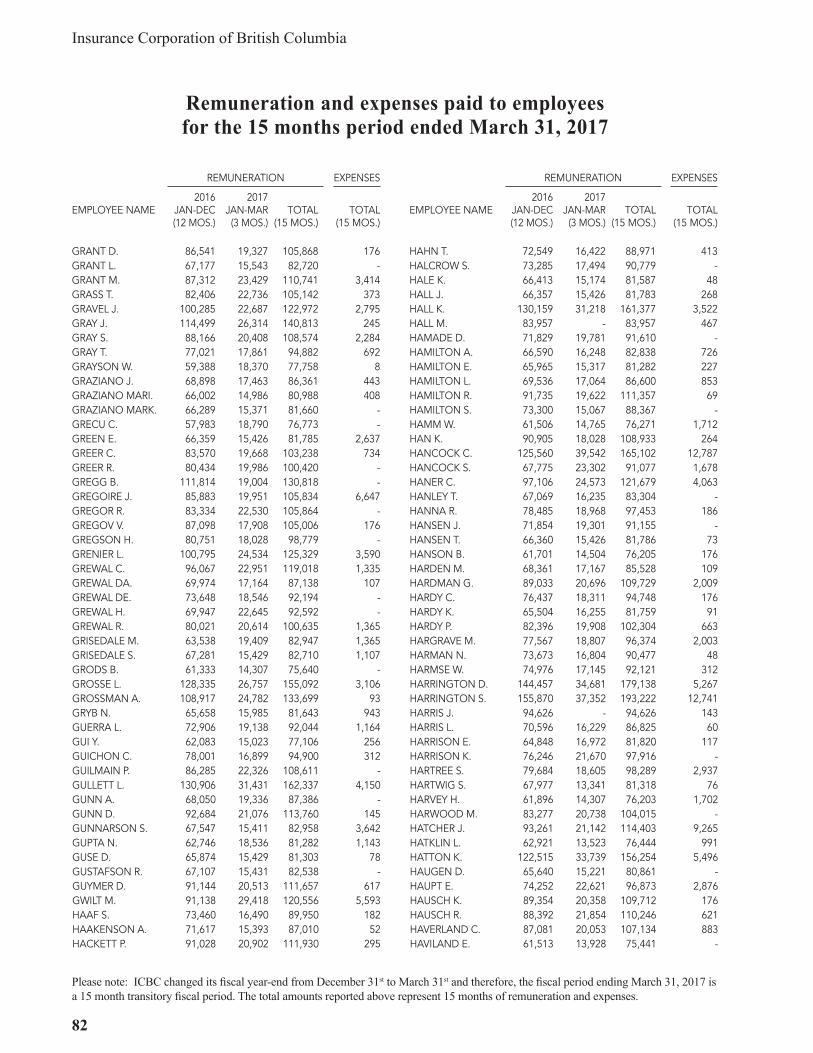
Insurance Corporation of British Columbia
82
Remuneration and expenses paid to employees for the 15 months period ended March 31, 2017
REMUNERATION EXPENSES
EMPLOYEE NAME2016
JAN-DEC (12 MOS.)
2017 JAN-MAR (3 MOS.)
TOTAL
(15 MOS.)
TOTAL
(15 MOS.)
GRANT D. 86,541 19,327 105,868 176 GRANT L. 67,177 15,543 82,720 - GRANT M. 87,312 23,429 110,741 3,414 GRASS T. 82,406 22,736 105,142 373 GRAVEL J. 100,285 22,687 122,972 2,795 GRAY J. 114,499 26,314 140,813 245 GRAY S. 88,166 20,408 108,574 2,284 GRAY T. 77,021 17,861 94,882 692 GRAYSON W. 59,388 18,370 77,758 8 GRAZIANO J. 68,898 17,463 86,361 443 GRAZIANO MARI. 66,002 14,986 80,988 408 GRAZIANO MARK. 66,289 15,371 81,660 - GRECU C. 57,983 18,790 76,773 - GREEN E. 66,359 15,426 81,785 2,637 GREER C. 83,570 19,668 103,238 734 GREER R. 80,434 19,986 100,420 - GREGG B. 111,814 19,004 130,818 - GREGOIRE J. 85,883 19,951 105,834 6,647 GREGOR R. 83,334 22,530 105,864 - GREGOV V. 87,098 17,908 105,006 176 GREGSON H. 80,751 18,028 98,779 - GRENIER L. 100,795 24,534 125,329 3,590 GREWAL C. 96,067 22,951 119,018 1,335 GREWAL DA. 69,974 17,164 87,138 107 GREWAL DE. 73,648 18,546 92,194 - GREWAL H. 69,947 22,645 92,592 - GREWAL R. 80,021 20,614 100,635 1,365 GRISEDALE M. 63,538 19,409 82,947 1,365 GRISEDALE S. 67,281 15,429 82,710 1,107 GRODS B. 61,333 14,307 75,640 - GROSSE L. 128,335 26,757 155,092 3,106 GROSSMAN A. 108,917 24,782 133,699 93 GRYB N. 65,658 15,985 81,643 943 GUERRA L. 72,906 19,138 92,044 1,164 GUI Y. 62,083 15,023 77,106 256 GUICHON C. 78,001 16,899 94,900 312 GUILMAIN P. 86,285 22,326 108,611 - GULLETT L. 130,906 31,431 162,337 4,150 GUNN A. 68,050 19,336 87,386 - GUNN D. 92,684 21,076 113,760 145 GUNNARSON S. 67,547 15,411 82,958 3,642 GUPTA N. 62,746 18,536 81,282 1,143 GUSE D. 65,874 15,429 81,303 78 GUSTAFSON R. 67,107 15,431 82,538 - GUYMER D. 91,144 20,513 111,657 617 GWILT M. 91,138 29,418 120,556 5,593 HAAF S. 73,460 16,490 89,950 182 HAAKENSON A. 71,617 15,393 87,010 52 HACKETT P. 91,028 20,902 111,930 295
REMUNERATION EXPENSES
EMPLOYEE NAME2016
JAN-DEC (12 MOS.)
2017 JAN-MAR (3 MOS.)
TOTAL
(15 MOS.)
TOTAL
(15 MOS.)
HAHN T. 72,549 16,422 88,971 413 HALCROW S. 73,285 17,494 90,779 - HALE K. 66,413 15,174 81,587 48 HALL J. 66,357 15,426 81,783 268 HALL K. 130,159 31,218 161,377 3,522 HALL M. 83,957 - 83,957 467 HAMADE D. 71,829 19,781 91,610 - HAMILTON A. 66,590 16,248 82,838 726 HAMILTON E. 65,965 15,317 81,282 227 HAMILTON L. 69,536 17,064 86,600 853 HAMILTON R. 91,735 19,622 111,357 69 HAMILTON S. 73,300 15,067 88,367 - HAMM W. 61,506 14,765 76,271 1,712 HAN K. 90,905 18,028 108,933 264 HANCOCK C. 125,560 39,542 165,102 12,787 HANCOCK S. 67,775 23,302 91,077 1,678 HANER C. 97,106 24,573 121,679 4,063 HANLEY T. 67,069 16,235 83,304 - HANNA R. 78,485 18,968 97,453 186 HANSEN J. 71,854 19,301 91,155 - HANSEN T. 66,360 15,426 81,786 73 HANSON B. 61,701 14,504 76,205 176 HARDEN M. 68,361 17,167 85,528 109 HARDMAN G. 89,033 20,696 109,729 2,009 HARDY C. 76,437 18,311 94,748 176 HARDY K. 65,504 16,255 81,759 91 HARDY P. 82,396 19,908 102,304 663 HARGRAVE M. 77,567 18,807 96,374 2,003 HARMAN N. 73,673 16,804 90,477 48 HARMSE W. 74,976 17,145 92,121 312 HARRINGTON D. 144,457 34,681 179,138 5,267 HARRINGTON S. 155,870 37,352 193,222 12,741 HARRIS J. 94,626 - 94,626 143 HARRIS L. 70,596 16,229 86,825 60 HARRISON E. 64,848 16,972 81,820 117 HARRISON K. 76,246 21,670 97,916 - HARTREE S. 79,684 18,605 98,289 2,937 HARTWIG S. 67,977 13,341 81,318 76 HARVEY H. 61,896 14,307 76,203 1,702 HARWOOD M. 83,277 20,738 104,015 - HATCHER J. 93,261 21,142 114,403 9,265 HATKLIN L. 62,921 13,523 76,444 991 HATTON K. 122,515 33,739 156,254 5,496 HAUGEN D. 65,640 15,221 80,861 - HAUPT E. 74,252 22,621 96,873 2,876 HAUSCH K. 89,354 20,358 109,712 176 HAUSCH R. 88,392 21,854 110,246 621 HAVERLAND C. 87,081 20,053 107,134 883 HAVILAND E. 61,513 13,928 75,441 -
Please note: ICBC changed its fiscal year-end from December 31st to March 31st and therefore, the fiscal period ending March 31, 2017 is a 15 month transitory fiscal period. The total amounts reported above represent 15 months of remuneration and expenses.

Statements and Schedules of Financial Information 2016/17
83
Remuneration and expenses paid to employees for the 15 month period ended March 31, 2017
REMUNERATION EXPENSES
EMPLOYEE NAME2016
JAN-DEC (12 MOS.)
2017 JAN-MAR (3 MOS.)
TOTAL
(15 MOS.)
TOTAL
(15 MOS.)
HAWK S. 85,681 18,738 104,419 363 HAWKINS M. 61,418 15,411 76,829 - HAY N. 61,181 16,374 77,555 180 HAYDEN M. 108,525 24,863 133,388 1,529 HAYES B. 65,525 16,205 81,730 - HAYWARD G. 93,422 22,455 115,877 5,635 HAYWARD L. 75,465 18,060 93,525 544 HAZLETT C. 81,417 18,092 99,509 - HAZLETT M. 92,862 21,351 114,213 1,702 HEALY I. 62,649 16,138 78,787 4,629 HEAP L. 80,254 18,446 98,700 289 HECIMOVIC M. 61,704 14,307 76,011 - HEER A. 73,432 13,829 87,261 962 HEERSAHOTA S. 68,933 20,378 89,311 3,753 HEESE R. 85,347 19,490 104,837 707 HEGINBOTTOM J. 98,304 25,475 123,779 1,337 HEIDNER J. 71,546 16,326 87,872 312 HEILMAN M. 73,611 17,068 90,679 176 HEINZ S. 65,549 15,449 80,998 441 HEISKANEN B. 79,542 18,273 97,815 485 HEMBROUGH S. 137,409 29,372 166,781 16,988 HENDERSON D. 129,041 29,144 158,185 - HENDRIKSEN L. 73,542 17,576 91,118 16 HENG D. 78,480 19,649 98,129 524 HEPBURN J. 77,406 18,919 96,325 - HEPHER K. 104,527 23,610 128,137 730 HERBOSA W. 75,149 18,738 93,887 - HERTSLET B. 65,354 16,835 82,189 - HERTSLET D. 97,435 23,539 120,974 4,047 HESLOP K. 67,999 14,572 82,571 1,337 HESSE P. 79,007 19,118 98,125 139 HEUCHERT T. 119,156 27,087 146,243 3,253 HEWITT D. 64,425 14,314 78,739 21 HEYE C. 63,523 12,905 76,428 76 HIBBERT L. 107,376 25,984 133,360 3,972 HICKEY B. 72,932 17,309 90,241 298 HIEBERT B. 78,158 17,530 95,688 49,950 HIEBERT D. 74,653 17,943 92,596 162 HIEBERT J. 69,536 17,877 87,413 231 HIEBERT K. 98,906 25,568 124,474 4,868 HIGGINS CA. 69,258 17,533 86,791 1,380 HIGGINS CO. 71,839 16,071 87,910 1,857 HILL DAR. 70,836 15,439 86,275 870 HILL DAV. 116,532 25,549 142,081 9,695 HILL G. 111,295 26,702 137,997 215 HILL M. 80,531 19,467 99,998 57 HILLIAM K. 89,537 10,633 100,170 670 HINTON M. 111,754 27,237 138,991 3,034 HIRA L. 70,486 16,912 87,398 540
REMUNERATION EXPENSES
EMPLOYEE NAME2016
JAN-DEC (12 MOS.)
2017 JAN-MAR (3 MOS.)
TOTAL
(15 MOS.)
TOTAL
(15 MOS.)
HIZON E. 143,527 39,552 183,079 419 HO C.K. 89,094 22,691 111,785 - HO CL. 67,679 15,194 82,873 2,814 HO I. 71,094 18,067 89,161 - HODGES L. 60,746 14,297 75,043 - HOEY J. 129,984 31,518 161,502 858 HOHLBEIN L. 66,999 15,645 82,644 3,494 HOLEKSA C. 79,849 18,034 97,883 107 HOLLAND G. 107,694 17,628 125,322 - HOLLAND S. 130,203 21,245 151,448 - HOLLEFREUND G. 105,883 24,110 129,993 8,066 HOLMAN J. 66,105 15,688 81,793 - HONEYMAN K. 70,346 16,691 87,037 - HOOTON A. 127,847 29,122 156,969 556 HOPKINS D. 100,712 21,901 122,613 286 HORNE J. 142,615 37,249 179,864 7,894 HORROCKS B. 129,548 30,277 159,825 1,608 HORVATH J. 93,176 20,060 113,236 - HOSKINS B. 94,051 25,579 119,630 1,843 HOSKINS J. 72,464 15,881 88,345 265 HOU J. 67,036 15,506 82,542 25 HOWARD A. 93,124 21,221 114,345 1,280 HOWARD H. 78,821 18,276 97,097 17 HOWARD P. 72,710 16,899 89,609 282 HOWARTH C. 72,708 16,899 89,607 - HOY B. 61,948 14,553 76,501 - HSU N. 101,099 22,920 124,019 9,723 HSU S. 62,736 15,252 77,988 2,223 HU T. 78,511 17,577 96,088 2,823 HUBER J. 85,073 18,823 103,896 1,723 HUGGINS P. 106,803 25,458 132,261 4,921 HUGHES E. 76,337 18,279 94,616 - HUGHES K. 82,554 19,131 101,685 5,276 HUH S. 72,517 19,133 91,650 - HUI A. 62,650 17,349 79,999 35 HUI J. 86,423 19,264 105,687 - HUI K. 82,500 22,905 105,405 176 HUI P. 87,269 21,127 108,396 - HUIE V. 63,161 15,495 78,656 239 HULL R. 67,340 15,549 82,889 - HUNDAL K. 90,985 28,322 119,307 - HUNDAL S. 62,962 15,126 78,088 1,011 HURZIN B. 79,800 18,298 98,098 224 HUSBAND D. 71,763 17,648 89,411 3,208 HUTCHON H. 76,026 10,005 86,031 - HUTSON J. 79,743 14,656 94,399 370 HUTTRAM L. 72,721 16,899 89,620 176 HUXLEY K. 96,759 21,965 118,724 6,900 IACOBAZZI E. 103,660 22,819 126,479 209
Please note: ICBC changed its fiscal year-end from December 31st to March 31st and therefore, the fiscal period ending March 31, 2017 is a 15 month transitory fiscal period. The total amounts reported above represent 15 months of remuneration and expenses.
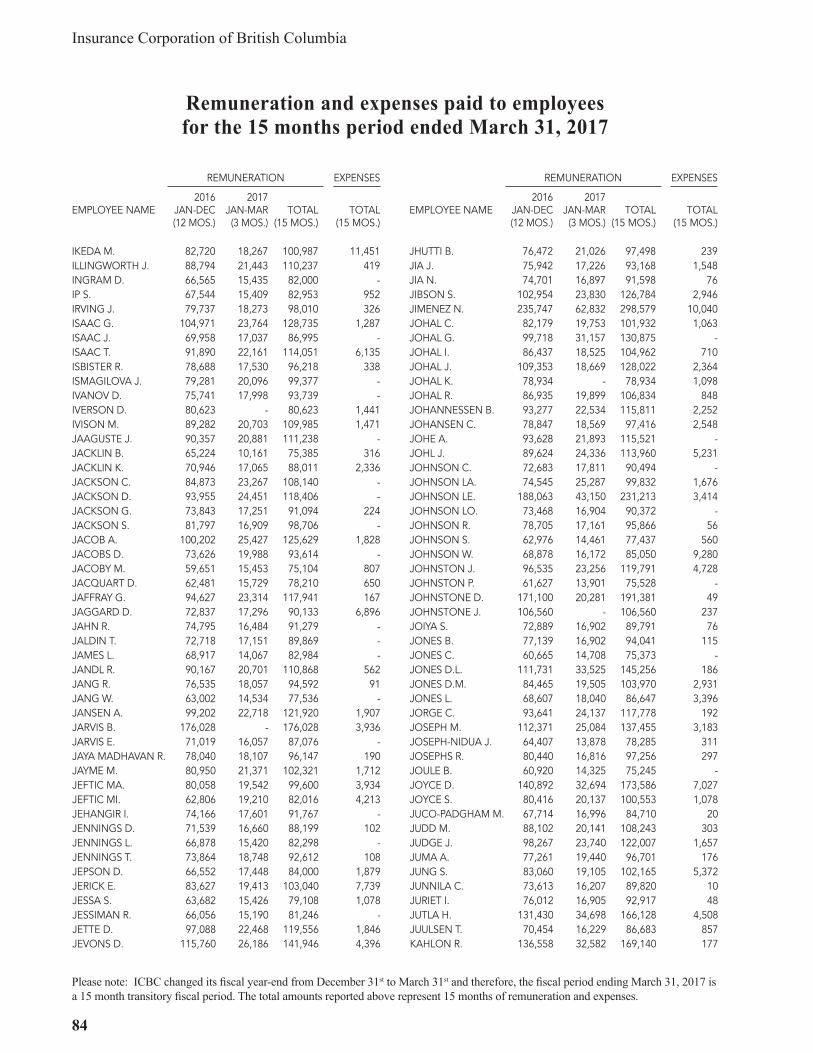
Insurance Corporation of British Columbia
84
Remuneration and expenses paid to employees for the 15 months period ended March 31, 2017
REMUNERATION EXPENSES
EMPLOYEE NAME2016
JAN-DEC (12 MOS.)
2017 JAN-MAR (3 MOS.)
TOTAL
(15 MOS.)
TOTAL
(15 MOS.)
IKEDA M. 82,720 18,267 100,987 11,451 ILLINGWORTH J. 88,794 21,443 110,237 419 INGRAM D. 66,565 15,435 82,000 - IP S. 67,544 15,409 82,953 952 IRVING J. 79,737 18,273 98,010 326 ISAAC G. 104,971 23,764 128,735 1,287 ISAAC J. 69,958 17,037 86,995 - ISAAC T. 91,890 22,161 114,051 6,135 ISBISTER R. 78,688 17,530 96,218 338 ISMAGILOVA J. 79,281 20,096 99,377 - IVANOV D. 75,741 17,998 93,739 - IVERSON D. 80,623 - 80,623 1,441 IVISON M. 89,282 20,703 109,985 1,471 JAAGUSTE J. 90,357 20,881 111,238 - JACKLIN B. 65,224 10,161 75,385 316 JACKLIN K. 70,946 17,065 88,011 2,336 JACKSON C. 84,873 23,267 108,140 - JACKSON D. 93,955 24,451 118,406 - JACKSON G. 73,843 17,251 91,094 224 JACKSON S. 81,797 16,909 98,706 - JACOB A. 100,202 25,427 125,629 1,828 JACOBS D. 73,626 19,988 93,614 - JACOBY M. 59,651 15,453 75,104 807 JACQUART D. 62,481 15,729 78,210 650 JAFFRAY G. 94,627 23,314 117,941 167 JAGGARD D. 72,837 17,296 90,133 6,896 JAHN R. 74,795 16,484 91,279 - JALDIN T. 72,718 17,151 89,869 - JAMES L. 68,917 14,067 82,984 - JANDL R. 90,167 20,701 110,868 562 JANG R. 76,535 18,057 94,592 91 JANG W. 63,002 14,534 77,536 - JANSEN A. 99,202 22,718 121,920 1,907 JARVIS B. 176,028 - 176,028 3,936 JARVIS E. 71,019 16,057 87,076 - JAYA MADHAVAN R. 78,040 18,107 96,147 190 JAYME M. 80,950 21,371 102,321 1,712 JEFTIC MA. 80,058 19,542 99,600 3,934 JEFTIC MI. 62,806 19,210 82,016 4,213 JEHANGIR I. 74,166 17,601 91,767 - JENNINGS D. 71,539 16,660 88,199 102 JENNINGS L. 66,878 15,420 82,298 - JENNINGS T. 73,864 18,748 92,612 108 JEPSON D. 66,552 17,448 84,000 1,879 JERICK E. 83,627 19,413 103,040 7,739 JESSA S. 63,682 15,426 79,108 1,078 JESSIMAN R. 66,056 15,190 81,246 - JETTE D. 97,088 22,468 119,556 1,846 JEVONS D. 115,760 26,186 141,946 4,396
REMUNERATION EXPENSES
EMPLOYEE NAME2016
JAN-DEC (12 MOS.)
2017 JAN-MAR (3 MOS.)
TOTAL
(15 MOS.)
TOTAL
(15 MOS.)
JHUTTI B. 76,472 21,026 97,498 239 JIA J. 75,942 17,226 93,168 1,548 JIA N. 74,701 16,897 91,598 76 JIBSON S. 102,954 23,830 126,784 2,946 JIMENEZ N. 235,747 62,832 298,579 10,040 JOHAL C. 82,179 19,753 101,932 1,063 JOHAL G. 99,718 31,157 130,875 - JOHAL I. 86,437 18,525 104,962 710 JOHAL J. 109,353 18,669 128,022 2,364 JOHAL K. 78,934 - 78,934 1,098 JOHAL R. 86,935 19,899 106,834 848 JOHANNESSEN B. 93,277 22,534 115,811 2,252 JOHANSEN C. 78,847 18,569 97,416 2,548 JOHE A. 93,628 21,893 115,521 - JOHL J. 89,624 24,336 113,960 5,231 JOHNSON C. 72,683 17,811 90,494 - JOHNSON LA. 74,545 25,287 99,832 1,676 JOHNSON LE. 188,063 43,150 231,213 3,414 JOHNSON LO. 73,468 16,904 90,372 - JOHNSON R. 78,705 17,161 95,866 56 JOHNSON S. 62,976 14,461 77,437 560 JOHNSON W. 68,878 16,172 85,050 9,280 JOHNSTON J. 96,535 23,256 119,791 4,728 JOHNSTON P. 61,627 13,901 75,528 - JOHNSTONE D. 171,100 20,281 191,381 49 JOHNSTONE J. 106,560 - 106,560 237 JOIYA S. 72,889 16,902 89,791 76 JONES B. 77,139 16,902 94,041 115 JONES C. 60,665 14,708 75,373 - JONES D.L. 111,731 33,525 145,256 186 JONES D.M. 84,465 19,505 103,970 2,931 JONES L. 68,607 18,040 86,647 3,396 JORGE C. 93,641 24,137 117,778 192 JOSEPH M. 112,371 25,084 137,455 3,183 JOSEPH-NIDUA J. 64,407 13,878 78,285 311 JOSEPHS R. 80,440 16,816 97,256 297 JOULE B. 60,920 14,325 75,245 - JOYCE D. 140,892 32,694 173,586 7,027 JOYCE S. 80,416 20,137 100,553 1,078 JUCO-PADGHAM M. 67,714 16,996 84,710 20 JUDD M. 88,102 20,141 108,243 303 JUDGE J. 98,267 23,740 122,007 1,657 JUMA A. 77,261 19,440 96,701 176 JUNG S. 83,060 19,105 102,165 5,372 JUNNILA C. 73,613 16,207 89,820 10 JURIET I. 76,012 16,905 92,917 48 JUTLA H. 131,430 34,698 166,128 4,508 JUULSEN T. 70,454 16,229 86,683 857 KAHLON R. 136,558 32,582 169,140 177
Please note: ICBC changed its fiscal year-end from December 31st to March 31st and therefore, the fiscal period ending March 31, 2017 is a 15 month transitory fiscal period. The total amounts reported above represent 15 months of remuneration and expenses.

Statements and Schedules of Financial Information 2016/17
85
Remuneration and expenses paid to employees for the 15 month period ended March 31, 2017
REMUNERATION EXPENSES
EMPLOYEE NAME2016
JAN-DEC (12 MOS.)
2017 JAN-MAR (3 MOS.)
TOTAL
(15 MOS.)
TOTAL
(15 MOS.)
KAILA G. 64,763 16,476 81,239 58 KAILA N. 123,210 32,222 155,432 - KAILA-GREWAL I. 80,503 20,724 101,227 478 KAJI J. 80,548 18,269 98,817 - KAJIWARA D. 80,641 18,641 99,282 1,385 KALISCH G. 74,374 17,532 91,906 13 KAMBO J. 63,162 15,268 78,430 178 KAMBOH C. 79,167 18,187 97,354 496 KAN C. 111,453 25,384 136,837 - KAN J. 78,877 18,507 97,384 3,572 KAN R. 101,047 22,303 123,350 - KANANI R. 80,365 24,022 104,387 - KANDA S. 72,440 17,427 89,867 4,985 KARP S. 75,470 17,577 93,047 166 KARPINSKI L. 65,926 15,306 81,232 - KATINIC A. 64,827 14,993 79,820 30 KAUFMANN K. 107,047 24,172 131,219 3,539 KAVANAUGH N. 67,945 16,730 84,675 4,684 KAYSER M. 80,243 20,188 100,431 1,688 KAZAKOFF B. 62,381 14,304 76,685 891 KEGLER B. 101,740 28,737 130,477 5,193 KEKS L. 92,764 21,131 113,895 2,741 KEKS LA. 72,644 16,909 89,553 - KELENY R. 92,574 21,080 113,654 1,274 KELENY W. 72,067 16,164 88,231 76 KELLERMAN F. 68,130 16,597 84,727 289 KELLETT T. 100,275 25,042 125,317 177 KELLY M. 82,449 19,157 101,606 - KELSO S. 62,990 12,346 75,336 25 KEMP P. 171,423 42,496 213,919 8,512 KEMPLING N. 88,125 21,959 110,084 4,787 KENNEDY H. 61,002 15,197 76,199 9 KENNEDY J. 83,069 16,691 99,760 - KENNEDY S. 76,212 19,249 95,461 - KENNELLY-MOHR B. 77,693 18,260 95,953 206 KENNEY L. 103,650 28,465 132,115 - KEOUGH D. 98,647 23,622 122,269 8,561 KHAKH G. 75,765 18,640 94,405 181 KHAN R. 60,951 14,402 75,353 3,970 KHAN S. 95,059 26,328 121,387 - KHOR J. 77,399 19,198 96,597 3,567 KIDD C. 70,572 18,218 88,790 45 KILAND L. 74,164 17,057 91,221 866 KILBRAI T. 74,131 16,902 91,033 - KILPATRICK A. 69,815 17,452 87,267 - KILPATRICK J. 120,350 28,862 149,212 176 KIM D. 74,119 17,564 91,683 153 KIM H. 87,072 23,100 110,172 - KIM J. 89,956 20,493 110,449 1,137
REMUNERATION EXPENSES
EMPLOYEE NAME2016
JAN-DEC (12 MOS.)
2017 JAN-MAR (3 MOS.)
TOTAL
(15 MOS.)
TOTAL
(15 MOS.)
KIM M. 60,545 14,929 75,474 - KIM SE. 107,976 26,091 134,067 419 KIM SI. 67,471 17,806 85,277 100 KIMBLE M. 82,439 22,645 105,084 1,567 KIMURA D. 63,633 20,174 83,807 935 KING D. 74,800 18,958 93,758 25 KING D.J. 76,989 16,902 93,891 135 KING J. 66,156 15,958 82,114 2,562 KINSEY W. 63,258 15,725 78,983 35 KIRBY C. 76,602 17,802 94,404 11,592 KIRKBY C. 60,078 15,279 75,357 - KIRKHAM R. 159,292 44,235 203,527 7,607 KISSINGER A. 61,583 14,302 75,885 12 KJERSIDE H. 75,269 19,718 94,987 - KLASSEN J. 65,501 15,190 80,691 - KLEEFSTRA Z. 101,227 23,366 124,593 3,478 KLEIN B. 63,874 15,011 78,885 - KLEIN K. 76,031 17,748 93,779 12,038 KLER K. 73,684 17,408 91,092 253 KLETTKE H. 62,051 14,418 76,469 9 KLOCKENBRINK N. 87,028 19,009 106,037 4,036 KLOOSTERMAN G. 66,412 16,421 82,833 22 KLYMCHUK R. 77,020 17,861 94,881 378 KNAPP M. 68,841 18,215 87,056 48 KNIPPELBERG S. 71,026 17,249 88,275 - KO E. 103,350 23,526 126,876 - KOBLANSKI T. 65,429 15,588 81,017 - KOCHUBIEVSKY Y. 84,993 19,601 104,594 3,828 KOENEN A. 92,323 22,265 114,588 2,327 KOIVUKANGAS A. 72,903 16,905 89,808 - KOLE D. 65,771 16,646 82,417 162 KOLOCKA Z. 75,037 17,635 92,672 376 KOLODZINSKI G. 80,804 18,382 99,186 1,607 KON D. 67,056 14,954 82,010 3,184 KONG J. 89,805 21,398 111,203 659 KONG S. 82,291 17,141 99,432 - KOONAR H. 69,799 16,880 86,679 76 KOONER H. 76,402 18,667 95,069 11,179 KOPCHUK K. 77,775 20,246 98,021 145 KOSKI M. 86,715 19,510 106,225 1,518 KOSTUR J. 105,427 28,058 133,485 1,552 KOSTUR S. 88,699 25,524 114,223 1,552 KOTSABOIKIDIS H. 79,845 19,890 99,735 6,039 KOUDI N. 105,936 26,408 132,344 - KOZAK J. 76,421 17,629 94,050 - KOZAR J. 90,122 24,297 114,419 132 KRANJC S. 80,022 18,209 98,231 98 KRIMMER J. 66,104 16,581 82,685 1,027 KRISTOPAITIS A. 83,372 18,700 102,072 693
Please note: ICBC changed its fiscal year-end from December 31st to March 31st and therefore, the fiscal period ending March 31, 2017 is a 15 month transitory fiscal period. The total amounts reported above represent 15 months of remuneration and expenses.

Insurance Corporation of British Columbia
86
Remuneration and expenses paid to employees for the 15 months period ended March 31, 2017
REMUNERATION EXPENSES
EMPLOYEE NAME2016
JAN-DEC (12 MOS.)
2017 JAN-MAR (3 MOS.)
TOTAL
(15 MOS.)
TOTAL
(15 MOS.)
KRUSEL R. 85,854 21,914 107,768 181 KUCHER L. 113,054 29,124 142,178 11,291 KUEHN A. 71,855 16,490 88,345 132 KULLMAN N. 105,581 28,470 134,051 100 KUMAR P. 71,164 19,266 90,430 - KUMAR R. 87,021 18,984 106,005 157 KUMAR S. 95,858 22,226 118,084 1,547 KUMARAN S. 71,294 16,048 87,342 - KUNG M. 92,305 27,974 120,279 - KUNZER A. 93,880 23,262 117,142 2,790 KUPCHUK T. 65,037 15,648 80,685 - KUUN J. 74,344 15,661 90,005 - KUXHOUSE Y. 83,209 18,305 101,514 226 KWAN A. 91,587 22,489 114,076 168 KWAN H. 83,802 21,474 105,276 - KWAN J.Y. 117,576 27,599 145,175 9,672 KWAN JE. 61,610 15,531 77,141 4,048 KWON T. 89,095 22,465 111,560 - KWONG E. 99,398 22,605 122,003 - LABERMEYER J. 98,199 22,711 120,910 552 LABOUCAN K. 66,477 18,200 84,677 - LAC H. 78,763 20,034 98,797 1,496 LACHANAS M. 86,906 18,865 105,771 80 LACHLAN D. 68,524 15,832 84,356 1,337 LADIWALA Z. 63,293 15,268 78,561 76 LAFLEUR T. 134,002 38,612 172,614 66 LAFORTUNE M. 59,545 16,284 75,829 169 LAI A. 71,672 13,135 84,807 - LAI G. 90,104 20,839 110,943 - LAI S. 76,383 20,223 96,606 295 LAINE V. 63,959 14,306 78,265 - LAING J. 66,910 15,429 82,339 - LAING L. 71,110 18,279 89,389 30,768 LAL J. 63,263 15,114 78,377 152 LAL S. 73,558 20,280 93,838 - LALONDE L. 162,739 37,593 200,332 33,941 LAM C. 70,466 20,489 90,955 328 LAM R. 83,198 20,591 103,789 2,355 LAMB D. 66,425 15,429 81,854 110 LAMBERT P. 89,234 20,260 109,494 - LAMONT G. 72,708 16,899 89,607 183 LANE E. 77,632 18,273 95,905 477 LANG G. 77,573 17,082 94,655 204 LANGEVIN Y. 79,867 18,668 98,535 - LANGILLE L. 65,501 15,190 80,691 76 LANGTRY P. 85,818 19,899 105,717 646 LARKE J. 92,229 20,923 113,152 1,925 LAROSE L. 66,697 15,694 82,391 32 LARSEN P. 119,937 27,919 147,856 76
REMUNERATION EXPENSES
EMPLOYEE NAME2016
JAN-DEC (12 MOS.)
2017 JAN-MAR (3 MOS.)
TOTAL
(15 MOS.)
TOTAL
(15 MOS.)
LAST A. 61,104 14,307 75,411 - LAU A. 66,305 16,193 82,498 - LAU E. 94,863 22,166 117,029 - LAU F. 71,762 17,221 88,983 3,990 LAU H. 62,428 14,466 76,894 40 LAU J. 77,977 20,789 98,766 - LAU M. 61,572 15,198 76,770 25 LAUDADIO S. 117,747 29,675 147,422 6,125 LAUGUICO K. 69,308 17,389 86,697 248 LAUREL D. 73,955 17,761 91,716 752 LAURIE K. 65,888 16,563 82,451 - LAVIE E. 92,199 21,150 113,349 3,100 LAW D. 69,179 16,308 85,487 - LAW J. 138,463 33,401 171,864 2,937 LE D. 66,625 16,427 83,052 - LEARNED D. 79,457 18,657 98,114 810 LEBRUN D. 113,618 28,066 141,684 4,358 LEBRUN M. 95,299 21,756 117,055 5,283 LEDUC B. 58,875 17,627 76,502 - LEDUC E. 69,854 16,838 86,692 113 LEE AL. 97,300 22,129 119,429 2,020 LEE AN. 121,382 29,191 150,573 - LEE B. 80,107 18,538 98,645 496 LEE C. 70,426 16,260 86,686 20 LEE C.M. 63,311 19,153 82,464 - LEE ED. 62,203 15,362 77,565 - LEE ER. 69,815 16,270 86,085 - LEE F. 70,831 14,913 85,744 91 LEE JAC. 95,850 48,418 144,268 885 LEE JAM. 72,210 19,385 91,595 - LEE JEA. 62,712 14,708 77,420 224 LEE JEN. 89,727 22,461 112,188 2,980 LEE KEI. 73,096 18,069 91,165 178 LEE KEV. 90,307 20,718 111,025 1,456 LEE MAR. 130,655 31,251 161,906 4,421 LEE MAY. 100,164 24,199 124,363 4,348 LEE MIC. 64,728 15,263 79,991 884 LEE MIT. 79,870 19,719 99,589 - LEE P.K. 91,948 21,783 113,731 29 LEE RE. 105,175 25,251 130,426 2,371 LEE RY. 83,176 20,081 103,257 394 LEE S. 76,790 18,024 94,814 - LEE T. 79,787 - 79,787 523 LEE VIC. 166,431 40,195 206,626 465 LEE VIN. 85,363 21,289 106,652 - LEE Y.H. 69,545 19,248 88,793 3,313 LEE Y.M. 86,257 21,062 107,319 363 LEESON J. 63,969 13,259 77,228 1,673 LEESON K. 66,858 15,919 82,777 225
Please note: ICBC changed its fiscal year-end from December 31st to March 31st and therefore, the fiscal period ending March 31, 2017 is a 15 month transitory fiscal period. The total amounts reported above represent 15 months of remuneration and expenses.

Statements and Schedules of Financial Information 2016/17
87
Remuneration and expenses paid to employees for the 15 month period ended March 31, 2017
REMUNERATION EXPENSES
EMPLOYEE NAME2016
JAN-DEC (12 MOS.)
2017 JAN-MAR (3 MOS.)
TOTAL
(15 MOS.)
TOTAL
(15 MOS.)
LEE-YOUNG D. 77,343 17,857 95,200 - LEE-YOUNG G. 67,217 12,079 79,296 191 LEGGETT K. 83,752 21,161 104,913 - LEI A. 61,499 14,719 76,218 - LEISHMAN D. 97,620 22,939 120,559 400 LELAND H. 61,175 15,903 77,078 497 LEMIEUX Y. 73,983 16,921 90,904 - LENCOVIC C. 80,482 20,141 100,623 4,680 LENNIE B. 61,406 14,527 75,933 - LEONG P. 199,768 50,555 250,323 7,297 LEONG S. 105,513 - 105,513 2,190 LEPAGE V. 141,519 33,993 175,512 3,880 LEROSE J. 125,611 30,094 155,705 3,314 LEROUX M. 97,870 23,660 121,530 3,489 LERVOLD C. 106,398 24,198 130,596 9,345 LESPERANCE J. 105,339 23,955 129,294 1,120 LESSARD E. 80,583 19,926 100,509 1,021 LESTON L. 82,149 18,723 100,872 287 LETKEMAN F. 108,173 24,348 132,521 5,982 LEUNG P. 84,695 19,797 104,492 - LEUNG V. 67,346 15,604 82,950 - LEUNG W. 95,815 29,685 125,500 - LEWICKI C. 76,637 415 77,052 1,140 LEWIS C. 117,929 25,135 143,064 - LEWIS R. 67,936 16,905 84,841 65 LEWIS T. 70,031 16,562 86,593 228 LEWKO A. 97,852 22,919 120,771 178 LEYENAAR D. 61,689 14,303 75,992 - LEYS N. 73,499 16,899 90,398 - LEZICA M. 88,386 20,497 108,883 1,479 LI A. 125,589 30,578 156,167 1,647 LI A.C. 88,037 25,393 113,430 419 LI C. 94,359 21,343 115,702 - LI E. 110,907 25,647 136,554 3,877 LI R. 77,752 19,755 97,507 5,118 LIEDL R. 93,941 22,755 116,696 565 LIFTON S. 67,731 17,894 85,625 126 LIGUORI T. 69,019 16,352 85,371 - LIM T. 75,367 16,906 92,273 50 LIN J. 75,344 17,702 93,046 2,969 LIN M. 92,071 23,476 115,547 542 LINDEN M. 92,540 18,704 111,244 266 LINDEN R. 87,802 20,288 108,090 577 LINDSAY M. 70,581 14,939 85,520 2,126 LING J. 69,476 20,430 89,906 616 LINTON N. 125,595 30,833 156,428 1,963 LINZMEIER J. 88,534 20,141 108,675 - LIOW K. 71,261 15,723 86,984 219 LIPKEWICH R. 68,188 18,532 86,720 979
REMUNERATION EXPENSES
EMPLOYEE NAME2016
JAN-DEC (12 MOS.)
2017 JAN-MAR (3 MOS.)
TOTAL
(15 MOS.)
TOTAL
(15 MOS.)
LIPTON T. 66,526 9,436 75,962 - LISE R. 80,004 18,748 98,752 102 LIU A. 69,034 17,421 86,455 - LIU S. 87,959 21,247 109,206 - LIU T. 93,319 25,097 118,416 - LLEWELLYN M. 63,968 13,947 77,915 - LO C. 65,326 14,773 80,099 - LO F. 99,805 27,407 127,212 2,949 LO K. 72,920 16,909 89,829 176 LOACH A. 182,377 41,415 223,792 3,415 LOCHRIE L. 117,330 22,556 139,886 - LOCKYER D. 76,884 12,075 88,959 40 LOFGREN B. 84,182 17,429 101,611 224 LOGAN D. 62,994 14,067 77,061 - LOISELLE S. 94,371 23,792 118,163 1,643 LONDON S. 70,921 15,390 86,311 2,475 LONG S. 72,862 15,762 88,624 - LOO A. 82,314 22,563 104,877 - LOPEZ-DEE M. 62,919 21,105 84,024 - LORE R. 87,611 21,502 109,113 - LOWE P. 70,421 20,164 90,585 28 LOWRIE S. 61,342 14,356 75,698 8 LU C. 78,050 20,286 98,336 589 LU T. 65,221 14,215 79,436 91 LUCAS K. 128,124 29,482 157,606 2,764 LUCAS S. 119,819 221 120,040 6,929 LUCHIES J. 91,931 20,942 112,873 50 LUDDU M. 76,466 17,284 93,750 532 LUFT E. 79,034 - 79,034 1,733 LUI E. 92,288 25,661 117,949 - LUISON M. 71,056 17,861 88,917 2,408 LUM MIN S. 67,300 15,582 82,882 - LUM W. 78,318 18,184 96,502 181 LUND J. 79,823 18,276 98,099 619 LUNDELL M. 62,119 14,819 76,938 - LUONG T. 75,832 18,435 94,267 281 LYNCH L. 76,413 16,660 93,073 20 LYNCH M. 66,900 15,220 82,120 - MA V. 81,498 19,713 101,211 - MA W. 91,656 28,165 119,821 - MAAN G. 71,243 16,347 87,590 76 MAC DONALD D. 73,275 17,269 90,544 6,642 MAC DONALD S. 72,907 16,935 89,842 - MACALINO R. 75,164 13,925 89,089 3,985 MACAPINLAC R. 96,648 24,667 121,315 185 MACARTHUR C. 89,221 20,309 109,530 421 MACAULAY H. 103,047 703 103,750 - MACDONALD A. 61,976 15,612 77,588 959 MACDONALD D. 73,472 17,658 91,130 105
Please note: ICBC changed its fiscal year-end from December 31st to March 31st and therefore, the fiscal period ending March 31, 2017 is a 15 month transitory fiscal period. The total amounts reported above represent 15 months of remuneration and expenses.

Insurance Corporation of British Columbia
88
Remuneration and expenses paid to employees for the 15 months period ended March 31, 2017
REMUNERATION EXPENSES
EMPLOYEE NAME2016
JAN-DEC (12 MOS.)
2017 JAN-MAR (3 MOS.)
TOTAL
(15 MOS.)
TOTAL
(15 MOS.)
MACDONALD K. 73,242 16,996 90,238 130 MACDONALD N. 68,368 15,325 83,693 1,718 MACFADYEN E. 78,622 18,269 96,891 154 MACFARLANE W. 134,260 31,622 165,882 1,075 MACGREGOR B. 71,590 17,310 88,900 - MACKAY D. 89,623 20,647 110,270 4,440 MACKAY K. 76,689 17,908 94,597 4,156 MACKAY M. 78,971 21,234 100,205 390 MACKIE L. 67,665 15,073 82,738 397 MACKINNON J. 72,710 16,899 89,609 396 MACLEAN K. 94,460 21,526 115,986 4,204 MACLEAN M. 77,363 17,671 95,034 72 MACLEAN R. 61,154 14,114 75,268 - MACLEAN V. 65,694 18,086 83,780 162 MACLEOD S. 81,200 19,704 100,904 - MACMILLAN A. 130,600 31,310 161,910 854 MACNEIL C. 101,850 23,548 125,398 4,156 MADANAYAKE U. 62,408 13,267 75,675 624 MAGANA M. 61,661 13,726 75,387 - MAGILL A. 78,567 15,781 94,348 5,608 MAGLIO M. 80,263 17,378 97,641 141 MAGNUSON L. 60,835 14,248 75,083 1,726 MAH B. 73,471 18,274 91,745 198 MAH D. 73,731 16,933 90,664 176 MAH J. 99,803 26,332 126,135 484 MAH RO. 74,826 17,566 92,392 120 MAH RY. 63,240 15,403 78,643 176 MAIER B. 95,678 18,421 114,099 9,869 MAINARDI D. 63,339 15,386 78,725 - MAIO A. 76,279 17,422 93,701 - MAK L. 130,178 40,123 170,301 - MAK S. 76,826 18,689 95,515 181 MAK Y. 78,820 19,670 98,490 2,343 MAKAROWSKI R. 85,321 19,966 105,287 - MAKHIJANI B. 84,737 19,647 104,384 - MALAWIYA R. 66,344 15,809 82,153 - MALCOLM D. 86,110 19,793 105,903 5,771 MALKOWICH L. 76,202 17,684 93,886 - MALONEY K. 72,656 17,549 90,205 1,878 MALSEGNA M. 76,639 19,113 95,752 825 MALTMAN E. 75,213 1,077 76,290 2,907 MALYON S. 166,351 25,217 191,568 3,308 MAN L. 100,142 23,723 123,865 1,969 MAN M. 95,616 22,181 117,797 1,047 MANDAIR J. 68,928 17,577 86,505 - MANN D. 65,645 15,238 80,883 262 MANN R. 63,603 13,760 77,363 235 MANN SA. 91,345 22,860 114,205 2,279 MANN SI. 104,650 27,890 132,540 176
REMUNERATION EXPENSES
EMPLOYEE NAME2016
JAN-DEC (12 MOS.)
2017 JAN-MAR (3 MOS.)
TOTAL
(15 MOS.)
TOTAL
(15 MOS.)
MANN T. 73,269 16,995 90,264 90 MANNING S. 61,226 17,683 78,909 176 MANSELL S. 63,303 15,204 78,507 76 MANUEL H. 98,103 25,325 123,428 - MAO Y. 88,117 20,379 108,496 - MAR T. 111,982 27,545 139,527 297 MARBAN K. 65,741 15,876 81,617 - MARCHI J. 127,438 30,395 157,833 2,032 MARCHUK D. 59,745 27,639 87,384 1,033 MARCOTTE B. 85,115 18,293 103,408 795 MARESCU L. 74,334 18,442 92,776 3,431 MARIA V. 73,925 17,910 91,835 4,627 MARINI M. 86,064 18,049 104,113 75 MARION C. 81,559 19,772 101,331 10,101 MARLATT L. 72,425 15,321 87,746 - MARQUES DA SILVA S. 64,124 14,190 78,314 - MARSH J. 79,095 17,597 96,692 - MARSHALL L. 88,182 21,291 109,473 59 MARTE A. 96,527 19,671 116,198 60 MARTENS B. 66,540 15,429 81,969 87 MARTIN L. 65,503 15,190 80,693 - MARTIN M. 100,684 23,786 124,470 1,341 MARTIN S. 83,130 18,069 101,199 748 MARTINEZ C. 69,728 16,908 86,636 15 MARTON F. 86,325 22,531 108,856 826 MARVEL D. 83,794 18,627 102,421 1,386 MARWICK C. 101,493 23,076 124,569 2,475 MARWICK G. 90,150 - 90,150 516 MATHARU H. 67,546 15,410 82,956 129 MATHESON C. 108,039 24,603 132,642 5,597 MATHIESON D. 95,806 21,777 117,583 3,758 MATHIEU A. 85,086 23,028 108,114 1,390 MATTHEWS L. 174,997 42,877 217,874 4,636 MATTHEWS R. 116,944 28,131 145,075 3,525 MATTU B. 66,634 15,426 82,060 - MAUGER R. 74,319 16,429 90,748 - MAURO J. 90,329 18,154 108,483 78 MAWHINNEY S. 74,900 17,011 91,911 185 MAYEDE G. 74,729 17,164 91,893 288 MAYHEW D. 68,906 19,837 88,743 95 MAYLOR M. 64,978 18,140 83,118 9,784 MAZALEK T. 91,763 22,922 114,685 - MCANDREW JA. 84,284 19,779 104,063 1,119 MCANDREW JE. 85,033 17,228 102,261 - MCAREE J. 69,366 15,582 84,948 598 MCARTHUR F. 75,870 17,094 92,964 101 MCARTHUR T. 74,899 16,899 91,798 - MCAVANY S. 63,377 18,566 81,943 11,247 MCCAULEY L. 74,748 17,238 91,986 3,400
Please note: ICBC changed its fiscal year-end from December 31st to March 31st and therefore, the fiscal period ending March 31, 2017 is a 15 month transitory fiscal period. The total amounts reported above represent 15 months of remuneration and expenses.
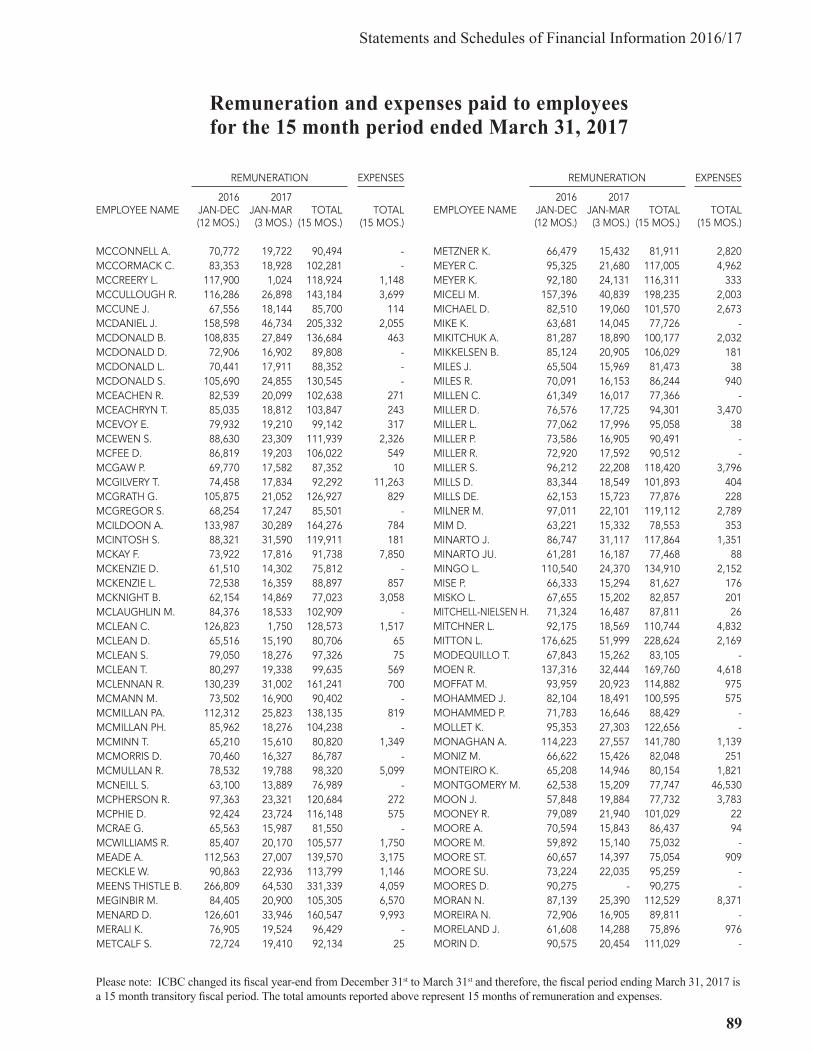
Statements and Schedules of Financial Information 2016/17
89
Remuneration and expenses paid to employees for the 15 month period ended March 31, 2017
REMUNERATION EXPENSES
EMPLOYEE NAME2016
JAN-DEC (12 MOS.)
2017 JAN-MAR (3 MOS.)
TOTAL
(15 MOS.)
TOTAL
(15 MOS.)
MCCONNELL A. 70,772 19,722 90,494 - MCCORMACK C. 83,353 18,928 102,281 - MCCREERY L. 117,900 1,024 118,924 1,148 MCCULLOUGH R. 116,286 26,898 143,184 3,699 MCCUNE J. 67,556 18,144 85,700 114 MCDANIEL J. 158,598 46,734 205,332 2,055 MCDONALD B. 108,835 27,849 136,684 463 MCDONALD D. 72,906 16,902 89,808 - MCDONALD L. 70,441 17,911 88,352 - MCDONALD S. 105,690 24,855 130,545 - MCEACHEN R. 82,539 20,099 102,638 271 MCEACHRYN T. 85,035 18,812 103,847 243 MCEVOY E. 79,932 19,210 99,142 317 MCEWEN S. 88,630 23,309 111,939 2,326 MCFEE D. 86,819 19,203 106,022 549 MCGAW P. 69,770 17,582 87,352 10 MCGILVERY T. 74,458 17,834 92,292 11,263 MCGRATH G. 105,875 21,052 126,927 829 MCGREGOR S. 68,254 17,247 85,501 - MCILDOON A. 133,987 30,289 164,276 784 MCINTOSH S. 88,321 31,590 119,911 181 MCKAY F. 73,922 17,816 91,738 7,850 MCKENZIE D. 61,510 14,302 75,812 - MCKENZIE L. 72,538 16,359 88,897 857 MCKNIGHT B. 62,154 14,869 77,023 3,058 MCLAUGHLIN M. 84,376 18,533 102,909 - MCLEAN C. 126,823 1,750 128,573 1,517 MCLEAN D. 65,516 15,190 80,706 65 MCLEAN S. 79,050 18,276 97,326 75 MCLEAN T. 80,297 19,338 99,635 569 MCLENNAN R. 130,239 31,002 161,241 700 MCMANN M. 73,502 16,900 90,402 - MCMILLAN PA. 112,312 25,823 138,135 819 MCMILLAN PH. 85,962 18,276 104,238 - MCMINN T. 65,210 15,610 80,820 1,349 MCMORRIS D. 70,460 16,327 86,787 - MCMULLAN R. 78,532 19,788 98,320 5,099 MCNEILL S. 63,100 13,889 76,989 - MCPHERSON R. 97,363 23,321 120,684 272 MCPHIE D. 92,424 23,724 116,148 575 MCRAE G. 65,563 15,987 81,550 - MCWILLIAMS R. 85,407 20,170 105,577 1,750 MEADE A. 112,563 27,007 139,570 3,175 MECKLE W. 90,863 22,936 113,799 1,146 MEENS THISTLE B. 266,809 64,530 331,339 4,059 MEGINBIR M. 84,405 20,900 105,305 6,570 MENARD D. 126,601 33,946 160,547 9,993 MERALI K. 76,905 19,524 96,429 - METCALF S. 72,724 19,410 92,134 25
REMUNERATION EXPENSES
EMPLOYEE NAME2016
JAN-DEC (12 MOS.)
2017 JAN-MAR (3 MOS.)
TOTAL
(15 MOS.)
TOTAL
(15 MOS.)
METZNER K. 66,479 15,432 81,911 2,820 MEYER C. 95,325 21,680 117,005 4,962 MEYER K. 92,180 24,131 116,311 333 MICELI M. 157,396 40,839 198,235 2,003 MICHAEL D. 82,510 19,060 101,570 2,673 MIKE K. 63,681 14,045 77,726 - MIKITCHUK A. 81,287 18,890 100,177 2,032 MIKKELSEN B. 85,124 20,905 106,029 181 MILES J. 65,504 15,969 81,473 38 MILES R. 70,091 16,153 86,244 940 MILLEN C. 61,349 16,017 77,366 - MILLER D. 76,576 17,725 94,301 3,470 MILLER L. 77,062 17,996 95,058 38 MILLER P. 73,586 16,905 90,491 - MILLER R. 72,920 17,592 90,512 - MILLER S. 96,212 22,208 118,420 3,796 MILLS D. 83,344 18,549 101,893 404 MILLS DE. 62,153 15,723 77,876 228 MILNER M. 97,011 22,101 119,112 2,789 MIM D. 63,221 15,332 78,553 353 MINARTO J. 86,747 31,117 117,864 1,351 MINARTO JU. 61,281 16,187 77,468 88 MINGO L. 110,540 24,370 134,910 2,152 MISE P. 66,333 15,294 81,627 176 MISKO L. 67,655 15,202 82,857 201 MITCHELL-NIELSEN H. 71,324 16,487 87,811 26 MITCHNER L. 92,175 18,569 110,744 4,832 MITTON L. 176,625 51,999 228,624 2,169 MODEQUILLO T. 67,843 15,262 83,105 - MOEN R. 137,316 32,444 169,760 4,618 MOFFAT M. 93,959 20,923 114,882 975 MOHAMMED J. 82,104 18,491 100,595 575 MOHAMMED P. 71,783 16,646 88,429 - MOLLET K. 95,353 27,303 122,656 - MONAGHAN A. 114,223 27,557 141,780 1,139 MONIZ M. 66,622 15,426 82,048 251 MONTEIRO K. 65,208 14,946 80,154 1,821 MONTGOMERY M. 62,538 15,209 77,747 46,530 MOON J. 57,848 19,884 77,732 3,783 MOONEY R. 79,089 21,940 101,029 22 MOORE A. 70,594 15,843 86,437 94 MOORE M. 59,892 15,140 75,032 - MOORE ST. 60,657 14,397 75,054 909 MOORE SU. 73,224 22,035 95,259 - MOORES D. 90,275 - 90,275 - MORAN N. 87,139 25,390 112,529 8,371 MOREIRA N. 72,906 16,905 89,811 - MORELAND J. 61,608 14,288 75,896 976 MORIN D. 90,575 20,454 111,029 -
Please note: ICBC changed its fiscal year-end from December 31st to March 31st and therefore, the fiscal period ending March 31, 2017 is a 15 month transitory fiscal period. The total amounts reported above represent 15 months of remuneration and expenses.

Insurance Corporation of British Columbia
90
Remuneration and expenses paid to employees for the 15 months period ended March 31, 2017
REMUNERATION EXPENSES
EMPLOYEE NAME2016
JAN-DEC (12 MOS.)
2017 JAN-MAR (3 MOS.)
TOTAL
(15 MOS.)
TOTAL
(15 MOS.)
MORLEY L. 85,316 18,783 104,099 349 MORNEAU R. 68,205 15,907 84,112 202 MORO D. 84,405 17,829 102,234 553 MORRALL G. 92,661 21,108 113,769 1,500 MORRELL G. 78,865 17,284 96,149 - MORRICE K. 63,034 15,290 78,324 132 MORRIS J. 66,264 15,429 81,693 601 MORRIS TO. 61,704 14,274 75,978 - MORRIS TR. 63,023 15,473 78,496 376 MORTIMER B. 73,428 18,358 91,786 134 MORTIMER M. 66,548 15,595 82,143 2,185 MOSCATO J. 102,947 25,305 128,252 272 MOSLEY G. 66,987 16,671 83,658 - MOULTON V. 76,594 20,132 96,726 270 MRAKIC M. 62,203 14,419 76,622 76 MULFORD A. 76,464 17,957 94,421 130 MULLER J. 66,606 15,732 82,338 1,009 MULLIGAN W. 79,048 20,027 99,075 2,114 MULVENNA S. 78,013 19,755 97,768 - MUNG D. 73,212 16,905 90,117 42 MUNN K. 94,043 26,318 120,361 7,303 MUNRO D. 99,979 22,727 122,706 248 MUNT K. 85,063 10,120 95,183 176 MURPHY M. 133,071 31,905 164,976 3,183 MURRAY R. 94,115 22,202 116,317 10,326 MUZZIN S. 79,714 18,946 98,660 418 MWENDWA A. 66,208 15,426 81,634 - NADEAU D. 105,908 24,082 129,990 1,440 NAGY C. 73,950 16,813 90,763 1,468 NAIDU K. 70,826 17,703 88,529 131 NAIDU N. 61,188 14,288 75,476 - NAKANO A. 76,305 16,660 92,965 224 NAKASHIMA S. 61,204 15,480 76,684 2,373 NAMISLO J. 77,770 18,010 95,780 10,485 NANOS L. 79,856 18,276 98,132 1,548 NAPIERALA E. 61,569 13,941 75,510 2,740 NARAINA K. 68,891 14,619 83,510 129 NARESH K. 82,322 20,137 102,459 1,503 NASH B. 88,919 20,232 109,151 3,418 NASU A. 82,132 18,025 100,157 - NATHAN V. 96,445 21,923 118,368 1,107 NAVARRO M. 62,183 14,167 76,350 281 NEESE N. 89,631 20,591 110,222 1,174 NELSON J. 74,555 17,563 92,118 76 NELSON K. 97,261 22,213 119,474 2,702 NELSON L. 93,973 21,371 115,344 176 NESLING N. 61,303 14,642 75,945 4,095 NEUFELD J. 62,975 14,127 77,102 20,205 NEUMANN C. 61,850 15,647 77,497 -
REMUNERATION EXPENSES
EMPLOYEE NAME2016
JAN-DEC (12 MOS.)
2017 JAN-MAR (3 MOS.)
TOTAL
(15 MOS.)
TOTAL
(15 MOS.)
NEWBERY R. 73,524 21,364 94,888 17 NEWBERY T. 64,077 17,944 82,021 320 NEWBY D. 82,811 - 82,811 391 NEWMAN B. 97,908 22,508 120,416 197 NEWMAN T. 86,231 19,784 106,015 - NG A. 91,962 21,182 113,144 217 NG C. 97,390 20,493 117,883 6,386 NG E. 64,183 15,848 80,031 1,580 NG H. 135,086 29,413 164,499 2,942 NG JANI. 105,936 26,811 132,747 58 NG JANN. 83,754 21,933 105,687 40 NG JO. 74,871 19,722 94,593 604 NG L. 73,603 17,153 90,756 - NG P. 91,095 23,251 114,346 - NG R. 78,690 25,427 104,117 410 NG Y. 81,931 19,841 101,772 205 NGAI C. 96,407 22,761 119,168 2,269 NGAI F. 62,765 17,875 80,640 - NGO P. 108,352 25,178 133,530 5,181 NGUYEN D. 86,406 19,926 106,332 460 NGUYEN H. 65,029 12,929 77,958 - NGUYEN J. 132,676 29,279 161,955 - NGUYEN Q. 80,590 20,948 101,538 90 NGUYEN S. 78,708 18,616 97,324 14,274 NGUYEN T. 71,120 16,857 87,977 76 NICHOLL C. 131,260 36,095 167,355 177 NICK R. 92,737 21,111 113,848 1,484 NICKASON N. 134,674 34,989 169,663 3,113 NICOL C. 66,835 15,388 82,223 96 NICOLSON J. 75,332 17,636 92,968 - NIEWELER E. 77,454 16,814 94,268 82 NIJJER R. 70,038 18,559 88,597 301 NIMI D. 69,994 18,042 88,036 - NISBETT T. 67,645 15,432 83,077 238 NISHI K. 88,010 18,395 106,405 74 NOBLEZA L. 73,154 18,115 91,269 - NOMURA K. 69,987 19,880 89,867 76 NORMAN B. 100,466 25,150 125,616 1,548 NOUJAIME R. 91,940 20,929 112,869 307 NOVAK E. 170,802 30,218 201,020 13,597 NOVAKOVIC G. 92,177 20,516 112,693 - NUNN J. 82,819 19,675 102,494 3,481 NUSCHE M. 93,337 22,455 115,792 6,066 NUTINI M. 69,081 15,413 84,494 2,552 NUTLAND K. 76,032 17,361 93,393 2,622 NUTTER L. 73,787 16,909 90,696 25 NYGAARD L. 69,721 16,902 86,623 - OBLEA E. 63,899 14,983 78,882 - O’BRIEN MA. 129,340 29,916 159,256 95
Please note: ICBC changed its fiscal year-end from December 31st to March 31st and therefore, the fiscal period ending March 31, 2017 is a 15 month transitory fiscal period. The total amounts reported above represent 15 months of remuneration and expenses.
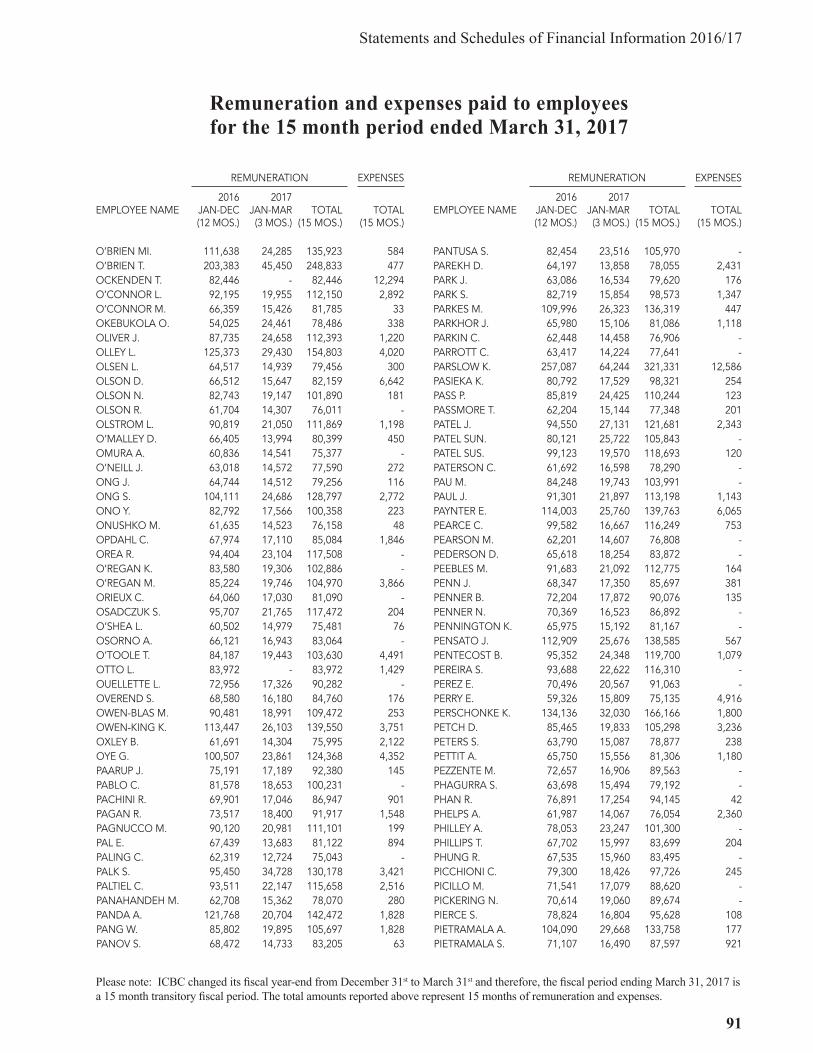
Statements and Schedules of Financial Information 2016/17
91
Remuneration and expenses paid to employees for the 15 month period ended March 31, 2017
REMUNERATION EXPENSES
EMPLOYEE NAME2016
JAN-DEC (12 MOS.)
2017 JAN-MAR (3 MOS.)
TOTAL
(15 MOS.)
TOTAL
(15 MOS.)
O’BRIEN MI. 111,638 24,285 135,923 584 O’BRIEN T. 203,383 45,450 248,833 477 OCKENDEN T. 82,446 - 82,446 12,294 O’CONNOR L. 92,195 19,955 112,150 2,892 O’CONNOR M. 66,359 15,426 81,785 33 OKEBUKOLA O. 54,025 24,461 78,486 338 OLIVER J. 87,735 24,658 112,393 1,220 OLLEY L. 125,373 29,430 154,803 4,020 OLSEN L. 64,517 14,939 79,456 300 OLSON D. 66,512 15,647 82,159 6,642 OLSON N. 82,743 19,147 101,890 181 OLSON R. 61,704 14,307 76,011 - OLSTROM L. 90,819 21,050 111,869 1,198 O’MALLEY D. 66,405 13,994 80,399 450 OMURA A. 60,836 14,541 75,377 - O’NEILL J. 63,018 14,572 77,590 272 ONG J. 64,744 14,512 79,256 116 ONG S. 104,111 24,686 128,797 2,772 ONO Y. 82,792 17,566 100,358 223 ONUSHKO M. 61,635 14,523 76,158 48 OPDAHL C. 67,974 17,110 85,084 1,846 OREA R. 94,404 23,104 117,508 - O’REGAN K. 83,580 19,306 102,886 - O’REGAN M. 85,224 19,746 104,970 3,866 ORIEUX C. 64,060 17,030 81,090 - OSADCZUK S. 95,707 21,765 117,472 204 O’SHEA L. 60,502 14,979 75,481 76 OSORNO A. 66,121 16,943 83,064 - O’TOOLE T. 84,187 19,443 103,630 4,491 OTTO L. 83,972 - 83,972 1,429 OUELLETTE L. 72,956 17,326 90,282 - OVEREND S. 68,580 16,180 84,760 176 OWEN-BLAS M. 90,481 18,991 109,472 253 OWEN-KING K. 113,447 26,103 139,550 3,751 OXLEY B. 61,691 14,304 75,995 2,122 OYE G. 100,507 23,861 124,368 4,352 PAARUP J. 75,191 17,189 92,380 145 PABLO C. 81,578 18,653 100,231 - PACHINI R. 69,901 17,046 86,947 901 PAGAN R. 73,517 18,400 91,917 1,548 PAGNUCCO M. 90,120 20,981 111,101 199 PAL E. 67,439 13,683 81,122 894 PALING C. 62,319 12,724 75,043 - PALK S. 95,450 34,728 130,178 3,421 PALTIEL C. 93,511 22,147 115,658 2,516 PANAHANDEH M. 62,708 15,362 78,070 280 PANDA A. 121,768 20,704 142,472 1,828 PANG W. 85,802 19,895 105,697 1,828 PANOV S. 68,472 14,733 83,205 63
REMUNERATION EXPENSES
EMPLOYEE NAME2016
JAN-DEC (12 MOS.)
2017 JAN-MAR (3 MOS.)
TOTAL
(15 MOS.)
TOTAL
(15 MOS.)
PANTUSA S. 82,454 23,516 105,970 - PAREKH D. 64,197 13,858 78,055 2,431 PARK J. 63,086 16,534 79,620 176 PARK S. 82,719 15,854 98,573 1,347 PARKES M. 109,996 26,323 136,319 447 PARKHOR J. 65,980 15,106 81,086 1,118 PARKIN C. 62,448 14,458 76,906 - PARROTT C. 63,417 14,224 77,641 - PARSLOW K. 257,087 64,244 321,331 12,586 PASIEKA K. 80,792 17,529 98,321 254 PASS P. 85,819 24,425 110,244 123 PASSMORE T. 62,204 15,144 77,348 201 PATEL J. 94,550 27,131 121,681 2,343 PATEL SUN. 80,121 25,722 105,843 - PATEL SUS. 99,123 19,570 118,693 120 PATERSON C. 61,692 16,598 78,290 - PAU M. 84,248 19,743 103,991 - PAUL J. 91,301 21,897 113,198 1,143 PAYNTER E. 114,003 25,760 139,763 6,065 PEARCE C. 99,582 16,667 116,249 753 PEARSON M. 62,201 14,607 76,808 - PEDERSON D. 65,618 18,254 83,872 - PEEBLES M. 91,683 21,092 112,775 164 PENN J. 68,347 17,350 85,697 381 PENNER B. 72,204 17,872 90,076 135 PENNER N. 70,369 16,523 86,892 - PENNINGTON K. 65,975 15,192 81,167 - PENSATO J. 112,909 25,676 138,585 567 PENTECOST B. 95,352 24,348 119,700 1,079 PEREIRA S. 93,688 22,622 116,310 - PEREZ E. 70,496 20,567 91,063 - PERRY E. 59,326 15,809 75,135 4,916 PERSCHONKE K. 134,136 32,030 166,166 1,800 PETCH D. 85,465 19,833 105,298 3,236 PETERS S. 63,790 15,087 78,877 238 PETTIT A. 65,750 15,556 81,306 1,180 PEZZENTE M. 72,657 16,906 89,563 - PHAGURRA S. 63,698 15,494 79,192 - PHAN R. 76,891 17,254 94,145 42 PHELPS A. 61,987 14,067 76,054 2,360 PHILLEY A. 78,053 23,247 101,300 - PHILLIPS T. 67,702 15,997 83,699 204 PHUNG R. 67,535 15,960 83,495 - PICCHIONI C. 79,300 18,426 97,726 245 PICILLO M. 71,541 17,079 88,620 - PICKERING N. 70,614 19,060 89,674 - PIERCE S. 78,824 16,804 95,628 108 PIETRAMALA A. 104,090 29,668 133,758 177 PIETRAMALA S. 71,107 16,490 87,597 921
Please note: ICBC changed its fiscal year-end from December 31st to March 31st and therefore, the fiscal period ending March 31, 2017 is a 15 month transitory fiscal period. The total amounts reported above represent 15 months of remuneration and expenses.

Insurance Corporation of British Columbia
92
Remuneration and expenses paid to employees for the 15 months period ended March 31, 2017
REMUNERATION EXPENSES
EMPLOYEE NAME2016
JAN-DEC (12 MOS.)
2017 JAN-MAR (3 MOS.)
TOTAL
(15 MOS.)
TOTAL
(15 MOS.)
PILLAI S. 60,468 16,807 77,275 1,672 PINIACH P. 93,707 22,813 116,520 107 PITMAN T. 61,607 14,302 75,909 - PITT C. 68,881 16,226 85,107 413 PITZMAN M. 79,480 19,248 98,728 2,733 PLOMP R. 84,472 19,323 103,795 6,669 POIRIER R. 64,608 15,647 80,255 1,758 PONCELET J. 61,004 14,265 75,269 - POOLE K. 103,456 26,112 129,568 76 POOLE R. 95,364 23,297 118,661 - POP T. 84,206 19,650 103,856 - POPA T. 89,489 20,398 109,887 3,564 POPESCU D. 91,418 23,364 114,782 2,097 PORCELLATO D. 73,293 16,905 90,198 - PORT C. 102,312 22,878 125,190 4,530 PORTER D. 98,763 22,927 121,690 23 PORTER J. 92,791 21,131 113,922 3,525 PORTERFIELD B. 91,810 20,279 112,089 1,548 POSTNIKOFF B. 73,965 16,887 90,852 2,591 POTTER J. 67,811 17,439 85,250 - POTTER M. 82,145 17,214 99,359 815 POTTERY J. 84,780 20,070 104,850 899 POTTS F. 88,179 19,210 107,389 926 POTTS R. 77,950 18,845 96,795 14,848 POWELL B. 60,553 14,629 75,182 176 POWER E. 64,754 14,343 79,097 116 POWERS R. 103,794 24,866 128,660 2,846 PRABHAKAR K. 81,983 19,679 101,662 - PREDEAUX D. 72,797 15,540 88,337 115 PRESTON D. 82,438 15,690 98,128 24 PRICE A. 113,835 32,626 146,461 2,272 PRIHAR N. 57,870 18,688 76,558 107 PRIOR G. 344,950 86,003 430,953 6,032 PRIOR W. 98,952 14,815 113,767 2,515 PROCKIW K. 114,714 25,935 140,649 4,147 PROIETTI B. 73,140 16,719 89,859 24 PRYSTAY L. 63,131 13,197 76,328 201 PRZYBYLSKI M. 141,794 33,296 175,090 - PULKO M. 84,128 19,949 104,077 455 PURCELL J. 84,227 20,372 104,599 1,291 PUTERMAN D. 88,594 20,795 109,389 3,112 PUTNEY C. 131,630 31,366 162,996 2,285 QI F. 84,559 21,096 105,655 2,965 QUAIL B. 92,653 23,116 115,769 1,669 QUALLY L. 62,157 15,792 77,949 629 QUAN M. 78,620 18,619 97,239 216 QUON A. 63,066 14,452 77,518 255 RABIE W. 95,250 20,711 115,961 - RADOS J. 71,340 16,490 87,830 181
REMUNERATION EXPENSES
EMPLOYEE NAME2016
JAN-DEC (12 MOS.)
2017 JAN-MAR (3 MOS.)
TOTAL
(15 MOS.)
TOTAL
(15 MOS.)
RADOS T. 131,855 29,775 161,630 34 RAE D. 72,291 17,721 90,012 308 RAEDLER R. 69,640 15,432 85,072 312 RAFFARD D. 71,841 16,660 88,501 2,086 RAFI A. 132,628 31,746 164,374 2,901 RAI H. 111,922 19,739 131,661 2,863 RAI K. 91,956 21,782 113,738 106 RAI V. 85,049 20,137 105,186 485 RALPH A. 69,124 17,131 86,255 - RAMSAY L. 83,509 18,992 102,501 181 RAPOSO M. 83,707 17,791 101,498 - RASCANU C. 62,864 15,482 78,346 11,451 RASKI J. 83,598 18,841 102,439 419 RATCLIFFE K. 101,683 30,100 131,783 - RAW M. 133,003 30,026 163,029 726 RAWLINGS L. 61,701 14,307 76,008 - RAYMOND L. 67,860 16,236 84,096 - RE F. 101,404 25,129 126,533 1,488 REDDY P. 57,950 17,979 75,929 - REDILA B. 74,377 17,635 92,012 76 REDMOND L. 132,998 28,328 161,326 556 REED S. 89,424 22,199 111,623 1,751 REGNIER R. 64,415 14,959 79,374 2,685 REGUSH H. 94,683 21,470 116,153 1,989 REID A. 65,185 14,650 79,835 825 REID E. 79,193 16,871 96,064 626 REID J. 64,093 15,997 80,090 - REID T. 73,352 19,191 92,543 176 REILLY K. 92,639 22,406 115,045 546 REIMER D. 129,760 31,776 161,536 2,325 REITER M. 62,703 14,963 77,666 1,119 REITER S. 61,001 14,991 75,992 413 REMPEL T. 78,342 17,293 95,635 301 REYNOLDS A. 83,921 19,259 103,180 10,526 RHIM H. 97,844 27,624 125,468 3,099 RIBEIRO D. 91,609 22,167 113,776 495 RICE-MACDONALD T. 70,494 19,690 90,184 697 RICH R. 79,925 20,532 100,457 1,365 RICHARDSON C. 64,440 15,394 79,834 60 RICHER A. 92,371 30,480 122,851 181 RICHER V. 61,406 14,278 75,684 - RIDDLE C. 119,716 26,967 146,683 2,145 RIDLEY N. 125,550 28,433 153,983 7,919 RIEL L. 60,287 15,107 75,394 2,702 RIGDON C. 86,879 22,301 109,180 - RIGGS C. 64,194 14,865 79,059 220 RINALDI P. 66,595 15,632 82,227 - RING G. 72,722 16,695 89,417 - RINKE C. 92,976 21,135 114,111 4,938
Please note: ICBC changed its fiscal year-end from December 31st to March 31st and therefore, the fiscal period ending March 31, 2017 is a 15 month transitory fiscal period. The total amounts reported above represent 15 months of remuneration and expenses.

Statements and Schedules of Financial Information 2016/17
93
Remuneration and expenses paid to employees for the 15 month period ended March 31, 2017
REMUNERATION EXPENSES
EMPLOYEE NAME2016
JAN-DEC (12 MOS.)
2017 JAN-MAR (3 MOS.)
TOTAL
(15 MOS.)
TOTAL
(15 MOS.)
RIVA T. 75,642 17,048 92,690 306 ROACH D. 78,556 21,854 100,410 - ROBERTSON A. 81,971 20,112 102,083 1,118 ROBERTSON J. 109,697 26,549 136,246 1,779 ROBERTSON MA. 71,842 16,660 88,502 - ROBERTSON MI. 65,112 13,426 78,538 105 ROBICHAUD D. 72,041 16,691 88,732 - ROBIN W. 61,382 13,638 75,020 271 ROBINSON C. 79,925 20,677 100,602 176 ROBINSON C.F. 76,623 17,711 94,334 10,391 ROBINSON I. 94,459 23,671 118,130 5,243 ROBINSON K. 144,053 36,781 180,834 13,605 ROBINSON M. 99,319 15,523 114,842 1,124 ROBINSON RE. 64,875 15,679 80,554 50 ROBINSON RO. 80,590 18,734 99,324 - ROBINTON L. 65,768 14,906 80,674 2,642 ROBSON A. 59,782 18,370 78,152 2,349 ROBSON P. 84,070 20,904 104,974 206 ROBSON R. 61,252 14,067 75,319 2,150 RODD R. 63,569 16,351 79,920 25 RODDICK K. 86,943 18,366 105,309 3,854 RODRIGUEZ E. 70,453 15,526 85,979 - ROEST C. 66,565 19,435 86,000 1,123 ROGERS H. 65,756 15,479 81,235 - ROGERS L. 72,357 17,101 89,458 - ROHDE E. 66,478 15,541 82,019 - ROHNE A. 73,525 16,660 90,185 1,377 ROJEN M. 72,063 15,973 88,036 377 ROLFSEN C. 72,691 16,684 89,375 176 ROLIN B. 71,086 16,484 87,570 - ROMANIUK L. 64,243 15,072 79,315 2,900 ROMARD T. 82,828 18,334 101,162 752 ROOT A. 128,250 33,804 162,054 1,126 RORISON A. 61,880 14,067 75,947 997 ROSALES R. 68,613 18,151 86,764 - ROSS D. 69,167 16,345 85,512 - ROSS S. 62,419 14,860 77,279 76 ROSTVIG R. 73,080 16,902 89,982 24 ROTH L. 61,487 14,555 76,042 171 ROTHER W. 88,972 20,386 109,358 - ROZAK D. 74,602 18,723 93,325 - RUBY W. 71,382 16,572 87,954 72 RUDKEVITCH S. 64,881 15,016 79,897 23 RUDKOWSKI A. 73,984 16,421 90,405 106 RUDOLPH S. 75,402 18,525 93,927 - RUEST N. 79,160 16,009 95,169 1,777 RUGGLES R. 63,181 16,881 80,062 1,270 RUGGLES S. 86,971 20,255 107,226 9,732 RUMBLE G. 125,619 28,359 153,978 5,350
REMUNERATION EXPENSES
EMPLOYEE NAME2016
JAN-DEC (12 MOS.)
2017 JAN-MAR (3 MOS.)
TOTAL
(15 MOS.)
TOTAL
(15 MOS.)
RUSCOFF G. 73,099 17,006 90,105 260 RUSK L. 72,015 16,691 88,706 - RUSSELL E. 84,119 19,560 103,679 - RUSSELL S. 78,230 18,445 96,675 943 RYAN C. 160,575 39,574 200,149 3,270 RYE K. 166,771 40,202 206,973 4,698 RYUJIN H. 106,335 27,915 134,250 805 SAALFELD S. 75,874 5,288 81,162 138 SABET F. 66,977 15,525 82,502 - SABET S. 85,114 22,003 107,117 - SADGROVE L. 77,608 21,606 99,214 1,721 SADRA M. 111,763 26,973 138,736 3,210 SAFRUIK G. 70,270 16,672 86,942 51 SAHOTA H. 121,544 29,482 151,026 465 SAHOTA R. 75,421 17,124 92,545 563 SAITO M. 73,173 16,905 90,078 225 SAKAI S. 80,519 20,986 101,505 - SALAHUB J. 66,227 14,493 80,720 - SALES K. 109,169 25,012 134,181 1,974 SALMAN-MANESH J. 93,211 - 93,211 1,748 SALTER C. 93,444 23,482 116,926 5,291 SAMPLE L. 72,354 16,691 89,045 - SAMSON K. 71,096 16,183 87,279 76 SANDALL G. 83,747 19,556 103,303 186 SANDEELA Z. 87,432 22,065 109,497 166 SANDHU JAN. 61,846 16,294 78,140 92 SANDHU JAS. 63,882 14,676 78,558 61 SANDHU L. 101,679 24,884 126,563 2,261 SANDHU P. 97,814 21,225 119,039 - SANDHU SH. 72,903 16,905 89,808 190 SANDHU ST. 67,286 20,405 87,691 421 SANDRIN F. 87,422 23,910 111,332 202 SANDRIN R. 102,719 24,838 127,557 367 SANGHA H. 77,273 18,080 95,353 1,846 SANGHA S. 74,765 18,130 92,895 - SANGHERA C. 77,590 16,752 94,342 - SANKAR S. 103,690 23,419 127,109 - SANTOS C. 69,592 14,073 83,665 - SARANCHUK L. 83,460 22,230 105,690 723 SARKESSIAN A. 68,432 17,584 86,016 343 SARTORE J. 93,657 24,142 117,799 1,048 SATO K. 112,366 25,944 138,310 679 SAUNDERS B. 132,919 33,631 166,550 2,398 SAUNDRY R. 78,820 18,079 96,899 2,006 SAVORY M. 68,283 14,963 83,246 50 SAWHNEY V. 97,489 22,645 120,134 15 SAWINSKI J. 64,087 15,011 79,098 12 SAYERS T. 91,685 20,773 112,458 - SCACCIA L. 99,461 24,058 123,519 85
Please note: ICBC changed its fiscal year-end from December 31st to March 31st and therefore, the fiscal period ending March 31, 2017 is a 15 month transitory fiscal period. The total amounts reported above represent 15 months of remuneration and expenses.

Insurance Corporation of British Columbia
94
Remuneration and expenses paid to employees for the 15 months period ended March 31, 2017
REMUNERATION EXPENSES
EMPLOYEE NAME2016
JAN-DEC (12 MOS.)
2017 JAN-MAR (3 MOS.)
TOTAL
(15 MOS.)
TOTAL
(15 MOS.)
SCALI AND. 77,020 20,137 97,157 1,371 SCALI ANN. 75,059 17,351 92,410 1,335 SCATCHARD G. 66,135 15,190 81,325 - SCHAEFER K. 67,549 17,182 84,731 538 SCHANZENBACH V. 68,157 16,013 84,170 - SCHEDEL V. 110,616 27,025 137,641 34,475 SCHICK D. 114,850 25,988 140,838 514 SCHICK R. 78,999 16,992 95,991 176 SCHMIDT M. 100,501 21,536 122,037 70 SCHMIDT P. 81,548 19,140 100,688 235 SCHMIDT V. 81,226 18,508 99,734 649 SCHNEIDER C. 60,917 14,185 75,102 864 SCHNEIDER K. 64,182 15,393 79,575 2,086 SCHNEIDER W. 87,593 21,091 108,684 - SCHOEMAN H. 116,976 26,635 143,611 2,206 SCHROEDER B. 66,110 15,675 81,785 47 SCHROEDER T. 62,952 15,959 78,911 - SCHUCK P. 107,400 24,463 131,863 556 SCHULTZ A. 90,653 22,415 113,068 365 SCHUURMAN P. 64,392 14,495 78,887 1,629 SCLATER R. 95,565 25,927 121,492 - SCOTT A. 61,921 14,179 76,100 856 SCOTT B. 78,769 17,914 96,683 3,462 SCOTT H. 88,482 20,771 109,253 - SCOTT M. 61,409 16,821 78,230 - SCOTT S. 64,379 14,012 78,391 - SCOTT V. 59,634 16,160 75,794 - SCULLION L. 78,652 19,142 97,794 20 SCULTETY J. 109,726 26,955 136,681 6,658 SEAH H. 75,353 17,211 92,564 - SEARLE M. 76,282 18,218 94,500 - SEARY S. 78,622 18,269 96,891 943 SEIFRED C. 58,676 17,167 75,843 - SEITZ D. 69,514 17,840 87,354 196 SENFT D. 72,405 18,381 90,786 94 SENGHERA G. 87,583 21,735 109,318 1,952 SENGHERA S. 119,940 34,204 154,144 808 SEOW S. 66,393 15,145 81,538 277 SERBAN D. 76,305 17,374 93,679 1,932 SERSEN L. 76,870 16,899 93,769 - SETTICASI P. 118,920 28,577 147,497 1,642 SHAH K. 61,656 18,005 79,661 2,374 SHAKIBAFAR P. 62,989 20,770 83,759 1,953 SHAND S. 68,823 19,569 88,392 324 SHANNON K. 90,011 20,368 110,379 - SHAPTON S. 81,943 16,830 98,773 227 SHARMA S. 78,593 17,451 96,044 131 SHARP L. 73,215 16,359 89,574 76 SHARRATT L. 60,379 15,400 75,779 -
REMUNERATION EXPENSES
EMPLOYEE NAME2016
JAN-DEC (12 MOS.)
2017 JAN-MAR (3 MOS.)
TOTAL
(15 MOS.)
TOTAL
(15 MOS.)
SHAUNTZ A. 99,005 22,588 121,593 781 SHAVER B. 64,734 14,808 79,542 82 SHAW I. 71,969 17,873 89,842 - SHAW W. 66,886 15,516 82,402 323 SHEN H. 103,690 24,348 128,038 550 SHEN R. 105,203 25,421 130,624 1,881 SHEPPARD G. 117,869 29,154 147,023 2,524 SHERGILL G. 62,190 14,458 76,648 - SHIBATA A. 110,999 24,276 135,275 135 SHIGEMATSU A. 66,225 15,429 81,654 618 SHILTON L. 71,803 17,125 88,928 - SHING A. 90,495 24,350 114,845 - SHOKAR C. 82,019 18,280 100,299 2,157 SHOKRY A. 66,406 21,305 87,711 2,081 SHOTTON B. 112,972 25,688 138,660 2,261 SI P. 112,781 27,799 140,580 40 SIDDIQUI A. 85,012 22,460 107,472 1,394 SIDHU MAND. 79,597 18,614 98,211 639 SIDHU MANP. 85,419 19,158 104,577 886 SIDHU R. 68,676 15,992 84,668 - SIDHU T. 75,941 18,165 94,106 11,574 SIEMENS B. 96,582 23,509 120,091 176 SIEMENS R. 67,802 15,358 83,160 - SIGURDSON E. 73,114 16,876 89,990 201 SILVEIRA N. 78,554 17,857 96,411 14,535 SILVEIRA P. 136,540 31,413 167,953 892 SIMHALAPATHI K. 71,813 17,227 89,040 - SIMISTER J. 99,488 22,865 122,353 5,747 SIMMONS A. 80,578 18,429 99,007 549 SIMPSON P. 78,970 18,172 97,142 1,698 SINGBEIL K. 88,375 20,139 108,514 1,235 SINGH P. 78,995 19,516 98,511 6,843 SINGH R. 94,672 26,469 121,141 6,382 SINGH S. 79,148 12,343 91,491 3,768 SINHA N. 141,581 32,081 173,662 351 SINWAR S. 96,123 24,695 120,818 808 SIU T. 77,750 20,404 98,154 8 SKJERPEN K. 69,909 17,753 87,662 50 SKJERPEN M. 72,802 16,874 89,676 - SKRYNNYK I. 72,397 16,777 89,174 1,548 SKUCAS S. 61,692 14,337 76,029 - SKYE-MAY V. 78,622 18,269 96,891 792 SLADE I. 105,838 28,123 133,961 2,458 SMEYERS M. 92,105 21,173 113,278 360 SMIT C. 73,020 16,899 89,919 326 SMITH ADD. 65,936 15,946 81,882 1,815 SMITH ADR. 101,900 23,855 125,755 6,487 SMITH D. 91,132 20,716 111,848 2,864 SMITH JE. 107,674 23,962 131,636 11,682
Please note: ICBC changed its fiscal year-end from December 31st to March 31st and therefore, the fiscal period ending March 31, 2017 is a 15 month transitory fiscal period. The total amounts reported above represent 15 months of remuneration and expenses.

Statements and Schedules of Financial Information 2016/17
95
Remuneration and expenses paid to employees for the 15 month period ended March 31, 2017
REMUNERATION EXPENSES
EMPLOYEE NAME2016
JAN-DEC (12 MOS.)
2017 JAN-MAR (3 MOS.)
TOTAL
(15 MOS.)
TOTAL
(15 MOS.)
SMITH JO. 91,827 20,876 112,703 - SMITH K. 82,411 19,255 101,666 - SMITH L. 60,589 15,864 76,453 - SMITH P. 91,956 23,158 115,114 1,261 SMITH ROB. 66,602 15,793 82,395 825 SMITH ROD. 66,602 15,426 82,028 78 SMITH S. 78,622 18,269 96,891 90 SMRZ J. 80,528 18,865 99,393 3,250 SOAMES B. 75,193 18,915 94,108 92 SODHI J. 118,910 25,577 144,487 684 SOETISNA R. 64,722 15,462 80,184 10 SOETISNA S. 75,351 19,960 95,311 - SOHI K. 64,818 15,410 80,228 - SOMERS I. 68,037 11,708 79,745 219 SOO JAN. 84,977 21,430 106,407 - SOO JAS. 104,596 15,427 120,023 181 SOO T. 97,974 26,162 124,136 214 SOON L. 111,798 27,905 139,703 - SOROCHAK E. 62,442 13,827 76,269 815 SOTHAM J. 90,318 22,604 112,922 181 SOUSA F. 80,307 18,735 99,042 1,522 SOUTHALL V. 71,852 17,133 88,985 - SPARK R. 84,974 415 85,389 6,399 SPARROW R. 64,820 17,134 81,954 - SPECHT J. 64,376 18,090 82,466 2,220 SPENCE A. 61,406 14,833 76,239 233 SPENCE M. 144,624 35,816 180,440 1,338 SPENCER J. 118,778 31,419 150,197 867 SPENCER S. 80,885 18,173 99,058 32 SPENCER S.L. 66,123 16,178 82,301 76 SPINKS P. 78,544 - 78,544 1,111 SPITALE J. 64,221 15,595 79,816 718 SPONAGLE D. 67,909 16,409 84,318 - SPRATT M. 106,963 22,274 129,237 4,464 SPYKER M. 67,359 15,572 82,931 3,363 ST. DENNIS L. 100,885 22,859 123,744 259 ST. LOUIS E. 104,737 25,351 130,088 3,277 ST. LOUIS K. 93,625 18,343 111,968 232 ST. PIERRE A. 88,918 20,257 109,175 924 STACEY J. 69,094 15,935 85,029 568 STACH T. 63,343 16,099 79,442 2,504 STAHL M. 63,564 18,439 82,003 - STAPLETON K. 61,835 15,509 77,344 94 STARCEVICH R. 77,600 17,856 95,456 1,316 STARCHUK D. 69,243 16,384 85,627 - STARK M. 74,588 16,902 91,490 90 STASTNY M. 97,152 30,223 127,375 - STATTON G. 108,779 23,859 132,638 1,812 STEEL K. 62,211 16,599 78,810 -
REMUNERATION EXPENSES
EMPLOYEE NAME2016
JAN-DEC (12 MOS.)
2017 JAN-MAR (3 MOS.)
TOTAL
(15 MOS.)
TOTAL
(15 MOS.)
STEELE C. 93,523 20,454 113,977 - STEFAN S. 64,951 15,669 80,620 - STEIN P. 63,489 14,855 78,344 231 STEIRO C. 122,644 27,696 150,340 4,685 STELTING S. 65,251 15,218 80,469 - STENSBY M. 66,235 15,426 81,661 - STEPHENSON D. 82,086 19,510 101,596 181 STERLING S. 70,108 16,082 86,190 76 STEVENS G. 84,799 23,295 108,094 - STEVENS V. 69,360 18,047 87,407 76 STEWART A.A. 64,038 14,890 78,928 3,537 STEWART A.L. 68,356 17,030 85,386 1,190 STEWART CA. 66,347 17,192 83,539 925 STEWART CH. 74,433 16,663 91,096 76 STEWART J. 66,620 15,221 81,841 - STIRLING C. 84,819 21,016 105,835 307 STOCKLEY S. 84,991 19,769 104,760 438 STONE G. 66,359 15,426 81,785 - STORY R. 127,750 28,842 156,592 2,965 STRAMPE A. 61,577 15,116 76,693 228 STRATYCHUK K. 71,054 17,971 89,025 - STRIZHKOVA O. 66,709 9,748 76,457 668 STROES J. 68,699 16,902 85,601 - STUBEL D. 73,733 20,012 93,745 - STUKEL J. 91,123 22,579 113,702 141 STUTT R. 90,316 20,575 110,891 3,803 STYLES D. 91,633 24,832 116,465 - SUCH L. 76,532 2,350 78,882 70 SUH S. 69,760 15,681 85,441 176 SUKUNDA D. 83,135 17,861 100,996 88 SULLY M. 102,011 23,233 125,244 2,980 SUN M. 76,432 17,659 94,091 627 SUN R. 67,568 12,058 79,626 214 SUNDARAM S. 90,039 20,021 110,060 - SURIAN C. 62,026 14,307 76,333 871 SURINE R. 84,048 20,291 104,339 6 SUSWENDI A. 80,031 23,376 103,407 28 SUTHERLAND C. 92,012 21,554 113,566 460 SUTHERLAND M. 78,300 15,855 94,155 - SUTHERLAND R. 71,884 16,542 88,426 - SUTHERLAND S. 82,602 19,160 101,762 5,688 SWEENEY J. 68,870 9,426 78,296 - SWOBODA A. 60,780 14,291 75,071 5,194 SYNHORST L. 79,911 17,574 97,485 101 SZABUNIA M. 65,124 14,482 79,606 622 SZETO C. 110,017 15,881 125,898 50 SZETO T. 72,466 17,011 89,477 - SZOLADI R. 61,893 14,517 76,410 578 SZYMANSKI A. 138,315 31,233 169,548 1,335
Please note: ICBC changed its fiscal year-end from December 31st to March 31st and therefore, the fiscal period ending March 31, 2017 is a 15 month transitory fiscal period. The total amounts reported above represent 15 months of remuneration and expenses.

Insurance Corporation of British Columbia
96
Remuneration and expenses paid to employees for the 15 months period ended March 31, 2017
REMUNERATION EXPENSES
EMPLOYEE NAME2016
JAN-DEC (12 MOS.)
2017 JAN-MAR (3 MOS.)
TOTAL
(15 MOS.)
TOTAL
(15 MOS.)
TAAMS E. 61,757 14,185 75,942 556 TADEY C. 82,734 20,703 103,437 2,064 TAING C. 61,208 14,191 75,399 - TAIT B. 78,704 16,899 95,603 204 TAKHAR A. 66,409 15,114 81,523 520 TAM K. 148,084 32,694 180,778 2,538 TAN E. 67,913 16,853 84,766 113 TAN JA. 157,453 617 158,070 658 TAN JU. 79,030 17,218 96,248 - TAN M. 75,048 16,902 91,950 16 TANG C. 85,603 25,021 110,624 219 TANG R. 136,524 28,365 164,889 7,414 TANG W. 69,553 16,076 85,629 - TARASUK J. 175,063 45,190 220,253 2,112 TASH A. 75,930 18,491 94,421 3,213 TATTRIE C. 72,771 16,708 89,479 33 TAY E. 69,811 16,660 86,471 - TAY T. 86,839 19,735 106,574 - TAYLOR A. 85,168 18,250 103,418 820 TAYLOR C. 80,718 24,122 104,840 15 TAYLOR CI. 62,788 14,252 77,040 - TAYLOR DE. 79,031 18,273 97,304 - TAYLOR DO. 63,042 16,259 79,301 2,126 TAYLOR G. 64,146 14,419 78,565 - TAYLOR J. 77,713 16,202 93,915 145 TAYLOR K. 75,411 19,182 94,593 1,649 TAYLOR L. 103,575 23,374 126,949 1,143 TAYLOR M. 93,297 21,217 114,514 3,787 TAYLOR N. 205,194 47,341 252,535 6,168 TAYLOR S. 73,261 15,872 89,133 - TAYLOR T. 80,091 18,190 98,281 236 TAZELAAR T. 86,734 21,782 108,516 198 TEIFFEL R. 109,452 25,594 135,046 76 TEMPLE F. 184,772 46,232 231,004 634 TENG M. 70,904 15,883 86,787 1,208 TENTES S. 83,901 18,273 102,174 145 TERAGUCHI L. 130,917 29,598 160,515 1,085 TERMUENDE R. 108,828 24,382 133,210 4,505 TERRILLON P. 67,032 14,598 81,630 - TESTINI M. 75,194 17,819 93,013 64 TETLOW L. 102,527 24,765 127,292 - TEUBNER R. 87,325 - 87,325 1,454 TEY J. 69,214 18,806 88,020 1,625 THABRKAY S. 80,308 18,395 98,703 16 THANDI B. 70,926 18,422 89,348 1,207 THERRIEN L. 65,503 15,190 80,693 - THIELKER D. 65,540 15,426 80,966 263 THIND R. 93,556 25,241 118,797 190 THIND RA. 73,190 17,325 90,515 4,246
REMUNERATION EXPENSES
EMPLOYEE NAME2016
JAN-DEC (12 MOS.)
2017 JAN-MAR (3 MOS.)
TOTAL
(15 MOS.)
TOTAL
(15 MOS.)
THOMAS L. 66,379 16,163 82,542 - THOMAS M. 85,334 21,186 106,520 - THOMAS N. 67,239 15,432 82,671 20 THOMAS R. 66,375 15,426 81,801 243 THOMPSON B. 70,685 16,899 87,584 820 THOMPSON J. 82,159 18,273 100,432 654 THOMPSON MAR. 65,018 13,270 78,288 176 THOMPSON MAT. 91,724 20,877 112,601 8,733 THOMPSON S. 66,194 15,363 81,557 - THOMPSON W. 80,543 19,301 99,844 - THOMSEN L. 80,179 18,404 98,583 - THOMSON B. 105,989 24,355 130,344 3,104 THOMSON M. 64,753 15,702 80,455 80 THOMSON S. 66,132 15,317 81,449 1,274 THORNLEY J. 78,799 19,025 97,824 1,374 THORSTEINSON K. 65,032 14,068 79,100 - THREATFUL J. 77,499 17,453 94,952 - TIAN G. 71,304 21,045 92,349 - TILLYER E. 88,943 21,647 110,590 223 TODD M. 74,662 17,082 91,744 - TODD R. 88,633 19,994 108,627 - TOKARYK N. 58,531 18,350 76,881 - TOMAS E. 73,526 17,353 90,879 - TOMELDEN M. 73,457 17,569 91,026 96 TOMPKINS C. 73,070 16,899 89,969 - TONG A. 62,119 14,066 76,185 1,901 TONG K. 132,046 29,523 161,569 4,358 TOOMEY S. 62,966 14,246 77,212 219 TOOR S. 94,547 24,621 119,168 4,868 TOPIC S. 82,967 17,557 100,524 896 TOPSY R. 66,442 15,403 81,845 7 TORRES D. 84,962 19,319 104,281 2,694 TORRES M. 71,951 19,889 91,840 - TOSIC-KOVACEVIC V. 83,034 19,350 102,384 - TOTH A. 76,588 17,415 94,003 - TOWELL R. 80,155 22,243 102,398 311 TRAFANANKO D. 66,372 15,994 82,366 - TRAN H. 75,155 22,281 97,436 - TRAN L. 67,364 17,001 84,365 176 TRENAMAN K. 76,039 17,441 93,480 4,597 TRESPALACIOS RUBIO M. 87,459 19,333 106,792 3,021 TRIONFI S. 60,378 14,829 75,207 907 TRIPP J. 84,691 18,614 103,305 380 TRIPP S. 130,202 29,028 159,230 84 TRUHAR-PEJNOVIC N. 60,292 17,094 77,386 27 TSANG W. 62,238 15,671 77,909 - TSE C. 74,092 17,692 91,784 1,248 TSE L. 136,517 32,415 168,932 2,691 TSUI J. 119,233 31,198 150,431 965
Please note: ICBC changed its fiscal year-end from December 31st to March 31st and therefore, the fiscal period ending March 31, 2017 is a 15 month transitory fiscal period. The total amounts reported above represent 15 months of remuneration and expenses.
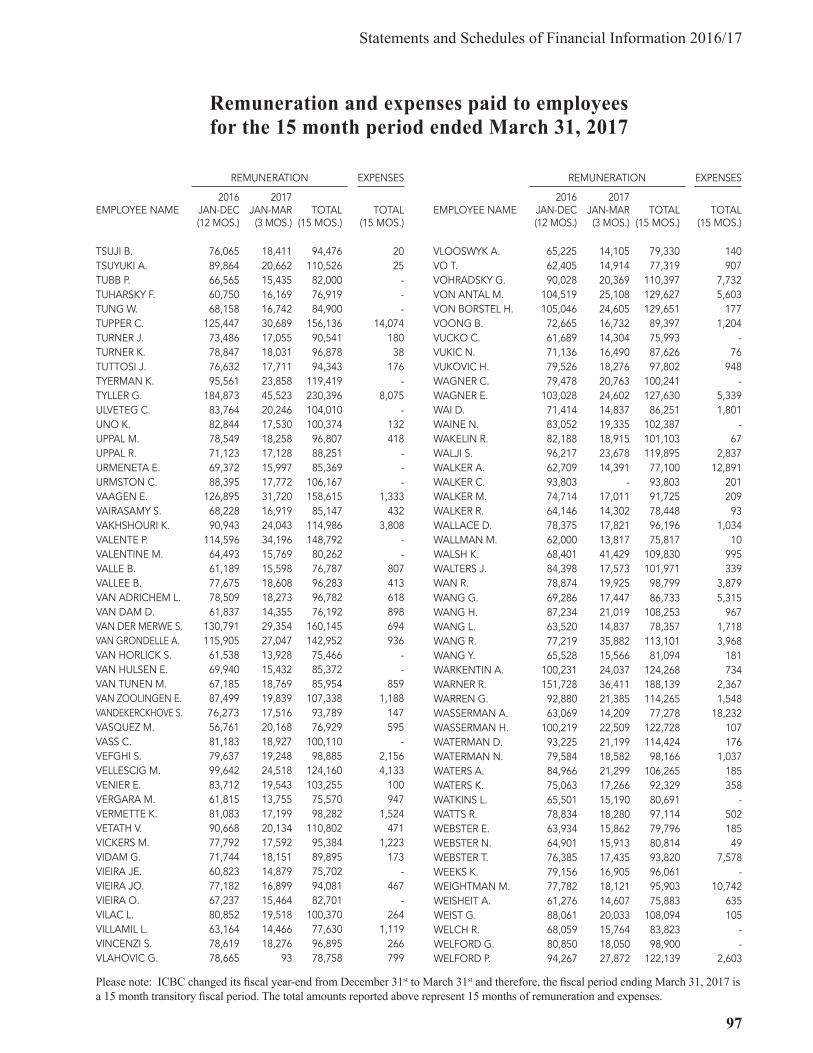
Statements and Schedules of Financial Information 2016/17
97
Remuneration and expenses paid to employees for the 15 month period ended March 31, 2017
REMUNERATION EXPENSES
EMPLOYEE NAME2016
JAN-DEC (12 MOS.)
2017 JAN-MAR (3 MOS.)
TOTAL
(15 MOS.)
TOTAL
(15 MOS.)
TSUJI B. 76,065 18,411 94,476 20 TSUYUKI A. 89,864 20,662 110,526 25 TUBB P. 66,565 15,435 82,000 - TUHARSKY F. 60,750 16,169 76,919 - TUNG W. 68,158 16,742 84,900 - TUPPER C. 125,447 30,689 156,136 14,074 TURNER J. 73,486 17,055 90,541 180 TURNER K. 78,847 18,031 96,878 38 TUTTOSI J. 76,632 17,711 94,343 176 TYERMAN K. 95,561 23,858 119,419 - TYLLER G. 184,873 45,523 230,396 8,075 ULVETEG C. 83,764 20,246 104,010 - UNO K. 82,844 17,530 100,374 132 UPPAL M. 78,549 18,258 96,807 418 UPPAL R. 71,123 17,128 88,251 - URMENETA E. 69,372 15,997 85,369 - URMSTON C. 88,395 17,772 106,167 - VAAGEN E. 126,895 31,720 158,615 1,333 VAIRASAMY S. 68,228 16,919 85,147 432 VAKHSHOURI K. 90,943 24,043 114,986 3,808 VALENTE P. 114,596 34,196 148,792 - VALENTINE M. 64,493 15,769 80,262 - VALLE B. 61,189 15,598 76,787 807 VALLEE B. 77,675 18,608 96,283 413 VAN ADRICHEM L. 78,509 18,273 96,782 618 VAN DAM D. 61,837 14,355 76,192 898 VAN DER MERWE S. 130,791 29,354 160,145 694 VAN GRONDELLE A. 115,905 27,047 142,952 936 VAN HORLICK S. 61,538 13,928 75,466 - VAN HULSEN E. 69,940 15,432 85,372 - VAN TUNEN M. 67,185 18,769 85,954 859 VAN ZOOLINGEN E. 87,499 19,839 107,338 1,188 VANDEKERCKHOVE S. 76,273 17,516 93,789 147 VASQUEZ M. 56,761 20,168 76,929 595 VASS C. 81,183 18,927 100,110 - VEFGHI S. 79,637 19,248 98,885 2,156 VELLESCIG M. 99,642 24,518 124,160 4,133 VENIER E. 83,712 19,543 103,255 100 VERGARA M. 61,815 13,755 75,570 947 VERMETTE K. 81,083 17,199 98,282 1,524 VETATH V. 90,668 20,134 110,802 471 VICKERS M. 77,792 17,592 95,384 1,223 VIDAM G. 71,744 18,151 89,895 173 VIEIRA JE. 60,823 14,879 75,702 - VIEIRA JO. 77,182 16,899 94,081 467 VIEIRA O. 67,237 15,464 82,701 - VILAC L. 80,852 19,518 100,370 264 VILLAMIL L. 63,164 14,466 77,630 1,119 VINCENZI S. 78,619 18,276 96,895 266 VLAHOVIC G. 78,665 93 78,758 799
REMUNERATION EXPENSES
EMPLOYEE NAME2016
JAN-DEC (12 MOS.)
2017 JAN-MAR (3 MOS.)
TOTAL
(15 MOS.)
TOTAL
(15 MOS.)
VLOOSWYK A. 65,225 14,105 79,330 140 VO T. 62,405 14,914 77,319 907 VOHRADSKY G. 90,028 20,369 110,397 7,732 VON ANTAL M. 104,519 25,108 129,627 5,603 VON BORSTEL H. 105,046 24,605 129,651 177 VOONG B. 72,665 16,732 89,397 1,204 VUCKO C. 61,689 14,304 75,993 - VUKIC N. 71,136 16,490 87,626 76 VUKOVIC H. 79,526 18,276 97,802 948 WAGNER C. 79,478 20,763 100,241 - WAGNER E. 103,028 24,602 127,630 5,339 WAI D. 71,414 14,837 86,251 1,801 WAINE N. 83,052 19,335 102,387 - WAKELIN R. 82,188 18,915 101,103 67 WALJI S. 96,217 23,678 119,895 2,837 WALKER A. 62,709 14,391 77,100 12,891 WALKER C. 93,803 - 93,803 201 WALKER M. 74,714 17,011 91,725 209 WALKER R. 64,146 14,302 78,448 93 WALLACE D. 78,375 17,821 96,196 1,034 WALLMAN M. 62,000 13,817 75,817 10 WALSH K. 68,401 41,429 109,830 995 WALTERS J. 84,398 17,573 101,971 339 WAN R. 78,874 19,925 98,799 3,879 WANG G. 69,286 17,447 86,733 5,315 WANG H. 87,234 21,019 108,253 967 WANG L. 63,520 14,837 78,357 1,718 WANG R. 77,219 35,882 113,101 3,968 WANG Y. 65,528 15,566 81,094 181 WARKENTIN A. 100,231 24,037 124,268 734 WARNER R. 151,728 36,411 188,139 2,367 WARREN G. 92,880 21,385 114,265 1,548 WASSERMAN A. 63,069 14,209 77,278 18,232 WASSERMAN H. 100,219 22,509 122,728 107 WATERMAN D. 93,225 21,199 114,424 176 WATERMAN N. 79,584 18,582 98,166 1,037 WATERS A. 84,966 21,299 106,265 185 WATERS K. 75,063 17,266 92,329 358 WATKINS L. 65,501 15,190 80,691 - WATTS R. 78,834 18,280 97,114 502 WEBSTER E. 63,934 15,862 79,796 185 WEBSTER N. 64,901 15,913 80,814 49 WEBSTER T. 76,385 17,435 93,820 7,578 WEEKS K. 79,156 16,905 96,061 - WEIGHTMAN M. 77,782 18,121 95,903 10,742 WEISHEIT A. 61,276 14,607 75,883 635 WEIST G. 88,061 20,033 108,094 105 WELCH R. 68,059 15,764 83,823 - WELFORD G. 80,850 18,050 98,900 - WELFORD P. 94,267 27,872 122,139 2,603
Please note: ICBC changed its fiscal year-end from December 31st to March 31st and therefore, the fiscal period ending March 31, 2017 is a 15 month transitory fiscal period. The total amounts reported above represent 15 months of remuneration and expenses.
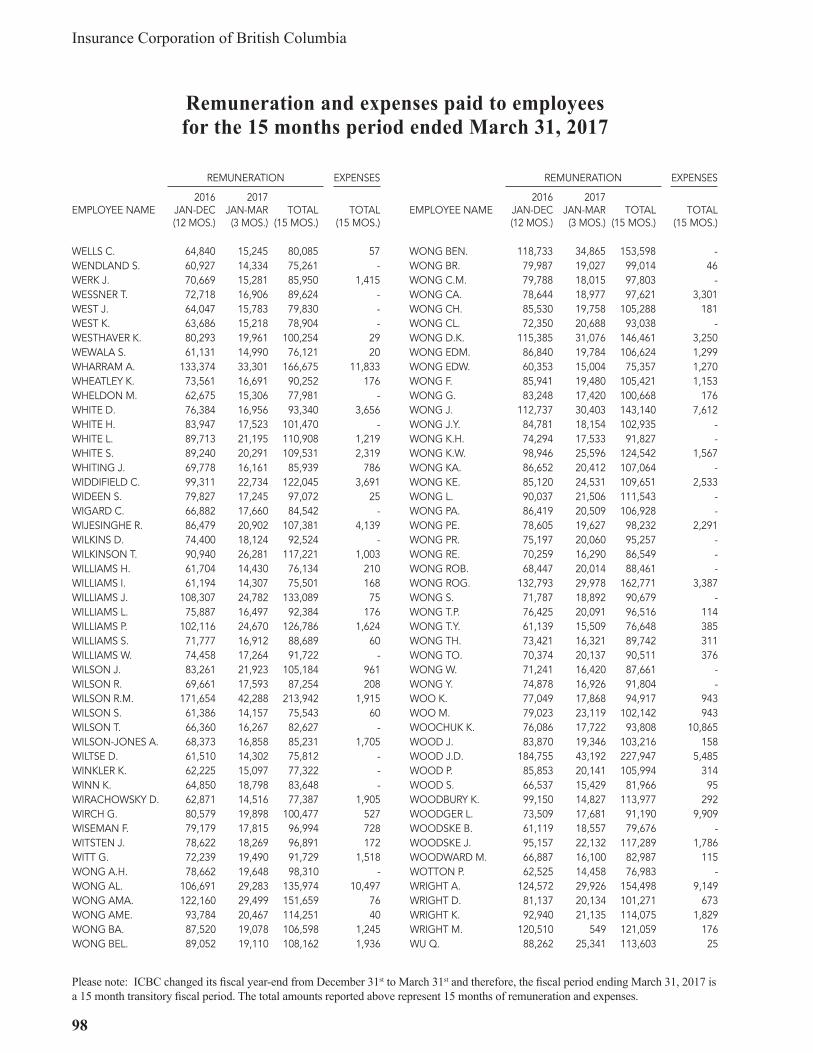
Insurance Corporation of British Columbia
98
Remuneration and expenses paid to employees for the 15 months period ended March 31, 2017
REMUNERATION EXPENSES
EMPLOYEE NAME2016
JAN-DEC (12 MOS.)
2017 JAN-MAR (3 MOS.)
TOTAL
(15 MOS.)
TOTAL
(15 MOS.)
WELLS C. 64,840 15,245 80,085 57 WENDLAND S. 60,927 14,334 75,261 - WERK J. 70,669 15,281 85,950 1,415 WESSNER T. 72,718 16,906 89,624 - WEST J. 64,047 15,783 79,830 - WEST K. 63,686 15,218 78,904 - WESTHAVER K. 80,293 19,961 100,254 29 WEWALA S. 61,131 14,990 76,121 20 WHARRAM A. 133,374 33,301 166,675 11,833 WHEATLEY K. 73,561 16,691 90,252 176 WHELDON M. 62,675 15,306 77,981 - WHITE D. 76,384 16,956 93,340 3,656 WHITE H. 83,947 17,523 101,470 - WHITE L. 89,713 21,195 110,908 1,219 WHITE S. 89,240 20,291 109,531 2,319 WHITING J. 69,778 16,161 85,939 786 WIDDIFIELD C. 99,311 22,734 122,045 3,691 WIDEEN S. 79,827 17,245 97,072 25 WIGARD C. 66,882 17,660 84,542 - WIJESINGHE R. 86,479 20,902 107,381 4,139 WILKINS D. 74,400 18,124 92,524 - WILKINSON T. 90,940 26,281 117,221 1,003 WILLIAMS H. 61,704 14,430 76,134 210 WILLIAMS I. 61,194 14,307 75,501 168 WILLIAMS J. 108,307 24,782 133,089 75 WILLIAMS L. 75,887 16,497 92,384 176 WILLIAMS P. 102,116 24,670 126,786 1,624 WILLIAMS S. 71,777 16,912 88,689 60 WILLIAMS W. 74,458 17,264 91,722 - WILSON J. 83,261 21,923 105,184 961 WILSON R. 69,661 17,593 87,254 208 WILSON R.M. 171,654 42,288 213,942 1,915 WILSON S. 61,386 14,157 75,543 60 WILSON T. 66,360 16,267 82,627 - WILSON-JONES A. 68,373 16,858 85,231 1,705 WILTSE D. 61,510 14,302 75,812 - WINKLER K. 62,225 15,097 77,322 - WINN K. 64,850 18,798 83,648 - WIRACHOWSKY D. 62,871 14,516 77,387 1,905 WIRCH G. 80,579 19,898 100,477 527 WISEMAN F. 79,179 17,815 96,994 728 WITSTEN J. 78,622 18,269 96,891 172 WITT G. 72,239 19,490 91,729 1,518 WONG A.H. 78,662 19,648 98,310 - WONG AL. 106,691 29,283 135,974 10,497 WONG AMA. 122,160 29,499 151,659 76 WONG AME. 93,784 20,467 114,251 40 WONG BA. 87,520 19,078 106,598 1,245 WONG BEL. 89,052 19,110 108,162 1,936
REMUNERATION EXPENSES
EMPLOYEE NAME2016
JAN-DEC (12 MOS.)
2017 JAN-MAR (3 MOS.)
TOTAL
(15 MOS.)
TOTAL
(15 MOS.)
WONG BEN. 118,733 34,865 153,598 - WONG BR. 79,987 19,027 99,014 46 WONG C.M. 79,788 18,015 97,803 - WONG CA. 78,644 18,977 97,621 3,301 WONG CH. 85,530 19,758 105,288 181 WONG CL. 72,350 20,688 93,038 - WONG D.K. 115,385 31,076 146,461 3,250 WONG EDM. 86,840 19,784 106,624 1,299 WONG EDW. 60,353 15,004 75,357 1,270 WONG F. 85,941 19,480 105,421 1,153 WONG G. 83,248 17,420 100,668 176 WONG J. 112,737 30,403 143,140 7,612 WONG J.Y. 84,781 18,154 102,935 - WONG K.H. 74,294 17,533 91,827 - WONG K.W. 98,946 25,596 124,542 1,567 WONG KA. 86,652 20,412 107,064 - WONG KE. 85,120 24,531 109,651 2,533 WONG L. 90,037 21,506 111,543 - WONG PA. 86,419 20,509 106,928 - WONG PE. 78,605 19,627 98,232 2,291 WONG PR. 75,197 20,060 95,257 - WONG RE. 70,259 16,290 86,549 - WONG ROB. 68,447 20,014 88,461 - WONG ROG. 132,793 29,978 162,771 3,387 WONG S. 71,787 18,892 90,679 - WONG T.P. 76,425 20,091 96,516 114 WONG T.Y. 61,139 15,509 76,648 385 WONG TH. 73,421 16,321 89,742 311 WONG TO. 70,374 20,137 90,511 376 WONG W. 71,241 16,420 87,661 - WONG Y. 74,878 16,926 91,804 - WOO K. 77,049 17,868 94,917 943 WOO M. 79,023 23,119 102,142 943 WOOCHUK K. 76,086 17,722 93,808 10,865 WOOD J. 83,870 19,346 103,216 158 WOOD J.D. 184,755 43,192 227,947 5,485 WOOD P. 85,853 20,141 105,994 314 WOOD S. 66,537 15,429 81,966 95 WOODBURY K. 99,150 14,827 113,977 292 WOODGER L. 73,509 17,681 91,190 9,909 WOODSKE B. 61,119 18,557 79,676 - WOODSKE J. 95,157 22,132 117,289 1,786 WOODWARD M. 66,887 16,100 82,987 115 WOTTON P. 62,525 14,458 76,983 - WRIGHT A. 124,572 29,926 154,498 9,149 WRIGHT D. 81,137 20,134 101,271 673 WRIGHT K. 92,940 21,135 114,075 1,829 WRIGHT M. 120,510 549 121,059 176 WU Q. 88,262 25,341 113,603 25
Please note: ICBC changed its fiscal year-end from December 31st to March 31st and therefore, the fiscal period ending March 31, 2017 is a 15 month transitory fiscal period. The total amounts reported above represent 15 months of remuneration and expenses.

Statements and Schedules of Financial Information 2016/17
99
Remuneration and expenses paid to employees for the 15 month period ended March 31, 2017
REMUNERATION EXPENSES
EMPLOYEE NAME2016
JAN-DEC (12 MOS.)
2017 JAN-MAR (3 MOS.)
TOTAL
(15 MOS.)
TOTAL
(15 MOS.)
WYLIE L. 61,729 14,215 75,944 4,006 WYLLIE T. 75,082 16,691 91,773 - WYNHOVEN K. 62,570 15,050 77,620 616 XU B. 99,067 22,532 121,599 - YAMAMOTO R. 70,091 18,840 88,931 - YAN M. 89,722 23,809 113,531 - YANG L. 73,818 17,294 91,112 1,937 YAP K. 85,871 21,297 107,168 387 YARDLEY C. 68,791 18,305 87,096 - YASAYKO J. 80,140 17,497 97,637 75 YEE E. 78,820 18,340 97,160 - YEE J. 60,346 15,947 76,293 1,960 YEE K. 72,906 16,905 89,811 16 YEE S. 76,386 23,106 99,492 168 YEN C. 78,726 22,751 101,477 - YENDALL S. 134,001 - 134,001 2,755 YERXA T. 76,634 18,325 94,959 76 YEUNG CH. 108,875 31,007 139,882 3,119 YEUNG CL. 68,798 15,677 84,475 - YEUNG CO. 90,097 27,453 117,550 1,552 YEUNG E. 104,194 23,690 127,884 341 YIP B. 74,215 15,657 89,872 76 YOCHIM C. 63,037 14,653 77,690 - YORSTON D. 72,920 16,908 89,828 476 YOUNG CH. 62,001 15,415 77,416 2,037 YOUNG CO. 96,890 23,264 120,154 2,077 YOUNG D.C. 82,872 18,236 101,108 465 YOUNG M. 89,179 23,261 112,440 2,279 YOUNG SH. 86,247 21,012 107,259 483 YOUNG SU. 61,513 14,302 75,815 - YOUNG T. 87,747 19,161 106,908 2,294 YPENBURG K. 98,949 21,341 120,290 10,347 YPENBURG R. 65,267 15,489 80,756 328 YU L. 68,533 16,566 85,099 1,536 YUAN Y. 88,804 24,537 113,341 2,649 YUE M. 95,922 18,169 114,091 380
REMUNERATION EXPENSES
EMPLOYEE NAME2016
JAN-DEC (12 MOS.)
2017 JAN-MAR (3 MOS.)
TOTAL
(15 MOS.)
TOTAL
(15 MOS.)
YUEN H. 77,451 17,895 95,346 75 YUEN J. 84,307 17,606 101,913 57 YUEN L. 61,471 14,012 75,483 443 YUEN S. 75,589 16,487 92,076 76 YUK D. 60,673 15,214 75,887 1,243 YUN S. 169,966 40,851 210,817 386 YUNG Y. 124,027 603 124,630 3,082 ZABKAR J. 85,203 19,235 104,438 - ZANACHELLI A. 60,625 15,507 76,132 - ZANATTA M. 71,914 13,640 85,554 76 ZANIC L. 70,196 17,873 88,069 913 ZANNIS F. 78,452 17,882 96,334 - ZARYSKI T. 82,917 19,930 102,847 1,436 ZAURRINI M. 81,950 17,853 99,803 1,179 ZAYTSOFF K. 91,913 20,934 112,847 5,791 ZENAROSA R. 92,610 23,827 116,437 - ZENONE C. 62,381 14,463 76,844 - ZHANG G. 78,973 18,994 97,967 3,323 ZHAO B. 92,075 21,612 113,687 - ZHAO M. 116,613 29,477 146,090 463 ZHONG J. 69,928 16,172 86,100 1,362 ZHU Y. 102,513 23,540 126,053 2,068 ZIELINSKI S. 60,582 15,732 76,314 172 ZIEMIANSKI J. 74,503 17,206 91,709 1,548 ZINGER K. 69,103 16,172 85,275 2,468 ZORN P. 74,460 16,905 91,365 78 ZUPANCIC D. 77,828 18,226 96,054 4,025
RECEIVER GEN. OF CANADA 23,220,971 -
TOTAL FOR OVER $75,000 $ 281,666,625 3,582,929
OTHER UNDER $75,000 $ 159,345,532 1,253,724
GRAND TOTAL $ 441,012,157 4,836,653
There were 39 severance agreements made between ICBC and its non-unionized employees during the 15 month period ended March 31, 2017. These agreements represent from 3 months to 18 months compensation.
Please note: ICBC changed its fiscal year-end from December 31st to March 31st and therefore, the fiscal period ending March 31, 2017 is a 15 month transitory fiscal period. The total amounts reported above represent 15 months of remuneration and expenses.

Insurance Corporation of British Columbia
100
NAME
POSITION
MEETINGS ATTENDED 1
RETAINERS
MEETINGS
FEES 2
TOTAL REMUNERATION
(15 MOS.)
EXPENSES
(15 MOS.)
BOIVIE C. BOARD OF DIRECTORSTRANSFORMATION PROGRAM COMMITTEE, CHAIRGOVERNANCE COMMITTEEOPERATIONS & PLANNING COMMITTEEAUDIT COMMITTEE (AS A GUEST)
15 of 1511 of 1110 of 101 of 11 of 1
18,750 3,000
17,250 39,000 1,334
DAVIDSON W. BOARD OF DIRECTORSAUDIT COMMITTEE, CHAIRINVESTMENT COMMITTEE
14 of 156 of 79 of 9
18,750 6,250
16,125 41,125 410
PENNER B.3 BOARD OF DIRECTORS, CHAIRAUDIT COMMITTEEINVESTMENT COMMITTEEHUMAN RESOURCES & COMPENSATION COMMITTEE
GOVERNANCE COMMITTEERATES AFFORDABILITY REVIEW COMMITTEERATES AFFORDABITY REVIEW EXTRAORDINARY MEETINGS
OPERATIONS & PLANNING COMMITTEE
12 of 155 of 77 of 96 of 8
9 of 108 of 823 of 23
6 of 8
30,000 33,375 63,375 14,314
HOWE M. BOARD OF DIRECTORSINVESTMENT COMMITTEE, CHAIRHUMAN RESOURCES & COMPENSATION COMMITTEE
AUDIT COMMITTEE (AS A GUEST)RATES AFFORDABILITY REVIEW COMMITTEE
14 of 159 of 98 of 8
1 of 17 of 8
18,750 3,750
18,375 40,875 60
McDONALD J. 4 BOARD OF DIRECTORSOPERATIONS & PLANNING COMMITTEEGOVERNANCE COMMITTEE, CHAIR
2 of 21 of 11 of 1
3,750
750
2,250 6,750 -
McINTYRE K.5 BOARD OF DIRECTORSTRANSFORMATION PROGRAM COMMITTEEOPERATIONS & PLANNING COMMITTEEHUMAN RESOURCES & COMPENSATION COMMITTEE
AUDIT COMMITTEE (AS A GUEST)GOVERNANCE COMMITTEE
15 of 1511 of 118 of 88 of 8
1 of 17 of 10
18,750 21,750 40,500 9,091
OLYNYK R.6 BOARD OF DIRECTORSAUDIT COMMITTEEOPERATIONS & PLANNING COMMITTEE, CHAIRRATES AFFORDABILITY REVIEW COMMITTEETRANSFORMATION PROGRAM COMMITTEE
13 of 155 of 75 of 88 of 810 of 11
22,500
3,750
18,375 44,625
8,829
ORR S.7 BOARD OF DIRECTORSGOVERNANCE COMMITTEE, CHAIRAUDIT COMMITTEEOPERATIONS & PLANNING COMMITTEERATES AFFORDABILITY REVIEW COMMITTEE
15 of 1510 of 107 of 78 of 88 of 8
18,7502,025
22,125 42,900 6,626
SUMAL I. BOARD OF DIRECTORSHUMAN RESOURCES & COMPENSATION COMMITTEE, CHAIR
INVESTMENT COMMITTEEAUDIT COMMITTEE (AS A GUEST)
14 of 158 of 8
7 of 91 of 1
18,750 3,750
14,625 37,125 2,419
GRAND TOTAL $ 192,025 $ 164,250 $ 356,275 $ 43,083
Meetings attended reflects only the total number of meetings held during each Director’s tenure on the Board or Committee.1 Paid up to a maximum of 30 full day meetings for Directors and 60 full day meetings for the Board Chair2 Meeting fees are $375 per half day and $750 per full day3 Barry Penner was appointed Chair on March 31, 2016 and served to July 20, 2017. On February 21, 2017, Barry received authorization from
the Appointee Remuneration Committee (ARC) of the Ministry of Transportation & Infrastructure to receive remuneration for extraordinary meetings attended for Rates Affordability Review
4 Jessica McDonald resigned July 22, 20165 Kevin McIntyre appointed December 31, 20156 Ron Olynyk served as Interim Chair of the Board January 1, to March 31, 20167 Sheila Orr was appointed Chair of the Governance Committee on July 28, 2016
Remuneration and expenses paid to members of the board of directors for the 15 month period ended March 31, 2017
Please note: ICBC changed its fiscal year-end from December 31st to March 31st and therefore, the fiscal period ending March 31, 2017 is a 15 month transitory fiscal period. The total amounts reported above represent 15 months of remuneration and expenses.
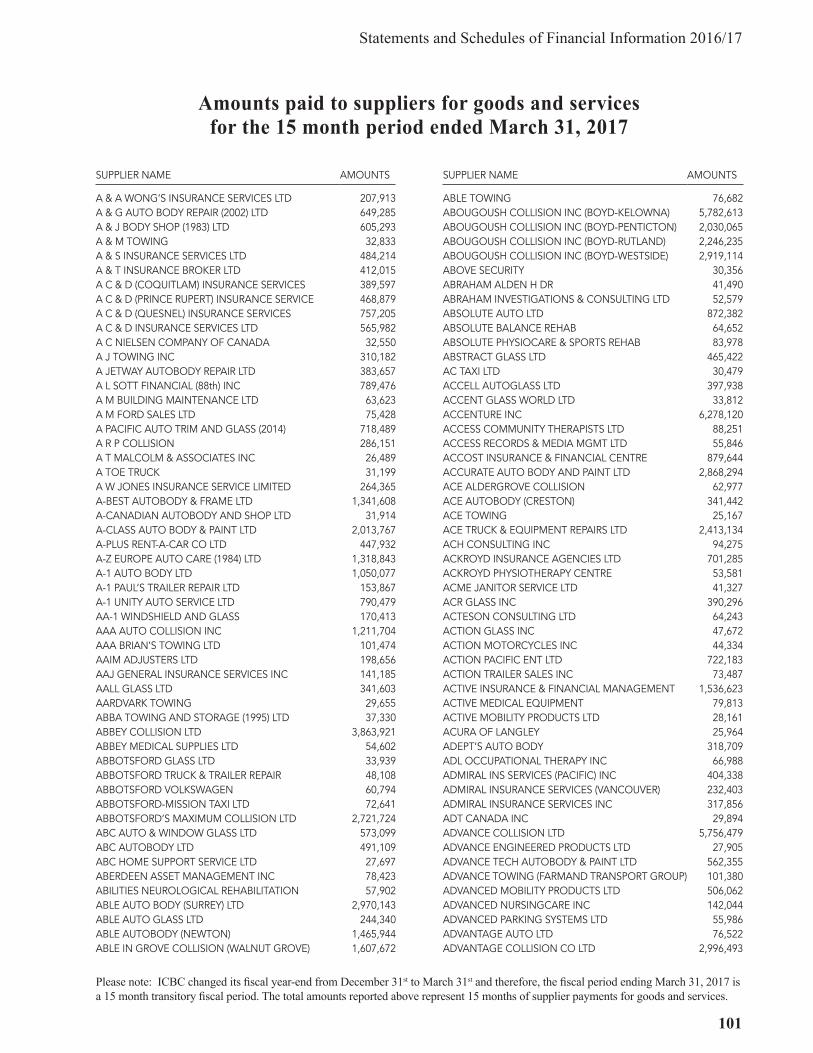
Statements and Schedules of Financial Information 2016/17
101
Amounts paid to suppliers for goods and services for the 15 month period ended March 31, 2017
SUPPLIER NAME AMOUNTS
A & A WONG’S INSURANCE SERVICES LTD 207,913A & G AUTO BODY REPAIR (2002) LTD 649,285A & J BODY SHOP (1983) LTD 605,293A & M TOWING 32,833A & S INSURANCE SERVICES LTD 484,214A & T INSURANCE BROKER LTD 412,015A C & D (COQUITLAM) INSURANCE SERVICES 389,597A C & D (PRINCE RUPERT) INSURANCE SERVICE 468,879A C & D (QUESNEL) INSURANCE SERVICES 757,205A C & D INSURANCE SERVICES LTD 565,982A C NIELSEN COMPANY OF CANADA 32,550A J TOWING INC 310,182A JETWAY AUTOBODY REPAIR LTD 383,657A L SOTT FINANCIAL (88th) INC 789,476A M BUILDING MAINTENANCE LTD 63,623A M FORD SALES LTD 75,428A PACIFIC AUTO TRIM AND GLASS (2014) 718,489A R P COLLISION 286,151A T MALCOLM & ASSOCIATES INC 26,489A TOE TRUCK 31,199A W JONES INSURANCE SERVICE LIMITED 264,365A-BEST AUTOBODY & FRAME LTD 1,341,608A-CANADIAN AUTOBODY AND SHOP LTD 31,914A-CLASS AUTO BODY & PAINT LTD 2,013,767A-PLUS RENT-A-CAR CO LTD 447,932A-Z EUROPE AUTO CARE (1984) LTD 1,318,843A-1 AUTO BODY LTD 1,050,077A-1 PAUL’S TRAILER REPAIR LTD 153,867A-1 UNITY AUTO SERVICE LTD 790,479AA-1 WINDSHIELD AND GLASS 170,413AAA AUTO COLLISION INC 1,211,704AAA BRIAN’S TOWING LTD 101,474AAIM ADJUSTERS LTD 198,656AAJ GENERAL INSURANCE SERVICES INC 141,185AALL GLASS LTD 341,603AARDVARK TOWING 29,655ABBA TOWING AND STORAGE (1995) LTD 37,330ABBEY COLLISION LTD 3,863,921ABBEY MEDICAL SUPPLIES LTD 54,602ABBOTSFORD GLASS LTD 33,939ABBOTSFORD TRUCK & TRAILER REPAIR 48,108ABBOTSFORD VOLKSWAGEN 60,794ABBOTSFORD-MISSION TAXI LTD 72,641ABBOTSFORD’S MAXIMUM COLLISION LTD 2,721,724ABC AUTO & WINDOW GLASS LTD 573,099ABC AUTOBODY LTD 491,109ABC HOME SUPPORT SERVICE LTD 27,697ABERDEEN ASSET MANAGEMENT INC 78,423ABILITIES NEUROLOGICAL REHABILITATION 57,902ABLE AUTO BODY (SURREY) LTD 2,970,143ABLE AUTO GLASS LTD 244,340ABLE AUTOBODY (NEWTON) 1,465,944ABLE IN GROVE COLLISION (WALNUT GROVE) 1,607,672
SUPPLIER NAME AMOUNTS
ABLE TOWING 76,682ABOUGOUSH COLLISION INC (BOYD-KELOWNA) 5,782,613ABOUGOUSH COLLISION INC (BOYD-PENTICTON) 2,030,065ABOUGOUSH COLLISION INC (BOYD-RUTLAND) 2,246,235ABOUGOUSH COLLISION INC (BOYD-WESTSIDE) 2,919,114ABOVE SECURITY 30,356ABRAHAM ALDEN H DR 41,490ABRAHAM INVESTIGATIONS & CONSULTING LTD 52,579ABSOLUTE AUTO LTD 872,382ABSOLUTE BALANCE REHAB 64,652ABSOLUTE PHYSIOCARE & SPORTS REHAB 83,978ABSTRACT GLASS LTD 465,422AC TAXI LTD 30,479ACCELL AUTOGLASS LTD 397,938ACCENT GLASS WORLD LTD 33,812ACCENTURE INC 6,278,120ACCESS COMMUNITY THERAPISTS LTD 88,251ACCESS RECORDS & MEDIA MGMT LTD 55,846ACCOST INSURANCE & FINANCIAL CENTRE 879,644ACCURATE AUTO BODY AND PAINT LTD 2,868,294ACE ALDERGROVE COLLISION 62,977ACE AUTOBODY (CRESTON) 341,442ACE TOWING 25,167ACE TRUCK & EQUIPMENT REPAIRS LTD 2,413,134ACH CONSULTING INC 94,275ACKROYD INSURANCE AGENCIES LTD 701,285ACKROYD PHYSIOTHERAPY CENTRE 53,581ACME JANITOR SERVICE LTD 41,327ACR GLASS INC 390,296ACTESON CONSULTING LTD 64,243ACTION GLASS INC 47,672ACTION MOTORCYCLES INC 44,334ACTION PACIFIC ENT LTD 722,183ACTION TRAILER SALES INC 73,487ACTIVE INSURANCE & FINANCIAL MANAGEMENT 1,536,623ACTIVE MEDICAL EQUIPMENT 79,813ACTIVE MOBILITY PRODUCTS LTD 28,161ACURA OF LANGLEY 25,964ADEPT’S AUTO BODY 318,709ADL OCCUPATIONAL THERAPY INC 66,988ADMIRAL INS SERVICES (PACIFIC) INC 404,338ADMIRAL INSURANCE SERVICES (VANCOUVER) 232,403ADMIRAL INSURANCE SERVICES INC 317,856ADT CANADA INC 29,894ADVANCE COLLISION LTD 5,756,479ADVANCE ENGINEERED PRODUCTS LTD 27,905ADVANCE TECH AUTOBODY & PAINT LTD 562,355ADVANCE TOWING (FARMAND TRANSPORT GROUP) 101,380ADVANCED MOBILITY PRODUCTS LTD 506,062ADVANCED NURSINGCARE INC 142,044ADVANCED PARKING SYSTEMS LTD 55,986ADVANTAGE AUTO LTD 76,522ADVANTAGE COLLISION CO LTD 2,996,493
Please note: ICBC changed its fiscal year-end from December 31st to March 31st and therefore, the fiscal period ending March 31, 2017 is a 15 month transitory fiscal period. The total amounts reported above represent 15 months of supplier payments for goods and services.

Insurance Corporation of British Columbia
102
Amounts paid to suppliers for goods and services for the 15 month period ended March 31, 2017
SUPPLIER NAME AMOUNTS
ADVANTAGE INSURANCE SERVICES LTD 222,477ADVANTAGE SPEECH-LANGUAGE PATHOLOGY 66,659ADVENTURE RV CENTER LTD 32,025AEDIFY CONSULTING 28,059AFFINITY CHIROPRACTIC CORPORATION 26,985AFFINITY INSURANCE SERVICES 142,098AFFLECK HRABINSKY BURGOYNE LLP 1,083,985AFFORDABLE AUTO GLASS 70,135AGAR’S FIX AUTO KELOWNA 355,603AGAR’S FIX AUTO WEST KELOWNA 439,676AGGRESSIVE AUTO TOWING LTD 316,244AGS AFFORDABLE GLASS SERVICES LTD 337,637AIM CEDAR WORKS LTD 165,287AIRLIFT NORTHWEST 78,608AJ’S GLASS CENTRE LTD 231,050AK AUTOWORKS (A K AUTOBODY & REPAIR LTD) 2,119,230AK FITNESS INC 58,408AL PARKER AUTOBODY 126,006ALASKA HI-WAY AUTO BODY (2004) LTD 5,942,656ALASKA HI-WAY AUTO GLASS LTD 251,018ALBERNI GLASS & MIRROR 134,804ALBERNI TOWING LTD 142,044ALBERTA HEALTH SERVICES 35,378ALCOTT BUILDING MAINTENANCE 78,185ALDER STREET AUTO BODY LTD 1,017,600ALDERGROVE A-1 GLASS LTD 359,171ALEXANDER HOLBURN BEAUDIN & LANG LLP 7,330,762ALL ACCESS AUTO GLASS 39,839ALL COLLISION SERVICES LTD 243,535ALL RISK INSURANCE AGENCIES LIMITED 736,102ALL SEASONS AUTO GLASS LTD 247,555ALL TECH TRANSPORT LTD (BUSTERS TOWING) 3,355,446ALL WRITE INSURANCE AGENCIES LTD 1,382,311ALL-WEST GLASS BURNS LAKE LTD 153,643ALL-WEST GLASS CHETWYND LTD 96,548ALL-WEST GLASS FT ST JOHN LTD 281,303ALL-WEST GLASS HAZELTON LTD 89,212ALL-WEST GLASS HOUSTON LTD 144,684ALL-WEST GLASS KITIMAT LTD 228,383ALL-WEST GLASS PRINCE GEORGE LTD 566,109ALL-WEST GLASS PRINCE RUPERT LTD 146,126ALL-WEST GLASS QUESNEL LTD 200,679ALL-WEST GLASS SMITHERS LTD 380,345ALL-WEST GLASS TERRACE LTD 361,721ALL-WEST GLASS VANDERHOOF LTD 137,045ALL-WEST HERITAGE GLASS LTD 124,503ALLENA CHONG INSURANCE AGENCIES LTD 229,192ALLIANZ GLOBAL INVESTORS US LLC 1,892,337ALLIED COAST THERAPY 130,303ALLIED INFORMATION CANADA 163,632ALLIED INSURANCE SERVICES INC 3,443,652ALLSET AUTO GLASS LTD 573,724ALLSTAR COLLISION SERVICES LTD 1,319,268
SUPPLIER NAME AMOUNTS
ALLSTAR HOLDINGS INCORPORATED 483,299ALLWEST INSURANCE SERVICES LTD 19,969,439ALLWEST REPORTING LTD 169,230ALOON STEPHEN DR INC 108,774ALOUETTE TRANSIT SYSTEMS LTD 83,620ALPINE AUTO BODY LTD 725,198ALPINE GLASS WINDOWS & DOORS LTD 360,067ALPINE INSURANCE AGENCIES LTD 412,108ALPORT INSURANCE AGENCIES INC 528,237ALVERSON TAYLOR MORTENSEN & SANDERS 131,805ALWAYS ABLE AUTO BODY 49,130AMBER AUTO BODY 170,703AMC CASSELLS INSURANCE SERVICE INC 252,928AMC EAGLERIDGE INSURANCE SERVICE (2012) 338,255AMC INSURANCE SERVICE (2008) LTD 436,906AMC INSURANCE SERVICE LTD 2,236,650AMC INSURANCE SERVICES (2011) LTD 265,692AMC INSURANCE SERVICES (2015) LTD 228,998AMERESCO 68,207AMEX AUTO BODY LTD 690,063AMIRI ALI DR 40,568AMJ LAW 2,661,568AMPCO MANUFACTURERS INC 186,756ANCHOR INSURANCE AGENCIES LTD 360,627ANCHORS AWAY TOWING LTD 30,700ANDERSON DUNCAN DR 46,240ANDERSON STEPHEN D DR INC 29,778ANDRE’S COLLISION REPAIRS LTD 700,349ANDY SORENSEN AUTOBODY & FRAME LTD 1,153,097ANGELS THERE FOR YOU HOME HEALTH CARE 65,743ANNETS KATHERINE, RMT 31,109ANNEX CONSULTING GROUP INC 4,851,239ANTLE TOWING LTD 69,874AON HEWITT INC 426,133AON REED STENHOUSE INC 877,162AP INSURANCE SERVICES LTD 463,431APAC AUTO GLASS 491,680APAC INVESTIGATION SERVICES INC 425,591APEL MARYANA DR 52,357APEX AUTO BODY 59,238APEX COLLISION 757,802APEX GLASS LTD 231,039APEX INSURANCE SERVICES LTD 1,169,595APEX PREMIER PROPERTY SERVICES LTD 38,419APHEMA PHYSIOTHERAPY CORP 29,911APOLLO CLINIC (THE) 118,373APPLE AUTO GLASS (ABBOTSFORD) 543,006APPLE AUTO GLASS (CHILLIWACK) 380,014APPLE AUTO GLASS (KAMLOOPS) 466,893APPLE AUTO GLASS (NANAIMO) 453,933APPLE AUTO GLASS (SALMON ARM) 336,437APPLE AUTO GLASS (VERNON) 477,610APPLE INSURANCE & FINANCIAL SERVICES INC 482,978
Please note: ICBC changed its fiscal year-end from December 31st to March 31st and therefore, the fiscal period ending March 31, 2017 is a 15 month transitory fiscal period. The total amounts reported above represent 15 months of supplier payments for goods and services.

Statements and Schedules of Financial Information 2016/17
103
Amounts paid to suppliers for goods and services for the 15 month period ended March 31, 2017
SUPPLIER NAME AMOUNTS
APPLEWOOD KIA (APPLEWOOD MOTORS INC) 36,566AR OT REHABILITATION SERVICES INC 858,292ARBOR BODY SHOP (1980) LTD 942,582ARBUTUS RV & MARINE SALES LTD 143,004ARCHIE’S AUTOWRECKING & TOWING 63,936ARCTECH WELDING & MACHINING 53,403ARGUS SOFTWARE INC 41,518ARI FINANCIAL SERVICES INC 987,270ARIA SOLUTIONS INC 2,827,610ARIO CONSTRUCTION INC 45,453ARMSTRONG COLLISION LTD 1,499,994ARO INC 428,617ARROW INSURANCE AGENCY LTD 1,513,899ARROW TRANSPORTATION SYSTEMS 114,296ARROWSMITH AUTOMOTIVE 93,996ARTHUR JOHN S DR INC 470,640AS NEW AUTOBODY & GLASS LTD 1,251,354ASC COLLISION REPAIR 2,582,064ASC-AUTOMOTIVE STYLING CENTRE 91,579ASHBERRY GLASS & WOODWORKING 82,459ASHES TO ANSWERS FIRE INVESTIGATION INC 29,524ASPECT SOFTWARE CANADA 219,812ASPECT SOFTWARE INC 43,573ASSESSMED 1,092,381ASSOCIATED ECONOMIC CONSULTANTS LTD 30,188ASSOCIATED ENGINEERING (BC) LTD 42,717ASSOCIATED INDEPENDENT ADJUSTERS 108,214ASTROGRAPHICS INDUSTRIES LTD 457,277AT MALCOLM & ASSOCIATES INC 33,448ATI GLASS SERVICES LTD 121,847ATI TRUCK REPAIR LTD 1,039,575ATLASSIAN PTY LTD 83,969ATS TRAFFIC BRITISH COLUMBIA LTD 64,608ATTACHMATE CORPORATION 240,787ATWAL’S INSURANCE & FINANCIAL CENTRE INC 1,031,674ATWATER INSURANCE AGENCY LTD 493,988AUDATEX 5,873,888AUDI DOWNTOWN VANCOUVER 39,371AUDI OF RICHMOND (COWELL 32,358AUDY FIX AUTO WEST SHORE (AUDY AUTOBODY) 1,491,518AURORA TRUCK CENTRE LTD 162,993AUTO ART COMPLETE REPAIRS LTD 73,334AUTO PLUS INSURANCE AGENCY INC 563,749AUTO SENSE COLLISION LTD 1,994,494AUTO WEST BMW (MTK AUTO WEST) 91,179AUTO-COM REFINISHING 99,393AUTOBODY ONE INC 779,869AUTOCRAFT AUTOBODY 147,574AUTOMALL AUTOBODY LTD 3,240,831AUTOMASTER AUTOBODY LTD 1,987,300AUTOMIND COLLISION REPAIR (ABBOTSFORD) 718,008AUTOMIND COLLISION REPAIR (BURNABY) 1,966,003AUTOMIND COLLISION REPAIR (COQUITLAM) 1,902,195
SUPPLIER NAME AMOUNTS
AUTOMIND COLLISION REPAIR (RICHMOND) 4,003,955AUTOMIND COLLISION REPAIR (SQUAMISH) 1,485,269AUTOMIND COLLISION REPAIR (VANCOUVER) 3,793,439AUTOMOTIVE TRAINING & TECHNICAL 64,370AUTOSMART COMPLETE REPAIRS & SERVICES INC 442,762AUTOSONIC AUTOBODY & REPAIR LTD 114,150AUTOWEST AUTOBODY LTD 1,829,126AVENUE ALIGNMENT & BODY SHOP 1,279,471AVEPOINT CANADA LTD 63,993AVERSON CONSULTING LTD 185,220AVISCAR INC 513,921AVISON YOUNG 51,465AVNET INC 30,687AVOCETTE TECHNOLOGIES INC 179,637AXIS INSURANCE MANAGERS INC DBA WINRAM 291,208AZORCAN AUTOBODY REPAIR & PAINTING 1,612,343B & A AUTO BODY (QUESNEL CANYON HOLDINGS) 1,719,299B & B GLASS 70,119B & D AUTO BODY LTD 4,999,917B & M AUTO-CRAFT COLLISION LTD 1,848,768B D MITCHELL PROSTHETIC & ORTHOTIC 50,995BABINE TRUCK & EQUIPMENT LTD (PR GEORGE) 36,453BABINE TRUCK & EQUIPMENT LTD (SMITHERS) 84,574BACK IN MOTION FUNCTIONAL ASSESSMENTS 1,095,348BACK IN MOTION PHYSIO & ACTIVE REHAB 387,477BACK IN MOTION REHAB INC 48,980BACK TO BACK CHIROPRACTIC 55,965BADRY COLLISION REPAIRS INC 817,060BAE SYSTEMS APPLIED INTELLIGENCE CANADA 3,423,244BAGGOO ALAN DR LTD 33,450BAILEY MARK, PHD R PSYCH 26,710BAILEY WESTERN STAR TRUCKS INC 39,209BAJA AUTOBODY LTD 604,753BAKER AUTO INC 43,000BAKER MATERIALS ENGINEERING LTD 867,446BAKER NEWBY LLP 1,719,765BALANCE IN MOTION 73,869BALFOUR AUTOBODY & GLASS LTD 252,929BANK OF MONTREAL 388,482BANMAN SCOTT DR CHIROPRACTIC SERVICES 43,789BANNISTER CHEV BUICK GMC VERNON INC 1,757,209BANNISTER COLLISION & GLASS 1,975,491BANNISTER HONDA 34,832BARE’S PAINT & BODYWORKS 1,266,408BARNES CRAIG & ASSOCIATES 256,786BARNES HARLEY-DAVIDSON (VICTORIA) 68,344BARNES HARLEY-DAVIDSON BUELL 59,590BARNES WHEATON (N SURREY) CHEV BUICK GMC 2,543,829BARON INSURANCE AGENCIES GROUP INC 1,578,040BASRA CHIROPRACTIC CLINIC INC 38,920BASRA JASKARANPAL DR 282,425BASRA STEVEN DR 295,243BAVARO AUTO BODY & AUTO GLASS 675,255
Please note: ICBC changed its fiscal year-end from December 31st to March 31st and therefore, the fiscal period ending March 31, 2017 is a 15 month transitory fiscal period. The total amounts reported above represent 15 months of supplier payments for goods and services.
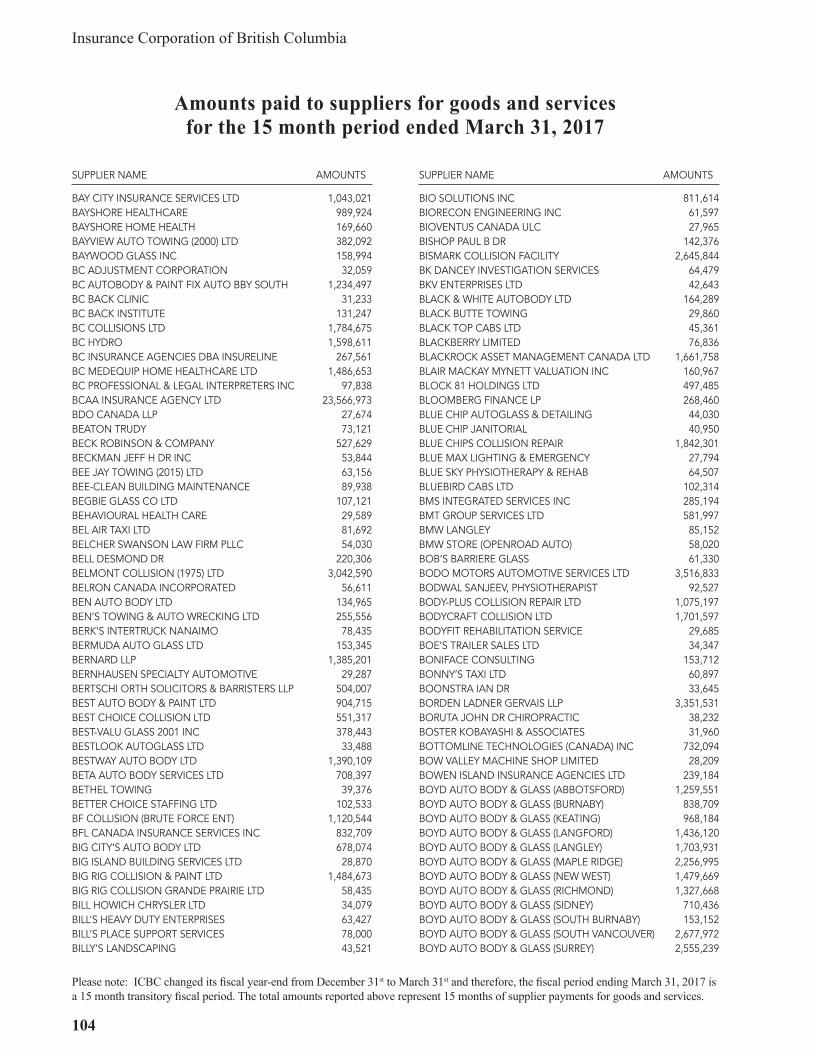
Insurance Corporation of British Columbia
104
Amounts paid to suppliers for goods and services for the 15 month period ended March 31, 2017
SUPPLIER NAME AMOUNTS
BAY CITY INSURANCE SERVICES LTD 1,043,021BAYSHORE HEALTHCARE 989,924BAYSHORE HOME HEALTH 169,660BAYVIEW AUTO TOWING (2000) LTD 382,092BAYWOOD GLASS INC 158,994BC ADJUSTMENT CORPORATION 32,059BC AUTOBODY & PAINT FIX AUTO BBY SOUTH 1,234,497BC BACK CLINIC 31,233BC BACK INSTITUTE 131,247BC COLLISIONS LTD 1,784,675BC HYDRO 1,598,611BC INSURANCE AGENCIES DBA INSURELINE 267,561BC MEDEQUIP HOME HEALTHCARE LTD 1,486,653BC PROFESSIONAL & LEGAL INTERPRETERS INC 97,838BCAA INSURANCE AGENCY LTD 23,566,973BDO CANADA LLP 27,674BEATON TRUDY 73,121BECK ROBINSON & COMPANY 527,629BECKMAN JEFF H DR INC 53,844BEE JAY TOWING (2015) LTD 63,156BEE-CLEAN BUILDING MAINTENANCE 89,938BEGBIE GLASS CO LTD 107,121BEHAVIOURAL HEALTH CARE 29,589BEL AIR TAXI LTD 81,692BELCHER SWANSON LAW FIRM PLLC 54,030BELL DESMOND DR 220,306BELMONT COLLISION (1975) LTD 3,042,590BELRON CANADA INCORPORATED 56,611BEN AUTO BODY LTD 134,965BEN’S TOWING & AUTO WRECKING LTD 255,556BERK’S INTERTRUCK NANAIMO 78,435BERMUDA AUTO GLASS LTD 153,345BERNARD LLP 1,385,201BERNHAUSEN SPECIALTY AUTOMOTIVE 29,287BERTSCHI ORTH SOLICITORS & BARRISTERS LLP 504,007BEST AUTO BODY & PAINT LTD 904,715BEST CHOICE COLLISION LTD 551,317BEST-VALU GLASS 2001 INC 378,443BESTLOOK AUTOGLASS LTD 33,488BESTWAY AUTO BODY LTD 1,390,109BETA AUTO BODY SERVICES LTD 708,397BETHEL TOWING 39,376BETTER CHOICE STAFFING LTD 102,533BF COLLISION (BRUTE FORCE ENT) 1,120,544BFL CANADA INSURANCE SERVICES INC 832,709BIG CITY’S AUTO BODY LTD 678,074BIG ISLAND BUILDING SERVICES LTD 28,870BIG RIG COLLISION & PAINT LTD 1,484,673BIG RIG COLLISION GRANDE PRAIRIE LTD 58,435BILL HOWICH CHRYSLER LTD 34,079BILL’S HEAVY DUTY ENTERPRISES 63,427BILL’S PLACE SUPPORT SERVICES 78,000BILLY’S LANDSCAPING 43,521
SUPPLIER NAME AMOUNTS
BIO SOLUTIONS INC 811,614BIORECON ENGINEERING INC 61,597BIOVENTUS CANADA ULC 27,965BISHOP PAUL B DR 142,376BISMARK COLLISION FACILITY 2,645,844BK DANCEY INVESTIGATION SERVICES 64,479BKV ENTERPRISES LTD 42,643BLACK & WHITE AUTOBODY LTD 164,289BLACK BUTTE TOWING 29,860BLACK TOP CABS LTD 45,361BLACKBERRY LIMITED 76,836BLACKROCK ASSET MANAGEMENT CANADA LTD 1,661,758BLAIR MACKAY MYNETT VALUATION INC 160,967BLOCK 81 HOLDINGS LTD 497,485BLOOMBERG FINANCE LP 268,460BLUE CHIP AUTOGLASS & DETAILING 44,030BLUE CHIP JANITORIAL 40,950BLUE CHIPS COLLISION REPAIR 1,842,301BLUE MAX LIGHTING & EMERGENCY 27,794BLUE SKY PHYSIOTHERAPY & REHAB 64,507BLUEBIRD CABS LTD 102,314BMS INTEGRATED SERVICES INC 285,194BMT GROUP SERVICES LTD 581,997BMW LANGLEY 85,152BMW STORE (OPENROAD AUTO) 58,020BOB’S BARRIERE GLASS 61,330BODO MOTORS AUTOMOTIVE SERVICES LTD 3,516,833BODWAL SANJEEV, PHYSIOTHERAPIST 92,527BODY-PLUS COLLISION REPAIR LTD 1,075,197BODYCRAFT COLLISION LTD 1,701,597BODYFIT REHABILITATION SERVICE 29,685BOE’S TRAILER SALES LTD 34,347BONIFACE CONSULTING 153,712BONNY’S TAXI LTD 60,897BOONSTRA IAN DR 33,645BORDEN LADNER GERVAIS LLP 3,351,531BORUTA JOHN DR CHIROPRACTIC 38,232BOSTER KOBAYASHI & ASSOCIATES 31,960BOTTOMLINE TECHNOLOGIES (CANADA) INC 732,094BOW VALLEY MACHINE SHOP LIMITED 28,209BOWEN ISLAND INSURANCE AGENCIES LTD 239,184BOYD AUTO BODY & GLASS (ABBOTSFORD) 1,259,551BOYD AUTO BODY & GLASS (BURNABY) 838,709BOYD AUTO BODY & GLASS (KEATING) 968,184BOYD AUTO BODY & GLASS (LANGFORD) 1,436,120BOYD AUTO BODY & GLASS (LANGLEY) 1,703,931BOYD AUTO BODY & GLASS (MAPLE RIDGE) 2,256,995BOYD AUTO BODY & GLASS (NEW WEST) 1,479,669BOYD AUTO BODY & GLASS (RICHMOND) 1,327,668BOYD AUTO BODY & GLASS (SIDNEY) 710,436BOYD AUTO BODY & GLASS (SOUTH BURNABY) 153,152BOYD AUTO BODY & GLASS (SOUTH VANCOUVER) 2,677,972BOYD AUTO BODY & GLASS (SURREY) 2,555,239
Please note: ICBC changed its fiscal year-end from December 31st to March 31st and therefore, the fiscal period ending March 31, 2017 is a 15 month transitory fiscal period. The total amounts reported above represent 15 months of supplier payments for goods and services.

Statements and Schedules of Financial Information 2016/17
105
Amounts paid to suppliers for goods and services for the 15 month period ended March 31, 2017
SUPPLIER NAME AMOUNTS
BOYD AUTO BODY & GLASS (VICTORIA) 1,819,889BOYLE MARC R DR INC 524,055BOYLEY AUTO BODY 123,758BRAINHUNTER SYSTEMS LTD 81,735BRANDALLIANCE INC DBA WILSON INT’L 49,921BRANDT TRACTOR LTD 44,546BRC GROUP 341,171BREEZE REHABILITATION CONSULTING 49,186BRIAN GIBBARD LAW CORP 125,818BRIAN JESSEL BMW PRE-OWNED 28,381BRIAN JESSEL BMW/SUBARU 181,248BRIAN RICE’S COURTENAY TOYOTA 36,141BRIAN’S GLASS 230,643BRIDGE LAKE TOWING 109,366BRIDGEPORT COLLISION LTD 863,696BRITANNIA AGENCIES (1986) LTD 378,543BROADRIDGE OS 168,363BROCO AUTO GLASS (ABBOTSFORD) 165,267BROCO AUTO GLASS (COQUITLAM) 460,310BROCO AUTO GLASS (KAMLOOPS) 232,381BROCO AUTO GLASS (KELOWNA) 82,209BROCO AUTO GLASS (NEWTON) 421,869BROCO AUTO GLASS (PORT KELLS) 135,450BROCO AUTO GLASS (VANCOUVER-KINGSWAY) 476,644BROCO AUTO GLASS (VICTORIA) 318,896BROCO AUTO GLASS & UPHOLSTERY (BURNABY) 507,328BROCO AUTO GLASS & UPHOLSTERY (LANGLEY) 797,625BROCO AUTO GLASS & UPHOLSTERY (MPL RIDGE) 427,957BROCO AUTO GLASS & UPHOLSTERY (NANAIMO) 520,940BROCO AUTO GLASS & UPHOLSTERY (NORTH VAN) 572,734BROCO AUTO GLASS & UPHOLSTERY (RICHMOND) 882,568BROCO AUTO GLASS & UPHOLSTERY (SW MARINE) 878,660BROCO GLASS (LANGLEY) 163,131BROCO GLASS (SURREY) 464,504BRODEX INDUSTRIES LTD 33,018BROMLEY DANA J DR INC 25,870BROOKFIELD (BOPC) INC 57,050BROOKS KEVIN 27,300BROOKSIDE AUTOBODY 28,599BROTHERS AUTOBODY REFINISHERS LTD 1,568,889BROWN BROS FORD SALES 51,197BROWN MECHANICAL SERVICES LTD 34,407BROWN ROBIN B - P ENGINEERING 39,457BROWNRIDGE & COMPANY INSURANCE SERVICES 737,941BROWNS’ CHEVROLET BUICK GMC LTD 33,783BRUNETTE INSURANCE AGENCIES LTD 692,460BRYAN & COMPANY LLP 36,306BRYAN’S AUTO BODY (SQUAMISH) LTD 519,442BUCKNELL JASON DR 38,467BUDGET GLASS LTD 265,600BUDGET RENT-A-CAR OF VICTORIA LTD 78,321BULKLEY VALLEY INSURANCE SERVICES LTD 1,059,172BULLET AUTO GLASS LTD 162,172
SUPPLIER NAME AMOUNTS
BUNTAIN INS AGENCIES DBA SOUTHLANDS 291,571BUNTAIN INSURANCE AGENCIES LTD 1,872,372BURNABY AUTO BODY (1986) LTD 63,497BURNABY KAWASAKI RETAIL LTD 33,823BURNABY PHYSIO & WELLNESS 33,244BURNS FITZPATRICK ROGERS SCHWARTZ 814,113BURNS PETER T, QC 67,863BURRARD AUTO METAL LTD 29,831BURRARD AUTOSTRASSE COLLISION LTD 5,933,185BUSY B GLASS 70,168BUZZ’S AUTOBODY LTD 4,092,515BZDEL DAVID DR 29,335C & C INSURANCE AGENCIES (RICHMOND) LTD 528,951C & C INSURANCE AGENCIES LTD 902,614C & J REBEL ENTERPRISES LTD 58,297C & K COLLISION (CHANG KWONG AUTO BODY) 386,539C & R TRUCK WEST LTD 2,077,581C & S MOTORCYCLES LTD 27,094C A TOWING 32,729C G COYLE & ASSOCIATES INC 1,040,382C P AUTOBODY LTD 73,692C R COASTLINE TOWING & TRANSPORT LTD 56,684C R NO 1 AUTO BODY LTD 1,867,291C&D INSURANCE SERVICES LTD 323,458C-ME PEDESTRIAN REFLECTORS 127,277CACTUS COLLISION & PAINT INC 1,684,126CALEA LTD 260,852CALGARY HEAVY TRUCK & COLLISION 209,652CALLA STRATEGIES 31,343CALMONT VOLVO TRUCK CENTRE LETHBRIDGE 26,128CALVERT ERIK DR INC 83,450CAM CLARK FORD LINCOLN LTD 1,483,300CAM CLARK FORD RICHMOND LTD 26,748CAMERON DONALD A DR INC 35,132CAMPBELL & FAIRWEATHER PSYCHOLOGY GROUP 109,115CAMPBELL BURTON AND MCMULLAN 39,061CAMPBELL FROH MAY & RICE LLP 509,454CAMPBELL RIVER GLASS 2009 LTD 115,694CAMPBELL SAUNDERS & COMPANY 51,919CAN AM CRUISERS INC 25,349CANADA CHAIRLINES LTD 105,471CANADA POST CORPORATION 6,983,837CANADA REVENUE AGENCY 29,695CANADIAN CAR AND TRUCK RENTAL 137,874CANADIAN CLAIMS SERVICES INC 47,429CANADIAN COLLISION CORP 48,860CANADIAN COUNCIL OF MOTOR TRANSPORT ADMIN 67,204CANADIAN IN-HOME CARE ASSISTANCE 92,874CANDY AUTOBODY INC 233,251CANIL ROY G DR CHIROPRACTIC 84,145CANNON CLINIC 30,620CANTALK (CANADA) INC 1,400,873CANUCK TOWING & SERVICES LTD 37,126
Please note: ICBC changed its fiscal year-end from December 31st to March 31st and therefore, the fiscal period ending March 31, 2017 is a 15 month transitory fiscal period. The total amounts reported above represent 15 months of supplier payments for goods and services.

Insurance Corporation of British Columbia
106
Amounts paid to suppliers for goods and services for the 15 month period ended March 31, 2017
SUPPLIER NAME AMOUNTS
CAPGEMINI FINANCIAL SERVICES CANADA INC 2,242,546CAPILANO VOLKSWAGEN INC 36,851CAPITAL MOTORS (1985) LTD 31,547CAPITAL WEST INSURANCE AGENCIES INC 313,967CAPITAL WEST INSURANCE SERVICES (SURREY) 313,733CAPITAL WEST INSURANCE SERVICES LTD 1,165,870CAPRI INSURANCE SERVICES LTD 10,458,692CAPSTONE INSURANCE SERVICES LTD 375,530CAPTURE FUNCTION CONSULTING INC 32,388CARBOY AUTO SALES (TOPWIN AUTO CENTRE) 34,794CARE AT HOME SERVICES ADVANCIA SOLUTIONS 274,846CARE CONCERNS LTD 100,228CARE PLUS HOME & HEALTH SERVICES 41,573CAREAGE HOME & HEALTH ENTERPRISES INC 33,055CARFRA & LAWTON 2,878,924CARIBOO CHEVROLET BUICK GMC LTD 46,170CARIBOO COLLISION REPAIRS LTD 286,368CARIBOO FORD LTD 50,278CARIBOO PROPANE 44,244CARLSBAD MEDICAL CENTER 44,980CARRUTHERS & COMPANY 1,670,381CARSON BRENT DR CHIROPRACTIC CORP 28,293CARSON INSURANCE BROKERS LTD 487,156CARSON SCOTT DR CHIROPRACTIC CORP 43,171CARSTAR 360 ABBOTSFORD (360 COLLISION) 1,104,173CARTER AUTOBODY (0977109 BC LTD) 1,323,775CARTER CHEVROLET CADILLAC BUICK GMC BBY 2,694,063CARTER CHEVROLET CADILLAC BUICK GMC NS 1,367,055CARTER MOTOR CARS LTD 47,483CASCADE COLLISION SERVICES INC 53,780CASCADE INSURANCE AGENCIES (BURNABY) INC 824,495CASCADES CONTAINERBOARD PACKAGING 31,417CASEGEN TECHNOLOGIES LTD 120,000CASEY JASON DR 46,508CASEY LAW OFFICES 681,356CASMAN INSURANCE AGENCY & FINANCIAL GRP 881,582CASSADY & COMPANY 2,206,660CASTLEGAR TOYOTA 41,436CATHAY PACIFIC INSURANCE AGENCY LTD 140,801CAVE & COMPANY 2,000,969CAWSTON GLASS 28,296CB’S AUTOTECH COLLISION & AUTOBODY REPAIR 1,079,963CBI HEALTH (REHAB IN MOTION) 59,113CBI HEALTH CENTRE 62,415CBI HEALTH CENTRE (BURNABY) 132,957CBI HEALTH CENTRE (CHILLIWACK) 169,552CBI HEALTH CENTRE (COQUITLAM) 258,862CBI HEALTH CENTRE (CRANBROOK) 167,527CBI HEALTH CENTRE (DUNCAN) 120,232CBI HEALTH CENTRE (KELOWNA) 240,642CBI HEALTH CENTRE (LANGFORD) 105,057CBI HEALTH CENTRE (NANAIMO AQUATICS) 104,386CBI HEALTH CENTRE (NEW WESTMINSTER) 30,050
SUPPLIER NAME AMOUNTS
CBI HEALTH CENTRE (SUMMIT NANAIMO) 67,094CBI HEALTH GROUP (NANAIMO) 498,173CBI OT SERVICES (VICTORIA) 529,585CBI PHYSIOTHERAPY & REHAB (ABBOTSFORD) 403,642CBI PHYSIOTHERAPY & REHAB (BURNABY) 28,895CBI PHYSIOTHERAPY & REHAB (COQUITLAM) 28,789CBI PHYSIOTHERAPY & REHAB (PRINCE GEORGE) 108,074CBI PHYSIOTHERAPY & REHAB (RICHMOND) 124,419CBI PHYSIOTHERAPY & REHAB (SURREY) 499,164CBI REHABILITATION & HAND THERAPY 189,103CBI SPORT & SPINE HEALTH CENTR 47,035CBI SPORTS INJURY & REHABILITATION CENTRE 323,555CBRE LIMITED 3,771,815CBV COLLECTION SERVICE LTD 357,449CCL LABEL (DIV OF CCL INDUSTRIES LTD) 695,943CCS COMPLETE CAR SERVICES LTD 76,220CEDAR VALLEY PHYSIOTHERAPY 60,812CEFIRO PAPER SUPPLY AND PACKAGING 33,728CELLTEX COLLISION REPAIRS LTD 427,549CENTENNIAL AUTO BODY & GLASS LTD 426,376CENTERFIRE HOLDINGS LTD 51,342CENTERLINE FIX AUTO QUESNEL 1,173,709CENTRAL AGENCIES LTD 912,131CENTRAL CHEVROLET GMC BUICK LTD 764,086CENTRAL CITY INSURANCE SERVICES INC 389,406CENTRAL ISLAND TOWING LTD 46,428CENTRAL PARK PHYSIOTHERAPY & SPORTS 132,223CENTRAL REHABILITATION 50,477CENTRAL VALLEY INSURANCE SERVICES LTD 1,014,120CENTRAL WASHINGTON HOSPITAL 90,158CENTRAL 1 34,163CENTRE MONTEREGIEN DE READAPTATION 39,595CENTURY COLLISION 1,811,301CERIDIAN CANADA LTD 71,470CERNA COLLISION LTD 887,791CERTIFIED PROSTHETICS & ORTHOPEDICS 53,404CF ACTIVE REHABILITATION 92,123CHAHAL SUKHAN 92,844CHAIR STUFF SALES LTD 32,958CHAMBERS OLSON LTD 453,404CHAMPION CHEVROLET LTD 578,631CHAMPION TOWING LTD 201,449CHANGEWAYS CLINIC 34,685CHANOR TRUCK & AUTO REPAIRS LTD 65,826CHAP’S AUTO BODY LTD 1,564,020CHAREST REPORTING INC 250,774CHARLESWORTH INSURANCE SERVICES LTD 1,032,038CHARLIE’S AUTO BODY 1,331,643CHARLTON HEATHER 43,990CHARLTON INSURANCE AGENCIES LTD 322,462CHAS & ASSOCIATES CONSULTING INC 225,348CHASE AUTO & WINDOW GLASS LTD 55,392CHASE AUTO AND WINDOW GLASS 94,757
Please note: ICBC changed its fiscal year-end from December 31st to March 31st and therefore, the fiscal period ending March 31, 2017 is a 15 month transitory fiscal period. The total amounts reported above represent 15 months of supplier payments for goods and services.
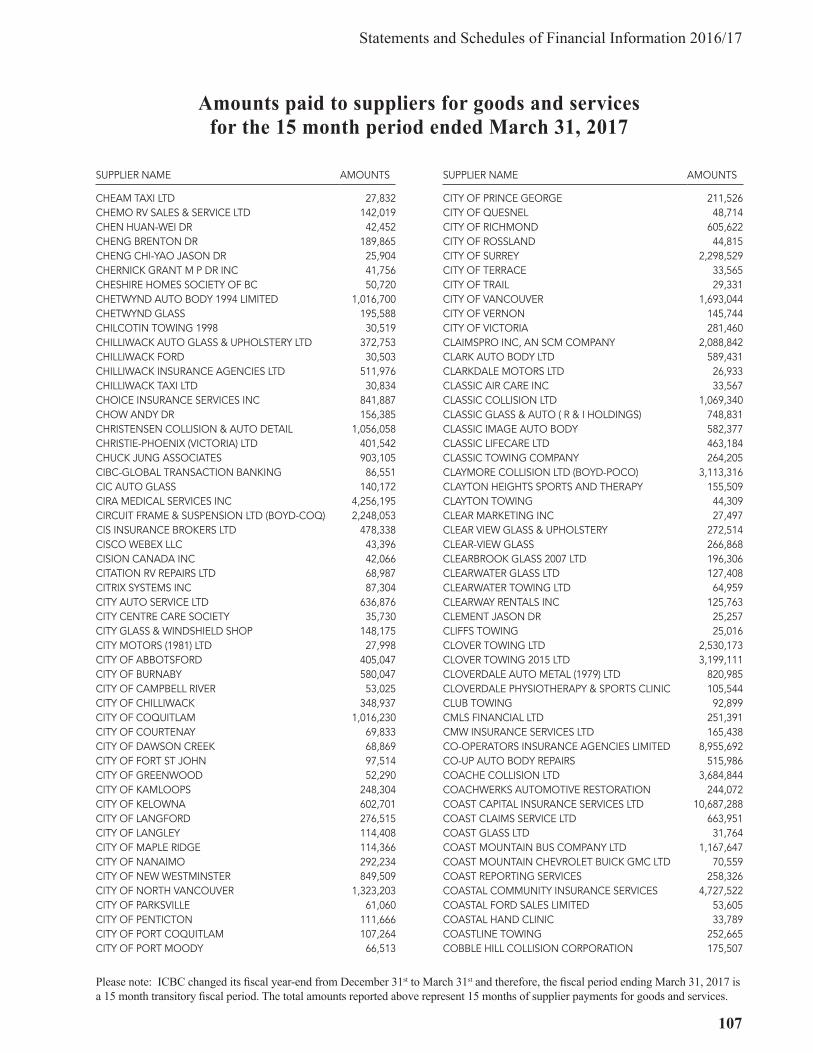
Statements and Schedules of Financial Information 2016/17
107
Amounts paid to suppliers for goods and services for the 15 month period ended March 31, 2017
SUPPLIER NAME AMOUNTS
CHEAM TAXI LTD 27,832CHEMO RV SALES & SERVICE LTD 142,019CHEN HUAN-WEI DR 42,452CHENG BRENTON DR 189,865CHENG CHI-YAO JASON DR 25,904CHERNICK GRANT M P DR INC 41,756CHESHIRE HOMES SOCIETY OF BC 50,720CHETWYND AUTO BODY 1994 LIMITED 1,016,700CHETWYND GLASS 195,588CHILCOTIN TOWING 1998 30,519CHILLIWACK AUTO GLASS & UPHOLSTERY LTD 372,753CHILLIWACK FORD 30,503CHILLIWACK INSURANCE AGENCIES LTD 511,976CHILLIWACK TAXI LTD 30,834CHOICE INSURANCE SERVICES INC 841,887CHOW ANDY DR 156,385CHRISTENSEN COLLISION & AUTO DETAIL 1,056,058CHRISTIE-PHOENIX (VICTORIA) LTD 401,542CHUCK JUNG ASSOCIATES 903,105CIBC-GLOBAL TRANSACTION BANKING 86,551CIC AUTO GLASS 140,172CIRA MEDICAL SERVICES INC 4,256,195CIRCUIT FRAME & SUSPENSION LTD (BOYD-COQ) 2,248,053CIS INSURANCE BROKERS LTD 478,338CISCO WEBEX LLC 43,396CISION CANADA INC 42,066CITATION RV REPAIRS LTD 68,987CITRIX SYSTEMS INC 87,304CITY AUTO SERVICE LTD 636,876CITY CENTRE CARE SOCIETY 35,730CITY GLASS & WINDSHIELD SHOP 148,175CITY MOTORS (1981) LTD 27,998CITY OF ABBOTSFORD 405,047CITY OF BURNABY 580,047CITY OF CAMPBELL RIVER 53,025CITY OF CHILLIWACK 348,937CITY OF COQUITLAM 1,016,230CITY OF COURTENAY 69,833CITY OF DAWSON CREEK 68,869CITY OF FORT ST JOHN 97,514CITY OF GREENWOOD 52,290CITY OF KAMLOOPS 248,304CITY OF KELOWNA 602,701CITY OF LANGFORD 276,515CITY OF LANGLEY 114,408CITY OF MAPLE RIDGE 114,366CITY OF NANAIMO 292,234CITY OF NEW WESTMINSTER 849,509CITY OF NORTH VANCOUVER 1,323,203CITY OF PARKSVILLE 61,060CITY OF PENTICTON 111,666CITY OF PORT COQUITLAM 107,264CITY OF PORT MOODY 66,513
SUPPLIER NAME AMOUNTS
CITY OF PRINCE GEORGE 211,526CITY OF QUESNEL 48,714CITY OF RICHMOND 605,622CITY OF ROSSLAND 44,815CITY OF SURREY 2,298,529CITY OF TERRACE 33,565CITY OF TRAIL 29,331CITY OF VANCOUVER 1,693,044CITY OF VERNON 145,744CITY OF VICTORIA 281,460CLAIMSPRO INC, AN SCM COMPANY 2,088,842CLARK AUTO BODY LTD 589,431CLARKDALE MOTORS LTD 26,933CLASSIC AIR CARE INC 33,567CLASSIC COLLISION LTD 1,069,340CLASSIC GLASS & AUTO ( R & I HOLDINGS) 748,831CLASSIC IMAGE AUTO BODY 582,377CLASSIC LIFECARE LTD 463,184CLASSIC TOWING COMPANY 264,205CLAYMORE COLLISION LTD (BOYD-POCO) 3,113,316CLAYTON HEIGHTS SPORTS AND THERAPY 155,509CLAYTON TOWING 44,309CLEAR MARKETING INC 27,497CLEAR VIEW GLASS & UPHOLSTERY 272,514CLEAR-VIEW GLASS 266,868CLEARBROOK GLASS 2007 LTD 196,306CLEARWATER GLASS LTD 127,408CLEARWATER TOWING LTD 64,959CLEARWAY RENTALS INC 125,763CLEMENT JASON DR 25,257CLIFFS TOWING 25,016CLOVER TOWING LTD 2,530,173CLOVER TOWING 2015 LTD 3,199,111CLOVERDALE AUTO METAL (1979) LTD 820,985CLOVERDALE PHYSIOTHERAPY & SPORTS CLINIC 105,544CLUB TOWING 92,899CMLS FINANCIAL LTD 251,391CMW INSURANCE SERVICES LTD 165,438CO-OPERATORS INSURANCE AGENCIES LIMITED 8,955,692CO-UP AUTO BODY REPAIRS 515,986COACHE COLLISION LTD 3,684,844COACHWERKS AUTOMOTIVE RESTORATION 244,072COAST CAPITAL INSURANCE SERVICES LTD 10,687,288COAST CLAIMS SERVICE LTD 663,951COAST GLASS LTD 31,764COAST MOUNTAIN BUS COMPANY LTD 1,167,647COAST MOUNTAIN CHEVROLET BUICK GMC LTD 70,559COAST REPORTING SERVICES 258,326COASTAL COMMUNITY INSURANCE SERVICES 4,727,522COASTAL FORD SALES LIMITED 53,605COASTAL HAND CLINIC 33,789COASTLINE TOWING 252,665COBBLE HILL COLLISION CORPORATION 175,507
Please note: ICBC changed its fiscal year-end from December 31st to March 31st and therefore, the fiscal period ending March 31, 2017 is a 15 month transitory fiscal period. The total amounts reported above represent 15 months of supplier payments for goods and services.

Insurance Corporation of British Columbia
108
Amounts paid to suppliers for goods and services for the 15 month period ended March 31, 2017
SUPPLIER NAME AMOUNTS
COBBLEHILL TAXI 26,248COBRA HEAVY IRON LTD 37,033COLD COUNTRY TOWING & TRAFFIC CONTROL 46,151COLEMAN DOUGLAS DR 66,473COLLIERS INTERNATIONAL / MANUFACTURERS 139,044COLLIERS INTERNATIONAL REALTY ADVISORS 54,485COLLIERS MACAULAY NICOLLS INC 216,261COLLINGWOOD INSURANCE CENTRE INC 551,579COLLINGWOOD INSURANCE CENTRE 2014 INC 34,872COLLINGWOOD WELLNESS INC 106,074COLLINS MANUFACTURING COMPANY LTD 184,243COLLISION ANALYSIS LTD 127,354COLLISION CRAFT 427,261COLUMBIA COLLISION REPAIRS LTD 2,774,320COLUMBIA GLASS (1972) LTD 177,610COLUMBIA PACIFIC CONSULTING GROUP INC 1,052,168COLUMBIA SPEECH AND LANGUAGE SERVICES INC 358,231COLUMBIA TOWING LTD 178,118COLUMBIA TRUCK CENTERS 59,603COMFORT KEEPERS (NORTH VANCOUVER) 26,595COMFORT KEEPERS (VANCOUVER) 29,247COMFORT KEEPERS (VICTORIA) 48,353COMFORT KEEPERS (WHITE ROCK) 575,162COMMERCIAL LIGHTING PRODUCTS 72,274COMMERCIAL TRUCK EQUIPMENT CO 36,078COMMIT AUTOBODY & REPAIR (2012) LTD 614,349COMMUNITY THERAPISTS (1998) INC 3,188,861COMOX VALLEY DODGE CHRYSLER JEEP LTD 719,916COMOX VALLEY TOWING & RECOVERY LTD 46,009COMPLETE REHAB SOLUTIONS INC 47,142COMPUGEN INC 351,957CONCERT REALTY SERVICES LTD 713,429CONFERENCE BOARD OF CANADA 28,331CONNELL DOUG G DR 220,923CONNOR CLARK & LUNN INVESTMENTS MGMT LTD 1,908,024CONSOLIDATED CIVIL ENFORCEMENT BC INC 227,682CONTENT STRATEGY INCORPORATED 33,999COOKSON INTERNATIONAL TRUCKS INC 46,425COOKSON MOTORS LTD 87,858COOPER’S USED AUTO PARTS LTD 32,805COPART AUTO AUCTIONS 949,393COQUITLAM AGENCIES (1982) LTD 478,707COQUITLAM EXPRESS AUTOBODY LTD 1,058,739COQUITLAM TOWING & STORAGE CO 1,042,038CORE AUTOBODY & REPAIR LIMITED 328,686CORE FITNESS AND REHAB INC 59,472CORNERSTONE ADJUSTERS INC 264,433CORPORATE CLASSICS CATERERS 78,743CORPORATE EXECUTIVE BOARD 79,361CORPORATION COMPUWARE DU CANADA 65,716CORPORATION OF DELTA 374,581CORVETTE SPECIALTIES LTD 443,810COSMOS AUTOCARE (COSMIC COLLISION LTD) 1,262,983
SUPPLIER NAME AMOUNTS
COTTONWOOD AUTO BODY LTD 1,694,712COTTONWOOD AUTO GLASS INC 92,963COTTONWOOD RV SALES & SERVICE LTD 175,829COUNTRY RV (FRASERWAY RV LTD) 38,950COURTENAY COLLISION SERVICES LTD 710,550COVERALL CLEANING CONCEPTS 28,712COWELL MOTORS LTD 107,227COWICHAN COLLISION LTD 1,515,938COWICHAN TOWING LTD 67,623COYOTE COLLISION LTD 1,209,969COZENS WIENS LLP 672,625CRAFTLINE COLLISION 64,134CRAFTSMAN COLLISION ABBOTSFORD CENTRE 2,412,407CRAFTSMAN COLLISION ABBOTSFORD WEST 1,507,344CRAFTSMAN COLLISION BOUNDARY & 1ST 2,281,757CRAFTSMAN COLLISION BRIDGE ST VICTORIA 2,615,892CRAFTSMAN COLLISION CAMBIE & MARINE 3,311,634CRAFTSMAN COLLISION CHILLIWACK 2,972,370CRAFTSMAN COLLISION COLWOOD 3,405,266CRAFTSMAN COLLISION COQUITLAM 2,613,393CRAFTSMAN COLLISION ESQUIMALT 1,433,962CRAFTSMAN COLLISION GT DUNCAN 3,985,352CRAFTSMAN COLLISION KAMLOOPS 1,679,732CRAFTSMAN COLLISION KELOWNA CENTRAL 2,573,452CRAFTSMAN COLLISION LANDMARK WAY 1,798,111CRAFTSMAN COLLISION LANGLEY 3,742,558CRAFTSMAN COLLISION MAIN & 3RD VANC 3,871,039CRAFTSMAN COLLISION MAPLE RIDGE 4,051,409CRAFTSMAN COLLISION METROTOWN 3,717,744CRAFTSMAN COLLISION NEWTON 2,691,637CRAFTSMAN COLLISION NORTH NANAIMO 2,353,120CRAFTSMAN COLLISION NORTH VAN EAST 2,903,549CRAFTSMAN COLLISION NORTH VAN WEST 3,525,103CRAFTSMAN COLLISION PORT COQUITLAM 2,913,386CRAFTSMAN COLLISION PORT MOODY 2,199,989CRAFTSMAN COLLISION POWELL EAST VANC 2,588,949CRAFTSMAN COLLISION RICHMOND 3,609,351CRAFTSMAN COLLISION RUTLAND 690,545CRAFTSMAN COLLISION SURREY SCOTT RD 3,628,881CRAFTSMAN COLLISION VERNON 2,234,314CRAFTSMAN COLLISION WALNUT GROVE 4,121,103CRAFTSMAN COLLISION WEST KELOWNA 1,502,924CRAFTSMAN COLLISION WHITE ROCK/S SURREY 4,198,183CRAFTSMAN COLLISION 6TH & YUKON 5,778,955CRANBROOK GLASS 141,106CRANBROOK PHARMACY LTD 76,184CRASHPAD COLLISION SERVICES LTD 438,897CRAWFORD & COMPANY (CANADA) INC 333,645CREATIVE MOBILITY PRODUCTS INC 254,766CREATIVE THERAPY CONSULTANTS 859,834CREEKSIDE PHYSIOTHERAPY CLINIC 27,427CRESTON CLASSIC GLASS & TRIM 57,605CRESTON TRUCK SERVICE LTD 60,488
Please note: ICBC changed its fiscal year-end from December 31st to March 31st and therefore, the fiscal period ending March 31, 2017 is a 15 month transitory fiscal period. The total amounts reported above represent 15 months of supplier payments for goods and services.

Statements and Schedules of Financial Information 2016/17
109
Amounts paid to suppliers for goods and services for the 15 month period ended March 31, 2017
SUPPLIER NAME AMOUNTS
CRESTON VALLEY ADAPTATIONS 59,823CRESTON VALLEY INSURANCE SERVICES LTD 984,854CRIDGE CENTRE FOR THE FAMILY (THE) 27,806CROSSMAN MARK W DR INC 252,590CROWN GLASS LTD 429,873CROWN PACIFIC COLLISION AND SALES LTD 27,235CRYSTAL CHIROPRACTIC CLINIC INC 26,911CRYSTAL GLASS CANADA LTD (BBY-WINSTON) 116,243CRYSTAL GLASS CANADA LTD (BBY-6TH ST) 215,154CRYSTAL GLASS CANADA LTD (CRANBROOK) 134,910CRYSTAL GLASS CANADA LTD (FERNIE) 121,734CRYSTAL GLASS CANADA LTD (KAMLOOPS) 407,557CRYSTAL GLASS CANADA LTD (KELOWNA) 162,727CRYSTAL GLASS CANADA LTD (LANGLEY) 381,700CRYSTAL GLASS CANADA LTD (MAPLE RIDGE) 233,721CRYSTAL GLASS CANADA LTD (PRINCE GEORGE) 457,388CRYSTAL GLASS CANADA LTD (QUESNEL) 253,431CRYSTAL GLASS CANADA LTD (RICHMOND) 151,668CRYSTAL GLASS CANADA LTD (SALMON ARM) 150,768CRYSTAL GLASS CANADA LTD (VERNON) 195,718CRYSTAL GLASS CANADA LTD (WEST KELOWNA) 295,896CSA INVESTIGATIONS 80,892CSDC SYSTEMS INC 34,106CTC RESOURCES LTD 61,222CUMBERBIRCH INSURANCE AGENCY LTD 83,428CUNDARI SEIBEL LLP 3,369,372CUNNINGHAM LINDSEY CANADA LIMITED 280,953CUSHMAN & WAKEFIELD LTD 43,150CUSTER REGIONAL HOSPITAL 28,739CUSTOM PROSTHETIC SERVICES LTD 25,284CUT THUMB GLASS LTD 100,529CUTBANKS AUTOBODY & GLASS LTD 1,321,248CYGNUS DESIGN GROUP INC 61,433D & B CUSTOM PAINTING LTD 114,596D & D TRANSPORT REFRIGERATION SERVICE 56,405D & K BODY SHOP CO LTD 296,635D J’S PAINT & BODY (1987) LTD 1,140,200D’ARCY’S GLASS (2010) LTD 465,654DALE BAZZANA AUTO BODY 111,370DALE CHARLES & ASSOCIATES 37,176DALES ALIGNMENT & BRAKE 72,468DAMON’S DUNN RIGHT TOWING & RECOVERY 82,019DAMS FORD LINCOLN SALES LTD (FRASER HWY) 2,546,803DAMS FORD LINCOLN SALES LTD (LANGLEY BYP) 121,281DAN THE MAN’S AUTOBODY REPAIR LTD 1,414,309DAN’S KAMLOOPS COLLISION CENTRE LTD 3,095,422DATA COMMUNICATIONS MANAGEMENT CORP 1,708,785DATA REPRO COM LTD 67,475DAVE DALE INSURANCE AGENCIES LTD 766,506DAVEY TREE EXPERT CO 29,962DAVID EYTAN ABRAHAM DR 515,237DAVID MORSE & ASSOCIATES 56,458DAVIE & ASSOCIATES 847,135
SUPPLIER NAME AMOUNTS
DAWSON CREEK COLLISION (PACE) 1,878,594DAWSON TRUCK REPAIRS LTD 54,995DAY & NITE TOWING & AUTOWRECKING 90,194DCT CHAMBERS TRUCKING LTD 115,064DE BEER HETTIE, OT 32,290DEAN NEUMANN PLC 823,790DEARBORN MOTORS LTD 179,699DECO PLUS PAINTING AND CONTRACTING LTD 52,414DEL ORO TOWING LTD 536,859DELOITTE LLP 2,790,366DELOITTE MANAGEMENT SERVICES LLP 1,017,378DELTA SUNSHINE TAXI (1972) LTD 44,676DELTA TRUCK & TRAILER REPAIR LTD 55,110DEN’S LADYSMITH COLLISION CENTRE INC 365,316DESIGN ROOFING & SHEET METAL LTD 71,154DESTINATION TOYOTA BURNABY 3,935,494DEUTSCHER T DR INC 34,901DEVENNEY SPENCER DR 31,262DEVON TRANSPORT LTD (BUDGET RENT-A-CAR) 5,826,978DHALIWAL GURSARNJIT DR 45,575DHALIWAL JAGDEEP DR 222,910DIAMOND AUTO & WINDOW GLASS 203,635DIAMOND AUTO GLASS LTD 396,220DICKSON BRAD DR CHIROPRACTIC CORP 25,700DIG INVESTIGATIONS & SECURITY LTD 1,322,012DINNING HUNTER JACKSON LAW 99,695DIONNE GLASS 115,543DIRECT IME CORP 357,790DIRECT LINE COMMERCIAL PROPERTY 75,185DIRECT TOWING 42,530DISCOUNT CAR AND TRUCK RENTALS 328,542DISCOVERY CLAIMS SERVICES LTD 545,573DISCOVERY INSURANCE SERVICES LTD 551,569DISTRICT OF CLEARWATER 245,640DISTRICT OF HUDSON’S HOPE 172,433DISTRICT OF LAKE COUNTRY 34,440DISTRICT OF MAPLE RIDGE 75,940DISTRICT OF MISSION 162,702DISTRICT OF NEW HAZELTON 446,806DISTRICT OF NORTH COWICHAN 62,182DISTRICT OF NORTH VANCOUVER 207,265DISTRICT OF SAANICH 215,273DISTRICT OF SOOKE 31,800DISTRICT OF SQUAMISH 100,793DISTRICT OF TAYLOR 41,400DISTRICT OF WEST VANCOUVER 50,317DITA EXCHANGE INC 44,731DIVERSECITY COMMUNITY RESOURCE SOCIETY 50,928DL ADJUSTERS LTD 519,452DNR TOWING INC 151,466DO-4-U AUTOBODY & PAINT 26,682DOBIE INSURANCE SERVICES LTD 682,647DOBSON’S GLASS LTD 589,550
Please note: ICBC changed its fiscal year-end from December 31st to March 31st and therefore, the fiscal period ending March 31, 2017 is a 15 month transitory fiscal period. The total amounts reported above represent 15 months of supplier payments for goods and services.

Insurance Corporation of British Columbia
110
Amounts paid to suppliers for goods and services for the 15 month period ended March 31, 2017
SUPPLIER NAME AMOUNTS
DOC’S AUTO BODY (2012) LTD 1,480,544DOLO INVESTIGATIONS LTD 25,306DOMENICO MEDIATION & ADJUSTMENT SERVICES 187,787DOMMISSE I G DR INC 43,751DON BECK COLLISION LTD 3,525,691DON DOCKSTEADER MOTORS LTD 27,385DON FOLK AUTO BODY (DFC AUTO LTD) 1,495,490DON UNRAU & ASSOCIATES CLAIM SERVICES 141,598DON WOTHERSPOON & ASSOCIATES (FLEETWOOD) 697,761DON WOTHERSPOON & ASSOCIATES (POCO) LTD 434,283DON WOTHERSPOON & ASSOCIATES LTD 201,102DON’S AUTO BODY & PAINT SHOP LTD 1,113,092DON’S AUTO TOWING LTD 970,879DONN DEAN COLLISION LTD 1,439,905DOUG’S PLACE COLLISION REPAIRS 34,350DOUGANS ANDREW DR 32,275DOUGLAS A GRAEB INC 56,805DOUGLAS R SODERLAND LAW OFFICES 598,800DOWNTOWN CENTRE MOTORS LTD 28,554DOWNTOWN SERVICE TOWING LTD 272,487DP VOCATIONAL SOLUTIONS INC 190,967DRAKE TOWING LTD 549,549DREAM OFFICE MANAGEMENT (BC) CORP 609,869DRIVE PRODUCTS INC 26,683DRIVING FORCE INC (THE) 350,941DRIVING MISS DAISY 27,848DRUMMOND LAW CORPORATION 919,505DU & ASSOCIATES PROFESSIONAL PSYCHOLOGY 42,528DUCK CREEK TECHNOLOGIES LLC 97,678DUECK CHEVROLET BUICK CADILLAC GMC LTD 3,046,632DUECK RICHMOND CHEV BUICK CADILLAC GMC 2,290,849DUKE REFRIGERATION & HVAC LTD 857,817DUMORE’S COLLISION LTD 1,217,927DUMOULIN BOSKOVICH LLP 2,368,418DUNCAN AUTO GLASS LTD 31,586DWIGHTS HOMES & GARDENS LTD 31,477DYE & DURHAM COMPANY INC 405,105DYNAMEX CANADA LIMITED 307,515DYNAMIC FACILITY SERVICES LTD 54,953DYNAMIC INVESTIGATIONS INC 46,481DYNAMIC SPECIALTY VEHICLES LTD 25,530DYSCO SERVICES LTD 34,029EAGLE AUTOMOTIVE CENTER (LARRY’S SERVICE) 1,087,651EAGLE RIDGE AQUATIC CENTRE PHYSIOTHERAPY 76,489EAGLE ROCK TOWING 41,724EARL’S TOWING 31,949EAST END AUTO BODY SHOP LTD 824,604EASTGATE AUTOBODY SHOP (1981) LTD 490,148EASTSIDE HEAVY TRUCK COLLISION 123,566EATON INDUSTRIES (CANADA) COMPANY 88,455EAVES MOTOR SALES LTD 338,533ECKLER LTD 144,986ECLIPSYS SOLUTIONS INC 591,134
SUPPLIER NAME AMOUNTS
ECONO GLASS LTD 48,368ECONOMY GLASS SUPPLIER LTD 106,309EDDIE’S TRUCK CENTER 59,959EDELWEISS AUTO REPAIRS LTD 330,042EDMONTON FABRICATION CENTRE LTD 45,010EDMONTON TRAILER SALES & LEASING 141,086EFFECTIVE AUTO BODY REPAIR LTD 1,593,379EFI GLOBAL 49,645EIGEN DEVELOPMENT LTD 361,318EISENKREIN SERVICES LTD 39,052ELAN DATA MAKERS 1,290,952ELDER JAMES DR 27,354ELITE AUTO GLASS INC 76,116ELITE BODY SHOP LTD 2,753,457ELITE XPRESS COLLISION SERVICES 2,111,916ELK VALLEY GLASS LTD 121,322ELLIOTT T G DR INC 158,440ELLIS CREEK AUTOBODY 523,258EMC CORPORATION OF CANADA 3,927,362EMMET CAFFERKY & ASSOCIATES LTD 501,314EMSLAND & ASSOCIATES INSURANCE SERVICES 831,717ENCORE TOWING & SERVICE 49,197ENDERBY AUTO BODY LTD 732,254ENERCONNECT SOLUTIONS 86,897ENNS ARON DR 49,085ENTERPRISE AUTO & RV LTD 111,176ENTERPRISE GLASS LTD 99,132ENTERPRISE RENT-A-CAR CANADA LTD 3,098,201ENVOY BAILIFFS & COLLECTION SERVICES LTD 219,587ERGO REHABILITATION INC 121,629ERIKS RESTORATIONS INC 44,686ERJAVEC ANDREW DR 27,779ERNST & YOUNG LLP 36,268,808ES AUTO SALES LTD 772,819ESIT ADVANCED SOLUTIONS INC 806,830ESSENTIAL AUTO COLLISION LTD 336,859ESSENTIAL KINETICS 44,570ESSEX COLLISION SERVICES LTD 1,827,257ESSEX INSURANCE AGENCY (1ST AVE) INC 556,757EURO-CAN BUILDING SERVICES LTD 68,682EUROSPEC AUTOBODY (2001) LTD 467,067EVERGREEN NURSING SERVICES LTD 488,051EX PHYSIOLOGY INC 49,835EXCEL AUTOBODY LTD 828,405EXCEL PHYSIOTHERAPY 59,378EXCEPTIONAL TOWING & RECOVERY 127,722EXCLUSIVE AUTO GLASS LTD 41,779EXECUTIVE AIR AMBULANCE LTD 71,813EXPERT COLLISION (2002) LTD 842,265EXPERT GARAGE LTD 175,661EXPRESS LANE AUTOBODY LTD 831,564EXTREME AUTOBODY LTD 1,339,401EXTREME RV 33,870
Please note: ICBC changed its fiscal year-end from December 31st to March 31st and therefore, the fiscal period ending March 31, 2017 is a 15 month transitory fiscal period. The total amounts reported above represent 15 months of supplier payments for goods and services.

Statements and Schedules of Financial Information 2016/17
111
Amounts paid to suppliers for goods and services for the 15 month period ended March 31, 2017
SUPPLIER NAME AMOUNTS
EYFORD MACAULAY SHAW & PADMANABHAN LLP 5,892,932F & W TOWING LTD 30,996F ADAMS & ASSOCIATES INSURANCE SERVICES 1,282,784FABRIS MCIVER HORNQUIST & RADCLIFFE 956,831FACTORY FINISH AUTO GLASS LTD 46,689FAIRLANE COLLISION REPAIRS LTD 2,094,997FALCON EQUIPMENT LTD 111,349FALSE CREEK COLLISION 1,573,135FALSE CREEK HEALTHCARE CENTRE 27,185FAMILY GLASS LTD 658,791FARBROOK AUTO WRECKING (1979) LTD 41,614FARGO FREIGHTLINER 64,902FARRIS VAUGHAN WILLS AND MURPHY 38,162FASKEN MARTINEAU DUMOULIN LLP 969,449FAST FRIENDLY RELIABLE GLASS 277,478FAST TRACK INVESTIGATIONS LTD 622,505FASTPLOW CONSTRUCTION INC 121,526FASTRACK AUTOBODY LTD 2,559,388FASTRACK GLASS LTD 104,422FAWCETT INSURANCE AGENCY LTD 531,298FCV TECHNOLOGIES LTD 429,623FEDERAL EXPRESS CANADA LTD 32,121FEDERATION OF BC YOUTH IN CARE NETWORKS 52,500FENDER’S AUTO BODY & PAINT LTD 2,842,486FENN’S TOWING & REPAIR LLC 27,070FENNELL’S RV REPAIR LTD 28,829FERNY’S AUTO BODY SHOP LTD 1,478,908FERRARAI MASERATI OF VANCOUVER 96,411FERREIRA COLLISION CENTRES LTD 1,330,922FH&P LAWYERS LLP 193,593FHC REACTIVE INJURY MANAGEMENT LTD 1,069,833FHL CLINICS 34,003FIJI ISLAND AUTO REPAIRS LTD 843,717FINNING (CANADA) 86,711FIRESIDE CONTRACTING 29,022FIRST CANADIAN LOGISTICS LTD 32,901FIRST CHOICE TOWING (2007) LTD 270,139FIRST CLASS AUTO BODY LTD 1,259,735FIRST INSURANCE AGENCIES LTD 890,570FIRST RESPONSE GLASS LTD 420,492FIRST TRUCK CENTRE (EDMONTON) 70,258FIRST TRUCK CENTRE VANCOUVER INC 4,520,153FIRST TRUCK COLLISION CENTRE LTD 1,505,561FIRST WEST INS SERVICES DBA ENVISION INS 3,885,558FIRST WEST INS SERVICES DBA ISLAND SAVING 3,148,473FIRST WEST INS SERVICES DBA VALLEY FIRST 3,767,634FIRST WEST INSURANCE SERVICES LTD 969,439FIRST WESTERN INSURANCE SERVICES INC 512,861FISHER CHARLES G DR INC 31,775FIT BODY ATHLETICS & REHABILITATION INC 377,856FIVE STAR TRUCK COLLISION CENTRE LTD 26,979FIX AUTO ABBOTSFORD WEST (RENASCENT) 1,550,503FIX AUTO BOW VALLEY 45,755
SUPPLIER NAME AMOUNTS
FIX AUTO CALGARY CENTRAL 33,234FIX AUTO CALGARY NORTHEAST 150,797FIX AUTO CALGARY SOUTH CENTRAL 286,151FIX AUTO CANADA INC 38,506FIX AUTO CHILLIWACK (RENASCENT) 1,788,590FIX AUTO DUNCAN 624,406FIX AUTO EDMONTON EAST 47,401FIX AUTO EDMONTON NORTH 44,985FIX AUTO EDMONTON SOUTH 27,654FIX AUTO EDMONTON STRATHCONA 177,240FIX AUTO EDMONTON WEST 160,221FIX AUTO GRANDE PRAIRIE NORTH 60,043FIX AUTO LETHBRDIGE 120,525FIX AUTO PEMBERTON 1,054,621FIX AUTO PORT MOODY 1,062,973FIX AUTO POWELL RIVER (AQUA STAR) 947,107FIX AUTO RED DEER 115,198FIX AUTO SPRUCE GROVE 47,182FIX AUTO VERNON (STAR AUTOBODY) 2,696,177FIX AUTO VICTORIA SOUTH (AUDY AUTOBODY) 721,686FIXED INCOME FINANCE PGIM INC 1,454,686FLATT WILLIAM RYAN DR 30,040FLYNN CANADA LTD 734,051FOCUS INVESTIGATIVE SERVICES INC 74,874FOCUS REHABILITATION AND CONSULTING 289,351FONCLOUD INC 209,886FONG HO-CHEUNG DR 26,715FORENSIC DYNAMICS INC 341,718FORGE INTEGRATED HEALTH INC 107,410FORM-ALL CONSTRUCTION LTD 41,948FORRESTER SWITZERLAND GMBH 65,100FORSONS ADJUSTING SERVICE 305,014FORT FABRICATION & WELDING LTD 151,880FORT NELSON AUTOBODY (1999) 27,996FORTISBC 652,494FOSTER’S RV & TRAILER SALES IN 88,440FOWLER WHITE BURNETT 72,231FOX FLIGHT INC 30,800FP&H LAWYERS 1,085,873FRANK’S AUTO BODY REPAIR 2,551,763FRANKEL MICHAEL DR INC 31,593FRANTZ WARD ATTORNEYS AT LAW 256,348FRASER AUTO DENT & COLOR 80,401FRASER BURRARD DIVING LTD 25,200FRASER CANYON GLASS LTD 136,567FRASER CITY MOTORS LTD 1,738,134FRASER HEALTH AUTHORITY 614,138FRASER RIVER PAINT & BODY LTD 1,128,003FRASER VALLEY AUTO GLASS & DETAILING 128,607FRASER VALLEY ORTHOPEDIC & SPORTS CLINIC 156,984FRASER VALLEY PROSTHETICS LTD 46,415FRASERVIEW COLLISION REPAIR LTD 2,896,407FRASERWAY RV GP LTD 579,732
Please note: ICBC changed its fiscal year-end from December 31st to March 31st and therefore, the fiscal period ending March 31, 2017 is a 15 month transitory fiscal period. The total amounts reported above represent 15 months of supplier payments for goods and services.

Insurance Corporation of British Columbia
112
Amounts paid to suppliers for goods and services for the 15 month period ended March 31, 2017
SUPPLIER NAME AMOUNTS
FRED’S AUTOBODY & PAINT (FRED GOWER ENT) 1,570,512FREEBIRD INC BODY & PAINT 34,611FREEDMAN JODY DR 43,445FREIGHTLINER OF CRANBROOK LTD 420,129FREIGHTLINER OF KELOWNA LTD 30,722FRIEDLANDER ROBIN DR INC 27,167FROH ROBERT G DR INC 497,729FSG - FOCUS SOLUTIONS GROUP INC 221,749FSJ GLASS HOUSE 1998 LTD 80,047FUNCTION HEALTH GROUP INC 34,795FUNCTIONAL OUTCOMES REHAB SERVICES 124,184G & A AUTO BODY REPAIRS LTD 121,032G DUNCAN AUTO BODY LTD 1,325,374G KEITH CHAMBERS CONSULTING INC 39,604G&G AUTO BODY REPAIR & SALES TD 163,092G&W JELLY’S LTD 51,359GAGE COLIN DR 51,237GAGNON MICHAEL DR 64,247GALAXIE COLLISION 1979 LTD (BOYD-BURNABY) 931,606GALLAGHER LAKE AUTO-BODY 331,595GALWAY REAL ESTATE ADVISORS INC 211,334GARCHA RANDY S DR 31,155GARDAWORLD CASH SERVICES CANADA CORP 366,631GARDEN CITY BODY & PAINT 38,689GARDNER CHEVROLET PONTIAC BUICK GMC LTD 36,861GARRISON BEATTY & GARRISON INSURANCE 325,707GARTNER CANADA CO 42,420GARY W NIX & ASSOCIATES LTD 79,411GARYS WESTSIDE TOWING LLC 77,956GASPARIN MORRIS DR 44,485GATEWAY GLASS LTD 35,552GATHERCOLE SHANE DR 32,695GATOR AUTO GLASS 52,734GAUTAM & ASSOCIATES 306,216GB GLASS EXPRESS 318,884GBG INSURANCE SERVICES LTD 679,923GD ASSESSMENTS INC 375,210GEMINI ADJUSTERS LTD 267,709GENERIC TOWING & AUTO PARTS LTD 193,629GEO H HEWITT CO LTD (THE) 40,738GEORGE’S BODY SHOP LTD 1,093,180GEORGIA STRAIGHT COLLISION LTD 1,213,554GET-AWAY RV CENTRE LTD 48,258GETGO INC 26,660GHD CONTRACTORS LTD 990,368GHD SERVICES INC 60,027GIBSON POWERCRAFT CENTRE LTD 34,502GILBERT KIRBY STRINGER 99,572GILLESPIE & COMPANY LLP 2,017,870GILMAY RV 47,989GIVER A YANK TOWING & PICKER SERVICE 113,306GJB HOLDINGS LTD 82,330GLACIER MOBILE GLASS LTD 253,775
SUPPLIER NAME AMOUNTS
GLACIER TOYOTA 25,373GLACIER VIEW GLASS LTD 157,963GLACIER VIEW INVESTIGATIVE SERVICES 45,822GLASS DOCTOR NORTH VANCOUVER 650,549GLASS DOCTOR OF SUNSHINE COAST 264,116GLASSCO AUTO & WINDOW LTD 382,052GLENMERRY GLASS LTD 132,879GLENN MOUNTAIN ORTHOPAEDIC & SPORTS 32,348GLENN’S TOWING AND REPAIR 43,750GLOBAL INSURANCE AGENCY (2007) LTD 309,168GLOBAL INSURANCE AGENCY (2008) LTD 362,855GLOBAL INSURANCE AGENCY LTD 291,189GLOBAL ROADWAY MAINTENANCE INC 48,170GLOBALSCAPE 39,707GLOVER ROAD CHIROPRACTIC 49,967GMR ADVANCED AUTOWORKS (ROB’S AUTO CARE) 881,909GN INSURANCE AGENCY LTD 579,143GNK INSURANCE SERVICES INC 730,117GO AUTO SURREY CHRYSLER DODGE JEEP RAM 2,019,967GOAL DIRECTED OCCUPATIONAL INC 124,997GODBOUT AUTO SERVICES INC 26,336GODOY & VERVERGAERT INSURANCE BROKERS INC 457,845GODOY & VERVERGAERT INSURANCE ONLY INC 593,061GODOY’S INSURANCE ONLY (LANGLEY) INC 559,085GODOY’S INSURANCE ONLY INC 324,850GOETZ THOMAS DR INC 32,293GOLD KEY INSURANCE SERVICES LTD 1,980,657GOLD KEY LANGLEY VOLKSWAGEN 2,415,068GOLDBERG FRAN 38,762GOLDEN EARS INSURANCE SERVICES LTD 1,662,175GOLDEN EARS ORTHOPAEDIC & SPORTS PHYSIO 105,881GOLDEN SHIELD ADJUSTERS LTD 302,501GOLDEN TOWING LTD 37,313GOLDKEY INSURANCE SERVICES (ABBOTSFORD) 286,077GOLDLEAF INSURANCE SERVICES INC 35,744GOLDMINE INSURANCE SERVICES (ABBOTSFORD) 315,448GOLDMINE INSURANCE SERVICES (2014) LTD 216,594GOLDMINE INSURANCE SERVICES LTD 960,687GOLDSTEIN LARRY M DR INC 110,959GOODLUCK AUTO & WINDOW GLASS 207,256GORD RON’S AUTO METAL (KIRMAC COLLISION) 2,176,314GORDON & REES LLP 1,015,155GORDON’S AUTO BODY WORKS LTD 2,689,723GOVERNMENT AGENT - ATLIN 58,843GOVERNMENT AGENT - DEASE LAKE 135,025GOVERNMENT AGENT - STEWART 59,217GOVERNMENT OF ALBERTA 393,204GRAMPA’S RV REPAIRS 186,628GRAND AND TOY LIMITED 1,084,329GRAND FORKS GLASS LTD 154,530GRAND PERFORMANCE AUTO CENTRE INC 2,024,779GRANDCITY AUTOBODY LTD 9,412,171GRANT KOVACS NORELL 4,372,838
Please note: ICBC changed its fiscal year-end from December 31st to March 31st and therefore, the fiscal period ending March 31, 2017 is a 15 month transitory fiscal period. The total amounts reported above represent 15 months of supplier payments for goods and services.
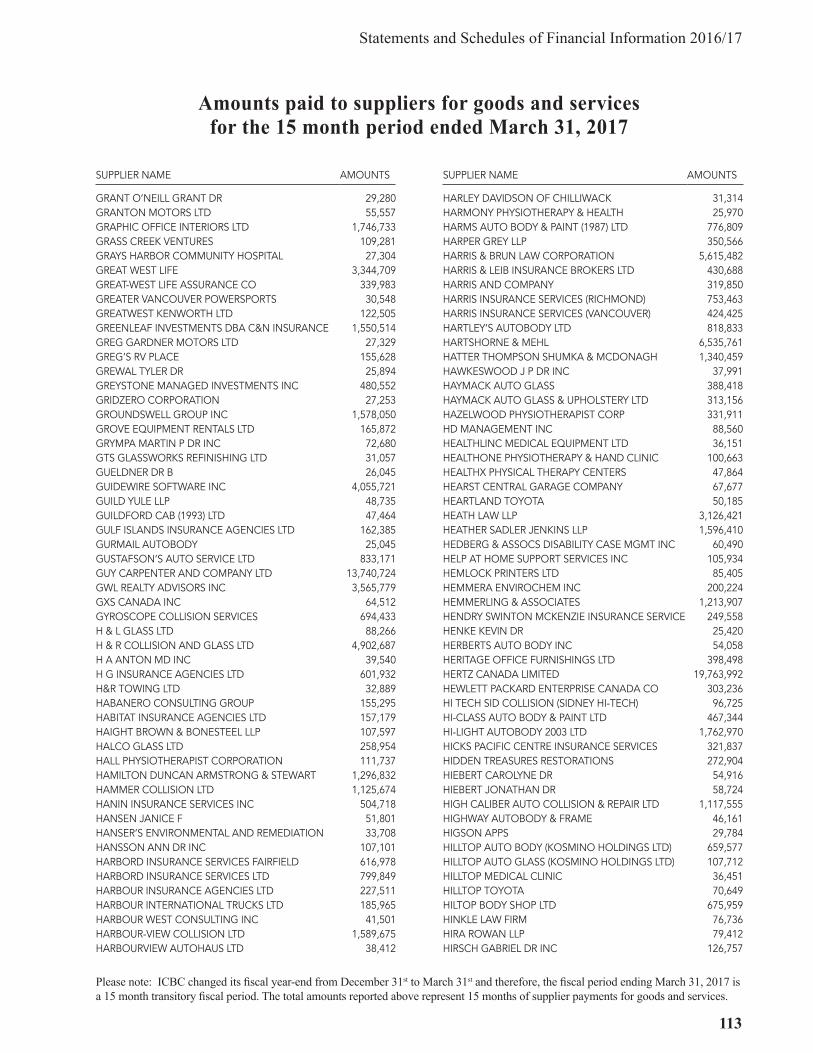
Statements and Schedules of Financial Information 2016/17
113
Amounts paid to suppliers for goods and services for the 15 month period ended March 31, 2017
SUPPLIER NAME AMOUNTS
GRANT O’NEILL GRANT DR 29,280GRANTON MOTORS LTD 55,557GRAPHIC OFFICE INTERIORS LTD 1,746,733GRASS CREEK VENTURES 109,281GRAYS HARBOR COMMUNITY HOSPITAL 27,304GREAT WEST LIFE 3,344,709GREAT-WEST LIFE ASSURANCE CO 339,983GREATER VANCOUVER POWERSPORTS 30,548GREATWEST KENWORTH LTD 122,505GREENLEAF INVESTMENTS DBA C&N INSURANCE 1,550,514GREG GARDNER MOTORS LTD 27,329GREG’S RV PLACE 155,628GREWAL TYLER DR 25,894GREYSTONE MANAGED INVESTMENTS INC 480,552GRIDZERO CORPORATION 27,253GROUNDSWELL GROUP INC 1,578,050GROVE EQUIPMENT RENTALS LTD 165,872GRYMPA MARTIN P DR INC 72,680GTS GLASSWORKS REFINISHING LTD 31,057GUELDNER DR B 26,045GUIDEWIRE SOFTWARE INC 4,055,721GUILD YULE LLP 48,735GUILDFORD CAB (1993) LTD 47,464GULF ISLANDS INSURANCE AGENCIES LTD 162,385GURMAIL AUTOBODY 25,045GUSTAFSON’S AUTO SERVICE LTD 833,171GUY CARPENTER AND COMPANY LTD 13,740,724GWL REALTY ADVISORS INC 3,565,779GXS CANADA INC 64,512GYROSCOPE COLLISION SERVICES 694,433H & L GLASS LTD 88,266H & R COLLISION AND GLASS LTD 4,902,687H A ANTON MD INC 39,540H G INSURANCE AGENCIES LTD 601,932H&R TOWING LTD 32,889HABANERO CONSULTING GROUP 155,295HABITAT INSURANCE AGENCIES LTD 157,179HAIGHT BROWN & BONESTEEL LLP 107,597HALCO GLASS LTD 258,954HALL PHYSIOTHERAPIST CORPORATION 111,737HAMILTON DUNCAN ARMSTRONG & STEWART 1,296,832HAMMER COLLISION LTD 1,125,674HANIN INSURANCE SERVICES INC 504,718HANSEN JANICE F 51,801HANSER’S ENVIRONMENTAL AND REMEDIATION 33,708HANSSON ANN DR INC 107,101HARBORD INSURANCE SERVICES FAIRFIELD 616,978HARBORD INSURANCE SERVICES LTD 799,849HARBOUR INSURANCE AGENCIES LTD 227,511HARBOUR INTERNATIONAL TRUCKS LTD 185,965HARBOUR WEST CONSULTING INC 41,501HARBOUR-VIEW COLLISION LTD 1,589,675HARBOURVIEW AUTOHAUS LTD 38,412
SUPPLIER NAME AMOUNTS
HARLEY DAVIDSON OF CHILLIWACK 31,314HARMONY PHYSIOTHERAPY & HEALTH 25,970HARMS AUTO BODY & PAINT (1987) LTD 776,809HARPER GREY LLP 350,566HARRIS & BRUN LAW CORPORATION 5,615,482HARRIS & LEIB INSURANCE BROKERS LTD 430,688HARRIS AND COMPANY 319,850HARRIS INSURANCE SERVICES (RICHMOND) 753,463HARRIS INSURANCE SERVICES (VANCOUVER) 424,425HARTLEY’S AUTOBODY LTD 818,833HARTSHORNE & MEHL 6,535,761HATTER THOMPSON SHUMKA & MCDONAGH 1,340,459HAWKESWOOD J P DR INC 37,991HAYMACK AUTO GLASS 388,418HAYMACK AUTO GLASS & UPHOLSTERY LTD 313,156HAZELWOOD PHYSIOTHERAPIST CORP 331,911HD MANAGEMENT INC 88,560HEALTHLINC MEDICAL EQUIPMENT LTD 36,151HEALTHONE PHYSIOTHERAPY & HAND CLINIC 100,663HEALTHX PHYSICAL THERAPY CENTERS 47,864HEARST CENTRAL GARAGE COMPANY 67,677HEARTLAND TOYOTA 50,185HEATH LAW LLP 3,126,421HEATHER SADLER JENKINS LLP 1,596,410HEDBERG & ASSOCS DISABILITY CASE MGMT INC 60,490HELP AT HOME SUPPORT SERVICES INC 105,934HEMLOCK PRINTERS LTD 85,405HEMMERA ENVIROCHEM INC 200,224HEMMERLING & ASSOCIATES 1,213,907HENDRY SWINTON MCKENZIE INSURANCE SERVICE 249,558HENKE KEVIN DR 25,420HERBERTS AUTO BODY INC 54,058HERITAGE OFFICE FURNISHINGS LTD 398,498HERTZ CANADA LIMITED 19,763,992HEWLETT PACKARD ENTERPRISE CANADA CO 303,236HI TECH SID COLLISION (SIDNEY HI-TECH) 96,725HI-CLASS AUTO BODY & PAINT LTD 467,344HI-LIGHT AUTOBODY 2003 LTD 1,762,970HICKS PACIFIC CENTRE INSURANCE SERVICES 321,837HIDDEN TREASURES RESTORATIONS 272,904HIEBERT CAROLYNE DR 54,916HIEBERT JONATHAN DR 58,724HIGH CALIBER AUTO COLLISION & REPAIR LTD 1,117,555HIGHWAY AUTOBODY & FRAME 46,161HIGSON APPS 29,784HILLTOP AUTO BODY (KOSMINO HOLDINGS LTD) 659,577HILLTOP AUTO GLASS (KOSMINO HOLDINGS LTD) 107,712HILLTOP MEDICAL CLINIC 36,451HILLTOP TOYOTA 70,649HILTOP BODY SHOP LTD 675,959HINKLE LAW FIRM 76,736HIRA ROWAN LLP 79,412HIRSCH GABRIEL DR INC 126,757
Please note: ICBC changed its fiscal year-end from December 31st to March 31st and therefore, the fiscal period ending March 31, 2017 is a 15 month transitory fiscal period. The total amounts reported above represent 15 months of supplier payments for goods and services.

Insurance Corporation of British Columbia
114
Amounts paid to suppliers for goods and services for the 15 month period ended March 31, 2017
SUPPLIER NAME AMOUNTS
HKG HOLDINGS INC DBA SUSSEX INSURANCE 1,035,597HMZ LAW 270,738HNC ALLIANCE HOLDINGS INC DBA SUSSEX 37,343HOGIES TOWING 38,397HOLESHOT MOTORSPORTS LTD 68,055HOLLETT RODNEY DR 66,716HOME INSTEAD SENIOR CARE BURNABY 123,163HOMESTEAD INSURANCE AGENCIES LTD 460,268HOOTSUITE MEDIA INC 32,623HOPE AUTO BODY LTD 807,343HOPE TOWING LTD 135,606HORIZON AUTOBODY COLLISION LTD 133,248HORIZON WEST INSURANCE SERVICES LTD 489,263HORLICK SIMON DR INC 1,015,574HOSKINS FORD SALES LTD 811,007HOULE ELECTRIC LIMITED 1,264,782HP ADVANCED SOLUTIONS INC 4,400,460HUB CITY MOTORS & EQUIPMENT LTD 76,030HUB FIRE ENGINES & EQUIPMENT LTD 40,777HUB INTERNATIONAL (BRENTWOOD) LTD 832,502HUB INTERNATIONAL (RICHMOND AUTO MALL) 4,164,055HUB INTERNATIONAL CANADA WEST ULC 45,851,865HUBER BANNISTER COLLISION CENTRE 1,037,978HUMHEJ DEANNA 190,586HUNGERFORD TOMYN LAWRENSON & NICHOLS 763,077HUSTON GRANT ADJUSTERS LTD 136,845HWANG JEFFREY DR 36,964HYDE PARK INSURANCE AGENCIES LTD 1,043,175I STATE TRUCK CENTRE 43,278IBM CANADA LTD 18,677,063IC FINANCIAL CORP DBA INSUREBC (SARDIS) 59,315ICARE INSURANCE BROKERS LTD 1,002,441IDEAL WINDOW TINT 31,511IMA SOLUTIONS INC 9,717,470IMPERIAL AUTOBODY (JKT AUTO BODY LTD) 1,150,189IMPERIAL PARKING CANADA CORP 77,800IN INSURANCE AGENCY LIMITED 64,672INDCON DEVELOPMENTS LTD 34,263INDEPENDENT LIFESTYLES - SUNSHINE COAST 73,669INFINITE COMPUTER SOLUTIONS CANADA LTD 152,880INFINITY HEALTH LLP 2,660,924INFINITY INSURANCE SERVICES INC 336,259INFOMART (DIV OF POSTMEDIA NETWORK INC) 66,045INFOTRELLIS INC 885,058INJURY RESOURCE CENTRE 178,717INLAND AUTO CENTRE LTD 37,862INLAND KENWORTH (BURNABY) 40,803INLAND KENWORTH (CAMPBELL RIVER) 46,200INLAND KENWORTH (CRANBROOK) 243,068INLAND KENWORTH (FORT ST JOHN) 1,086,769INLAND KENWORTH (KAMLOOPS) 63,650INLAND KENWORTH (LANGLEY) 2,777,427INLAND KENWORTH (PENTICTON) 63,171
SUPPLIER NAME AMOUNTS
INLAND KENWORTH (PRINCE GEORGE) 978,286INLAND KENWORTH (QUESNEL) 130,672INLAND KENWORTH (VERNON) 71,195INLAND KENWORTH (WILLIAMS LAKE) 146,930INLINE INDUSTRIES LTD 65,464INNOVATIVE FITNESS 60,743INSIGHTS WEST MARKETING RESEARCH INC 31,316INSTA GLASS (CHILLIWACK) 652,619INSTA GLASS (SECHELT) 164,391INSURANCE BROKERS ASSOCIATION 39,789INSURANCE BUREAU OF CANADA 248,449INSURANCE SERVICES DEPT OF LONDON DRUGS 9,636,525INSUREBC (ARBUTUS) INSURANCE SERVICES 349,578INSUREBC (DEEP COVE) INSURANCE SERVICES 304,254INSUREBC (LANGLEY) INSURANCE SERVICES 473,587INSUREBC (LANSDOWNE) INSURANCE SERVICES 498,161INSUREBC (LEE & PORTER) INSURANCE SERVICE 224,699INSUREBC (MARPOLE) INSURANCE SERVICES 247,063INSUREBC (MEADOWTOWN) INSURANCE SERVICES 194,378INSUREBC (QUEENSBOROUGH) INSUR SERVICES 369,674INSUREBC (SQUAMISH) INSURANCE SERVICES 720,682INSUREBC (UNIVERSITY) INSURANCE SERVICES 383,712INSUREBC (WESTVIEW) INSURANCE SERVICES 300,685INSUREBC (WILLOWBROOK) INSURANCE SERVICES 400,025INSUREBC (YALETOWN) INSURANCE SERVICES 548,393INTECH ENGINEERING LTD 65,783INTEGRA CUSTOM COLLISION 1,394,317INTEGRIS INSURANCE SERVICES LTD 1,221,579INTERCITY EQUITY CORP DBA CAULFEILD INS 527,605INTERCITY EQUITY CORP DBA LEADERS INS 222,456INTERCITY EQUITY CORP DBA PORT MOODY INC 708,785INTERCONTINENTAL TRUCK BODY 120,421INTERIM HEALTH CARE 123,136INTERIOR FRAME AND COLLISION (RJAMES) 1,750,143INTERIOR HEALTH AUTHORITY 432,519INTERIOR MOBILE GLASS INC 184,681INTERIOR SAVINGS INSURANCE SERVICES 6,418,052INTERMARK LAW 93,716INTERNATIONAL DIRECT RESPONSE SERVICES 41,992INTERNATIONAL MACHINERY SALES INC 31,976INTERNATIONAL WORD EXCHANGE LTD 152,129INTUITIVE INDEPENDENCE REHABILITATION 1,086,917INVERMERE GLASS LTD 136,256INVESTIGATIVE TRAINING SERVICE LLC 34,800IP AUTO SERVICE 285,782IPSA INTERNATIONAL INC 180,148IPSOS LP 289,178IRL INTERNATIONAL TRUCK CENTRE 128,809IRON MOUNTAIN CANADA OPS ULC 75,491IRONWOOD INSURANCE AGENCIES LTD 1,123,222IRWIN & BILLINGS 429,347IRWIN COLLISION REPAIRS LTD 928,755ISHERWOOD BODY & FENDER LTD 1,635,780
Please note: ICBC changed its fiscal year-end from December 31st to March 31st and therefore, the fiscal period ending March 31, 2017 is a 15 month transitory fiscal period. The total amounts reported above represent 15 months of supplier payments for goods and services.

Statements and Schedules of Financial Information 2016/17
115
Amounts paid to suppliers for goods and services for the 15 month period ended March 31, 2017
SUPPLIER NAME AMOUNTS
ISLAND HEALTH AUTHORITY 86,193ISLAND INSURANCE AGENCY LTD 1,063,430ISLAND MEDIQUIP LTD 74,445ISLAND THUNDER TOWING 56,637ISLAND TRUCK & AUTO COLLISION LTD 1,133,669ISTATE TRUCK CENTER 62,696ITF 1648020 ALBERTA LTD 38,289ITF 2166025 ONTARIO LTD 110,465ITF 2277479 ONTARIO LTD 168,836ITF 2329075 ONTARIO LTD 79,575IVAN’S AUTO BODY LTD 1,536,989IVANHOE CAMBRIDGE II INC 516,771IVES BURGER 632,040J A QUALITY GLASS AND DETAIL INC 360,335J D TOWING 26,558J F VISION AUTOGLASS (BURNABY) LTD 630,260J F VISION AUTOGLASS LTD 868,140J P MOORE INVESTIGATIONS LTD 143,069J&H ALEXANDER LTD 370,022JACK SCHULTZ AUTOBODY LTD 4,019,021JACK W CHOW INSURANCE SERVICES LTD 362,457JACK’S TOWING (2010) LTD 1,372,220JACOBS CHIROPRACTIC INC 31,067JACOBSON FORD SALES LTD 124,941JAG LAW CORPORATION 49,426JAGER AARON DR 30,835JAMES G MCMYNN AGENCIES LTD 127,508JAMES WESTERN STAR (PRINCE GEORGE) 73,042JAMES WESTERN STAR (WILLIAMS LAKE) 146,342JAMIE DAVIS MOTOR TRUCK & AUTO LTD 325,809JAN-PRO CLEANING SYSTEMS OF VANCOUVER 264,061JAN’S PRECISION AUTOBODY 1,430,088JANG ERIC DR CHIROPRACTIC 148,065JANI-KING OF NORTHERN BC 101,588JANIC ALEKSANDAR 28,078JANKE PAUL DR INC 189,729JARDINE LLOYD THOMPSON CANADA INC 45,770JAY’S CUSTOM TOWING 25,440JENSEN SIGNS 52,295JERRY L WARD CHIROPRACTIC SERVICES INC 33,394JF AUTO CENTRE LTD 107,399JHAJ HARDIP 80,025JIM PATTISON CHRYSLER JEEP DODGE 2,844,431JIM PATTISON HYUNDAI SURREY 30,660JIM PATTISON LEXUS VICTORIA 52,394JIM PATTISON TOYOTA DOWNTOWN 40,222JIM PATTISON TOYOTA NORTH VAN 41,838JIM PATTISON TOYOTA SURREY 5,508,964JIM PATTISON TOYOTA VICTORIA 179,110JIM PATTISON VOLKSWAGEN SURREY 237,791JIWA FARRAH DR 27,316JJB INSURANCE AGENCIES INC 627,232JL BROTHERS AUTO BODY LTD 98,146
SUPPLIER NAME AMOUNTS
JOE’S AUTOBODY REPAIR LTD 1,140,595JOHN ROSS INSURANCE SERVICE LTD 268,775JOHN’S AUTOBODY & AUTOSALVAGE 196,696JOHNSON & BELL LTD 143,081JOHNSTON MEIER INSURANCE AGENCIES LTD 20,878,286JOHNSTON MEIER INSURANCE BROKERS (1996) 273,295JOINT PHYSIOTHERAPY & SPORTS INJURY (THE) 49,724JONATHAN NEIL & ASSOCIATES 26,231JONCAS MEDIATION SERVICES 29,138JONES EMERY HARGREAVES SWAN 2,195,661JOSAN ENTERPRISES LTD 70,450JOSCHKO MICHAEL DR 96,676JR REHABILITATION SERVICES INC 3,376,853JUAN KIM 30,049JUBILEE RV CENTRE 36,447JUST RITE TIRE & AUTOBODY SHOP 33,376JUSTICE INSTITUTE OF BC 30,319K D ENGINEERING LTD 111,111K M AUTOBODY REPAIR LTD 352,562K-LINE TRAILERS LTD 484,994KAL TIRE 242,764KALAWSKY COLLISION CENTRE LTD 1,473,259KAMI INSURANCE AGENCIES LTD 195,803KAMLOOPS DODGE CHRYSLER JEEP LTD 69,729KAMLOOPS FORD LINCOLN LTD 3,590,246KAMLOOPS INSURANCE SERVICES INC 662,696KAMLOOPS PHYSIOTHERAPY & SPORTS INJURY 59,677KANE SHANNON AND WEILER 8,973,100KANES HARLEY DAVIDSON 49,059KARIM SHAHZAD DR 54,980KARP HOMECARE 229,941KARP PERSONAL TRAINING & REHABILITATION 1,972,124KARP REHABILITATION 1,381,652KASIAN ARCHITECTURE INTERIOR DESIGN 390,297KASTELEIN STOUT INSURANCE AGENCIES INC 298,457KC REHAB INC 69,446KCI MEDICAL CANADA INC 47,639KDM WELDING & MANUFACTURING LTD 132,860KEATING COLLISION (SIDNEY-TECH) 127,308KEEGZ SOUTH COUNTRY TOWING 86,897KELOWNA BMW/MINI KELOWNA 41,857KELOWNA CABS (1981) LTD 55,244KELOWNA CHRYSLER DODGE LTD 976,184KELOWNA FIX AUTO (KELOWNA AUTO COLLISION) 44,739KELOWNA GLASS 463,640KELOWNA MEDICAL MASSAGE 57,622KELOWNA PERFORMANCE COLLISION CENTRE LTD 3,850,929KELOWNA TRUCK & RV LTD 37,298KELOWNA VALLEY INSURANCE SERVICES LTD 844,999KELVIN PHYSIOTHERAPY CLINIC 95,022KEMBLE F DR INC 115,213KEN RYSTEAD INSURANCE AGENCIES LTD 224,828KEN’S LANDSCAPING LTD 124,606
Please note: ICBC changed its fiscal year-end from December 31st to March 31st and therefore, the fiscal period ending March 31, 2017 is a 15 month transitory fiscal period. The total amounts reported above represent 15 months of supplier payments for goods and services.
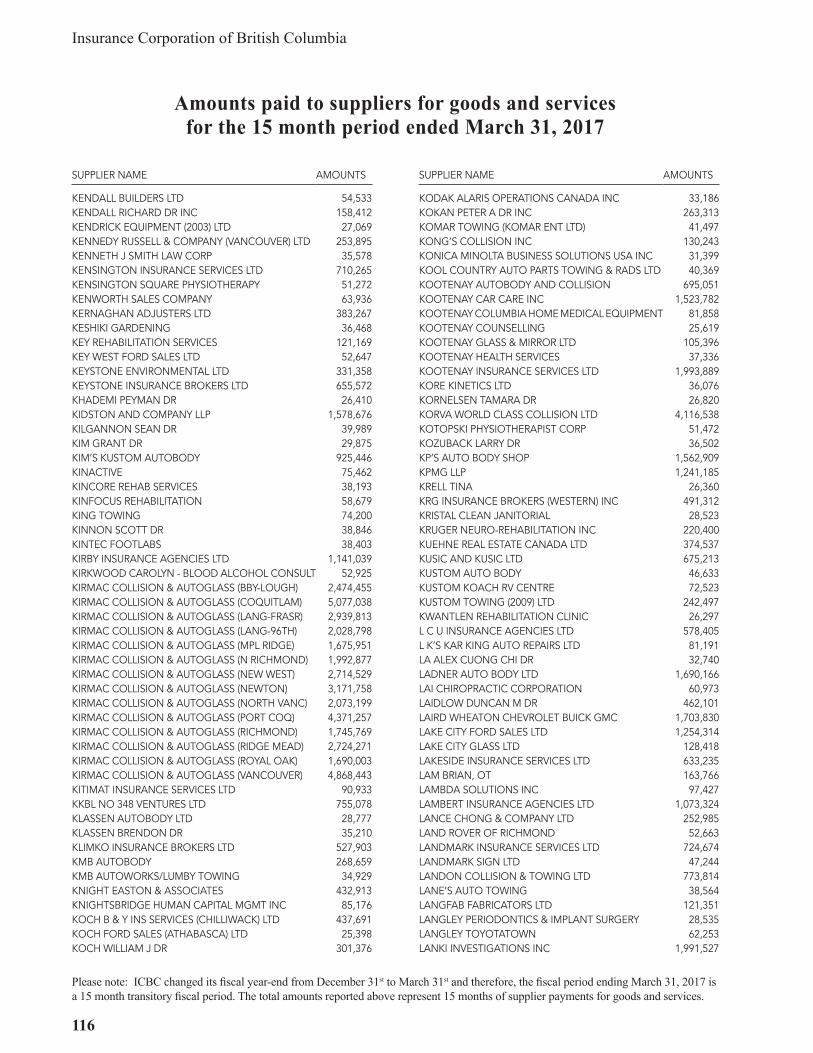
Insurance Corporation of British Columbia
116
Amounts paid to suppliers for goods and services for the 15 month period ended March 31, 2017
SUPPLIER NAME AMOUNTS
KENDALL BUILDERS LTD 54,533KENDALL RICHARD DR INC 158,412KENDRICK EQUIPMENT (2003) LTD 27,069KENNEDY RUSSELL & COMPANY (VANCOUVER) LTD 253,895KENNETH J SMITH LAW CORP 35,578KENSINGTON INSURANCE SERVICES LTD 710,265KENSINGTON SQUARE PHYSIOTHERAPY 51,272KENWORTH SALES COMPANY 63,936KERNAGHAN ADJUSTERS LTD 383,267KESHIKI GARDENING 36,468KEY REHABILITATION SERVICES 121,169KEY WEST FORD SALES LTD 52,647KEYSTONE ENVIRONMENTAL LTD 331,358KEYSTONE INSURANCE BROKERS LTD 655,572KHADEMI PEYMAN DR 26,410KIDSTON AND COMPANY LLP 1,578,676KILGANNON SEAN DR 39,989KIM GRANT DR 29,875KIM’S KUSTOM AUTOBODY 925,446KINACTIVE 75,462KINCORE REHAB SERVICES 38,193KINFOCUS REHABILITATION 58,679KING TOWING 74,200KINNON SCOTT DR 38,846KINTEC FOOTLABS 38,403KIRBY INSURANCE AGENCIES LTD 1,141,039KIRKWOOD CAROLYN - BLOOD ALCOHOL CONSULT 52,925KIRMAC COLLISION & AUTOGLASS (BBY-LOUGH) 2,474,455KIRMAC COLLISION & AUTOGLASS (COQUITLAM) 5,077,038KIRMAC COLLISION & AUTOGLASS (LANG-FRASR) 2,939,813KIRMAC COLLISION & AUTOGLASS (LANG-96TH) 2,028,798KIRMAC COLLISION & AUTOGLASS (MPL RIDGE) 1,675,951KIRMAC COLLISION & AUTOGLASS (N RICHMOND) 1,992,877KIRMAC COLLISION & AUTOGLASS (NEW WEST) 2,714,529KIRMAC COLLISION & AUTOGLASS (NEWTON) 3,171,758KIRMAC COLLISION & AUTOGLASS (NORTH VANC) 2,073,199KIRMAC COLLISION & AUTOGLASS (PORT COQ) 4,371,257KIRMAC COLLISION & AUTOGLASS (RICHMOND) 1,745,769KIRMAC COLLISION & AUTOGLASS (RIDGE MEAD) 2,724,271KIRMAC COLLISION & AUTOGLASS (ROYAL OAK) 1,690,003KIRMAC COLLISION & AUTOGLASS (VANCOUVER) 4,868,443KITIMAT INSURANCE SERVICES LTD 90,933KKBL NO 348 VENTURES LTD 755,078KLASSEN AUTOBODY LTD 28,777KLASSEN BRENDON DR 35,210KLIMKO INSURANCE BROKERS LTD 527,903KMB AUTOBODY 268,659KMB AUTOWORKS/LUMBY TOWING 34,929KNIGHT EASTON & ASSOCIATES 432,913KNIGHTSBRIDGE HUMAN CAPITAL MGMT INC 85,176KOCH B & Y INS SERVICES (CHILLIWACK) LTD 437,691KOCH FORD SALES (ATHABASCA) LTD 25,398KOCH WILLIAM J DR 301,376
SUPPLIER NAME AMOUNTS
KODAK ALARIS OPERATIONS CANADA INC 33,186KOKAN PETER A DR INC 263,313KOMAR TOWING (KOMAR ENT LTD) 41,497KONG’S COLLISION INC 130,243KONICA MINOLTA BUSINESS SOLUTIONS USA INC 31,399KOOL COUNTRY AUTO PARTS TOWING & RADS LTD 40,369KOOTENAY AUTOBODY AND COLLISION 695,051KOOTENAY CAR CARE INC 1,523,782KOOTENAY COLUMBIA HOME MEDICAL EQUIPMENT 81,858KOOTENAY COUNSELLING 25,619KOOTENAY GLASS & MIRROR LTD 105,396KOOTENAY HEALTH SERVICES 37,336KOOTENAY INSURANCE SERVICES LTD 1,993,889KORE KINETICS LTD 36,076KORNELSEN TAMARA DR 26,820KORVA WORLD CLASS COLLISION LTD 4,116,538KOTOPSKI PHYSIOTHERAPIST CORP 51,472KOZUBACK LARRY DR 36,502KP’S AUTO BODY SHOP 1,562,909KPMG LLP 1,241,185KRELL TINA 26,360KRG INSURANCE BROKERS (WESTERN) INC 491,312KRISTAL CLEAN JANITORIAL 28,523KRUGER NEURO-REHABILITATION INC 220,400KUEHNE REAL ESTATE CANADA LTD 374,537KUSIC AND KUSIC LTD 675,213KUSTOM AUTO BODY 46,633KUSTOM KOACH RV CENTRE 72,523KUSTOM TOWING (2009) LTD 242,497KWANTLEN REHABILITATION CLINIC 26,297L C U INSURANCE AGENCIES LTD 578,405L K’S KAR KING AUTO REPAIRS LTD 81,191LA ALEX CUONG CHI DR 32,740LADNER AUTO BODY LTD 1,690,166LAI CHIROPRACTIC CORPORATION 60,973LAIDLOW DUNCAN M DR 462,101LAIRD WHEATON CHEVROLET BUICK GMC 1,703,830LAKE CITY FORD SALES LTD 1,254,314LAKE CITY GLASS LTD 128,418LAKESIDE INSURANCE SERVICES LTD 633,235LAM BRIAN, OT 163,766LAMBDA SOLUTIONS INC 97,427LAMBERT INSURANCE AGENCIES LTD 1,073,324LANCE CHONG & COMPANY LTD 252,985LAND ROVER OF RICHMOND 52,663LANDMARK INSURANCE SERVICES LTD 724,674LANDMARK SIGN LTD 47,244LANDON COLLISION & TOWING LTD 773,814LANE’S AUTO TOWING 38,564LANGFAB FABRICATORS LTD 121,351LANGLEY PERIODONTICS & IMPLANT SURGERY 28,535LANGLEY TOYOTATOWN 62,253LANKI INVESTIGATIONS INC 1,991,527
Please note: ICBC changed its fiscal year-end from December 31st to March 31st and therefore, the fiscal period ending March 31, 2017 is a 15 month transitory fiscal period. The total amounts reported above represent 15 months of supplier payments for goods and services.

Statements and Schedules of Financial Information 2016/17
117
Amounts paid to suppliers for goods and services for the 15 month period ended March 31, 2017
SUPPLIER NAME AMOUNTS
LARRY’S AUTO GLASS 94,410LATIMER P R DR MEDICAL SERVICES INC 119,025LAURA SMITH & ASSOCIATES 40,392LAVANCO BUILDING MAINTENANCE LTD 349,037LAWN FATHERS LANDSCAPING 45,833LAWSON LUNDELL 97,605LAZAR SUSAN FAYE DR INC 45,407LEADING EDGE GLASS LTD 242,174LEBLANC JEANNE DR 133,899LEE’S AUTOPRIDE COLLISION LTD 2,307,041LEGACIES HEALTH CENTRE 299,646LEGEAR PELLING INSURANCE AGENCIES LTD 835,471LEISURELAND RV CENTRE INC 42,857LEITH JORDAN M DR 101,120LEITH WHEELER INVESTMENT CO 268,654LENOVO CANADA INC 193,305LEON AINES AUTO BODY LTD 395,739LES SCHULTZ AUTOBODY & GLASS 527,587LETHBRIDGE DODGE CHRYSLER JEEP 26,212LEUNG SIMPSON DR CHIROPRACTIC 28,265LEVIN ALEXANDER L DR LTD 699,510LEXISNEXIS CANADA INC 81,125LIEBERT CANADA 26,164LIFE AFTER LAW INC 47,040LIFE FLIGHT INTERNATIONAL 47,630LIFE SKILLS THERAPY 1,694,421LIFEMARK HEALTH 755,936LIFEMARK HEALTH CENTRE 983,363LIFEMARK HEALTH ESQUIMALT 67,721LIFEMARK HEALTH OKANAGAN 288,094LIFEMARK HEALTH RICHMOND 38,212LIFEMARK NORDEL WAY 53,622LIFEMARK OCCUPATIONAL THERAPY 132,132LIFEMARK PHYSIOTHERAPY 367,979LIFEMARK PINNACLE SPORTS PHYSIOTHERAPY 37,713LIFEMARK SPORT MEDICINE 114,804LIFEMARK WESTBANK 61,268LILLOOET GLASS AND TIRE 112,898LIMA’S BODY AND PAINT LTD 254,338LINDSAY HART LLP 67,841LINDSAY LLP 7,694,278LINK INSURANCE SERVICES LTD 556,451LINKEDIN IRELAND LIMITED 86,655LIONHEART INVESTIGATIONS 331,494LITKE REBEKAH 43,305LITTLE VALLEY RESTORATIONS LTD 1,550,412LIVING LINE (THE) 39,608LJ’S TOWING & TRANSPORT 40,885LO GARY C P DR 34,458LODGE & ASSOCIATES INVESTIGATIONS LTD 420,469LOMAS-MILNE GROUP INC 998,215LONDON DRUGS LTD 39,255LONG VIEW SYSTEMS CORPORATION 1,228,720
SUPPLIER NAME AMOUNTS
LONGVIEW SOLUTIONS INC 61,473LOOMER RICHARD DR INC 70,482LOTUS AUTOBODY REPAIRS LTD 753,196LOUGHEED ACURA 76,992LOVETT WESTMACOTT 50,700LOW COST TOWING (2014) 27,504LSV ASSET MANAGEMENT 57,927LUKER FORENSIC ENGINEERING INC 35,694LYLE INSURANCE SERVICES INC 623,794LYNN VALLEY ORTHOPAEDIC & SPORTS PHYSIO 37,359LYONS LANDSCAPING LTD 88,406LYSAK HANNA DR PSYCHOLOGY INC 177,352M B COLLISION RICHMOND INC 11,625,306M G COLLISION REPAIRS LTD 2,019,600MA HILDA DR 25,340MAACO COLLISION REPAIR & AUTO PAINTING 730,119MACATEE MANAGEMENT 0853784 BC 30,570MACCABEE TANKS LTD 161,246MACCARTHY MOTORS (TERRACE) LTD 28,101MACDERMOTT’S INSURANCE AGENCY LTD 995,553MACDONALD ANGELA DR 32,670MACDONALD BOYLE & JEFFERY 95,750MACDONALD-GILL INSURANCE SERVICES LTD 649,958MACDONALD’S HOME HEALTH CARE 69,942MACDONALD’S PRESCRIPTIONS LTD 79,661MACFARLANE INSURANCE AGENCIES LTD 260,676MACHAON MEDICAL EVALUATIONS INC 64,996MACK SALES & SERVICE OF NANAIMO LTD 66,833MACKENZIE DAVID DR 68,017MACKENZIE FUJISAWA LLP 1,185,430MACKENZIE STORAGE LTD 39,049MACKENZIE TIRE LTD 32,855MACKOFF & COMPANY 3,106,351MACNAUGHTON & WARD LTD 2,036,304MADAHAR J S DR 29,013MAGNA LEGAL SERVICES 45,930MAGNUM TRAILER & EQUIPMENT INC 678,547MAIN STREET INSURANCE SERVICES LTD 256,707MAINLAND AGENCIES LTD 92,321MAINLAND AUTOMOTIVE COLLISION (RICH) 2,228,675MAINLAND AUTOMOTIVE COLLISION (VANC) 3,633,489MAINLAND FORD LTD 1,650,497MAINLAND GLASS INC 69,007MAINLAND REPORTING SERVICES INC 219,907MAIR JENSEN BLAIR LLP 28,813MAKIN V DR INC 152,402MALHI SANDEEP 62,759MALIBU COLLISION (ROADKNIGHT HOLDINGS) 1,373,322MALOON STEPHEN DR INC 359,514MALUDZINSKI KRZYSZTOF, RMT 39,816MANFRED’S AUTO BODY LTD 1,143,803MANN RAJ DR 295,264MANN SUKHDIP DR 43,366
Please note: ICBC changed its fiscal year-end from December 31st to March 31st and therefore, the fiscal period ending March 31, 2017 is a 15 month transitory fiscal period. The total amounts reported above represent 15 months of supplier payments for goods and services.

Insurance Corporation of British Columbia
118
Amounts paid to suppliers for goods and services for the 15 month period ended March 31, 2017
SUPPLIER NAME AMOUNTS
MANOR INSURANCE SERVICE LTD 330,919MANULIFE FINANCIAL 22,101,750MAPLE AUTO GLASS & UPHOLSTERY LTD 232,594MAPLE RIDGE CHRYSLER JEEP DODGE 34,156MAPLE RIDGE PHYSIOTHERAPY & PAIN CLINIC 149,701MAPLE RIDGE TOWING (1981) LTD 644,384MAPLE TOWING CORP 26,076MAPLELEAF INSURANCE SERVICES LTD 548,033MARDON INSURANCE BROKERS (COQUITLAM) LTD 485,035MARDON INSURANCE BROKERS (WHITE ROCK) LTD 287,631MARDON INSURANCE BROKERS LTD 634,420MARINE DRIVE COLLISION LTD 1,922,333MARIO’S TOWING LTD (HOPE) 487,466MARIO’S TOWING LTD (KAMLOOPS) 318,588MARIO’S TOWING LTD (KELOWNA) 1,878,936MARIO’S TOWING LTD (MERRITT) 413,797MARIO’S TOWING LTD (PRINCETON) 190,630MARK V AUTO BODY LTD 2,207,472MARK’S AUTO BODY (BBY) LTD 1,131,060MARK’S AUTO BODY LTD 2,382,235MARKS WORK WEARHOUSE 77,309MARPOLE PHYSIOTHERAPY CLINIC 60,584MARSH CANADA LIMITED 1,740,177MARSHALL CHIROPRACTIC INC 29,705MARY ANN MEEGAN INSURANCE AGENCY LTD 313,656MASKALL’S COLLISION AND GLASS 709,827MASOUMI AL DR 32,810MASRI BASSAM A DR INC 594,590MASTER AUTOBODY 362,245MASTER TOUCH AUTOBODY SERVICE LTD 229,269MASTERGLASS AUTOGLASS LTD 541,617MATEC CONSULTANTS LIMITED 25,216MATHESON COLLISION 69,679MATSON DRISCOLL & DAIMCO LTD 140,041MAXHEALTH CHIROPRACTIC INC 98,377MAXIM RENTALS & LEASING 46,942MAXIM TRUCK & TRAILER 147,380MAXIMUM COLLISION LTD 4,196,618MAXUM AUTOMOTIVE REFINISHING LTD 675,321MAXXAM INSURANCE SERVICES (BURNABY) LTD 4,979,285MAXXAM INSURANCE SERVICES INCORPORATED 1,986,317MAYFAIR INDUSTRIAL PAINTING LTD 53,117MAYFIELD CRYSTAL - MAYFIELD OT CONSULTING 49,698MAYSA VENTURES LTD 757,744MCAULEY CLAIMS SERVICES LTD 354,477MCBAIN INSURANCE AGENCY 716,843MCBURNEY’S INSURANCE AGENCY LTD 523,819MCCALLUM PHYSIOTHERAPY CLINIC 41,648MCCONNAN BION O’CONNOR & PETERSON 458,508MCCORMACK BRUCE DR 25,174MCCRINDLE LIZ DR 29,609MCCRODAN MEDIATION SERVICES 194,341MCCRODAN VISION DEVELOPMENT 64,760
SUPPLIER NAME AMOUNTS
MCDERMOTT’S BODY SHOP LTD 1,903,077MCDONALD & COMPANY 2,485,256MCELHANNEY CONSULTING SERVICES 49,673MCGRAW ROBERT W DR INC 579,987MCGREGOR BERGER & ASSOCIATES 68,932MCINTOSH HEATHER 90,571MCKAY COLIN DR 104,686MCKENZIE G M DR INC 72,531MCL MOTOR CARS 2010 54,900MCL SOLUTIONS 225,388MCLEOD AGENCIES (2002) LTD 521,416MCNEIL OCCUPATIONAL REHAB SERVICES LTD 110,821MCNEILL NAKAMOTO RECRUITMENT GROUP 109,788MCPHERSON INSURANCE AGENCIES LTD 235,847MCQUARRIE HUNTER LLP 1,643,234ME TOO CONTRACTING & TOWING 31,912MEA FORENSIC ENGINEERS & SCIENTISTS LTD 2,603,468MEAD-WESCOTT LARISSA 38,599MEADOWRIDGE COLLISION LTD 2,468,014MECANICA SCIENTIFIC SERVICES CORP 35,319MEDI VAN CANADA INC 27,225MEDICAL SERVICES PLAN 61,478,710MEDICHAIR CRANBROOK 26,491MEDICHAIR NORTHERN BC 56,275MEDICREDIT INC 41,963MEDISYS CORPORATE HEALTH LP 25,490MEGA ASSISTANCE SERVICES INC 163,396MEGA AUTO BODY LTD 72,665MEGA LEUNG COUNSELLING SERVICES 38,411MEGA TECH 55,596MEGSON FITZPATRICK INC 2,966,463MEIER TRAVIS DR 250,722MEL’S HOT RODS CUSTOM & CLASSICS 47,148MELCOR REIT LP 249,228MERANI HAFEEZ DR 55,377MERCEDES-BENZ CANADA INC (LLOYD AVE) 4,957,456MERCEDES-BENZ CANADA INC (LOUGHEED HWY) 97,785MERCEDES-BENZ CANADA INC (MARINE DR) 39,887MERCEDES-BENZ CANADA INC (RICHMOND) 55,424MERCEDES-BENZ CANADA INC (TERMINAL AVE) 49,926MERCER CANADA LIMITED 48,602MERCURY ADJUSTERS INC 569,477MERCY MEDICAL CENTER REDDING 51,861MERIDIAN INSURANCE AGENCIES LTD 705,496MERIDIAN REHABILITATION CONSULTING INC 1,784,768MERIDIAN RV MFG LTD 429,439MERRY MAIDS 29,153MERTIN CHEVROLET CADILLAC BUICK GMC LTD 3,318,688MERVYN’S THE BODY SHOP (1994) LTD 2,067,737METRO MOTORS LTD 2,124,631METRO WEST INSURANCE AGENCY LTD 2,661,540METROPOLITAN INSURANCE BROKERS LTD 582,726METROTOWN ORTHOPEDIC & SPORTS PHYSIO 42,376
Please note: ICBC changed its fiscal year-end from December 31st to March 31st and therefore, the fiscal period ending March 31, 2017 is a 15 month transitory fiscal period. The total amounts reported above represent 15 months of supplier payments for goods and services.
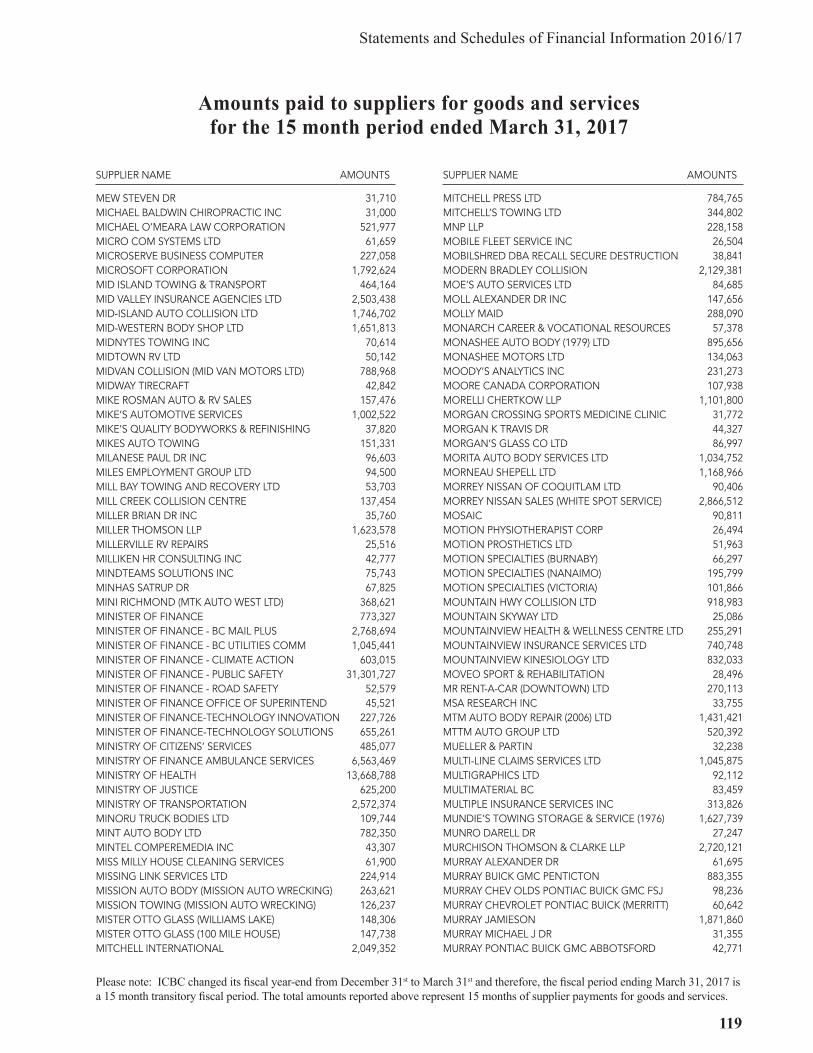
Statements and Schedules of Financial Information 2016/17
119
Amounts paid to suppliers for goods and services for the 15 month period ended March 31, 2017
SUPPLIER NAME AMOUNTS
MEW STEVEN DR 31,710MICHAEL BALDWIN CHIROPRACTIC INC 31,000MICHAEL O’MEARA LAW CORPORATION 521,977MICRO COM SYSTEMS LTD 61,659MICROSERVE BUSINESS COMPUTER 227,058MICROSOFT CORPORATION 1,792,624MID ISLAND TOWING & TRANSPORT 464,164MID VALLEY INSURANCE AGENCIES LTD 2,503,438MID-ISLAND AUTO COLLISION LTD 1,746,702MID-WESTERN BODY SHOP LTD 1,651,813MIDNYTES TOWING INC 70,614MIDTOWN RV LTD 50,142MIDVAN COLLISION (MID VAN MOTORS LTD) 788,968MIDWAY TIRECRAFT 42,842MIKE ROSMAN AUTO & RV SALES 157,476MIKE’S AUTOMOTIVE SERVICES 1,002,522MIKE’S QUALITY BODYWORKS & REFINISHING 37,820MIKES AUTO TOWING 151,331MILANESE PAUL DR INC 96,603MILES EMPLOYMENT GROUP LTD 94,500MILL BAY TOWING AND RECOVERY LTD 53,703MILL CREEK COLLISION CENTRE 137,454MILLER BRIAN DR INC 35,760MILLER THOMSON LLP 1,623,578MILLERVILLE RV REPAIRS 25,516MILLIKEN HR CONSULTING INC 42,777MINDTEAMS SOLUTIONS INC 75,743MINHAS SATRUP DR 67,825MINI RICHMOND (MTK AUTO WEST LTD) 368,621MINISTER OF FINANCE 773,327MINISTER OF FINANCE - BC MAIL PLUS 2,768,694MINISTER OF FINANCE - BC UTILITIES COMM 1,045,441MINISTER OF FINANCE - CLIMATE ACTION 603,015MINISTER OF FINANCE - PUBLIC SAFETY 31,301,727MINISTER OF FINANCE - ROAD SAFETY 52,579MINISTER OF FINANCE OFFICE OF SUPERINTEND 45,521MINISTER OF FINANCE-TECHNOLOGY INNOVATION 227,726MINISTER OF FINANCE-TECHNOLOGY SOLUTIONS 655,261MINISTRY OF CITIZENS’ SERVICES 485,077MINISTRY OF FINANCE AMBULANCE SERVICES 6,563,469MINISTRY OF HEALTH 13,668,788MINISTRY OF JUSTICE 625,200MINISTRY OF TRANSPORTATION 2,572,374MINORU TRUCK BODIES LTD 109,744MINT AUTO BODY LTD 782,350MINTEL COMPEREMEDIA INC 43,307MISS MILLY HOUSE CLEANING SERVICES 61,900MISSING LINK SERVICES LTD 224,914MISSION AUTO BODY (MISSION AUTO WRECKING) 263,621MISSION TOWING (MISSION AUTO WRECKING) 126,237MISTER OTTO GLASS (WILLIAMS LAKE) 148,306MISTER OTTO GLASS (100 MILE HOUSE) 147,738MITCHELL INTERNATIONAL 2,049,352
SUPPLIER NAME AMOUNTS
MITCHELL PRESS LTD 784,765MITCHELL’S TOWING LTD 344,802MNP LLP 228,158MOBILE FLEET SERVICE INC 26,504MOBILSHRED DBA RECALL SECURE DESTRUCTION 38,841MODERN BRADLEY COLLISION 2,129,381MOE’S AUTO SERVICES LTD 84,685MOLL ALEXANDER DR INC 147,656MOLLY MAID 288,090MONARCH CAREER & VOCATIONAL RESOURCES 57,378MONASHEE AUTO BODY (1979) LTD 895,656MONASHEE MOTORS LTD 134,063MOODY’S ANALYTICS INC 231,273MOORE CANADA CORPORATION 107,938MORELLI CHERTKOW LLP 1,101,800MORGAN CROSSING SPORTS MEDICINE CLINIC 31,772MORGAN K TRAVIS DR 44,327MORGAN’S GLASS CO LTD 86,997MORITA AUTO BODY SERVICES LTD 1,034,752MORNEAU SHEPELL LTD 1,168,966MORREY NISSAN OF COQUITLAM LTD 90,406MORREY NISSAN SALES (WHITE SPOT SERVICE) 2,866,512MOSAIC 90,811MOTION PHYSIOTHERAPIST CORP 26,494MOTION PROSTHETICS LTD 51,963MOTION SPECIALTIES (BURNABY) 66,297MOTION SPECIALTIES (NANAIMO) 195,799MOTION SPECIALTIES (VICTORIA) 101,866MOUNTAIN HWY COLLISION LTD 918,983MOUNTAIN SKYWAY LTD 25,086MOUNTAINVIEW HEALTH & WELLNESS CENTRE LTD 255,291MOUNTAINVIEW INSURANCE SERVICES LTD 740,748MOUNTAINVIEW KINESIOLOGY LTD 832,033MOVEO SPORT & REHABILITATION 28,496MR RENT-A-CAR (DOWNTOWN) LTD 270,113MSA RESEARCH INC 33,755MTM AUTO BODY REPAIR (2006) LTD 1,431,421MTTM AUTO GROUP LTD 520,392MUELLER & PARTIN 32,238MULTI-LINE CLAIMS SERVICES LTD 1,045,875MULTIGRAPHICS LTD 92,112MULTIMATERIAL BC 83,459MULTIPLE INSURANCE SERVICES INC 313,826MUNDIE’S TOWING STORAGE & SERVICE (1976) 1,627,739MUNRO DARELL DR 27,247MURCHISON THOMSON & CLARKE LLP 2,720,121MURRAY ALEXANDER DR 61,695MURRAY BUICK GMC PENTICTON 883,355MURRAY CHEV OLDS PONTIAC BUICK GMC FSJ 98,236MURRAY CHEVROLET PONTIAC BUICK (MERRITT) 60,642MURRAY JAMIESON 1,871,860MURRAY MICHAEL J DR 31,355MURRAY PONTIAC BUICK GMC ABBOTSFORD 42,771
Please note: ICBC changed its fiscal year-end from December 31st to March 31st and therefore, the fiscal period ending March 31, 2017 is a 15 month transitory fiscal period. The total amounts reported above represent 15 months of supplier payments for goods and services.

Insurance Corporation of British Columbia
120
Amounts paid to suppliers for goods and services for the 15 month period ended March 31, 2017
SUPPLIER NAME AMOUNTS
MURRICK INSURANCE SERVICES (DELTA) LTD 303,935MURRICK INSURANCE SERVICES (DOWNTOWN) LTD 940,669MURRICK INSURANCE SERVICES (KILLARNEY) 721,901MURRICK INSURANCE SERVICES (NEW WEST) LTD 696,455MURRICK INSURANCE SERVICES (OAKRIDGE) LTD 508,973MURRICK INSURANCE SERVICES (WEST END) LTD 555,462MW MOTOR WERKE INC 28,570M3 COLLISION COMPANY LIMITED 209,531NADER RAMI DR R PSYCH 35,571NADINA TRUCK SERVICE LTD 94,525NAGRA RAV DR 41,979NAHANNI TRUCK & TRAILER REPAIR 79,779NAKUSP GLASS 40,578NAMAN HOWELL SMITH & LEE 26,677NANAIMO AUTOBODY & GLASS LTD 534,096NANAIMO CHRYSLER LTD 882,280NANAIMO FOREST PRODUCTS LTD 29,832NANAIMO REALTY (NANAIMO) LTD 911,706NATIONAL CAR & TRUCK RENTAL 248,401NATIONAL CAR RENTAL 119,470NATIONAL INVESTIGATION SERVICES LTD 97,901NATIONAL TRUCK CENTRE INC 76,197NATIONWIDE INSURANCE AGENCY LTD 274,708NAUROTH & ASSOCIATES INSURANCE BROKERS 823,461NC RON’S TOWING (ACE AUTO WRECKING LTD) 808,200NECHAKO BRAKE & WHEEL LTD 35,916NEIGHBORHOOD NURSING 37,397NEIGHBOURHOOD AUTO BODY LTD 1,116,186NEIGHBOURHOOD AUTO GLASS & UPHOLSTERY LTD 230,994NEIGHBOURHOOD INSURANCE BROKER INC 182,230NELSON’S GLASS LTD 203,648NEMTIN CONSULTANTS LTD 28,738NENO’S PAINT & BODY LTD 891,808NEOPOST CANADA LTD 34,657NETSCOUT SYSTEMS INC 33,173NEUFELD WILLIAM DR 65,456NEURO-ABILITY REHABILITATION SERVICES 56,665NEW BILLA AUTOBODY 2008 LTD 1,541,594NEW DIAMOND INSURANCE SERVICES LTD 465,747NEW PLANET COLLISION LTD 814,085NEW PROFESSION COLLISION LTD 1,276,675NEW PROFESSION SVA COLLISION LTD 2,679,675NEW TECHNOLOGY COLLISION 1,475,570NEW WEST AUTO METAL INC 1,917,158NEW WEST COLLISION INC 2,174,026NEW WORLD INSURANCE SERVICES LIMITED 693,199NEWTON INSURANCE SERVICES INC 934,120NEWTON WHALLEY HIWAY TAXI LTD 98,562NICE SYSTEMS CANADA LTD 1,263,251NICHOLS ENVIRONMENTAL (CANADA) LTD 635,958NICK’S AUTO BODY LTD 2,197,375NICKERSON BROS 55,722NIELSEN ROBERT G DR CHIROPRAC 30,519
SUPPLIER NAME AMOUNTS
NIKKEL MARK DR 52,215NILAN JOHNSON LEWIS PA 37,417NISQUALLY TOWING 30,787NIXON O’BRIEN 25,231NK AUTOMOTIVE TRUCK & DIESEL 29,738NO 1 COLLISION (1993) INC (LOUGHEED HWY) 7,309,352NO 1 COLLISION (1993) INC (RICHMOND) 12,075,167NO 1 COLLISION (1993) INC (3RD AVE-VANC) 6,937,676NO 229 SAIL VIEW VENTURES LTD 121,505NOR-DEL GLASS LTD 242,506NOR-MAR INDUSTRIES LTD 35,159NORA CHAMBERS INC 45,020NORGATE AUTO BODY LTD 3,001,282NORM’S AUTO REFINISHING LTD 1,954,765NORTECH WELDING & FABRICATING 26,947NORTH COAST COLLISION LTD 690,657NORTH ISLAND GLASS 2012 LTD 81,488NORTH LINE COLLISION LTD 1,175,134NORTH PACIFIC WINDOW & GLASS LTD 106,605NORTH RIVER TOWING (2004) LTD 42,434NORTH SHORE LAW LLP 1,126,085NORTH SHORE RV CENTRE LTD 59,057NORTH SHORE TAXI (1966) LTD 46,128NORTH STAR BODY SHOP 2,488,985NORTHERN ALUMINUM TANK SERVICE (1999) LTD 193,428NORTHERN GLASS & CONTRACTING 161,753NORTHERN GLASS AND DOORS LTD 135,507NORTHERN HEALTH AUTHORITY 35,373NORTHERN HOME CARE 68,981NORTHERN SAVINGS INSURANCE SERVICES LTD 1,674,971NORTHLAND CHRYSLER JEEP DODGE 88,817NORTHLAND HYUNDAI 60,942NORTHLAND NISSAN 129,364NORTHSIDE INJURY REHABILITATION LTD 60,172NORTHSTAR BIOKINETICS INC 25,446NORTHVIEW INSURANCE BROKERS INC 320,844NORTHWAY GLASS INC 89,477NOVACOAST INC 72,681NOVUS GLASS (WHITE ROCK GLASS) 262,318NOVUS LANGLEY (WHITE ROCK GLASS) 97,352NR MOTORS LTD 87,814NRC ENVIRONMENTAL SERVICES INC 38,158NRG RESEARCH GROUP INC 1,468,405NUCOR ENVIRONMENTAL SOLUTIONS 105,765NURSE NEXT DOOR (DUNCAN) 52,585NURSE NEXT DOOR (MAPLE RIDGE) 107,889NURSE NEXT DOOR (NORTH SHORE) 233,240NURSE NEXT DOOR (PENTICTON) 119,803NURSE NEXT DOOR (VANCOUVER) 72,105NURSE NEXT DOOR (VERNON) 52,628NUSS TRUCK & EQUIPMENT PAINT 31,273NUTHALL ADJUSTERS 186,580NYRC (NORTH YORK REHABILITATION CENTRE) 5,808,532
Please note: ICBC changed its fiscal year-end from December 31st to March 31st and therefore, the fiscal period ending March 31, 2017 is a 15 month transitory fiscal period. The total amounts reported above represent 15 months of supplier payments for goods and services.

Statements and Schedules of Financial Information 2016/17
121
Amounts paid to suppliers for goods and services for the 15 month period ended March 31, 2017
SUPPLIER NAME AMOUNTS
O’BRIEN’S SERVICE & REPAIRS LTD 65,120O’CONNOR COLLISION & TOWING 2,436,752O’CONNOR DODGE CHRYSLER JEEP 78,734O’CONNOR RV CENTRE LTD 287,850O’SHAUGHNESSY ROY DR INC 405,058OAKRIDGE PHYSIOTHERAPY 47,820OAKWEST INSURANCE AGENCIES LTD 888,215OASIS PHYSIOTHERAPY MISSION 75,676OASIS REHABILITATION LTD 79,912OCEAN TRAILER (C KEAY INVESTMENTS LTD) 1,144,955OCEANSIDE PHYSIO & WORK CONDITIONING 29,503OCEANSIDE TAXI 27,400OCEANVIEW HOME CARE SERVICES 178,752OCHOA JOSE L DR 44,757ODGERS BERNDSTON CANDAD INC 50,663OK REGION TOWING 48,024OK TIRE 37,392OKANAGAN CHRYSLER JEEP DODGE 53,285OKANAGAN GLASS LTD 49,512OKANAGAN ORAL & MAXILLOFACIAL SURGERY 32,513OKANAGAN VALLEY INSURANCE SERVICES LTD 1,064,613OKANAGAN VISION THERAPY 32,725OKAPED 25,729OLIVER & CO 224,772OLYMPIC INS SERVICES LTD DBA SEAFIRST 206,912OMEGA AUTOBODY INC 851,703OMINECA GLASS SERVICES (2012) LTD 154,452OMNICARE FOR PEOPLE AT HOME 107,939ON CALL TOWING & TRAFFIC CONTROL 132,400ON LINE COLLISION LTD 2,800,924ON SIDE RESTORATION SERVICES LTD 50,036ON TIME AUTO BODY LTD 143,261ONESTOP AUTOGLASS LTD 110,494ONISON CANADA CORPORATION 25,200ONROUTE TOWING & HEAVY RECOVERY 55,719ONSITE AUTO GLASS 200,250OPEN TEXT CORPORATION 979,316OPENROAD RICHMOND AUTO BODY-LANGLEY 5,564,181OPERATION RED NOSE 55,000OPTIMAL RECOVERY PHYSIOTHERAPY CLINIC 78,446OPTIMUM THERAPY REHABILITATION SERVICES 158,867OPTUM HEALTH SERVICES (CANADA) 165,105ORACLE CANADA ULC 2,285,544ORCHARD FORD SALES LTD 66,362ORIGIN AUTO SERVICES LTD 133,077ORION HEALTH - NEW WESTMINSTER 283,433ORION HEALTH SERVICES INC 833,534ORKIN CANADA CORPORATION 50,727ORTHO DESIGN INC 26,210ORTHOMED TECHNOLOGY INC 43,963OSBORNE CHIROPRACTIC 32,781OT CONSULTING/TREATMENT SERVICES LTD 208,339OT WORKS LTD 883,487
SUPPLIER NAME AMOUNTS
OTTER POINT COLLISION LTD 346,730OTTO & ASSOCIATES INSURANCE AGENCY LTD 136,559OTTO AUTO SERVICE LTD 153,757OUEST BUSINESS SOLUTIONS INC 201,600OUIMET PAUL DR 33,142OUR GLASS SHOP 125,780OVERSEAS AUTO BODY (NEWTON) INC 431,813OVERSEAS AUTO BODY (1989) INC 3,709,253OVERSEAS AUTO BODY (2010) LTD 2,378,380OZA PRIYANKA 32,718P & C STEINBERG MEDICAL CORP 66,496P & H SUPPLIES LTD 191,013P & R TRUCK CENTRE LTD 61,860P G KLASSIC AUTOBODY LTD 3,713,295P J COLLISION LTD 1,418,562PACIFIC CABS 90,223PACIFIC CHEVROLET BUICK GMC LTD 595,055PACIFIC COAST HEAVY TRUCK GROUP 32,958PACIFIC COAST INSURANCE BROKERS INC 1,350,342PACIFIC COAST RECOVERY CARE 26,278PACIFIC HONDA 32,276PACIFIC INSURANCE AGENCIES LTD 220,158PACIFIC LAW GROUP 5,876,154PACIFIC PLACE INSURANCE SERVICES INC 474,801PACIFIC TRUCK & EQUIPMENT INC 154,144PADILLA JULIO R DR 68,683PAI HOWARD 153,807PAINE EDMONDS 291,713PAINT’EN PLACE INC 66,375PAINTS BEYOND AUTO BODY VANCOUVER LTD 195,729PALADIN SECURITY GROUP LTD 1,775,798PANNU JASMINDER DR 152,240PANORAMA OPTOMETRY 53,095PANORAMA PHYSIOTHERAPY & SPORTS CLINIC 133,460PANTHER GLASS & UPHOLSTERY 135,364PARAGON COLLISION REPAIRS LTD 1,135,670PARAMONOFF CATHERINE DR INC 42,525PARAMOUNT AUTO BODY LTD 1,717,644PARK GEORGIA INSURANCE AGENCIES (2014) 2,878,898PARK GEORGIA INSURANCE AGENCIES LTD 597,213PARK INSURANCE AGENCY LTD 804,814PARK PLACE SENIORS LIVING 38,341PARK SAE WHAN DR 174,017PARK SHORE MOTORS LTD 61,889PARKER’S CHRYSLER DODGE JEEP LTD 1,080,333PARKERS AUTO BODY AND PAINT LTD 2,959,221PARKSVILLE CHRYSLER LTD 1,126,006PARKSVILLE TOWING 38,095PARKWAY CREW INC (THE) 32,846PARKWAY PHYSIOTHERAPY AND PERFORMANCE 89,131PATHWAY RESOURCES LTD 225,444PATTON SHEILA DR 88,520PAUL’S AUTO BODY LTD 1,992,739
Please note: ICBC changed its fiscal year-end from December 31st to March 31st and therefore, the fiscal period ending March 31, 2017 is a 15 month transitory fiscal period. The total amounts reported above represent 15 months of supplier payments for goods and services.
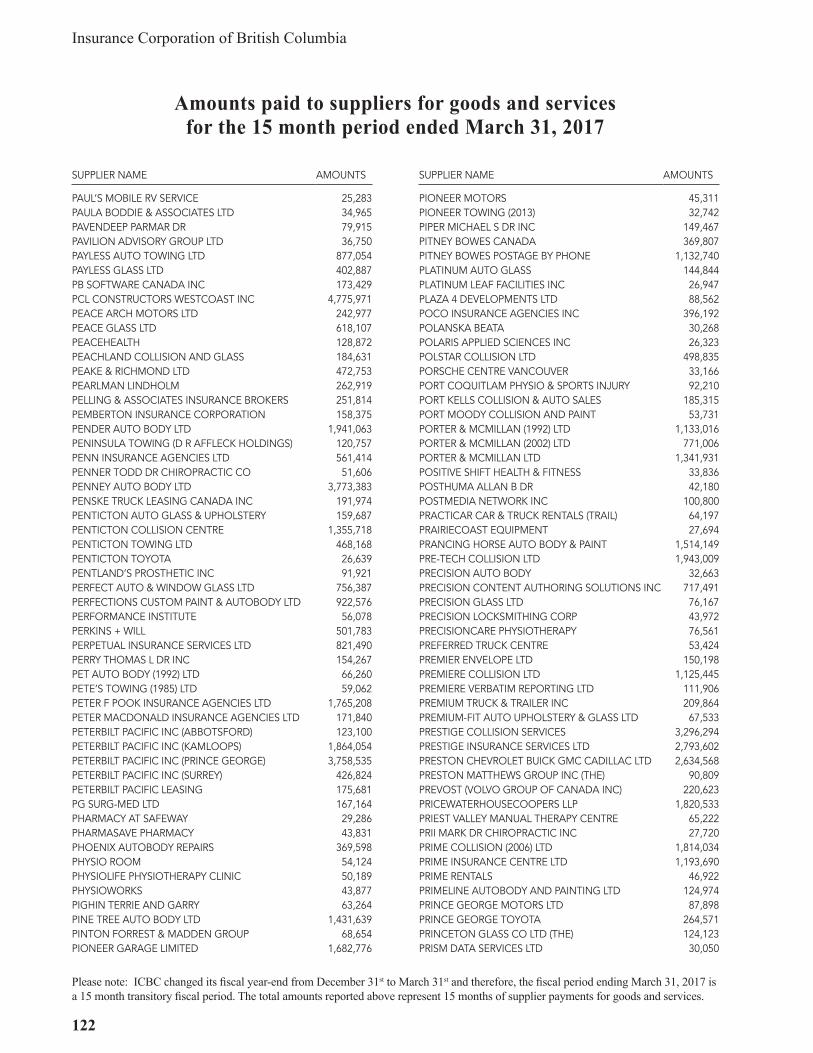
Insurance Corporation of British Columbia
122
Amounts paid to suppliers for goods and services for the 15 month period ended March 31, 2017
SUPPLIER NAME AMOUNTS
PAUL’S MOBILE RV SERVICE 25,283PAULA BODDIE & ASSOCIATES LTD 34,965PAVENDEEP PARMAR DR 79,915PAVILION ADVISORY GROUP LTD 36,750PAYLESS AUTO TOWING LTD 877,054PAYLESS GLASS LTD 402,887PB SOFTWARE CANADA INC 173,429PCL CONSTRUCTORS WESTCOAST INC 4,775,971PEACE ARCH MOTORS LTD 242,977PEACE GLASS LTD 618,107PEACEHEALTH 128,872PEACHLAND COLLISION AND GLASS 184,631PEAKE & RICHMOND LTD 472,753PEARLMAN LINDHOLM 262,919PELLING & ASSOCIATES INSURANCE BROKERS 251,814PEMBERTON INSURANCE CORPORATION 158,375PENDER AUTO BODY LTD 1,941,063PENINSULA TOWING (D R AFFLECK HOLDINGS) 120,757PENN INSURANCE AGENCIES LTD 561,414PENNER TODD DR CHIROPRACTIC CO 51,606PENNEY AUTO BODY LTD 3,773,383PENSKE TRUCK LEASING CANADA INC 191,974PENTICTON AUTO GLASS & UPHOLSTERY 159,687PENTICTON COLLISION CENTRE 1,355,718PENTICTON TOWING LTD 468,168PENTICTON TOYOTA 26,639PENTLAND’S PROSTHETIC INC 91,921PERFECT AUTO & WINDOW GLASS LTD 756,387PERFECTIONS CUSTOM PAINT & AUTOBODY LTD 922,576PERFORMANCE INSTITUTE 56,078PERKINS + WILL 501,783PERPETUAL INSURANCE SERVICES LTD 821,490PERRY THOMAS L DR INC 154,267PET AUTO BODY (1992) LTD 66,260PETE’S TOWING (1985) LTD 59,062PETER F POOK INSURANCE AGENCIES LTD 1,765,208PETER MACDONALD INSURANCE AGENCIES LTD 171,840PETERBILT PACIFIC INC (ABBOTSFORD) 123,100PETERBILT PACIFIC INC (KAMLOOPS) 1,864,054PETERBILT PACIFIC INC (PRINCE GEORGE) 3,758,535PETERBILT PACIFIC INC (SURREY) 426,824PETERBILT PACIFIC LEASING 175,681PG SURG-MED LTD 167,164PHARMACY AT SAFEWAY 29,286PHARMASAVE PHARMACY 43,831PHOENIX AUTOBODY REPAIRS 369,598PHYSIO ROOM 54,124PHYSIOLIFE PHYSIOTHERAPY CLINIC 50,189PHYSIOWORKS 43,877PIGHIN TERRIE AND GARRY 63,264PINE TREE AUTO BODY LTD 1,431,639PINTON FORREST & MADDEN GROUP 68,654PIONEER GARAGE LIMITED 1,682,776
SUPPLIER NAME AMOUNTS
PIONEER MOTORS 45,311PIONEER TOWING (2013) 32,742PIPER MICHAEL S DR INC 149,467PITNEY BOWES CANADA 369,807PITNEY BOWES POSTAGE BY PHONE 1,132,740PLATINUM AUTO GLASS 144,844PLATINUM LEAF FACILITIES INC 26,947PLAZA 4 DEVELOPMENTS LTD 88,562POCO INSURANCE AGENCIES INC 396,192POLANSKA BEATA 30,268POLARIS APPLIED SCIENCES INC 26,323POLSTAR COLLISION LTD 498,835PORSCHE CENTRE VANCOUVER 33,166PORT COQUITLAM PHYSIO & SPORTS INJURY 92,210PORT KELLS COLLISION & AUTO SALES 185,315PORT MOODY COLLISION AND PAINT 53,731PORTER & MCMILLAN (1992) LTD 1,133,016PORTER & MCMILLAN (2002) LTD 771,006PORTER & MCMILLAN LTD 1,341,931POSITIVE SHIFT HEALTH & FITNESS 33,836POSTHUMA ALLAN B DR 42,180POSTMEDIA NETWORK INC 100,800PRACTICAR CAR & TRUCK RENTALS (TRAIL) 64,197PRAIRIECOAST EQUIPMENT 27,694PRANCING HORSE AUTO BODY & PAINT 1,514,149PRE-TECH COLLISION LTD 1,943,009PRECISION AUTO BODY 32,663PRECISION CONTENT AUTHORING SOLUTIONS INC 717,491PRECISION GLASS LTD 76,167PRECISION LOCKSMITHING CORP 43,972PRECISIONCARE PHYSIOTHERAPY 76,561PREFERRED TRUCK CENTRE 53,424PREMIER ENVELOPE LTD 150,198PREMIERE COLLISION LTD 1,125,445PREMIERE VERBATIM REPORTING LTD 111,906PREMIUM TRUCK & TRAILER INC 209,864PREMIUM-FIT AUTO UPHOLSTERY & GLASS LTD 67,533PRESTIGE COLLISION SERVICES 3,296,294PRESTIGE INSURANCE SERVICES LTD 2,793,602PRESTON CHEVROLET BUICK GMC CADILLAC LTD 2,634,568PRESTON MATTHEWS GROUP INC (THE) 90,809PREVOST (VOLVO GROUP OF CANADA INC) 220,623PRICEWATERHOUSECOOPERS LLP 1,820,533PRIEST VALLEY MANUAL THERAPY CENTRE 65,222PRII MARK DR CHIROPRACTIC INC 27,720PRIME COLLISION (2006) LTD 1,814,034PRIME INSURANCE CENTRE LTD 1,193,690PRIME RENTALS 46,922PRIMELINE AUTOBODY AND PAINTING LTD 124,974PRINCE GEORGE MOTORS LTD 87,898PRINCE GEORGE TOYOTA 264,571PRINCETON GLASS CO LTD (THE) 124,123PRISM DATA SERVICES LTD 30,050
Please note: ICBC changed its fiscal year-end from December 31st to March 31st and therefore, the fiscal period ending March 31, 2017 is a 15 month transitory fiscal period. The total amounts reported above represent 15 months of supplier payments for goods and services.

Statements and Schedules of Financial Information 2016/17
123
Amounts paid to suppliers for goods and services for the 15 month period ended March 31, 2017
SUPPLIER NAME AMOUNTS
PRISM TOWING 89,339PRO BODY SHOP (1998) LTD 1,809,637PRO MOTION PHYSIOTHERAPY & SPORTS INJURY 45,874PRO TOW (349932 BC LTD) 169,493PRO-TECH COLLISION CENTRE 994,293PRO-TECH COLLISION LTD 1,251,371PRO-VISION INSURANCE BROKERS LTD 393,841PRO-WIDE GLASS INC 254,517PROACTIVE FITNESS LTD 26,146PROBE INVESTIGATORS & SECURITY CONSULTANT 232,200PROFIRE EMERGENCY EQUIPMENT INC 188,290PROGRESS MARKETING INC 38,917PROGRESS SOFTWARE CORPORATION 38,983PROGRESSIVE INSURANCE SERVICES LTD 544,294PROGRESSIVE REHAB INC 183,617PROGRESSIVE WASTE SOLUTIONS CANADA 38,337PROLINE COLLISION LTD 444,076PROLINE GLASS LTD 36,782PROMONTORY DENTAL CENTRE & ASSOCIATES 27,170PRONTO AUTO GLASS 194,550PRONTO TOWING LTD 199,532PROSPECT PARK AUTOBODY LTD 1,506,486PROTRUCK COLLISION & FRAME REPAIR 383,866PROUT ALISTER J E DR INC 270,690PROVIDENCE AIR AMBULANCE LTD 25,083PROVIDENCE HEALTH CARE 46,776PROVIDENCE SACRED HEART 61,735PROVINCE OF BC (BC ONLINE) 1,233,441PROVINCE OF BC (EXCESS OPTIONAL TRANSFER) 138,118,000PROVINCE OF BC (MVB FEES) 685,591,936PROVINCE OF BC (MVB FINES) 53,573,728PROVINCE OF BC (PREMIUM TAX) 287,926,602PROVINCE OF BC (SST/PST) 225,505,313PRYKE LAMBERT LEATHLEY RUSSELL LLP 2,117,244PT HEALTH BC CORP 206,789PUBLIC SERVICE PENSION PLAN 727,484PULLMER LEWIS DR INC 35,645PUPPET LABS INC 259,550PUREWAL MANVIR, PHYSIOTHERAPIST 171,360PUROLATOR INC 1,026,122PURTZKI JACQUELINE DR 26,840PUSHAP AUTO BODY & INTERIOR REPAIR LTD 25,636QA CENTRIC SOLUTIONS INC 1,115,948QA LAW 9,096,025QED FINANCIAL SYSTEMS INC 63,451QMATIC CANADA LTD 148,651QUALICARE SOUTH ISLAND 28,222QUALITEK COLLISION LTD 813,368QUALITY CHOICE AUTO & TRUCK COLLISION 222,627QUALITY FIRST COLLISION REPAIRS 2013 LTD 544,390QUALITY GLASS LTD 156,011QUANTUM MURRAY LP 262,485QUARTECH SYSTEMS LTD 6,417,136
SUPPLIER NAME AMOUNTS
QUEENSWAY AUTO BODY 1,089,715QUESNEL TOWING LTD 342,188QUESNEL TOYOTA 92,049QUIRING MOTORS (1994) LTD 204,416QV INVESTORS INC 816,434R & S AUTO BODY (1990) LTD 1,317,144R I SMITH HOLDINGS LTD 224,566R LAMBA FORENSIC PSYCHIATRIC SERVICES LTD 107,952R S REHAB SOLUTIONS INC 441,699RACE & COMPANY 3,097,089RAE-TECH FIRE INVESTIGATIONS LTD 37,365RAGS TO RICHES TOP SHOP 43,711RAINBOW GLASS 195,218RAINBOW INSURANCE AGENCY LTD 154,602RAJA TRAILER & EQUIPMENT SALES 30,407RALLY SOFTWARE 89,135RAM ENVIRONMENTAL RESPONSE LTD 1,056,403RAM’S AUTOBODY LTD 27,202RAMP BODY & FENDER WORKS LTD 683,000RAND & FOWLER INSURANCE AGENCIES INC 376,724RAND & FOWLER INSURANCE COQUITLAM LTD 4,883,300RAND & FOWLER INSURANCE LTD 4,312,012RAND & FOWLER INSURANCE SERVICES LTD 2,385,710RANDHAWA ROBIN K DR 39,520RANDSTAD TECHNOLOGIES 86,370RANJBAR SHERVIN DR 110,939RAPID AUTO GLASS LTD 1,248,189RAPID AUTOBODY LTD 64,837RAY CAM COMMUNITY ASSOCIATION 30,000RAY F CHIN INDEPENDENT ADJUSTER 315,773RAY WONG INSURANCE SERVICES LTD 403,800RAYDAR AUTOBODY LTD 2,098,680RBC INVESTOR SERVICES TRUST 77,516RBS COLLISION REPAIRS LIMITED 438,744RCU INSURANCE SERVICES LTD 540,646RDH BUILDING SCIENCE INC 94,535RE DEV RA HOLDINGS LTD 42,959RE FUNCTION HEALTH GROUP INC 90,144REACTIVE RECOVERY INC 44,898REAL INSURANCE SOLUTIONS INC 1,695,667REBALANCEMD 68,228RECEIVER GENERAL FOR CANADA 7,983,730REDFLEX TRAFFIC SYSTEMS (CANADA) LTD 1,800,830REDSTONE ENTERPRISES LTD 199,098REEBYE N K DR INC 56,935REEBYE R N DR INC 36,726REED LORI 138,575REES PETER M DR LTD 351,087REFLECTIONS TRUCK BODY REPAIR LTD 6,400,618REGAL COLLISION LTD 77,116REGAN WILLIAM D DR 110,323REGENCY CHRYSLER 26,778REGENCY LEXUS VANCOUVER 32,400
Please note: ICBC changed its fiscal year-end from December 31st to March 31st and therefore, the fiscal period ending March 31, 2017 is a 15 month transitory fiscal period. The total amounts reported above represent 15 months of supplier payments for goods and services.
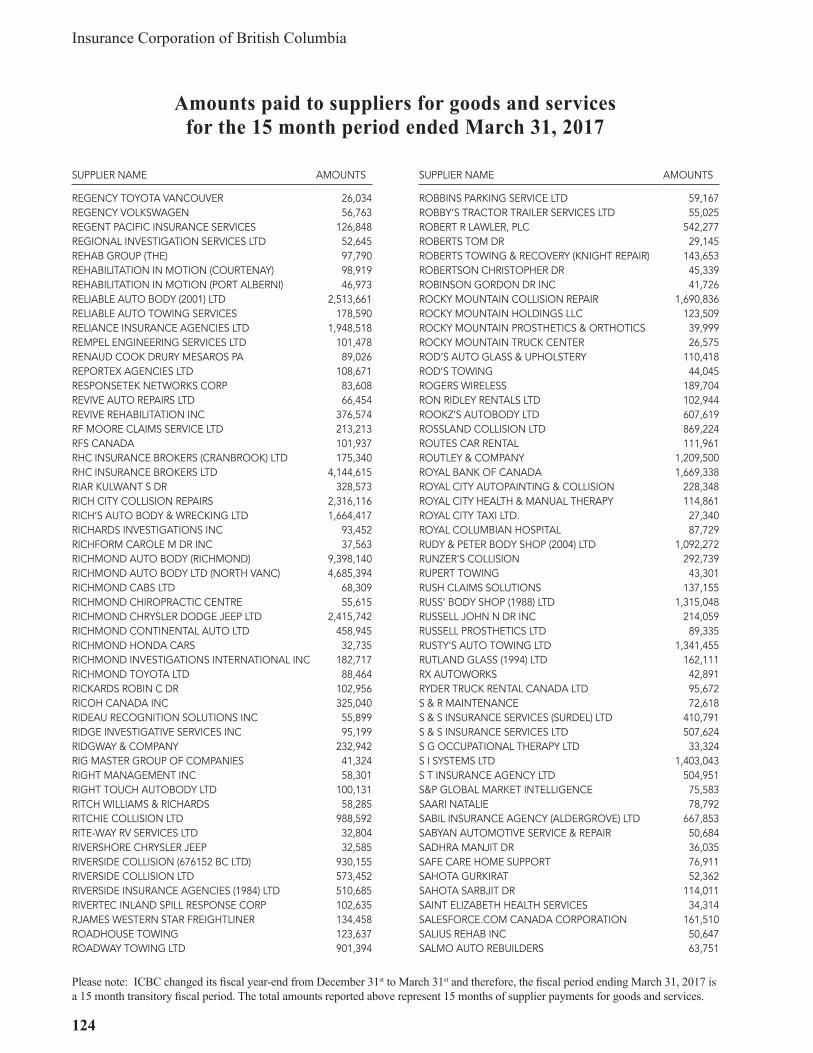
Insurance Corporation of British Columbia
124
Amounts paid to suppliers for goods and services for the 15 month period ended March 31, 2017
SUPPLIER NAME AMOUNTS
REGENCY TOYOTA VANCOUVER 26,034REGENCY VOLKSWAGEN 56,763REGENT PACIFIC INSURANCE SERVICES 126,848REGIONAL INVESTIGATION SERVICES LTD 52,645REHAB GROUP (THE) 97,790REHABILITATION IN MOTION (COURTENAY) 98,919REHABILITATION IN MOTION (PORT ALBERNI) 46,973RELIABLE AUTO BODY (2001) LTD 2,513,661RELIABLE AUTO TOWING SERVICES 178,590RELIANCE INSURANCE AGENCIES LTD 1,948,518REMPEL ENGINEERING SERVICES LTD 101,478RENAUD COOK DRURY MESAROS PA 89,026REPORTEX AGENCIES LTD 108,671RESPONSETEK NETWORKS CORP 83,608REVIVE AUTO REPAIRS LTD 66,454REVIVE REHABILITATION INC 376,574RF MOORE CLAIMS SERVICE LTD 213,213RFS CANADA 101,937RHC INSURANCE BROKERS (CRANBROOK) LTD 175,340RHC INSURANCE BROKERS LTD 4,144,615RIAR KULWANT S DR 328,573RICH CITY COLLISION REPAIRS 2,316,116RICH’S AUTO BODY & WRECKING LTD 1,664,417RICHARDS INVESTIGATIONS INC 93,452RICHFORM CAROLE M DR INC 37,563RICHMOND AUTO BODY (RICHMOND) 9,398,140RICHMOND AUTO BODY LTD (NORTH VANC) 4,685,394RICHMOND CABS LTD 68,309RICHMOND CHIROPRACTIC CENTRE 55,615RICHMOND CHRYSLER DODGE JEEP LTD 2,415,742RICHMOND CONTINENTAL AUTO LTD 458,945RICHMOND HONDA CARS 32,735RICHMOND INVESTIGATIONS INTERNATIONAL INC 182,717RICHMOND TOYOTA LTD 88,464RICKARDS ROBIN C DR 102,956RICOH CANADA INC 325,040RIDEAU RECOGNITION SOLUTIONS INC 55,899RIDGE INVESTIGATIVE SERVICES INC 95,199RIDGWAY & COMPANY 232,942RIG MASTER GROUP OF COMPANIES 41,324RIGHT MANAGEMENT INC 58,301RIGHT TOUCH AUTOBODY LTD 100,131RITCH WILLIAMS & RICHARDS 58,285RITCHIE COLLISION LTD 988,592RITE-WAY RV SERVICES LTD 32,804RIVERSHORE CHRYSLER JEEP 32,585RIVERSIDE COLLISION (676152 BC LTD) 930,155RIVERSIDE COLLISION LTD 573,452RIVERSIDE INSURANCE AGENCIES (1984) LTD 510,685RIVERTEC INLAND SPILL RESPONSE CORP 102,635RJAMES WESTERN STAR FREIGHTLINER 134,458ROADHOUSE TOWING 123,637ROADWAY TOWING LTD 901,394
SUPPLIER NAME AMOUNTS
ROBBINS PARKING SERVICE LTD 59,167ROBBY’S TRACTOR TRAILER SERVICES LTD 55,025ROBERT R LAWLER, PLC 542,277ROBERTS TOM DR 29,145ROBERTS TOWING & RECOVERY (KNIGHT REPAIR) 143,653ROBERTSON CHRISTOPHER DR 45,339ROBINSON GORDON DR INC 41,726ROCKY MOUNTAIN COLLISION REPAIR 1,690,836ROCKY MOUNTAIN HOLDINGS LLC 123,509ROCKY MOUNTAIN PROSTHETICS & ORTHOTICS 39,999ROCKY MOUNTAIN TRUCK CENTER 26,575ROD’S AUTO GLASS & UPHOLSTERY 110,418ROD’S TOWING 44,045ROGERS WIRELESS 189,704RON RIDLEY RENTALS LTD 102,944ROOKZ’S AUTOBODY LTD 607,619ROSSLAND COLLISION LTD 869,224ROUTES CAR RENTAL 111,961ROUTLEY & COMPANY 1,209,500ROYAL BANK OF CANADA 1,669,338ROYAL CITY AUTOPAINTING & COLLISION 228,348ROYAL CITY HEALTH & MANUAL THERAPY 114,861ROYAL CITY TAXI LTD. 27,340ROYAL COLUMBIAN HOSPITAL 87,729RUDY & PETER BODY SHOP (2004) LTD 1,092,272RUNZER’S COLLISION 292,739RUPERT TOWING 43,301RUSH CLAIMS SOLUTIONS 137,155RUSS’ BODY SHOP (1988) LTD 1,315,048RUSSELL JOHN N DR INC 214,059RUSSELL PROSTHETICS LTD 89,335RUSTY’S AUTO TOWING LTD 1,341,455RUTLAND GLASS (1994) LTD 162,111RX AUTOWORKS 42,891RYDER TRUCK RENTAL CANADA LTD 95,672S & R MAINTENANCE 72,618S & S INSURANCE SERVICES (SURDEL) LTD 410,791S & S INSURANCE SERVICES LTD 507,624S G OCCUPATIONAL THERAPY LTD 33,324S I SYSTEMS LTD 1,403,043S T INSURANCE AGENCY LTD 504,951S&P GLOBAL MARKET INTELLIGENCE 75,583SAARI NATALIE 78,792SABIL INSURANCE AGENCY (ALDERGROVE) LTD 667,853SABYAN AUTOMOTIVE SERVICE & REPAIR 50,684SADHRA MANJIT DR 36,035SAFE CARE HOME SUPPORT 76,911SAHOTA GURKIRAT 52,362SAHOTA SARBJIT DR 114,011SAINT ELIZABETH HEALTH SERVICES 34,314SALESFORCE.COM CANADA CORPORATION 161,510SALIUS REHAB INC 50,647SALMO AUTO REBUILDERS 63,751
Please note: ICBC changed its fiscal year-end from December 31st to March 31st and therefore, the fiscal period ending March 31, 2017 is a 15 month transitory fiscal period. The total amounts reported above represent 15 months of supplier payments for goods and services.
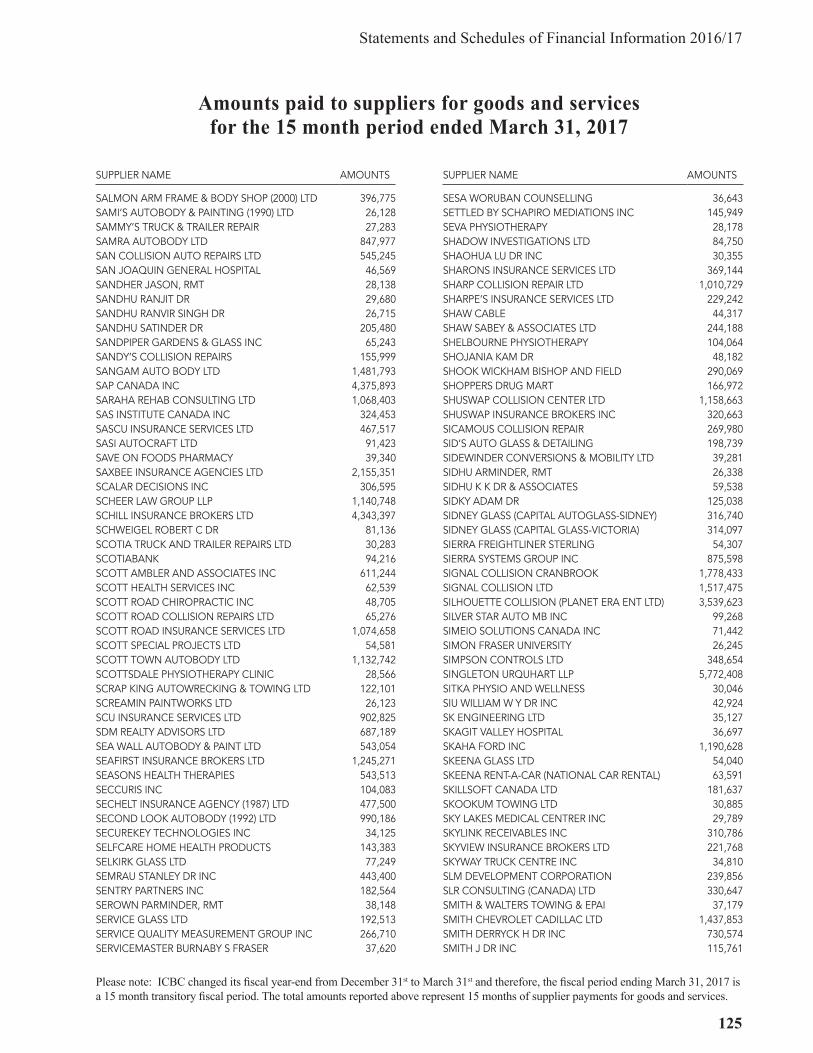
Statements and Schedules of Financial Information 2016/17
125
Amounts paid to suppliers for goods and services for the 15 month period ended March 31, 2017
SUPPLIER NAME AMOUNTS
SALMON ARM FRAME & BODY SHOP (2000) LTD 396,775SAMI’S AUTOBODY & PAINTING (1990) LTD 26,128SAMMY’S TRUCK & TRAILER REPAIR 27,283SAMRA AUTOBODY LTD 847,977SAN COLLISION AUTO REPAIRS LTD 545,245SAN JOAQUIN GENERAL HOSPITAL 46,569SANDHER JASON, RMT 28,138SANDHU RANJIT DR 29,680SANDHU RANVIR SINGH DR 26,715SANDHU SATINDER DR 205,480SANDPIPER GARDENS & GLASS INC 65,243SANDY’S COLLISION REPAIRS 155,999SANGAM AUTO BODY LTD 1,481,793SAP CANADA INC 4,375,893SARAHA REHAB CONSULTING LTD 1,068,403SAS INSTITUTE CANADA INC 324,453SASCU INSURANCE SERVICES LTD 467,517SASI AUTOCRAFT LTD 91,423SAVE ON FOODS PHARMACY 39,340SAXBEE INSURANCE AGENCIES LTD 2,155,351SCALAR DECISIONS INC 306,595SCHEER LAW GROUP LLP 1,140,748SCHILL INSURANCE BROKERS LTD 4,343,397SCHWEIGEL ROBERT C DR 81,136SCOTIA TRUCK AND TRAILER REPAIRS LTD 30,283SCOTIABANK 94,216SCOTT AMBLER AND ASSOCIATES INC 611,244SCOTT HEALTH SERVICES INC 62,539SCOTT ROAD CHIROPRACTIC INC 48,705SCOTT ROAD COLLISION REPAIRS LTD 65,276SCOTT ROAD INSURANCE SERVICES LTD 1,074,658SCOTT SPECIAL PROJECTS LTD 54,581SCOTT TOWN AUTOBODY LTD 1,132,742SCOTTSDALE PHYSIOTHERAPY CLINIC 28,566SCRAP KING AUTOWRECKING & TOWING LTD 122,101SCREAMIN PAINTWORKS LTD 26,123SCU INSURANCE SERVICES LTD 902,825SDM REALTY ADVISORS LTD 687,189SEA WALL AUTOBODY & PAINT LTD 543,054SEAFIRST INSURANCE BROKERS LTD 1,245,271SEASONS HEALTH THERAPIES 543,513SECCURIS INC 104,083SECHELT INSURANCE AGENCY (1987) LTD 477,500SECOND LOOK AUTOBODY (1992) LTD 990,186SECUREKEY TECHNOLOGIES INC 34,125SELFCARE HOME HEALTH PRODUCTS 143,383SELKIRK GLASS LTD 77,249SEMRAU STANLEY DR INC 443,400SENTRY PARTNERS INC 182,564SEROWN PARMINDER, RMT 38,148SERVICE GLASS LTD 192,513SERVICE QUALITY MEASUREMENT GROUP INC 266,710SERVICEMASTER BURNABY S FRASER 37,620
SUPPLIER NAME AMOUNTS
SESA WORUBAN COUNSELLING 36,643SETTLED BY SCHAPIRO MEDIATIONS INC 145,949SEVA PHYSIOTHERAPY 28,178SHADOW INVESTIGATIONS LTD 84,750SHAOHUA LU DR INC 30,355SHARONS INSURANCE SERVICES LTD 369,144SHARP COLLISION REPAIR LTD 1,010,729SHARPE’S INSURANCE SERVICES LTD 229,242SHAW CABLE 44,317SHAW SABEY & ASSOCIATES LTD 244,188SHELBOURNE PHYSIOTHERAPY 104,064SHOJANIA KAM DR 48,182SHOOK WICKHAM BISHOP AND FIELD 290,069SHOPPERS DRUG MART 166,972SHUSWAP COLLISION CENTER LTD 1,158,663SHUSWAP INSURANCE BROKERS INC 320,663SICAMOUS COLLISION REPAIR 269,980SID’S AUTO GLASS & DETAILING 198,739SIDEWINDER CONVERSIONS & MOBILITY LTD 39,281SIDHU ARMINDER, RMT 26,338SIDHU K K DR & ASSOCIATES 59,538SIDKY ADAM DR 125,038SIDNEY GLASS (CAPITAL AUTOGLASS-SIDNEY) 316,740SIDNEY GLASS (CAPITAL GLASS-VICTORIA) 314,097SIERRA FREIGHTLINER STERLING 54,307SIERRA SYSTEMS GROUP INC 875,598SIGNAL COLLISION CRANBROOK 1,778,433SIGNAL COLLISION LTD 1,517,475SILHOUETTE COLLISION (PLANET ERA ENT LTD) 3,539,623SILVER STAR AUTO MB INC 99,268SIMEIO SOLUTIONS CANADA INC 71,442SIMON FRASER UNIVERSITY 26,245SIMPSON CONTROLS LTD 348,654SINGLETON URQUHART LLP 5,772,408SITKA PHYSIO AND WELLNESS 30,046SIU WILLIAM W Y DR INC 42,924SK ENGINEERING LTD 35,127SKAGIT VALLEY HOSPITAL 36,697SKAHA FORD INC 1,190,628SKEENA GLASS LTD 54,040SKEENA RENT-A-CAR (NATIONAL CAR RENTAL) 63,591SKILLSOFT CANADA LTD 181,637SKOOKUM TOWING LTD 30,885SKY LAKES MEDICAL CENTRER INC 29,789SKYLINK RECEIVABLES INC 310,786SKYVIEW INSURANCE BROKERS LTD 221,768SKYWAY TRUCK CENTRE INC 34,810SLM DEVELOPMENT CORPORATION 239,856SLR CONSULTING (CANADA) LTD 330,647SMITH & WALTERS TOWING & EPAI 37,179SMITH CHEVROLET CADILLAC LTD 1,437,853SMITH DERRYCK H DR INC 730,574SMITH J DR INC 115,761
Please note: ICBC changed its fiscal year-end from December 31st to March 31st and therefore, the fiscal period ending March 31, 2017 is a 15 month transitory fiscal period. The total amounts reported above represent 15 months of supplier payments for goods and services.

Insurance Corporation of British Columbia
126
Amounts paid to suppliers for goods and services for the 15 month period ended March 31, 2017
SUPPLIER NAME AMOUNTS
SMITHRITE DISPOSAL LTD 168,408SMOKEY CREEK SALVAGE 63,535SNIDER SCOTT - MEDIATOR 145,206SOBEY PAUL W DR INC 42,584SOFTCHOICE LP 4,079,685SOJA PETER J DR 25,079SOLID GOLD COLLISION LTD 601,799SOLOMONS KEVIN DR INC 1,282,821SOLUTIONS THRU SOFTWARE LTD 123,424SOMERS AND COMPANY 5,539,701SONG FAMILY CHIROPRACTIC 58,752SOOKE GLASS LTD 25,476SOOKE’S WESTCOAST COLLISION & GLASS 772,175SOPRON AUTO BODY (P & T AUTO BODY LTD) 1,145,875SOPRON AUTOBODY LTD 1,152,484SORRENTO TOWING & RECOVERY LTD 27,477SOUND IDEARS INC 43,895SOUTH COAST FORD PROPERTY 44,769SOUTH COAST FORD SALES LTD 25,592SOUTH FRASER PHYSIOTHERAPY CLINIC 206,030SOUTH SEAS AUTO BODY CO LTD 2,512,662SOUTH SURREY MEDICAL CLINIC 28,210SOUTH THOMPSON MOTORS LTD 29,989SOUTH VANCOUVER PHYSIOTHERAPY 50,761SOUTHCENTRE PHYSIOTHERAPY CLINIC 27,267SOUTHERN INSURANCE SERVICES LTD 4,187,696SOUTHLAND INTERNATIONAL 68,887SOUTHSIDE DOOR AND GATE 92,916SOUTHSIDE FRAME & ALIGNMENT 29,482SOVIO O M DR 581,301SPARLING REAL ESTATE LTD 191,242SPARROW FITNESS 34,885SPARWOOD TOWING 46,125SPECIAL D’S COLLISION LTD 542,245SPECIALIST REFERRAL CLINIC 3,356,486SPECIALIZED TOWING LIMITED 94,604SPECTRUM REHABILITATION SERVICE INC 114,094SPEEDIER AUTO BODY SHOP LTD 1,678,926SPEEDY GLASS (ABBOTSFORD) 732,102SPEEDY GLASS (BURNABY-IMPERIAL ST) 631,424SPEEDY GLASS (BURNABY-LOUGHEED HWY) 547,162SPEEDY GLASS (CAMPBELL RIVER) 228,033SPEEDY GLASS (CASTLEGAR) 330,619SPEEDY GLASS (CHILLIWACK) 653,532SPEEDY GLASS (COQUITLAM) 842,332SPEEDY GLASS (COURTENAY) 724,945SPEEDY GLASS (CRANBROOK) 173,789SPEEDY GLASS (CRESTON) 181,143SPEEDY GLASS (DAWSON CREEK) 369,699SPEEDY GLASS (DUNCAN) 344,236SPEEDY GLASS (KAMLOOPS-SEYMOUR ST) 332,389SPEEDY GLASS (KAMLOOPS-TRANQUILLE) 392,802SPEEDY GLASS (KELOWNA) 563,630
SUPPLIER NAME AMOUNTS
SPEEDY GLASS (LANGLEY) 987,610SPEEDY GLASS (MAPLE RIDGE) 381,155SPEEDY GLASS (NANAIMO) 290,671SPEEDY GLASS (NELSON) 310,599SPEEDY GLASS (NORTH VAN-BROOKSBANK) 730,772SPEEDY GLASS (NORTH VAN-MARINE DR) 963,760SPEEDY GLASS (PARKSVILLE) 289,780SPEEDY GLASS (PENTICTON) 504,846SPEEDY GLASS (PRINCE GEORGE) 384,361SPEEDY GLASS (RICHMOND) 1,012,617SPEEDY GLASS (SQUAMISH) 322,340SPEEDY GLASS (SURREY-FRASER HWY) 858,227SPEEDY GLASS (SURREY-KING GEORGE BLVD) 709,942SPEEDY GLASS (SURREY-72ND AVE) 650,965SPEEDY GLASS (TERRACE) 438,589SPEEDY GLASS (VANCOUVER-KINGSWAY) 1,735,542SPEEDY GLASS (VANCOUVER-YORK AVE) 681,272SPEEDY GLASS (VERNON) 789,483SPEEDY GLASS (VICTORIA-GOVERNMENT) 525,800SPEEDY GLASS (VICTORIA-ISLAND HWY) 518,980SPEEDY GLASS (WILLIAMS LAKE) 227,272SPINNERS AUTO GLASS LTD 83,362SPLASHES WASH LODGE INC 591,893SPOTLITE CUSTOM COLLISION (1987) LTD 2,175,767SPRINGFIELD AUTO BODY LTD 1,803,174SRA GLASS & AUTO REPAIR 68,589SS&C TECHNOLOGIES CANADA CORP 2,663,990ST ANTHONY SUMMIT MEDICAL 67,663STAMPEDE GLASS 496,382STANTEC CONSULTING LTD 3,455,777STAR AUTOBODY LTD 2,711,585STARLITE AUTOBODY LTD 753,415STARR ELKE DR 45,750STATE STREET BANK & TRUST COMPANY CANADA 35,210,426STATE STREET GLOBAL ADVISORS LTD 137,426STATE STREET TRUST COMPANY CANADA 594,707STATION SQUARE MEDICAL CLINIC 26,751STAVROS AUTO BODY LTD 346,438STEFAN FRASER AND ASSOCIATES INC 337,437STEHMEIER JOSHUA R DR 43,385STERLING AUTOBODY (DELTA) LTD 327,183STERLING FENCE CO LTD 32,943STERLING TALENT SOLUTIONS 127,370STERLING TRUCK AND TRAILER SALES LTD 31,957STEVE MARSHALL MOTORS (1996) LTD 1,227,512STEVEN KROEGER PHYSICAL THERAPIST CORP 33,461STEVENS ALISON DR 68,207STEVENS VIRGIN 6,060,790STEVIE’S AUTOMOTIVE 146,236STEWART & COMPANY 5,057,667STEWART’S WELDING LTD 169,611STEWARTS COLLISION CENTER 476,367STILL CREEK COLLISION INC 1,231,344
Please note: ICBC changed its fiscal year-end from December 31st to March 31st and therefore, the fiscal period ending March 31, 2017 is a 15 month transitory fiscal period. The total amounts reported above represent 15 months of supplier payments for goods and services.

Statements and Schedules of Financial Information 2016/17
127
Amounts paid to suppliers for goods and services for the 15 month period ended March 31, 2017
SUPPLIER NAME AMOUNTS
STILL CREEK PRESS LTD 92,290STONE BROS AUTO BODY & AUTO WRECKING LTD 1,499,901STRAUSS & SHAVELLE INC 46,515STREAMLINE AUTO & WINDOW GLASS 304,056SUCCESS REALTY & INSURANCE LTD 265,860SUCHDEV JAGJEVEN JOHNNY 31,860SUDDEN IMPACT AUTO BODY REPAIR LTD 1,331,601SUMAS ENVIRONMENTAL SERVICES INC 30,731SUMEN SINGLA PHYSIOTHERAPIST CORP 27,749SUMMERLAND GLASS AND MIRROR LTD 135,948SUMMERLAND RV CENTRE 25,208SUMMIT INJURY MANAGEMENT LP 107,505SUMMIT INSURANCE BROKERS INC 219,107SUMMIT TRAILER LTD 36,895SUN CITY PHYSIOTHERAPY 83,848SUN COUNTRY TOYOTA 1,648,644SUN LIFE FINANCIAL 151,797SUNCREEK AUTO GLASS LTD 364,188SUNNYSIDE AUTOBODY (1980) LTD 1,961,083SUNRISE FORD SALES LTD 1,223,604SUNRISE HASTINGS PHYSIO CLINIC 53,224SUNRISE HOSPITAL & MEDICAL CENTER 110,988SUNRISE SERVICE ABBOTSFORD LTD 50,998SUNRISE TRAILER SALES LTD 58,069SUNSET GLASS 156,492SUNSET PHYSIOTHERAPY CLINIC 52,129SUNSET SQUARE (DARLEN VENTURES LTD) 112,570SUNSHINE AUTO BODY LTD 1,139,462SUNSHINE AUTOBODY (VERNON) LTD 702,761SUNSHINE GLASS AND MIRROR LTD 104,429SUNSTONE PHYSIOTHERAPY CLINIC 38,797SUNWEST RV CENTRE LTD 61,127SUNWHEEL REHABILITATION 144,763SUPER EURO AUTO LTD 1,666,721SUPERIOR COLLISION REPAIRS LTD 2,145,695SUPERIOR TOWING 37,005SUPERSTAR AUTO REPAIR CENTRE LTD 579,112SUPREMEX INC 399,023SURDELL KENNEDY TAXI LTD 135,183SUREWAY INSURANCE SERVICES LTD 204,057SURREY AUTO GLASS LTD 411,947SURREY AUTOBODY AND PAINT LTD 3,130,853SURREY CENTRAL PHYSIO AND WELLNESS 61,978SURREY HWY 10 PHYSIOTHERAPY & MASSAGE 71,679SURREY IMPORTS LTD 83,251SURREY INSURANCE AGENCY INC 122,481SURREY SPORTS & REHABILITATION 54,115SURREYSIDE PHYSIOTHERAPY CLINIC 35,120SUSSEX INSURANCE AGENCY (AMBLESIDE) INC 240,690SUSSEX INSURANCE AGENCY (CREST PLAZA) INC 3,213,151SUSSEX INSURANCE AGENCY (KELOWNA) INC 1,773,540SUSSEX INSURANCE AGENCY (LANGLEY) INC 831,701SUSSEX INSURANCE AGENCY (MISSION) INC 1,662,314
SUPPLIER NAME AMOUNTS
SUSSEX INSURANCE AGENCY (PENTICTON) INC 212,388SUSSEX INSURANCE AGENCY (ROYAL OAK) INC 1,486,358SUSSEX INSURANCE AGENCY INCORPORATED 1,861,748SUTER BROOK INSURANCE SERVICES LTD 229,632SWADDEN & COMPANY 5,993,992SWEDE’S TOWING 53,140SYMMETRIX INSTITUTE OF EXERCISE 64,685SYMMETRY INJURY REHABILITATION LTD 1,074,734SYMONS TIRE SERVICE LTD 35,486SYNECTICS ROAD SAFETY RESEARCH CORP 31,233T C VALLEY COLLISION LTD 1,120,852T F AUTO BODY (TUNG FAT MOTORS ) 963,619T H PETTIT LAW CORP (PETTIT AND COMPANY) 2,716,160T J GLASS ODYSSEY INC 879,498T J’S AUTO BODY (1998) LTD 1,354,968T S MCKENZIE INSURANCE AGENCIES LTD 524,384TABERNER PAUL D - MEDIATOR 47,543TABLEAU SOFTWARE INC 631,252TAFT STETTINIUS & HOLLISER LLP 70,021TAI-HSING AUTO REPAIRS INC 144,617TALBOT INSURANCE SERVICES LTD 316,455TALBOT MEDIATION SERVICES LTD 183,175TAMMY STAMNES & KEN WILSON INS AGENCY 4,065,934TARAZI FADI DR 103,234TATA CONSULTANCY SERVICES CANADA INC 2,488,331TAURUS AUTO COLLISION CARE LTD 125,771TAURUS COMMERCIAL REAL ESTATE SERVICES 377,867TAYLOR SHANE DR 30,831TAYLORMOTIVE SERVICE LTD 3,473,077TD ASSET MANAGEMENT INC 295,148TD CANADA TRUST 65,100TEACHERS’ TUTORING SERVICE 27,479TEAL PHILIP DR INC 63,990TEASDALE CAOLAN DR 154,227TECH MAHINDRA LTD 834,774TECH TRAILER 30,307TEDCO RV SUPPLIES 53,103TEK TRUCK SERVICES (TRAI FAM GROUP INC) 49,847TEKSYSTEMS CANADA INC 167,295TELDON MEDIA GROUP 149,441TELECOM WEST INC 26,040TELFER CHARLES D DR 120,071TELUS COMMUNICATIONS COMPANY 12,344,684TELUS SERVICES INC 3,178,116TENABLE NETWORK SECURITY INC 60,026TERMINAL AUTO BODY (PARKSVILLE) LTD 2,069,937TERRACE MOTORS LTD 45,323TERRACE TOTEM FORD SALES LTD 78,333TERRAWEST ENVIROMENTAL INC 1,153,110TESSLER B B DR INC 266,494THERMO KING OF BRITISH COLUMBIA INC 39,823THIND MANDEEP, RMT 38,243THISTLE CANADA (DIV OF JARDINE LLOYD) 83,320
Please note: ICBC changed its fiscal year-end from December 31st to March 31st and therefore, the fiscal period ending March 31, 2017 is a 15 month transitory fiscal period. The total amounts reported above represent 15 months of supplier payments for goods and services.

Insurance Corporation of British Columbia
128
Amounts paid to suppliers for goods and services for the 15 month period ended March 31, 2017
SUPPLIER NAME AMOUNTS
THOMAS INTERNATIONAL INC 25,745THOMAS SHAWN DR 34,025THOMPSON INSURANCE CENTRE (1997) INC 179,527THOMPSON J P DR INC 272,909THOMSON REUTERS CANADA 107,145THREE PEAKS KINESIOLOGY INC 114,616THREE POINT MOTORS 110,653THUNDERBIRD INSURANCE BROKERS LTD 391,529THUNDERVALLEY TOWING 32,867THY INVESTMENTS LTD DBA SUSSEX INS AGENCY 488,476TIFFIN MOTOR HOMES INC 50,206TIGER TOWING LIMITED 76,072TILLYARD MANAGEMENT INC 28,917TIP TOP COLLISION LTD 917,561TITAN ENTERPRISE INC DBA SUSSEX INSURANCE 308,883TITAN WINDOW FILMS LTD 47,046TITCHENER DR CHIROPRACTIC CORP 54,082TMA AUTOBODY & SERVICES LTD 1,551,643TOBIAS DAVID L DR INC 52,950TOM THOMPSON AUTO GLASS LTD 472,981TOM’S & MERRITT TOWING LTD 145,224TOM’S CUSTOM AUTOBODY (1017288 BC LTD) 3,188,656TOM’S RV SERVICE & SUPPLIES LTD 37,903TOMITA TODD DR INC 121,842TONKS TOWING LTD 165,297TONY LAU INSURANCE AGENCIES LTD 951,773TOP GUN COLLISION AUTO BODY LTD 1,264,937TOTAL THERAPY REHABILITATION & WELLNESS 335,345TOTEM TOWING 533,193TOWER INVESTIGATIVE GROUP INC 51,221TOWERS WATSON SOFTWARE LTD 188,482TOWN OF GIBSONS 428,626TOWN OF LADYSMITH 25,777TOWN OF LAKE COWICHAN 27,090TOWN OF OSOYOOS 33,900TOWN OF SIDNEY 417,115TOWN OF VIEW ROYAL 39,600TOWNLINE INSURANCE SERVICES LTD 425,014TOWNSHIP OF LANGLEY 415,946TRACTION MOTORCYCLES LTD 63,080TRACUMENT SOLUTIONS INC 38,895TRADEMARK GLASSWORKS LTD 157,126TRADEWIND INSURANCE SERVICES LTD 415,742TRAILER WIZARDS LTD 118,216TRAILERCRAFT 355,810TRAINOR VOCATIONAL CONSULTING CORP 34,731TRANN ALLAN - MEDIATOR 51,705TRANS AMERICA GLASS NETWORK 211,130TRANSWORLD MANAGEMENT LTD 189,241TRASK M - NURSING CONSULTANT 47,781TRAVCO RV SERVICE CENTRE LTD 70,561TRAVELAND LEISURE VEHICLES LTD 673,975TRAVLOS ANDREW DR INC 73,551
SUPPLIER NAME AMOUNTS
TRAXLER HAINES 529,819TRELOAR PHYSIOTHERAPY CLINIC 135,661TREV DEELEY MOTORCYCLES (1991) LTD 70,513TRI CITY COLLISION AND REPAIRS LTD 51,392TRI-CITY INSURANCE BROKERS LTD 865,717TRICA CXM SOLUTIONS LTD 93,384TRISTAR COLLISION 4,672,742TROJAN COLLISION SERVICES LTD 3,089,391TROY TATER CHIROPRACTIC INC 28,600TROY WOTHERSPOON INSURANCE SERVICES 3,522,161TRU-LINE AUTOBODY FRAME & WHEEL LTD 381,902TRUE LEVEL CONCRETE 35,364TRUFAX SERVICES LTD 29,962TSAWWASSEN COLLISION LTD 2,610,438TSAWWASSEN INSURANCE BROKERS LTD 407,200TSN INSURANCE SERVICES (SURREY) LTD 658,440TSN INSURANCE SERVICES LTD 1,449,512TURNBULL IAN M DR 72,502TURNBULL RUTH DR MEDICAL INC 29,219TURNER VOLKSWAGEN 37,795TURNEY TOWING LLC 30,024TURNHAM WOODLAND 595,883TURNING POINT REHABILITATION CONSULTING 198,101TWENTY FOUR SEVEN INVESTIGATIONS INC 496,973TWIN RINKS PHYSIO & SPORTS INJURY CLINIC 47,439TWINSTAR COLLISION LTD 787,818TXL INSURANCE AGENCY INC 822,608TY-CROP MANUFACTURING LTD 494,044TYEE CHEVROLET LTD 959,364TYLER’S TOWING (2013) LTD 48,107ULINE CANADA CORPORATION 62,864ULTIMATE COLLISION REPAIRS LTD 52,761ULTRA-TECH CLEANING SYSTEMS LTD 44,320UNDERWRITERS INSURANCE AGENCIES-POWELL RV 463,328UNDERWRITERS INSURANCE BROKERS-PENTICTON 1,240,392UNIFIED SYSTEMS INC 181,881UNITED COLLISION AUTO REPAIR 250,617UNITED COLLISION REPAIR LTD 321,527UNITED REPORTING SERVICE LTD 39,794UNITED TOWING SERVICES INC 162,046UNITED WAY OF THE LOWER MAINLAND 97,211UNITOW SERVICES (1978) LTD 620,356UNIVERSAL AUTO COLLISION LTD 178,894UNIVERSITY OF BRITISH COLUMBIA 61,485URBAN PACIFIC LAND CORP 127,112URGEL’S AUTO COLLISION LTD 1,514,591UTILITY TRAILER SALES 57,146V I P AUTOBODY INC 237,309VAISLER BARRY J DR INC 132,203VAISMAN OFIR 175,571VALLENTYNE STEPHEN DR INC 27,114VALLEY AUTO REPAIR INC 31,624VALLEY GLASS KELOWNA LTD 26,079
Please note: ICBC changed its fiscal year-end from December 31st to March 31st and therefore, the fiscal period ending March 31, 2017 is a 15 month transitory fiscal period. The total amounts reported above represent 15 months of supplier payments for goods and services.
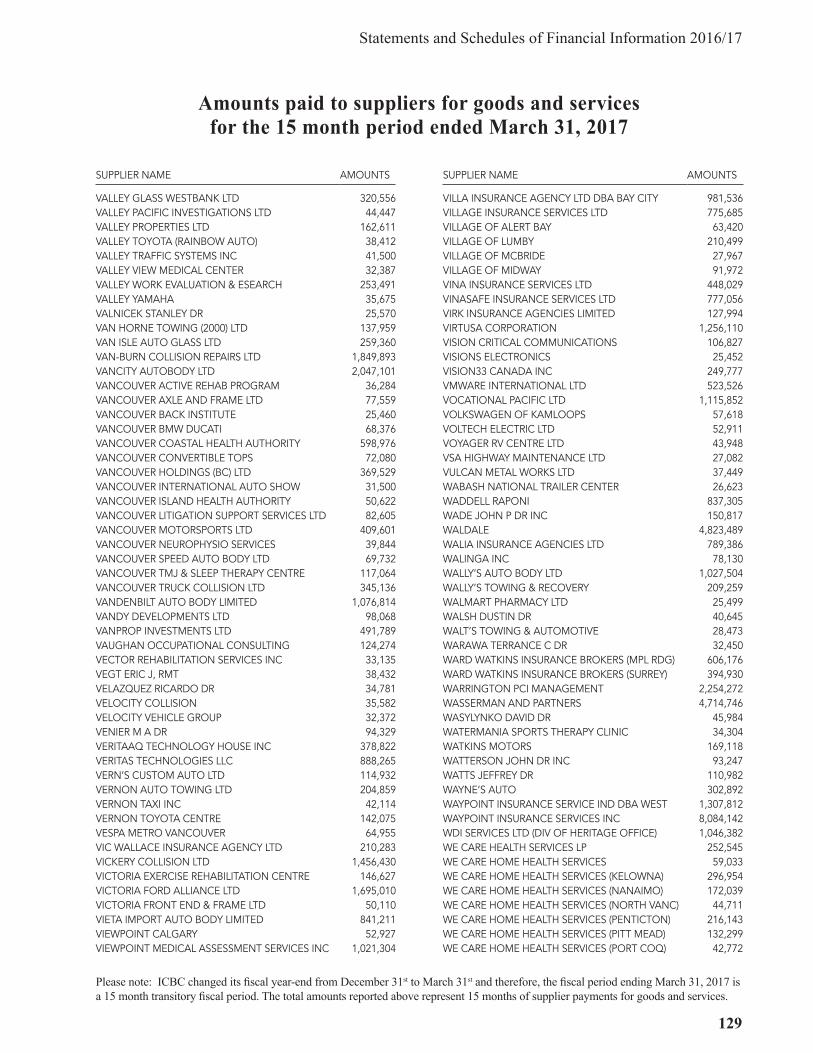
Statements and Schedules of Financial Information 2016/17
129
Amounts paid to suppliers for goods and services for the 15 month period ended March 31, 2017
SUPPLIER NAME AMOUNTS
VALLEY GLASS WESTBANK LTD 320,556VALLEY PACIFIC INVESTIGATIONS LTD 44,447VALLEY PROPERTIES LTD 162,611VALLEY TOYOTA (RAINBOW AUTO) 38,412VALLEY TRAFFIC SYSTEMS INC 41,500VALLEY VIEW MEDICAL CENTER 32,387VALLEY WORK EVALUATION & ESEARCH 253,491VALLEY YAMAHA 35,675VALNICEK STANLEY DR 25,570VAN HORNE TOWING (2000) LTD 137,959VAN ISLE AUTO GLASS LTD 259,360VAN-BURN COLLISION REPAIRS LTD 1,849,893VANCITY AUTOBODY LTD 2,047,101VANCOUVER ACTIVE REHAB PROGRAM 36,284VANCOUVER AXLE AND FRAME LTD 77,559VANCOUVER BACK INSTITUTE 25,460VANCOUVER BMW DUCATI 68,376VANCOUVER COASTAL HEALTH AUTHORITY 598,976VANCOUVER CONVERTIBLE TOPS 72,080VANCOUVER HOLDINGS (BC) LTD 369,529VANCOUVER INTERNATIONAL AUTO SHOW 31,500VANCOUVER ISLAND HEALTH AUTHORITY 50,622VANCOUVER LITIGATION SUPPORT SERVICES LTD 82,605VANCOUVER MOTORSPORTS LTD 409,601VANCOUVER NEUROPHYSIO SERVICES 39,844VANCOUVER SPEED AUTO BODY LTD 69,732VANCOUVER TMJ & SLEEP THERAPY CENTRE 117,064VANCOUVER TRUCK COLLISION LTD 345,136VANDENBILT AUTO BODY LIMITED 1,076,814VANDY DEVELOPMENTS LTD 98,068VANPROP INVESTMENTS LTD 491,789VAUGHAN OCCUPATIONAL CONSULTING 124,274VECTOR REHABILITATION SERVICES INC 33,135VEGT ERIC J, RMT 38,432VELAZQUEZ RICARDO DR 34,781VELOCITY COLLISION 35,582VELOCITY VEHICLE GROUP 32,372VENIER M A DR 94,329VERITAAQ TECHNOLOGY HOUSE INC 378,822VERITAS TECHNOLOGIES LLC 888,265VERN’S CUSTOM AUTO LTD 114,932VERNON AUTO TOWING LTD 204,859VERNON TAXI INC 42,114VERNON TOYOTA CENTRE 142,075VESPA METRO VANCOUVER 64,955VIC WALLACE INSURANCE AGENCY LTD 210,283VICKERY COLLISION LTD 1,456,430VICTORIA EXERCISE REHABILITATION CENTRE 146,627VICTORIA FORD ALLIANCE LTD 1,695,010VICTORIA FRONT END & FRAME LTD 50,110VIETA IMPORT AUTO BODY LIMITED 841,211VIEWPOINT CALGARY 52,927VIEWPOINT MEDICAL ASSESSMENT SERVICES INC 1,021,304
SUPPLIER NAME AMOUNTS
VILLA INSURANCE AGENCY LTD DBA BAY CITY 981,536VILLAGE INSURANCE SERVICES LTD 775,685VILLAGE OF ALERT BAY 63,420VILLAGE OF LUMBY 210,499VILLAGE OF MCBRIDE 27,967VILLAGE OF MIDWAY 91,972VINA INSURANCE SERVICES LTD 448,029VINASAFE INSURANCE SERVICES LTD 777,056VIRK INSURANCE AGENCIES LIMITED 127,994VIRTUSA CORPORATION 1,256,110VISION CRITICAL COMMUNICATIONS 106,827VISIONS ELECTRONICS 25,452VISION33 CANADA INC 249,777VMWARE INTERNATIONAL LTD 523,526VOCATIONAL PACIFIC LTD 1,115,852VOLKSWAGEN OF KAMLOOPS 57,618VOLTECH ELECTRIC LTD 52,911VOYAGER RV CENTRE LTD 43,948VSA HIGHWAY MAINTENANCE LTD 27,082VULCAN METAL WORKS LTD 37,449WABASH NATIONAL TRAILER CENTER 26,623WADDELL RAPONI 837,305WADE JOHN P DR INC 150,817WALDALE 4,823,489WALIA INSURANCE AGENCIES LTD 789,386WALINGA INC 78,130WALLY’S AUTO BODY LTD 1,027,504WALLY’S TOWING & RECOVERY 209,259WALMART PHARMACY LTD 25,499WALSH DUSTIN DR 40,645WALT’S TOWING & AUTOMOTIVE 28,473WARAWA TERRANCE C DR 32,450WARD WATKINS INSURANCE BROKERS (MPL RDG) 606,176WARD WATKINS INSURANCE BROKERS (SURREY) 394,930WARRINGTON PCI MANAGEMENT 2,254,272WASSERMAN AND PARTNERS 4,714,746WASYLYNKO DAVID DR 45,984WATERMANIA SPORTS THERAPY CLINIC 34,304WATKINS MOTORS 169,118WATTERSON JOHN DR INC 93,247WATTS JEFFREY DR 110,982WAYNE’S AUTO 302,892WAYPOINT INSURANCE SERVICE IND DBA WEST 1,307,812WAYPOINT INSURANCE SERVICES INC 8,084,142WDI SERVICES LTD (DIV OF HERITAGE OFFICE) 1,046,382WE CARE HEALTH SERVICES LP 252,545WE CARE HOME HEALTH SERVICES 59,033WE CARE HOME HEALTH SERVICES (KELOWNA) 296,954WE CARE HOME HEALTH SERVICES (NANAIMO) 172,039WE CARE HOME HEALTH SERVICES (NORTH VANC) 44,711WE CARE HOME HEALTH SERVICES (PENTICTON) 216,143WE CARE HOME HEALTH SERVICES (PITT MEAD) 132,299WE CARE HOME HEALTH SERVICES (PORT COQ) 42,772
Please note: ICBC changed its fiscal year-end from December 31st to March 31st and therefore, the fiscal period ending March 31, 2017 is a 15 month transitory fiscal period. The total amounts reported above represent 15 months of supplier payments for goods and services.

Insurance Corporation of British Columbia
130
Amounts paid to suppliers for goods and services for the 15 month period ended March 31, 2017
SUPPLIER NAME AMOUNTS
WE CARE HOME HEALTH SERVICES (SURREY) 258,235WE CARE HOME HEALTH SERVICES (VERNON) 378,765WE CARE HOME HEALTH SERVICES (VICTORIA) 287,216WEBSTER HUDSON & COOMBE LLP 4,867,523WEEKS INSURANCE & FINANCIAL SERVICES INC 108,821WELL ON AUSTIN HEALTH GROUP INC 720,298WENDY LINTOTT CONSULTING 78,050WESGROUP PROPERTIES LP 1,822,748WEST COAST DETAIL & ACCESSORY CENTRE 254,746WEST COAST IMPORT VEHICLES LTD 111,890WEST COAST KINESIOLOGY SERVICES LTD 56,540WEST COAST MOTOR SPORT LTD 47,178WEST COAST ORAL & MAXILLOFACIAL SURGERY 80,990WEST COAST REPAIR & COLLISION SERVICE 951,833WEST COAST RV PARTS & SERVICE 77,804WEST END AUTO BODY LTD 3,791,170WEST JOSHUA DR 29,800WEST KELOWNA FIX AUTO (KELOWNA AUTO COLL) 32,391WEST KOOTENAY BRAIN INJURY ASSOC 43,986WEST PACIFIC CONSULTING GROUP 2,860,056WEST SHORE PARKS & RECREATION 62,532WESTERBERG BRIAN D DR INC 46,239WESTERN AUTO WRECKERS 180,308WESTERN BUS PARTS & SERVICE (LEVETT AUTO) 520,132WESTERN FINANCIAL GROUP (NETWORK) INC 21,408,340WESTERN MGMT CONSULTANTS 46,095WESTERN STAR & STERLING TRUCKS 98,526WESTERN TRAILER CO 26,004WESTISLE HEATING AND COOLING 27,938WESTLAND INSURANCE GROUP LTD 35,694,505WESTLAND INSURANCE GROUP LTD DBA MEIER 3,970,994WESTPAC AUTO GLASS LTD 43,178WESTSHORE TOWING LTD 206,909WESTVIEW AGENCIES LTD 798,149WHEATON CHEVROLET BUICK CADILLAC GMC LTD 1,632,702WHEELER-HOMEMAKER’S INSURANCE AGENCIES 121,004WHISTLER GLASS LTD 191,333WHITE ROCK SOUTH SURREY TAXI LTD 44,400WHITE ROCK VOLKSWAGEN 109,152WHITEHALL TRUCK & TOWING INC 28,225WHITELAW TWINING 2,029,436WHITLOCK INSURANCE SERVICES LTD 258,096WHOLLY FIT WITH HOLLY SCHMIDT 39,825WHYTE BARRY DR CHIROPRACTIC INC 36,441WHYTE INSURANCE SERVICES LTD 60,055WILFRED LEONG INSURANCE AGENCIES LTD 98,640WILKINSON R V DR INC 61,477WILLE DODGE CHRYSLER LTD 1,284,516WILLIAM PARTON AGENCIES LTD 137,464WILLIAMS & PARTNERS 508,517WILLIAMS ARTHUR D, PH D 250,653WILLIAMS RECOGNITION LTD 121,722WILLIS CANADA INC 259,536
SUPPLIER NAME AMOUNTS
WILLIS LOUIE LTD 44,713WILLOW POINT COLLISION 698,817WILLOWBROOK COLLISION 2002 LTD 1,092,874WILLOWBROOK MOTORS LTD 60,438WILLY’S COLLISION (2005) LTD 859,494WILSON KING AND COMPANY 277,559WILSON M BECK INSURANCE SERVICES (KEL) 200,313WILSON M BECK INSURANCE SERVICES INC 509,662WIND GLASS LTD 192,869WINFIELD HEAVY TRUCK & COLLISION REPAIRS 75,307WINKELAAR CHRIS, OT 47,507WINSTON PAUL DR INC 65,706WISEMAN STEPHEN R DR INC 156,199WIZARDS GLASS & UPHOLSTERY LTD 51,739WJ STELMASCHUK AND ASSOCIATES LTD 40,200WM ANDERSON AGENCIES LTD 1,665,164WOLFE’S LANGLEY MAZDA 30,449WONG DARWIN YUK WHA, RMT 26,463WONG DR AND ASSOCIATES 32,540WONG PETER K DR 351,749WONG’S INSURANCE SERVICES LTD 952,987WOOD WHEATON CHEVROLET CADILLAC BUICK 243,794WOODGROVE CHRYSLER 27,685WOOLFENDEN ANDREW R DR INC 363,835WORKERS’ COMPENSATION BOARD OF BC 791,152WORKPLACE RESOURCE 38,086WRIGHT-SMITH PHYSIOTHERAPIST CORP 27,686WRIGHT’S AUTO BODY 356,158WSP CANADA INC 103,931XPERA RISK MITIGATION & INVESTIGATIONS 2,930,617XTREME AUTOBODY & PAINT 177,374YAU BONG AUTO GLASS LTD 32,806YEE INSURANCE SERVICES LTD 128,634YELLOW CAB COMPANY LTD 240,675YELLOWHEAD ROAD & BRIDGE 238,004YEREMA GEEKIE LAW CORP (SALLOUM WATTS) 683,146YEWCHUK JENNIFER DR 33,770YIEN ALAN - VOCATIONAL REHAB SERVICES 43,584YIP BOBBY DR 44,805YIP WILLIE DR 51,265YOUR FAMILY FOOD MART LTD 198,688YU HAERANG GRACE DR 62,127YU WILLIAM DR INC 42,337ZARKADAS PETER DR 109,380ZENK LAW CORPORATION 1,201,719ZERKEE BEN C DR CHIROPRACTIC INC 31,620ZIMMER WHEATON PONTIAC BUICK GMC LTD 2,585,124ZOFFMANN ELISABETH DR 57,524ZSA LEGAL RECRUITMENT 59,216ZZ CHROME MFG INC 58,1771ST CHOICE AUTOGLASS 33,0591ST CLASS AUTO GLASS & UPHOLSTERY LTD 97,44010NET MANAGED SOLUTIONS LTD 44,471
Please note: ICBC changed its fiscal year-end from December 31st to March 31st and therefore, the fiscal period ending March 31, 2017 is a 15 month transitory fiscal period. The total amounts reported above represent 15 months of supplier payments for goods and services.

Statements and Schedules of Financial Information 2016/17
131
Amounts paid to suppliers for goods and services for the 15 month period ended March 31, 2017
SUPPLIER NAME AMOUNTS
100 MILE GLASS LTD 153,6151018412 BC LTD DBA SUSSEX INSURANCE 409,5221114940 BC LTD DBA SUSSEX INSURANCE 435,27917 KAMLOOPS SENIORS VILLAGE 25,77820/20 AUTO GLASS (ABBOTSFORD) 802,0552000 AUTOMOTIVE COLLISION 2,041,8002272807 ONTARIO LTD 40,66324 HR COLLISION CENTER INC 3,475,1114 U AUTO CARE INC 303,456466824 BC LTD DBA B & W INSURANCE 1,808,958485975 BC LTD DBA SUSSEX INSURANCE AGENCY 694,1125 STAR TOWING INC 51,0765TH & CARNEY AUTO SALES INC 47,77751561 BC LTD (C/O STEINER PROPERTIES) 30,222548981 BC LTD DBA JOHN FLEMING INSURANCE 215,412556774 BC LTD DBA SUSSEX INSURANCE 808,339596961 BC LTD (TILLYARD MANAGEMENT INC) 2,393,475610728 BC LTD DBA SUSSEX INSURANCE AGENCY 1,103,388677891 BC LTD DBA SUSSEX INSURANCE AGENCY 686,927695668 BC LTD DBA CITY CENTER INSURANCE 516,5727 GN AUTOBODY LIMITED 713,194767147 BC LTD DBA SUSSEX INSURANCE AGENCY 407,949768206 BC LTD DBA SUSSEX INSURANCE AGENCY 374,806804297 BC LTD 156,508816751 BC LTD DBA SUSSEX INSURANCE AGENCY 820,980846589 BC LTD DBA SUSSEX INSURANCE AGENCY 606,938
SUPPLIER NAME AMOUNTS
851765 BC LTD DBA SUSSEX INSURANCE AGENCY 856,164852773 BC LTD DBA SUSSEX INSURANCE AGENCY 824,005856028 BC LTD DBA SUSSEX INSURANCE AGENCY 928,031863981 BC LTD DBA SUSSEX INSURANCE AGENCY 436,383869391 BC LTD (C/O WARRINGTON PCI MGMT) 166,561886324 BC LTD DBA SUSSEX INSURANCE AGENCY 981,767913364 BC LTD DBA SUSSEX INSURANCE AGENCY 1,084,995913365 BC LTD DBA SUSSEX INSURANCE AGENCY 273,962913367 BC LTD DBA SUSSEX INSURANCE AGENCY 767,632925218 BC LTD DBA SUSSEX INSURANCE AGENCY 823,714943450 BC LTD DBA SUSSEX INSURANCE AGENCY 344,385944048 BC LTD DBA SUSSEX INSURANCE AGENCY 535,718953121 BC LTD DBA SUSSEX INSURANCE AGENCY 1,305,160965687 BC LTD DBA SUSSEX INSURANCE AGENCY 1,893,652971924 BC LTD DBA SUSSEX INSURANCE AGENCY 915,712978173 BC LTD DBA SUSSEX INSURANCE AGENCY 237,007990645 BC LTD DBA SUSSEX INSURANCE AGENCY 2,236,247994768 BC LTD DBA SUSSEX INSURANCE AGENCY 667,774
TOTAL FOR OVER $25,000 $ 3,869,145,688
OTHERS UNDER $25,000 $ 62,394,517
GRAND TOTAL $ 3,931,540,205
Please note: ICBC changed its fiscal year-end from December 31st to March 31st and therefore, the fiscal period ending March 31, 2017 is a 15 month transitory fiscal period. The total amounts reported above represent 15 months of supplier payments for goods and services.

ACG365 (102017)