Statement of Management’s Responsibility for …Statement of Management’s Responsibility for...
70
Statement of Management’s Responsibility for Financial Information Management of Bank of Montreal (the “bank”) is responsible for the preparation and presentation of the annual consolidated financial statements, Management’s Discussion and Analysis (“MD&A”) and all other information in the Annual Report. The consolidated financial statements have been prepared in accordance with International Financial Reporting Standards (“IFRS”) as issued by the International Accounting Standards Board and meet the applicable requirements of the Canadian Securities Administrators (“CSA”) and the Securities and Exchange Commission (“SEC”) in the United States. The consolidated financial statements also comply with the provisions of the Bank Act (Canada) and related regulations, including interpretations of IFRS by our regulator, the Office of the Superintendent of Financial Institutions Canada. The MD&A has been prepared in accordance with the requirements of securities regulators, including National Instrument 51-102 Continuous Disclosure Obligations of the CSA. The consolidated financial statements and information in the MD&A necessarily include amounts based on informed judgments and estimates of the expected effects of current events and transactions with appropriate consideration to materiality. In addition, in preparing the financial information we must interpret the requirements described above, make determinations as to the relevancy of information to be included, and make estimates and assumptions that affect reported information. The MD&A also includes information regarding the impact of current transactions and events, sources of liquidity and capital resources, operating trends, risks and uncertainties. Actual results in the future may differ materially from our present assessment of this information because events and circumstances in the future may not occur as expected. The financial information presented in the bank’s Annual Report is consistent with that in the consolidated financial statements. In meeting our responsibility for the reliability and timeliness of financial information, we maintain and rely on a comprehensive system of internal controls, including organizational and procedural controls, disclosure controls and procedures, and internal control over financial reporting. Our system of internal controls includes written communication of our policies and procedures governing corporate conduct and risk management; comprehensive business planning; effective segregation of duties; delegation of authority and personal accountability; escalation of relevant information for decisions regarding public disclosure; careful selection and training of personnel; and accounting policies that we regularly update. Our internal controls are designed to provide reasonable assurance that transactions are authorized, assets are safeguarded and proper records are maintained and that we are in compliance with all regulatory requirements. The system of internal controls is further supported by a compliance function, which is designed to ensure that we and our employees comply with securities legislation and conflict of interest rules, and by an internal audit staff, which conducts periodic audits of all aspects of our operations. As of October 31, 2018, we, as the bank’s Chief Executive Officer and Chief Financial Officer, have determined that the bank’s internal control over financial reporting is effective. We have certified Bank of Montreal’s annual filings with the CSA and with the SEC pursuant to National Instrument 52-109, Certification of Disclosure in Issuers’ Annual and Interim Filings and the Securities Exchange Act of 1934. In order to provide their audit opinions on our consolidated financial statements and on the bank’s internal control over financial reporting, the Shareholders’ Auditors audit our system of internal controls over financial reporting and conduct work to the extent that they consider appropriate. Their audit opinion on the bank’s internal control over financial reporting as of October 31, 2018 is set forth on page 142. The Board of Directors, based on recommendations from its Audit and Conduct Review Committee, reviews and approves the financial information contained in the Annual Report, including the MD&A. The Board of Directors and its relevant committees oversee management’s responsibilities for the preparation and presentation of financial information, maintenance of appropriate internal controls, compliance with legal and regulatory requirements, management and control of major risk areas, and assessment of significant and related party transactions. The Audit and Conduct Review Committee, which is comprised entirely of independent directors, is also responsible for selecting the Shareholders’ Auditors and reviewing the qualifications, independence and performance of both the Shareholders’ Auditors and internal audit. The Shareholders’ Auditors and the bank’s Chief Auditor have full and free access to the Board of Directors, its Audit and Conduct Review Committee and other relevant committees to discuss audit, financial reporting and related matters. The Office of the Superintendent of Financial Institutions Canada conducts examinations and inquiries into the affairs of the bank as deemed necessary to ensure that the provisions of the Bank Act, with respect to the safety of the depositors, are being duly observed and that the bank is in sound financial condition. Darryl White Thomas E. Flynn Toronto, Canada Chief Executive Officer Chief Financial Officer December 4, 2018 140 BMO Financial Group 201st Annual Report 2018
Transcript of Statement of Management’s Responsibility for …Statement of Management’s Responsibility for...

Statement of Management’s Responsibilityfor Financial Information
Management of Bank of Montreal (the “bank”) is responsible for the preparation and presentation of the annual consolidated financial statements,Management’s Discussion and Analysis (“MD&A”) and all other information in the Annual Report.
The consolidated financial statements have been prepared in accordance with International Financial Reporting Standards (“IFRS”) as issued bythe International Accounting Standards Board and meet the applicable requirements of the Canadian Securities Administrators (“CSA”) and theSecurities and Exchange Commission (“SEC”) in the United States. The consolidated financial statements also comply with the provisions of the BankAct (Canada) and related regulations, including interpretations of IFRS by our regulator, the Office of the Superintendent of Financial InstitutionsCanada. The MD&A has been prepared in accordance with the requirements of securities regulators, including National Instrument 51-102 ContinuousDisclosure Obligations of the CSA.
The consolidated financial statements and information in the MD&A necessarily include amounts based on informed judgments and estimates ofthe expected effects of current events and transactions with appropriate consideration to materiality. In addition, in preparing the financialinformation we must interpret the requirements described above, make determinations as to the relevancy of information to be included, and makeestimates and assumptions that affect reported information. The MD&A also includes information regarding the impact of current transactions andevents, sources of liquidity and capital resources, operating trends, risks and uncertainties. Actual results in the future may differ materially from ourpresent assessment of this information because events and circumstances in the future may not occur as expected.
The financial information presented in the bank’s Annual Report is consistent with that in the consolidated financial statements.In meeting our responsibility for the reliability and timeliness of financial information, we maintain and rely on a comprehensive system of
internal controls, including organizational and procedural controls, disclosure controls and procedures, and internal control over financial reporting. Oursystem of internal controls includes written communication of our policies and procedures governing corporate conduct and risk management;comprehensive business planning; effective segregation of duties; delegation of authority and personal accountability; escalation of relevantinformation for decisions regarding public disclosure; careful selection and training of personnel; and accounting policies that we regularly update. Ourinternal controls are designed to provide reasonable assurance that transactions are authorized, assets are safeguarded and proper records aremaintained and that we are in compliance with all regulatory requirements. The system of internal controls is further supported by a compliancefunction, which is designed to ensure that we and our employees comply with securities legislation and conflict of interest rules, and by an internalaudit staff, which conducts periodic audits of all aspects of our operations.
As of October 31, 2018, we, as the bank’s Chief Executive Officer and Chief Financial Officer, have determined that the bank’s internal controlover financial reporting is effective. We have certified Bank of Montreal’s annual filings with the CSA and with the SEC pursuant to NationalInstrument 52-109, Certification of Disclosure in Issuers’ Annual and Interim Filings and the Securities Exchange Act of 1934.
In order to provide their audit opinions on our consolidated financial statements and on the bank’s internal control over financial reporting, theShareholders’ Auditors audit our system of internal controls over financial reporting and conduct work to the extent that they consider appropriate.Their audit opinion on the bank’s internal control over financial reporting as of October 31, 2018 is set forth on page 142.
The Board of Directors, based on recommendations from its Audit and Conduct Review Committee, reviews and approves the financialinformation contained in the Annual Report, including the MD&A. The Board of Directors and its relevant committees oversee management’sresponsibilities for the preparation and presentation of financial information, maintenance of appropriate internal controls, compliance with legal andregulatory requirements, management and control of major risk areas, and assessment of significant and related party transactions.
The Audit and Conduct Review Committee, which is comprised entirely of independent directors, is also responsible for selecting theShareholders’ Auditors and reviewing the qualifications, independence and performance of both the Shareholders’ Auditors and internal audit. TheShareholders’ Auditors and the bank’s Chief Auditor have full and free access to the Board of Directors, its Audit and Conduct Review Committee andother relevant committees to discuss audit, financial reporting and related matters.
The Office of the Superintendent of Financial Institutions Canada conducts examinations and inquiries into the affairs of the bank as deemednecessary to ensure that the provisions of the Bank Act, with respect to the safety of the depositors, are being duly observed and that the bank is insound financial condition.
Darryl White Thomas E. Flynn Toronto, CanadaChief Executive Officer Chief Financial Officer December 4, 2018
140 BMO Financial Group 201st Annual Report 2018

Independent Auditors’ Report of Registered PublicAccounting Firm
To the Shareholders of Bank of Montreal
Opinion on the Consolidated Financial StatementsWe have audited the accompanying consolidated financial statements of Bank of Montreal (the “Bank”), which comprise the consolidated balancesheets as at October 31, 2018 and October 31, 2017, the consolidated statements of income, comprehensive income, changes in equity and cashflows for each of the years in the three-year period ended October 31, 2018, and notes, comprising a summary of significant accounting policies andother explanatory information (collectively referred to as the consolidated financial statements).
In our opinion, the consolidated financial statements present fairly, in all material respects, the consolidated financial position of the Bank as atOctober 31, 2018 and October 31, 2017, and its consolidated financial performance and its consolidated cash flows for each of the years in the three-year period ended October 31, 2018 in accordance with International Financial Reporting Standards as issued by the International AccountingStandards Board.
Change in Accounting PrincipleWithout qualifying our opinion on the consolidated financial statements, we draw attention to Note 1 to the consolidated financial statements, whichindicates that the Bank has changed its method of accounting for financial instruments in 2018 due to the adoption of International FinancialReporting Standard 9 Financial Instruments.
Report on Internal Control Over Financial ReportingWe also have audited, in accordance with the standards of the Public Company Accounting Oversight Board (United States), the Bank’s internal controlover financial reporting as of October 31, 2018, based on the criteria established in Internal Control – Integrated Framework (2013) issued by theCommittee of Sponsoring Organizations of the Treadway Commission (COSO), and our report dated December 4, 2018 expressed an unqualified(unmodified) opinion on the effectiveness of the Bank’s internal control over financial reporting.
Basis for Opinion
A – Management’s Responsibility for the Consolidated Financial StatementsManagement is responsible for the preparation and fair presentation of these consolidated financial statements in accordance with InternationalFinancial Reporting Standards as issued by the International Accounting Standards Board, and for such internal control as management determines isnecessary to enable the preparation of consolidated financial statements that are free from material misstatement, whether due to fraud or error.
B – Auditors’ ResponsibilityOur responsibility is to express an opinion on these consolidated financial statements based on our audits. We conducted our audits in accordancewith Canadian generally accepted auditing standards and the standards of the Public Company Accounting Oversight Board (United States) (“PCAOB”).Those standards require that we plan and perform the audit to obtain reasonable assurance about whether the consolidated financial statements arefree from material misstatement, whether due to error or fraud. Those standards also require that we comply with ethical requirements, includingindependence. We are required to be independent with respect to the Bank in accordance with the ethical requirements that are relevant to our auditof the consolidated financial statements in Canada, the U.S. federal securities laws and the applicable rules and regulations of the Securities andExchange Commission and the PCAOB. We are a public accounting firm registered with the PCAOB.
An audit includes performing procedures to assess the risks of material misstatements of the consolidated financial statements, whether due toerror or fraud, and performing procedures to respond to those risks. Such procedures included obtaining and examining, on a test basis, auditevidence regarding the amounts and disclosures in the consolidated financial statements. The procedures selected depend on our judgment, includingthe assessment of the risks of material misstatement of the consolidated financial statements, whether due to fraud or error. In making those riskassessments, we consider internal control relevant to the Bank’s preparation and fair presentation of the consolidated financial statements in order todesign audit procedures that are appropriate in the circumstances.
An audit also includes evaluating the appropriateness of accounting policies and principles used and the reasonableness of accounting estimatesmade by management, as well as evaluating the overall presentation of the consolidated financial statements.
We believe that the audit evidence we have obtained in our audits is sufficient and appropriate to provide a reasonable basis for our audit opinion.
Chartered Professional Accountants, Licensed Public AccountantsWe have served as the Bank’s auditor since 2004 and as joint auditor for the prior 11 years
December 4, 2018Toronto, Canada
BMO Financial Group 201st Annual Report 2018 141

Report of Independent Registered Public Accounting Firm
The Shareholders of Bank of Montreal
Opinion on Internal Control over Financial ReportingWe have audited Bank of Montreal (the “Bank”)’s internal control over financial reporting as of October 31, 2018, based on the criteria established inInternal Control – Integrated Framework (2013) issued by the Committee of Sponsoring Organizations of the Treadway Commission.
In our opinion, the Bank maintained, in all material respects, effective internal control over financial reporting as of October 31, 2018, based onthe criteria established in Internal Control – Integrated Framework (2013) issued by the Committee of Sponsoring Organizations of the TreadwayCommission.
Report on the Consolidated Financial StatementsWe also have audited, in accordance with Canadian generally accepted auditing standards and the standards of the Public Company AccountingOversight Board (United States) (“PCAOB”), the consolidated balance sheets of the Bank as at October 31, 2018, and 2017, the related consolidatedstatements of income, comprehensive income, changes in equity and cash flows for each of the years in the three-year period ended October 31,2018, and the related notes, comprising a summary of significant accounting policies and other explanatory information (collectively referred to asthe “consolidated financial statements”) and our report dated December 4, 2018 expressed an unmodified (unqualified) opinion on thoseconsolidated financial statements.
Basis for OpinionThe Bank’s management is responsible for maintaining effective internal control over financial reporting and for its assessment of the effectiveness ofinternal control over financial reporting, included in the accompanying Management’s Annual Report on Disclosure Controls and Procedures andInternal Control Over Financial Reporting, on page 123 of the Management’s Discussion and Analysis (“MD&A”). Our responsibility is to express anopinion on the Bank’s internal control over financial reporting based on our audit.
We are a public accounting firm registered with the PCAOB and are required to be independent with respect to the Bank in accordance with theU.S. federal securities laws and the applicable rules and regulations of the Securities and Exchange Commission and the PCAOB and in accordancewith the ethical requirements that are relevant to our audit of the financial statements in Canada.
We conducted our audit in accordance with the standards of the PCAOB. Those standards require that we plan and perform the audit to obtainreasonable assurance about whether effective internal control over financial reporting was maintained in all material respects. Our audit of internalcontrol over financial reporting included obtaining an understanding of internal control over financial reporting, assessing the risk that a materialweakness exists, and testing and evaluating the design and operating effectiveness of internal control based on the assessed risk. Our audit alsoincluded performing such other procedures as we considered necessary in the circumstances. We believe that our audit provides a reasonable basisfor our opinion.
Definition and Limitations of Internal Control over Financial ReportingA company’s internal control over financial reporting is a process designed to provide reasonable assurance regarding the reliability of financialreporting and the preparation of financial statements for external purposes in accordance with generally accepted accounting principles. A company’sinternal control over financial reporting includes those policies and procedures that (1) pertain to the maintenance of records that, in reasonabledetail, accurately and fairly reflect the transactions and dispositions of the assets of the company; (2) provide reasonable assurance that transactionsare recorded as necessary to permit preparation of financial statements in accordance with generally accepted accounting principles, and that receiptsand expenditures of the company are being made only in accordance with authorizations of management and directors of the company; and(3) provide reasonable assurance regarding prevention or timely detection of unauthorized acquisition, use, or disposition of the company’s assetsthat could have a material effect on the financial statements.
Because of its inherent limitations, internal control over financial reporting may not prevent or detect misstatements. Also, projections of anyevaluation of effectiveness to future periods are subject to the risk that controls may become inadequate because of changes in conditions, or thatthe degree of compliance with the policies or procedures may deteriorate.
Chartered Professional Accountants, Licensed Public AccountantsDecember 4, 2018Toronto, Canada
142 BMO Financial Group 201st Annual Report 2018
ConsolidatedFinancialStatem
ents
Consolidated Statement of Income
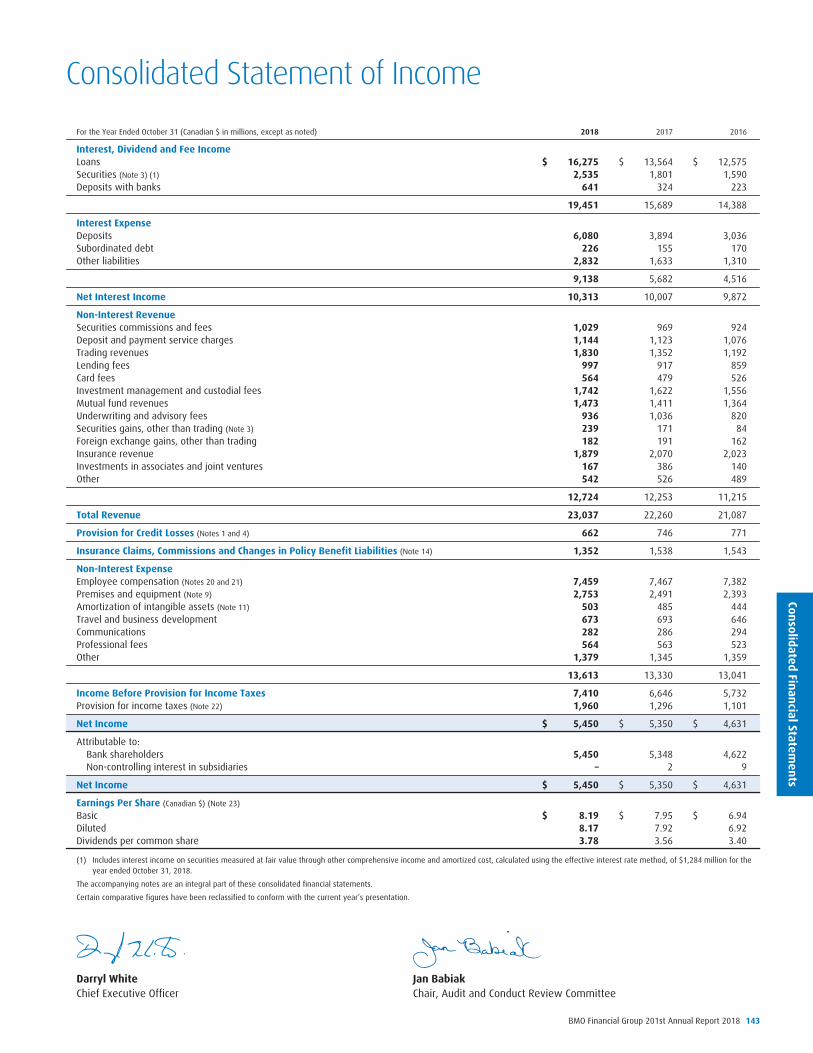
For the Year Ended October 31 (Canadian $ in millions, except as noted) 2018 2017 2016
Interest, Dividend and Fee IncomeLoans $ 16,275 $ 13,564 $ 12,575Securities (Note 3) (1) 2,535 1,801 1,590Deposits with banks 641 324 223
19,451 15,689 14,388
Interest ExpenseDeposits 6,080 3,894 3,036Subordinated debt 226 155 170Other liabilities 2,832 1,633 1,310
9,138 5,682 4,516
Net Interest Income 10,313 10,007 9,872
Non-Interest RevenueSecurities commissions and fees 1,029 969 924Deposit and payment service charges 1,144 1,123 1,076Trading revenues 1,830 1,352 1,192Lending fees 997 917 859Card fees 564 479 526Investment management and custodial fees 1,742 1,622 1,556Mutual fund revenues 1,473 1,411 1,364Underwriting and advisory fees 936 1,036 820Securities gains, other than trading (Note 3) 239 171 84Foreign exchange gains, other than trading 182 191 162Insurance revenue 1,879 2,070 2,023Investments in associates and joint ventures 167 386 140Other 542 526 489
12,724 12,253 11,215
Total Revenue 23,037 22,260 21,087
Provision for Credit Losses (Notes 1 and 4) 662 746 771
Insurance Claims, Commissions and Changes in Policy Benefit Liabilities (Note 14) 1,352 1,538 1,543
Non-Interest ExpenseEmployee compensation (Notes 20 and 21) 7,459 7,467 7,382Premises and equipment (Note 9) 2,753 2,491 2,393Amortization of intangible assets (Note 11) 503 485 444Travel and business development 673 693 646Communications 282 286 294Professional fees 564 563 523Other 1,379 1,345 1,359
13,613 13,330 13,041
Income Before Provision for Income Taxes 7,410 6,646 5,732Provision for income taxes (Note 22) 1,960 1,296 1,101
Net Income $ 5,450 $ 5,350 $ 4,631
Attributable to:Bank shareholders 5,450 5,348 4,622Non-controlling interest in subsidiaries – 2 9
Net Income $ 5,450 $ 5,350 $ 4,631
Earnings Per Share (Canadian $) (Note 23)
Basic $ 8.19 $ 7.95 $ 6.94Diluted 8.17 7.92 6.92Dividends per common share 3.78 3.56 3.40
(1) Includes interest income on securities measured at fair value through other comprehensive income and amortized cost, calculated using the effective interest rate method, of $1,284 million for theyear ended October 31, 2018.
The accompanying notes are an integral part of these consolidated financial statements.
Certain comparative figures have been reclassified to conform with the current year’s presentation.
Darryl White Jan BabiakChief Executive Officer Chair, Audit and Conduct Review Committee
BMO Financial Group 201st Annual Report 2018 143

Cons
olid
ated
Fina
ncia
lSta
tem
ents
CONSOLIDATED FINANCIAL STATEMENTS
Consolidated Statement of Comprehensive Income
For the Year Ended October 31 (Canadian $ in millions) 2018 2017 2016
Net Income $ 5,450 $ 5,350 $ 4,631
Other Comprehensive (Loss), net of taxes (Note 22)
Items that may subsequently be reclassified to net incomeNet change in unrealized gains (losses) on fair value through OCI securities (1)
Unrealized (losses) on fair value through OCI debt securities arising during the year (2) (251) na naUnrealized gains on available-for-sale securities arising during the year (3) na 95 151Reclassification to earnings of (gains) in the year (4) (65) (87) (28)
(316) 8 123
Net change in unrealized (losses) on cash flow hedges(Losses) on derivatives designated as cash flow hedges arising during the year (5) (1,228) (839) (26)Reclassification to earnings of losses on derivatives designated as cash flow hedges (6) 336 61 10
(892) (778) (16)
Net gains (losses) on translation of net foreign operationsUnrealized gains (losses) on translation of net foreign operations 417 (885) 213Unrealized gains (losses) on hedges of net foreign operations (7) (155) 23 41
262 (862) 254
Items that will not be reclassified to net incomeGains (losses) on remeasurement of pension and other employee future benefit plans (8) 261 420 (422)(Losses) on remeasurement of own credit risk on financial liabilities designated at fair value (Note 1) (9) (24) (148) (153)
237 272 (575)
Other Comprehensive (Loss), net of taxes (Note 22) (709) (1,360) (214)
Total Comprehensive Income $ 4,741 $ 3,990 $ 4,417
Attributable to:Bank shareholders 4,741 3,988 4,408Non-controlling interest in subsidiaries – 2 9
Total Comprehensive Income $ 4,741 $ 3,990 $ 4,417
(1) Fiscal 2017 and prior years represent available-for-sale securities (Note 1).(2) Net of income tax recovery of $69 million, na and na for the year ended, respectively.(3) Net of income tax (provision) of na, $(21) million and $(64) million for the year ended, respectively.(4) Net of income tax provision of $23 million, $36 million and $11 million for the year ended, respectively.(5) Net of income tax (provision) recovery of $432 million, $322 million and $(4) million for the year ended, respectively.(6) Net of income tax (recovery) of $(121) million, $(21) million and $(6) million for the year ended, respectively.(7) Net of income tax (provision) recovery of $56 million, $(8) million and $(10) million for the year ended, respectively.(8) Net of income tax (provision) recovery of $(111) million, $(157) million and $156 million for the year ended, respectively.(9) Net of income tax recovery of $6 million, $53 million and $55 million for the year ended, respectively.
na – not applicable due to IFRS 9 adoption.
The accompanying notes are an integral part of these consolidated financial statements.
144 BMO Financial Group 201st Annual Report 2018
ConsolidatedFinancialStatem
ents
Consolidated Balance Sheet
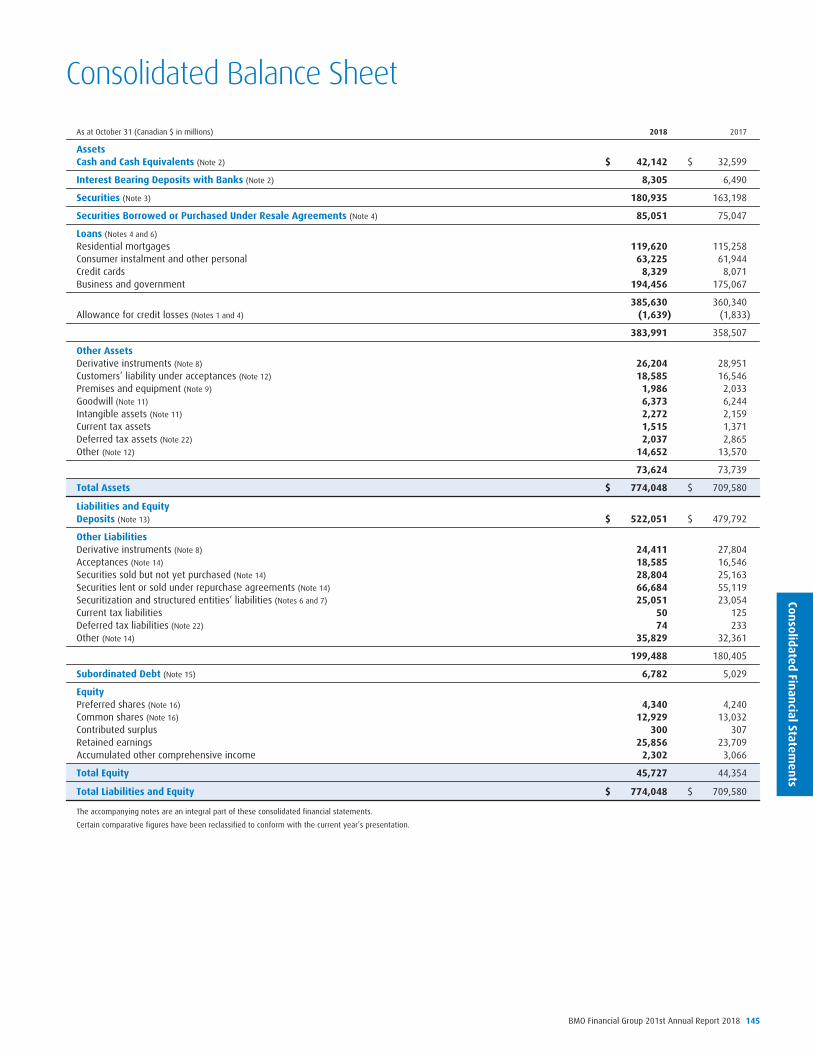
As at October 31 (Canadian $ in millions) 2018 2017
AssetsCash and Cash Equivalents (Note 2) $ 42,142 $ 32,599
Interest Bearing Deposits with Banks (Note 2) 8,305 6,490
Securities (Note 3) 180,935 163,198
Securities Borrowed or Purchased Under Resale Agreements (Note 4) 85,051 75,047
Loans (Notes 4 and 6)
Residential mortgages 119,620 115,258Consumer instalment and other personal 63,225 61,944Credit cards 8,329 8,071Business and government 194,456 175,067
385,630 360,340Allowance for credit losses (Notes 1 and 4) (1,639) (1,833)
383,991 358,507
Other AssetsDerivative instruments (Note 8) 26,204 28,951Customers’ liability under acceptances (Note 12) 18,585 16,546Premises and equipment (Note 9) 1,986 2,033Goodwill (Note 11) 6,373 6,244Intangible assets (Note 11) 2,272 2,159Current tax assets 1,515 1,371Deferred tax assets (Note 22) 2,037 2,865Other (Note 12) 14,652 13,570
73,624 73,739
Total Assets $ 774,048 $ 709,580
Liabilities and EquityDeposits (Note 13) $ 522,051 $ 479,792
Other LiabilitiesDerivative instruments (Note 8) 24,411 27,804Acceptances (Note 14) 18,585 16,546Securities sold but not yet purchased (Note 14) 28,804 25,163Securities lent or sold under repurchase agreements (Note 14) 66,684 55,119Securitization and structured entities’ liabilities (Notes 6 and 7) 25,051 23,054Current tax liabilities 50 125Deferred tax liabilities (Note 22) 74 233Other (Note 14) 35,829 32,361
199,488 180,405
Subordinated Debt (Note 15) 6,782 5,029
EquityPreferred shares (Note 16) 4,340 4,240Common shares (Note 16) 12,929 13,032Contributed surplus 300 307Retained earnings 25,856 23,709Accumulated other comprehensive income 2,302 3,066
Total Equity 45,727 44,354
Total Liabilities and Equity $ 774,048 $ 709,580
The accompanying notes are an integral part of these consolidated financial statements.
Certain comparative figures have been reclassified to conform with the current year’s presentation.
BMO Financial Group 201st Annual Report 2018 145

Cons
olid
ated
Fina
ncia
lSta
tem
ents
CONSOLIDATED FINANCIAL STATEMENTS
Consolidated Statement of Changes in Equity
For the Year Ended October 31 (Canadian $ in millions) 2018 2017 2016
Preferred Shares (Note 16)Balance at beginning of year $ 4,240 $ 3,840 $ 3,240Issued during the year 400 900 600Redeemed during the year (300) (500) –
Balance at End of Year 4,340 4,240 3,840
Common Shares (Note 16)Balance at beginning of year 13,032 12,539 12,313Issued under the Shareholder Dividend Reinvestment and Share Purchase Plan (Note 16) – 448 90Issued under the Stock Option Plan (Note 16) 99 146 136Repurchased for cancellation (Note 16) (202) (101) –
Balance at End of Year 12,929 13,032 12,539
Contributed SurplusBalance at beginning of year 307 294 299Stock option expense, net of options exercised (Note 20) (12) 6 (14)Other 5 7 9
Balance at End of Year 300 307 294
Retained EarningsBalance at beginning of year 23,709 21,205 18,930Impact from adopting IFRS 9 (Note 28) 99 na naNet income attributable to bank shareholders 5,450 5,348 4,622Dividends – Preferred shares (Note 16) (184) (184) (150)
– Common shares (Note 16) (2,424) (2,312) (2,191)Share issue expense (5) (9) (6)Common shares repurchased for cancellation (Note 16) (789) (339) –
Balance at End of Year 25,856 23,709 21,205
Accumulated Other Comprehensive Income (Loss) on Fair Value through OCI Securities, net of taxes (1)Balance at beginning of year 56 48 (75)Impact from adopting IFRS 9 (Note 28) (55) na naUnrealized gains (losses) on fair value through OCI debt securities arising during the year (251) na naUnrealized gains on available-for-sale securities arising during the year na 95 151Reclassification to earnings of (gains) in the year (65) (87) (28)
Balance at End of Year (315) 56 48
Accumulated Other Comprehensive Income (Loss) on Cash Flow Hedges, net of taxesBalance at beginning of year (182) 596 612(Losses) on derivatives designated as cash flow hedges arising during the year (1,228) (839) (26)Reclassification to earnings of losses on derivatives designated as cash flow hedges in the year 336 61 10
Balance at End of Year (1,074) (182) 596
Accumulated Other Comprehensive Income on Translation of Net Foreign Operations, net of taxesBalance at beginning of year 3,465 4,327 4,073Unrealized gains (losses) on translation of net foreign operations 417 (885) 213Unrealized gains (losses) on hedges of net foreign operations (155) 23 41
Balance at End of Year 3,727 3,465 4,327
Accumulated Other Comprehensive Income (Loss) on Pension and Other Employee Future Benefit Plans,net of taxes
Balance at beginning of year (92) (512) (90)Gains (losses) on remeasurement of pension and other employee future benefit plans 261 420 (422)
Balance at End of Year 169 (92) (512)
Accumulated Other Comprehensive Loss on Own Credit Risk on Financial Liabilities Designated at Fair Value,net of taxes
Balance at beginning of year (181) (33) 120(Losses) on remeasurement of own credit risk on financial liabilities designated at fair value (Note 1) (24) (148) (153)
Balance at End of Year (205) (181) (33)
Total Accumulated Other Comprehensive Income 2,302 3,066 4,426
Total Shareholders’ Equity $ 45,727 $ 44,354 $ 42,304
Non-controlling Interest in SubsidiariesBalance at beginning of year – 24 491Net income attributable to non-controlling interest – 2 9Dividends to non-controlling interest – – (10)Redemption/purchase of non-controlling interest – (25) (450)Other – (1) (16)
Balance at End of Year – – 24
Total Equity $ 45,727 $ 44,354 $ 42,328
(1) Fiscal 2017 and prior years represent available-for-sale securities (Note 1).
na – not applicable due to IFRS 9 adoption.
The accompanying notes are an integral part of these consolidated financial statements.
146 BMO Financial Group 201st Annual Report 2018
ConsolidatedFinancialStatem
ents
Consolidated Statement of Cash Flows
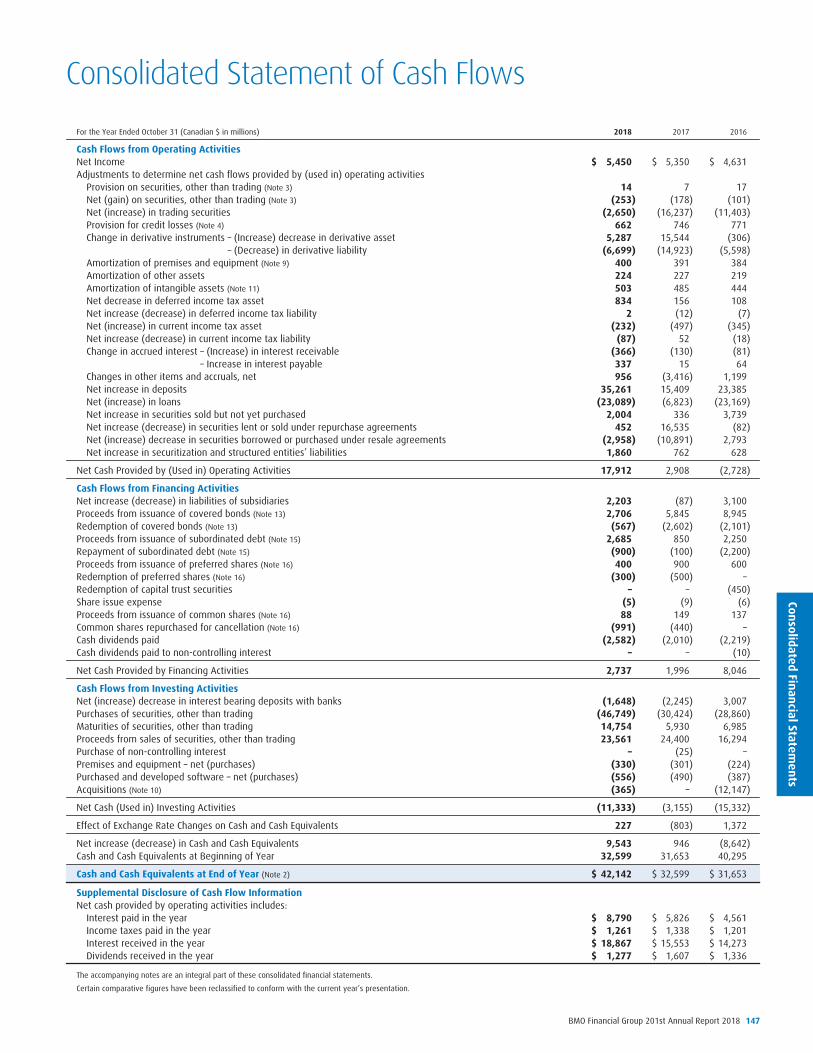
For the Year Ended October 31 (Canadian $ in millions) 2018 2017 2016
Cash Flows from Operating ActivitiesNet Income $ 5,450 $ 5,350 $ 4,631Adjustments to determine net cash flows provided by (used in) operating activities
Provision on securities, other than trading (Note 3) 14 7 17Net (gain) on securities, other than trading (Note 3) (253) (178) (101)Net (increase) in trading securities (2,650) (16,237) (11,403)Provision for credit losses (Note 4) 662 746 771Change in derivative instruments – (Increase) decrease in derivative asset 5,287 15,544 (306)
– (Decrease) in derivative liability (6,699) (14,923) (5,598)Amortization of premises and equipment (Note 9) 400 391 384Amortization of other assets 224 227 219Amortization of intangible assets (Note 11) 503 485 444Net decrease in deferred income tax asset 834 156 108Net increase (decrease) in deferred income tax liability 2 (12) (7)Net (increase) in current income tax asset (232) (497) (345)Net increase (decrease) in current income tax liability (87) 52 (18)Change in accrued interest – (Increase) in interest receivable (366) (130) (81)
– Increase in interest payable 337 15 64Changes in other items and accruals, net 956 (3,416) 1,199Net increase in deposits 35,261 15,409 23,385Net (increase) in loans (23,089) (6,823) (23,169)Net increase in securities sold but not yet purchased 2,004 336 3,739Net increase (decrease) in securities lent or sold under repurchase agreements 452 16,535 (82)Net (increase) decrease in securities borrowed or purchased under resale agreements (2,958) (10,891) 2,793Net increase in securitization and structured entities’ liabilities 1,860 762 628
Net Cash Provided by (Used in) Operating Activities 17,912 2,908 (2,728)
Cash Flows from Financing ActivitiesNet increase (decrease) in liabilities of subsidiaries 2,203 (87) 3,100Proceeds from issuance of covered bonds (Note 13) 2,706 5,845 8,945Redemption of covered bonds (Note 13) (567) (2,602) (2,101)Proceeds from issuance of subordinated debt (Note 15) 2,685 850 2,250Repayment of subordinated debt (Note 15) (900) (100) (2,200)Proceeds from issuance of preferred shares (Note 16) 400 900 600Redemption of preferred shares (Note 16) (300) (500) –Redemption of capital trust securities – – (450)Share issue expense (5) (9) (6)Proceeds from issuance of common shares (Note 16) 88 149 137Common shares repurchased for cancellation (Note 16) (991) (440) –Cash dividends paid (2,582) (2,010) (2,219)Cash dividends paid to non-controlling interest – – (10)
Net Cash Provided by Financing Activities 2,737 1,996 8,046
Cash Flows from Investing ActivitiesNet (increase) decrease in interest bearing deposits with banks (1,648) (2,245) 3,007Purchases of securities, other than trading (46,749) (30,424) (28,860)Maturities of securities, other than trading 14,754 5,930 6,985Proceeds from sales of securities, other than trading 23,561 24,400 16,294Purchase of non-controlling interest – (25) –Premises and equipment – net (purchases) (330) (301) (224)Purchased and developed software – net (purchases) (556) (490) (387)Acquisitions (Note 10) (365) – (12,147)
Net Cash (Used in) Investing Activities (11,333) (3,155) (15,332)
Effect of Exchange Rate Changes on Cash and Cash Equivalents 227 (803) 1,372
Net increase (decrease) in Cash and Cash Equivalents 9,543 946 (8,642)Cash and Cash Equivalents at Beginning of Year 32,599 31,653 40,295
Cash and Cash Equivalents at End of Year (Note 2) $ 42,142 $ 32,599 $ 31,653
Supplemental Disclosure of Cash Flow InformationNet cash provided by operating activities includes:
Interest paid in the year $ 8,790 $ 5,826 $ 4,561Income taxes paid in the year $ 1,261 $ 1,338 $ 1,201Interest received in the year $ 18,867 $ 15,553 $ 14,273Dividends received in the year $ 1,277 $ 1,607 $ 1,336
The accompanying notes are an integral part of these consolidated financial statements.
Certain comparative figures have been reclassified to conform with the current year’s presentation.
BMO Financial Group 201st Annual Report 2018 147
Not
esNOTES TO CONSOLIDATED FINANCIAL STATEMENTS
Note 1: Basis of PresentationBank of Montreal (“the bank”) is a chartered bank under the Bank Act (Canada) and is a public company incorporated in Canada. We are a highlydiversified financial services company, providing a broad range of personal and commercial banking, wealth management and investment bankingproducts and services. The bank’s head office is at 129 rue Saint-Jacques, Montreal, Quebec. Its executive offices are at 100 King Street West, 1 FirstCanadian Place, Toronto, Ontario. Our common shares are listed on the Toronto Stock Exchange (“TSX”) and the New York Stock Exchange.
We have prepared these consolidated financial statements in accordance with International Financial Reporting Standards (“IFRS”) as issued bythe International Accounting Standards Board (“IASB”). We also comply with interpretations of IFRS by our regulator, the Office of the Superintendentof Financial Institutions Canada (“OSFI”).
Our consolidated financial statements have been prepared on a historic cost basis, except for the revaluation of the following items: assets andliabilities held for trading; financial assets and liabilities measured or designated at fair value through profit or loss (“FVTPL”); financial assetsmeasured or designated at fair value through other comprehensive income (“FVOCI”); financial assets and financial liabilities designated as hedgeditems in qualifying fair value hedge relationships; cash-settled share-based payment liabilities; defined benefit pension and other employee futurebenefit liabilities; and insurance-related liabilities.
These consolidated financial statements were authorized for issue by the Board of Directors on December 4, 2018.
Basis of ConsolidationThese consolidated financial statements are inclusive of the financial statements of our subsidiaries as at October 31, 2018. We conduct businessthrough a variety of corporate structures, including subsidiaries, structured entities (“SEs”), associates and joint ventures. Subsidiaries are thoseentities where we exercise control through our ownership of the majority of the voting shares. We also hold interests in SEs, which we consolidatewhen we control the SEs. These are more fully described in Note 7. All of the assets, liabilities, revenues and expenses of our subsidiaries andconsolidated SEs are included in our consolidated financial statements. All intercompany transactions and balances are eliminated on consolidation.
We hold investments in associates, where we exert significant influence over operating, investing and financing decisions (generally companiesin which we own between 20% and 50% of the voting shares). These are accounted for using the equity method. The equity method is also appliedto our investments in joint ventures. Joint ventures are those entities where we exercise joint control through an agreement with other shareholders.Under the equity method of accounting, investments are initially recorded at cost, and the carrying amount is increased or decreased to recognize ourshare of investee net income or loss, including other comprehensive income or loss. Our equity accounted investments are recorded as othersecurities and our share of the net income or loss is recorded in investments in associates and joint ventures, in our Consolidated Statement ofIncome. Any other comprehensive income amounts are reflected in the relevant section of our Consolidated Statement of Comprehensive Income.Additional information regarding accounting for other securities is included in Note 3.
Non-controlling interest in subsidiaries is presented in our Consolidated Balance Sheet as a separate component of equity that is distinct from ourshareholders’ equity. The net income attributable to non-controlling interest in subsidiaries is presented separately in our Consolidated Statement ofIncome.
Specific Accounting PoliciesTo facilitate a better understanding of our consolidated financial statements, we have disclosed our significant accounting policies throughout thefollowing notes with the related financial disclosures by major caption:
Note Topic Page1 Basis of Presentation 1482 Cash and Interest Bearing Deposits with Banks 1533 Securities 1534 Loans and Allowance for Credit Losses 1575 Risk Management 1646 Transfer of Assets 1647 Structured Entities 1658 Derivative Instruments 1679 Premises and Equipment 17510 Acquisitions 17611 Goodwill and Intangible Assets 17612 Other Assets 17813 Deposits 17814 Other Liabilities 17915 Subordinated Debt 181
Note Topic Page16 Equity 18217 Fair Value of Financial Instruments and Trading-Related Revenue 18418 Offsetting of Financial Assets and Financial Liabilities 19019 Capital Management 19120 Employee Compensation – Share-Based Compensation 19221 Employee Compensation – Pension and Other Employee Future
Benefits 19422 Income Taxes 19823 Earnings Per Share 20024 Commitments, Guarantees, Pledged Assets, Provisions and
Contingent Liabilities 20125 Operating and Geographic Segmentation 20326 Significant Subsidiaries 20627 Related Party Transactions 20628 Transition to IFRS 9 207
Translation of Foreign CurrenciesWe conduct business in a variety of foreign currencies and present our consolidated financial statements in Canadian dollars, which is our functionalcurrency. Monetary assets and liabilities, as well as non-monetary assets and liabilities measured at fair value that are denominated in foreigncurrencies, are translated into Canadian dollars at the exchange rate in effect at the balance sheet date. Non-monetary assets and liabilities notmeasured at fair value are translated into Canadian dollars at historical rates. Revenues and expenses denominated in foreign currencies aretranslated using the average exchange rate for the year.
Unrealized gains and losses arising from translating our net investment in foreign operations into Canadian dollars, net of related hedgingactivities and applicable income taxes, are included in our Consolidated Statement of Comprehensive Income within net gain (loss) on translation ofnet foreign operations. When we dispose of a foreign operation such that control, significant influence or joint control is lost, the cumulative amountof the translation gain (loss) and any applicable hedging activities and related income taxes is reclassified to our Consolidated Statement of Income aspart of the gain or loss on disposition.
148 BMO Financial Group 201st Annual Report 2018
Notes
Foreign currency translation gains and losses on equity securities measured at FVOCI that are denominated in foreign currencies are included inaccumulated other comprehensive income on FVOCI equity securities, net of taxes, in our Consolidated Statement of Changes in Equity. All otherforeign currency translation gains and losses are included in foreign exchange, other than trading, in our Consolidated Statement of Income as theyarise.
From time to time, we enter into foreign exchange hedge contracts to reduce our exposure to changes in the value of foreign currencies.Realized and unrealized gains and losses that arise on the mark-to-market of foreign exchange contracts related to economic hedges are included innon-interest revenue in our Consolidated Statement of Income. Changes in the fair value of derivative contracts that qualify as accounting hedges arerecorded in our Consolidated Statement of Comprehensive Income within net change in unrealized gains (losses) on derivatives designated as cashflow hedges, with the spot/forward differential (the difference between the foreign currency exchange rate at the inception of the contract and therate at the end of the contract) recorded in interest income (expense) over the term of the hedge.
RevenueDividend IncomeDividend income is recognized when the right to receive payment is established. This is the ex-dividend date for listed equity securities.
Fee IncomeSecurities commissions and fees are earned in Wealth Management and Capital Markets on brokerage transactions executed for customers,generally as a fixed fee per share traded, where the commissions and related clearing expense are recognized on trade date. There are also feesbased on a percentage of the customer’s portfolio holdings that entitle clients to investment advice and a certain number of trades which arerecorded over the period to which they relate.
Deposit and payment service charges are primarily earned in Personal and Commercial Banking and include monthly account maintenance fees andother activity-based fees earned on deposit and cash management services. Fees are recognized over time or at a point in time, i.e. over the periodthat account maintenance and cash management services are provided, or when an income-generating activity is performed.
Card fees arise in Personal and Commercial Banking and primarily include interchange income, late fees and annual fees. Card fees are recordedwhen the related services are provided, except for annual fees, which are recorded evenly throughout the year. Interchange income is calculated as apercentage of the transaction amount and/or a fixed price per transaction as established by the payment network and is recognized when the cardtransaction is settled. Reward costs for certain of our cards are recorded as a reduction in card fees.
Investment management and custodial fees are earned in Wealth Management and are based primarily on the balance of assets undermanagement or assets under administration, as at the period end, for investment management, custodial, estate and trustee services provided. Feesare recorded over the period the services are performed.
Mutual fund revenues arise in Wealth Management and are earned on fund management services which are primarily calculated and recordedbased on a percentage of the fund’s net asset value. The fees are recorded over the period the services are performed.
Underwriting and advisory fees are earned in Capital Markets and arise from securities offerings in which we act as an underwriter or agent,structuring and administering loan syndications and fees earned from providing merger-and-acquisition services and structuring advice. Underwritingand advisory fees are generally recognized when the services or milestones are completed.
LeasesWe are lessors in both financing leases and operating leases. Leases are classified as financing leases if they transfer substantially all the risks andrewards incidental to ownership of the leased asset to the lessee. Otherwise they are classified as operating leases, as we retain substantially all therisks and rewards of asset ownership.
As lessor in a financing lease, a loan is recognized equal to the investment in the lease, which is calculated as the present value of the minimumpayments to be received from the lessee, discounted at the interest rate implicit in the lease, plus any unguaranteed residual value we expect torecover at the end of the lease. Finance lease income is recognized in interest, dividend and fee income, loans, in our Consolidated Statement ofIncome.
Assets under operating leases are recorded in other assets in our Consolidated Balance Sheet. Rental income is recognized on a straight-line basisover the term of the lease in non-interest revenue, other, in our Consolidated Statement of Income. Depreciation on these assets is recognized on astraight-line basis over the life of the lease in non-interest expense, other, in our Consolidated Statement of Income.
Assets Held-for-SaleNon-current non-financial assets classified as held-for-sale are measured at the lower of their carrying amount and fair value less costs to sell and arepresented within other assets in our Consolidated Balance Sheet. Subsequent to its initial classification, a non-current asset is no longer depreciatedor amortized, and any subsequent write-down in fair value less costs to sell is recognized in non-interest revenue, other, in our ConsolidatedStatement of Income.
Changes in Accounting PoliciesFinancial InstrumentsEffective November 1, 2017 we adopted IFRS 9 Financial Instruments (“IFRS 9”), which replaces IAS 39 Financial Instruments: Recognition andMeasurement (“IAS 39”). IFRS 9 addresses impairment, classification and measurement, and hedge accounting. The impact to shareholders’ equity atNovember 1, 2017 was an increase of $70 million ($44 million after-tax) related to the impairment requirements of the standard. Prior periods havenot been restated. Refer to Note 28, Transition to IFRS 9, for the impact on the opening balance sheet at November 1, 2017 and for accountingpolicies under IAS 39, which were applicable in prior periods.
BMO Financial Group 201st Annual Report 2018 149

Not
esNOTES TO CONSOLIDATED FINANCIAL STATEMENTS
ImpairmentIFRS 9 introduces a new expected credit loss (“ECL”) impairment model for all financial assets and certain off-balance sheet loan commitments andguarantees. The new ECL model results in an allowance for credit losses being recorded on financial assets regardless of whether there has been anactual impairment. This differs from our previous approach where the allowance recorded on performing loans was designed to capture only incurredlosses whether or not they have been specifically identified.
The ECL model requires the recognition of credit losses based on up to 12 months of expected losses for performing loans (Stage 1) and therecognition of lifetime expected losses on performing loans that have experienced a significant increase in credit risk since origination (Stage 2).
The determination of a significant increase in credit risk takes into account many different factors and will vary by product and risk segment. Themain factors considered in making this determination are relative changes in probability-weighted probability of default since origination and certainother criteria such as 30-day past due and watchlist status. The allowance for assets in Stage 2 will be higher than for those in Stage 1 as a result ofthe longer time horizon associated with this stage. Stage 3 requires the recognition of lifetime losses for all credit impaired assets.
IFRS 9 requires consideration of past events, current market conditions and reasonable supportable information about future economicconditions, in determining whether there has been a significant increase in credit risk and in calculating the amount of expected losses. The standardalso requires future economic conditions be based on an unbiased, probability-weighted assessment of possible future outcomes.
In considering the lifetime of an instrument, IFRS 9 generally requires the use of the contractual period, including pre-payment, extension andother options. For revolving instruments, such as credit cards, that may not have a defined contractual period, lifetime is based on historicalbehaviour.
Classification and MeasurementDebt instruments, including loans, are classified based on both our business model for managing the assets and the contractual cash flowcharacteristics of the assets. Debt instruments are measured at fair value through profit or loss (“FVTPL”) unless certain conditions are met that permitmeasurement at either fair value through other comprehensive income (“FVOCI”) or amortized cost.
FVOCI is permitted where debt instruments are held with the objective of selling the assets or collecting contractual cash flows and those cashflows represent solely payments of principal and interest. These securities may be sold in response to or in anticipation of changes in interest ratesand resulting prepayment risk, changes in credit risk, changes in foreign currency risk, changes in funding sources or terms, or to meet liquidityneeds. Changes in fair value are recorded in other comprehensive income; gains or losses on disposal and impairment losses are recorded in ourConsolidated Statement of Income.
Amortized cost is permitted where debt instruments are held with the objective of collecting contractual cash flows and those cash flowsrepresent solely payments of principal and interest. Gains or losses on disposal and impairment losses are recorded in our Consolidated Statement ofIncome.
For both FVOCI and amortized cost instruments, premiums, discounts and transaction costs are amortized over the term of the instrument on aneffective yield basis as an adjustment to interest income.
Equity instruments are measured at FVTPL unless we elect to measure at FVOCI, in which case gains and losses are never recognized in income.As permitted by IFRS 9, in fiscal 2015, we have early adopted the provisions relating to the recognition of changes in own credit risk for financial
liabilities designated at FVTPL.Additional information regarding changes in own credit risk is included in Notes 13 and 14.
Hedge AccountingIFRS 9 introduced a new hedge accounting model that expands the scope of hedged items and risks eligible for hedge accounting and aligns hedgeaccounting more closely with risk management. The new model no longer specifies quantitative measures for effectiveness testing and does notpermit hedge de-designation. IFRS 9 includes a policy choice that allows us to continue to apply the existing hedge accounting rules, which we haveelected to use. However, as required by the standard, we adopted the new hedge accounting disclosures. Refer to Note 8.
Use of Estimates and JudgmentsThe preparation of the consolidated financial statements requires management to use estimates and assumptions that affect the carrying amounts ofcertain assets and liabilities, certain amounts reported in net income and other related disclosures.
The most significant assets and liabilities for which we must make estimates include allowance for credit losses; financial instruments measuredat fair value; pension and other employee future benefits; impairment of securities; income taxes and deferred taxes; goodwill and intangible assets;insurance-related liabilities; and provisions. We make judgments in assessing whether substantially all risks and rewards have been transferred inrespect of transfers of financial assets and whether we control SEs, as discussed in Notes 6 and 7, respectively. If actual results were to differ fromthe estimates, the impact would be recorded in future periods.
We have established detailed policies and control procedures that are intended to ensure these judgments are well controlled, independentlyreviewed and consistently applied from period to period. We believe that our estimates of the value of our assets and liabilities are appropriate.
Allowance for Credit LossesThe expected credit loss model requires the recognition of credit losses based on up to 12 months of expected losses for performing loans and therecognition of lifetime losses on performing loans that have experienced a significant increase in credit risk since origination.
The determination of a significant increase in credit risk takes into account many different factors and varies by product and risk segment. Themain factors considered in making this determination are relative changes in probability of default since origination, and certain other criteria, such as30-day past due and watchlist status. The assessment of a significant increase in credit risk requires experienced credit judgment.
In determining whether there has been a significant increase in credit risk and in calculating the amount of expected credit losses, we must relyon estimates and exercise judgment regarding matters for which the ultimate outcome is unknown. These judgments include changes incircumstances that may cause future assessments of credit risk to be materially different from current assessments, which could require an increaseor decrease in the allowance for credit losses.
The calculation of expected credit losses includes the explicit incorporation of forecasts of future economic conditions. We have developedmodels incorporating specific macroeconomic variables that are relevant to each portfolio. Key economic variables for our retail portfolios includeprimary operating markets of Canada, the United States and regional markets where considered significant. Forecasts are developed internally by our
150 BMO Financial Group 201st Annual Report 2018

Notes
Economics group, considering external data and our view of future economic conditions. We exercise experienced credit judgment to incorporatemultiple economic forecasts which are probability-weighted in the determination of the final expected credit loss. The allowance is sensitive tochanges in both economic forecasts and the probability weight assigned to each forecast scenario.
Additional information regarding the allowance for credit losses is included in Notes 4 and 28.
Financial Instruments Measured at Fair ValueFair value measurement techniques are used to value various financial assets and financial liabilities and are used in performing impairment testingon certain non-financial assets. Detailed discussions of our fair value measurement techniques are included in Note 17.
Pension and Other Employee Future BenefitsOur pension and other employee future benefits expense is calculated by our independent actuaries using assumptions determined by management.If actual experience were to differ from the assumptions used, we would recognize this difference in other comprehensive income.
Pension and other employee future benefits expense, plan assets and defined benefit obligations are also sensitive to changes in discount rates.We determine discount rates for all of our plans using high-quality AA rated corporate bond yields with terms matching the plans’ specific cash flows.
Additional information regarding our accounting for pension and other employee future benefits is included in Note 21.
Impairment of SecuritiesWe review other securities at each quarter-end reporting period to identify and evaluate investments that show indications of possible impairment.For these equity securities, a significant or prolonged decline in the fair value of a security below its cost is objective evidence of impairment.
Debt securities measured at amortized cost or FVOCI are assessed for impairment using the expected credit loss model. For securities determinedto have low credit risk, the allowance for credit losses is measured at a 12 month expected credit loss.
Additional information regarding our accounting for debt securities measured at amortized cost or FVOCI and other securities, allowance for creditlosses and the determination of fair value is included in Notes 3 and 17.
Income Taxes and Deferred Tax AssetsThe provision for income taxes is calculated based on the expected tax treatment of transactions recorded in either our Consolidated Statement ofIncome or Consolidated Statement of Changes in Equity. In determining the provision for income taxes, we interpret tax legislation, case law andadministrative positions in numerous jurisdictions and, based on our judgment, record our estimate of the amount required to settle tax obligations.We also make assumptions about the expected timing of the reversal of deferred tax assets and liabilities. If our interpretations differ from those oftaxing authorities or if the timing of reversals is not as expected, our provision for income taxes could increase or decrease in future periods. Theamount of any such increase or decrease cannot be reasonably estimated.
Deferred tax assets are recognized only when it is probable that sufficient taxable profit will be available in future periods against whichdeductible temporary differences may be utilized. We are required to assess whether it is probable that our deferred income tax assets will berealized prior to expiration and, based on all the available evidence, determine if any portion of our deferred income tax assets should not berecognized. The factors used to assess the probability of realization are our past experience of income and capital gains, our forecast of future netincome before taxes, and the period remaining before the expiration of tax loss carryforwards. Changes in our assessment of these factors couldincrease or decrease our provision for income taxes in future periods.
Additional information regarding our accounting for income taxes is included in Note 22.
Goodwill and Intangible AssetsFor the purpose of impairment testing, goodwill is allocated to our groups of cash-generating units (“CGUs”), which represent the lowest level withinthe bank at which goodwill is monitored for internal management purposes. Impairment testing is performed at least annually, by comparing thecarrying values and the recoverable amounts of the CGUs to which goodwill has been allocated to determine whether the recoverable amount ofeach group is greater than its carrying value. If the carrying value of the group were to exceed its recoverable amount, an impairment calculationwould be performed. The recoverable amount of a CGU is the higher of its fair value less costs to sell and the value in use.
In determining fair value less costs to sell, we employ a discounted cash flow model consistent with those used when we acquire businesses.This model is dependent on assumptions related to revenue growth, discount rates, synergies achieved on acquisition and the availability ofcomparable acquisition data. Changes in any of these assumptions would affect the determination of fair value for each of the business units in adifferent manner. Management must exercise judgment and make assumptions in determining fair value less costs to sell, and differences injudgment and assumptions could affect the determination of fair value and any resulting impairment write-down.
Intangible assets with a definite life are amortized to income on either a straight-line or an accelerated basis over a period not exceeding 15years, depending on the nature of the asset. We test definite-life intangible assets for impairment when circumstances indicate the carrying valuemay not be recoverable. Indefinite-life intangible assets are tested annually for impairment. If any intangible assets are determined to be impaired,we write them down to their recoverable amount, the higher of value in use and fair value less costs to sell, when this is less than the carrying value.
Additional information regarding goodwill and intangible assets is included in Note 11.
Insurance-Related LiabilitiesInsurance claims and policy benefit liabilities represent current claims and estimates of future insurance policy benefit liabilities. Liabilities for lifeinsurance contracts are determined using the Canadian Asset Liability Method, which incorporates best-estimate assumptions for mortality, morbidity,policy lapses, surrenders, future investment yields, policy dividends, administration costs and margins for adverse deviation. These assumptions arereviewed at least annually and updated to reflect actual experience and market conditions. The most significant impact on the valuation of a liabilitywould result from a change in the assumption for future investment yields.
Additional information regarding insurance-related liabilities is included in Note 14.
BMO Financial Group 201st Annual Report 2018 151

Not
esNOTES TO CONSOLIDATED FINANCIAL STATEMENTS
ProvisionsThe bank and its subsidiaries are involved in various legal actions in the ordinary course of business.
Provisions are recorded at the best estimate of the amounts required to settle any obligations related to these legal actions as at the balancesheet date, taking into account the risks and uncertainties associated with the obligation. Factors considered in making the assessment include: acase-by-case assessment of specific facts and circumstances, our past experience and the opinions of legal experts. Management and external expertsare involved in estimating any provisions. The actual costs of resolving these claims may be substantially higher or lower than the amounts of theprovisions.
Additional information regarding provisions is included in Note 24.
Transfer of Financial Assets and Consolidation of Structured EntitiesWe enter into transactions in which we transfer assets, typically mortgage loans and credit cards, to a structured entity or third party to obtainalternate sources of funding. We assess whether substantially all of the risks and rewards of the loans have been transferred to determine if theyqualify for derecognition. Since we continue to be exposed to substantially all of the repayment, interest rate and/or credit risk associated with thesecuritized loans, they do not qualify for derecognition. We continue to recognize the loans and the related cash proceeds as secured financings in ourConsolidated Balance Sheet.
For securitization vehicles sponsored by the bank, the vehicles typically have limited decision-making authority. The structure of these vehicleslimits the activities they can undertake, the types of assets they can hold and how activities are funded. We control and consolidate these vehicleswhen we have the key decision-making powers necessary to obtain the majority of the benefits of their activities.
For certain investments in limited partnerships, we exercise judgment in determining whether we control an entity. Based on an assessment ofour interests and rights, we have determined that we do not control certain entities, even though we may have an ownership interest greater than50%. This may be the case when we are not the general partner in an arrangement and the general partner’s rights most significantly affect thereturns of the entity. Additionally, we have determined that we control certain entities despite having an ownership interest less than 50%. This maybe the case when we are the general partner in an arrangement and the general partner’s rights most significantly affect the returns of the entity.
Transferred assets are discussed in greater detail in Note 6 and structured entities are discussed in greater detail in Notes 7 and 20.
Future Changes in IFRSRevenueIn May 2014, the IASB issued IFRS 15 Revenue from Contracts with Customers (“IFRS 15”), which replaces the existing standards for revenuerecognition. The new standard establishes a framework for the recognition and measurement of revenues generated from contracts with customers,providing a principles-based approach for revenue recognition, and introduces the concept of recognizing revenue for performance obligations as theyare satisfied. Revenues outside of the scope of IFRS 15 include interest and dividend income, trading revenues, securities gains/losses, insurancerevenues, investments in associates and joint ventures and lease income. The standard also requires additional disclosures about the nature, amount,timing and uncertainty of revenues and cash flows arising from transactions with our customers.
In April 2016, the IASB issued clarifications to IFRS 15, which provided additional clarity on revenue recognition related to identifyingperformance obligations, application guidance on principal versus agent and licences of intellectual property.
The primary impact of IFRS 15 will be the reclassification of amounts within the Consolidated Statement of Income. Loyalty rewards and cashpromotion costs on cards currently recorded in non-interest expense will be presented as a reduction in non-interest revenue. Reimbursement ofcertain expenses incurred on behalf of customers currently recorded as a reduction in non-interest expense will be recorded in non-interest revenue.In addition, there will be minimal impacts to net income as a result of no longer discounting our loyalty rewards costs and the amortization of costs toobtain card customers, which are currently expensed as incurred.
On transition to IFRS 15 on November 1, 2018, we can either restate prior periods as if we had always applied IFRS 15 or alternatively, we canrecognize the cumulative effect of any changes resulting from our adoption of IFRS 15 in opening retained earnings with no comparison for prioryears. We have elected to restate prior periods.
The impact of adopting IFRS 15 in 2018 and 2017 would have been a decrease in non-interest revenue of $132 million and $153 million,a decrease in non-interest expense of $136 million and $138 million, and an increase in net income of $3 million and a decrease in net income of$11 million, in our Consolidated Statement of Income, respectively. The impact in our Consolidated Balance Sheet as at October 31, 2018 and 2017 isnot significant.
Share-based PaymentIn June 2016, the IASB issued amendments to IFRS 2 Share-based Payment (“IFRS 2”) in relation to the classification and measurement of share-based payment transactions. The amendments will not have a significant impact on our consolidated financial statements. The amendments areeffective for our fiscal year beginning November 1, 2018.
LeasesIn January 2016, the IASB issued IFRS 16 Leases (“IFRS 16”), which provides guidance for leases whereby lessees will recognize a liability for thepresent value of future lease liabilities and record a corresponding asset on the balance sheet for most leases. There are minimal changes to lessoraccounting. IFRS 16 is effective for our fiscal year beginning November 1, 2019.
In order to meet the requirements of IFRS 16, we have established an enterprise-wide project and are currently assessing the impact of thestandard on our future financial results. The main impact identified to date is the requirement to record real estate leases on balance sheet. Currently,most of our real estate leases are classified as operating leases, whereby we record lease expense over the term of the lease with no asset orliability recorded on the balance sheet other than any related leasehold improvements. Under IFRS 16, we will recognize a right-of-use asset and alease liability on the balance sheet. There will be no significant impact on our lessor businesses.
When we adopt IFRS 16, we can either recognize the cumulative effect of any changes resulting from our adoption of IFRS 16 in opening retainedearnings with no comparison for prior years or alternatively, we can restate prior periods as if we had always applied IFRS 16. We are assessing ourtransition approach as part of our project.
152 BMO Financial Group 201st Annual Report 2018

Notes
Insurance ContractsIn May 2017, the IASB issued IFRS 17 Insurance Contracts (“IFRS 17”), which provides a comprehensive approach to accounting for all types ofinsurance contracts and will replace the existing IFRS 4 Insurance Contracts. In November 2018, the IASB tentatively decided to defer the effectivedate of IFRS 17 by one year, which would change the anticipated effective date for the bank to November 1, 2022. We will continue to closelymonitor the ongoing discussions at the IASB. We are currently assessing the impact of the standard on our future financial results.
Conceptual FrameworkIn March 2018, the IASB issued the revised Conceptual Framework (“Framework”), which sets out the fundamental concepts for financial reporting toensure consistency in standard-setting decisions and that similar transactions are treated in a similar way, so as to provide useful information to usersof financial statements. The revised Framework, which is effective for our fiscal year beginning November 1, 2020, will inform future standard-settingdecisions but does not impact existing IFRS. We do not expect the Framework to have a significant impact on our accounting policies.
Note 2: Cash and Interest Bearing Deposits with Banks(Canadian $ in millions) 2018 2017
Cash and deposits with banks (1) 40,738 30,002Cheques and other items in transit, net 1,404 2,597
Total cash and cash equivalents 42,142 32,599
(1) Includes deposits with the Bank of Canada, the U.S. Federal Reserve and other central banks.
Cheques and Other Items in Transit, NetCheques and other items in transit are recorded at cost and represent the net position of the uncleared cheques and other items in transit between usand other banks.
Cash RestrictionsCertain of our foreign operations are required to maintain reserves or minimum balances with central banks in their respective countries of operation,totalling $1,655 million as at October 31, 2018 ($1,435 million in 2017).
Interest Bearing Deposits with BanksDeposits with banks are recorded at amortized cost and include acceptances we have purchased that were issued by other banks. Interest incomeearned on these deposits is recorded on an accrual basis.
Note 3: SecuritiesSecurities are divided into six types, each with a different purpose and accounting treatment. The types of securities we hold are as follows:
Trading securities are securities purchased for resale over a short period of time. Trading securities are recorded at fair value through profit or loss.Transaction costs and changes in fair value are recorded in our Consolidated Statement of Income in trading revenues.
Fair value through profit or loss securities are measured at fair value with changes in fair value and related transaction costs recorded in ourConsolidated Statement of Income in securities gains and losses, other than trading, except as noted below. This category includes the following:
Securities Designated at FVTPLIn order to qualify for this designation, the security must have reliably measurable fair values and the designation eliminates or significantly reducesthe inconsistent treatment that would otherwise arise from measuring the gains and losses on a different basis. Securities must be designated oninitial recognition, and the designation is irrevocable. If these securities were not designated at FVTPL, they would be accounted for as either FVOCI oramortized cost.
We designate certain securities held by our insurance subsidiaries that support our insurance liabilities at fair value through profit or loss sincethe actuarial calculation of insurance liabilities is based on the fair value of the investments supporting them. This designation aligns the accountingresult with the way the portfolio is managed on a fair value basis. The change in fair value of the securities is recorded in non-interest revenue,insurance revenue and the change in fair value of the liabilities is recorded in insurance claims, commissions and changes in policy benefit liabilities.The fair value of these investments as at October 31, 2018 of $8,783 million ($8,465 million as at October 31, 2017) is recorded in securities in ourConsolidated Balance Sheet. The impact of recording these investments at fair value through profit or loss was a decrease of $372 million in non-interest revenue, insurance revenue, for the year ended October 31, 2018 (increase of $39 million for the year ended October 31, 2017).
Securities Mandatorily Measured at FVTPLSecurities managed on a fair value basis, but not held for trading, or debt securities whose cash flows do not represent solely payments of principaland interest and equity securities not held for trading are classified as FVTPL.
Debt securities measured at amortized cost are debt securities purchased with the objective of collecting contractual cash flows and those cashflows represent solely payments of principal and interest. These securities are initially recorded at fair value plus transaction costs and subsequentlymeasured at amortized cost using the effective interest method. Impairment losses (recoveries) are recorded in our Consolidated Statement ofIncome in securities gains, other than trading. Interest income earned and amortization of premiums, discounts and transaction costs are recorded inour Consolidated Statement of Income in interest, dividend and fee income, securities.
BMO Financial Group 201st Annual Report 2018 153

Not
esNOTES TO CONSOLIDATED FINANCIAL STATEMENTS
Debt securities measured at FVOCI are debt securities purchased with the objective of both collecting contractual cash flows and selling thesecurities. The securities’ cash flows represent solely payments of principal and interest. These securities may be sold in response to or in anticipationof changes in interest rates and resulting prepayment risk, changes in credit risk, changes in foreign currency risk, changes in funding sources orterms, or to meet liquidity needs.
Debt securities measured at FVOCI are initially recorded at fair value plus transaction costs. They are subsequently measured at fair value, withunrealized gains and losses recorded in our Consolidated Statement of Comprehensive Income until the security is sold or impaired. Gains and losseson disposal and impairment losses (recoveries) are recorded in our Consolidated Statement of Income in non-interest revenue, securities gains, otherthan trading. Interest income earned is recorded in our Consolidated Statement of Income in interest, dividend and fee income, securities using theeffective interest method.
Equity securities measured at FVOCI are equity securities where we have elected to record changes in the fair value of the instrument in othercomprehensive income as opposed to fair value through profit or loss. Gains or losses recorded on these instruments will never be recognized inprofit or loss. Equity securities measured at FVOCI are not subject to an impairment assessment.
Other securities are investments in associates and joint ventures where we exert significant influence over operating, investing and financingdecisions (generally companies in which we own between 20% and 50% of the voting shares). These are accounted for using the equity method ofaccounting. Our share of the net income or loss is recorded in investments in associates and joint ventures in our Consolidated Statement of Income.Any other comprehensive income amounts are reflected in the relevant section of our Consolidated Statement of Comprehensive Income.
We account for all of our securities transactions using settlement date accounting in our Consolidated Balance Sheet. Changes in fair value betweenthe trade date and settlement date are recorded in net income, except for those related to securities measured at FVOCI, which are recorded in othercomprehensive income.
Impairment ReviewDebt securities classified as amortized cost or FVOCI are assessed for impairment using the ECL model, with the exception of securities determined tohave low credit risk where the allowance for credit losses is measured at a 12 month expected credit loss. A financial asset is considered to have lowcredit risk if the financial asset has a low risk of default, the borrower has a strong capacity to meet its contractual cash flow obligations in the nearterm and adverse changes in economic and business conditions in the longer term may, but will not necessarily, reduce the ability of the borrower tofulfill its contractual cash flow obligations.
Classification of SecuritiesOur securities are classified as at October 31, 2018 under IFRS 9 and as at October 31, 2017 under IAS 39 as follows:
(Canadian $ in millions) 2018 2017
Trading 99,697 99,069FVTPL (1) 11,611 naFVOCI - Debt and Equity (2) 62,440 naAvailable-for-sale na 54,075Amortized cost (3) 6,485 naHeld-to-maturity na 9,094Other 702 960
180,935 163,198
(1) Comprised of $2,828 million mandatorily measured at fair value and $8,783 million designated at fair value.(2) Includes allowances for credit losses on FVOCI debt securities of $2 million (na at October 31, 2017).(3) Net of allowances for credit losses of $1 million (na at October 31, 2017).
na – not applicable due to IFRS 9 adoption.
Fair Value MeasurementFor traded securities, quoted market value is considered to be fair value. Quoted market value is based on bid prices. For securities where marketquotes are not available, we use estimation techniques to determine fair value. A discussion of fair value measurement is included in Note 17.
154 BMO Financial Group 201st Annual Report 2018
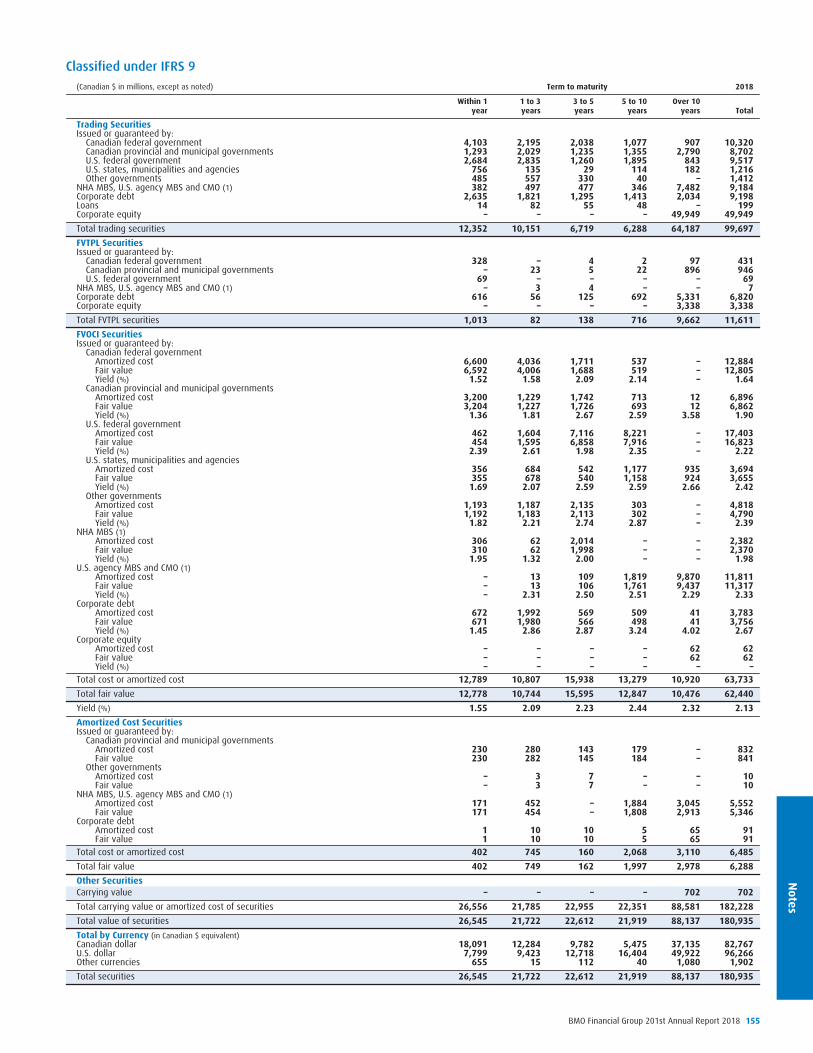
Notes
Classified under IFRS 9(Canadian $ in millions, except as noted) Term to maturity 2018
Within 1year
1 to 3years
3 to 5years
5 to 10years
Over 10years Total
Trading SecuritiesIssued or guaranteed by:
Canadian federal government 4,103 2,195 2,038 1,077 907 10,320Canadian provincial and municipal governments 1,293 2,029 1,235 1,355 2,790 8,702U.S. federal government 2,684 2,835 1,260 1,895 843 9,517U.S. states, municipalities and agencies 756 135 29 114 182 1,216Other governments 485 557 330 40 – 1,412
NHA MBS, U.S. agency MBS and CMO (1) 382 497 477 346 7,482 9,184Corporate debt 2,635 1,821 1,295 1,413 2,034 9,198Loans 14 82 55 48 – 199Corporate equity – – – – 49,949 49,949Total trading securities 12,352 10,151 6,719 6,288 64,187 99,697FVTPL SecuritiesIssued or guaranteed by:
Canadian federal government 328 – 4 2 97 431Canadian provincial and municipal governments – 23 5 22 896 946U.S. federal government 69 – – – – 69
NHA MBS, U.S. agency MBS and CMO (1) – 3 4 – – 7Corporate debt 616 56 125 692 5,331 6,820Corporate equity – – – – 3,338 3,338Total FVTPL securities 1,013 82 138 716 9,662 11,611FVOCI SecuritiesIssued or guaranteed by:
Canadian federal governmentAmortized cost 6,600 4,036 1,711 537 – 12,884Fair value 6,592 4,006 1,688 519 – 12,805Yield (%) 1.52 1.58 2.09 2.14 – 1.64
Canadian provincial and municipal governmentsAmortized cost 3,200 1,229 1,742 713 12 6,896Fair value 3,204 1,227 1,726 693 12 6,862Yield (%) 1.36 1.81 2.67 2.59 3.58 1.90
U.S. federal governmentAmortized cost 462 1,604 7,116 8,221 – 17,403Fair value 454 1,595 6,858 7,916 – 16,823Yield (%) 2.39 2.61 1.98 2.35 – 2.22
U.S. states, municipalities and agenciesAmortized cost 356 684 542 1,177 935 3,694Fair value 355 678 540 1,158 924 3,655Yield (%) 1.69 2.07 2.59 2.59 2.66 2.42
Other governmentsAmortized cost 1,193 1,187 2,135 303 – 4,818Fair value 1,192 1,183 2,113 302 – 4,790Yield (%) 1.82 2.21 2.74 2.87 – 2.39
NHA MBS (1)Amortized cost 306 62 2,014 – – 2,382Fair value 310 62 1,998 – – 2,370Yield (%) 1.95 1.32 2.00 – – 1.98
U.S. agency MBS and CMO (1)Amortized cost – 13 109 1,819 9,870 11,811Fair value – 13 106 1,761 9,437 11,317Yield (%) – 2.31 2.50 2.51 2.29 2.33
Corporate debtAmortized cost 672 1,992 569 509 41 3,783Fair value 671 1,980 566 498 41 3,756Yield (%) 1.45 2.86 2.87 3.24 4.02 2.67
Corporate equityAmortized cost – – – – 62 62Fair value – – – – 62 62Yield (%) – – – – – –
Total cost or amortized cost 12,789 10,807 15,938 13,279 10,920 63,733Total fair value 12,778 10,744 15,595 12,847 10,476 62,440Yield (%) 1.55 2.09 2.23 2.44 2.32 2.13Amortized Cost SecuritiesIssued or guaranteed by:
Canadian provincial and municipal governmentsAmortized cost 230 280 143 179 – 832Fair value 230 282 145 184 – 841
Other governmentsAmortized cost – 3 7 – – 10Fair value – 3 7 – – 10
NHA MBS, U.S. agency MBS and CMO (1)Amortized cost 171 452 – 1,884 3,045 5,552Fair value 171 454 – 1,808 2,913 5,346
Corporate debtAmortized cost 1 10 10 5 65 91Fair value 1 10 10 5 65 91
Total cost or amortized cost 402 745 160 2,068 3,110 6,485Total fair value 402 749 162 1,997 2,978 6,288Other SecuritiesCarrying value – – – – 702 702Total carrying value or amortized cost of securities 26,556 21,785 22,955 22,351 88,581 182,228Total value of securities 26,545 21,722 22,612 21,919 88,137 180,935Total by Currency (in Canadian $ equivalent)Canadian dollar 18,091 12,284 9,782 5,475 37,135 82,767U.S. dollar 7,799 9,423 12,718 16,404 49,922 96,266Other currencies 655 15 112 40 1,080 1,902Total securities 26,545 21,722 22,612 21,919 88,137 180,935
BMO Financial Group 201st Annual Report 2018 155
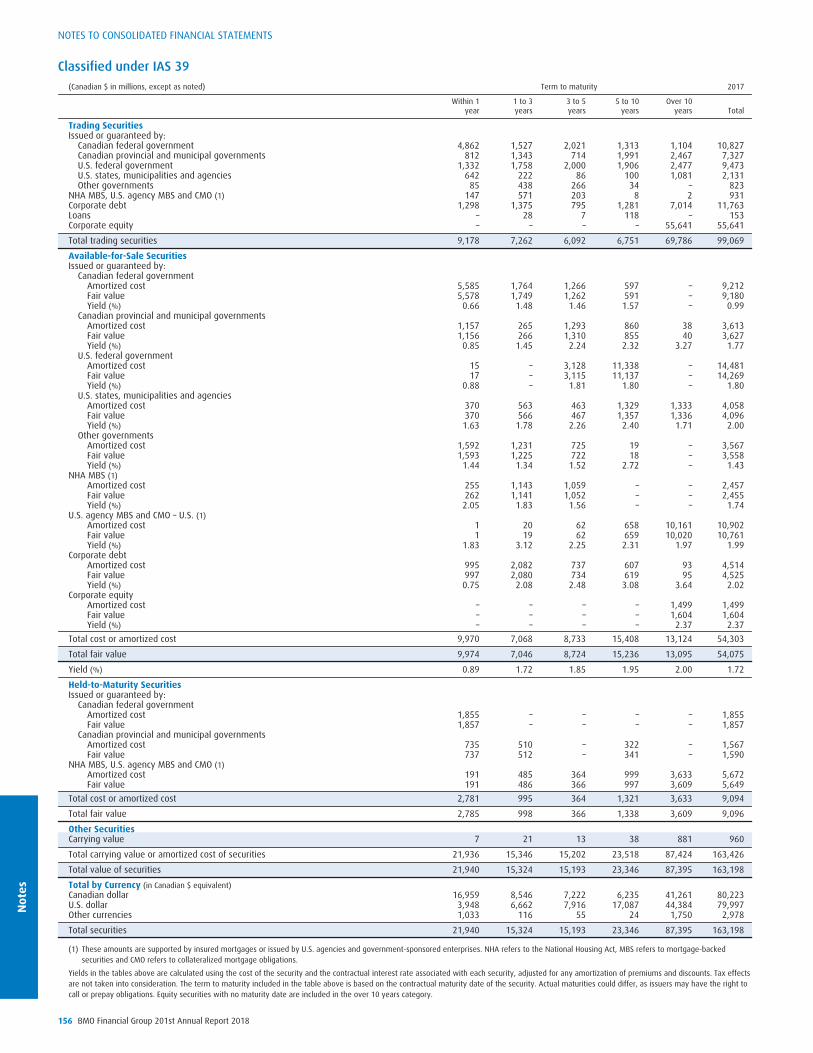
Not
esNOTES TO CONSOLIDATED FINANCIAL STATEMENTS
Classified under IAS 39(Canadian $ in millions, except as noted) Term to maturity 2017
Within 1year
1 to 3years
3 to 5years
5 to 10years
Over 10years Total
Trading SecuritiesIssued or guaranteed by:
Canadian federal government 4,862 1,527 2,021 1,313 1,104 10,827Canadian provincial and municipal governments 812 1,343 714 1,991 2,467 7,327U.S. federal government 1,332 1,758 2,000 1,906 2,477 9,473U.S. states, municipalities and agencies 642 222 86 100 1,081 2,131Other governments 85 438 266 34 – 823
NHA MBS, U.S. agency MBS and CMO (1) 147 571 203 8 2 931Corporate debt 1,298 1,375 795 1,281 7,014 11,763Loans – 28 7 118 – 153Corporate equity – – – – 55,641 55,641
Total trading securities 9,178 7,262 6,092 6,751 69,786 99,069
Available-for-Sale SecuritiesIssued or guaranteed by:
Canadian federal governmentAmortized cost 5,585 1,764 1,266 597 – 9,212Fair value 5,578 1,749 1,262 591 – 9,180Yield (%) 0.66 1.48 1.46 1.57 – 0.99
Canadian provincial and municipal governmentsAmortized cost 1,157 265 1,293 860 38 3,613Fair value 1,156 266 1,310 855 40 3,627Yield (%) 0.85 1.45 2.24 2.32 3.27 1.77
U.S. federal governmentAmortized cost 15 – 3,128 11,338 – 14,481Fair value 17 – 3,115 11,137 – 14,269Yield (%) 0.88 – 1.81 1.80 – 1.80
U.S. states, municipalities and agenciesAmortized cost 370 563 463 1,329 1,333 4,058Fair value 370 566 467 1,357 1,336 4,096Yield (%) 1.63 1.78 2.26 2.40 1.71 2.00
Other governmentsAmortized cost 1,592 1,231 725 19 – 3,567Fair value 1,593 1,225 722 18 – 3,558Yield (%) 1.44 1.34 1.52 2.72 – 1.43
NHA MBS (1)Amortized cost 255 1,143 1,059 – – 2,457Fair value 262 1,141 1,052 – – 2,455Yield (%) 2.05 1.83 1.56 – – 1.74
U.S. agency MBS and CMO – U.S. (1)Amortized cost 1 20 62 658 10,161 10,902Fair value 1 19 62 659 10,020 10,761Yield (%) 1.83 3.12 2.25 2.31 1.97 1.99
Corporate debtAmortized cost 995 2,082 737 607 93 4,514Fair value 997 2,080 734 619 95 4,525Yield (%) 0.75 2.08 2.48 3.08 3.64 2.02
Corporate equityAmortized cost – – – – 1,499 1,499Fair value – – – – 1,604 1,604Yield (%) – – – – 2.37 2.37
Total cost or amortized cost 9,970 7,068 8,733 15,408 13,124 54,303
Total fair value 9,974 7,046 8,724 15,236 13,095 54,075
Yield (%) 0.89 1.72 1.85 1.95 2.00 1.72
Held-to-Maturity SecuritiesIssued or guaranteed by:
Canadian federal governmentAmortized cost 1,855 – – – – 1,855Fair value 1,857 – – – – 1,857
Canadian provincial and municipal governmentsAmortized cost 735 510 – 322 – 1,567Fair value 737 512 – 341 – 1,590
NHA MBS, U.S. agency MBS and CMO (1)Amortized cost 191 485 364 999 3,633 5,672Fair value 191 486 366 997 3,609 5,649
Total cost or amortized cost 2,781 995 364 1,321 3,633 9,094
Total fair value 2,785 998 366 1,338 3,609 9,096
Other SecuritiesCarrying value 7 21 13 38 881 960
Total carrying value or amortized cost of securities 21,936 15,346 15,202 23,518 87,424 163,426
Total value of securities 21,940 15,324 15,193 23,346 87,395 163,198
Total by Currency (in Canadian $ equivalent)Canadian dollar 16,959 8,546 7,222 6,235 41,261 80,223U.S. dollar 3,948 6,662 7,916 17,087 44,384 79,997Other currencies 1,033 116 55 24 1,750 2,978
Total securities 21,940 15,324 15,193 23,346 87,395 163,198
(1) These amounts are supported by insured mortgages or issued by U.S. agencies and government-sponsored enterprises. NHA refers to the National Housing Act, MBS refers to mortgage-backedsecurities and CMO refers to collateralized mortgage obligations.
Yields in the tables above are calculated using the cost of the security and the contractual interest rate associated with each security, adjusted for any amortization of premiums and discounts. Tax effectsare not taken into consideration. The term to maturity included in the table above is based on the contractual maturity date of the security. Actual maturities could differ, as issuers may have the right tocall or prepay obligations. Equity securities with no maturity date are included in the over 10 years category.
156 BMO Financial Group 201st Annual Report 2018

Notes
Unrealized Gains and LossesThe following table summarizes the unrealized gains and losses on FVOCI securities as at October 31, 2018 under IFRS 9 and the unrealized gains andlosses on available-for-sale securities as at October 31, 2017 under IAS 39.
(Canadian $ in millions) 2018 2017
Amortizedcost
Grossunrealized
gains
Grossunrealized
lossesFair
valueAmortized
cost
Grossunrealized
gains
Grossunrealized
lossesFair
value
Issued or guaranteed by:Canadian federal government 12,884 1 80 12,805 9,212 6 38 9,180Canadian provincial and municipal governments 6,896 8 42 6,862 3,613 29 15 3,627U.S. federal government 17,403 4 584 16,823 14,481 12 224 14,269U.S. states, municipalities and agencies 3,694 16 55 3,655 4,058 43 5 4,096Other governments 4,818 2 30 4,790 3,567 3 12 3,558
NHA MBS 2,382 6 18 2,370 2,457 9 11 2,455U.S. agency MBS and CMO 11,811 2 496 11,317 10,902 6 147 10,761Corporate debt 3,783 6 33 3,756 4,514 23 12 4,525Corporate equity 62 – – 62 1,499 121 16 1,604
Total 63,733 45 1,338 62,440 54,303 252 480 54,075
Unrealized gains (losses) may be offset by related (losses) gains on hedge contracts.
Interest, Dividend and Fee IncomeInterest, dividend and fee income has been included in our consolidated financial statements as follows, excluding other securities and tradingsecurities. Related income for trading securities is included in Note 17 Trading-Related Revenue.
(Canadian $ in millions) 2018 2017 2016
FVTPL 16 na naFVOCI 1,118 na naAmortized cost 172 na naAvailable-for-sale securities na 662 509Held-to-maturity securities na 150 143
Total 1,306 812 652
na – not applicable due to IFRS 9 adoption.Certain comparative figures have been reclassified to conform with the current year’s presentation.
Non-Interest RevenueNet gains and losses from securities, excluding net realized and unrealized gains on trading securities, have been included in our ConsolidatedStatement of Income as follows:
(Canadian $ in millions) 2018 2017 2016
Non-Interest RevenueFVTPL securities 106 na naFVOCI securities (1)
Gross realized gains 363 228 59Gross realized (losses) (216) (99) (16)
Unrealized gains on investments reclassified from available-for-sale to other na – 7Other securities, net realized and unrealized gains – 49 51Impairment write-downs (14) (7) (17)
Securities gains, other than trading (2) 239 171 84
(1) Realized gains (losses) are net of unrealized gains (losses) on related hedge contracts. Fiscal 2017 and prior years represent available-for-sale securities (Note 1).(2) The following amounts of income related to our insurance operations were included in non-interest revenue, insurance revenue, in our Consolidated Statement of Income: Interest, dividend and fee
income of $354 million for the year ended October 31, 2018 ($325 million in 2017); and securities gains, other than trading, of $1 million for the year ended October 31, 2018 ($nil in 2017).Unrealized gains and losses on trading securities are included in trading-related revenue in Note 17.na – not applicable due to IFRS 9 adoption.
Note 4: Loans and Allowance for Credit LossesLoans are initially measured at fair value plus directly attributable costs, and are subsequently measured at amortized cost using the effective interestmethod. The effective interest method allocates interest income over the expected term of the loan by applying the effective interest rate to thecarrying amount of the loan. The effective interest rate is defined as the rate that exactly discounts estimated future cash receipts through theexpected term of the loan to the net carrying amount of the loan. Under the effective interest method, the amount recognized in interest, dividendand fee income, loans, varies over the term of the loan based on the principal outstanding. The treatment of interest income for impaired loans isdescribed below.
Securities Borrowed or Purchased Under Resale AgreementsSecurities borrowed or purchased under resale agreements represent the amounts we will receive as a result of our commitment to return or resellsecurities that we have borrowed or purchased, back to the original lender or seller, on a specified date at a specified price. We account for theseinstruments as if they were loans.
Lending FeesLending fees arise in Personal and Commercial Banking and Capital Markets. The accounting treatment for lending fees varies depending on thetransaction. Some loan origination, restructuring and renegotiation fees are recorded as interest income over the term of the loan, while otherlending fees are taken into income at the time of loan origination. Commitment fees are calculated as a percentage of the facility balance at the end
BMO Financial Group 201st Annual Report 2018 157

Not
esNOTES TO CONSOLIDATED FINANCIAL STATEMENTS
of the period. The fees are recorded as interest income over the term of the loan, unless we believe the loan commitment will not be used. In the lattercase, commitment fees are recorded as lending fees earned over the commitment period. Loan syndication fees are payable and included in lendingfees at the time the syndication is completed, unless the yield on any loans we retain is less than that of other comparable lenders involved in thefinancing. In the latter case, an appropriate portion of the syndication fee is recorded as interest income over the term of the loan.
Impaired LoansWe classify a loan as impaired when one or more loss events have occurred, such as bankruptcy, default or delinquency. Generally, consumer loans inboth Canada and the U.S. are classified as impaired when payment is contractually 90 days past due, or one year past due for residential mortgages ifguaranteed by the Government of Canada. Credit card loans are immediately written off when principal or interest payments are 180 days past due,and are not reported as impaired. In Canada, consumer instalment loans, other personal loans and some small business loans are normally written offwhen they are one year past due. In the U.S., all consumer loans are generally written off when they are 180 days past due, except for non-realestate term loans, which are generally written off when they are 120 days past due. For the purpose of measuring the amount to be written off, thedetermination of the recoverable amount includes an estimate of future recoveries.
Corporate and commercial loans are classified as impaired when we determine there is no longer reasonable assurance that principal or interestwill be collected in their entirety on a timely basis. Generally, we consider corporate and commercial loans to be impaired when payments are90 days past due. Corporate and commercial loans are written off following a review on an individual loan basis that confirms all recovery attemptshave been exhausted.
A loan will be reclassified to performing status when we determine that there is reasonable assurance of full and timely repayment of interestand principal in accordance with the terms and conditions of the loan, and that none of the criteria for classification of the loan as impaired continueto apply.
Loans are in default when the borrower is unlikely to pay its credit obligations in full without recourse by the bank, such as realizing security, orwhen the borrower’s payments are past due more than 90 days (180 days for credit card loans). Overdrafts are considered to be past due once thecustomer has breached an advised limit or been advised of a limit smaller than currently outstanding or, in the case of retail overdrafts, has notbrought the overdraft down to a $nil balance within a specified time period.
Our average gross impaired loans were $2,115 million for the year ended October 31, 2018 ($2,248 million in 2017). Our average impaired loans,net of the specific allowance, were $1,706 million for the year ended October 31, 2018 ($1,838 million in 2017).
Once a loan is identified as impaired, we continue to recognize interest income based on the original effective interest rate on the loan amountnet of its related allowance. In the periods following the recognition of impairment, adjustments to the allowance for these loans reflecting the timevalue of money are recognized and presented as interest income. Interest income on impaired loans of $67 million was recognized for the yearended October 31, 2018 ($75 million in 2017 and $74 million in 2016).
During the year ended October 31, 2018, we recorded a net gain of $4 million before tax ($28 million in 2017 and $5 million in 2016) on the saleof impaired and written-off loans.
Allowance for Credit Losses (“ACL”)The allowance for credit losses recorded in our Consolidated Balance Sheet is maintained at a level that we consider adequate to absorb credit-relatedlosses on our loans and other credit instruments. The allowance for credit losses amounted to $1,870 million as at October 31, 2018, of which$1,639 million was recorded in loans and $231 million was recorded in other liabilities in our Consolidated Balance Sheet.
Allowance on Performing LoansWe maintain an allowance in order to cover impairment in the existing portfolio for loans that have not yet been individually identified as impaired.Our approach to establishing and maintaining the allowance on performing loans is based on the requirements of IFRS, considering guidelines issuedby OSFI.
Under the IFRS 9 ECL methodology, an allowance is recorded for expected credit losses on financial assets regardless of whether there has beenan actual impairment. We recognize a loss allowance at an amount equal to 12 month expected credit losses, if the credit risk at the reporting datehas not increased significantly since initial recognition (Stage 1). We will record expected credit losses over the remaining life of performing financialassets which are considered to have experienced a significant increase in credit risk (Stage 2).
The determination of a significant increase in credit risk takes into account many different factors and varies by product and risk segment. Themain factors considered in making this determination are relative changes in probability-weighted probability of default since origination and certainother criteria, such as 30-day past due and watchlist status.
For each exposure, ECL is a function of the probability of default (“PD”), exposure at default (“EAD”) and loss given default (“LGD”), with thetiming of the loss also considered, and is estimated by incorporating forward-looking economic information and through the use of experienced creditjudgment to reflect factors not captured in ECL models.
PD represents the likelihood that a loan will not be repaid and will go into default in either a 12 month horizon for Stage 1 or a lifetime horizonfor Stage 2. The PD for each individual instrument is modelled based on historical data and is estimated based on current market conditions andreasonable and supportable information about future economic conditions.
EAD is modelled on historical data and represents an estimate of the outstanding amount of credit exposure at the time a default may occur. Foroff-balance sheet and undrawn amounts, EAD includes an estimate of any further amounts to be drawn at the time of default.
LGD is the amount that may not be recovered in the event of default and is modelled based on historical data and reasonable and supportableinformation about future economic conditions, where appropriate. LGD takes into consideration the amount and quality of any collateral held.
We consider past events, current market conditions and reasonable forward-looking supportable information about future economic conditions incalculating the amount of expected losses. In assessing information about possible future economic conditions, we utilize multiple economic scenariosincluding our base case, which represents, in our view, the most probable outcome, as well as benign and adverse forecasts, all of which aredeveloped by our Economics group. Key economic variables used in the determination of the allowance for credit losses reflect the geographicdiversity of our portfolios, where appropriate.
In considering the lifetime of a loan, the contractual period of the loan, including prepayment, extension and other options, is generally used. Forrevolving instruments, such as credit cards, which may not have a defined contractual period, the lifetime is based on historical behaviour.
158 BMO Financial Group 201st Annual Report 2018

Notes
Our ECL methodology also requires the use of experienced credit judgment to incorporate the estimated impact of factors that are not captured inthe modelled ECL results.
Allowance on Impaired LoansWe maintain an allowance on individually identified impaired loans (Stage 3) of $370 million on our gross impaired loans of $1,936 million, to reducetheir carrying value to an expected recoverable amount of $1,566 million as at October 31, 2018 ($1,827 million as at October 31, 2017). We reviewour loans on an ongoing basis to assess whether any loans should be classified as impaired and whether an allowance or write-off should berecorded (excluding credit card loans, which are classified as impaired and written off when principal or interest payments are 180 days past due).The review of individually significant problem loans is conducted at least quarterly by the account managers, each of whom assesses the ultimatecollectability and estimated recoveries for a specific loan based on all events and conditions that are relevant to the loan. This assessment is thenreviewed and approved by an independent credit officer.
Individually Significant Impaired LoansTo determine the amount we expect to recover from an individually significant impaired loan, we use the value of the estimated future cash flowsdiscounted at the loan’s original effective interest rate. The determination of estimated future cash flows of a collateralized impaired loan reflects theexpected realization of the underlying security, net of expected costs and any amounts legally required to be paid to the borrower. Security can varyby type of loan and may include cash, securities, real estate properties, accounts receivable, guarantees, inventory or other capital assets.
Individually Insignificant Impaired LoansResidential mortgages, consumer instalment and other personal loans are individually insignificant and may be individually assessed or collectivelyassessed for losses at the time of impairment, taking into account historical loss experience and expectations of future economic conditions.Collectively assessed loans are grouped together by similar risk characteristics, such as type of instrument, geographic location, industry, type ofcollateral and term to maturity.
BMO Financial Group 201st Annual Report 2018 159

Not
esNOTES TO CONSOLIDATED FINANCIAL STATEMENTS
Loans Credit Risk ExposureThe following table sets out our credit risk exposure for all loans carried at amortized cost or FVTPL as at October 31, 2018. Stage 1 represents thoseperforming loans carried with a 12 month expected credit loss, Stage 2 represents those performing loans carried with a lifetime expected credit loss,and Stage 3 represents those loans with a lifetime credit loss that are credit impaired.
(Canadian $ in millions) 2018
Stage 1 Stage 2 Stage 3 Total
Loans: Residential mortgagesExceptionally low – – – –Very low 76,314 125 – 76,439Low 18,975 2,479 – 21,454Medium 12,621 3,765 – 16,386High 90 445 – 535Not rated 4,250 181 – 4,431Impaired – – 375 375
Allowance for credit losses 20 37 19 76
Carrying amount 112,230 6,958 356 119,544
Loans: Consumer instalment and other personalExceptionally low 20,236 20 – 20,256Very low 13,364 222 – 13,586Low 12,581 364 – 12,945Medium 7,707 4,153 – 11,860High 127 1,657 – 1,784Not rated 2,105 168 – 2,273Impaired – – 521 521
Allowance for credit losses 83 312 143 538
Carrying amount 56,037 6,272 378 62,687
Loans: Credit cardsExceptionally low 2,403 4 – 2,407Very low 1,140 11 – 1,151Low 943 107 – 1,050Medium 1,742 874 – 2,616High 108 428 – 536Not rated 568 1 – 569Impaired – – – –
Allowance for credit losses 39 191 – 230
Carrying amount 6,865 1,234 – 8,099
Loans: Business and government (1)Acceptable
Investment grade 109,774 2,148 – 111,922Sub-investment grade 88,348 7,308 – 95,656
Watchlist – 4,423 – 4,423Impaired – – 1,040 1,040
Allowance for credit losses 232 355 208 795
Carrying amount 197,890 13,524 832 212,246
Commitments and financial guarantee contractsAcceptable
Investment grade 116,108 1,722 – 117,830Sub-investment grade 44,895 3,426 – 48,321
Watchlist – 1,650 – 1,650Impaired – – 242 242
Allowance for credit losses 108 96 27 231
Carrying amount 160,895 6,702 215 167,812
(1) Includes customers’ liability under acceptances.
160 BMO Financial Group 201st Annual Report 2018

Notes
The following table shows the continuity in the loss allowance by each product type as at October 31, 2018.
(Canadian $ in millions)
For the twelve months ended Stage 1 Stage 2 Stage 3 Total
Loans: Residential mortgagesBalance as at November 1, 2017 16 34 49 99Transfer to Stage 1 34 (31) (3) –Transfer to Stage 2 (1) 7 (6) –Transfer to Stage 3 – (9) 9 –Net remeasurement of loss allowance (37) 42 19 24Loan originations 10 – – 10Derecognitions and maturities (2) (6) – (8)
Total provision for credit losses (“PCL”) (1) 4 3 19 26Write-offs – – (20) (20)Recoveries of previous write-offs – – 7 7Foreign exchange and other – 1 (11) (10)
Balance as at October 31, 2018 20 38 44 102
Loans: Consumer instalment and other personalBalance as at November 1, 2017 76 357 137 570Transfer to Stage 1 214 (200) (14) –Transfer to Stage 2 (22) 105 (83) –Transfer to Stage 3 (4) (162) 166 –Net remeasurement of loss allowance (196) 272 162 238Loan originations 39 – – 39Derecognitions and maturities (18) (50) – (68)
Total PCL (1) 13 (35) 231 209Write-offs – – (301) (301)Recoveries of previous write-offs – – 92 92Foreign exchange and other 1 4 (15) (10)
Balance as at October 31, 2018 90 326 144 560
Loans: Credit cardsBalance as at November 1, 2017 83 254 – 337Transfer to Stage 1 177 (177) – –Transfer to Stage 2 (37) 37 – –Transfer to Stage 3 (1) (195) 196 –Net remeasurement of loss allowance (164) 342 20 198Loan originations 19 – – 19Derecognitions and maturities (3) (42) – (45)
Total PCL (1) (9) (35) 216 172Write-offs – – (319) (319)Recoveries of previous write-offs – – 103 103
Balance as at October 31, 2018 74 219 – 293
Loans: Business and governmentBalance as at November 1, 2017 268 410 234 912Transfer to Stage 1 136 (128) (8) –Transfer to Stage 2 (31) 66 (35) –Transfer to Stage 3 (1) (61) 62 –Net remeasurement of loss allowance (155) 203 215 263Loan originations 163 – – 163Derecognitions and maturities (80) (86) – (166)Model changes (7) (3) – (10)
Total PCL (1) 25 (9) 234 250Write-offs – – (297) (297)Recoveries of previous write-offs – – 59 59Foreign exchange and other 5 7 (21) (9)
Balance as at October 31, 2018 298 408 209 915
Total as at October 31, 2018 482 991 397 1,870
Comprised of: Loans 374 895 370 1,639Other credit instruments (2) 108 96 27 231
(1) Excludes provision for credit losses on other assets of $5 million.(2) Recorded in other liabilities on the Consolidated Balance Sheet.
BMO Financial Group 201st Annual Report 2018 161

Not
esNOTES TO CONSOLIDATED FINANCIAL STATEMENTS
The following table shows the continuity of our allowance for credit losses under IAS 39 as at October 31, 2017:
(Canadian $ in millions)Residentialmortgages
Credit card, consumer instalmentand other personal loans
Business andgovernment loans Total
2017 2016 2017 2016 2017 2016 2017 2016
Impairment allowances (specific ACL), beginning of year 59 69 123 113 250 210 432 392Amounts written off (27) (38) (631) (616) (296) (349) (954) (1,003)Recoveries of amounts written off in previous years 16 16 199 173 50 154 265 343Charge to income statement (specific PCL) 11 24 464 478 347 269 822 771Foreign exchange and other movements (10) (12) (18) (25) (117) (34) (145) (71)
Specific ACL, end of year 49 59 137 123 234 250 420 432
Collective ACL, beginning of year 71 111 596 714 1,015 835 1,682 1,660Charge (recovery) to income statement (collective PCL) (1) (42) (6) (120) (69) 162 (76) –Foreign exchange and other movements (1) 2 (4) 2 (25) 18 (30) 22
Collective ACL, end of year 69 71 586 596 921 1,015 1,576 1,682
Total ACL 118 130 723 719 1,155 1,265 1,996 2,114
Comprised of: Loans 93 104 722 719 1,018 1,102 1,833 1,925Other credit instruments (1) 25 26 1 – 137 163 163 189
(1) The total specific and collective allowances related to other credit instruments are included in other liabilities.
Certain comparative figures have been reclassified to conform with the current year’s presentation.
Significant changes in the gross balances, including originations, maturities and repayments in the normal course of operations, impact the allowancefor credit losses.
Loans and allowance for credit losses by geographic region as at October 31, 2018 under IFRS 9 and as at October 31, 2017 under IAS 39 are asfollows:
(Canadian $ in millions) 2018 2017
Grossamount
Allowance onimpaired loans (2)
Allowance onperforming loans (3)
Netamount
Grossamount
Specificallowance (2)
Collectiveallowance (3)
Netamount
By geographic region: (1)
Canada 244,837 189 689 243,959 233,672 212 799 232,661United States 131,247 181 574 130,492 115,029 161 641 114,227Other countries 9,546 – 6 9,540 11,639 20 – 11,619
Total 385,630 370 1,269 383,991 360,340 393 1,440 358,507
(1) Geographic region is based upon the country of ultimate risk.(2) Excludes allowance for credit losses on impaired loans of $27 million for other credit instruments, which is included in other liabilities ($27 million in 2017).(3) Excludes allowance for credit losses on performing loans of $204 million for other credit instruments, which is included in other liabilities ($136 million in 2017).
Certain comparative figures have been reclassified to conform with the current year’s presentation.
Impaired loans, including the related allowances, as at October 31, 2018 under IFRS 9 and as at October 31, 2017 under IAS 39 are as follows:
(Canadian $ in millions) Gross impaired amount (1)Allowance on
impaired loans (3)Specific
allowance (3) NetNet
impaired amount
2018 2017 2018 2017 2018 2017
Residential mortgages 375 391 19 24 356 367Consumer instalment and other personal loans 521 556 143 136 378 420Business and government loans 1,040 1,273 208 233 832 1,040
Total 1,936 2,220 370 393 1,566 1,827
By geographic region: (2)
Canada 735 793 189 212 546 581United States 1,201 1,377 181 161 1,020 1,216Other countries – 50 – 20 – 30
Total 1,936 2,220 370 393 1,566 1,827
(1) Excludes purchased credit impaired loans.(2) Geographic region is based upon the country of ultimate risk.(3) Excludes allowance for credit losses on impaired loans of $27 million for other credit instruments, which is included in other liabilities ($27 million in 2017).
Fully secured loans with amounts past due between 90 and 180 days that we have not classified as impaired totalled $49 million and $62 million as at October 31, 2018 and 2017, respectively.
Certain comparative figures have been reclassified to conform with the current year’s presentation.
162 BMO Financial Group 201st Annual Report 2018

Notes
Loans Past Due Not ImpairedLoans that are past due but not classified as impaired are loans where our customers have failed to make payments when contractually due, but forwhich we expect the full amount of principal and interest payments to be collected, or which are held at fair value. The following table presents loansthat are past due but not classified as impaired as at October 31, 2018 and 2017.
(Canadian $ in millions) 1 to 29 days 30 to 89 days 90 days or more Total
2018 2017 2018 2017 2018 2017 2018 2017
Residential mortgages (1) 660 649 513 438 21 19 1,194 1,106Credit card, consumer instalment and other personal loans 1,431 1,480 415 466 88 94 1,934 2,040Business and government loans 611 589 268 297 55 72 934 958
Total 2,702 2,718 1,196 1,201 164 185 4,062 4,104
(1) The percentage of loans 90 days or more past due but not impaired that were guaranteed by the Government of Canada is 66% for 2018 and 67% for 2017.
ECL Sensitivity and Key Economic VariablesThe allowance for performing loans is sensitive to changes in both economic forecasts and the probability-weight assigned to each forecast scenario.Many of the factors have a high degree of interdependency although there is no single factor to which loan impairment allowances as a whole aresensitive.
If we assumed a 100% base case economic forecast and included the impact of loan migration by restaging, with other assumptions heldconstant including the application of experienced credit judgment, the allowance for performing loans would be approximately $1,250 million as atOctober 31, 2018 compared to the reported allowance for performing loans of $1,473 million.
If we assumed a 100% adverse economic forecast and included the impact of loan migration by restaging, with other assumptions held constantincluding the application of experienced credit judgment, the allowance for performing loans would be approximately $2,650 million as at October 31,2018, compared to the reported allowance for performing loans of $1,473 million.
Actual results in a recession will differ as our portfolio will change through time due to migration, growth, risk mitigation actions and otherfactors. In addition, our allowance will reflect the three economic scenarios used in assessing the allowance with weightings attached to adverse andbenign scenarios often unequally weighted and the weightings will change through time.
The following table shows the key economic variables we use to estimate our allowance on performing loans during the forecast period. Thevalues shown represent the end of period national average values for the first 12 months and then the national average for the remaining horizon.While the values disclosed below are national variables, in our underlying models we use regional variables where considered appropriate.
Benign scenario Base scenario Adverse scenario
As at October 31, 2018 First 12 months Remaining horizon (1) First 12 months Remaining horizon (1) First 12 months Remaining horizon (1)
Real gross domestic product (2)Canada 3.1% 2.4% 1.8% 1.6% (3.2)% 0.8%U.S. 2.9% 1.9% 2.4% 1.6% (2.9)% 0.9%
Corporate BBB 10-year spreadCanada 2.0% 2.1% 2.3% 2.3% 4.7% 3.9%U.S. 1.8% 2.0% 2.2% 2.3% 4.3% 3.5%
Unemployment ratesCanada 5.4% 5.2% 5.6% 5.6% 9.3% 9.3%U.S. 3.2% 3.1% 3.6% 3.7% 6.7% 6.8%
Housing Price IndexCanada (3) 2.4% 2.6% 1.4% 1.8% (12.8)% (3.2)%U.S. (4) 5.1% 4.3% 3.6% 3.0% (7.3)% (1.2)%
(1) The remaining forecast period is two years.(2) Real gross domestic product is based on year over year growth.(3) In Canada, we use the HPI Benchmark Composite.(4) In the U.S., we use the National Case-Shiller House Price Index.
The ECL approach requires the recognition of credit losses based on up to 12 months of expected losses for performing loans (Stage 1) and therecognition of lifetime expected losses on performing loans that have experienced a significant increase in credit risk since origination (Stage 2).Under our current probability-weighted scenarios, if all our performing loans were in Stage 1, our models would generate an allowance forperforming loans of approximately $1,000 million compared to the reported allowance for performing loans of $1,473 million.
Renegotiated LoansFrom time to time we modify the contractual terms of a loan due to the poor financial condition of the borrower. We assess renegotiated loans forimpairment consistent with our existing policies for impairment. When renegotiation leads to significant concessions being granted, and theconcessions are for economic or legal reasons related to the borrower’s financial difficulty that we would not otherwise consider, the loan is classifiedas impaired. We consider one or a combination of the following to be significant concessions: (1) a reduction of the stated interest rate, (2) anextension of the maturity date or dates at a stated interest rate lower than the current market rate for a new loan with similar terms, or(3) forgiveness of principal or accrued interest.
Renegotiated loans are permitted to remain in performing status if the modifications are not considered to be significant, or are returned toperforming status when none of the criteria for classification as impaired continue to apply.
The carrying value of our renegotiated loans was $1,129 million as at October 31, 2018 ($1,064 million in 2017). Renegotiated loans of$541 million were classified as performing during the year ended October 31, 2018 ($509 million in 2017). Renegotiated loans of $53 million werewritten off in the year ended October 31, 2018 ($36 million in 2017).
Foreclosed AssetsProperty or other assets that we receive from borrowers to satisfy their loan commitments are classified as either held for use or held for saleaccording to management’s intention and are recorded at their carrying amount.
BMO Financial Group 201st Annual Report 2018 163

Not
esNOTES TO CONSOLIDATED FINANCIAL STATEMENTS
During the year ended October 31, 2018, we foreclosed on impaired loans and received $117 million of real estate properties that we classifiedas held for sale ($62 million in 2017).
As at October 31, 2018, real estate properties held for sale totalled $58 million ($55 million in 2017). These properties are disposed of whenconsidered appropriate. During the year ended October 31, 2018, we recorded an impairment loss of $10 million on real estate properties classified asheld for sale ($10 million in 2017 and $18 million in 2016).
Write-offs Subject to Collection EffortsGenerally, we continue to seek recovery on amounts that were written off during the period unless the loan is sold, we no longer have the right tocollect or we have exhausted all reasonable efforts to collect.
CollateralCollateral is used to manage credit risk related to securities borrowed or purchased under resale agreements, residential mortgages, consumerinstalment and other personal loans and business and government loans. Additional information on our collateral requirements is included in Notes14 and 24 as well as in the blue-tinted font in the Enterprise-Wide Risk Management section of Management’s Discussion and Analysis on pages 87and 88 of this report.
Note 5: Risk ManagementWe have an enterprise-wide approach to the identification, measurement, monitoring and control of risks faced across our organization.The key risks related to our financial instruments are classified as credit and counterparty, market, and liquidity and funding risk.
Credit and Counterparty RiskCredit and counterparty risk is the potential for loss due to the failure of a borrower, endorser, guarantor or counterparty to repay a loan or honouranother predetermined financial obligation. Credit risk arises predominantly with respect to loans, over-the-counter and centrally cleared derivativesand other credit instruments. This is the most significant measurable risk that we face.
Our risk management practices and key measures are disclosed in the text and tables presented in a blue-tinted font in the Enterprise-Wide RiskManagement section of Management’s Discussion and Analysis on pages 87 to 91 of this report. Additional information on credit risk related to loansand derivatives is disclosed in Notes 4 and 8, respectively.
Market RiskMarket risk is the potential for adverse changes in the value of our assets and liabilities resulting from changes in market variables such as interestrates, foreign exchange rates, equity and commodity prices and their implied volatilities, and credit spreads, and includes the risk of credit migrationand default in our trading book. We incur market risk in our trading and underwriting activities and in the management of structural market risk in ourbanking and insurance activities.
Our market risk management practices and key measures are disclosed in the text and tables presented in a blue-tinted font in the Enterprise-Wide Risk Management section of Management’s Discussion and Analysis on pages 95 to 99 of this report.
Liquidity and Funding RiskLiquidity and funding risk is the potential for loss if we are unable to meet our financial commitments in a timely manner at reasonable prices as theybecome due. It is our policy to ensure that sufficient liquid assets and funding capacity are available to meet financial commitments, includingliabilities to depositors and suppliers, and lending, investment and pledging commitments, even in times of stress. Managing liquidity and fundingrisk is essential to maintaining a safe and sound enterprise, depositor confidence and earnings stability.
Our liquidity and funding risk management practices and key measures are disclosed in the text presented in a blue-tinted font in the Enterprise-Wide Risk Management section of Management’s Discussion and Analysis on pages 100 to 108 of this report.
Note 6: Transfer of AssetsLoan SecuritizationWe sell Canadian mortgage loans to third-party Canadian securitization programs, including the Canada Mortgage Bond program, directly to third-party investors under the National Housing Act Mortgage-Backed Securities program and under our own program. We assess whether substantially allof the risks and rewards of the loans have been transferred to determine if they qualify for derecognition.
Under these programs, we are entitled to the payment over time of the excess of the sum of interest and fees collected from customers, inconnection with the loans that were sold, over the yield paid to investors, less credit losses and other costs. Since we continue to be exposed tosubstantially all of the prepayment, interest rate and credit risk associated with the securitized loans, they do not qualify for derecognition. Wecontinue to recognize the loans and the related cash proceeds as secured financing in our Consolidated Balance Sheet. The interest and fees collected,net of the yield paid to investors, is recorded in net interest income using the effective interest method over the term of the securitization. Creditlosses associated with the loans are recorded in the provision for credit losses. During the year ended October 31, 2018, we sold $8,062 million ofmortgage loans to these programs ($8,707 million in 2017).
164 BMO Financial Group 201st Annual Report 2018

Notes
The following table presents the carrying amount and fair value of transferred assets that did not qualify for derecognition and the associatedliabilities:
(Canadian $ in millions) 2018 2017
Carrying amountof assets (1)
Carrying amount ofassociated liabilities
Carrying amountof assets (1)
Carrying amount ofassociated liabilities
Residential mortgages 5,569 4,797Other related assets (2) 11,640 12,091
Total (3) 17,209 16,925 16,888 16,621
(1) Carrying amount of loans is net of allowance.(2) Other related assets represent payments received on account of loans pledged under securitization programs that have not yet been applied against the associated liabilities. The payments received
are held on behalf of the investors in the securitization vehicles until principal payments are required to be made on the associated liabilities. In order to compare all assets supporting the associatedliabilities, this amount is added to the carrying amount of the securitized assets in the table above.
(3) The fair values of assets and associated liabilities are $17,105 million and $16,763 million, respectively, as at October 31, 2018 ($16,847 million and $16,746 million, respectively, in 2017).
We retain the mortgage servicing rights for certain mortgage loans purchased or originated in the U.S. which are sold and derecognized. Duringthe year ended October 31, 2018, we sold $936 million of these loans ($1,012 million in 2017) and recognized $17 million in mortgage servicingrights ($17 million in 2017) due to our continued involvement.
Securities Lent or Sold Under Repurchase AgreementsSecurities lent or sold under repurchase agreements represent short-term funding transactions in which we sell securities that we own andsimultaneously commit to repurchase the same securities at a specified price on a specified date in the future. We retain substantially all of the risksand rewards associated with the securities and we continue to recognize them in our Consolidated Balance Sheet, with the obligation to repurchasethese securities recorded as secured borrowing transactions at the amount owing. The interest expense related to these liabilities is recorded on anaccrual basis. Additional information on securities lent or sold under repurchase agreements is provided in Note 14.
Note 7: Structured EntitiesWe enter into certain transactions in the ordinary course of business which involve the establishment of structured entities (“SEs”) to facilitate orsecure customer transactions and to obtain alternate sources of funding. We are required to consolidate an SE if we control the entity. We control anSE when we have power over the SE, exposure to variable returns as a result of our involvement, and the ability to exercise power to affect theamount of our returns.
In assessing whether we control an SE, we consider the entire arrangement to determine the purpose and design of the SE, the nature of anyrights held through contractual arrangements and whether we are acting as a principal or agent.
We perform a reassessment of consolidation if facts and circumstances indicate that there have been changes to one or more of the elements ofcontrol over the SE. See Note 1 for more information on our basis of consolidation.
Consolidated Structured EntitiesBank Securitization VehiclesWe use securitization vehicles to securitize our Canadian credit card loans, Canadian real estate lines of credit and Canadian auto loans in order toobtain alternate sources of funding. The structure of these vehicles limits the activities they can undertake and the types of assets they can hold, andthe vehicles have limited decision-making authority. The vehicles issue term asset-backed securities to fund their activities. We control andconsolidate these vehicles, as we have the key decision-making powers necessary to obtain the majority of the benefits of their activities.
The following table presents the carrying amount and fair value of transferred assets that did not qualify for derecognition and the associatedliabilities issued by our bank securitization vehicles:
(Canadian $ in millions) 2018 2017
Carrying amountof assets (1)
Carrying amountof associated liabilities
Carrying amountof assets (1)
Carrying amountof associated liabilities
Credit card receivables 7,246 5,096 7,058 4,115Consumer instalment and other personal (2) 6,827 3,083 5,699 2,295
Total (3) 14,073 8,179 12,757 6,410
(1) Carrying amount of loans is net of allowance.(2) Includes Canadian real estate lines of credit and Canadian auto loans.(3) The fair values of assets and associated liabilities are $14,045 million and $8,134 million, respectively, as at October 31, 2018 ($12,753 million and $6,403 million, respectively, in 2017).
Certain comparative figures have been reclassified to conform with the current year’s presentation.
U.S. Customer Securitization VehicleWe sponsor one customer securitization vehicle (also referred to as a bank-sponsored multi-seller conduit) that provides our customers with alternatesources of funding through the securitization of their assets. This vehicle provides clients with access to financing in the asset-backed commercial paper(“ABCP”) markets by allowing them to either sell their assets directly into the vehicle or indirectly by selling an interest in the securitized assets into thevehicle, which then issues ABCP to investors in order to fund the purchases. We do not sell assets to the customer securitization vehicle. We earn feesfor providing services related to the securitizations, including liquidity, distribution and financial arrangement fees for supporting the ongoing operationsof the vehicle. We have determined that we control and therefore consolidate this vehicle, as we are exposed to its variable returns and we have thekey decision-making powers necessary to affect the amount of those returns in our capacity as liquidity provider and servicing agent.
We provide committed liquidity support facilities to this vehicle which may require that we provide additional financing to the vehicle in theevent that certain events occur. The total committed undrawn amount under these facilities at October 31, 2018 was $7,100 million ($6,765 million atOctober 31, 2017).
BMO Financial Group 201st Annual Report 2018 165

Not
esNOTES TO CONSOLIDATED FINANCIAL STATEMENTS
Capital and Funding VehiclesWe have a funding vehicle that was created to guarantee payments due to bondholders on bonds issued by us. We sell assets to this funding vehiclein exchange for an intercompany loan.
We may also use capital vehicles to transfer our credit exposure on certain loan assets. We purchase credit protection against eligible creditevents from these vehicles. The vehicles collateralize their obligation through the issuance of guarantee-linked notes. Loan assets are not sold orassigned to the vehicles and remain on our Consolidated Balance Sheet. As at October 31, 2018, $325 million of guarantee-linked notes issued bythese vehicles were included in deposits in our Consolidated Balance Sheet ($318 million at October 31, 2017).
For those vehicles that purchase assets from us or are designed to pass on our credit risk, we have determined that based on the rights of thearrangements or through our equity interest we have significant exposure to the variable returns of the vehicles, and we control and thereforeconsolidate these vehicles. Additional information related to notes issued by and assets sold to these vehicles is provided in Note 13 and Note 24,respectively.
Unconsolidated Structured EntitiesThe table below presents amounts related to our interests in unconsolidated SEs:
(Canadian $ in millions) 2018 2017
Capitalvehicles
Canadiancustomer
securitizationvehicles (1)
Structuredfinance
vehiclesCapital
vehicles
Canadiancustomer
securitizationvehicles (1)
Structuredfinance
vehicles
Interests recorded on the balance sheetCash and cash equivalents 118 53 – 8 50 –Trading securities – 12 – – 6 209FVTPL securities – 582 – na na naFVOCI securities 2 242 – na na naAvailable-for-sale securities na na na 2 725 –Loans 7 – – 7 – –Other 3 13 – – 6 –
130 902 – 17 787 209
Deposits 570 53 – 460 50 146Derivatives – – – – – 63Other 17 – – 16 – –
587 53 – 476 50 209
Exposure to loss (2) 28 7,135 – 57 6,425 209
Total assets of the entities 587 5,033 – 476 4,592 209
(1) Securities held that are issued by our Canadian customer securitization vehicles are comprised of asset-backed commercial paper and are classified as trading securities, FVTPL securities and FVOCIsecurities (trading securities and available-for-sale securities in 2017 under IAS 39). All assets held by these vehicles relate to assets in Canada.
(2) Exposure to loss represents securities held, undrawn liquidity facilities, total committed amounts of the BMO funded vehicle, derivative assets and loans.na – not applicable due to IFRS 9 adoption.
Capital VehiclesOne of our capital vehicles holds a note issued by us as its underlying asset. We intend to redeem the note on December 31, 2018. We may also usecapital vehicles to pass our credit risk to security holders of the vehicles. In these situations we are not exposed to significant default or credit risk.Our remaining exposure to variable returns is less than that of the note holders in these vehicles, who are exposed to our default and credit risk. Weare not required to consolidate these vehicles.
Canadian Customer Securitization VehiclesWe sponsor customer securitization vehicles (also referred to as bank-sponsored multi-seller conduits) that provide our customers with alternatesources of funding through the securitization of their assets. These vehicles provide clients with access to financing either from BMO or in the ABCPmarkets by allowing them to either sell their assets directly into the vehicle or indirectly by selling an interest in the securitized assets into thevehicle, which then issues ABCP to either investors or BMO to fund the purchases. We do not sell assets to the customer securitization vehicles. Weearn fees for providing services related to the securitizations, including liquidity, distribution and financial arrangement fees for supporting theongoing operations of the vehicles. We have determined that we do not control these entities, as their key relevant activity, the servicing of programassets, does not reside with us.
We provide liquidity facilities to the market-funded vehicles which may require that we provide additional financing to the vehicles in the eventthat certain events occur. The total committed and undrawn amount under these liquidity facilities and any undrawn amounts of the BMO fundedvehicle at October 31, 2018 was $6,286 million ($5,688 million at October 31, 2017).
Structured Finance VehiclesWe facilitate development of investment products by third parties, including mutual funds, unit investment trusts and other investment funds that aresold to retail investors. We enter into derivative contracts with these third parties to provide investors with their desired exposure, and we hedge ourexposure related to these derivative contracts by investing in other funds through SEs. We are not required to consolidate these vehicles.
During 2018, we discontinued these vehicles and we no longer enter into these types of arrangements with third parties.
BMO Managed FundsWe have established a number of funds that we also manage. We assess whether or not we control these funds based on the economic interest wehave in the funds, including investments in the funds and management fees earned from the funds, and any investors’ rights to remove us as
166 BMO Financial Group 201st Annual Report 2018

Notes
investment manager. Based on our assessment, we have determined that we do not control these funds. Our total interest in unconsolidated BMOmanaged funds was $1,612 million at October 31, 2018 ($1,750 million in 2017), which is included in securities in our Consolidated Balance Sheet.
Other Structured EntitiesWe purchase and hold investments in a variety of third-party structured entities, including exchange-traded funds, mutual funds, limited partnershipsand investment trusts. We are considered to have an interest in these investments through our holdings and because we may act as a counterparty incertain derivatives contracts. We are not the investment manager or the sponsor of any of these investments. We are generally a passive investorand do not have power over the key decision-making activities of these investments. Our maximum exposure to loss from our investments is limitedto the carrying amounts of our investments and any unutilized commitment we have provided.
Sponsored Structured EntitiesWe may be deemed to be the sponsor of an SE if we are involved in the design, legal set-up or marketing of the SE. We may also be deemed to bethe sponsor of an SE if market participants would reasonably associate the entity with us. We do not have an interest in certain SEs that we havesponsored.
Additional information on our compensation trusts is provided in Note 20.
Note 8: Derivative InstrumentsDerivative instruments are financial contracts that derive their value from underlying changes in interest rates, foreign exchange rates or otherfinancial or commodity prices or indices.
Derivative instruments are either regulated exchange-traded contracts or negotiated over-the-counter contracts. We use these instruments fortrading purposes, as well as to manage our exposures, mainly to foreign currency and interest rate fluctuations, as part of our asset/liabilitymanagement program.
Types of DerivativesSwapsSwaps are contractual agreements between two parties to exchange a series of cash flows. The various swap agreements that we enter into are asfollows:
Interest rate swaps – counterparties generally exchange fixed and floating rate interest payments based on a notional value in a single currency.Cross-currency swaps – fixed rate interest payments and principal amounts are exchanged in different currencies.Cross-currency interest rate swaps – fixed and/or floating rate interest payments and principal amounts are exchanged in different currencies.Commodity swaps – counterparties generally exchange fixed and floating rate payments based on a notional value of a single commodity.Equity swaps – counterparties exchange the return on an equity security or a group of equity securities for the return based on a fixed or floating
interest rate or the return on another equity security or group of equity securities.Credit default swaps – one counterparty pays the other a fee in exchange for that other counterparty agreeing to make a payment if a credit
event occurs, such as bankruptcy or failure to pay.Total return swaps – one counterparty agrees to pay or receive from the other cash amounts based on changes in the value of a reference asset
or group of assets, including any returns such as interest earned on these assets, in exchange for amounts that are based on prevailing marketfunding rates.
Forwards and FuturesForwards and futures are contractual agreements to either buy or sell a specified amount of a currency, commodity, interest-rate-sensitive financialinstrument or security at a specified price and date in the future.
Forwards are customized contracts transacted in the over-the-counter market. Futures are transacted in standardized amounts on regulatedexchanges and are subject to daily cash margining.
OptionsOptions are contractual agreements that convey to the purchaser the right but not the obligation to either buy or sell a specified amount of acurrency, commodity, interest-rate-sensitive financial instrument or security at a fixed future date or at any time within a fixed future period.
For options written by us, we receive a premium from the purchaser for accepting market risk.For options purchased by us, we pay a premium for the right to exercise the option. Since we have no obligation to exercise the option, our
primary exposure to risk is the potential credit risk if the writer of an over-the-counter contract fails to meet the terms of the contract.Caps, collars and floors are specialized types of written and purchased options. They are contractual agreements in which the writer agrees to
pay the purchaser, based on a specified notional amount, the difference between the market rate and the prescribed rate of the cap, collar or floor.The writer receives a premium for selling this instrument.
A swaption is an option granting its owner the right but not the obligation to enter into an underlying swap.A future option is an option contract in which the underlying instrument is a single futures contract.
The main risks associated with these derivative instruments are related to exposure to movements in interest rates, foreign exchange rates, creditquality, value of the underlying financial instrument or commodity, as applicable, and the possible inability of counterparties to meet the terms ofthe contracts.
Embedded DerivativesFrom time to time, we purchase or issue financial instruments containing embedded derivatives. The embedded derivative in financial liabilities isseparated from the host contract and carried at fair value if the economic characteristics of the derivative are not closely related to those of the hostcontract, the terms of the embedded derivative are the same as those of a stand-alone derivative, and the combined contract is not measured at fair
BMO Financial Group 201st Annual Report 2018 167

Not
esNOTES TO CONSOLIDATED FINANCIAL STATEMENTS
value. To the extent that we cannot reliably identify and measure the embedded derivative, the entire contract is carried at fair value, with changesin fair value reflected in income. Embedded derivatives in certain of our equity linked notes are accounted for separately from the host instrument.
Contingent FeaturesCertain over-the-counter derivative instruments contain provisions that link the amount of collateral we are required to post or pay to our creditratings (as determined by the major credit rating agencies). If our credit ratings were to be downgraded, certain counterparties to these derivativeinstruments could demand immediate and ongoing collateralization on derivative liability positions or request immediate payment. The aggregatefair value of all derivative instruments with collateral posting requirements that were in a liability position on October 31, 2018 was $2,860 million($3,866 million in 2017), for which we have posted collateral of $2,963 million ($4,223 million in 2017).
Risks HedgedInterest Rate RiskWe manage interest rate risk through interest rate futures, interest rate swaps and options, which are linked to and adjust the interest rate sensitivityof a specific asset, liability, forecasted transaction or firm commitment, or a specific pool of transactions with similar risk characteristics.
Foreign Currency RiskWe manage foreign currency risk through currency futures, foreign currency options, cross-currency swaps, foreign exchange spot transactions,forward contracts and deposits denominated in foreign currencies.
Equity Price RiskWe manage equity price risk through total return swaps.
Trading DerivativesTrading derivatives include derivatives entered into with customers to accommodate their risk management needs, market-making to facilitatecustomer-driven demand for derivatives, derivatives transacted on a limited basis to generate trading income from our principal trading positionsand certain derivatives that are executed as part of our risk management strategy that do not qualify as hedges for accounting purposes (“economichedges”).
We structure and market derivative products to enable customers to transfer, modify or reduce current or expected risks.Principal trading activities include market-making and positioning activities. Market-making involves quoting bid and offer prices to other market
participants with the intention of generating revenues based on spread and volume. Positioning activities involve managing market risk positionswith the expectation of profiting from favourable movements in prices, rates or indices.
Trading derivatives are recorded at fair value. Realized and unrealized gains and losses are recorded in trading revenues in our ConsolidatedStatement of Income. Unrealized gains on trading derivatives are recorded as derivative instrument assets and unrealized losses are recorded asderivative instrument liabilities in our Consolidated Balance Sheet.
We may also economically hedge a portion of our U.S. dollar earnings through forward foreign exchange contracts and/or options to minimizefluctuations in our consolidated net income due to the translation of our U.S. dollar earnings. These contracts are recorded at fair value, with changesin fair value recorded in non-interest revenue, trading revenues, in our Consolidated Statement of Income.
168 BMO Financial Group 201st Annual Report 2018

Notes
Fair Value of Trading and Hedging DerivativesFair value represents point-in-time estimates that may change in subsequent reporting periods due to market conditions or other factors. A discussionof the fair value measurement of derivatives is included in Note 17.
Fair values of our derivative instruments are as follows:
(Canadian $ in millions) 2018 2017
Grossassets
Grossliabilities Net
Grossassets
Grossliabilities Net
TradingInterest Rate ContractsSwaps 7,795 (6,419) 1,376 8,390 (7,027) 1,363Forward rate agreements 36 (10) 26 41 – 41Futures 2 (3) (1) – – –Purchased options 425 – 425 444 – 444Written options – (273) (273) – (329) (329)Foreign Exchange ContractsCross-currency swaps 2,362 (1,678) 684 2,687 (1,752) 935Cross-currency interest rate swaps 4,977 (6,057) (1,080) 8,103 (9,051) (948)Forward foreign exchange contracts 4,335 (2,817) 1,518 4,954 (3,178) 1,776Purchased options 241 – 241 267 – 267Written options – (228) (228) – (270) (270)Commodity ContractsSwaps 1,559 (1,084) 475 726 (717) 9Futures 17 – 17 – – –Purchased options 484 – 484 352 – 352Written options – (372) (372) – (357) (357)Equity Contracts 2,158 (2,402) (244) 1,388 (3,386) (1,998)Credit Default SwapsPurchased 1 (36) (35) – (54) (54)Written 9 (1) 8 7 (1) 6
Total fair value – trading derivatives 24,401 (21,380) 3,021 27,359 (26,122) 1,237
HedgingInterest Rate ContractsCash flow hedges – swaps 18 (1,261) (1,243) 78 (558) (480)Fair value hedges – swaps 701 (668) 33 274 (402) (128)
Total swaps 719 (1,929) (1,210) 352 (960) (608)
Foreign Exchange ContractsCash flow hedges 1,084 (1,074) 10 1,202 (722) 480
Total foreign exchange contracts 1,084 (1,074) 10 1,202 (722) 480
Equity ContractsCash flow hedges – (28) (28) 38 – 38
Total equity contracts – (28) (28) 38 – 38
Total fair value – hedging derivatives (1) 1,803 (3,031) (1,228) 1,592 (1,682) (90)
Total fair value – trading and hedging derivatives 26,204 (24,411) 1,793 28,951 (27,804) 1,147
Less: impact of master netting agreements (15,575) 15,575 – (19,909) 19,909 –
Total 10,629 (8,836) 1,793 9,042 (7,895) 1,147
(1) The fair values of hedging derivatives wholly or partially offset the changes in fair values of the related on-balance sheet financial instruments.
Assets are shown net of liabilities to customers where we have a legally enforceable right to offset amounts and we intend to settle contracts on anet basis.
BMO Financial Group 201st Annual Report 2018 169

Not
esNOTES TO CONSOLIDATED FINANCIAL STATEMENTS
Notional Amounts of Trading DerivativesThe notional amounts of our derivatives represent the amount to which a rate or price is applied in order to calculate the amount of cash that mustbe exchanged under the contract. Notional amounts do not represent assets or liabilities and therefore are not recorded in our Consolidated BalanceSheet.
(Canadian $ in millions) 2018 2017
Exchange traded Over-the-counter Total Exchange traded Over-the-counter Total
Interest Rate ContractsSwaps – 3,684,763 3,684,763 – 3,073,490 3,073,490Forward rate agreements – 411,573 411,573 – 195,142 195,142Purchased options 26,629 35,023 61,652 10,407 29,107 39,514Written options 16,511 48,721 65,232 9,284 37,247 46,531Futures 192,482 – 192,482 89,053 – 89,053
Total interest rate contracts 235,622 4,180,080 4,415,702 108,744 3,334,986 3,443,730
Foreign Exchange ContractsCross-currency swaps – 57,226 57,226 – 50,534 50,534Cross-currency interest rate swaps – 449,187 449,187 – 430,808 430,808Forward foreign exchange contracts – 463,743 463,743 – 392,924 392,924Purchased options 2,625 21,468 24,093 6,001 23,812 29,813Written options 1,420 24,018 25,438 1,249 29,101 30,350Futures 739 – 739 794 – 794
Total foreign exchange contracts 4,784 1,015,642 1,020,426 8,044 927,179 935,223
Commodity ContractsSwaps – 24,366 24,366 – 18,713 18,713Purchased options 3,303 6,182 9,485 5,031 7,080 12,111Written options 4,909 4,233 9,142 6,896 4,905 11,801Futures 33,104 – 33,104 28,139 – 28,139
Total commodity contracts 41,316 34,781 76,097 40,066 30,698 70,764
Equity Contracts 33,687 52,725 86,412 14,253 63,184 77,437
Credit Default SwapsPurchased – 3,047 3,047 – 2,658 2,658Written – 443 443 – 448 448
Total 315,409 5,286,718 5,602,127 171,107 4,359,153 4,530,260
Derivatives Used in Hedge AccountingIn accordance with our risk management strategy, we enter into various derivative contracts to hedge our interest rate, foreign currency and equityprice exposures. In addition, we use deposits to hedge foreign currency exposure in our net investment in foreign operations. To the extent theseinstruments qualify for hedge accounting, we designate them in accounting hedge relationships. Our structural market risk strategies, including ourapproach to managing interest rate and foreign exchange risk, are included in the blue-tinted font in the Structural (Non-Trading) Market Risk sectionof Management’s Discussion and Analysis on page 98 of this report. In addition, our exposure to foreign exchange rate risk is discussed in the ForeignExchange Risk section of Management’s Discussion and Analysis on page 99. Our exposure to equity price risk and our approach to managing it arediscussed in the “other share-based compensation, mid-term incentive plans” section of Note 20.
By using derivatives to hedge exposures to interest rates, foreign currency exchange rates, and equity prices, we are also exposed to the creditrisk of the derivative counterparty. We mitigate credit risk by entering into transactions with high-quality counterparties, requiring the counterpartiesto post collateral, entering into master netting agreements, or settling through centrally cleared counterparties.
In order to qualify as an accounting hedge, the hedging relationship must be designated and formally documented at its inception, detailing theparticular risk management objective and strategy for the hedge and the specific asset, liability or cash flow being hedged, as well as howeffectiveness is being assessed. Changes in the fair value of the derivative must be highly effective in offsetting changes in the fair value or changesin the amount of future cash flows of the hedged item. We evaluate hedge effectiveness at the inception of the hedging relationship and on anongoing basis, retrospectively and prospectively, primarily using a quantitative statistical regression analysis. We consider a hedging relationshiphighly effective when all of the following criteria are met: correlation between the variables in the regression is at least 0.8; the slope of theregression is within a 0.8 to 1.25 range; and the confidence level of the slope is at least 95%. The practice is different for our net investment hedge,discussed in the Net Investment Hedges section below.
Any ineffectiveness in the hedging relationship is recognized as it arises in non-interest revenue, other, in our Consolidated Statement of Income.
170 BMO Financial Group 201st Annual Report 2018

Notes
The following table outlines the notional amounts and average rates of derivatives and the carrying amount of deposits designated as hedginginstruments, by term to maturity, hedge type, and risk type, where applicable.
(Canadian $ in millions, except as noted) 2018
Remaining term to maturity
TotalWithin 1 year 1 to 3 years 3 to 5 years 5 to 10 years Over 10 years
Cash Flow HedgesInterest rate risk – Interest rate swapsNotional amount 5,252 22,976 30,790 14,751 – 73,769Average fixed interest rate 1.66% 1.67% 2.60% 2.42% – 2.21%Foreign exchange risk – Cross-currency swaps and foreign
exchange forwards (1)CAD-USD pair Notional amount 3,939 10,572 11,781 2,576 251 29,119
Average fixed interest rate 1.31% 1.20% 2.01% 1.27% 3.02% 1.57%Average exchange rate: CAD-USD 1.3347 1.3035 1.2923 1.1871 1.3122 1.2930
CAD-EUR pair Notional amount 3,804 8,726 8,618 – 201 21,349Average fixed interest rate 1.74% 2.10% 2.26% – 2.97% 2.11%Average exchange rate: CAD-EUR 1.5217 1.4685 1.4999 – 1.4870 1.4908
Other currency pairs (2) Notional amount – 1,817 4,427 109 – 6,353Average fixed interest rate – 2.05% 2.80% 2.98% – 2.59%Average exchange rate: CAD-Non USD/EUR – 1.4361 1.3338 0.1696 (3) – 1.3430
Equity price risk – Total return swapNotional amount 381 – – – – 381
Fair Value HedgesInterest rate risk – Interest rate swapsNotional amount 14,516 21,919 22,928 14,101 – 73,464Average fixed interest rate 1.81% 2.16% 2.29% 2.36% – 2.17%
Net Investment HedgesForeign exchange riskUSD denominated deposit – carrying amount 6,596 – – – – 6,596GBP denominated deposit – carrying amount 473 – – – – 473
(1) Under certain hedge strategies using cross-currency swaps, a CAD leg is inserted to create two swaps designated as separate hedges (for example, a EURO-USD cross-currency swap split intoEURO-CAD and CAD-USD cross-currency swaps). The relevant notional amount is grossed up in this table as the cross-currency swaps are disclosed by CAD-foreign currency pair.
(2) Includes CAD-AUD, CAD-CHF, CAD-CNH, CAD-GBP or CAD-HKD cross-currency swaps where applicable.(3) Includes one CAD-HKD cross-currency swap.
Cash Flow HedgesCash flow hedges modify exposure to variability in cash flows for variable interest rate bearing instruments, foreign currency denominated assets andliabilities and certain cash-settled share-based payment grants subject to equity price risk. We use interest rate swaps with or without embeddedoptions, cross-currency swaps, and total return swaps to hedge this variability. We hedge the full amount of foreign exchange risk, but interest raterisk is hedged only to the extent of benchmark interest rates. The benchmark interest rate is a component of interest rate risk that is observable inthe relevant financial markets, for example London Interbank Offered Rate (“LIBOR”) or Bankers’ Acceptances (“BA”) rate.
We determine the amount of the exposure to which hedge accounting is applied by assessing the potential impact of changes in interest rates,foreign exchange rates, and equity prices on the future cash flows of floating rate loans and deposits, foreign currency denominated assets andliabilities and certain cash-settled share-based payments. This assessment is performed using analytical techniques, such as simulation, sensitivityanalysis, stress testing and gap analysis.
We record interest that we pay or receive on these cash flow hedge derivatives as an adjustment to net interest income in our ConsolidatedStatement of Income over the life of the hedge.
To the extent that changes in the fair value of the derivative offset changes in the fair value of the hedged item for the designated hedged risk,they are recorded in other comprehensive income. Hedge ineffectiveness, the portion of the change in fair value of the derivative that does not offsetchanges in the fair value of the hedged item, is recorded directly in non-interest revenue, other, in our Consolidated Statement of Income as it arises.
For cash flow hedges that are discontinued before the end of the original hedge term, the cumulative unrealized gain or loss recorded in othercomprehensive income is amortized to our Consolidated Statement of Income in net interest income for interest rate swaps and in employeecompensation for total return swaps as the hedged item is recorded in earnings. The entire unrealized gain or loss is recognized immediately in netinterest income in our Consolidated Statement of Income, if the hedged item is sold or settled. We do not terminate our foreign exchange hedgesbefore maturity.
Under cash flow hedges, we use a hypothetical derivative to measure the hedged risk of floating rate loans, deposits, foreign currencydenominated assets and liabilities, or share-based payment grants. This hypothetical derivative matches the critical terms of the hedged itemsidentically, and it perfectly offsets the hedged cash flow.
In our cash flow hedge relationships, the main sources of ineffectiveness are differences in interest rate indices, tenor and reset/settlementfrequencies between the hedging instrument and the hedged item.
Net Investment HedgesNet investment hedges mitigate our exposure to foreign currency exchange rate fluctuations related to our net investment in foreign operations.
Deposits denominated in foreign currencies are designated as a hedging instrument for a portion of the net investment in foreign operations. Theforeign currency translation of our net investment in foreign operations and the effective portion of the corresponding hedging instrument arerecorded in unrealized gains (losses) on translation of net foreign operations in other comprehensive income.
Effectiveness of our net investment hedge is determined by using the dollar offset method with spot foreign currency rates. As the notionalamount of the deposits and the hedged net investment in foreign operations are the same, there is no source of ineffectiveness in these hedgingrelationships.
BMO Financial Group 201st Annual Report 2018 171

Not
esNOTES TO CONSOLIDATED FINANCIAL STATEMENTS
For cash flow hedges and net investment hedges, the following table contains information related to items designated as hedging instruments,hedged items and hedge ineffectiveness for the year ended October 31, 2018.
2018
Carrying amount ofhedging instruments (1) Hedge ineffectiveness
(Canadian $ in millions) Asset Liability
Gains (Losses) onhedging derivatives
used to calculatehedge ineffectiveness
Gains (Losses) onhypothetical derivativesused to calculate hedge
ineffectiveness
Ineffectivenessrecorded in
non-interestrevenue – other
Cash flow hedgesInterest rate risk – Interest rate swaps 18 (1,261) (1,685) 1,687 (4)Foreign exchange risk – Cross-currency swaps and foreign exchange
forwards 1,084 (1,074) (459) 459 –Equity price risk – Total return swaps – (28) 24 (24) –
1,102 (2,363) (2,120) 2,122 (4)
Net investment hedgesForeign exchange risk – Deposit liabilities (7,069) (211) 211 –
Total 1,102 (9,432) (2,331) 2,333 (4)
(1) Represents the unrealized gains (losses) within derivative financial instruments in assets and liabilities, respectively, in the Consolidated Balance Sheet.
For cash flow hedges and net investment hedges, the following table contains information related to impacts on the Consolidated Statement of OtherComprehensive Income, on a pre-tax basis for the year ended October 31, 2018.
2018
Balance in cash flow hedge AOCI /net foreign operations AOCI
(Canadian $ in millions)AOCI as at
November 1, 2017
Gains /(losses)
recognizedin OCI
Amount reclassified tonet income as the
hedged item affectsnet income
AOCI as atOctober 31, 2018 Active hedges Discontinued hedges
Cash flow hedgesInterest rate risk (597) (1,681) 67 (2,211) (1,348) (863)Foreign exchange risk 298 (3) 456 751 751 –Equity price risk 72 24 (66) 30 30 –
(227) (1,660) 457 (1,430) (1) (567) (863)
Net investment hedgesForeign exchange risk (1,580) (211) – (1,791) (1,791) –
Total (1,807) (1,871) 457 (3,221) (2,358) (863)
(1) Tax balance related to cash flow hedge AOCI is $356 million as at October 31, 2018.
Fair Value HedgesFair value hedges modify exposure to changes in a fixed rate instrument’s fair value caused by changes in interest rates. These hedges economicallyconvert fixed rate assets and liabilities to floating rate. We use interest rate swaps to hedge interest rate risk, including benchmark interest rates,inherent in fixed rate securities, a portfolio of mortgages, deposits and subordinated debt.
Any fixed rate assets or liabilities that are part of a hedging relationship are adjusted for the change in value of the risk being hedged. To theextent that the change in the fair value of the derivative does not offset changes in the fair value of the hedged item for the risk being hedged, thenet amount (hedge ineffectiveness) is recorded directly in non-interest revenue, other, in our Consolidated Statement of Income.
For fair value hedges that are discontinued, we cease adjusting the hedged item. The cumulative fair value adjustment of the hedged item isthen amortized to net interest income over the hedged item’s remaining term to maturity. If the hedged item is sold or settled, the cumulative fairvalue adjustment is included in the gain or loss on sale or settlement.
In our fair value hedge relationships, the main sources of ineffectiveness are the counterparty effect and our own credit risk on the fair value ofthe swap, and the difference in terms such as fixed interest rate or reset/settlement frequency between the swap and the hedged item.
The amounts relating to derivatives designated as fair value hedging instruments, hedged items and hedge ineffectiveness for the year are as follows:
(Canadian $ in millions ) 2018
Carrying amount ofhedging derivatives (1) Hedge ineffectiveness
Accumulated amount of fair valuehedge gains (losses) on hedged items
Asset Liability
Gains (Losses) onhedging derivatives
used to calculatehedge ineffectiveness
Gains (Losses) onhedged item usedto calculate hedge
ineffectiveness
Ineffectivenessrecorded in
non-interestrevenue – other
Carrying amountof the hedged
item (2)Active
hedgesDiscontinued
hedges
Fair value hedgeInterest rate swaps 701 (668)FVOCI securities and loans – – 850 (843) 7 36,722 (1,160) –Deposits and subordinated
debt – – (764) 761 (3) (34,375) 719 436
Total 701 (668) 86 (82) 4 2,347 (441) 436
(1) Represents the unrealized gains (losses) within derivative financial instruments in assets and liabilities, respectively, in the Consolidated Balance Sheet.(2) Represents the carrying value on the Consolidated Balance Sheet and includes amortized cost, before allowance for credit losses, plus fair value hedge adjustments, except for FVOCI securities that are
carried at fair value.
172 BMO Financial Group 201st Annual Report 2018

Notes
Comparative InformationDuring 2017, net losses of $1,161 million related to the effective portion of cash flow hedges were recognized in OCI. A gain of $188 million relatedto cash flow hedges was transferred from equity to income in interest income or interest expense. Net ineffectiveness recognized on cash flowhedges during 2017 was a loss of $7 million.
Included within non-interest revenue, other, is a fair value loss of $200 million on derivatives held in qualifying fair value hedging relationships,and a gain of $193 million representing net increases in the fair value of the hedged item attributable to the hedged risk.
Derivative-Related Market RiskDerivative instruments are subject to market risk. Market risk arises from the potential for a negative impact on the balance sheet and/or statementof income due to adverse changes in the value of derivative instruments as a result of changes in certain market variables. These variables includeinterest rates, foreign exchange rates, equity and commodity prices and their implied volatilities, as well as credit spreads, credit migration anddefault. We strive to limit market risk by employing comprehensive governance and management processes for all market risk-taking activities.
Derivative-Related Credit RiskOver-the-counter derivative instruments are subject to credit risk arising from the possibility that counterparties may default on their obligations. Thecredit risk associated with a derivative is normally a small fraction of the notional amount of the derivative instrument. Derivative contracts generallyexpose us to potential credit loss if changes in market rates affect the counterparty’s position unfavourably and the counterparty defaults onpayment. The credit risk is represented by the positive fair value of the derivative instrument. We strive to limit credit risk by dealing withcounterparties that we believe are creditworthy, and we manage our credit risk for derivatives using the same credit risk process that is applied toloans and other credit assets.
We also pursue opportunities to reduce our exposure to credit losses on derivative instruments, including through collateral and by entering intomaster netting agreements with counterparties. The credit risk associated with favourable contracts is mitigated by legally enforceable master nettingagreements to the extent that unfavourable contracts with the same counterparty must be settled concurrently with favourable contracts.
Exchange-traded derivatives have limited potential for credit exposure, as they are settled net daily with each exchange.
Terms used in the credit risk table below are as follows:
Replacement cost represents the cost of replacing all contracts that have a positive fair value, determined using current market rates. It represents ineffect the unrealized gains on our derivative instruments. Replacement costs disclosed below represent the net of the asset and liability to a specificcounterparty where we have a legally enforceable right to offset the amount owed to us with the amount owed by us and we intend either to settleon a net basis or to realize the asset and settle the liability simultaneously.
Credit risk equivalent represents the total replacement cost plus an amount representing the potential future credit exposure, as outlined in OSFI’sCapital Adequacy Guideline.
Risk-weighted assets represent the credit risk equivalent, weighted on the basis of the creditworthiness of the counterparty, and consideringcollateral, netting and other credit risk mitigants, as prescribed by OSFI.
BMO Financial Group 201st Annual Report 2018 173

Not
esNOTES TO CONSOLIDATED FINANCIAL STATEMENTS
(Canadian $ in millions) 2018 2017
Replacementcost
Credit riskequivalent
Risk-weightedassets
Replacementcost
Credit riskequivalent
Risk-weightedassets
Interest Rate ContractsSwaps 8,514 10,699 – 8,742 11,603 –Forward rate agreements 36 34 – 41 42 –Purchased options 409 393 – 440 381 –
Total interest rate contracts 8,959 11,126 704 9,223 12,026 1,537
Foreign Exchange ContractsCross-currency swaps 3,270 7,832 – 3,727 8,345 –Cross-currency interest rate swaps 5,035 14,909 – 8,157 17,210 –Forward foreign exchange contracts 4,453 8,373 – 5,062 8,389 –Purchased options 225 424 – 250 420 –
Total foreign exchange contracts 12,983 31,538 2,544 17,196 34,364 2,701
Commodity ContractsSwaps 1,559 4,450 – 726 2,971 –Purchased options 335 1,108 – 120 1,034 –
Total commodity contracts 1,894 5,558 1,188 846 4,005 971
Equity Contracts 1,585 4,332 431 1,322 4,750 461
Credit Default Swaps 10 55 83 7 46 27
Total derivatives 25,431 52,609 4,950 28,594 55,191 5,697
Less: impact of master netting agreements (15,575) (29,170) – (19,909) (33,025) –
Total 9,856 23,439 4,950 8,685 22,166 5,697
The total derivatives and the impact of master netting agreements for replacement cost do not include exchange-traded derivatives with a fair value of $773 million as at October 31, 2018 ($357 millionin 2017).
Transactions are conducted with counterparties in various geographic locations and industry sectors. Set out below is the replacement cost ofcontracts with customers located in the following countries, based on country of ultimate risk:
(Canadian $ in millions, except as noted) Before master netting agreements After master netting agreements
2018 2017 2018 2017
Canada 13,449 53% 15,447 54% 4,901 50% 5,045 58%United States 5,446 21% 7,149 25% 2,102 21% 1,940 22%United Kingdom 1,181 5% 1,079 4% 315 3% 182 2%Other countries (1) 5,355 21% 4,919 17% 2,538 26% 1,518 18%
Total 25,431 100% 28,594 100% 9,856 100% 8,685 100%
(1) No other country represented 15% or more of our replacement cost in 2018 or 2017.
Transactions are conducted with various counterparties. Set out below is the replacement cost of contracts (before the impact of master nettingagreements) with customers in the following industries:
As at October 31, 2018 (Canadian $ in millions) Interest rate contracts Foreign exchange contracts Commodity contracts Equity contracts Credit default swaps Total
Financial institutions 6,509 10,238 360 1,219 10 18,336Governments 1,694 1,478 56 – – 3,228Natural resources 3 27 432 – – 462Energy 93 641 727 – – 1,461Other 660 599 319 366 – 1,944
Total 8,959 12,983 1,894 1,585 10 25,431
As at October 31, 2017 (Canadian $ in millions) Interest rate contracts Foreign exchange contracts Commodity contracts Equity contracts Credit default swaps Total
Financial institutions 6,063 13,898 227 1,141 7 21,336Governments 1,895 1,202 66 – – 3,163Natural resources – 22 74 – – 96Energy 155 479 226 – – 860Other 1,110 1,595 253 181 – 3,139
Total 9,223 17,196 846 1,322 7 28,594
174 BMO Financial Group 201st Annual Report 2018

Notes
Term to MaturityOur derivative contracts have varying maturity dates. The remaining contractual terms to maturity for the notional amounts of our derivative contractsare set out below:
(Canadian $ in millions) Term to maturity 2018 2017
Within1 year
1 to 3years
3 to 5years
5 to 10years
Over 10years
Total notionalamounts
Total notionalamounts
Interest Rate ContractsSwaps 1,404,557 707,683 1,167,568 514,392 37,797 3,831,997 3,202,365Forward rate agreements, futures and options 608,132 100,756 13,885 7,897 269 730,939 370,240
Total interest rate contracts 2,012,689 808,439 1,181,453 522,289 38,066 4,562,936 3,572,605
Foreign Exchange ContractsCross-currency swaps 12,466 36,718 24,980 15,413 3,339 92,916 85,586Cross-currency interest rate swaps 118,783 147,231 97,828 72,857 18,533 455,232 434,210Forward foreign exchange contracts, futures and options 512,002 9,283 1,148 134 26 522,593 463,665
Total foreign exchange contracts 643,251 193,232 123,956 88,404 21,898 1,070,741 983,461
Commodity ContractsSwaps 6,234 14,885 2,875 372 – 24,366 18,713Futures and options 21,910 25,587 3,530 704 – 51,731 52,051
Total commodity contracts 28,144 40,472 6,405 1,076 – 76,097 70,764
Equity Contracts 72,922 7,953 3,873 1,680 366 86,794 77,781
Credit Contracts 746 248 1,262 1,083 151 3,490 3,106
Total notional amount 2,757,752 1,050,344 1,316,949 614,532 60,481 5,800,058 4,707,717
Note 9: Premises and EquipmentWe record all premises and equipment at cost less accumulated amortization, and less any accumulated impairment, except land, which is recorded atcost. Buildings, computer equipment and operating system software, other equipment and leasehold improvements are amortized on a straight-linebasis over their estimated useful lives. When the major components of a building have different useful lives, they are accounted for separately andamortized over each component’s estimated useful life.
The maximum estimated useful lives we use to amortize our assets are as follows:
Buildings 10 to 40 yearsComputer equipment and operating system software 5 yearsOther equipment 10 yearsLeasehold improvements Lease term to a maximum of 10 years
Amortization methods, useful lives and the residual values of premises and equipment are reviewed annually for any change in circumstances andare adjusted if appropriate. At each reporting period, we review whether there are any indications that premises and equipment need to be tested forimpairment. If there is an indication that an asset may be impaired, we test for impairment by comparing the asset’s carrying value to its recoverableamount. The recoverable amount is calculated as the higher of the value in use and the fair value less costs to sell. Value in use is the present valueof the future cash flows expected to be derived from the asset. An impairment charge is recorded when the recoverable amount is less than thecarrying value. There were no significant write-downs of premises and equipment due to impairment during the years ended October 31, 2018 and2017. Gains and losses on disposal are included in non-interest expense, premises and equipment, in our Consolidated Statement of Income.
BMO Financial Group 201st Annual Report 2018 175

Not
esNOTES TO CONSOLIDATED FINANCIAL STATEMENTS
Net rent expense for premises and equipment reported in non-interest expense, premises and equipment, in our Consolidated Statement ofIncome for the years ended October 31, 2018, 2017 and 2016 was $530 million, $501 million and $502 million, respectively.
(Canadian $ in millions) 2018 2017
Land BuildingsComputer
equipmentOther
equipmentLeasehold
improvements Total Land BuildingsComputer
equipmentOther
equipmentLeasehold
improvements Total
CostBalance at beginning of year 174 1,726 1,994 913 1,429 6,236 207 1,784 1,844 902 1,347 6,084Additions 4 66 236 40 87 433 – 72 156 69 105 402Disposals (1) (32) (163) (11) (27) (20) (253) (28) (95) (13) (13) (10) (159)Foreign exchange and other (1) (2) 10 7 18 32 (5) (35) 7 (45) (13) (91)
Balance at end of year 145 1,627 2,229 933 1,514 6,448 174 1,726 1,994 913 1,429 6,236
Accumulated Depreciation andImpairment
Balance at beginning of year – 1,063 1,465 674 1,001 4,203 – 1,055 1,306 649 927 3,937Disposals (1) – (116) (9) (24) (15) (164) – (32) (11) (8) (8) (59)Amortization – 60 201 48 91 400 – 63 185 49 94 391Foreign exchange and other – 9 5 6 3 23 – (23) (15) (16) (12) (66)
Balance at end of year – 1,016 1,662 704 1,080 4,462 – 1,063 1,465 674 1,001 4,203
Net carrying value 145 611 567 229 434 1,986 174 663 529 239 428 2,033
(1) Includes fully depreciated assets written off.
Note 10: AcquisitionsThe cost of an acquisition is measured at the fair value of the consideration transferred, including contingent consideration. Acquisition-related costsare recognized as an expense in the period in which they are incurred. The identifiable assets acquired and liabilities assumed and contingentconsideration are measured at their fair values at the date of acquisition. Goodwill is measured as the excess of the aggregate of the considerationtransferred over the net of the fair value of identifiable assets acquired and liabilities assumed. The results of operations of acquired businesses areincluded in our consolidated financial statements beginning on the date of acquisition.
KGS-Alpha Capital Markets (“KGS”)On September 1, 2018, we completed the acquisition of the business of KGS, a U.S. fixed income broker-dealer specializing in U.S. mortgage andasset-backed securities in the institutional investor market, for cash consideration of US$304 million (CAD$397 million). The acquisition was accountedfor as a business combination, and the acquired business and corresponding goodwill are included in our Capital Markets reporting segment.
As part of this acquisition, we acquired intangible assets of $49 million and goodwill of $54 million. The intangible assets are being amortizedover three to fourteen years on an accelerated basis. Goodwill of $32 million related to this acquisition is deductible for tax purposes.
The fair values of the assets acquired and liabilities assumed at the date of acquisition are as follows:
(Canadian $ in millions)
KGS
Securities – trading 5,193Securities borrowed or purchased under resale agreements 5,669Goodwill and intangible assets 103Other assets 584
Total assets 11,549
Securities lent or sold under repurchase agreements 9,563Securities sold but not yet purchased 1,431Other liabilities 158
Purchase price 397
The purchase price allocation for KGS is subject to refinement as we complete the valuation of the assets acquired and liabilities assumed.
Note 11: Goodwill and Intangible AssetsGoodwillWhen we complete an acquisition, we allocate the purchase price paid to the assets acquired, including identifiable intangible assets, and theliabilities assumed. Any portion of the consideration transferred that is in excess of the fair value of those net assets is considered to be goodwill.Goodwill is not amortized and is instead tested for impairment annually.
176 BMO Financial Group 201st Annual Report 2018

Notes
In performing the impairment test, we utilize the fair value less costs to sell for each group of CGUs based on discounted cash flow projections.Cash flows were projected for the first 10 years based on actual operating results, expected future business performance and past experience. Beyond10 years, cash flows were assumed to grow at perpetual annual rates of up to 2% (3% in 2017). The discount rates we applied in determining therecoverable amounts in 2018 ranged from 8.6% to 11.4% (8.3% to 12.2% in 2017), and were based on our estimate of the cost of capital for eachCGU. The cost of capital for each CGU was estimated using the Capital Asset Pricing Model, based on the historical betas of publicly traded peercompanies that are comparable to the CGU.
There were no write-downs of goodwill due to impairment during the years ended October 31, 2018 and 2017.The key assumptions described above may change as market and economic conditions change. However, we estimate that reasonably possible
changes in these assumptions are not expected to cause recoverable amounts of our CGUs to decline below their carrying amounts.
A continuity of our goodwill by group of CGUs for the years ended October 31, 2018 and 2017 is as follows:
(Canadian $ in millions)Personal and
Commercial BankingWealth
ManagementBMO
Capital Markets Total
CanadianP&C
U.S.P&C Total
TraditionalWealth
Management Insurance Total
Balance – October 31, 2016 97 3,861 3,958 2,117 2 2,119 304 6,381Acquisitions (disposals) during the year – – – (4) – (4) – (4)Foreign exchange and other (1) – (142) (142) 24 – 24 (15) (133)
Balance – October 31, 2017 97 3,719 3,816 2,137 2 2,139 289 6,244
Acquisitions (disposals) during the year – – – – – – 54 54Foreign exchange and other (1) – 78 78 (8) – (8) 5 75
Balance – October 31, 2018 97 (2) 3,797 (3) 3,894 2,129 (4) 2 (5) 2,131 348 (6) 6,373
(1) Other changes in goodwill included the effects of translating goodwill denominated in foreign currencies into Canadian dollars and purchase accounting adjustments related to prior-year purchases.(2) Relates primarily to bcpbank Canada, Diners Club, Aver Media LP and GE Transportation Finance.(3) Relates primarily to First National Bank & Trust, Ozaukee Bank, Merchants and Manufacturers Bancorporation, Inc., Diners Club, AMCORE, M&I and GE Transportation Finance.(4) Relates to BMO Nesbitt Burns Inc., Guardian Group of Funds Ltd., Pyrford International plc, LGM Investments Limited, M&I, myCFO, Inc., Stoker Ostler Wealth Advisors, Inc., CTC Consulting LLC, AWMB
and F&C Asset Management plc.(5) Relates to AIG.(6) Relates to Gerard Klauer Mattison, BMO Nesbitt Burns Inc., Paloma Securities L.L.C., M&I, Greene Holcomb Fisher and KGS.
Intangible AssetsIntangible assets related to our acquisitions are initially recorded at their fair value at the acquisition date and subsequently at cost less accumulatedamortization. Software is recorded at cost less accumulated amortization. Amortization expense is recorded in amortization of intangible assets in ourConsolidated Statement of Income. The following table presents the changes in the balance of these intangible assets:
(Canadian $ in millions)Customer
relationshipsCore
depositsBranch distribution
networksSoftware –amortizing
Software underdevelopment Other Total
Cost as at October 31, 2016 704 968 194 3,189 476 365 5,896Additions (disposals) (33) – – 546 (67) – 446Foreign exchange and other (17) (37) (7) (39) (11) 11 (100)
Cost as at October 31, 2017 654 931 187 3,696 398 376 6,242Additions (disposals) 35 – – 422 94 12 563Foreign exchange and other (1) 20 4 9 4 (4) 32
Cost as at October 31, 2018 688 951 191 4,127 496 384 6,837
Certain comparative figures have been reclassified to conform with the current year’s presentation.
The following table presents the accumulated amortization of our intangible assets:
(Canadian $ in millions)Customer
relationshipsCore
depositsBranch distribution
networksSoftware –amortizing
Software underdevelopment Other Total
Accumulated amortization at October 31, 2016 398 735 194 2,329 – 62 3,718Amortization 68 56 – 336 – 25 485Disposals (22) – – (11) – – (33)Foreign exchange and other (13) (29) (7) (36) – (2) (87)
Accumulated amortization at October 31, 2017 431 762 187 2,618 – 85 4,083Amortization 46 51 – 387 – 19 503Disposals – – – (20) – – (20)Foreign exchange and other (2) 17 4 (15) – (5) (1)
Accumulated amortization at October 31, 2018 475 830 191 2,970 – 99 4,565
Carrying value at October 31, 2018 213 121 – 1,157 496 285 2,272
Carrying value at October 31, 2017 223 169 – 1,078 398 291 2,159
Certain comparative figures have been reclassified to conform with the current year’s presentation.
Intangible assets are amortized to income over the period during which we believe the assets will benefit us, on either a straight-line or anaccelerated basis, over a period not to exceed 15 years. We have $165 million as at October 31, 2018 ($169 million as at October 31, 2017) inintangible assets with indefinite lives that relate primarily to fund management contracts.
BMO Financial Group 201st Annual Report 2018 177

Not
esNOTES TO CONSOLIDATED FINANCIAL STATEMENTS
The useful lives of intangible assets are reviewed annually for any changes in circumstances. We test definite-life intangible assets forimpairment when events or changes in circumstances indicate that their carrying value may not be recoverable. Indefinite-life intangible assets aretested annually for impairment. If any intangible assets are determined to be impaired, we write them down to their recoverable amount, the higherof value in use and fair value less costs to sell, when this is less than the carrying value.
There were write-downs of intangible assets of $13 million during the year ended October 31, 2018 ($5 million in 2017).
Note 12: Other AssetsCustomers’ Liability under AcceptancesAcceptances represent a form of negotiable short-term debt that is issued by our customers, which we guarantee for a fee. The fees earned arerecorded in lending fees in our Consolidated Statement of Income over the term of the acceptance. The amount potentially due under the acceptancesis recorded in other liabilities on our Consolidated Balance Sheet. We record the bank’s equivalent claim against our customers in the event of a callon these commitments in other assets on our Consolidated Balance Sheet.
OtherThe components of other within other assets are as follows:
(Canadian $ in millions) 2018 2017
Accounts receivable, prepaid expenses and other items 6,910 6,508Accrued interest receivable 1,461 1,079BMO Transportation Finance – leased vehicles 937 928Cash collateral 2,019 3,165Due from clients, dealers and brokers 236 156Insurance-related assets 822 644Pension asset (Note 21) 664 508Precious metals 1,603 582
Total 14,652 13,570
Certain comparative figures have been reclassified to conform with the current year’s presentation.
Note 13: DepositsPayable on demand
(Canadian $ in millions) Interest bearing Non-interest bearingPayable
after noticePayable ona fixed date Total
2018 2017 2018 2017 2018 2017 2018 2017 2018 2017
Deposits by:Banks (1) 1,450 818 1,400 1,864 526 586 24,531 24,937 27,907 28,205Business and government 25,266 20,621 33,984 33,968 67,026 61,790 187,024 166,897 313,300 283,276Individuals 3,476 3,278 21,345 20,044 90,233 89,859 65,790 55,130 180,844 168,311
Total (2)(3) 30,192 24,717 56,729 55,876 157,785 152,235 277,345 246,964 522,051 479,792
Booked in:Canada 21,735 21,557 47,231 44,380 82,091 81,590 161,192 145,648 312,249 293,175United States 7,395 2,259 9,477 11,496 74,476 69,555 86,805 75,517 178,153 158,827Other countries 1,062 901 21 – 1,218 1,090 29,348 25,799 31,649 27,790
Total 30,192 24,717 56,729 55,876 157,785 152,235 277,345 246,964 522,051 479,792
(1) Includes regulated and central banks.(2) Includes structured notes designated at fair value through profit or loss.(3) As at October 31, 2018 and 2017, total deposits payable on a fixed date included $29,673 million and $30,419 million, respectively, of federal funds purchased, commercial paper issued and other
deposit liabilities. Included in deposits as at October 31, 2018 and 2017 are $259,747 million and $237,127 million, respectively, of deposits denominated in U.S. dollars, and $37,427 million and$27,686 million, respectively, of deposits denominated in other foreign currencies.
Certain comparative figures have been reclassified to conform with the current year’s presentation.
Deposits payable on demand are comprised primarily of our customers’ chequing accounts, some of which we pay interest on. Our customers neednot notify us prior to withdrawing money from their chequing accounts.
Deposits payable after notice are comprised primarily of our customers’ savings accounts, on which we pay interest. Deposits payable on a fixeddate are comprised of:‰ Various investment instruments purchased by our customers to earn interest over a fixed period, such as term deposits and guaranteed investment
certificates. The terms of these deposits can vary from one day to 10 years.‰ Federal funds purchased, which are overnight borrowings of other banks’ excess reserve funds at the United States Federal Reserve Bank. As at
October 31, 2018, we had borrowed $55 million of federal funds ($707 million in 2017).‰ Commercial paper, which totalled $9,121 million as at October 31, 2018 ($8,430 million in 2017).‰ Covered bonds, which totalled $25,045 million as at October 31, 2018 ($23,108 million in 2017).
178 BMO Financial Group 201st Annual Report 2018

Notes
The following table presents the maturity schedule for our deposits payable on a fixed date:
(Canadian $ in millions) 2018 2017
Within 1 year 162,666 145,0391 to 2 years 34,154 25,6202 to 3 years 26,107 23,3233 to 4 years 16,708 19,3454 to 5 years 22,196 15,850Over 5 years 15,514 17,787
Total (1) 277,345 246,964
(1) Includes $247,808 million of deposits, each greater than one hundred thousand dollars, of which $146,697 million were booked in Canada, $71,770 million were booked in the United States and$29,341 million were booked in other countries ($221,954 million, $130,197 million, $65,963 million and $25,794 million, respectively, in 2017). Of the $146,697 million of deposits booked in Canada,$55,190 million mature in less than three months, $3,836 million mature in three to six months, $12,909 million mature in six to twelve months and $74,762 million mature after 12 months($130,197 million, $41,418 million, $7,922 million, $10,574 million and $70,283 million, respectively, in 2017). We have unencumbered liquid assets of $242,612 million to support these and otherdeposit liabilities ($213,757 million in 2017).
Most of our structured note liabilities included in deposits have been designated at fair value through profit or loss and are accounted for at fair value,which aligns the accounting result with the way the portfolio is managed. The fair value and notional amount due at contractual maturity of thesenotes as at October 31, 2018 were $15,309 million and $15,668 million respectively ($13,674 million and $13,563 million, respectively, in 2017). Thechange in fair value of these structured notes was recorded as an increase of $498 million in non-interest revenue, trading revenues, and a decreaseof $28 million before tax was recorded in other comprehensive income related to changes in our own credit spread for the year ended October 31,2018 (a decrease of $72 million recorded in non-interest revenue, trading revenues, and a decrease of $169 million related to changes in our owncredit spread in 2017). The impact of changes in our own credit spread is measured based on movements in our own credit spread year over year.
The cumulative change in fair value related to changes in our own credit spread that has been recognized since the notes were designated at fairvalue to October 31, 2018 was an unrealized loss of approximately $331 million (unrealized loss of approximately $303 million in 2017), and$255 million of this unrealized loss has been recorded in other comprehensive income ($227 million in 2017).
Note 14: Other LiabilitiesAcceptancesAcceptances represent a form of negotiable short-term debt that is issued by our customers, which we guarantee for a fee. The fees earned arerecorded in lending fees in our Consolidated Statement of Income over the term of the acceptance. The amount potentially due under acceptances isrecorded in other liabilities on our Consolidated Balance Sheet. We record the bank’s equivalent claim against our customers in the event of a call onthese commitments in other assets on our Consolidated Balance Sheet.
Securities Lending and BorrowingSecurities lending and borrowing transactions are generally collateralized by securities or cash. Cash advanced or received as collateral is recorded inother assets or other liabilities, respectively. Interest earned on cash collateral is recorded in interest, dividend and fee income in our ConsolidatedStatement of Income, and interest expense on cash collateral is recorded in interest expense, other liabilities, in our Consolidated Statement ofIncome. The transfer of the securities to counterparties is only reflected in our Consolidated Balance Sheet if the risks and rewards of ownership havealso been transferred. Securities borrowed are not recognized in our Consolidated Balance Sheet unless they are then sold to third parties, in whichcase the obligation to return the securities is recorded in Securities sold but not yet purchased at fair value, with any gains or losses recorded innon-interest revenue, trading revenues.
Securities Sold but not yet PurchasedSecurities sold but not yet purchased represent our obligations to deliver securities that we did not own at the time of sale. These obligations arerecorded at their fair value. Adjustments to the fair value as at the balance sheet date and gains and losses on the settlement of these obligations arerecorded in trading revenues in our Consolidated Statement of Income.
Securities Lent or Sold Under Repurchase AgreementsSecurities lent or sold under repurchase agreements represent short-term funding transactions in which we sell securities that we own andsimultaneously commit to repurchase the same securities at a specified price on a specified date in the future. The obligation to repurchase thesesecurities is recorded at the amount owing. The interest expense related to these liabilities is recorded on an accrual basis in interest expense, otherliabilities, in our Consolidated Statement of Income.
Securitization and Structured Entities’ LiabilitiesSecuritization and structured entities’ liabilities include notes issued by our consolidated bank securitization vehicles and liabilities associated with thesecuritization of our Canadian mortgage loans as part of the Canada Mortgage Bond program, the National Housing Act Mortgage-Backed Securitiesprogram and our own program. Additional information on our securitization program and associated liabilities is provided in Notes 6 and 7. Theseliabilities are initially measured at fair value plus any directly attributable costs and are subsequently measured at amortized cost. The interestexpense related to these liabilities is recorded in interest expense, other liabilities, in our Consolidated Statement of Income.
BMO Financial Group 201st Annual Report 2018 179

Not
esNOTES TO CONSOLIDATED FINANCIAL STATEMENTS
OtherThe components of other within other liabilities are as follows:
(Canadian $ in millions) 2018 2017
Accounts payable, accrued expenses and other items 8,119 7,894Accrued interest payable 1,385 1,037Cash collateral 4,343 3,696Insurance-related liabilities 9,585 8,959Liabilities of subsidiaries, other than deposits 9,283 6,931Other employee future benefits liability (Note 21) 960 1,303Payable to brokers, dealers and clients 1,898 2,177Pension liability (Note 21) 256 364
Total 35,829 32,361
Certain comparative figures have been reclassified to conform with the current year’s presentation.
Insurance-Related LiabilitiesWe are engaged in insurance businesses related to life and health insurance, annuities and reinsurance.
We designate the obligation related to certain investment contracts in our insurance business at fair value through profit or loss, whicheliminates a measurement inconsistency that would otherwise arise from measuring the investment contract liabilities and offsetting changes in thefair value of the investments supporting them on a different basis. The fair value of these investment contract liabilities as at October 31, 2018 of$800 million ($749 million as at October 31, 2017) is recorded in other liabilities in our Consolidated Balance Sheet. The change in fair value of theseinvestment contract liabilities resulted in a decrease of $28 million in insurance claims, commissions and changes in policy benefit liabilities for theyear ended October 31, 2018 (decrease of $41 million in 2017 and an increase of $55 million in 2016). For the year ended October 31, 2018, a loss of$2 million was recorded in other comprehensive income related to changes in our credit spread (loss of $32 million in 2017 and $7 million in 2016).The impact of changes in our own credit spread is measured based on movements in our own credit spread year over year. Changes in the fair valueof investments backing these investment contract liabilities are recorded in non-interest revenue, insurance revenue.
Insurance claims and policy benefit liabilities represent current claims and estimates of future insurance policy benefit liabilities. Liabilities for lifeinsurance contracts are determined using the Canadian Asset Liability Method, which incorporates best-estimate assumptions for mortality, morbidity,policy lapses, surrenders, future investment yields, policy dividends, administration costs and margins for adverse deviation. These assumptions arereviewed at least annually and updated to reflect actual experience and market conditions.
A reconciliation of the change in insurance-related liabilities is as follows:
(Canadian $ in millions) 2018 2017
Insurance-related liabilities, beginning of year 8,959 7,909Increase (decrease) in life insurance policy benefit liabilities from:
New business 742 545In-force policies (400) 66Changes in actuarial assumptions and methodology 3 (52)Foreign currency – (1)
Net increase in life insurance policy benefit liabilities 345 558Change in other insurance-related liabilities 281 492
Insurance-related liabilities, end of year 9,585 8,959
ReinsuranceIn the ordinary course of business, our insurance subsidiaries reinsure risks to other insurance and reinsurance companies in order to provide greaterdiversification, limit loss exposure to large risks, and provide additional capacity for future growth. These ceding reinsurance arrangements do notrelieve our insurance subsidiaries of their direct obligation to the insured parties. We evaluate the financial condition of the reinsurers and monitortheir credit ratings to minimize our exposure to losses from reinsurer insolvency.
Reinsurance premiums ceded are recorded net against direct premium income and are included in non-interest revenue, insurance revenue, in ourConsolidated Statement of Income for the years ended October 31, 2018, 2017 and 2016, as shown in the table below:
(Canadian $ in millions) 2018 2017 2016
Direct premium income 1,976 1,750 1,561Ceded premiums (148) (157) (271)
1,828 1,593 1,290
180 BMO Financial Group 201st Annual Report 2018

Notes
Note 15: Subordinated DebtSubordinated debt represents our direct unsecured obligations to our debt holders, in the form of notes and debentures and forms part of ourregulatory capital. Subordinated debt is recorded at amortized cost using the effective interest rate method. Where appropriate, we enter into fair valuehedges to hedge the risks caused by changes in interest rates (see Note 8). The rights of the holders of our notes and debentures are subordinate tothe claims of depositors and certain other creditors. We require approval from OSFI before we can redeem any part of our subordinated debt.
The face values, terms to maturity and carrying values of our subordinated debt are as follows:
(Canadian $ in millions, except as noted) Face value Maturity date Interest rate (%) Redeemable at our option2018Total
2017Total
Debentures Series 20 150 December 2025 to 2040 8.25 Not redeemable 143 148Series F Medium-Term Notes, First Tranche 900 March 2023 6.17 March 2018 (1) – 905Series H Medium-Term Notes, First Tranche (8) 1,000 September 2024 3.12 September 2019 (2) 1,003 1,016Series H Medium-Term Notes, Second Tranche (8) 1,000 December 2025 3.34 December 2020 (3) 916 969Series I Medium-Term Notes, First Tranche (8) 1,250 June 2026 3.32 June 2021 (4) 1,222 1,178Series I Medium-Term Notes, Second Tranche (8) 850 June 2027 2.57 June 2022 (5) 813 8133.803% Subordinated Notes due 2032 (8)(9) US 1,250 December 2032 3.80 December 2027 (6) 1,573 –4.338% Subordinated Notes due 2028 (8)(10) US 850 October 2028 4.34 October 2023 (7) 1,112 –
Total (11) 6,782 5,029
(1) All $900 million Series F Medium-Term Notes, First Tranche were redeemed on March 28, 2018 for 100% of the principal amount plus accrued and unpaid interest to, but excluding, the redemptiondate.
(2) Redeemable at par together with accrued and unpaid interest to, but excluding, their redemption date commencing September 19, 2019.(3) Redeemable at the greater of par and the Canada Yield Price prior to December 8, 2020, and redeemable at par together with accrued and unpaid interest to, but excluding, their redemption date
commencing December 8, 2020.(4) Redeemable at the greater of par and the Canada Yield Price prior to June 1, 2021, and redeemable at par together with accrued and unpaid interest to, but excluding, their redemption date
commencing June 1, 2021.(5) Redeemable at the greater of par and the Canada Yield Price prior to June 1, 2022, and redeemable at par together with accrued and unpaid interest to, but excluding, their redemption date
commencing June 1, 2022.(6) Redeemable at par on December 15, 2027 together with accrued and unpaid interest to, but excluding, the redemption date.(7) Redeemable at par on October 5, 2023 together with accrued and unpaid interest to, but excluding, the redemption date.(8) These notes include a non-viability contingent capital provision, which is necessary for notes issued after a certain date to qualify as regulatory capital under Basel III. As such, the notes are
convertible into a variable number of our common shares if OSFI announces that the bank is, or is about to become, non-viable or if a federal or provincial government in Canada publicly announcesthat the bank has accepted or agreed to accept a capital injection, or equivalent support, to avoid non-viability. In such an event, each note is convertible into common shares pursuant to anautomatic conversion formula with a multiplier and a conversion price based on the greater of: (i) a floor price of $5.00 and (ii) the current market price of our common shares based on the volumeweighted average trading price of our common shares on the TSX. The number of common shares issued is determined by dividing the par value of the note (including accrued and unpaid interest onsuch note) by the conversion price and then times the multiplier.
(9) On December 12, 2017, we issued US$1,250 million of 3.803% subordinated notes.(10) On October 5, 2018, we issued US$850 million of 4.338% subordinated notes.(11) Certain amounts of subordinated debt were issued at a premium or discount and include fair value hedge adjustments, which together decreased their carrying value as at October 31, 2018 by
$233 million ($121 million in 2017); see Note 8 for further details. The carrying value is also adjusted for the subordinated debt holdings, held for market making purposes.
Certain comparative figures have been reclassified to conform with the current year’s presentation.
The aggregate remaining maturities of our subordinated debt, based on the maturity dates under the terms of issue, can be found in the blue-tintedfont in the Contractual Maturities of Assets and Liabilities and Off-Balance Sheet Commitments section of Management’s Discussion and Analysis onpages 107 to 108 of this report.
BMO Financial Group 201st Annual Report 2018 181
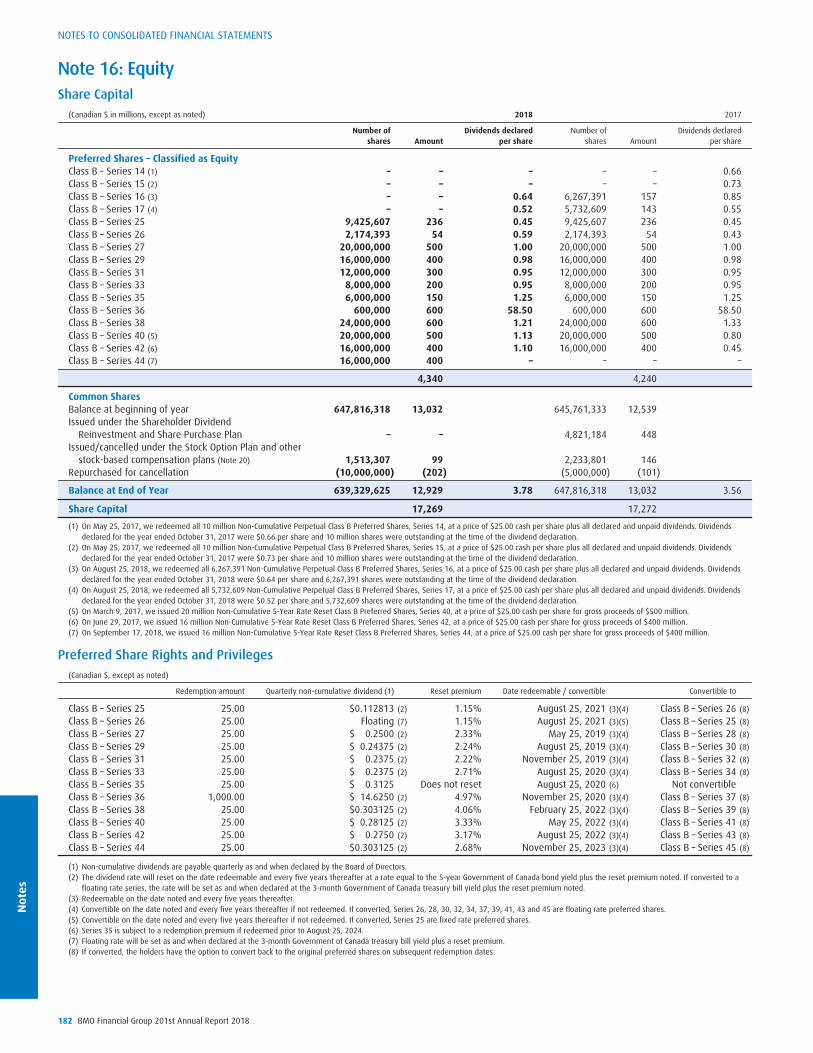
Not
esNOTES TO CONSOLIDATED FINANCIAL STATEMENTS
Note 16: EquityShare Capital
(Canadian $ in millions, except as noted) 2018 2017
Number ofshares Amount
Dividends declaredper share
Number ofshares Amount
Dividends declaredper share
Preferred Shares – Classified as EquityClass B – Series 14 (1) – – – – – 0.66Class B – Series 15 (2) – – – – – 0.73Class B – Series 16 (3) – – 0.64 6,267,391 157 0.85Class B – Series 17 (4) – – 0.52 5,732,609 143 0.55Class B – Series 25 9,425,607 236 0.45 9,425,607 236 0.45Class B – Series 26 2,174,393 54 0.59 2,174,393 54 0.43Class B – Series 27 20,000,000 500 1.00 20,000,000 500 1.00Class B – Series 29 16,000,000 400 0.98 16,000,000 400 0.98Class B – Series 31 12,000,000 300 0.95 12,000,000 300 0.95Class B – Series 33 8,000,000 200 0.95 8,000,000 200 0.95Class B – Series 35 6,000,000 150 1.25 6,000,000 150 1.25Class B – Series 36 600,000 600 58.50 600,000 600 58.50Class B – Series 38 24,000,000 600 1.21 24,000,000 600 1.33Class B – Series 40 (5) 20,000,000 500 1.13 20,000,000 500 0.80Class B – Series 42 (6) 16,000,000 400 1.10 16,000,000 400 0.45Class B – Series 44 (7) 16,000,000 400 – – – –
4,340 4,240
Common SharesBalance at beginning of year 647,816,318 13,032 645,761,333 12,539Issued under the Shareholder Dividend
Reinvestment and Share Purchase Plan – – 4,821,184 448Issued/cancelled under the Stock Option Plan and other
stock-based compensation plans (Note 20) 1,513,307 99 2,233,801 146Repurchased for cancellation (10,000,000) (202) (5,000,000) (101)
Balance at End of Year 639,329,625 12,929 3.78 647,816,318 13,032 3.56
Share Capital 17,269 17,272
(1) On May 25, 2017, we redeemed all 10 million Non-Cumulative Perpetual Class B Preferred Shares, Series 14, at a price of $25.00 cash per share plus all declared and unpaid dividends. Dividendsdeclared for the year ended October 31, 2017 were $0.66 per share and 10 million shares were outstanding at the time of the dividend declaration.
(2) On May 25, 2017, we redeemed all 10 million Non-Cumulative Perpetual Class B Preferred Shares, Series 15, at a price of $25.00 cash per share plus all declared and unpaid dividends. Dividendsdeclared for the year ended October 31, 2017 were $0.73 per share and 10 million shares were outstanding at the time of the dividend declaration.
(3) On August 25, 2018, we redeemed all 6,267,391 Non-Cumulative Perpetual Class B Preferred Shares, Series 16, at a price of $25.00 cash per share plus all declared and unpaid dividends. Dividendsdeclared for the year ended October 31, 2018 were $0.64 per share and 6,267,391 shares were outstanding at the time of the dividend declaration.
(4) On August 25, 2018, we redeemed all 5,732,609 Non-Cumulative Perpetual Class B Preferred Shares, Series 17, at a price of $25.00 cash per share plus all declared and unpaid dividends. Dividendsdeclared for the year ended October 31, 2018 were $0.52 per share and 5,732,609 shares were outstanding at the time of the dividend declaration.
(5) On March 9, 2017, we issued 20 million Non-Cumulative 5-Year Rate Reset Class B Preferred Shares, Series 40, at a price of $25.00 cash per share for gross proceeds of $500 million.(6) On June 29, 2017, we issued 16 million Non-Cumulative 5-Year Rate Reset Class B Preferred Shares, Series 42, at a price of $25.00 cash per share for gross proceeds of $400 million.(7) On September 17, 2018, we issued 16 million Non-Cumulative 5-Year Rate Reset Class B Preferred Shares, Series 44, at a price of $25.00 cash per share for gross proceeds of $400 million.
Preferred Share Rights and Privileges(Canadian $, except as noted)
Redemption amount Quarterly non-cumulative dividend (1) Reset premium Date redeemable / convertible Convertible to
Class B – Series 25 25.00 $0.112813 (2) 1.15% August 25, 2021 (3)(4) Class B – Series 26 (8)
Class B – Series 26 25.00 Floating (7) 1.15% August 25, 2021 (3)(5) Class B – Series 25 (8)
Class B – Series 27 25.00 $ 0.2500 (2) 2.33% May 25, 2019 (3)(4) Class B – Series 28 (8)
Class B – Series 29 25.00 $ 0.24375 (2) 2.24% August 25, 2019 (3)(4) Class B – Series 30 (8)
Class B – Series 31 25.00 $ 0.2375 (2) 2.22% November 25, 2019 (3)(4) Class B – Series 32 (8)
Class B – Series 33 25.00 $ 0.2375 (2) 2.71% August 25, 2020 (3)(4) Class B – Series 34 (8)
Class B – Series 35 25.00 $ 0.3125 Does not reset August 25, 2020 (6) Not convertibleClass B – Series 36 1,000.00 $ 14.6250 (2) 4.97% November 25, 2020 (3)(4) Class B – Series 37 (8)
Class B – Series 38 25.00 $0.303125 (2) 4.06% February 25, 2022 (3)(4) Class B – Series 39 (8)
Class B – Series 40 25.00 $ 0.28125 (2) 3.33% May 25, 2022 (3)(4) Class B – Series 41 (8)
Class B – Series 42 25.00 $ 0.2750 (2) 3.17% August 25, 2022 (3)(4) Class B – Series 43 (8)
Class B – Series 44 25.00 $0.303125 (2) 2.68% November 25, 2023 (3)(4) Class B – Series 45 (8)
(1) Non-cumulative dividends are payable quarterly as and when declared by the Board of Directors.(2) The dividend rate will reset on the date redeemable and every five years thereafter at a rate equal to the 5-year Government of Canada bond yield plus the reset premium noted. If converted to a
floating rate series, the rate will be set as and when declared at the 3-month Government of Canada treasury bill yield plus the reset premium noted.(3) Redeemable on the date noted and every five years thereafter.(4) Convertible on the date noted and every five years thereafter if not redeemed. If converted, Series 26, 28, 30, 32, 34, 37, 39, 41, 43 and 45 are floating rate preferred shares.(5) Convertible on the date noted and every five years thereafter if not redeemed. If converted, Series 25 are fixed rate preferred shares.(6) Series 35 is subject to a redemption premium if redeemed prior to August 25, 2024.(7) Floating rate will be set as and when declared at the 3-month Government of Canada treasury bill yield plus a reset premium.(8) If converted, the holders have the option to convert back to the original preferred shares on subsequent redemption dates.
182 BMO Financial Group 201st Annual Report 2018

Notes
Authorized Share CapitalWe classify financial instruments that we issue as financial liabilities, equity instruments or compound instruments. Financial instruments that will besettled by a variable number of our common shares upon conversion by the holders are classified as liabilities on our Consolidated Balance Sheet.Dividends and interest payments on financial liabilities are classified as interest expense in our Consolidated Statement of Income. Financialinstruments are classified as equity instruments when there is no contractual obligation to transfer cash or other financial assets. Further, issuedinstruments that are not mandatorily redeemable, or that are not convertible into a variable number of our common shares at the holder’s option, areclassified as equity and presented in share capital. Dividend payments on equity instruments are recognized as a reduction in equity.
Common SharesWe are authorized by our shareholders to issue an unlimited number of our common shares, without par value, for unlimited consideration. Ourcommon shares are not redeemable or convertible. Dividends are declared by our Board of Directors at their discretion. Historically, the Board ofDirectors has declared dividends on a quarterly basis and the amount can vary from quarter to quarter.
Preferred SharesWe are authorized by our shareholders to issue an unlimited number of Class A Preferred Shares and Class B Preferred Shares, without par value, inseries, for unlimited consideration. Class B Preferred Shares may be issued in a foreign currency.
Treasury SharesWhen we purchase our common shares as part of our trading business, we record the cost of those shares as a reduction in shareholders’ equity. Ifthose shares are resold at a price higher than their cost, the premium is recorded as an increase in contributed surplus. If those shares are resold at aprice below their cost, the discount is recorded as a reduction first to contributed surplus and then to retained earnings for any amount in excess oftotal contributed surplus related to treasury shares.
Non-Viability Contingent CapitalClass B – Series 27, Class B – Series 29, Class B – Series 31, Class B – Series 33, Class B – Series 35, Class B – Series 36, Class B – Series 38, Class B –Series 40, Class B – Series 42 and Class B – Series 44 preferred share issues include a non-viability contingent capital provision, which is necessary forthe shares to qualify as regulatory capital under Basel III. As such, the shares are convertible into a variable number of our common shares if OSFIannounces that the bank is, or is about to become, non-viable or if a federal or provincial government in Canada publicly announces that the bank hasaccepted or agreed to accept a capital injection, or equivalent support, to avoid non-viability. In such an event, each preferred share is convertible intocommon shares pursuant to an automatic conversion formula and a conversion price based on the greater of: (i) a floor price of $5.00 and (ii) thecurrent market price of our common shares based on the volume weighted average trading price of our common shares on the TSX. The number ofcommon shares issued is determined by dividing the share value of the preferred share issuance (including declared and unpaid dividends on suchpreferred share issuance) by the conversion price and then times the multiplier.
Normal Course Issuer BidWe renewed our normal course issuer bid (“NCIB”), effective June 1, 2018 for one year. Under this NCIB, we may purchase up to 20 million of ourcommon shares for cancellation. The timing and amount of purchases under the NCIB are subject to management discretion based on factors such asmarket conditions and capital levels. The bank will consult with OSFI before making purchases under the NCIB.
During the year ended October 31, 2018, we purchased for cancellation 10 million of our common shares.During the year ended October 31, 2017, we purchased for cancellation 5 million of our common shares.
Share Redemption and Dividend RestrictionsOSFI must approve any plan to redeem any of our preferred share issues for cash.
We are prohibited from declaring dividends on our preferred or common shares when we would be, as a result of paying such a dividend, incontravention of the capital adequacy, liquidity or any other regulatory directive issued under the Bank Act (Canada). In addition, common sharedividends cannot be paid unless all dividends declared and payable on our preferred shares have been paid or sufficient funds have been set aside todo so.
In addition, we have agreed that if BMO Capital Trust II (the “Trust”), an unconsolidated structured entity, fails to pay any required distributionon its capital trust securities, we will not declare dividends of any kind on any of our preferred or common shares for a period of time following theTrust’s failure to pay the required distribution (as defined in the applicable prospectuses) unless the Trust first pays such distribution to the holders ofits capital trust securities.
Currently, these limitations do not restrict the payment of dividends on common or preferred shares.
Shareholder Dividend Reinvestment and Share Purchase PlanWe offer a Dividend Reinvestment and Share Purchase Plan (“DRIP”) for our shareholders. Participation in the plan is optional. Under the terms of theDRIP, cash dividends on common shares are reinvested to purchase additional common shares. Shareholders also have the opportunity to makeoptional cash payments to acquire additional common shares.
For dividends paid in fiscal 2018, common shares to supply the DRIP were purchased in the open market.For the dividends paid in the first two quarters of 2017, common shares to supply the DRIP were issued from treasury with a two percent
discount. For the dividends paid in the third quarter of 2017, common shares to supply the DRIP were issued from treasury without a discount. For thedividends paid in the fourth quarter, common shares to supply the DRIP were purchased on the open market.
During the year ended October 31, 2018, we did not issue any common shares from treasury (4,821,184 in 2017) and purchased 1,995,353common shares in the open market (504,873 in 2017) for delivery to shareholders under the DRIP.
Potential Share IssuancesAs at October 31, 2018, we had reserved 39,947,147 common shares (39,947,147 in 2017) for potential issuance in respect of the DRIP. We have alsoreserved 6,095,201 common shares (7,525,296 in 2017) for the potential exercise of stock options, as further described in Note 20.
BMO Financial Group 201st Annual Report 2018 183

Not
esNOTES TO CONSOLIDATED FINANCIAL STATEMENTS
Note 17: Fair Value of Financial Instruments and Trading-Related RevenueWe record trading assets and liabilities, derivatives, certain equity and debt securities and securities sold but not yet purchased at fair value, andother non-trading assets and liabilities at amortized cost less allowances or write-downs for impairment. The fair values presented in this note arebased upon the amounts estimated for individual assets and liabilities and do not include an estimate of the fair value of any of the legal entities orunderlying operations that comprise our business. For certain portfolios of financial instruments where we manage exposures to similar and offsettingrisks, fair value is determined on the basis of our net exposure to that risk.
Fair value represents the amount that would be received to sell an asset or paid to transfer a liability in an orderly transaction between willingmarket participants at the measurement date. The fair value amounts disclosed represent point-in-time estimates that may change in subsequentreporting periods due to changes in market conditions or other factors. Some financial instruments are not typically exchangeable or exchanged andtherefore it is difficult to determine their fair value. Where there is no quoted market price, we determine fair value using management’s bestestimates based on a range of valuation techniques and assumptions; since these involve uncertainties, the fair values may not be realized in anactual sale or immediate settlement of the asset or liability.
Governance Over the Determination of Fair ValueSenior executive oversight of our valuation processes is provided through various valuation and risk committees. In order to ensure that all financialinstruments carried at fair value are reasonably measured for risk management and financial reporting purposes, we have established governancestructures and controls, such as model validation and approval, independent price verification (“IPV”) and profit or loss attribution analysis (“PAA”),consistent with industry practice. These controls are applied independently of the relevant operating groups.
We establish and regularly update valuation methodologies for each financial instrument that is required to be measured at fair value. Theapplication of valuation models for products or portfolios is subject to independent approval to ensure only validated models are used. The impact ofknown limitations of models and data inputs is also monitored on an ongoing basis. IPV is a process that regularly and independently verifies theaccuracy and appropriateness of market prices or model inputs used in the valuation of financial instruments. This process assesses fair values using avariety of different approaches to verify and validate the valuations. PAA is a daily process used by management to identify and explain changes infair value positions across all operating lines of business within BMO Capital Markets. This process works in concert with other processes to ensurethat the fair values being reported are reasonable and appropriate.
SecuritiesFor traded securities, quoted market value is considered to be fair value. Quoted market value is based on bid or ask prices, depending on which isthe most appropriate to measure fair value. Securities for which no active market exists are valued using all reasonably available market information.Our fair value methodologies are described below.
Government SecuritiesThe fair value of government issued or guaranteed debt securities in active markets is determined by reference to recent transaction prices, brokerquotes or third-party vendor prices. The fair value of securities that are not traded in an active market is modelled using implied yields derived fromthe prices of similar actively traded government securities and observable spreads. Market inputs to the model include coupon, maturity and duration.
Mortgage-Backed Securities and Collateralized Mortgage ObligationsThe fair value of mortgage-backed securities and collateralized mortgage obligations is determined using independent prices obtained from third-party vendor prices, broker quotes and relevant market indices, as applicable. If such prices are not available, fair value is determined using cash flowmodels that make maximum use of observable market inputs or benchmark prices for similar instruments. Valuation assumptions for mortgage-backed securities and collateralized mortgage obligations include discount rates, expected prepayments, credit spreads and recoveries.
Corporate Debt SecuritiesThe fair value of corporate debt securities is determined using prices observed in the most recent transactions. When observable price quotations arenot available, fair value is determined based on discounted cash flow models using discounting curves and spreads obtained from independentdealers, brokers and multi-contributor pricing sources.
Corporate Equity SecuritiesThe fair value of equity securities is based on quoted prices in active markets, where available. Where quoted prices in active markets are not readilyavailable, fair value is determined using either quoted market prices for similar securities or using valuation techniques, which include discountedcash flow analysis and earnings multiples.
Privately Issued SecuritiesPrivately issued debt and equity securities are valued using prices observed in recent market transactions, where available. Otherwise, fair value isderived from valuation models using a market or income approach. These models consider various factors, including projected cash flows, earnings,revenue and other third-party evidence, as available. The fair value of limited partnership investments is based upon net asset values published bythird-party fund managers.
Prices from brokers and multi-contributor pricing sources are corroborated as part of our independent review process, which may include usingvaluation techniques or obtaining consensus or composite prices from other pricing services. We validate the estimates of fair value by independentlyobtaining multiple quotes for external market prices and input values. We review the approach taken by third-party vendors to ensure that thevendor employs a valuation model which maximizes the use of observable inputs such as benchmark yields, bid-ask spreads, underlying collateral,weighted-average terms to maturity and prepayment rate assumptions. Fair value estimates from internal valuation techniques are verified, wherepossible, by reference to prices obtained from third-party vendors.
184 BMO Financial Group 201st Annual Report 2018

Notes
LoansIn determining the fair value of our fixed rate performing loans, we discount the remaining contractual cash flows, adjusted for estimatedprepayment, at market interest rates currently offered for loans with similar terms and risks. For floating rate performing loans, changes in interestrates have minimal impact on fair value since interest rates are repriced or reset frequently. On that basis, fair value is assumed to be equal tocarrying value.
Derivative InstrumentsA number of valuation techniques are employed to estimate fair value, including discounted cash flow analysis, the Black-Scholes model, Monte Carlosimulation and other accepted market models. These independently validated models incorporate current market data for interest rates, currencyexchange rates, equity and commodity prices and indices, credit spreads, recovery rates, corresponding market volatility levels, spot prices,correlation levels and other market-based pricing factors. Option implied volatilities, an input into many valuation models, are either obtained directlyfrom market sources or calculated from market prices. Multi-contributor pricing sources are used wherever possible.
In determining the fair value of complex and customized derivatives, we consider all reasonably available information, including dealer andbroker quotations, multi-contributor pricing sources and any relevant observable market inputs. Our model calculates fair value based on inputsspecific to the type of contract, which may include stock prices, correlation for multiple assets, interest rates, foreign exchange rates, yield curves andvolatilities.
We calculate a credit valuation adjustment (“CVA”) to recognize the risk that any given derivative counterparty may not ultimately be able tofulfill its obligations. The CVA is derived from market-observed credit spreads or proxy credit spreads and our assessment of the net counterpartycredit risk exposure, taking into account credit mitigants such as collateral, master netting agreements and novation to central counterparties. We alsocalculate a funding valuation adjustment (“FVA”) to recognize the implicit funding costs associated with over-the-counter derivative positions. TheFVA is determined by reference to market funding spreads.
DepositsIn determining the fair value of our deposits, we incorporate the following assumptions:‰ For fixed rate, fixed maturity deposits, we discount the remaining contractual cash flows for these deposits, adjusted for expected redemptions, at
market interest rates currently offered for deposits with similar terms and risks. Fair value of our senior note liabilities and covered bonds isdetermined by referring to current market prices for similar instruments or using valuation techniques, such as discounted cash flows that usemarket interest rate curves and funding spreads.
‰ For fixed rate deposits with no defined maturities, we consider fair value to equal carrying value, based on carrying value being equivalent to theamount payable on the reporting date.
‰ For floating rate deposits, changes in interest rates have minimal impact on fair value since deposits reprice to market frequently. On that basis, fairvalue is assumed to equal carrying value.
A portion of our structured note liabilities that have coupons or repayment terms linked to the performance of interest rates, foreign currencies,commodities or equity securities have been designated at fair value through profit or loss. The fair value of these structured notes is estimated usinginternally validated valuation models and incorporates observable market prices for identical or comparable securities, as well as other inputs, such asinterest rate yield curves, option volatilities and foreign exchange rates, where appropriate. Where observable prices or inputs are not available,management judgment is required to determine the fair value by assessing other relevant sources of information, such as historical data and proxyinformation from similar transactions.
Securities Sold But Not Yet PurchasedThe fair value of these obligations is based on the fair value of the underlying securities, which can be equity or debt securities. As these obligationsare fully collateralized, the method used to determine fair value would be the same as that used for the relevant underlying equity or debt securities.
Securitization and Structured Entities’ LiabilitiesThe determination of the fair value of securitization and structured entities’ liabilities is based on quoted market prices or quoted market prices forsimilar financial instruments, where available. Where quoted prices are not available, fair value is determined using valuation techniques, such asdiscounted cash flow models that maximize the use of observable inputs.
Subordinated DebtThe fair value of our subordinated debt is determined by referring to current market prices for the same or similar instruments.
Financial Instruments with a Carrying Value Approximating Fair ValueShort-term and Other Financial InstrumentsCarrying value is assumed to be a reasonable estimate of fair value for our cash and cash equivalents.
The carrying value of certain financial assets and liabilities, such as interest bearing deposits with banks, securities borrowed or purchased underresale agreements, customers’ liability under acceptances, other assets, acceptances, securities lent or sold under repurchase agreements and otherliabilities, is a reasonable estimate of fair value due to their short-term nature or because they are frequently repriced to current market rates.
Certain assets, including premises and equipment, goodwill and intangible assets, as well as shareholders’ equity, are not considered financialinstruments and therefore no fair value has been determined for these items.
BMO Financial Group 201st Annual Report 2018 185
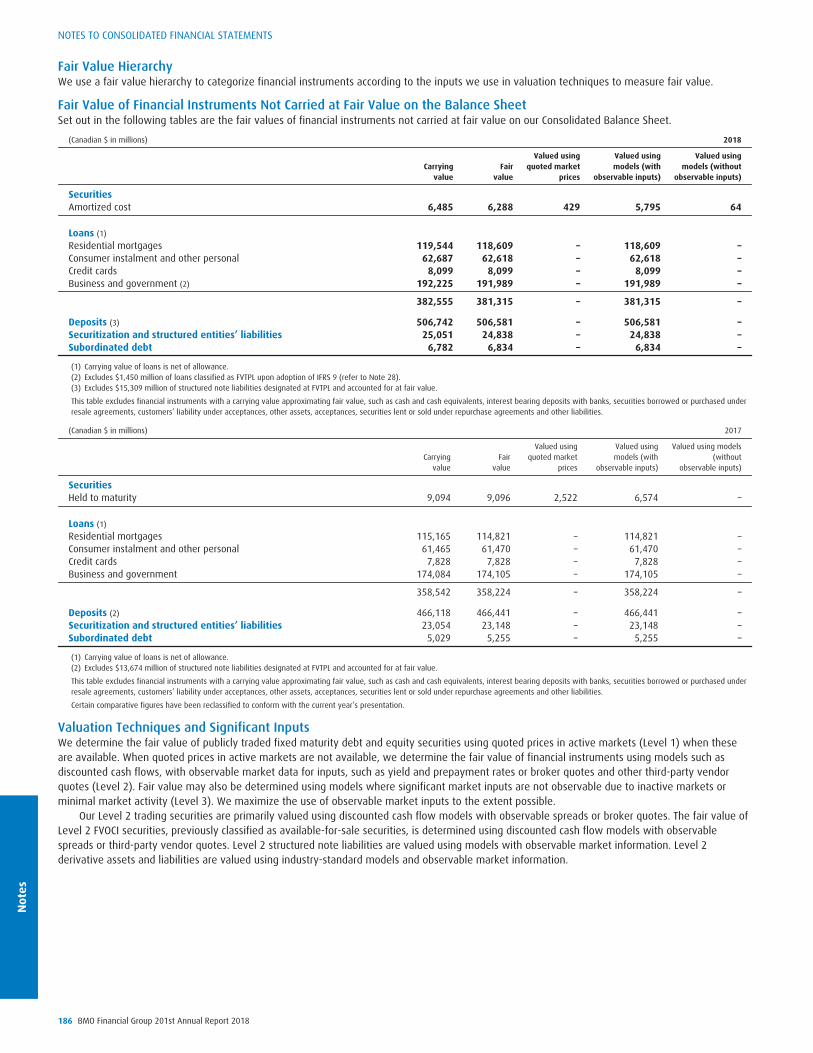
Not
esNOTES TO CONSOLIDATED FINANCIAL STATEMENTS
Fair Value HierarchyWe use a fair value hierarchy to categorize financial instruments according to the inputs we use in valuation techniques to measure fair value.
Fair Value of Financial Instruments Not Carried at Fair Value on the Balance SheetSet out in the following tables are the fair values of financial instruments not carried at fair value on our Consolidated Balance Sheet.
(Canadian $ in millions) 2018
Carryingvalue
Fairvalue
Valued usingquoted market
prices
Valued usingmodels (with
observable inputs)
Valued usingmodels (without
observable inputs)
SecuritiesAmortized cost 6,485 6,288 429 5,795 64
Loans (1)
Residential mortgages 119,544 118,609 – 118,609 –Consumer instalment and other personal 62,687 62,618 – 62,618 –Credit cards 8,099 8,099 – 8,099 –Business and government (2) 192,225 191,989 – 191,989 –
382,555 381,315 – 381,315 –
Deposits (3) 506,742 506,581 – 506,581 –Securitization and structured entities’ liabilities 25,051 24,838 – 24,838 –Subordinated debt 6,782 6,834 – 6,834 –
(1) Carrying value of loans is net of allowance.(2) Excludes $1,450 million of loans classified as FVTPL upon adoption of IFRS 9 (refer to Note 28).(3) Excludes $15,309 million of structured note liabilities designated at FVTPL and accounted for at fair value.
This table excludes financial instruments with a carrying value approximating fair value, such as cash and cash equivalents, interest bearing deposits with banks, securities borrowed or purchased underresale agreements, customers’ liability under acceptances, other assets, acceptances, securities lent or sold under repurchase agreements and other liabilities.
(Canadian $ in millions) 2017
Carryingvalue
Fairvalue
Valued usingquoted market
prices
Valued usingmodels (with
observable inputs)
Valued using models(without
observable inputs)
SecuritiesHeld to maturity 9,094 9,096 2,522 6,574 –
Loans (1)
Residential mortgages 115,165 114,821 – 114,821 –Consumer instalment and other personal 61,465 61,470 – 61,470 –Credit cards 7,828 7,828 – 7,828 –Business and government 174,084 174,105 – 174,105 –
358,542 358,224 – 358,224 –
Deposits (2) 466,118 466,441 – 466,441 –Securitization and structured entities’ liabilities 23,054 23,148 – 23,148 –Subordinated debt 5,029 5,255 – 5,255 –
(1) Carrying value of loans is net of allowance.(2) Excludes $13,674 million of structured note liabilities designated at FVTPL and accounted for at fair value.
This table excludes financial instruments with a carrying value approximating fair value, such as cash and cash equivalents, interest bearing deposits with banks, securities borrowed or purchased underresale agreements, customers’ liability under acceptances, other assets, acceptances, securities lent or sold under repurchase agreements and other liabilities.
Certain comparative figures have been reclassified to conform with the current year’s presentation.
Valuation Techniques and Significant InputsWe determine the fair value of publicly traded fixed maturity debt and equity securities using quoted prices in active markets (Level 1) when theseare available. When quoted prices in active markets are not available, we determine the fair value of financial instruments using models such asdiscounted cash flows, with observable market data for inputs, such as yield and prepayment rates or broker quotes and other third-party vendorquotes (Level 2). Fair value may also be determined using models where significant market inputs are not observable due to inactive markets orminimal market activity (Level 3). We maximize the use of observable market inputs to the extent possible.
Our Level 2 trading securities are primarily valued using discounted cash flow models with observable spreads or broker quotes. The fair value ofLevel 2 FVOCI securities, previously classified as available-for-sale securities, is determined using discounted cash flow models with observablespreads or third-party vendor quotes. Level 2 structured note liabilities are valued using models with observable market information. Level 2derivative assets and liabilities are valued using industry-standard models and observable market information.
186 BMO Financial Group 201st Annual Report 2018

Notes
The extent of our use of actively quoted market prices (Level 1), internal models using observable market information as inputs (Level 2) and modelswithout observable market information as inputs (Level 3) in the valuation of securities, fair value liabilities, derivative assets and derivative liabilities ispresented in the following tables:
Classified under IFRS 9(Canadian $ in millions) 2018
Valued usingquoted market prices
Valued usingmodels (with
observable inputs)
Valued usingmodels (without
observable inputs) Total
Trading SecuritiesIssued or guaranteed by:
Canadian federal government 9,107 1,213 – 10,320Canadian provincial and municipal governments 4,013 4,689 – 8,702U.S. federal government 9,465 52 – 9,517U.S. states, municipalities and agencies 78 1,138 – 1,216Other governments 1,210 201 – 1,411
NHA MBS and U.S. agency MBS and CMO 60 8,869 255 9,184Corporate debt 2,973 6,218 7 9,198Loans – 199 – 199Corporate equity 49,946 4 – 49,950
76,852 22,583 262 99,697
FVTPL SecuritiesIssued or guaranteed by:
Canadian federal government 328 103 – 431Canadian provincial and municipal governments 219 727 – 946U.S. federal government 69 – – 69
NHA MBS and U.S. agency MBS and CMO – 7 – 7Corporate debt 178 6,643 – 6,821Corporate equity 1,378 134 1,825 3,337
2,172 7,614 1,825 11,611
FVOCI SecuritiesIssued or guaranteed by:
Canadian federal government 11,978 827 – 12,805Canadian provincial and municipal governments 3,315 3,547 – 6,862U.S. federal government 16,823 – – 16,823U.S. states, municipalities and agencies 14 3,640 1 3,655Other governments 3,143 1,647 – 4,790
NHA MBS and U.S. agency MBS and CMO – 13,687 – 13,687Corporate debt 1,959 1,797 – 3,756Corporate equity – – 62 62
37,232 25,145 63 62,440
Business and Government Loans – – 1,450 1,450
Fair Value LiabilitiesSecurities sold but not yet purchased 26,336 2,468 – 28,804Structured note liabilities and other note liabilities – 15,309 – 15,309Annuity liabilities – 800 – 800
26,336 18,577 – 44,913
Derivative AssetsInterest rate contracts 18 8,959 – 8,977Foreign exchange contracts 16 12,983 – 12,999Commodity contracts 166 1,894 – 2,060Equity contracts 286 1,872 – 2,158Credit default swaps – 10 – 10
486 25,718 – 26,204
Derivative LiabilitiesInterest rate contracts 14 8,620 – 8,634Foreign exchange contracts 2 11,852 – 11,854Commodity contracts 295 1,161 – 1,456Equity contracts 246 2,183 1 2,430Credit default swaps – 36 1 37
557 23,852 2 24,411
BMO Financial Group 201st Annual Report 2018 187

Not
esNOTES TO CONSOLIDATED FINANCIAL STATEMENTS
Classified under IAS 39(Canadian $ in millions) 2017
Valued usingquoted market prices
Valued usingmodels (with
observable inputs)
Valued usingmodels (without
observable inputs) Total
Trading SecuritiesIssued or guaranteed by:
Canadian federal government 8,712 2,115 – 10,827Canadian provincial and municipal governments 3,177 4,150 – 7,327U.S. federal government 9,417 56 – 9,473U.S. states, municipalities and agencies 189 1,942 – 2,131Other governments 630 193 – 823
NHA MBS, U.S. agency MBS and CMO – 931 – 931Corporate debt 1,485 10,278 – 11,763Loans 3 150 – 153Corporate equity 55,640 1 – 55,641
79,253 19,816 – 99,069
Available-for-Sale SecuritiesIssued or guaranteed by:
Canadian federal government 8,283 897 – 9,180Canadian provincial and municipal governments 920 2,707 – 3,627U.S. federal government 14,269 – – 14,269U.S. states, municipalities and agencies 18 4,077 1 4,096Other governments 2,290 1,268 – 3,558
NHA MBS, U.S. agency MBS and CMO – 13,216 – 13,216Corporate debt 1,551 2,972 2 4,525Corporate equity 37 126 1,441 1,604
27,368 25,263 1,444 54,075
Other Securities – – 333 333
Fair Value LiabilitiesSecurities sold but not yet purchased 22,992 2,171 – 25,163Structured note liabilities and other note liabilities – 13,674 – 13,674Annuity liabilities – 749 – 749
22,992 16,594 – 39,586
Derivative AssetsInterest rate contracts 4 9,223 – 9,227Foreign exchange contracts 17 17,196 – 17,213Commodity contracts 232 846 – 1,078Equity contracts 93 1,333 – 1,426Credit default swaps – 7 – 7
346 28,605 – 28,951
Derivative LiabilitiesInterest rate contracts 7 8,309 – 8,316Foreign exchange contracts 6 14,967 – 14,973Commodity contracts 239 835 – 1,074Equity contracts 166 3,220 – 3,386Credit default swaps – 55 – 55
418 27,386 – 27,804
Quantitative Information about Level 3 Fair Value MeasurementsThe table below presents the fair values of our significant Level 3 financial instruments, the valuation techniques used to determine their fair valuesand the value ranges of significant unobservable inputs used in the valuations. We have not applied any other reasonably possible alternativeassumption to the significant Level 3 categories of private equity investments, as the net asset values are provided by the investment or fundmanagers.
As at October 31, 2018(Canadian $ in millions, except as noted)
Reporting line in fairvalue hierarchy table
Fair valueof assets Valuation techniques
Significantunobservable inputs
Range of input values (1)Change in fair value
reasonably possible alternatives (2)Low High
Private equity (3) Corporate equity 1,825 Net Asset ValueEV/EBITDA
Net Asset ValueMultiple
na6x
na18x
nana
Loans Business andgovernment loans
1,450 Discountedcash flows
Discountmargin
50 bps 175 bps 3
(1) The low and high input values represent the highest and lowest actual level of inputs used to value a group of financial instruments in a particular product category. These input ranges do not reflectthe level of input uncertainty, but are affected by the specific underlying instruments within the product category. The input ranges will therefore vary from period to period based on thecharacteristics of the underlying instruments held at each balance sheet date.
(2) The impact of assuming a 10 basis point increase or decrease in discount margin for business and government loans.(3) Included in private equity is $889 million of Federal Reserve Bank and U.S. Federal Home Loan Bank shares that we hold to meet regulatory requirements.na – not applicable
188 BMO Financial Group 201st Annual Report 2018

Notes
Significant Unobservable Inputs in Level 3 Instrument ValuationsNet Asset ValueNet asset value represents the estimated value of a security based on valuations received from the investment or fund manager. The valuation ofcertain private equity securities is based on the economic benefit we derive from our investment.
EV/EBITDA MultipleThe fair value of private equity and merchant banking investments is derived by calculating an enterprise value (“EV”) using the EV/EBITDA multipleand then proceeding through a waterfall of the company’s capital structure to determine the value of the assets or securities we hold. The EV/EBITDAmultiple is determined using judgment in considering factors such as multiples for comparable listed companies, recent transactions and company-specific factors, as well as liquidity discounts that account for the lack of active trading in these assets and securities.
Discount MarginLoan and corporate debt yield is the interest rate used to discount expected future cash flows in the valuation model. The discount margin is thedifference between an instrument’s yield and a benchmark instrument’s yield. Benchmark instruments have high credit quality ratings and similarmaturities, such as government bonds. The discount margin therefore represents a market return required for uncertainty in future cash flows.Generally a higher or lower discount margin will result in a lower or higher fair value.
Significant TransfersOur policy is to record transfers of assets and liabilities between fair value hierarchy levels at their fair values as at the end of each reporting period,consistent with the date of the determination of fair value. Transfers between the various fair value hierarchy levels reflect changes in the availabilityof quoted market prices or observable market inputs that result from changes in market conditions. The following is a discussion of the significanttransfers between Level 1, Level 2 and Level 3 balances for the year ended October 31, 2018.
During the year ended October 31, 2018, $2,578 million of trading securities, $714 million of FVTPL securities and $2,266 million of FVOCIsecurities ($176 million of trading securities and $107 million of available-for-sale securities, respectively, in 2017) were transferred from Level 1 toLevel 2 due to reduced observability of the inputs used to value these securities. During the year ended October 31, 2018, $4,122 million of tradingsecurities, $742 million of FVTPL securities and $4,044 million of FVOCI securities ($156 million of trading securities and $56 million of available-for-sale securities, respectively, in 2017) were transferred from Level 2 to Level 1 due to increased availability of quoted prices in active markets.
During the year ended October 31, 2017, $33 million of available-for-sale securities were transferred from Level 3 to Level 1 due to theavailability of observable prices used to value these securities. No such transfers happened in 2018.
Changes in Level 3 Fair Value MeasurementsThe tables below present a reconciliation of all changes in Level 3 financial instruments during the years ended October 31, 2018 and 2017, includingrealized and unrealized gains (losses) included in earnings and other comprehensive income.
Change in fair value
For the year ended October 31, 2018(Canadian $ in millions)
BalanceNovember 1,
2017Included in
earnings
Includedin othercompre-hensive
income (1) Purchases SalesMaturities/Settlement
Transfersinto
Level 3
Transfersout of
Level 3
Fair value asat October 31,
2018
Change inunrealized gains
(losses)recorded in income
for instrumentsstill held (2)
Trading SecuritiesNHA MBS and U.S. agency MBS
and CMO – (1) 4 306 (54) – – – 255 (5)Corporate debt – – – 7 – – – – 7 –
Total trading securities – (1) 4 313 (54) – – – 262 (5)
FVTPL SecuritiesCorporate debt (3) 73 – (4) 5 – – – (74) – –Corporate equity (3)(4) 1,701 12 31 307 (161) (2) – (63) 1,825 5
Total FVTPL securities 1,774 12 27 312 (161) (2) – (137) 1,825 5
FVOCI SecuritiesIssued or guaranteed by:
U.S. states, municipalitiesand agencies 1 – – – – – – – 1 na
Corporate debt 2 – – – – (2) – – – naCorporate equity – – – 62 – – – – 62 na
Total FVOCI securities 3 – – 62 – (2) – – 63 na
Business and GovernmentLoans (5) 2,372 (2) 24 604 – (1,548) – – 1,450 –
Derivative LiabilitiesEquity contracts – – – – – – 1 – 1 –Credit default swaps – – – – – – 1 – 1 –
Total derivative liabilities – – – – – – 2 – 2 –
(1) Foreign exchange translation on trading securities held by foreign subsidiaries is included in other comprehensive income, net foreign operations.(2) Changes in unrealized gains (losses) on FVTPL securities still held on October 31, 2018 are included in earnings for the year.(3) Includes $73 million of debt instruments and $260 million of equity instruments reclassified from other securities to FVTPL upon adoption of IFRS 9 (see Note 28).(4) Includes $1,441 million of equity instruments reclassified from available-for-sale to FVTPL upon adoption of IFRS 9 (see Note 28).(5) Business and government loans were reclassified from amortized cost to FVTPL upon adoption of IFRS 9 (see Note 28).
na – not applicable
BMO Financial Group 201st Annual Report 2018 189

Not
esNOTES TO CONSOLIDATED FINANCIAL STATEMENTS
Change in fair value
For the year ended October 31, 2017(Canadian $ in millions)
BalanceOctober 31,
2016Included in
earnings
Includedin othercompre-hensive
income (1) Purchases SalesMaturities/Settlement
Transfersinto
Level 3
Transfersout of
Level 3
Fair value asat October 31,
2017
Change inunrealized gains
(losses)recorded in income
for instrumentsstill held (2)
Trading SecuritiesCorporate debt 91 1 1 – – (93) – – – –
Total trading securities 91 1 1 – – (93) – – – –
Available-for-Sale SecuritiesIssued or guaranteed by:
U.S. states, municipalitiesand agencies 1 – – – – – – – 1 na
Corporate debt 4 – – – (1) (1) – – 2 naCorporate equity 1,456 (40) (15) 190 (117) – – (33) 1,441 na
Total available-for-sale securities 1,461 (40) (15) 190 (118) (1) – (33) 1,444 na
Other Securities 320 (9) (7) 134 (102) (3) – – 333 (8)
(1) Foreign exchange translation on trading securities held by foreign subsidiaries is included in other comprehensive income, net foreign operations.(2) Changes in unrealized gains (losses) on trading securities, derivative assets and derivative liabilities still held on October 31, 2017 are included in earnings for the year.na – not applicable
Trading-Related RevenueTrading assets and liabilities, including derivatives, securities and financial instruments designated at fair value through profit or loss, are measured atfair value, with gains and losses recognized in trading revenues, non-interest revenue, in the Consolidated Statement of Income. Trading-relatedrevenue includes net interest income and non-interest revenue and excludes underwriting fees and commissions on securities transactions, which areshown separately in the Consolidated Statement of Income. Net interest income arises from interest and dividends related to trading assets andliabilities and is reported net of interest expense associated with funding these assets and liabilities in the following table.
(Canadian $ in millions) 2018 2017 2016
Interest rates 437 480 663Foreign exchange 377 369 349Equities 449 239 188Commodities 63 84 66Other 82 47 25
Total trading revenue 1,408 1,219 1,291
Reported as:Net interest income (1) (422) (133) 99Non-interest revenue – trading revenue 1,830 1,352 1,192
Total trading revenue 1,408 1,219 1,291
(1) Amounts in brackets denote net interest expense.
Note 18: Offsetting of Financial Assets and Financial LiabilitiesFinancial assets and financial liabilities are offset and the net amount is reported in our Consolidated Balance Sheet when there is a legallyenforceable right to offset the recognized amounts and there is an intention to settle on a net basis, or realize the asset and settle the liabilitysimultaneously. The following table presents the amounts that have been offset in our Consolidated Balance Sheet, including securities purchasedunder resale agreements, securities sold under repurchase agreements and derivative instruments, generally under a market settlement mechanism(e.g. an exchange or clearing house) where simultaneous net settlement can be achieved to eliminate credit and liquidity risk betweencounterparties. Also presented are amounts not offset in the Consolidated Balance Sheet related to transactions where a master netting agreement orsimilar arrangement is in place with a right to offset the amounts only in the event of default, insolvency or bankruptcy, or where the offset criteriaare otherwise not met.
(Canadian $ in millions) 2018
Amounts not offset in the balance sheet
Grossamounts
Amounts offset inthe balance sheet
Net amountspresented in the
balance sheet
Impact ofmaster netting
agreements
Securitiesreceived/pledgedas collateral (1)(2)
Cashcollateral
Netamount (3)
Financial AssetsSecurities borrowed or purchased under resale
agreements 86,635 1,584 85,051 13,355 70,640 – 1,056Derivative instruments 52,810 26,606 26,204 15,575 505 3,576 6,548
139,445 28,190 111,255 28,930 71,145 3,576 7,604
Financial LiabilitiesDerivative instruments 51,017 26,606 24,411 15,575 555 1,492 6,789Securities lent or sold under repurchase agreements 68,268 1,584 66,684 13,355 53,071 – 258
119,285 28,190 91,095 28,930 53,626 1,492 7,047
190 BMO Financial Group 201st Annual Report 2018

Notes
(Canadian $ in millions) 2017
Amounts not offset in the balance sheet
Grossamounts
Amounts offset inthe balance sheet
Net amountspresented in the
balance sheet
Impact ofmaster netting
agreements
Securitiesreceived/pledged
as collateral (1)(2)Cash
collateralNet
amount (3)
Financial AssetsSecurities borrowed or purchased under resale
agreements 80,948 5,901 75,047 9,382 65,044 – 621Derivative instruments 45,064 16,113 28,951 19,909 933 2,903 5,206
126,012 22,014 103,998 29,291 65,977 2,903 5,827
Financial LiabilitiesDerivative instruments 43,917 16,113 27,804 19,909 1,263 1,642 4,990Securities lent or sold under repurchase agreements 61,020 5,901 55,119 9,382 45,436 – 301
104,937 22,014 82,923 29,291 46,699 1,642 5,291
(1) Financial assets received/pledged as collateral are disclosed at fair value and are limited to the net balance sheet exposure (i.e. any over-collateralization is excluded from the table).(2) Certain amounts of collateral are restricted from being sold or repledged except in the event of default or the occurrence of other predetermined events.(3) Not intended to represent our actual exposure to credit risk.
Note 19: Capital ManagementOur objective is to maintain a strong capital position in a cost-effective structure that: is appropriate given our target regulatory capital ratios andinternal assessment of required economic capital; is consistent with our target credit ratings; underpins our operating groups’ business strategies; andsupports depositor, investor and regulator confidence, while building long-term shareholder value.
Our approach includes establishing limits, targets and performance measures that are used to manage balance sheet positions, risk levels andcapital requirements, as well as issuing and redeeming capital instruments to achieve a cost-effective capital structure.
Regulatory capital requirements and risk-weighted assets for the consolidated entity are determined in accordance with OSFI’s Capital AdequacyRequirements Guideline.
Common Equity Tier 1 (CET1) capital is the most permanent form of capital. It is comprised of common shareholders’ equity less deductions forgoodwill, intangible assets and certain other items. Tier 1 capital is primarily comprised of CET1, preferred shares and innovative hybrid instruments,less certain regulatory deductions.
Tier 2 capital is primarily comprised of subordinated debentures and may include certain loan loss allowances, less certain regulatory deductions.Total capital includes Tier 1 and Tier 2 capital. Details of the components of our capital position are presented in Notes 11, 12, 15 and 16.
CET1 Capital Ratio, Tier 1 Capital Ratio, Total Capital Ratio and Leverage Ratio are the primary regulatory capital measures.‰ The CET1 Capital Ratio is defined as common shareholders’ equity, net of capital adjustments, divided by CET1 capital risk-weighted assets.‰ The Tier 1 Capital Ratio is defined as Tier 1 capital divided by Tier 1 capital risk-weighted assets.‰ The Total Capital Ratio is defined as Total capital divided by Total capital risk-weighted assets.‰ The Leverage Ratio is defined as Tier 1 capital divided by the sum of on-balance sheet items and specified off-balance sheet items, net of specified
adjustments.
As at October 31, 2018, we met OSFI’s required target capital ratios, which include a 2.5% Capital Conservation Buffer, a 1.0% Common Equity Tier 1Surcharge for domestic systemically important banks, a Countercyclical Buffer and a 1.5% Domestic Stability Buffer.
Regulatory Capital Measures and Risk-Weighted Assets(Canadian $ in millions, except as noted) 2018 2017
Common Equity Tier 1 Capital 32,721 30,633Tier 1 Capital 37,220 35,108Total Capital 44,116 40,596Common Equity Tier 1 Capital Risk-Weighted Assets 289,237 269,466Tier 1 Capital Risk-Weighted Assets 289,420 269,466Total Capital Risk-Weighted Assets 289,604 269,466Common Equity Tier 1 Capital Ratio 11.3% 11.4%Tier 1 Capital Ratio 12.9% 13.0%Total Capital Ratio 15.2% 15.1%Leverage Ratio 4.2% 4.4%
All 2018 and 2017 balances above are on an “all-in” basis.
BMO Financial Group 201st Annual Report 2018 191
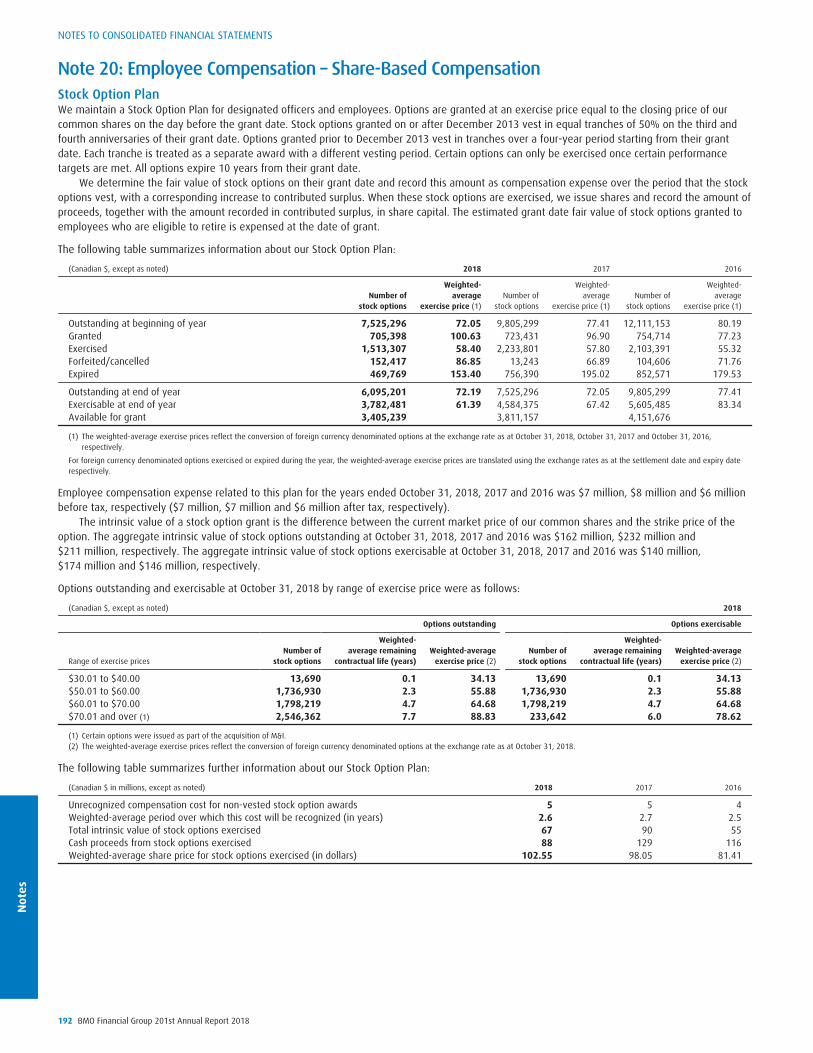
Not
esNOTES TO CONSOLIDATED FINANCIAL STATEMENTS
Note 20: Employee Compensation – Share-Based CompensationStock Option PlanWe maintain a Stock Option Plan for designated officers and employees. Options are granted at an exercise price equal to the closing price of ourcommon shares on the day before the grant date. Stock options granted on or after December 2013 vest in equal tranches of 50% on the third andfourth anniversaries of their grant date. Options granted prior to December 2013 vest in tranches over a four-year period starting from their grantdate. Each tranche is treated as a separate award with a different vesting period. Certain options can only be exercised once certain performancetargets are met. All options expire 10 years from their grant date.
We determine the fair value of stock options on their grant date and record this amount as compensation expense over the period that the stockoptions vest, with a corresponding increase to contributed surplus. When these stock options are exercised, we issue shares and record the amount ofproceeds, together with the amount recorded in contributed surplus, in share capital. The estimated grant date fair value of stock options granted toemployees who are eligible to retire is expensed at the date of grant.
The following table summarizes information about our Stock Option Plan:
(Canadian $, except as noted) 2018 2017 2016
Number ofstock options
Weighted-average
exercise price (1)Number of
stock options
Weighted-average
exercise price (1)Number of
stock options
Weighted-average
exercise price (1)
Outstanding at beginning of year 7,525,296 72.05 9,805,299 77.41 12,111,153 80.19Granted 705,398 100.63 723,431 96.90 754,714 77.23Exercised 1,513,307 58.40 2,233,801 57.80 2,103,391 55.32Forfeited/cancelled 152,417 86.85 13,243 66.89 104,606 71.76Expired 469,769 153.40 756,390 195.02 852,571 179.53
Outstanding at end of year 6,095,201 72.19 7,525,296 72.05 9,805,299 77.41Exercisable at end of year 3,782,481 61.39 4,584,375 67.42 5,605,485 83.34Available for grant 3,405,239 3,811,157 4,151,676
(1) The weighted-average exercise prices reflect the conversion of foreign currency denominated options at the exchange rate as at October 31, 2018, October 31, 2017 and October 31, 2016,respectively.
For foreign currency denominated options exercised or expired during the year, the weighted-average exercise prices are translated using the exchange rates as at the settlement date and expiry daterespectively.
Employee compensation expense related to this plan for the years ended October 31, 2018, 2017 and 2016 was $7 million, $8 million and $6 millionbefore tax, respectively ($7 million, $7 million and $6 million after tax, respectively).
The intrinsic value of a stock option grant is the difference between the current market price of our common shares and the strike price of theoption. The aggregate intrinsic value of stock options outstanding at October 31, 2018, 2017 and 2016 was $162 million, $232 million and$211 million, respectively. The aggregate intrinsic value of stock options exercisable at October 31, 2018, 2017 and 2016 was $140 million,$174 million and $146 million, respectively.
Options outstanding and exercisable at October 31, 2018 by range of exercise price were as follows:
(Canadian $, except as noted) 2018
Options outstanding Options exercisable
Range of exercise pricesNumber of
stock options
Weighted-average remaining
contractual life (years)Weighted-average
exercise price (2)Number of
stock options
Weighted-average remaining
contractual life (years)Weighted-average
exercise price (2)
$30.01 to $40.00 13,690 0.1 34.13 13,690 0.1 34.13$50.01 to $60.00 1,736,930 2.3 55.88 1,736,930 2.3 55.88$60.01 to $70.00 1,798,219 4.7 64.68 1,798,219 4.7 64.68$70.01 and over (1) 2,546,362 7.7 88.83 233,642 6.0 78.62
(1) Certain options were issued as part of the acquisition of M&I.(2) The weighted-average exercise prices reflect the conversion of foreign currency denominated options at the exchange rate as at October 31, 2018.
The following table summarizes further information about our Stock Option Plan:
(Canadian $ in millions, except as noted) 2018 2017 2016
Unrecognized compensation cost for non-vested stock option awards 5 5 4Weighted-average period over which this cost will be recognized (in years) 2.6 2.7 2.5Total intrinsic value of stock options exercised 67 90 55Cash proceeds from stock options exercised 88 129 116Weighted-average share price for stock options exercised (in dollars) 102.55 98.05 81.41
192 BMO Financial Group 201st Annual Report 2018

Notes
The fair value of options granted was estimated using a binomial option pricing model. The weighted-average fair value of options granted during theyears ended October 31, 2018, 2017 and 2016 was $11.30, $11.62 and $7.60, respectively. To determine the fair value of the stock option trancheson the grant date, the following ranges of values were used for each option pricing assumption:
2018 2017 2016
Expected dividend yield 4.1% 4.3% 5.5%Expected share price volatility 17.0% – 17.3% 18.4% – 18.8% 19.8% – 20.0%Risk-free rate of return 2.1% 1.7% – 1.8% 1.3% – 1.4%Expected period until exercise (in years) 6.5 – 7.0 6.5 – 7.0 6.5 – 7.0
Changes to the input assumptions can result in different fair value estimates.Expected dividend yield is based on market expectations of future dividends on our common shares. Expected share price volatility is determined
based on the market consensus implied volatility for traded options on our common shares. The risk-free rate is based on the yields of a Canadianswap curve with maturities similar to the expected period until exercise of the options. The weighted-average exercise price on the grant date for theyears ended October 31, 2018, 2017 and 2016 was $100.63, $96.90 and $77.23, respectively.
Other Share-Based CompensationShare Purchase PlansWe offer various employee share purchase plans. The largest of these plans provides employees with the option of directing a portion of their grosssalary toward the purchase of our common shares. We match 50% of employee contributions up to 6% of their individual gross salary to a maximumof $100,000. Our contributions during the first two years vest after two years of participation in the plan, with subsequent contributions vestingimmediately. The shares held in the employee share purchase plan are purchased on the open market and are considered outstanding for purposes ofcomputing earnings per share. The dividends earned on our common shares held by the plan are used to purchase additional common shares on theopen market.
We account for our contribution as employee compensation expense when it is contributed to the plan.Employee compensation expense related to these plans for the years ended October 31, 2018, 2017 and 2016 was $51 million, $53 million and
$51 million, respectively. There were 17.8 million, 18.3 million and 18.9 million common shares held in these plans for the years ended October 31,2018, 2017 and 2016, respectively.
Compensation TrustsWe sponsor various share ownership arrangements, certain of which are administered through trusts into which our matching contributions are paid.
We are not required to consolidate our compensation trusts. The assets held by the trusts are not included in our consolidated financialstatements.
Total assets held under our share ownership arrangements amounted to $1,752 million as at October 31, 2018 ($1,805 million in 2017).
Mid-Term Incentive PlansWe offer mid-term incentive plans for executives and certain senior employees. Payment amounts are adjusted to reflect reinvested dividends andchanges in the market value of our common shares. Depending on the plan, the recipient receives either a single cash payment at the end of thethree-year period of the plan, or cash payments over the three years of the plan. As the awards are cash settled, they are recorded as liabilities.Amounts payable under such awards are recorded as compensation expense over the vesting period. Amounts related to units granted to employeeswho are eligible to retire are expensed at the time of grant. Subsequent changes in the fair value of the liability are recorded in compensationexpense in the period in which they arise.
Mid-term incentive plan units granted during the years ended October 31, 2018, 2017 and 2016 totalled 5.9 million, 5.9 million and 6.4 million,respectively.
Prior to 2015, we entered into agreements with third parties to assume our liabilities related to a portion of units granted for a fixed up-frontpayment. For units subject to such arrangements, we no longer have any obligation for future cash payments and as a result no liability is recordedrelated to these awards. All cash payments made under such arrangements are deferred in the Consolidated Balance Sheet as other assets and arerecognized on a straight-line basis over the vesting period. Subsequent changes in the market value of our common shares do not affect the amountof compensation expense related to these awards. During the year ended October 31, 2017, all remaining deferred compensation related to thesearrangements was recognized.
Employee compensation expense related to plans where we entered into agreements with third parties for the years ended October 31, 2018,2017 and 2016 was $nil, $(7) million and $26 million before tax, respectively ($nil, $(5) million and $19 million after tax, respectively).
Mid-term incentive plan units for which we did not enter into agreements with third parties for the years ended October 31, 2018, 2017 and2016 totalled 5.9 million, 5.9 million and 6.4 million units, respectively. The grant date fair value of these awards as at October 31, 2018, 2017 and2016 was $581 million, $515 million and $492 million, respectively, for which we recorded employee compensation expense of $595 million,$703 million and $537 million before tax, respectively ($437 million, $516 million and $397 million after tax, respectively). We hedge the impact ofthe change in market value of our common shares by entering into total return swaps (equity contracts). We also enter into foreign currency swaps tomanage the foreign exchange translation from our United States businesses. Gains on total return swaps and foreign currency swaps recognized forthe years ended October 31, 2018, 2017 and 2016 were $51 million, $183 million and $111 million, respectively, resulting in net employeecompensation expense of $544 million, $520 million and $426 million, respectively.
A total of 17.1 million, 17.0 million and 17.0 million mid-term incentive plan units were outstanding as at October 31, 2018, 2017 and 2016,respectively, and the intrinsic value of those awards which had vested was $1,269 million, $1,253 million and $883 million, respectively. Cashpayments made in relation to these liabilities were $598 million, $343 million and $131 million, respectively.
BMO Financial Group 201st Annual Report 2018 193
Not
esNOTES TO CONSOLIDATED FINANCIAL STATEMENTS
Deferred Incentive PlansWe offer deferred incentive plans for members of our Board of Directors, executives and key employees in BMO Capital Markets and WealthManagement. Under these plans, fees, annual incentive payments and/or commissions can be deferred as share units of our common shares. Theseshare units are either fully vested on the grant date or vest at the end of three years. The value of these share units is adjusted to reflect reinvesteddividends and changes in the market value of our common shares.
Deferred incentive plan payments are paid in cash upon the participant’s departure from the bank.Employee compensation expense for these plans is recorded in the year the fees, incentive payments and/or commissions are earned. Changes
in the amount of the incentive plan payments as a result of dividends and share price movements are recorded as increases or decreases inemployee compensation expense in the period of the change.
Deferred incentive plan units granted during the years ended October 31, 2018, 2017 and 2016 totalled 0.3 million, 0.3 million and 0.4 million,respectively, and the grant date fair value of these units was $33 million, $32 million and $28 million, respectively.
Liabilities related to these plans are recorded in other liabilities in our Consolidated Balance Sheet and totalled $485 million and $499 million asat October 31, 2018 and 2017, respectively. Payments made under these plans for the years ended October 31, 2018, 2017 and 2016 were$60 million, $32 million and $53 million, respectively.
Employee compensation expense related to these plans for the years ended October 31, 2018, 2017 and 2016 was $27 million, $91 million and$67 million before tax, respectively ($20 million, $67 million and $50 million after tax, respectively). We have entered into derivative instruments tohedge our exposure related to these plans. Changes in the fair value of these derivatives are recorded as employee compensation expense in theperiod in which they arise. Gains on these derivatives for the years ended October 31, 2018, 2017 and 2016 were $8 million, $78 million and$57 million before tax, respectively. These gains resulted in net employee compensation expense for the years ended October 31, 2018, 2017 and2016 of $19 million, $13 million and $10 million before tax, respectively ($14 million, $10 million and $7 million after tax, respectively).
A total of 4.9 million, 5.0 million and 4.8 million deferred incentive plan units were outstanding as at October 31, 2018, 2017 and 2016,respectively.
Note 21: Employee Compensation – Pension and Other Employee Future BenefitsPension and Other Employee Future Benefit PlansWe sponsor a number of arrangements globally, that provide pension and other employee future benefits to our retired and current employees. Thelargest of these arrangements, by defined benefit obligation, are the primary defined benefit pension plans for employees in Canada and the UnitedStates and the primary other employee future benefit plan for employees in Canada.
Pension arrangements include defined benefit pension plans, as well as supplementary arrangements that provide pension benefits in excess ofstatutory limits. Generally, under these plans we provide retirement benefits based on an employee’s years of service and average annual earningsover a period of time prior to retirement. Our pension and other employee future benefit expenses, recorded in employee compensation expense,mainly comprise the current service cost plus or minus the interest on net defined benefit assets or liabilities. In addition, we provide definedcontribution pension plans to employees in some of our subsidiaries. The costs of these plans, recorded in employee compensation expense, areequal to our contributions to the plans.
The defined benefit pension plans for our employees in the United States were closed to new members on April 1, 2016 and closed to futureaccruals on March 1, 2017. A defined contribution pension plan was made available for employees affected by the closure. As a result of the closureof these plans, we recorded a curtailment gain of $52 million in non-interest expense, employee compensation, in our Consolidated Statement ofIncome in 2016.
During the fourth quarter of 2018, we announced changes to our other employee future benefits plan for Canadian employees that will becomemandatory for new retirees beginning January 1, 2021. Plan changes include an increase in the service requirement for eligibility and flexible benefitswith employer premium caps. We recorded a $277 million benefit from the remeasurement of the benefit liability in non-interest expense, employeecompensation, in our Consolidated Statement of Income.
We also provide other employee future benefits, including health and dental care benefits and life insurance, for eligible current and retiredemployees.
Short-term employee benefits, such as salaries, paid absences, bonuses and other benefits, are accounted for on an accrual basis over the periodin which the employees provide the related services.
Investment PolicyThe defined benefit pension plans are administered under a defined governance structure, with the oversight resting with the Board of Directors.
The plans are managed under a framework that considers both assets and liabilities in the development of an investment policy and inmanaging risk. Over the past several years, we have implemented a liability-driven investment strategy for the primary Canadian plan to enhancerisk-adjusted returns while reducing the plan’s surplus volatility. This strategy has reduced the impact of the plan on our regulatory capital.
The plans invest in asset classes that include equities, fixed income and alternative strategies, under established investment guidelines. Planassets are diversified across asset classes and by geographic exposure. They are managed by asset management firms that are responsible for theselection of investment securities. Derivative instruments are permitted under policy guidelines and are generally used to hedge foreign currencyexposures, manage interest rate exposures or replicate the return of an asset.
194 BMO Financial Group 201st Annual Report 2018

Notes
Asset AllocationsThe asset allocation ranges and weighted-average actual asset allocations of our primary pension plans, based on the fair market values atOctober 31, are as follows:
Pension benefit plans
Target range2018
Actual2018
Actual2017
Equities 25% – 50% 37% 40%Fixed income investments 25% – 55% 46% 46%Other 10% – 40% 17% 14%
Our pension and other employee future benefit plan assets are measured at fair value on a recurring basis.
Risk ManagementThe defined benefit pension plans are exposed to various risks, including market risk (interest rate, equity and foreign currency risks), credit risk,operational risk, surplus risk and longevity risk. We follow a number of approaches to monitor and actively manage these risks, including:‰ monitoring surplus-at-risk, which measures a plan’s risk in an asset-liability framework;‰ stress testing and scenario analyses to evaluate the volatility of the plans’ financial positions and any potential impact on the bank;‰ hedging of currency exposures and interest rate risk within policy limits;‰ controls related to asset mix allocations, geographic allocations, portfolio duration, credit quality of debt securities, sector guidelines, issuer/
counterparty limits and others; and‰ ongoing monitoring of exposures, performance and risk levels.
Pension and Other Employee Future Benefit LiabilitiesOur actuaries perform valuations of our defined benefit obligations for pension and other employee future benefits as at October 31 of each yearusing the projected unit credit method based on management’s assumptions about discount rates, rates of compensation increase, retirement age,mortality and health care cost trend rates.
The discount rates for the primary Canadian and U.S. pension and other employee future benefit plans were selected based on the yields of high-quality AA rated corporate bonds with terms matching the plans’ cash flows.
The fair value of plan assets is deducted from the defined benefit obligation to determine the net defined benefit asset or liability. For definedbenefit pension plans that are in a net defined benefit asset position, the recognized asset is limited to the present value of economic benefitsavailable in the form of future refunds from the plan or reductions in future contributions to the plan (the “asset ceiling”). Changes in the asset ceilingare recognized in other comprehensive income. Components of the change in our net defined benefit assets or liabilities and our pension and otheremployee future benefit expense are as follows:
Current service cost represents benefits earned in the current year. The cost is determined with reference to the current workforce and the amountof benefits to which employees will be entitled upon retirement, based on the provisions of our benefit plans.
Interest on net defined benefit asset or liability represents the increase in the net defined benefit asset or liability that results from the passage oftime and is determined by applying the discount rate to the net defined benefit asset or liability.
Actuarial gains and losses may arise in two ways. First, each year our actuaries recalculate the defined benefit obligations and compare them tothose estimated as at the previous year end. Any differences that result from changes in demographic and economic assumptions or from planmember experience being different from management’s expectations at the previous year end are considered actuarial gains or losses. Second,actuarial gains and losses arise when there are differences between the discount rate and actual returns on plan assets. Actuarial gains and losses arerecognized immediately in other comprehensive income as they occur and are not subsequently reclassified to income in future periods.
Plan amendments are changes in our defined benefit obligations that result from changes to provisions of the plans. The effects of planamendments are recognized immediately in income when a plan is amended.
Settlements occur when defined benefit obligations for plan participants are settled, usually through lump sum cash payments, and as a result we nolonger have any obligation to provide such participants with benefit payments in the future.
Funding of Pension and Other Employee Future Benefit PlansWe fund our defined benefit pension plans in Canada and the United States in accordance with statutory requirements, and the assets in these plansare used to pay benefits to retirees and other employees. Some groups of employees are also eligible to make voluntary contributions in order toreceive enhanced benefits. Our supplementary pension plan in Canada is funded, while in the United States the supplementary pension plan isunfunded.
Our other employee future benefit plans in Canada and the United States are either partially funded or unfunded. Benefit payments related tothese plans are paid either through the respective plan or directly by us.
We measure the fair value of plan assets for our plans in Canada and the United States as at October 31. In addition to actuarial valuations foraccounting purposes, we are required to prepare valuations for determining our minimum funding requirements for our pension arrangements inaccordance with the relevant statutory framework (our “funding valuation”). An annual funding valuation is performed for our plans in Canada andthe United States. The most recent funding valuation for our primary Canadian pension plan was performed as at October 31, 2018 and the mostrecent funding valuation for our primary U.S. pension plan was performed as at January 1, 2018. Benefit payments for fiscal 2019 are estimated to be$486 million.
BMO Financial Group 201st Annual Report 2018 195

Not
esNOTES TO CONSOLIDATED FINANCIAL STATEMENTS
A summary of plan information for the past three years is as follows:(Canadian $ in millions) Pension benefit plans Other employee future benefit plans
2018 2017 2016 2018 2017 2016
Defined benefit obligation 8,311 8,846 8,992 1,113 1,460 1,493Fair value of plan assets 8,719 8,990 8,655 153 157 150
Surplus (deficit) and net defined benefit asset (liability) 408 144 (337) (960) (1,303) (1,343)
Surplus (deficit) is comprised of:Funded or partially funded plans 573 339 (127) 37 28 7Unfunded plans (165) (195) (210) (997) (1,331) (1,350)
Surplus (deficit) and net defined benefit asset (liability) 408 144 (337) (960) (1,303) (1,343)
Pension and Other Employee Future Benefit ExpensesPension and other employee future benefit expenses are determined as follows:
(Canadian $ in millions) Pension benefit plans Other employee future benefit plans
2018 2017 2016 2018 2017 2016
Annual benefits expenseCurrent service cost 210 254 224 26 32 25Net interest (income) expense on net defined benefit (asset) liability (10) 7 (10) 45 47 52Past service cost (income) 7 – – (277) – –Administrative expenses 5 5 5 – – –Remeasurement of other long-term benefits – – – (10) (6) 6
Benefits expense 212 266 219 (216) 73 83Canada and Quebec pension plan expense 76 75 73 – – –Defined contribution expense 153 123 96 – – –
Total annual pension and other employee future benefit expenses recognizedin the Consolidated Statement of Income 441 464 388 (216) 73 83
Weighted-average Assumptions Used to Determine Benefit ExpensesPension benefit plans Other employee future benefit plans
2018 2017 2016 2018 2017 2016
Discount rate at beginning of year (3)(4) 3.5% 3.4% 4.2% 3.6% 3.6% 4.4%Rate of compensation increase 2.4% 2.8% 2.7% 2.0% 2.4% 2.4%Assumed overall health care cost trend rate na na na 4.9% (1) 5.2% (2) 5.3% (2)
(1) Trending to 4.1% in 2040 and remaining at that level thereafter.(2) Trending to 4.5% in 2031 and remaining at that level thereafter.(3) The pension benefit current service cost was calculated using a separate discount rate of 3.70% and 3.68% for 2018 and 2017, respectively.(4) The other employee future benefit plans current service cost was calculated using a separate discount rate of 3.76% and 3.78% for 2018 and 2017, respectively.na – not applicable
Assumptions regarding future mortality are based on published statistics and mortality tables calibrated to plan experience, when applicable. Thecurrent life expectancies underlying the amounts of the defined benefit obligations for our primary plans are as follows:
(Years) Canada United States
2018 2017 2018 2017
Life expectancy for those currently age 65Males 23.7 23.6 21.9 22.0Females 24.0 24.0 23.4 23.4Life expectancy at age 65 for those currently age 45Males 24.6 24.6 23.1 23.2Females 25.0 24.9 24.5 24.6
196 BMO Financial Group 201st Annual Report 2018

Notes
Changes in the estimated financial positions of our defined benefit pension plans and other employee future benefit plans are as follows:(Canadian $ in millions, except as noted) Pension benefit plans Other employee future benefit plans
2018 2017 2018 2017
Defined benefit obligationDefined benefit obligation at beginning of year 8,846 8,992 1,460 1,493Current service cost 210 254 26 32Past service cost (income) 7 – (277) –Interest cost 299 300 51 52Benefits paid (492) (448) (43) (45)Employee contributions 15 15 5 5Actuarial (gains) losses due to:
Changes in demographic assumptions (50) (127) (31) (107)Changes in financial assumptions (562) (150) (77) (2)Plan member experience 16 45 (4) 39
Foreign exchange and other 22 (35) 3 (7)
Defined benefit obligation at end of year 8,311 8,846 1,113 1,460
Wholly or partially funded defined benefit obligation 8,146 8,651 116 129Unfunded defined benefit obligation 165 195 997 1,331
Total defined benefit obligation 8,311 8,846 1,113 1,460
Weighted-average assumptions used to determine the defined benefit obligationDiscount rate at end of year 4.0% 3.5% 4.1% 3.6%Rate of compensation increase 2.4% 2.4% 2.0% 2.0%Assumed overall health care cost trend rate na na 4.9% (1) 5.2% (2)
Fair value of plan assetsFair value of plan assets at beginning of year 8,990 8,655 157 150Interest income 309 293 6 5Return on plan assets (excluding interest income) (323) 277 (10) 8Employer contributions 213 219 35 40Employee contributions 15 15 5 5Benefits paid (492) (448) (43) (45)Administrative expenses (5) (5) – –Foreign exchange and other 12 (16) 3 (6)
Fair value of plan assets at end of year 8,719 8,990 153 157
Surplus (deficit) and net defined benefit asset (liability) at end of year 408 144 (960) (1,303)
Recorded in:Other assets 664 508 – –Other liabilities (256) (364) (960) (1,303)
Surplus (deficit) and net defined benefit asset (liability) at end of year 408 144 (960) (1,303)
Actuarial gains (losses) recognized in other comprehensive incomeNet actuarial gains (losses) on plan assets (323) 277 (10) 8Actuarial gains (losses) on defined benefit obligation due to:
Changes in demographic assumptions 50 127 30 104Changes in financial assumptions 562 150 72 –Plan member experience (16) (45) 1 (41)
Foreign exchange and other 6 (3) – –
Actuarial gains recognized in other comprehensive income for the year 279 506 93 71
(1) Trending to 4.1% in 2040 and remaining at that level thereafter.(2) Trending to 4.5% in 2031 and remaining at that level thereafter.
na – not applicable
Our pension and other employee future benefit plan assets are measured at fair value on a recurring basis. The fair values of plan assets held by ourprimary plans as at October 31 are as follows:
(Canadian $ in millions) 2018 2017
Quoted Unquoted Total Quoted Unquoted Total
Cash and money market funds 114 – 114 150 5 155Securities issued or guaranteed by:
Canadian federal government 108 41 149 143 47 190Canadian provincial and municipal governments 219 309 528 471 320 791U.S. federal government 297 – 297 307 20 327U.S. states, municipalities and agencies – 12 12 – 16 16
Pooled funds 1,591 2,715 4,306 1,743 2,012 3,755Derivative instruments 1 (14) (13) 1 (29) (28)Corporate debt 6 1,055 1,061 9 1,251 1,260Corporate equity 1,105 – 1,105 1,291 – 1,291
3,441 4,118 7,559 4,115 3,642 7,757
Certain comparative figures have been reclassified to conform with the current year’s presentation.
No plan assets are directly invested in the bank’s or related parties’ securities as at October 31, 2018 and 2017. As at October 31, 2018, our primaryCanadian plan indirectly held, through pooled funds, approximately $15 million ($3 million in 2017) of our common shares. The plans do not hold anyproperty we occupy or other assets we use.
The plans paid $4 million in the year ended October 31, 2018 ($4 million in 2017) to the bank and certain of our subsidiaries for investmentmanagement, record-keeping, custodial and administrative services rendered.
BMO Financial Group 201st Annual Report 2018 197
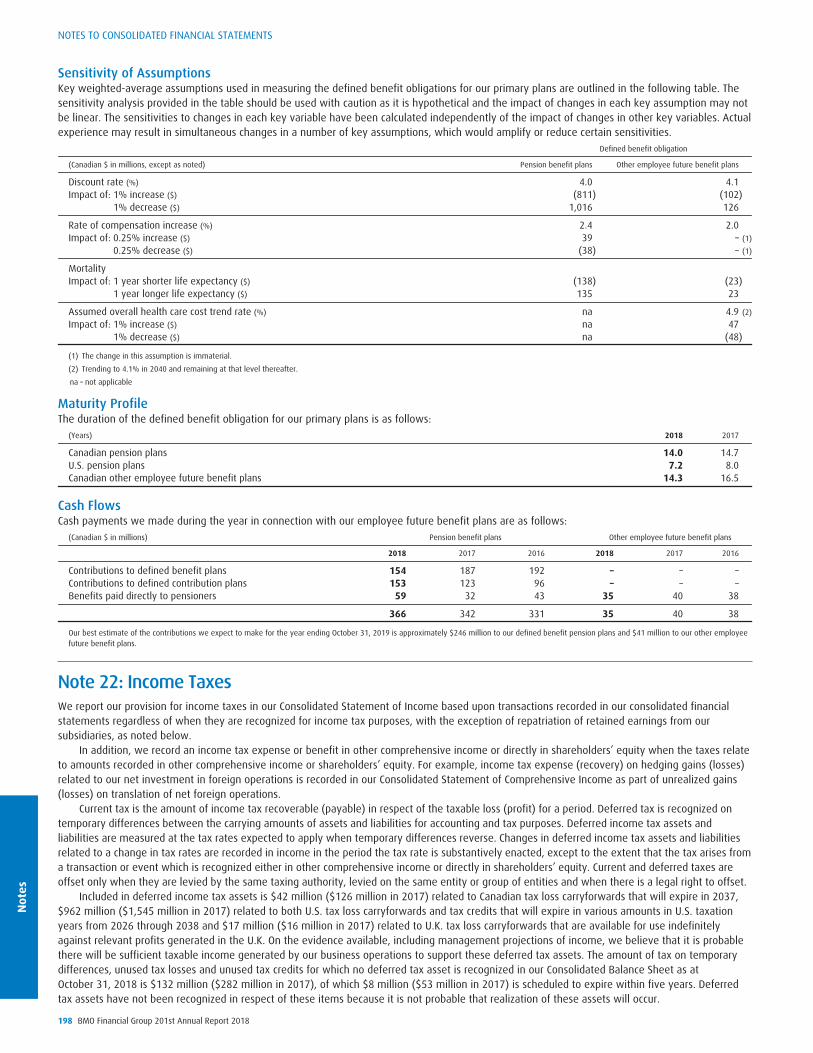
Not
esNOTES TO CONSOLIDATED FINANCIAL STATEMENTS
Sensitivity of AssumptionsKey weighted-average assumptions used in measuring the defined benefit obligations for our primary plans are outlined in the following table. Thesensitivity analysis provided in the table should be used with caution as it is hypothetical and the impact of changes in each key assumption may notbe linear. The sensitivities to changes in each key variable have been calculated independently of the impact of changes in other key variables. Actualexperience may result in simultaneous changes in a number of key assumptions, which would amplify or reduce certain sensitivities.
Defined benefit obligation
(Canadian $ in millions, except as noted) Pension benefit plans Other employee future benefit plans
Discount rate (%) 4.0 4.1Impact of: 1% increase ($) (811) (102)
1% decrease ($) 1,016 126
Rate of compensation increase (%) 2.4 2.0Impact of: 0.25% increase ($) 39 – (1)
0.25% decrease ($) (38) – (1)
MortalityImpact of: 1 year shorter life expectancy ($) (138) (23)
1 year longer life expectancy ($) 135 23
Assumed overall health care cost trend rate (%) na 4.9 (2)
Impact of: 1% increase ($) na 471% decrease ($) na (48)
(1) The change in this assumption is immaterial.
(2) Trending to 4.1% in 2040 and remaining at that level thereafter.
na – not applicable
Maturity ProfileThe duration of the defined benefit obligation for our primary plans is as follows:
(Years) 2018 2017
Canadian pension plans 14.0 14.7U.S. pension plans 7.2 8.0Canadian other employee future benefit plans 14.3 16.5
Cash FlowsCash payments we made during the year in connection with our employee future benefit plans are as follows:
(Canadian $ in millions) Pension benefit plans Other employee future benefit plans
2018 2017 2016 2018 2017 2016
Contributions to defined benefit plans 154 187 192 – – –Contributions to defined contribution plans 153 123 96 – – –Benefits paid directly to pensioners 59 32 43 35 40 38
366 342 331 35 40 38
Our best estimate of the contributions we expect to make for the year ending October 31, 2019 is approximately $246 million to our defined benefit pension plans and $41 million to our other employeefuture benefit plans.
Note 22: Income TaxesWe report our provision for income taxes in our Consolidated Statement of Income based upon transactions recorded in our consolidated financialstatements regardless of when they are recognized for income tax purposes, with the exception of repatriation of retained earnings from oursubsidiaries, as noted below.
In addition, we record an income tax expense or benefit in other comprehensive income or directly in shareholders’ equity when the taxes relateto amounts recorded in other comprehensive income or shareholders’ equity. For example, income tax expense (recovery) on hedging gains (losses)related to our net investment in foreign operations is recorded in our Consolidated Statement of Comprehensive Income as part of unrealized gains(losses) on translation of net foreign operations.
Current tax is the amount of income tax recoverable (payable) in respect of the taxable loss (profit) for a period. Deferred tax is recognized ontemporary differences between the carrying amounts of assets and liabilities for accounting and tax purposes. Deferred income tax assets andliabilities are measured at the tax rates expected to apply when temporary differences reverse. Changes in deferred income tax assets and liabilitiesrelated to a change in tax rates are recorded in income in the period the tax rate is substantively enacted, except to the extent that the tax arises froma transaction or event which is recognized either in other comprehensive income or directly in shareholders’ equity. Current and deferred taxes areoffset only when they are levied by the same taxing authority, levied on the same entity or group of entities and when there is a legal right to offset.
Included in deferred income tax assets is $42 million ($126 million in 2017) related to Canadian tax loss carryforwards that will expire in 2037,$962 million ($1,545 million in 2017) related to both U.S. tax loss carryforwards and tax credits that will expire in various amounts in U.S. taxationyears from 2026 through 2038 and $17 million ($16 million in 2017) related to U.K. tax loss carryforwards that are available for use indefinitelyagainst relevant profits generated in the U.K. On the evidence available, including management projections of income, we believe that it is probablethere will be sufficient taxable income generated by our business operations to support these deferred tax assets. The amount of tax on temporarydifferences, unused tax losses and unused tax credits for which no deferred tax asset is recognized in our Consolidated Balance Sheet as atOctober 31, 2018 is $132 million ($282 million in 2017), of which $8 million ($53 million in 2017) is scheduled to expire within five years. Deferredtax assets have not been recognized in respect of these items because it is not probable that realization of these assets will occur.
198 BMO Financial Group 201st Annual Report 2018
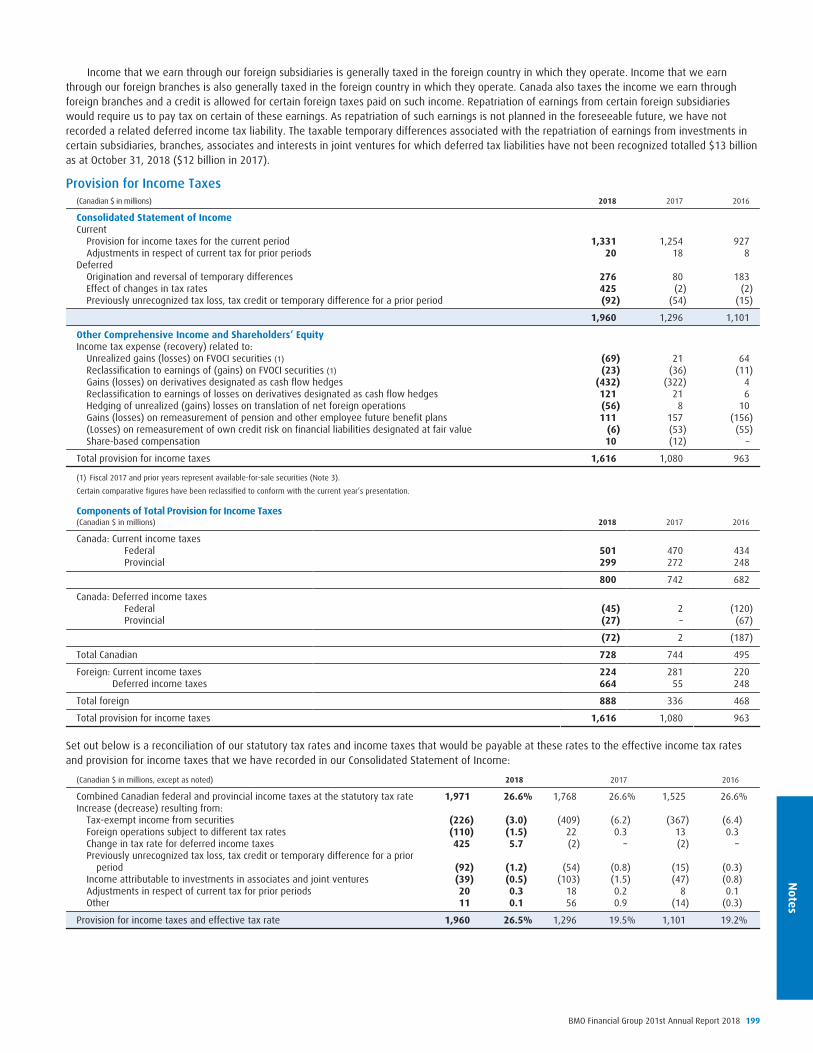
Notes
Income that we earn through our foreign subsidiaries is generally taxed in the foreign country in which they operate. Income that we earnthrough our foreign branches is also generally taxed in the foreign country in which they operate. Canada also taxes the income we earn throughforeign branches and a credit is allowed for certain foreign taxes paid on such income. Repatriation of earnings from certain foreign subsidiarieswould require us to pay tax on certain of these earnings. As repatriation of such earnings is not planned in the foreseeable future, we have notrecorded a related deferred income tax liability. The taxable temporary differences associated with the repatriation of earnings from investments incertain subsidiaries, branches, associates and interests in joint ventures for which deferred tax liabilities have not been recognized totalled $13 billionas at October 31, 2018 ($12 billion in 2017).
Provision for Income Taxes(Canadian $ in millions) 2018 2017 2016
Consolidated Statement of IncomeCurrent
Provision for income taxes for the current period 1,331 1,254 927Adjustments in respect of current tax for prior periods 20 18 8
DeferredOrigination and reversal of temporary differences 276 80 183Effect of changes in tax rates 425 (2) (2)Previously unrecognized tax loss, tax credit or temporary difference for a prior period (92) (54) (15)
1,960 1,296 1,101
Other Comprehensive Income and Shareholders’ EquityIncome tax expense (recovery) related to:
Unrealized gains (losses) on FVOCI securities (1) (69) 21 64Reclassification to earnings of (gains) on FVOCI securities (1) (23) (36) (11)Gains (losses) on derivatives designated as cash flow hedges (432) (322) 4Reclassification to earnings of losses on derivatives designated as cash flow hedges 121 21 6Hedging of unrealized (gains) losses on translation of net foreign operations (56) 8 10Gains (losses) on remeasurement of pension and other employee future benefit plans 111 157 (156)(Losses) on remeasurement of own credit risk on financial liabilities designated at fair value (6) (53) (55)Share-based compensation 10 (12) –
Total provision for income taxes 1,616 1,080 963
(1) Fiscal 2017 and prior years represent available-for-sale securities (Note 3).
Certain comparative figures have been reclassified to conform with the current year’s presentation.
Components of Total Provision for Income Taxes(Canadian $ in millions) 2018 2017 2016
Canada: Current income taxesFederal 501 470 434Provincial 299 272 248
800 742 682
Canada: Deferred income taxesFederal (45) 2 (120)Provincial (27) – (67)
(72) 2 (187)
Total Canadian 728 744 495
Foreign: Current income taxes 224 281 220Deferred income taxes 664 55 248
Total foreign 888 336 468
Total provision for income taxes 1,616 1,080 963
Set out below is a reconciliation of our statutory tax rates and income taxes that would be payable at these rates to the effective income tax ratesand provision for income taxes that we have recorded in our Consolidated Statement of Income:
(Canadian $ in millions, except as noted) 2018 2017 2016
Combined Canadian federal and provincial income taxes at the statutory tax rate 1,971 26.6% 1,768 26.6% 1,525 26.6%Increase (decrease) resulting from:
Tax-exempt income from securities (226) (3.0) (409) (6.2) (367) (6.4)Foreign operations subject to different tax rates (110) (1.5) 22 0.3 13 0.3Change in tax rate for deferred income taxes 425 5.7 (2) – (2) –Previously unrecognized tax loss, tax credit or temporary difference for a prior
period (92) (1.2) (54) (0.8) (15) (0.3)Income attributable to investments in associates and joint ventures (39) (0.5) (103) (1.5) (47) (0.8)Adjustments in respect of current tax for prior periods 20 0.3 18 0.2 8 0.1Other 11 0.1 56 0.9 (14) (0.3)
Provision for income taxes and effective tax rate 1,960 26.5% 1,296 19.5% 1,101 19.2%
BMO Financial Group 201st Annual Report 2018 199

Not
esNOTES TO CONSOLIDATED FINANCIAL STATEMENTS
Components of Deferred Income Tax Balances(Canadian $ in millions)
Deferred Income Tax Asset (Liability) (1)Net asset,
November 1, 2017 (2)Benefit (expense)
to income statementBenefit (expense)
to equityTranslation
and otherNet asset,
October 31, 2018
Allowance for credit losses 684 (150) – (50) 484Employee future benefits 416 (111) (23) – 282Deferred compensation benefits 545 (50) – (1) 494Other comprehensive income 50 – 138 7 195Tax loss carryforwards 1,233 (628) – 1 606Tax credits 454 (39) – – 415Premises and equipment (664) 148 – 1 (515)Pension benefits (52) 19 (88) – (121)Goodwill and intangible assets (261) 60 – – (201)Securities 21 17 – – 38Other 180 125 (10) (9) 286
Total 2,606 (609) 17 (51) 1,963
(Canadian $ in millions)
Deferred Income Tax Asset (Liability) (1)Net asset,
October 31, 2016Benefit (expense)
to income statementBenefit (expense)
to equityTranslationand other
Net asset,October 31, 2017
Allowance for credit losses 883 (118) – (55) 710Employee future benefits 424 12 (14) (6) 416Deferred compensation benefits 462 102 – (19) 545Other comprehensive income (82) – 112 (3) 27Tax loss carryforwards 1,343 (18) – (92) 1,233Tax credits 407 64 – (17) 454Premises and equipment (613) (83) – 32 (664)Pension benefits 89 5 (143) (3) (52)Goodwill and intangible assets (253) (23) – 15 (261)Securities 12 11 – (2) 21Other 187 24 12 (20) 203
Total 2,859 (24) (33) (170) 2,632
(1) Deferred tax assets of $2,037 million and $2,865 million and deferred tax liabilities of $74 million and $233 million as at October 31, 2018 and 2017, respectively, are presented on the balance sheetnet by legal jurisdiction.
(2) Includes IFRS 9 adoption (refer to Note 28)
Certain comparative figures have been reclassified to conform with the current year’s presentation.
In fiscal 2018, we were reassessed by the Canada Revenue Agency (“CRA”) for additional income taxes and interest in an amount of approximately$169 million in respect of certain 2013 Canadian corporate dividends. In prior fiscal years, we were reassessed for additional income taxes andinterest of approximately $116 million and $76 million, respectively, for certain 2012 and 2011 Canadian corporate dividends. In its reassessments,the CRA denied dividend deductions on the basis that the dividends were received as part of a “dividend rental arrangement.” The tax rules raised bythe CRA in the reassessments were prospectively addressed in the 2015 and 2018 Canadian federal budgets. In the future, it is possible that we maybe reassessed for significant income tax for similar activities in 2014 and subsequent years. We remain of the view that our tax filing positions wereappropriate and intend to challenge any reassessment.
On December 22, 2017, the U.S. government enacted new tax legislation that became effective on January 1, 2018. Under the new legislation,our U.S. net deferred tax asset was revalued by $483 million because of the lower income tax rate. The $483 million revaluation is comprised of a$425 million income tax expense recorded in our Consolidated Statement of Income, and a $58 million income tax charge recorded in othercomprehensive income and shareholders’ equity for the year ended October 31, 2018.
Note 23: Earnings Per ShareBasic earnings per share is calculated by dividing net income attributable to our shareholders, after deducting preferred share dividends, by the dailyaverage number of fully paid common shares outstanding throughout the year.
Diluted earnings per share is calculated in the same manner, with further adjustments made to reflect the dilutive impact of instrumentsconvertible into our common shares.
200 BMO Financial Group 201st Annual Report 2018

Notes
The following table presents our basic and diluted earnings per share:
Basic Earnings per Share(Canadian $ in millions, except as noted) 2018 2017 2016
Net income attributable to bank shareholders 5,450 5,348 4,622Dividends on preferred shares (184) (184) (150)
Net income available to common shareholders 5,266 5,164 4,472
Weighted-average number of common shares outstanding (in thousands) 642,930 649,650 644,049
Basic earnings per share (Canadian $) 8.19 7.95 6.94
Diluted Earnings per ShareNet income available to common shareholders adjusted for impact of dilutive instruments 5,266 5,164 4,472Weighted-average number of common shares outstanding (in thousands) 642,930 649,650 644,049Effect of dilutive instruments
Stock options potentially exercisable (1) 5,876 6,859 8,706Common shares potentially repurchased (3,893) (4,548) (6,629)
Weighted-average number of diluted common shares outstanding (in thousands) 644,913 651,961 646,126
Diluted earnings per share (Canadian $) 8.17 7.92 6.92
(1) In computing diluted earnings per share, we excluded average stock options outstanding of 1,101,938, 1,330,564 and 1,353,464 with weighted-average exercise prices of $127.45, $182.70 and$238.45 for the years ended October 31, 2018, 2017 and 2016, respectively, as the average share price for the period did not exceed the exercise price.
Note 24: Commitments, Guarantees, Pledged Assets, Provisions and Contingent LiabilitiesIn the normal course of business, we enter into a variety of contracts under which we may be required to make payments to reimburse acounterparty for a loss if a third party does not perform according to the terms of a contract or does not make payments when due under the termsof a debt instrument, and contracts under which we provide indirect guarantees of the indebtedness of another party, all of which are consideredguarantees.
Guarantees that qualify as derivatives are accounted for in accordance with the policy for derivative instruments (see Note 8). For guaranteesthat do not qualify as derivatives, the liability is initially recorded at fair value, which is generally the fee received. Subsequently, guarantees arerecorded at the higher of the initial fair value, less amortization to recognize any fee income earned over the period, and our best estimate of theamount required to settle the obligation. Any change in the liability is reported in our Consolidated Statement of Income.
We enter into a variety of commitments, including off-balance sheet credit instruments, such as backstop liquidity facilities, securities lending,letters of credit, credit default swaps and commitments to extend credit, as a method of meeting the financial needs of our customers. Thesecommitments include contracts where we may be required to make payments to a counterparty, based on changes in the value of an asset, liabilityor equity security that the counterparty holds, due to changes in an underlying interest rate, foreign exchange rate or other variable. The contractualamount of our commitments represents our maximum undiscounted potential exposure, before possible recoveries under recourse and collateralprovisions. Collateral requirements for these instruments are consistent with collateral requirements for loans.
A large majority of these commitments expire without being drawn upon. As a result, the total contractual amounts may not be representative ofthe funding likely to be required for these commitments.
We strive to limit credit risk by dealing only with counterparties that we believe are creditworthy, and we manage our credit risk for theseinstruments using the same credit risk process that is applied to loans and other credit assets.
The maximum amount payable related to our various commitments is as follows:(Canadian $ in millions) 2018 2017
Financial GuaranteesStandby letters of credit 18,458 18,126Credit default swaps (1) 443 448Other Credit InstrumentsBackstop liquidity facilities 5,627 5,044Securities lending 4,939 5,336Documentary and commercial letters of credit 1,263 1,030Commitments to extend credit (2) 137,995 122,881Other commitments 8,935 4,329
Total 177,660 157,194
(1) The fair value of the related derivatives included in our Consolidated Balance Sheet was $8 million as at October 31, 2018 ($6 million in 2017).(2) Commitments to extend credit exclude personal lines of credit and credit cards that are unconditionally cancellable at our discretion.
Financial GuaranteesStandby letters of credit represent our obligation to make payments to third parties on behalf of customers if they are unable to make the requiredpayments or meet other contractual requirements. The majority have a term of one year or less. Collateral requirements for standby letters of creditand guarantees are consistent with our collateral requirements for loans. Standby letters of credit and guarantees include our guarantee of asubsidiary’s debt directly provided to a third party.
Written credit default swaps require us to compensate a counterparty following the occurrence of a credit event in relation to a specifiedreference obligation, such as a bond or a loan. The terms of these contracts range from less than one year to 10 years. Refer to Note 8 for details.
BMO Financial Group 201st Annual Report 2018 201

Not
esNOTES TO CONSOLIDATED FINANCIAL STATEMENTS
Other Credit InstrumentsBackstop liquidity facilities are provided to asset-backed commercial paper (“ABCP”) or commercial paper (“CP”) programs administered by either usor third parties as an alternative source of financing when ABCP or CP markets cannot be accessed and for ABCP programs when predeterminedperformance measures of the financial assets held by these programs are not met. The terms of the backstop liquidity facilities do not require us toadvance money to these programs in the event of insolvency of the borrower. The facilities’ terms are generally no longer than one year, but can beseveral years.
We lend eligible customers’ securities to third-party borrowers who have been evaluated for credit risk using the same credit risk process that isapplied to loans and other credit assets. In connection with these activities, we may provide indemnification to clients against losses resulting fromthe failure of the borrower to return loaned securities when due. All borrowings are fully collateralized with cash or marketable securities. Assecurities are loaned, we require borrowers to maintain collateral which is equal to or in excess of 100% of the fair value of the securities borrowed.The collateral is revalued on a daily basis.
Documentary and commercial letters of credit represent our agreement to honour drafts presented by a third party upon completion of specificactivities.
Commitments to extend credit represent our commitment to our customers to grant them credit in the form of loans or other financings forspecific amounts and maturities, subject to their meeting certain conditions.
Other commitments include commitments to fund external private equity funds and investments in equity and debt securities at market value atthe time the commitments are drawn. In addition, we act as underwriter for certain new issuances under which we, alone or together with asyndicate of financial institutions, purchase the new issue for resale to investors.
Indemnification AgreementsIn the normal course of operations, we enter into various agreements that provide general indemnifications. These indemnifications typically occur inconnection with sales of assets, securities offerings, service contracts, membership agreements, clearing arrangements, derivative contracts andleasing transactions. Based on historical experience, we expect the risk of loss to be remote.
Exchange and Clearinghouse GuaranteesWe are a member of several securities and futures exchanges and central counterparties. Membership in certain of these organizations may requireus to pay a pro rata share of the losses incurred by the organization in the event of default of another member. It is difficult to estimate ourmaximum exposure under these membership agreements, since this would require an assessment of future claims that may be made against us thathave not yet occurred. Based on historical experience, we expect the risk of loss to be remote.
Pledged AssetsIn the normal course of business, we pledge assets as security for various liabilities that we incur.
The following tables summarize our pledged assets and collateral, and the activities to which they relate:
(Canadian $ in millions) 2018 2017
Bank AssetsCash and securities (1)
Issued or guaranteed by the Government of Canada 7,784 11,904Issued or guaranteed by a Canadian province, municipality or school corporation 7,143 6,170Other 60,812 51,848
Mortgages, securities borrowed or purchased under resale agreements and other 115,256 99,474
190,995 169,396
(Canadian $ in millions) 2018 2017
Assets pledged in relation to:Central counterparties, payment systems and depositories 2,403 2,043Bank of Canada 525 725Foreign governments and central banks 3 3Obligations related to securities sold under repurchase agreements 54,606 42,450Securities borrowing and lending 50,388 51,120Derivatives transactions 6,120 5,924Securitization 28,710 27,632Covered bonds 26,721 24,983Other 21,519 14,516
Total pledged assets and collateral (1) 190,995 169,396
(1) Excludes cash pledged with central banks disclosed as restricted cash in Note 2.
Certain comparative figures have been reclassified to conform with the current year’s presentation.
CollateralWhen entering into trading activities, such as purchases under resale agreements, securities borrowing and lending activities or financing for certainderivative transactions, we require our counterparties to provide us with collateral that will protect us from losses in the event of their default.Collateral transactions (received or pledged) are typically conducted under terms that are usual and customary in standard trading activities. If there isno default, the securities or their equivalents must be returned to, or returned by, the counterparty at the end of the contract.
The fair value of counterparty collateral that we are permitted to sell or repledge (in the absence of default by the owner of the collateral) was$123,782 million as at October 31, 2018 ($118,324 million as at October 31, 2017). The fair value of collateral that we have sold or repledged was$82,392 million as at October 31, 2018 ($76,909 million as at October 31, 2017).
Lease CommitmentsWe have entered into a number of non-cancellable leases for premises and equipment. Our computer and software leases are typically fixed forone term and our premises leases have various renewal options and rights. Our total contractual rental commitments as at October 31, 2018 were
202 BMO Financial Group 201st Annual Report 2018

Notes
$2,742 million. The commitments for each of the next five years and thereafter are $404 million for 2019, $358 million for 2020, $301 million for2021, $254 million for 2022, $215 million for 2023 and $1,210 million thereafter. Included in these amounts are commitments related to 1,130leased branch locations as at October 31, 2018.
Provisions and Contingent LiabilitiesProvisions are recognized when we have a legal or constructive obligation as a result of past events, such as contractual commitments, legal or otherobligations where we can reliably estimate the obligation, and it is probable we will be required to settle the obligation. We recognize as a provisionour best estimate of the amount required to settle the obligations as of the balance sheet date, taking into account the risks and uncertaintiessurrounding the obligations. Provisions are recorded in other liabilities on the Consolidated Balance Sheet. Contingent liabilities are potentialobligations arising from past events, the existence of which will only be confirmed by the occurrence or non-occurrence of one or more future eventsnot wholly within our control and are not included in the table below.
Restructuring ChargesIncluded in provisions as at October 31, 2018 is $176 million ($98 million in 2017) of restructuring charges related to our ongoing enterprise-wideinitiative to simplify how we work, drive increased efficiency, and invest in technology to move our business forward. This amount represents ourbest estimate of the amount that will be ultimately paid out.
Legal ProceedingsThe bank and its subsidiaries are party to legal proceedings, including regulatory investigations, in the ordinary course of business. While there isinherent difficulty in predicting the outcome of these proceedings, management does not expect the outcome of any of these proceedings,individually or in the aggregate, to have a material adverse effect on the consolidated financial position or the results of operations of the bank.
Changes in the provision balance during the year were as follows:(Canadian $ in millions) 2018 2017
Balance at beginning of year 170 268Additional provisions/increase in provisions 375 153Provisions utilized (250) (172)Amounts reversed (11) (75)Exchange differences and other movements – (4)
Balance at end of year (1) 284 170
(1) Balance includes severance obligations, restructuring charges and legal provisions.
Note 25: Operating and Geographic SegmentationOperating GroupsWe conduct our business through three operating groups, each of which has a distinct mandate. We determine our operating groups based on ourmanagement structure and therefore these groups, and the results attributed to them, may not be comparable with those of other financial servicescompanies. We evaluate the performance of our groups using reported and adjusted measures, such as net income, revenue growth, return on equity,and non-interest expense-to-revenue (productivity) ratio, as well as operating leverage.
Effective with the adoption of IFRS 9, we allocate the provision for credit losses on performing loans and the related allowance to operatinggroups. In 2017 and prior years, the collective provision and allowance were held in Corporate Services.
Personal and Commercial BankingPersonal and Commercial Banking (“P&C”) is comprised of two operating segments: Canadian Personal and Commercial Banking and U.S. Personal andCommercial Banking.
Canadian Personal and Commercial BankingCanadian Personal and Commercial Banking (“Canadian P&C”) provides a full range of financial products and services to eight million customers.Personal Banking provides financial solutions for everyday banking, financing, investing, credit card and creditor insurance needs. Commercial Bankingprovides our small business and commercial banking customers with a broad suite of integrated commercial and capital markets products, as well asfinancial advisory services.
U.S. Personal and Commercial BankingU.S. Personal and Commercial Banking (“U.S. P&C”) offers a broad range of products and services. Our retail and small and mid-sized business bankingcustomers are served through our branches, contact centres, online and mobile banking platforms and automated banking machines across eightstates. Our commercial banking customers are offered in-depth specific industry knowledge, as well as strategic capital markets solutions.
BMO Wealth ManagementBMO’s group of wealth management businesses serves a full range of client segments from mainstream to ultra high net worth and institutional,with a broad offering of wealth management products and services, including insurance products. Wealth Management (“BMO WM”) is a globalbusiness with an active presence in markets across Canada, the United States, Europe and Asia.
BMO Financial Group 201st Annual Report 2018 203

Not
esNOTES TO CONSOLIDATED FINANCIAL STATEMENTS
BMO Capital MarketsBMO Capital Markets (“BMO CM”) is a North American-based financial services provider offering a complete range of products and services tocorporate, institutional and government clients. Through our Investment and Corporate Banking and Trading Products lines of business, we operate in33 locations around the world, including 19 offices in North America.
Corporate ServicesCorporate Services consists of Corporate Units and Technology and Operations (“T&O”). Corporate Units provide enterprise-wide expertise, governanceand support in a variety of areas, including strategic planning, risk management, finance, legal and regulatory compliance, human resources,communications, marketing, real estate, procurement, data and analytics, and innovation. T&O manages, maintains and provides governance ofinformation technology, cyber security, and operations services for the bank.
The costs of these Corporate Units and T&O services are largely transferred to the three operating groups (P&C, BMO WM and BMO CM), with anyremaining amounts retained in Corporate Services results. As such, Corporate Services results largely reflect the impact of residual treasury-relatedactivities, the elimination of taxable equivalent adjustments, residual unallocated expenses and certain acquisition integration costs and restructuringcosts.
Basis of PresentationThe results of these operating groups are based on our internal financial reporting systems. The accounting policies used in these segments aregenerally consistent with those followed in the preparation of our consolidated financial statements, as disclosed in Note 1 and throughout theconsolidated financial statements. Income taxes presented below may not be reflective of taxes paid in each jurisdiction where we operate. Incometaxes are generally applied to each segment based on a statutory tax rate and may be adjusted for items and activities specific to each segment. Anotable accounting measurement difference is the taxable equivalent basis adjustment as described below.
Periodically, certain business lines and units within the business lines are transferred between client and corporate support groups to moreclosely align our organizational structure with our strategic priorities. In addition, revenue and expense allocations are updated to more accuratelyalign with current experience. Results for prior periods are restated to conform with the current year’s presentation.
Taxable Equivalent BasisWe analyze revenue on a taxable equivalent basis (“teb”) at the operating group level. Revenue and the provision for income taxes are increased ontax-exempt securities to an equivalent before-tax basis to facilitate comparisons of income between taxable and tax-exempt sources. The offset tothe groups’ teb adjustments is reflected in Corporate Services revenue and provision for income taxes. The teb adjustment for the year endedOctober 31, 2018 was $313 million ($567 million in 2017 and $510 million in 2016).
Inter-Group AllocationsVarious estimates and allocation methodologies are used in the preparation of the operating groups’ financial information. Overhead expenses areallocated to operating groups using allocation formulas applied on a consistent basis. Operating group net interest income reflects internal fundingcharges and credits on the groups’ assets, liabilities and capital, at market rates, taking into account relevant terms and currency considerations. Theoffset of the net impact of these charges and credits is reflected in Corporate Services. These inter-group allocations are also applied to thegeographical segmentation.
Our results and average assets, grouped by operating segment, are as follows:
(Canadian $ in millions)Canadian
P&CU.S.P&C
WealthManagement BMO CM
CorporateServices (1) Total
2018Net interest income (2) 5,541 3,843 826 659 (556) 10,313Non-interest revenue 2,171 1,140 5,468 3,696 249 12,724
Total Revenue 7,712 4,983 6,294 4,355 (307) 23,037Provision for (recovery of) credit losses on impaired loans 466 258 6 (17) (13) 700Provision for (recovery of) credit losses on performing loans 3 (38) – (1) (2) (38)
Total provision for (recovery of) credit losses 469 220 6 (18) (15) 662Insurance claims, commissions and changes in policy benefit liabilities – – 1,352 – – 1,352Amortization 318 454 231 124 – 1,127Non-interest expense 3,487 2,558 3,278 2,727 436 12,486
Income (loss) before taxes and non-controlling interest in subsidiaries 3,438 1,751 1,427 1,522 (728) 7,410Provision for (recovery of) income taxes 884 357 355 366 (2) 1,960
Reported net income (loss) 2,554 1,394 1,072 1,156 (726) 5,450
Non-controlling interest in subsidiaries – – – – – –
Net Income (loss) attributable to bank shareholders 2,554 1,394 1,072 1,156 (726) 5,450
Average Assets 224,553 110,351 35,913 307,087 76,391 754,295
204 BMO Financial Group 201st Annual Report 2018
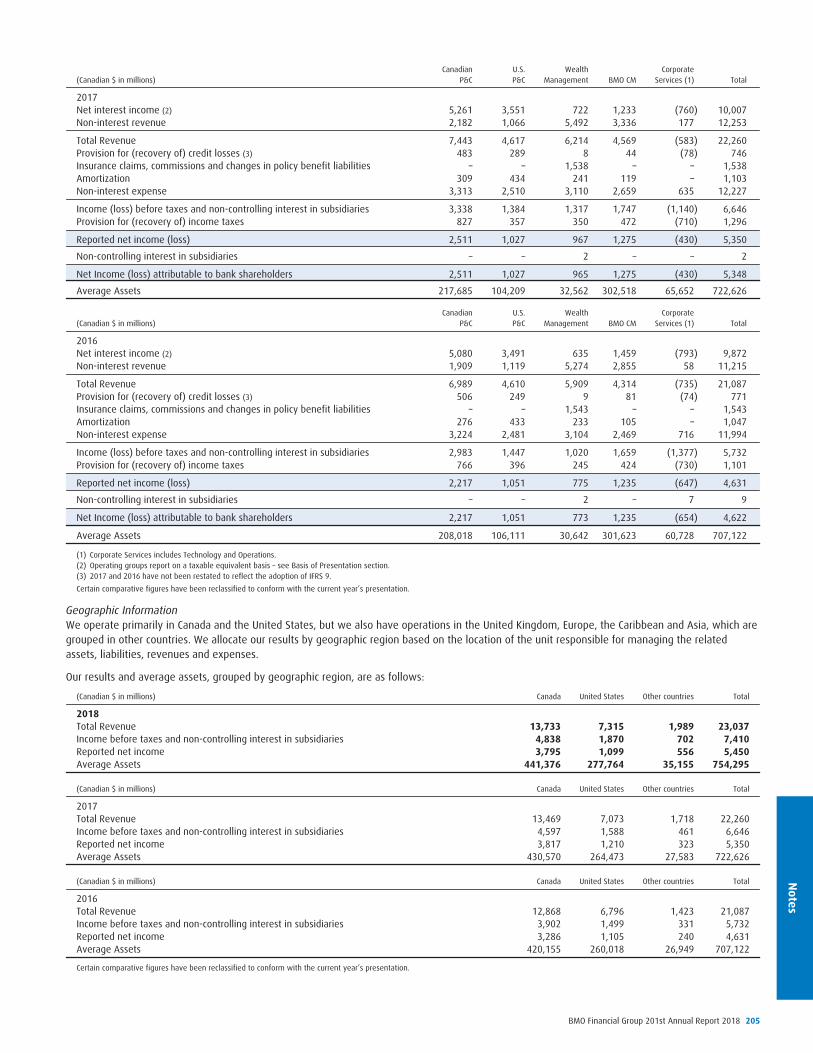
Notes
(Canadian $ in millions)Canadian
P&CU.S.P&C
WealthManagement BMO CM
CorporateServices (1) Total
2017Net interest income (2) 5,261 3,551 722 1,233 (760) 10,007Non-interest revenue 2,182 1,066 5,492 3,336 177 12,253
Total Revenue 7,443 4,617 6,214 4,569 (583) 22,260Provision for (recovery of) credit losses (3) 483 289 8 44 (78) 746Insurance claims, commissions and changes in policy benefit liabilities – – 1,538 – – 1,538Amortization 309 434 241 119 – 1,103Non-interest expense 3,313 2,510 3,110 2,659 635 12,227
Income (loss) before taxes and non-controlling interest in subsidiaries 3,338 1,384 1,317 1,747 (1,140) 6,646Provision for (recovery of) income taxes 827 357 350 472 (710) 1,296
Reported net income (loss) 2,511 1,027 967 1,275 (430) 5,350
Non-controlling interest in subsidiaries – – 2 – – 2
Net Income (loss) attributable to bank shareholders 2,511 1,027 965 1,275 (430) 5,348
Average Assets 217,685 104,209 32,562 302,518 65,652 722,626
(Canadian $ in millions)Canadian
P&CU.S.P&C
WealthManagement BMO CM
CorporateServices (1) Total
2016Net interest income (2) 5,080 3,491 635 1,459 (793) 9,872Non-interest revenue 1,909 1,119 5,274 2,855 58 11,215
Total Revenue 6,989 4,610 5,909 4,314 (735) 21,087Provision for (recovery of) credit losses (3) 506 249 9 81 (74) 771Insurance claims, commissions and changes in policy benefit liabilities – – 1,543 – – 1,543Amortization 276 433 233 105 – 1,047Non-interest expense 3,224 2,481 3,104 2,469 716 11,994
Income (loss) before taxes and non-controlling interest in subsidiaries 2,983 1,447 1,020 1,659 (1,377) 5,732Provision for (recovery of) income taxes 766 396 245 424 (730) 1,101
Reported net income (loss) 2,217 1,051 775 1,235 (647) 4,631
Non-controlling interest in subsidiaries – – 2 – 7 9
Net Income (loss) attributable to bank shareholders 2,217 1,051 773 1,235 (654) 4,622
Average Assets 208,018 106,111 30,642 301,623 60,728 707,122
(1) Corporate Services includes Technology and Operations.(2) Operating groups report on a taxable equivalent basis – see Basis of Presentation section.(3) 2017 and 2016 have not been restated to reflect the adoption of IFRS 9.
Certain comparative figures have been reclassified to conform with the current year’s presentation.
Geographic InformationWe operate primarily in Canada and the United States, but we also have operations in the United Kingdom, Europe, the Caribbean and Asia, which aregrouped in other countries. We allocate our results by geographic region based on the location of the unit responsible for managing the relatedassets, liabilities, revenues and expenses.
Our results and average assets, grouped by geographic region, are as follows:
(Canadian $ in millions) Canada United States Other countries Total
2018Total Revenue 13,733 7,315 1,989 23,037Income before taxes and non-controlling interest in subsidiaries 4,838 1,870 702 7,410Reported net income 3,795 1,099 556 5,450Average Assets 441,376 277,764 35,155 754,295
(Canadian $ in millions) Canada United States Other countries Total
2017Total Revenue 13,469 7,073 1,718 22,260Income before taxes and non-controlling interest in subsidiaries 4,597 1,588 461 6,646Reported net income 3,817 1,210 323 5,350Average Assets 430,570 264,473 27,583 722,626
(Canadian $ in millions) Canada United States Other countries Total
2016Total Revenue 12,868 6,796 1,423 21,087Income before taxes and non-controlling interest in subsidiaries 3,902 1,499 331 5,732Reported net income 3,286 1,105 240 4,631Average Assets 420,155 260,018 26,949 707,122
Certain comparative figures have been reclassified to conform with the current year’s presentation.
BMO Financial Group 201st Annual Report 2018 205

Not
esNOTES TO CONSOLIDATED FINANCIAL STATEMENTS
Note 26: Significant SubsidiariesAs at October 31, 2018, the bank, either directly or indirectly through its subsidiaries, controls the following significant operating subsidiaries.
Significant subsidiaries (1)(2) Head or principal officeBook value of shares owned by the bank
(Canadian $ in millions)
Bank of Montreal Capital Markets (Holdings) Limited and subsidiaries, including: London, England 332BMO Capital Markets Limited London, EnglandPyrford International Limited London, England
Bank of Montreal (China) Co. Ltd. Beijing, China 448Bank of Montreal Holding Inc. and subsidiaries, including: Toronto, Canada 29,028
Bank of Montreal Mortgage Corporation Calgary, CanadaBMO Mortgage Corp. Vancouver, Canada
BMO Investments Limited Hamilton, BermudaBMO Reinsurance Limited St. Michaels, Barbados
BMO Nesbitt Burns Holdings Corporation Toronto, CanadaBMO Nesbitt Burns Inc. Toronto, Canada
BMO Investments Inc. Toronto, CanadaBMO InvestorLine Inc. Toronto, Canada
Bank of Montreal Ireland plc Dublin, Ireland 1,022BMO Financial Corp. and subsidiaries, including: Chicago, United States 21,893
BMO Asset Management Corp. and subsidiaries Chicago, United StatesBMO Capital Markets Corp. New York, United StatesBMO Harris Bank National Association and subsidiaries, including: Chicago, United States
BMO Harris Investment Company LLC Las Vegas, United StatesBMO Harris Financial Advisors, Inc. Chicago, United StatesBMO Harris Financing, Inc. and subsidiaries Chicago, United StatesCTC myCFO, LLC Palo Alto, United States
BMO Global Asset Management (Europe) Limited and subsidiaries, including: London, England 692BMO Asset Management (Holdings) plc and subsidiaries (3) London, England
BMO Life Insurance Company and subsidiaries, including: Toronto, Canada 1,195BMO Life Holdings (Canada), ULC Halifax, Canada
BMO Life Assurance Company Toronto, CanadaBMO Trust Company Toronto, Canada 768BMO Trustee Asia Limited Hong Kong, China 2LGM (Bermuda) Limited and subsidiaries, including: Hamilton, Bermuda 147
BMO Global Asset Management (Asia) Limited Hong Kong, ChinaLGM Investments Limited London, England
(1) Each subsidiary is incorporated or organized under the laws of the state or country in which the principal office is situated, except for BMO Financial Corp., BMO Asset Management Corp., BMO CapitalMarkets Corp., BMO Harris Financial Advisors, Inc., BMO Harris Financing, Inc., and CTC myCFO, LLC, which are incorporated under the laws of the state of Delaware, United States. BMO AssetManagement (Holdings) plc is incorporated under the laws of Scotland.
(2) Unless otherwise noted, the bank, either directly or indirectly through its subsidiaries, owns 100% of the outstanding voting shares of each subsidiary.(3) Effective October 31, 2018, F&C Asset Management plc changed its name to BMO Asset Management (Holdings) plc.
Significant RestrictionsOur ability to transfer funds between our subsidiaries may be restricted by statutory, contractual, capital and regulatory requirements. Restrictionsinclude:‰ Assets pledged as security for various liabilities we incur. Refer to Note 24 for details.‰ Assets of our consolidated structured entities that are held for the benefit of the note holders. Refer to Note 7 for details.‰ Assets held by our insurance subsidiaries. Refer to Note 12 for details.‰ Regulatory and statutory requirements that reflect capital and liquidity requirements. Refer to Note 19 for details.‰ Funds required to be held with central banks. Refer to Note 2 for details.
Note 27: Related Party TransactionsRelated parties include subsidiaries, associates, joint ventures, employee future benefit plans and key management personnel and their close familymembers. Close family members include spouses, common-law partners and dependent minors. Transactions with our subsidiaries are eliminated onconsolidation, and are not disclosed as related party transactions.
Key Management Personnel CompensationKey management personnel is defined as those persons having authority and responsibility for planning, directing and/or controlling the activities ofan entity, being the members of our Board of Directors (“directors”) and certain senior executives.
The following table presents the compensation of our key management personnel:
(Canadian $ in millions) 2018 2017 2016
Base salary and incentives 21 23 22Post-employment benefits 2 1 2Share-based payments (1) 31 38 32
Total key management personnel compensation 54 62 56
(1) Amounts included in share-based payments are the fair values of awards granted in the year.
206 BMO Financial Group 201st Annual Report 2018

Notes
We offer senior executives market interest rates on credit card balances, a fee-based subsidy on annual credit card fees, and a select suite ofcustomer loan and mortgage products at rates normally accorded to preferred customers. At October 31, 2018, loans to key management personneltotalled $16 million ($10 million in 2017).
Directors receive a specified amount of their annual retainer in deferred stock units. Until a director’s shareholdings (including deferred stockunits) are eight times greater than their annual retainer, they are required to take 100% of their annual retainer and other fees in the form of eitherour common shares or deferred stock units. They may elect to receive the remainder of such retainer fees and other remuneration in cash, commonshares or deferred stock units.
Directors of our wholly owned subsidiary, BMO Financial Corp., are required to take a specified minimum amount of their annual retainer andother fees in the form of deferred stock units.
Joint Ventures and AssociatesWe provide banking services to our joint ventures and associates on the same terms offered to our customers for these services. Our investments injoint ventures of which we own 50% totalled $231 million as at October 31, 2018 ($182 million in 2017). Our investments in associates over whichwe exert significant influence totalled $471 million as at October 31, 2018 ($444 million in 2017).
The following table presents transactions with our joint ventures and associates:
(Canadian $ in millions) 2018 2017
Loans 195 178Deposits 114 132Fees paid for services received 71 66
Note 28: Transition to IFRS 9The following table shows the pre-transition IAS 39 and corresponding IFRS 9 classification and measurement categories, and reconciles the IAS 39and IFRS 9 carrying amounts for loans, securities and other financial assets as at November 1, 2017 as a result of adopting IFRS 9. There were nochanges to the measurement basis of other financial asset categories or any financial liabilities.
(Canadian $ in millions)IAS 39 measurement
categoryIFRS 9 measurement
categoryIAS 39 carrying
amount Reclassification RemeasurementIFRS 9 carrying
amount
Financial AssetsSecurities
Trading Trading 99,069 (8,534) – 90,535FVTPL – 8,534 – 8,534
Available-for-sale na 54,075 (54,075) – –FVOCI – 51,909 – 51,909FVTPL – 2,081 – 2,081
Amortized cost – 85 – 85Held-to-maturity Amortized cost 9,094 – (2) 9,092
Other Other 960 (333) – 627FVTPL – 333 – 333
Total Securities 163,198 – (2) 163,196
LoansResidential mortgages Amortized cost Amortized cost 115,258 – – 115,258Consumer instalment and other Amortized cost Amortized cost 61,944 – – 61,944Credit cards Amortized cost Amortized cost 8,071 – – 8,071Business and government Amortized cost Amortized cost 175,067 (2,372) – 172,695
FVTPL – 2,372 – 2,372
Total Loans 360,340 – – 360,340Allowance for credit losses (1,833) – 154 (1,679)
358,507 – 154 358,661
Remaining financial assets (1) 127,706 – (6) 127,700
Financial LiabilitiesAllowance for credit losses on off-balance
sheet exposures 163 – 76 239
Total pre-tax impact of IFRS 9 adoption na – 70 na
Total after-tax Accumulated Other Comprehensive Income 3,066 (55) – 3,011Total after-tax Retained Earnings (2)(3) 23,709 55 44 23,808Total after-tax Shareholders’ Equity 44,354 – 44 44,398
(1) Represents cash and cash equivalents, interest bearing deposits with banks, securities borrowed or purchased under resale agreements and other assets. Remeasurement represents the impact ofthe impairment provisions of IFRS 9 on these remaining financial assets.
(2) Reclassification amount represents the after-tax impact ($105 million pre-tax) that resulted from the reclassification of equity securities from available-for-sale under IAS 39 to fair value through profitor loss under IFRS 9.
(3) Remeasurement represents the after-tax impact ($70 million pre-tax) of the adoption of the impairment provisions of IFRS 9.
na – not applicable due to IFRS 9 adoption.
BMO Financial Group 201st Annual Report 2018 207

Not
esNOTES TO CONSOLIDATED FINANCIAL STATEMENTS
The securities balances by measurement category following the adoption of IFRS 9 as at November 1, 2017 were:
(Canadian $ in millions) November 1, 2017
Trading 90,535FVTPL 10,948FVOCI 51,909Amortized cost 9,177Other 627
Total 163,196
The primary impact as a result of adopting the classification and measurement provisions of IFRS 9 relates to securities held by the bank.On transition, our existing held-to-maturity securities continued to qualify for amortized cost treatment, as they are held with the intent to collect
contractual cash flows and those cash flows represent solely payments of principal and interest.Our available-for-sale portfolio was reclassified based on the result of the business model and contractual cash flow tests. All available-for-sale
securities that represented equity instruments were reclassified as fair value through profit or loss. Available-for-sale securities that representedinvestments in debt instruments were generally classified as fair value through other comprehensive income. Certain available-for-sale debt securitieswere classified as fair value through profit or loss, as their contractual cash flows did not represent solely payments of principal and interest. Certainavailable-for-sale debt securities were classified as amortized cost, as they are held with the intent to collect contractual cash flows and those cashflows represent only payments of principal and interest. On transition, investments held in our merchant banking business are classified as fair valuethrough profit or loss and no longer require designation under the fair value option.
Our lending portfolios continue to be recorded at amortized cost, with the exception of certain business and government loans, whosecontractual cash flows did not represent only payments of principal and interest, and were classified as fair value through profit or loss.
The following table illustrates the impact of transition to IFRS 9 on the allowance for credit loss as of November 1, 2017.
(Canadian $ in millions)IAS 39 collective
allowanceIAS 39 specific
allowanceIAS 39
allowance RemeasurementIFRS 9
allowance IFRS 9 Stage 1 IFRS 9 Stage 2 IFRS 9 Stage 3
LoansResidential mortgages 69 24 93 (20) 73 16 33 24Consumer instalment and other 343 136 479 71 550 70 344 136Credit cards 243 – 243 41 284 63 221 –Business and government 785 233 1,018 (246) 772 205 334 233
Total allowance for credit losses 1,440 393 1,833 (154) 1,679 354 932 393Allowance for credit losses on
remaining financial assets (1) – – – 8 8 7 1 –Allowance for credit losses on
off-balance sheet exposures 136 27 163 76 239 89 123 27
Total 1,576 420 1,996 (70) 1,926 450 1,056 420
(1) Represents cash and cash equivalents, interest bearing deposits with banks, securities, securities borrowed or purchased under resale agreements and other assets.
Accounting Policies for Financial Instruments under IAS 39, Financial Instruments: Recognition and MeasurementThe following accounting policies apply to comparative information for 2017 and 2016 in our consolidated financial statements as we did not restateprior periods on adoption of IFRS 9.
Classification and Measurement of SecuritiesSecurities are divided into four types: trading securities designated at FVTPL, available-for-sale securities, held-to-maturity and other securities.
Trading securities are securities that we purchase for resale over a short period of time. We classify trading securities and securities designatedunder the fair value option at fair value through profit or loss.
We record the transaction costs, gains and losses realized on disposal and unrealized gains and losses due to changes in fair value in ourConsolidated Statement of Income in trading revenues. Securities designated at FVTPL are financial instruments that are accounted for at fair value,with changes in fair value recorded in income provided they meet certain criteria.
Available-for-sale securities consist of debt and equity securities that may be sold in response to or in anticipation of changes in interest rates andresulting prepayment risk, changes in credit risk, changes in foreign currency risk, changes in funding sources or terms, or in order to meet liquidityneeds.
Available-for-sale securities are initially recorded at fair value plus transaction costs. They are subsequently measured at fair value, withunrealized gains and losses recorded in unrealized gains (losses) on available-for-sale securities in our Consolidated Statement of ComprehensiveIncome until the security is sold. Gains and losses on disposal and impairment losses (recoveries) are recorded in our Consolidated Statement ofIncome in non-interest revenue, securities gains, other than trading. Interest income earned and dividends received on available-for-sale securitiesare recorded in our Consolidated Statement of Income in interest, dividend and fee income, securities.
Held-to-maturity securities are debt securities that we have the intention and ability to hold to maturity and that do not meet the definition of aloan. These securities are initially recorded at fair value plus transaction costs and subsequently measured at amortized cost using the effectiveinterest method. Impairment losses are recorded in our Consolidated Statement of Income in securities gains (losses), other than trading. Interestincome earned and amortization of premiums or discounts on these debt securities are recorded in our Consolidated Statement of Income in interest,dividend and fee income, securities.
208 BMO Financial Group 201st Annual Report 2018

Notes
Other securities are investments in companies where we exert significant influence over operating, investing and financing decisions (generallycompanies in which we own between 20% and 50% of the voting shares). We account for these other securities using the equity method ofaccounting. Other securities also include certain securities held by our merchant banking business.
Impairment of SecuritiesWe review held-to-maturity, available-for-sale and other securities at each quarter-end reporting period to identify and evaluate investments thatshow indications of possible impairment.
For held-to-maturity, available-for-sale and other securities, impairment losses are recognized if there is objective evidence of impairment as aresult of an event that reduces the estimated future cash flows from the security and the impact can be reliably estimated.
We do not record impairment write-downs on debt securities when impairment is due to changes in market interest rates if future contractualcash flows associated with the debt security are still expected to be recovered.
The impairment loss on available-for-sale securities is the difference between the security’s amortized cost and its current fair value, less anypreviously recognized impairment losses. If there is objective evidence of impairment, a write-down is transferred from our Consolidated Statementof Comprehensive Income, unrealized gains (losses) on available-for-sale securities, to our Consolidated Statement of Income in securities gains,other than trading.
The impairment loss on held-to-maturity securities is the difference between a security’s carrying amount and the present value of its estimatedfuture cash flows discounted at the original effective interest rate. If there is objective evidence of impairment, a write-down is recorded in ourConsolidated Statement of Income in securities gains, other than trading.
For available-for-sale debt securities, a previous impairment loss is reversed through net income if an event occurs after the impairment wasrecognized that can be objectively attributed to an increase in fair value, to a maximum of the original impairment charge. For available-for-saleequity securities, previous impairment losses are not reversed through net income, and any subsequent increases in fair value are recorded in othercomprehensive income. Reversals of impairment losses on held-to-maturity securities are recorded to a maximum of the amortized cost of theinvestment before the original impairment charge.
LoansLoans are initially measured at fair value plus directly attributable costs, and are subsequently measured at amortized cost using the effective interestmethod. The effective interest method allocates interest income over the expected term of the loan by applying the effective interest rate to thecarrying amount of the loan. The effective interest rate is defined as the rate that exactly discounts future cash receipts through the expected term ofthe loan to the net carrying amount of the loan. Under the effective interest method, the amount recognized in interest, dividend and fee income,loans, varies over the term of the loan based on the principal outstanding.
Allowance for Credit LossesThe allowance for credit losses adjusts the value of loans to reflect their estimated realizable value. In assessing their estimated realizable value, wemust rely on estimates and exercise judgment regarding matters for which the ultimate outcome is unknown. These include economic factors,developments affecting companies in particular industries, and specific issues with respect to single borrowers. Changes in circumstances may causefuture assessments of credit risk to be materially different from current assessments, which could result in an increase or decrease in the allowancefor credit losses.
The allowance is comprised of a specific allowance and a collective allowance.
Specific AllowanceThese allowances are recorded for individually identified impaired loans to reduce their carrying value to the expected recoverable amount. Wereview our loans on an ongoing basis to assess whether any loans should be classified as impaired and whether an allowance or write-off should berecorded (excluding credit card loans, which are classified as impaired and written off when principal or interest payments are 180 days past due, asdiscussed under Impaired Loans). The review of individually significant problem loans is conducted at least quarterly by the account managers, eachof whom assesses the ultimate collectability and estimated recoveries for a specific loan based on all events and conditions that are relevant to theloan. This assessment is then reviewed and approved by an independent credit officer.
Individually Significant Impaired LoansTo determine the amount we expect to recover from an individually significant impaired loan, we use the value of the estimated future cash flowsdiscounted at the loan’s original effective interest rate. The determination of estimated future cash flows of a collateralized impaired loan reflects theexpected realization of the underlying security, net of expected costs and any amounts legally required to be paid to the borrower. Security can varyby type of loan and may include cash, securities, real estate properties, accounts receivable, guarantees, inventory or other capital assets.
Individually Insignificant Impaired LoansResidential mortgages, consumer instalment and other personal loans are individually insignificant and may be individually assessed or collectivelyassessed for losses at the time of impairment, taking into account historical loss experience.
Collective AllowanceWe maintain a collective allowance in order to cover impairment in the existing portfolio for loans that have not yet been individually identified asimpaired. Our approach to establishing and maintaining the collective allowance is based on the requirements of IAS 39, considering guidelines issuedby OSFI.
The collective allowance methodology incorporates both quantitative and qualitative factors to determine an appropriate level for the collectiveallowance. For the purpose of calculating the collective allowance, we group loans on the basis of similarities in credit risk characteristics. The lossfactors for groups of loans are determined based on a minimum of five years of historical data and a one-year loss emergence period, except forcredit cards, where a seven-month loss emergence period is used. The loss factors are back-tested and calibrated on a regular basis to ensure thatthey continue to reflect our best estimate of losses that have been incurred but not yet identified, on an individual basis, within the pools of loans.Historical loss experience data is also reviewed in the determination of loss factors. Qualitative factors are based on current observable data, such ascurrent macroeconomic and business conditions, portfolio-specific considerations and model risk factors.
BMO Financial Group 201st Annual Report 2018 209