STATEMENT OF FINANCIAL INFORMATION PREPARED UNDER … · STATEMENT OF FINANCIAL INFORMATION...
57
STATEMENT OF FINANCIAL INFORMATION PREPARED UNDER THE FINANCIAL INFORMATION ACT FOR YEAR ENDED MARCH 31, 2017 VANCOUVER ISLAND UNIVERSITY 900 FIFTH STREET NANAIMO, BC V9R 5S5
Transcript of STATEMENT OF FINANCIAL INFORMATION PREPARED UNDER … · STATEMENT OF FINANCIAL INFORMATION...

STATEMENT OF FINANCIAL INFORMATION
PREPARED UNDER THE FINANCIAL INFORMATION ACT
FOR YEAR ENDED MARCH 31, 2017
VANCOUVER ISLAND UNIVERSITY
900 FIFTH STREET
NANAIMO, BC
V9R 5S5
2
STATEMENT OF FINANCIAL INFORMATION
PREPARED UNDER THE FINANCIAL INFORMATION ACT
FOR YEAR ENDED MARCH 31, 2017
TABLE OF CONTENTS
Management Report ......................................................................................................... page 3
Approval of Financial Information ...................................................................................... page 4
Schedule of Debts ............................................................................................................. page 5
Schedule of Guarantee and Indemnity .............................................................................. page 6
Statement of Severance Agreements ................................................................................ page 8
Schedule of Board Remuneration ...................................................................................... page 9
Schedule of Employee Remuneration and Expenses ...................................................... page 10
Schedule of Suppliers of Goods and Services ................................................................. page 23
Reconciliation .................................................................................................................. page 30
Consolidated Financial Statements 2016-2017 .......................................................... Appendix 1

Sept. 14, 2017

5
STATEMENT OF FINANCIAL INFORMATION
PREPARED UNDER THE FINANCIAL INFORMATION ACT
FOR YEAR ENDED MARCH 31, 2017
SCHEDULE OF DEBTS
Prepared under the Financial Information Regulation, Schedule 1, Section 4
Vancouver Island University has not incurred any debt during the 2016-17 fiscal period

6
STATEMENT OF FINANCIAL INFORMATION
PREPARED UNDER THE FINANCIAL INFORMATION ACT
FOR YEAR ENDED MARCH 31, 2017
SCHEDULE OF GUARANTEE AND INDEMNITY AGREEMENTS
Prepared Under Financial Information Regulation, Schedule 1, Section 5
List of Financial guarantee and indemnity agreements in force which required government approval prior to being given under the Financial Administration Act Guarantees and Indemnities Regulations (BC Reg.258/87): Adventures Abroad Worldwide Travel Ltd. DBA Magic Yachts
Bonfire Interactive Ltd.
Britco LP
British Columbia Innovation Council
Camosun College and North Island College
Canadian Collegiate Athletic Association
City of Nanaimo (2)
Colleges and Institutes Canada
Duncan Retail Limited Partnership c/o Gulf Pacific Property Management Ltd.
Educational Testing Service
Her Majesty the Queen in Right of Canada as represented by Parks Canada Agency
Her Majesty the Queen in Right of the Province of British Columbia represented by the Minister responsible for the Land Act
Her Majesty the Queen in Right of the Province of British Columbia, represented by the Minister of Forests, Lands and Natural Resource Operations
Her Majesty the Queen in Right of the Province of British Columbia, represented by the Minister of Agriculture

7
Industry Training Authority
Ivanhoe Cambridge Inc., Ivanhoe Cambridge II Inc. and Woodgrove Holdings Inc.
Meloche Monnex Inc.
Nanaimo Port Authority
Nanwakolas Council Society (2)
National College of Tourism
Prometric Canada Testing Services Inc.
Regional District of Nanaimo
Ryerson University
Stz'uminus First Nation
TeamDynamix Solutions LLC
The Canadian Dairy Commission
Timberwest Forest Company, a partnership of TimberWest Forest Corp. and Timberwest Holdings Ltd.
Vancouver Island Master Gardeners Association
VancouverCruises.com Charters Ltd.
8
STATEMENT OF FINANCIAL INFORMATION
PREPARED UNDER THE FINANCIAL INFORMATION ACT
FOR YEAR ENDED MARCH 31, 2017
STATEMENT OF SEVERANCE AGREEMENTS
Prepared under the Financial Information Regulation, Schedule 1, Subsection 6(7)
There were four severance agreements made between Vancouver Island University and its non-unionized employees during fiscal year 2016-2017. The agreements represent between 6 and 18 months of compensation.
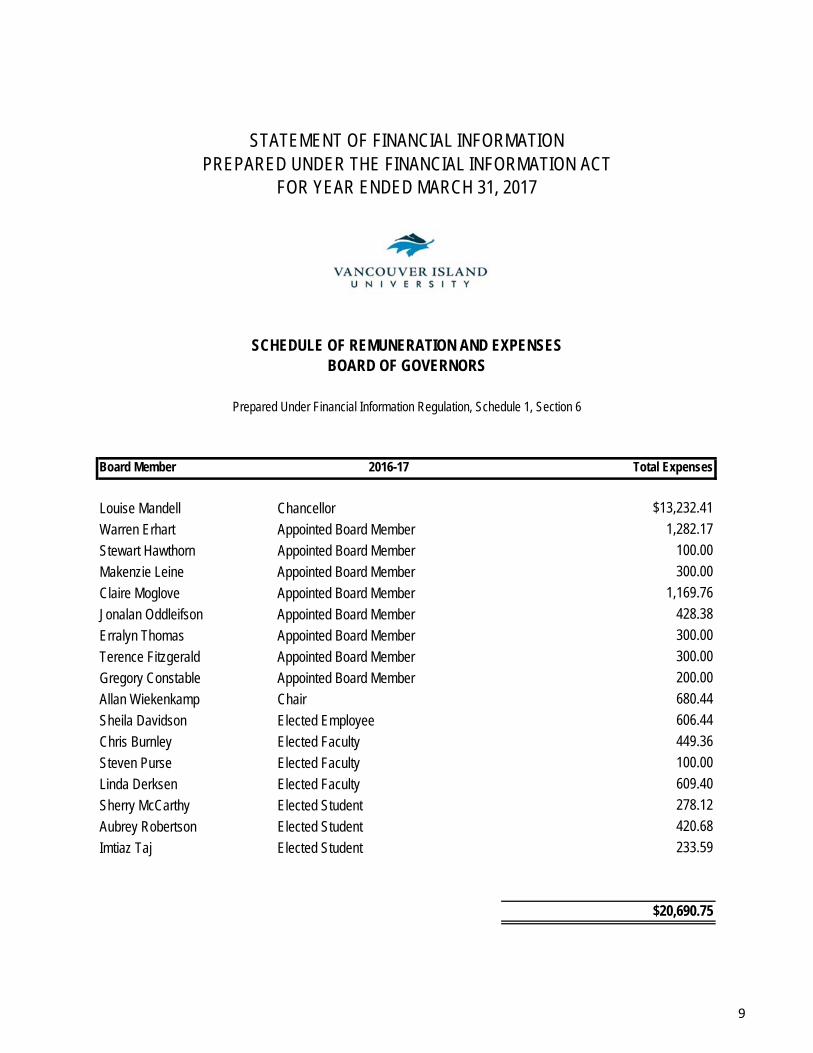
Board Member 2016-17 Total Expenses
Louise Mandell Chancellor $13,232.41
Warren Erhart Appointed Board Member 1,282.17
Stewart Hawthorn Appointed Board Member 100.00
Makenzie Leine Appointed Board Member 300.00
Claire Moglove Appointed Board Member 1,169.76
Jonalan Oddleifson Appointed Board Member 428.38
Erralyn Thomas Appointed Board Member 300.00
Terence Fitzgerald Appointed Board Member 300.00
Gregory Constable Appointed Board Member 200.00
Allan Wiekenkamp Chair 680.44
Sheila Davidson Elected Employee 606.44
Chris Burnley Elected Faculty 449.36
Steven Purse Elected Faculty 100.00
Linda Derksen Elected Faculty 609.40
Sherry McCarthy Elected Student 278.12
Aubrey Robertson Elected Student 420.68
Imtiaz Taj Elected Student 233.59
$20,690.75
Prepared Under Financial Information Regulation, Schedule 1, Section 6
STATEMENT OF FINANCIAL INFORMATIONPREPARED UNDER THE FINANCIAL INFORMATION ACT
FOR YEAR ENDED MARCH 31, 2017
SCHEDULE OF REMUNERATION AND EXPENSESBOARD OF GOVERNORS
9
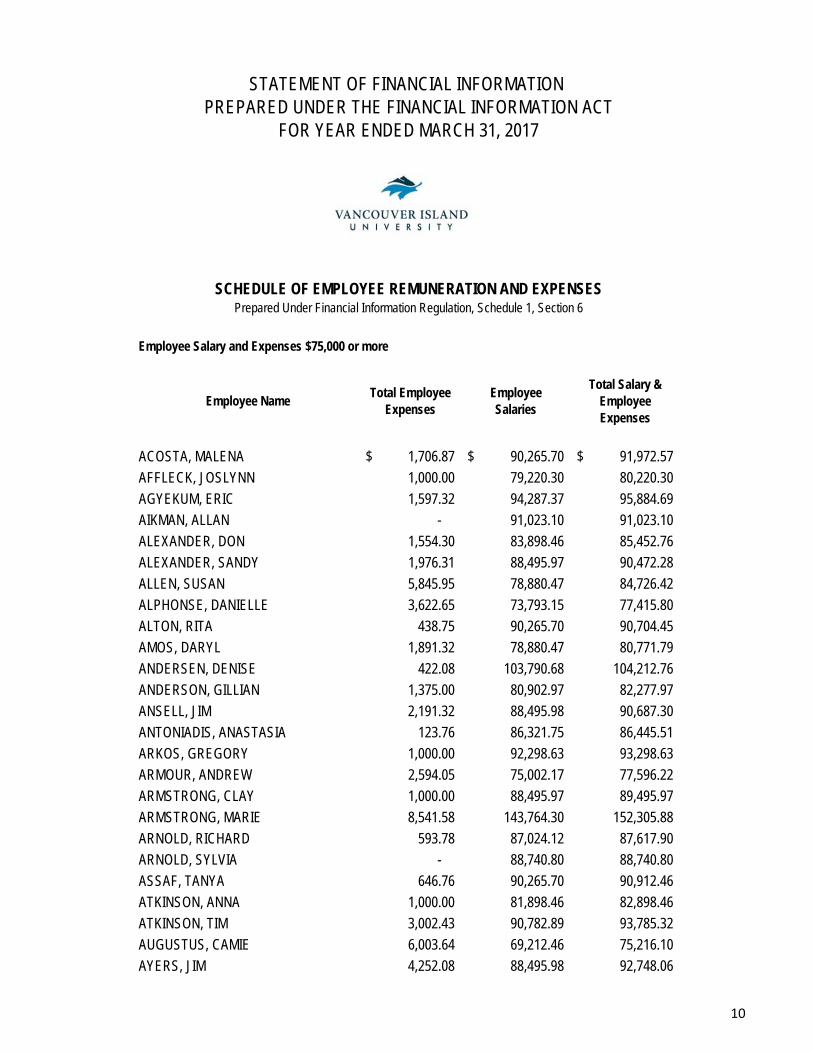
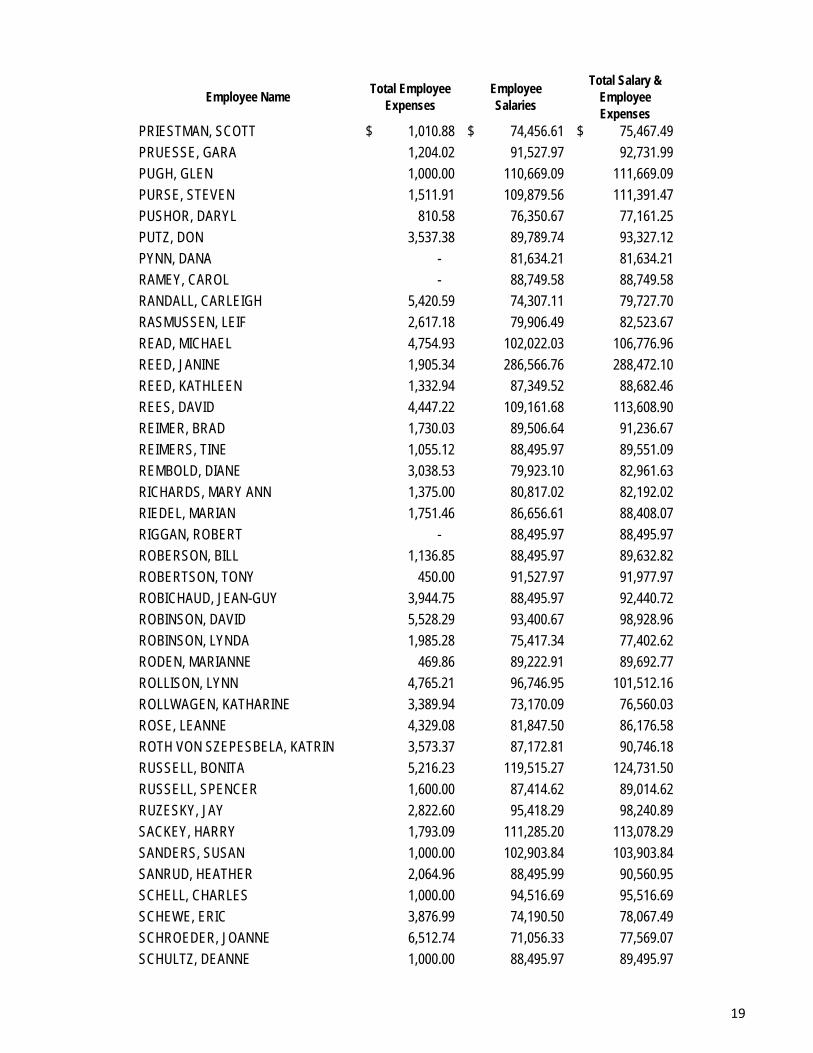
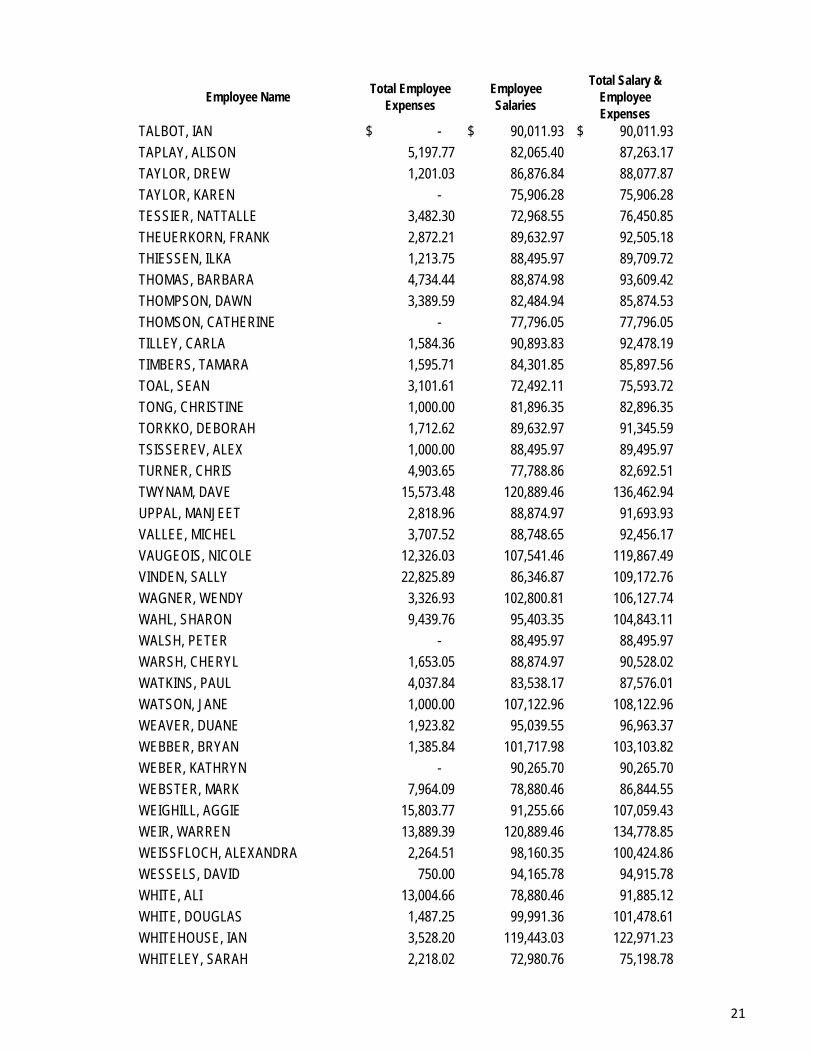
Employee Salary and Expenses $75,000 or more
Employee NameTotal Employee
ExpensesEmployeeSalaries
Total Salary & Employee Expenses
ACOSTA, MALENA 1,706.87$ 90,265.70$ 91,972.57$
AFFLECK, JOSLYNN 1,000.00 79,220.30 80,220.30
AGYEKUM, ERIC 1,597.32 94,287.37 95,884.69
AIKMAN, ALLAN - 91,023.10 91,023.10
ALEXANDER, DON 1,554.30 83,898.46 85,452.76
ALEXANDER, SANDY 1,976.31 88,495.97 90,472.28
ALLEN, SUSAN 5,845.95 78,880.47 84,726.42
ALPHONSE, DANIELLE 3,622.65 73,793.15 77,415.80
ALTON, RITA 438.75 90,265.70 90,704.45
AMOS, DARYL 1,891.32 78,880.47 80,771.79
ANDERSEN, DENISE 422.08 103,790.68 104,212.76
ANDERSON, GILLIAN 1,375.00 80,902.97 82,277.97
ANSELL, JIM 2,191.32 88,495.98 90,687.30
ANTONIADIS, ANASTASIA 123.76 86,321.75 86,445.51
ARKOS, GREGORY 1,000.00 92,298.63 93,298.63
ARMOUR, ANDREW 2,594.05 75,002.17 77,596.22
ARMSTRONG, CLAY 1,000.00 88,495.97 89,495.97
ARMSTRONG, MARIE 8,541.58 143,764.30 152,305.88
ARNOLD, RICHARD 593.78 87,024.12 87,617.90
ARNOLD, SYLVIA - 88,740.80 88,740.80
ASSAF, TANYA 646.76 90,265.70 90,912.46
ATKINSON, ANNA 1,000.00 81,898.46 82,898.46
ATKINSON, TIM 3,002.43 90,782.89 93,785.32
AUGUSTUS, CAMIE 6,003.64 69,212.46 75,216.10
AYERS, JIM 4,252.08 88,495.98 92,748.06
STATEMENT OF FINANCIAL INFORMATION PREPARED UNDER THE FINANCIAL INFORMATION ACT
FOR YEAR ENDED MARCH 31, 2017
SCHEDULE OF EMPLOYEE REMUNERATION AND EXPENSESPrepared Under Financial Information Regulation, Schedule 1, Section 6
10
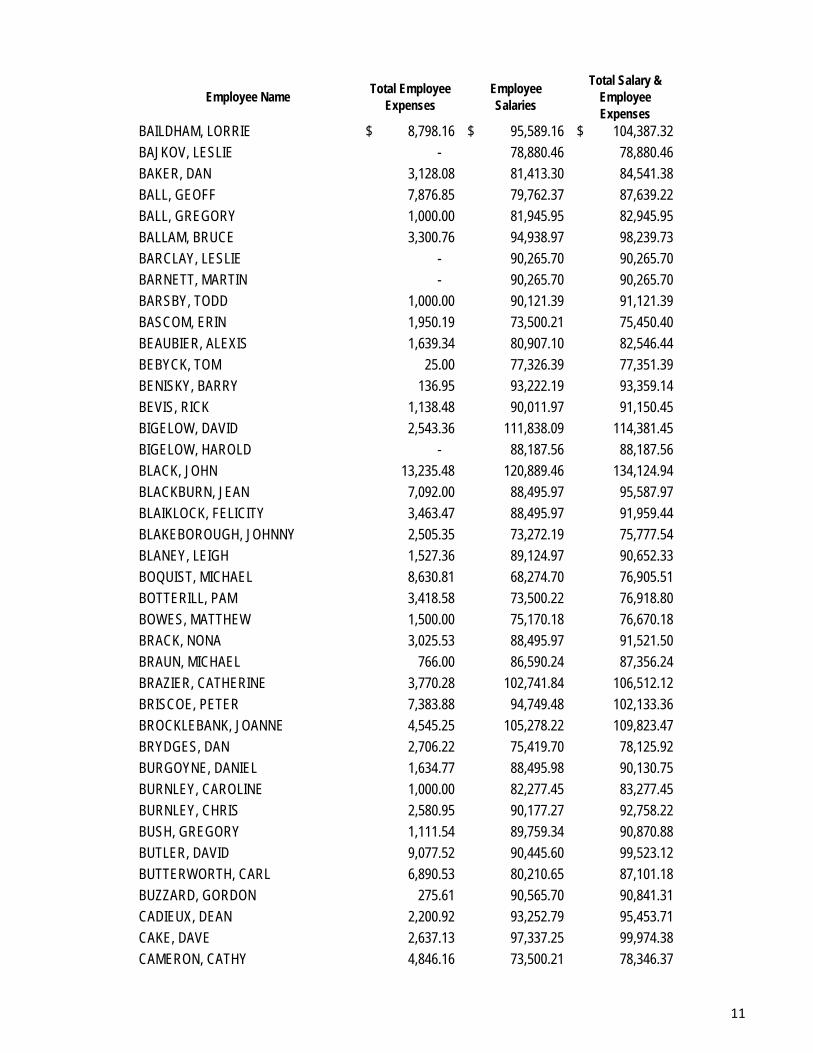
Employee NameTotal Employee
ExpensesEmployeeSalaries
Total Salary & Employee Expenses
BAILDHAM, LORRIE 8,798.16$ 95,589.16$ 104,387.32$
BAJKOV, LESLIE - 78,880.46 78,880.46
BAKER, DAN 3,128.08 81,413.30 84,541.38
BALL, GEOFF 7,876.85 79,762.37 87,639.22
BALL, GREGORY 1,000.00 81,945.95 82,945.95
BALLAM, BRUCE 3,300.76 94,938.97 98,239.73
BARCLAY, LESLIE - 90,265.70 90,265.70
BARNETT, MARTIN - 90,265.70 90,265.70
BARSBY, TODD 1,000.00 90,121.39 91,121.39
BASCOM, ERIN 1,950.19 73,500.21 75,450.40
BEAUBIER, ALEXIS 1,639.34 80,907.10 82,546.44
BEBYCK, TOM 25.00 77,326.39 77,351.39
BENISKY, BARRY 136.95 93,222.19 93,359.14
BEVIS, RICK 1,138.48 90,011.97 91,150.45
BIGELOW, DAVID 2,543.36 111,838.09 114,381.45
BIGELOW, HAROLD - 88,187.56 88,187.56
BLACK, JOHN 13,235.48 120,889.46 134,124.94
BLACKBURN, JEAN 7,092.00 88,495.97 95,587.97
BLAIKLOCK, FELICITY 3,463.47 88,495.97 91,959.44
BLAKEBOROUGH, JOHNNY 2,505.35 73,272.19 75,777.54
BLANEY, LEIGH 1,527.36 89,124.97 90,652.33
BOQUIST, MICHAEL 8,630.81 68,274.70 76,905.51
BOTTERILL, PAM 3,418.58 73,500.22 76,918.80
BOWES, MATTHEW 1,500.00 75,170.18 76,670.18
BRACK, NONA 3,025.53 88,495.97 91,521.50
BRAUN, MICHAEL 766.00 86,590.24 87,356.24
BRAZIER, CATHERINE 3,770.28 102,741.84 106,512.12
BRISCOE, PETER 7,383.88 94,749.48 102,133.36
BROCKLEBANK, JOANNE 4,545.25 105,278.22 109,823.47
BRYDGES, DAN 2,706.22 75,419.70 78,125.92
BURGOYNE, DANIEL 1,634.77 88,495.98 90,130.75
BURNLEY, CAROLINE 1,000.00 82,277.45 83,277.45
BURNLEY, CHRIS 2,580.95 90,177.27 92,758.22
BUSH, GREGORY 1,111.54 89,759.34 90,870.88
BUTLER, DAVID 9,077.52 90,445.60 99,523.12
BUTTERWORTH, CARL 6,890.53 80,210.65 87,101.18
BUZZARD, GORDON 275.61 90,565.70 90,841.31
CADIEUX, DEAN 2,200.92 93,252.79 95,453.71
CAKE, DAVE 2,637.13 97,337.25 99,974.38
CAMERON, CATHY 4,846.16 73,500.21 78,346.37
11

Employee NameTotal Employee
ExpensesEmployeeSalaries
Total Salary & Employee Expenses
CAMPBELL, BARBARA 750.00$ 86,068.75$ 86,818.75$
CAMPBELL, MADELAINE - 77,213.28 77,213.28
CARPENTER, PATRICK 1,000.00 88,495.97 89,495.97
CARPENTIER, SALLY 1,838.37 116,223.41 118,061.78
CARROLL, ANITA 1,762.35 88,495.97 90,258.32
CATHERS, DEVON 6,634.38 70,041.90 76,676.28
CEBULIAK, JIM - 90,265.70 90,265.70
CHACON, ENRIQUE 989.44 83,444.49 84,433.93
CHASSELS, CARRIE 19,017.98 134,008.88 153,026.86
CHASTER, WILLIAM 1,000.00 75,727.40 76,727.40
CHEUNG, STEVE - 88,107.86 88,107.86
CHICQUEN, KEITH 5,510.59 95,589.16 101,099.75
CHRISTOFFERSEN, JENNIFER 1,834.35 88,495.97 90,330.32
CHUANKAMNERDKARN, PATRICK 6,097.84 88,495.97 94,593.81
CHYPLYK, KRISTINE 13,648.81 66,540.57 80,189.38
CLEGG, JEREMY 3,502.75 95,569.40 99,072.15
CLEMENTS, STEPHEN 5,764.75 95,589.16 101,353.91
CLEMOTTE, OSCAR 1,000.00 88,695.97 89,695.97
COATES, JASON 8,193.53 89,789.74 97,983.27
COLE, JANE 1,000.00 93,422.97 94,422.97
COLLETTE, DANA 2,405.57 88,495.97 90,901.54
CONDIE, BRUCE 43,752.11 91,583.57 135,335.68
CONLIN, ARDITH 4,460.35 74,121.81 78,582.16
COOPER, JIM 454.40 78,018.46 78,472.86
COOPER, SHEILA 13,431.22 63,138.78 76,570.00
CORRIN, DOUG 1,564.63 88,238.50 89,803.13
COTE, DENIS 2,966.44 79,552.03 82,518.47
COWEN, GORDON - 90,265.70 90,265.70
COX, RIKI 1,000.00 88,495.97 89,495.97
CRAN, GREG 13,149.75 107,363.25 120,513.00
CRANMER, LAURA 1,000.00 90,684.46 91,684.46
CRUICKSHANKS, NADINE 6,569.73 88,495.98 95,065.71
CUMBERS, ALAN 2,015.10 134,008.88 136,023.98
DALAGER, SHANE 2,906.09 74,697.82 77,603.91
DAMES, SHANNON 4,326.60 86,656.62 90,983.22
DAOUST, MICHELLE 1,670.00 88,495.97 90,165.97
DAS, ANUPAM 1,000.00 89,632.98 90,632.98
DAVIDSON, SHARON 4,057.44 73,130.61 77,188.05
DAVIES, ROBIN 1,343.77 96,768.30 98,112.07
DAVIES, STEPHEN 2,920.04 88,495.97 91,416.01
12

Employee NameTotal Employee
ExpensesEmployeeSalaries
Total Salary & Employee Expenses
DAVIS, TREVOR 1,266.50$ 77,816.94$ 79,083.44$
DE LA BARRE, SUZANNE 3,842.01 93,772.52 97,614.53
DELAMERE, TOM 2,390.87 97,100.70 99,491.57
DEMERS, HELENE 4,754.16 119,830.42 124,584.58
DERBY, BRENDAN - 90,265.70 90,265.70
DERKSEN, TERI 3,562.49 81,792.31 85,354.80
DESILETS, CAROL 5,415.51 100,629.09 106,044.60
DIAMENTE, PETER 1,000.00 74,528.22 75,528.22
DICK, BRIAN 6,467.92 104,729.99 111,197.91
DOUGHTY, TERRI 4,000.00 94,918.08 98,918.08
DOUGLAS, DOUGLAS 862.72 81,268.10 82,130.82
DOWN, MICHAEL 1,661.44 90,446.62 92,108.06
DRURY, DAVID 118.13 92,137.90 92,256.03
DUDAS, SARAH 5,792.44 88,495.97 94,288.41
DUFF, STEFANIE 1,640.00 104,220.17 105,860.17
DUTCHUK, MARK - 86,211.93 86,211.93
DYKEMAN, BROCK 11,559.72 73,740.44 85,300.16
EASTON, GINA 719.23 81,715.47 82,434.70
EBY, EIKO 1,066.00 98,996.24 100,062.24
ECCLES, LIZ - 82,433.49 82,433.49
EDMONDSON, GORDON 1,260.00 76,970.07 78,230.07
EGAN, MARK 3,178.25 73,500.21 76,678.46
EGELAND, ERIN 5,195.90 98,770.19 103,966.09
ERGASHEVA, MAK 7,088.26 69,108.78 76,197.04
EVELEIGH, DARREN 15,067.36 89,789.74 104,857.10
FALVAI, JOANNE 4,539.55 90,390.97 94,930.52
FARRANT, SUSAN 7,016.95 75,318.99 82,335.94
FERGUSON, ROB 7,259.78 92,413.19 99,672.97
FISHER, PAIGE 19,805.87 88,495.97 108,301.84
FOOTE, CHRIS 1,583.40 95,564.32 97,147.72
FORD, JENNIFER 1,750.00 93,104.62 94,854.62
FORRESTER, DAVID 3,916.01 78,880.46 82,796.47
FOSTER, JACQUELINE - 89,333.49 89,333.49
FOSTER, PATRICK 1,269.59 81,792.31 83,061.90
FOX, SABRINA 380.60 75,018.22 75,398.82
FRIESEN, DUANE 1,898.96 92,688.62 94,587.58
FUNK, MARILYN 1,621.98 93,993.94 95,615.92
GABLER, JOERG - 90,818.12 90,818.12
GALLANT, MAURICE 1,544.33 90,265.70 91,810.03
GANASSIN, ROSEMARIE 1,000.00 81,692.55 82,692.55
13

Employee NameTotal Employee
ExpensesEmployeeSalaries
Total Salary & Employee Expenses
GARDINER, ELIZA 4,015.28$ 74,658.39$ 78,673.67$
GEORGE, DOUGLAS - 78,101.80 78,101.80
GIBLER, JULIE 777.36 88,495.97 89,273.33
GILCHRIST, ALAN 1,000.00 88,495.97 89,495.97
GILL, CHRIS 11,204.44 98,543.75 109,748.19
GILLIS, LIZ 2,730.37 107,073.24 109,803.61
GILLIS, TRACY 3,119.13 87,159.06 90,278.19
GIRARD, MICHAEL - 90,657.20 90,657.20
GOATER, TIM 1,000.00 89,064.47 90,064.47
GOVER, LAURA 1,153.57 73,939.75 75,093.32
GOVOROV, MICHAEL 3,457.36 88,495.97 91,953.33
GOWER, RITA 1,001.20 81,781.12 82,782.32
GREENWAY, SARAH 5,161.63 88,823.38 93,985.01
GRESS, JASON 2,361.47 89,238.63 91,600.10
GRIEVE, SHEILA 4,266.62 89,443.47 93,710.09
GULBRANSON, BURKE 1,961.62 83,654.42 85,616.04
HAGAN, SANDRA 1,000.00 88,874.97 89,874.97
HAIME, COLIN - 92,285.97 92,285.97
HALLAM, MICHAEL 7,643.75 90,265.70 97,909.45
HAMILTON, NANCY 3,011.34 79,236.52 82,247.86
HANNESSON, DARREN 1,000.00 115,729.53 116,729.53
HANNESSON, TERESA 2,685.80 90,995.97 93,681.77
HANSON, CRAIG 511.86 89,418.60 89,930.46
HARAPNUK, EILEEN 2,457.18 76,561.64 79,018.82
HARPER, KEN 443.33 89,877.53 90,320.86
HASAN, SHAHRIAR 2,076.23 88,495.97 90,572.20
HASSIB, ASHRAF 5,309.55 88,874.97 94,184.52
HAWAMDEH, MOHAMMED 1,572.48 76,424.26 77,996.74
HAYDEN, KATHLEEN 2,822.47 89,789.74 92,612.21
HEARN, DEBORAH 1,000.00 92,394.25 93,394.25
HEESE, BRIAN 2,478.32 81,034.31 83,512.63
HEIKKILA, RICK 1,420.36 95,033.21 96,453.57
HERNANDEZ, MERCEDES 1,000.00 91,777.65 92,777.65
HESKETH, JOANNA 3,824.37 88,631.32 92,455.69
HILL, JOHN 1,000.00 93,993.95 94,993.95
HINBEST, JERRY 3,395.36 93,233.48 96,628.84
HINDE, JOHN 1,000.00 88,495.97 89,495.97
HOBENSHIELD, SHARON 11,780.83 95,689.16 107,469.99
HOLDING, SARAH 8,747.55 68,786.14 77,533.69
HOLLENBERG, ANDREW 1,961.00 93,280.45 95,241.45
14
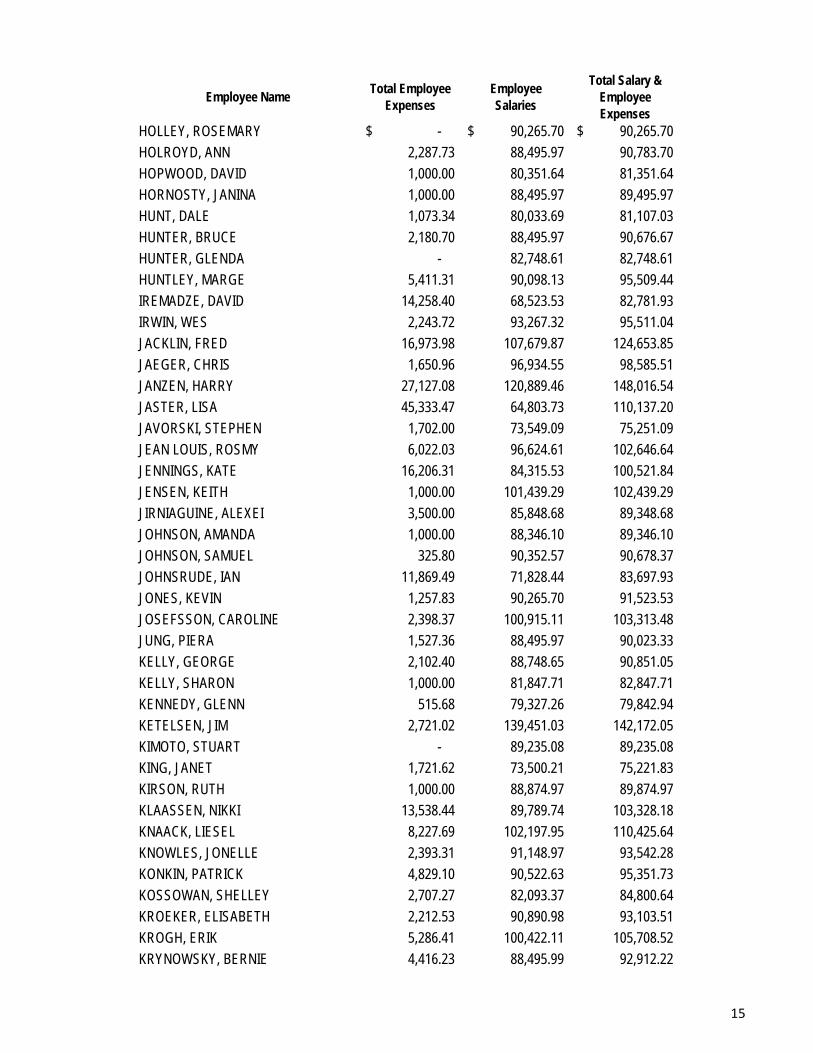
Employee NameTotal Employee
ExpensesEmployeeSalaries
Total Salary & Employee Expenses
HOLLEY, ROSEMARY -$ 90,265.70$ 90,265.70$
HOLROYD, ANN 2,287.73 88,495.97 90,783.70
HOPWOOD, DAVID 1,000.00 80,351.64 81,351.64
HORNOSTY, JANINA 1,000.00 88,495.97 89,495.97
HUNT, DALE 1,073.34 80,033.69 81,107.03
HUNTER, BRUCE 2,180.70 88,495.97 90,676.67
HUNTER, GLENDA - 82,748.61 82,748.61
HUNTLEY, MARGE 5,411.31 90,098.13 95,509.44
IREMADZE, DAVID 14,258.40 68,523.53 82,781.93
IRWIN, WES 2,243.72 93,267.32 95,511.04
JACKLIN, FRED 16,973.98 107,679.87 124,653.85
JAEGER, CHRIS 1,650.96 96,934.55 98,585.51
JANZEN, HARRY 27,127.08 120,889.46 148,016.54
JASTER, LISA 45,333.47 64,803.73 110,137.20
JAVORSKI, STEPHEN 1,702.00 73,549.09 75,251.09
JEAN LOUIS, ROSMY 6,022.03 96,624.61 102,646.64
JENNINGS, KATE 16,206.31 84,315.53 100,521.84
JENSEN, KEITH 1,000.00 101,439.29 102,439.29
JIRNIAGUINE, ALEXEI 3,500.00 85,848.68 89,348.68
JOHNSON, AMANDA 1,000.00 88,346.10 89,346.10
JOHNSON, SAMUEL 325.80 90,352.57 90,678.37
JOHNSRUDE, IAN 11,869.49 71,828.44 83,697.93
JONES, KEVIN 1,257.83 90,265.70 91,523.53
JOSEFSSON, CAROLINE 2,398.37 100,915.11 103,313.48
JUNG, PIERA 1,527.36 88,495.97 90,023.33
KELLY, GEORGE 2,102.40 88,748.65 90,851.05
KELLY, SHARON 1,000.00 81,847.71 82,847.71
KENNEDY, GLENN 515.68 79,327.26 79,842.94
KETELSEN, JIM 2,721.02 139,451.03 142,172.05
KIMOTO, STUART - 89,235.08 89,235.08
KING, JANET 1,721.62 73,500.21 75,221.83
KIRSON, RUTH 1,000.00 88,874.97 89,874.97
KLAASSEN, NIKKI 13,538.44 89,789.74 103,328.18
KNAACK, LIESEL 8,227.69 102,197.95 110,425.64
KNOWLES, JONELLE 2,393.31 91,148.97 93,542.28
KONKIN, PATRICK 4,829.10 90,522.63 95,351.73
KOSSOWAN, SHELLEY 2,707.27 82,093.37 84,800.64
KROEKER, ELISABETH 2,212.53 90,890.98 93,103.51
KROGH, ERIK 5,286.41 100,422.11 105,708.52
KRYNOWSKY, BERNIE 4,416.23 88,495.99 92,912.22
15

Employee NameTotal Employee
ExpensesEmployeeSalaries
Total Salary & Employee Expenses
KUBOTA, SAYURI 6,439.12$ 90,265.70$ 96,704.82$
KURULAK, DONNA 1,000.00 96,879.25 97,879.25
L'ABBE, SONNET 6,447.87 74,298.82 80,746.69
LANE, BRENDA 2,971.86 92,865.31 95,837.17
LANE, RICHARD 1,000.00 88,495.97 89,495.97
LANE, SARAH - 90,265.70 90,265.70
LANE, STEVE 6,303.48 144,013.37 150,316.85
LATULIPPE, JOHAN - 102,326.20 102,326.20
LAVOIE, CARMEN 1,643.40 86,656.62 88,300.02
LE MASURIER, GUY 2,045.41 91,906.97 93,952.38
LEAF, SCOTT 1,000.00 91,026.12 92,026.12
LEAVITT, TOM - 90,265.70 90,265.70
LEEMAN, KAREN 1,212.64 85,174.04 86,386.68
LEGIN, SHELLEY 40,557.86 165,507.93 206,065.79
LEITH, HOPE 635.08 97,061.37 97,696.45
LEPAGE, JOHN 1,000.00 81,847.50 82,847.50
LESEMANN, JEROME 2,334.55 80,018.94 82,353.49
LEVINS, KEVIN 7,399.02 91,179.20 98,578.22
LEWIS, JEFF 1,000.00 89,192.50 90,192.50
LEWIS, RICHARD 6,264.06 102,197.95 108,462.01
LEWIS, TIMOTHY 1,784.23 89,253.97 91,038.20
LIN, ANDY 7,228.26 99,496.96 106,725.22
LINDSAY, BRANDON 4,399.05 83,631.70 88,030.75
LITCHFIELD, WILLIAM 13,044.58 129,686.01 142,730.59
LITTLEJOHN, DEANNA - 87,993.71 87,993.71
LITVA, KATARINA 1,343.15 86,656.62 87,999.77
LIU, HUI (JOY) 2,023.70 91,527.97 93,551.67
LIU, HUIZHU 1,000.00 98,306.15 99,306.15
LIVINGSTONE, DAVID 8,399.73 98,121.84 106,521.57
LLOYD, JASON 641.52 75,698.19 76,339.71
LLOYD, SUSAN - 77,004.34 77,004.34
LORD, JOANNA 430.36 78,814.69 79,245.05
LUMSDEN, SHELLEY 3,655.91 73,500.21 77,156.12
MACCOLL, MICHAEL - 119,753.00 119,753.00
MACHAJ, ANNA 15,388.20 134,070.49 149,458.69
MACKAY, ROSS 11,606.00 120,889.46 132,495.46
MACMILLAN, NEIL 2,952.48 101,205.22 104,157.70
MACQUEEN, BARB 118.24 88,389.71 88,507.95
MACSWEEN, NORMA 3,197.14 109,161.68 112,358.82
MAGEE-CHALMERS, JESSIE 9,993.40 100,317.98 110,311.38
16

Employee NameTotal Employee
ExpensesEmployeeSalaries
Total Salary & Employee Expenses
MAKEPEACE, MYRON 1,000.00$ 88,495.97$ 89,495.97$
MAKEPEACE-DORE, MAUREEN 1,644.88 86,639.33 88,284.21
MALBON, LES 1,100.00 93,210.64 94,310.64
MALTESEN, JEAN 12,530.42 121,815.81 134,346.23
MARCHANT, ELLIOTT - 83,418.97 83,418.97
MARTENS, MARTIN 1,288.29 123,452.26 124,740.55
MARTIN, JEANNIE 1,000.00 82,955.60 83,955.60
MARTINFLATT, ASHLEIGH 4,178.26 88,495.98 92,674.24
MARTTALA, RAIMO (750.00) 76,074.42 75,324.42
MASSON, CYNTHEA 1,600.00 88,495.97 90,095.97
MATHESON, DEBORAH 6,468.90 115,507.57 121,976.47
MATHESON, KATHLEEN 2,705.61 90,265.70 92,971.31
MATTAR, LOUIS 1,136.85 82,600.68 83,737.53
MAYONA, LEMUEL 9,343.06 68,274.70 77,617.76
MAZUTINEC, KEVIN 1,972.75 73,054.47 75,027.22
MCCARTNEY, MICKI 4,453.90 77,728.78 82,182.68
MCCLUSKEY, ELLEN 1,723.80 92,285.98 94,009.78
MCCOMB, TINA 3,136.39 102,197.95 105,334.34
MCCRAE, LORNA 2,077.37 84,357.40 86,434.77
MCFARLAND, DANA 5,252.90 88,495.97 93,748.87
MCGRAIL, JUSTIN 1,343.77 89,632.97 90,976.74
MCKAY, BRENDA 8,993.08 126,079.05 135,072.13
MCKINNON, SHERRI - 90,265.70 90,265.70
MCLAREN, RHONDA 437.72 93,007.27 93,444.99
MCLEAN, DOUG - 90,266.27 90,266.27
MCLIN, ELIZABETH 10,236.44 82,678.89 92,915.33
MCVEIGH, COLLEEN 4,419.09 89,632.97 94,052.06
MCWHIRTER, JOY - 90,265.70 90,265.70
MEIJER DREES, LAURIE 1,000.00 93,143.97 94,143.97
MERNER, JENNIFER 1,000.00 89,347.00 90,347.00
METCALF, BARBARA 1,567.36 81,284.31 82,851.67
MILLARD, LORNA 1,461.91 88,765.41 90,227.32
MIZUNO, RITA - 90,265.70 90,265.70
MOHABEER, RAVINDRA 1,009.88 91,019.97 92,029.85
MOLONEY, MARY ANNE 6,828.06 108,871.95 115,700.01
MOORE, WILLIAM - 78,056.30 78,056.30
MORESIDE, SANDRA 631.04 90,265.70 90,896.74
MORGAN, JOHN 1,444.33 101,901.17 103,345.50
MOTTERSHEAD, PAUL 8,296.20 102,197.95 110,494.15
MUSTAFA, SAMEER 4,471.21 89,253.97 93,725.18
17

Employee NameTotal Employee
ExpensesEmployeeSalaries
Total Salary & Employee Expenses
NACHTSHEIM, SUZY 178.37$ 90,265.70$ 90,444.07$
NAESCHKE, RITA 420.00 76,360.21 76,780.21
NEILSON, LINDA - 87,657.45 87,657.45
NELSON, BRANDON 4,576.42 70,607.46 75,183.88
NETHERTON, ALEXANDER 1,000.00 83,753.56 84,753.56
NG, PATRICK 1,026.00 98,231.44 99,257.44
NICOL, JEFFREY 1,000.00 105,048.97 106,048.97
NILSON, RALPH 75,131.93 212,902.28 288,034.21
NILSON, SUZANNE 2,355.23 90,138.30 92,493.53
NOAKES, DON 5,342.99 125,503.18 130,846.17
NOAKES, JAMIE 7,978.27 75,534.27 83,512.54
NOHR, LARRY 199.17 93,658.82 93,857.99
NOLAN, DAVID 790.68 86,171.88 86,962.56
NOYON, MARK 3,974.52 90,595.40 94,569.92
O'CONNOR, MAUREEN 2,806.56 88,495.97 91,302.53
OKUN, MAUREEN 2,404.27 98,666.84 101,071.11
ONCESCU, JACKIE 1,220.45 105,553.78 106,774.23
O'NEILL, MARY 2,684.88 88,745.98 91,430.86
O'NEILL, MELANIE 1,000.00 90,325.30 91,325.30
OSBORNE, LESLEY 19,511.86 59,777.60 79,289.46
O'SHEA, MICHAEL 3,397.35 94,660.57 98,057.92
O'TOOLE, SHAWN 1,000.00 88,495.97 89,495.97
PAGE, NANCY 1,461.91 89,632.97 91,094.88
PALM, JUDY - 96,176.55 96,176.55
PAPROSKI, DARREN 8,021.48 116,862.17 124,883.65
PARKER, PETE 5,400.50 95,543.13 100,943.63
PARTYKA, JOHN - 78,880.46 78,880.46
PASTRO, HEATHER 2,995.84 88,495.98 91,491.82
PATOLA, ELIZABETH 527.36 84,718.23 85,245.59
PEARCE, BROOK 6,838.42 71,086.90 77,925.32
PELLEY, STEPHEN 1,311.87 94,159.82 95,471.69
PENNER, RAYMOND 3,814.95 96,925.17 100,740.12
PEPPER-SMITH, ROBERT 1,000.00 90,769.98 91,769.98
PEREZA ROLLS, TINA 527.36 90,995.97 91,523.33
PEVEC, ALEXANDER 1,918.00 95,797.55 97,715.55
PICHE, MARIE 1,955.49 86,472.75 88,428.24
PIKE, GRAHAM 30,375.93 123,668.52 154,044.45
POTTER, LEON 2,126.22 94,180.98 96,307.20
PREDYK, JOHN 1,000.00 89,253.97 90,253.97
PRICE, COLLEEN 1,527.36 77,334.16 78,861.52
18
Employee NameTotal Employee
ExpensesEmployeeSalaries
Total Salary & Employee Expenses
PRIESTMAN, SCOTT 1,010.88$ 74,456.61$ 75,467.49$
PRUESSE, GARA 1,204.02 91,527.97 92,731.99
PUGH, GLEN 1,000.00 110,669.09 111,669.09
PURSE, STEVEN 1,511.91 109,879.56 111,391.47
PUSHOR, DARYL 810.58 76,350.67 77,161.25
PUTZ, DON 3,537.38 89,789.74 93,327.12
PYNN, DANA - 81,634.21 81,634.21
RAMEY, CAROL - 88,749.58 88,749.58
RANDALL, CARLEIGH 5,420.59 74,307.11 79,727.70
RASMUSSEN, LEIF 2,617.18 79,906.49 82,523.67
READ, MICHAEL 4,754.93 102,022.03 106,776.96
REED, JANINE 1,905.34 286,566.76 288,472.10
REED, KATHLEEN 1,332.94 87,349.52 88,682.46
REES, DAVID 4,447.22 109,161.68 113,608.90
REIMER, BRAD 1,730.03 89,506.64 91,236.67
REIMERS, TINE 1,055.12 88,495.97 89,551.09
REMBOLD, DIANE 3,038.53 79,923.10 82,961.63
RICHARDS, MARY ANN 1,375.00 80,817.02 82,192.02
RIEDEL, MARIAN 1,751.46 86,656.61 88,408.07
RIGGAN, ROBERT - 88,495.97 88,495.97
ROBERSON, BILL 1,136.85 88,495.97 89,632.82
ROBERTSON, TONY 450.00 91,527.97 91,977.97
ROBICHAUD, JEAN-GUY 3,944.75 88,495.97 92,440.72
ROBINSON, DAVID 5,528.29 93,400.67 98,928.96
ROBINSON, LYNDA 1,985.28 75,417.34 77,402.62
RODEN, MARIANNE 469.86 89,222.91 89,692.77
ROLLISON, LYNN 4,765.21 96,746.95 101,512.16
ROLLWAGEN, KATHARINE 3,389.94 73,170.09 76,560.03
ROSE, LEANNE 4,329.08 81,847.50 86,176.58
ROTH VON SZEPESBELA, KATRIN 3,573.37 87,172.81 90,746.18
RUSSELL, BONITA 5,216.23 119,515.27 124,731.50
RUSSELL, SPENCER 1,600.00 87,414.62 89,014.62
RUZESKY, JAY 2,822.60 95,418.29 98,240.89
SACKEY, HARRY 1,793.09 111,285.20 113,078.29
SANDERS, SUSAN 1,000.00 102,903.84 103,903.84
SANRUD, HEATHER 2,064.96 88,495.99 90,560.95
SCHELL, CHARLES 1,000.00 94,516.69 95,516.69
SCHEWE, ERIC 3,876.99 74,190.50 78,067.49
SCHROEDER, JOANNE 6,512.74 71,056.33 77,569.07
SCHULTZ, DEANNE 1,000.00 88,495.97 89,495.97
19

Employee NameTotal Employee
ExpensesEmployeeSalaries
Total Salary & Employee Expenses
SCOW, SYLVIA 6,594.63$ 70,358.85$ 76,953.48$
SEINEN, ALBERT 1,565.36 88,496.32 90,061.68
SHARDLOW, SUE - 90,265.70 90,265.70
SHAW, PAM 5,119.80 92,763.12 97,882.92
SHORE, DEBBIE 4,121.36 90,265.70 94,387.06
SIFTON, DANIEL 4,440.73 88,495.97 92,936.70
SIMONS, DANIEL 1,000.00 109,070.47 110,070.47
SINCLAIR, JANET 2,260.52 87,080.45 89,340.97
SITTER, RON 4,158.20 113,984.20 118,142.40
SKIPSEY, JOE 888.75 90,265.70 91,154.45
SLOCUM, JOANNE 814.66 78,322.35 79,137.01
SLONOWSKY, DEAN - 92,782.25 92,782.25
SMILSKI, ANDREA 3,998.27 107,042.47 111,040.74
SMITH, ELFIE 9,600.93 84,732.19 94,333.12
SMITH, KEITH 1,000.00 102,105.57 103,105.57
SMITH, TONI 1,000.00 77,694.64 78,694.64
SNOW, KATHRYN 11,887.88 73,500.21 85,388.09
SPEED, ANDREW 13,478.28 95,589.16 109,067.44
SPEIGHT, PAMELA 1,104.56 93,043.97 94,148.53
SPRONK, TERRI 1,804.22 75,193.33 76,997.55
STAJIC, JANINA 7,903.40 78,878.83 86,782.23
STANLEY, MARNI 1,000.00 109,849.83 110,849.83
STASIUK, MARY 1,000.00 88,495.97 89,495.97
STEEL, MICHELLE 1,000.00 88,495.97 89,495.97
STEEN, GLYNIS 4,698.21 113,313.59 118,011.80
STEPHENS, MELISSA 1,017.16 82,022.52 83,039.68
STERN, LOUISE 2,556.20 93,793.62 96,349.82
STETAR, DOUG 1,000.00 80,144.98 81,144.98
STEWART, CHARLENE 436.85 90,265.70 90,702.55
STEWART, JANICE 2,473.86 90,794.44 93,268.30
STOKES, TIM 2,554.04 89,783.62 92,337.66
STREMMING, AL 6,950.81 68,927.57 75,878.38
STUART, CAROL 11,172.63 125,916.05 137,088.68
SULLY, BRENDA 1,000.00 88,495.98 89,495.98
SUNDBY, LESLIE 7,958.51 88,495.97 96,454.48
SUSKI, LAURA 550.00 88,874.98 89,424.98
SUTTON, JASON 515.68 75,075.78 75,591.46
SWARTS, JACOBUS 1,000.00 92,621.15 93,621.15
SYLTE, KAREN 1,448.95 88,495.97 89,944.92
TAKISHITA, FAITH 1,000.00 88,495.97 89,495.97
20
Employee NameTotal Employee
ExpensesEmployeeSalaries
Total Salary & Employee Expenses
TALBOT, IAN -$ 90,011.93$ 90,011.93$
TAPLAY, ALISON 5,197.77 82,065.40 87,263.17
TAYLOR, DREW 1,201.03 86,876.84 88,077.87
TAYLOR, KAREN - 75,906.28 75,906.28
TESSIER, NATTALLE 3,482.30 72,968.55 76,450.85
THEUERKORN, FRANK 2,872.21 89,632.97 92,505.18
THIESSEN, ILKA 1,213.75 88,495.97 89,709.72
THOMAS, BARBARA 4,734.44 88,874.98 93,609.42
THOMPSON, DAWN 3,389.59 82,484.94 85,874.53
THOMSON, CATHERINE - 77,796.05 77,796.05
TILLEY, CARLA 1,584.36 90,893.83 92,478.19
TIMBERS, TAMARA 1,595.71 84,301.85 85,897.56
TOAL, SEAN 3,101.61 72,492.11 75,593.72
TONG, CHRISTINE 1,000.00 81,896.35 82,896.35
TORKKO, DEBORAH 1,712.62 89,632.97 91,345.59
TSISSEREV, ALEX 1,000.00 88,495.97 89,495.97
TURNER, CHRIS 4,903.65 77,788.86 82,692.51
TWYNAM, DAVE 15,573.48 120,889.46 136,462.94
UPPAL, MANJEET 2,818.96 88,874.97 91,693.93
VALLEE, MICHEL 3,707.52 88,748.65 92,456.17
VAUGEOIS, NICOLE 12,326.03 107,541.46 119,867.49
VINDEN, SALLY 22,825.89 86,346.87 109,172.76
WAGNER, WENDY 3,326.93 102,800.81 106,127.74
WAHL, SHARON 9,439.76 95,403.35 104,843.11
WALSH, PETER - 88,495.97 88,495.97
WARSH, CHERYL 1,653.05 88,874.97 90,528.02
WATKINS, PAUL 4,037.84 83,538.17 87,576.01
WATSON, JANE 1,000.00 107,122.96 108,122.96
WEAVER, DUANE 1,923.82 95,039.55 96,963.37
WEBBER, BRYAN 1,385.84 101,717.98 103,103.82
WEBER, KATHRYN - 90,265.70 90,265.70
WEBSTER, MARK 7,964.09 78,880.46 86,844.55
WEIGHILL, AGGIE 15,803.77 91,255.66 107,059.43
WEIR, WARREN 13,889.39 120,889.46 134,778.85
WEISSFLOCH, ALEXANDRA 2,264.51 98,160.35 100,424.86
WESSELS, DAVID 750.00 94,165.78 94,915.78
WHITE, ALI 13,004.66 78,880.46 91,885.12
WHITE, DOUGLAS 1,487.25 99,991.36 101,478.61
WHITEHOUSE, IAN 3,528.20 119,443.03 122,971.23
WHITELEY, SARAH 2,218.02 72,980.76 75,198.78
21

Employee NameTotal Employee
ExpensesEmployeeSalaries
Total Salary & Employee Expenses
WILKINSON, JIM 1,366.81$ 88,495.97$ 89,862.78$
WILLIAMS, ALANNA 1,000.00 94,632.98 95,632.98
WILLIAMS, MARK 1,000.00 85,183.44 86,183.44
WILLIS, ROBERT 1,286.78 97,967.91 99,254.69
WILSON, HANNAH 1,695.98 94,797.08 96,493.06
WITTY, DAVID 31,993.65 168,507.93 200,501.58
WOODWARD, DAVID 5,194.33 72,775.84 77,970.17
WOYCHUK, JOHN 5,301.61 73,348.51 78,650.12
WYTENBROEK, LYNN 7,006.70 102,174.27 109,180.97
YOUNG, TRICIA 907.83 88,539.39 89,447.22
YOUNG, WENDY 3,074.23 120,889.46 123,963.69
ZANDBERGEN, PAUL 1,000.00 89,882.69 90,882.69
ZANDEE, TRACY 1,164.37 75,666.27 76,830.64
TOTAL SALARIES & EMPLOYEE EXPENSES $75,000 OR MORE $ 1,811,362.73 $ 43,491,397.77 $ 45,302,760.50
TOTAL SALARIES & EMPLOYEE EXPENSES UNDER $75,000 $ 1,065,433.78 $ 36,762,127.74 $ 37,827,561.52
GRAND TOTAL: SALARIES & EMPLOYEE EXPENSES $ 2,876,796.51 $ 80,253,525.51 $ 83,130,322.02
22
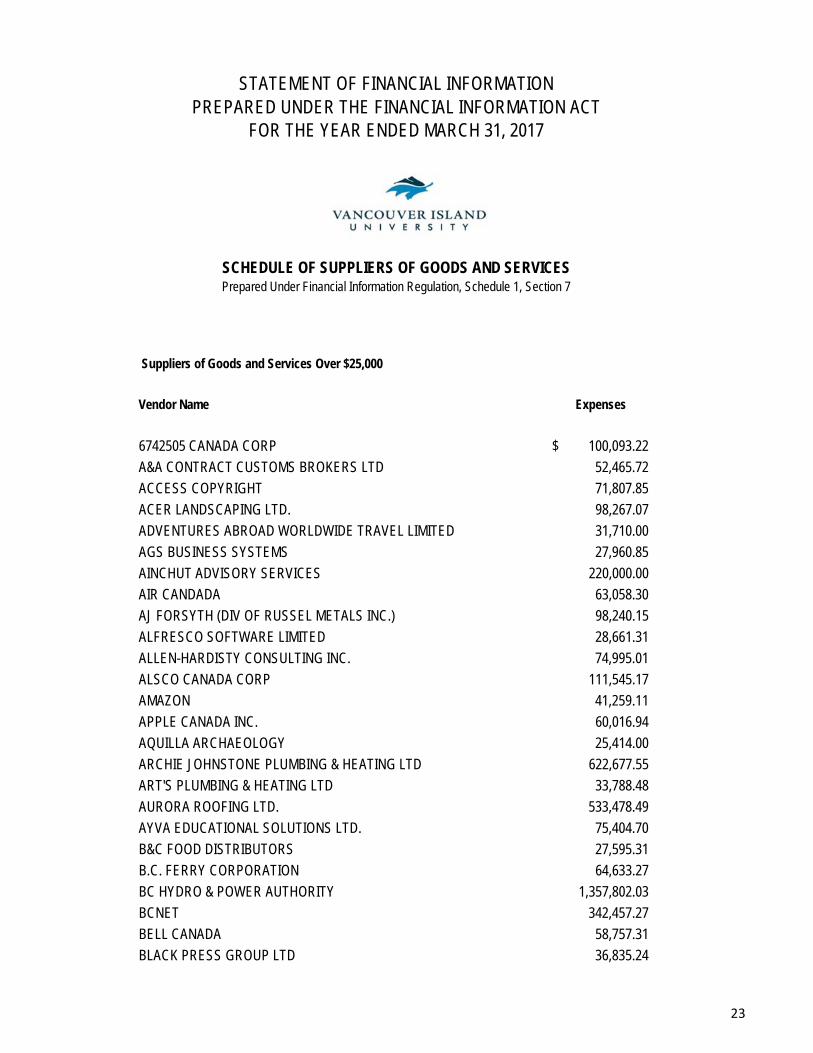
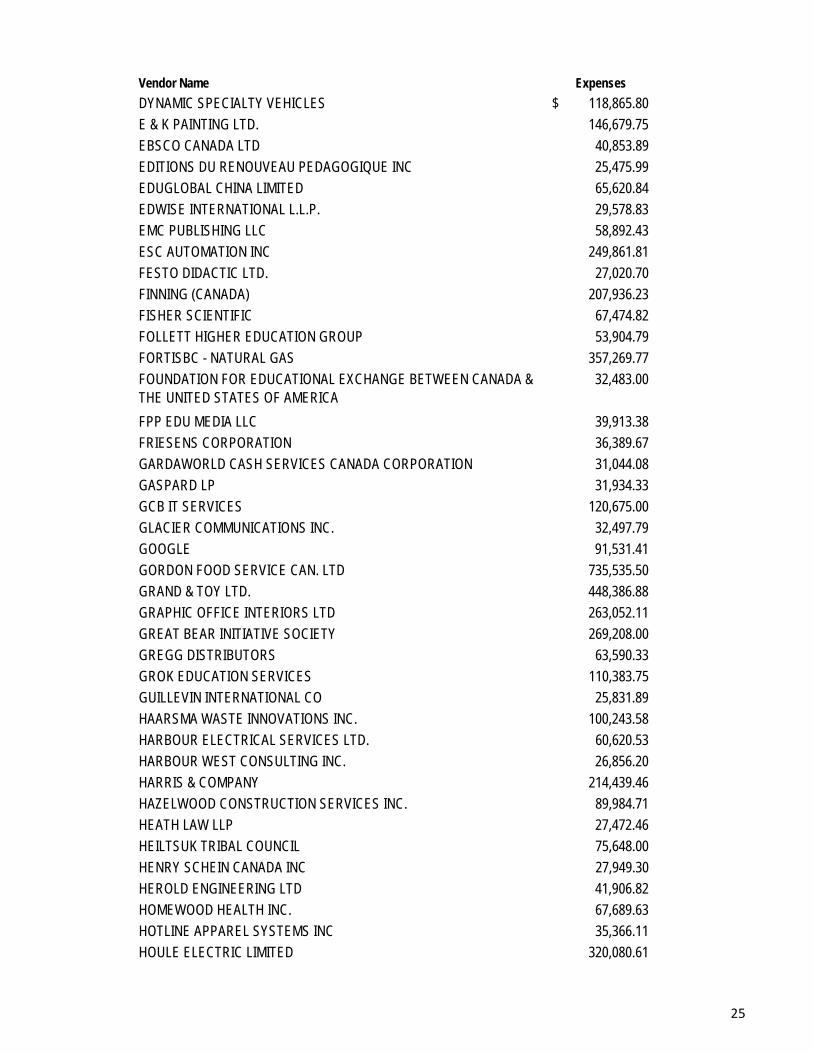
Suppliers of Goods and Services Over $25,000
Vendor Name Expenses
6742505 CANADA CORP 100,093.22$
A&A CONTRACT CUSTOMS BROKERS LTD 52,465.72
ACCESS COPYRIGHT 71,807.85
ACER LANDSCAPING LTD. 98,267.07
ADVENTURES ABROAD WORLDWIDE TRAVEL LIMITED 31,710.00
AGS BUSINESS SYSTEMS 27,960.85
AINCHUT ADVISORY SERVICES 220,000.00
AIR CANDADA 63,058.30
AJ FORSYTH (DIV OF RUSSEL METALS INC.) 98,240.15
ALFRESCO SOFTWARE LIMITED 28,661.31
ALLEN-HARDISTY CONSULTING INC. 74,995.01
ALSCO CANADA CORP 111,545.17
AMAZON 41,259.11
APPLE CANADA INC. 60,016.94
AQUILLA ARCHAEOLOGY 25,414.00
ARCHIE JOHNSTONE PLUMBING & HEATING LTD 622,677.55
ART'S PLUMBING & HEATING LTD 33,788.48
AURORA ROOFING LTD. 533,478.49
AYVA EDUCATIONAL SOLUTIONS LTD. 75,404.70
B&C FOOD DISTRIBUTORS 27,595.31
B.C. FERRY CORPORATION 64,633.27
BC HYDRO & POWER AUTHORITY 1,357,802.03
BCNET 342,457.27
BELL CANADA 58,757.31
BLACK PRESS GROUP LTD 36,835.24
STATEMENT OF FINANCIAL INFORMATIONPREPARED UNDER THE FINANCIAL INFORMATION ACT
FOR THE YEAR ENDED MARCH 31, 2017
SCHEDULE OF SUPPLIERS OF GOODS AND SERVICESPrepared Under Financial Information Regulation, Schedule 1, Section 7
23
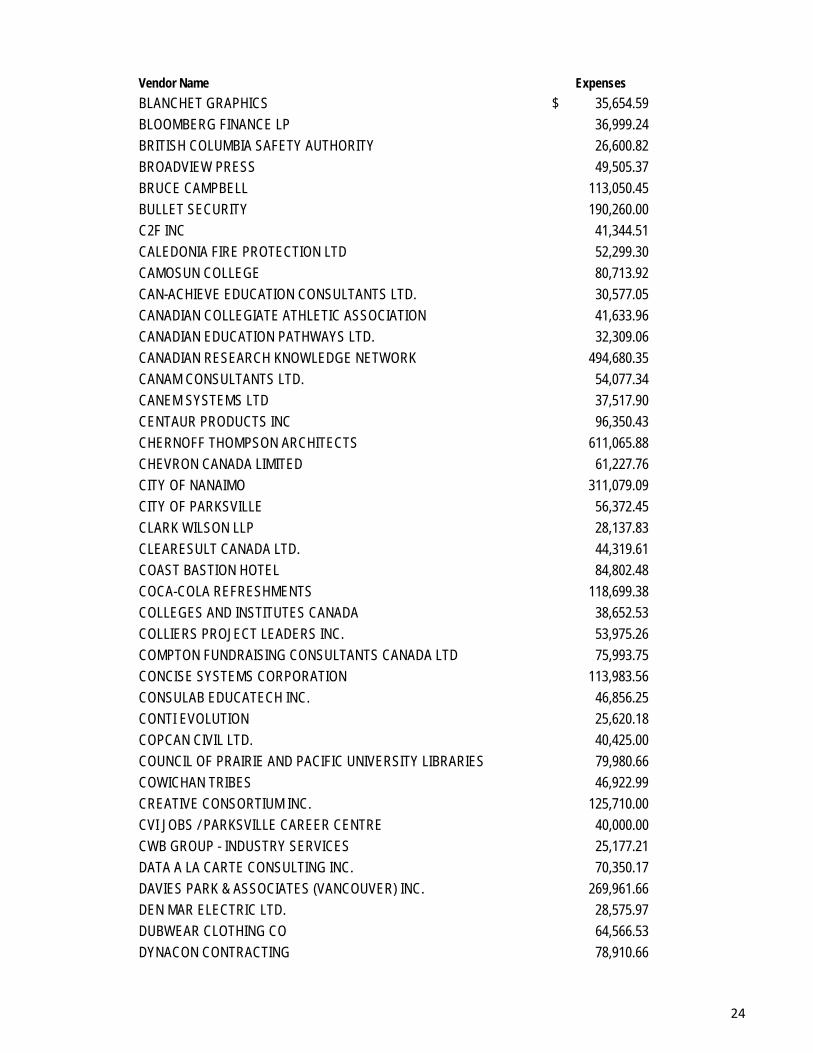
Vendor Name Expenses
BLANCHET GRAPHICS 35,654.59$
BLOOMBERG FINANCE LP 36,999.24
BRITISH COLUMBIA SAFETY AUTHORITY 26,600.82
BROADVIEW PRESS 49,505.37
BRUCE CAMPBELL 113,050.45
BULLET SECURITY 190,260.00
C2F INC 41,344.51
CALEDONIA FIRE PROTECTION LTD 52,299.30
CAMOSUN COLLEGE 80,713.92
CAN-ACHIEVE EDUCATION CONSULTANTS LTD. 30,577.05
CANADIAN COLLEGIATE ATHLETIC ASSOCIATION 41,633.96
CANADIAN EDUCATION PATHWAYS LTD. 32,309.06
CANADIAN RESEARCH KNOWLEDGE NETWORK 494,680.35
CANAM CONSULTANTS LTD. 54,077.34
CANEM SYSTEMS LTD 37,517.90
CENTAUR PRODUCTS INC 96,350.43
CHERNOFF THOMPSON ARCHITECTS 611,065.88
CHEVRON CANADA LIMITED 61,227.76
CITY OF NANAIMO 311,079.09
CITY OF PARKSVILLE 56,372.45
CLARK WILSON LLP 28,137.83
CLEARESULT CANADA LTD. 44,319.61
COAST BASTION HOTEL 84,802.48
COCA-COLA REFRESHMENTS 118,699.38
COLLEGES AND INSTITUTES CANADA 38,652.53
COLLIERS PROJECT LEADERS INC. 53,975.26
COMPTON FUNDRAISING CONSULTANTS CANADA LTD 75,993.75
CONCISE SYSTEMS CORPORATION 113,983.56
CONSULAB EDUCATECH INC. 46,856.25
CONTI EVOLUTION 25,620.18
COPCAN CIVIL LTD. 40,425.00
COUNCIL OF PRAIRIE AND PACIFIC UNIVERSITY LIBRARIES 79,980.66
COWICHAN TRIBES 46,922.99
CREATIVE CONSORTIUM INC. 125,710.00
CVI JOBS / PARKSVILLE CAREER CENTRE 40,000.00
CWB GROUP - INDUSTRY SERVICES 25,177.21
DATA A LA CARTE CONSULTING INC. 70,350.17
DAVIES PARK & ASSOCIATES (VANCOUVER) INC. 269,961.66
DEN MAR ELECTRIC LTD. 28,575.97
DUBWEAR CLOTHING CO 64,566.53
DYNACON CONTRACTING 78,910.66
24
Vendor Name Expenses
DYNAMIC SPECIALTY VEHICLES 118,865.80$
E & K PAINTING LTD. 146,679.75
EBSCO CANADA LTD 40,853.89
EDITIONS DU RENOUVEAU PEDAGOGIQUE INC 25,475.99
EDUGLOBAL CHINA LIMITED 65,620.84
EDWISE INTERNATIONAL L.L.P. 29,578.83
EMC PUBLISHING LLC 58,892.43
ESC AUTOMATION INC 249,861.81
FESTO DIDACTIC LTD. 27,020.70
FINNING (CANADA) 207,936.23
FISHER SCIENTIFIC 67,474.82
FOLLETT HIGHER EDUCATION GROUP 53,904.79
FORTISBC - NATURAL GAS 357,269.77
FOUNDATION FOR EDUCATIONAL EXCHANGE BETWEEN CANADA & THE UNITED STATES OF AMERICA
32,483.00
FPP EDU MEDIA LLC 39,913.38
FRIESENS CORPORATION 36,389.67
GARDAWORLD CASH SERVICES CANADA CORPORATION 31,044.08
GASPARD LP 31,934.33
GCB IT SERVICES 120,675.00
GLACIER COMMUNICATIONS INC. 32,497.79
GOOGLE 91,531.41
GORDON FOOD SERVICE CAN. LTD 735,535.50
GRAND & TOY LTD. 448,386.88
GRAPHIC OFFICE INTERIORS LTD 263,052.11
GREAT BEAR INITIATIVE SOCIETY 269,208.00
GREGG DISTRIBUTORS 63,590.33
GROK EDUCATION SERVICES 110,383.75
GUILLEVIN INTERNATIONAL CO 25,831.89
HAARSMA WASTE INNOVATIONS INC. 100,243.58
HARBOUR ELECTRICAL SERVICES LTD. 60,620.53
HARBOUR WEST CONSULTING INC. 26,856.20
HARRIS & COMPANY 214,439.46
HAZELWOOD CONSTRUCTION SERVICES INC. 89,984.71
HEATH LAW LLP 27,472.46
HEILTSUK TRIBAL COUNCIL 75,648.00
HENRY SCHEIN CANADA INC 27,949.30
HEROLD ENGINEERING LTD 41,906.82
HOMEWOOD HEALTH INC. 67,689.63
HOTLINE APPAREL SYSTEMS INC 35,366.11
HOULE ELECTRIC LIMITED 320,080.61
25
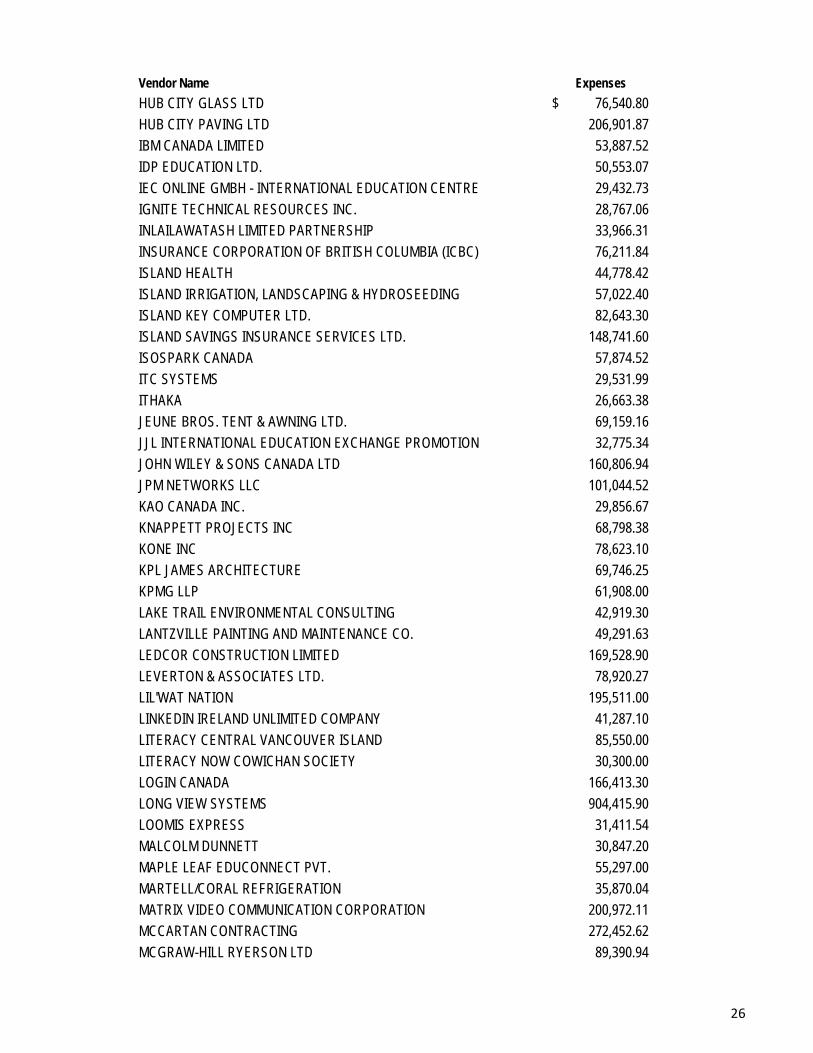
Vendor Name Expenses
HUB CITY GLASS LTD 76,540.80$
HUB CITY PAVING LTD 206,901.87
IBM CANADA LIMITED 53,887.52
IDP EDUCATION LTD. 50,553.07
IEC ONLINE GMBH - INTERNATIONAL EDUCATION CENTRE 29,432.73
IGNITE TECHNICAL RESOURCES INC. 28,767.06
INLAILAWATASH LIMITED PARTNERSHIP 33,966.31
INSURANCE CORPORATION OF BRITISH COLUMBIA (ICBC) 76,211.84
ISLAND HEALTH 44,778.42
ISLAND IRRIGATION, LANDSCAPING & HYDROSEEDING 57,022.40
ISLAND KEY COMPUTER LTD. 82,643.30
ISLAND SAVINGS INSURANCE SERVICES LTD. 148,741.60
ISOSPARK CANADA 57,874.52
ITC SYSTEMS 29,531.99
ITHAKA 26,663.38
JEUNE BROS. TENT & AWNING LTD. 69,159.16
JJL INTERNATIONAL EDUCATION EXCHANGE PROMOTION 32,775.34
JOHN WILEY & SONS CANADA LTD 160,806.94
JPM NETWORKS LLC 101,044.52
KAO CANADA INC. 29,856.67
KNAPPETT PROJECTS INC 68,798.38
KONE INC 78,623.10
KPL JAMES ARCHITECTURE 69,746.25
KPMG LLP 61,908.00
LAKE TRAIL ENVIRONMENTAL CONSULTING 42,919.30
LANTZVILLE PAINTING AND MAINTENANCE CO. 49,291.63
LEDCOR CONSTRUCTION LIMITED 169,528.90
LEVERTON & ASSOCIATES LTD. 78,920.27
LIL'WAT NATION 195,511.00
LINKEDIN IRELAND UNLIMITED COMPANY 41,287.10
LITERACY CENTRAL VANCOUVER ISLAND 85,550.00
LITERACY NOW COWICHAN SOCIETY 30,300.00
LOGIN CANADA 166,413.30
LONG VIEW SYSTEMS 904,415.90
LOOMIS EXPRESS 31,411.54
MALCOLM DUNNETT 30,847.20
MAPLE LEAF EDUCONNECT PVT. 55,297.00
MARTELL/CORAL REFRIGERATION 35,870.04
MATRIX VIDEO COMMUNICATION CORPORATION 200,972.11
MCCARTAN CONTRACTING 272,452.62
MCGRAW-HILL RYERSON LTD 89,390.94
26

Vendor Name Expenses
MERCEDES BENZ NANAIMO 64,788.45$
MICROSERVE 478,243.08
MINISTER OF FINANCE 271,550.44
MNP LLP 506,847.45
MONERIS SOLUTIONS 351,534.36
MONK OFFICE SUPPLY LTD 84,558.09
MONTROYAL CONTRACTING 114,758.65
MOUNT BENSON MECHANICAL (1991) 77,489.33
MPS 56,437.75
MY LOUD SPEAKER MARKETING CORPORATION 36,533.45
N & N CHOPRA CONSULTANTS PVT. LTD. 25,584.00
NANAIMO ECONOMIC DEVELOPMENT CORPORATION 34,257.25
NANAIMO MINUTE MEN 30,356.65
NANWAKOLAS COUNCIL 298,985.80
NEBRASKA BOOK COMPANY 80,635.54
NELSON EDUCATION LTD 467,797.35
NEOPOST CANADA LTD. 135,554.33
NEW GENERATION PRINTING 27,692.00
NORSTAN COMMUNICATIONS, INC 36,866.55
NORTH ISLAND COLLEGE 490,487.42
NUAIRE INC 36,831.23
OMAR KARIM 32,189.96
ORACLE CANADA ULC 146,884.34
ORGANIZATION FOR WORLDWIDE EDUCATION 333,010.21
ORIAC 31,802.09
ORYX SIMULATIONS AB 78,560.19
OUGHTRED COFFEE & TEA LTD. 52,771.09
OXFORD UNIVERSITY PRESS 99,649.33
PACIFIC PLUMBING & HEATING 40,162.33
PACWEST 31,541.59
PANGLOBAL TRAINING SYSTEMS LTD. 36,646.32
PARALAX CANADA 26,962.60
PARTNERS IN GRIME 34,559.70
PATTERSON DENTAL SUPPLY INC 49,167.38
PAYLESS BUILDING MAINTENANCE LTD 940,300.81
PEARSON EDUCATION CANADA 378,520.97
PENGUIN RANDOM HOUSE CANADA LIMITED 31,582.61
PERKINELMER HEALTH SCIENCES CANADA,INC. 193,951.82
PERKINS+WILL CANADA ARCHITECTS CO. 1,593,572.36
POST-SECONDARY EMPLOYERS' ASSOCIATION 25,042.14
POWELL RIVER EMPLOYMENT PROGRAM SOCIETY 36,796.80
27

Vendor Name Expenses
POWELL RIVER MAINTENANCE AND JANITORIAL 30,906.78$
PRAXAIR DISTRIBUTION 206,952.55
PRECISION DECORATING LTD. 72,182.25
PRICE'S ALARM SYSTEMS LTD 28,601.91
PROGRESSIVE EDUCATION SYSTEMS 54,772.44
PROQUEST LLC 180,351.91
PROTECT INTERNATIONAL INC. 34,644.75
PROVINCE OF BRITISH COLUMBIA 47,391.88
PUROLATOR COURIER LTD 38,337.96
PUTRENKO VIKTOR VALENTINOVICH 44,133.13
QUALITY FOODS 44,978.34
RAM ELECTRIC 47,271.47
RECTEC INDUSTRIES 30,114.00
RED WILLIAMS WELL DRILLING LTD. 248,568.93
RICHARD PAYNE 25,696.10
ROBERT HALF MANAGEMENT RESOURCES 27,110.50
ROGERS WIRELESS INC 135,894.19
SCALAR DECISIONS INC. 51,900.27
SCHOOL DISTRICT #68 NANAIMO 26,480.66
SECURCO SERVICES INC 79,810.73
SHANDONG INSTITUTE OF BUSINESS 86,527.19
SHARPER MARKETING INC 43,769.45
SHATEX MANUFACTURING CORP 46,342.21
SHELL ENERGY NORTH AMERICA (CANADA) INC. 131,930.08
SIMON FRASER UNIVERSITY 247,622.09
SIRSI/DYNIX 65,329.24
SMITH + ANDERSEN FALCON ENGINEERING LTD 96,862.50
SMITH TRANSPORTATION LTD 52,559.61
SNOW CAP ENTERPRISES LTD 79,336.20
SNUNEYMUXW FIRST NATION 53,025.00
SOFTCHOICE LP 48,811.91
SOULES CONSULTING LTD. 63,052.85
SPICERS CANADA ULC 43,796.12
SSA QUANTITY SURVEYORS LTD. 44,227.74
STANTEC CONSULTING LTD. 28,207.33
STAPLES BUSINESS ADVANTAGE CANADA 31,324.89
STARGARDEN CORPORATION 43,057.00
STRATEGY HOUSE INC. 45,609.96
STZ'UMINUS FIRST NATION 158,265.25
SYNNEX CANADA 35,119.58
SYSCO VICTORIA INC 152,435.34
28
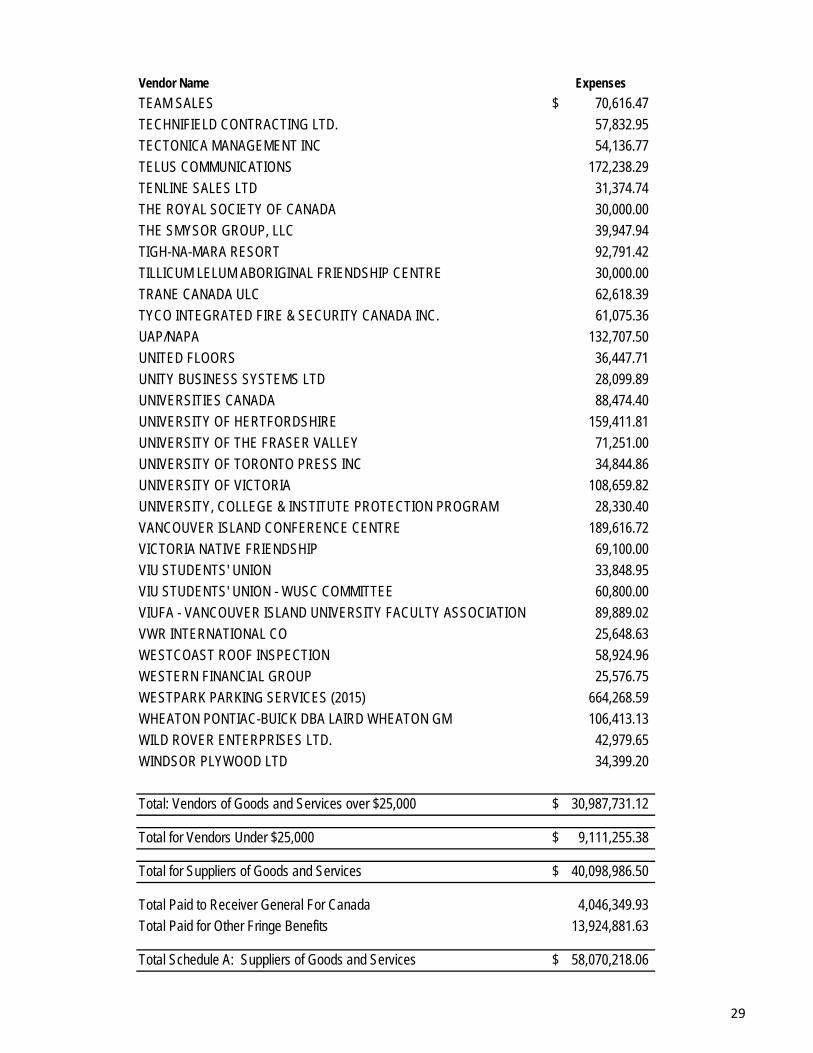
Vendor Name Expenses
TEAM SALES 70,616.47$
TECHNIFIELD CONTRACTING LTD. 57,832.95
TECTONICA MANAGEMENT INC 54,136.77
TELUS COMMUNICATIONS 172,238.29
TENLINE SALES LTD 31,374.74
THE ROYAL SOCIETY OF CANADA 30,000.00
THE SMYSOR GROUP, LLC 39,947.94
TIGH-NA-MARA RESORT 92,791.42
TILLICUM LELUM ABORIGINAL FRIENDSHIP CENTRE 30,000.00
TRANE CANADA ULC 62,618.39
TYCO INTEGRATED FIRE & SECURITY CANADA INC. 61,075.36
UAP/NAPA 132,707.50
UNITED FLOORS 36,447.71
UNITY BUSINESS SYSTEMS LTD 28,099.89
UNIVERSITIES CANADA 88,474.40
UNIVERSITY OF HERTFORDSHIRE 159,411.81
UNIVERSITY OF THE FRASER VALLEY 71,251.00
UNIVERSITY OF TORONTO PRESS INC 34,844.86
UNIVERSITY OF VICTORIA 108,659.82
UNIVERSITY, COLLEGE & INSTITUTE PROTECTION PROGRAM 28,330.40
VANCOUVER ISLAND CONFERENCE CENTRE 189,616.72
VICTORIA NATIVE FRIENDSHIP 69,100.00
VIU STUDENTS' UNION 33,848.95
VIU STUDENTS' UNION - WUSC COMMITTEE 60,800.00
VIUFA - VANCOUVER ISLAND UNIVERSITY FACULTY ASSOCIATION 89,889.02
VWR INTERNATIONAL CO 25,648.63
WESTCOAST ROOF INSPECTION 58,924.96
WESTERN FINANCIAL GROUP 25,576.75
WESTPARK PARKING SERVICES (2015) 664,268.59
WHEATON PONTIAC-BUICK DBA LAIRD WHEATON GM 106,413.13
WILD ROVER ENTERPRISES LTD. 42,979.65
WINDSOR PLYWOOD LTD 34,399.20
Total: Vendors of Goods and Services over $25,000 30,987,731.12$
Total for Vendors Under $25,000 9,111,255.38$
Total for Suppliers of Goods and Services 40,098,986.50$
Total Paid to Receiver General For Canada 4,046,349.93
Total Paid for Other Fringe Benefits 13,924,881.63
Total Schedule A: Suppliers of Goods and Services 58,070,218.06$
29
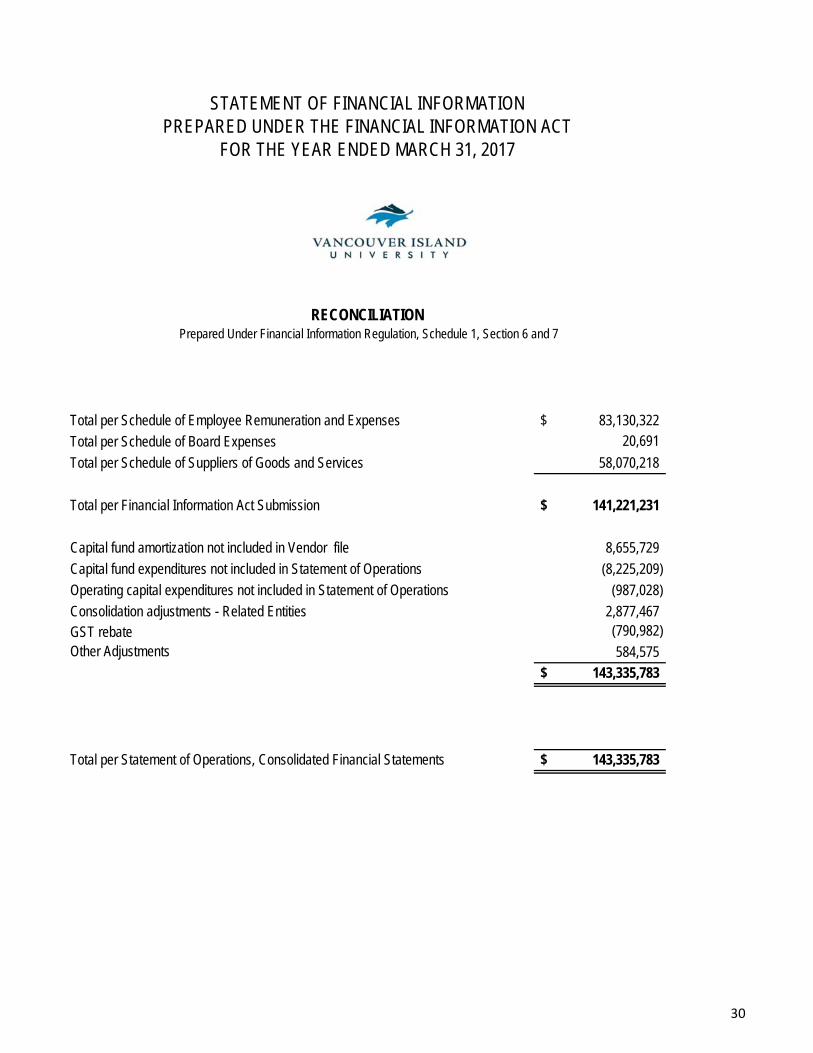
Total per Schedule of Employee Remuneration and Expenses 83,130,322$
Total per Schedule of Board Expenses 20,691
Total per Schedule of Suppliers of Goods and Services 58,070,218
Total per Financial Information Act Submission 141,221,231$
Capital fund amortization not included in Vendor file 8,655,729
Capital fund expenditures not included in Statement of Operations (8,225,209)
Operating capital expenditures not included in Statement of Operations (987,028)
Consolidation adjustments - Related Entities 2,877,467 GST rebate (790,982) Other Adjustments 584,575
143,335,783$
Total per Statement of Operations, Consolidated Financial Statements 143,335,783$
STATEMENT OF FINANCIAL INFORMATIONPREPARED UNDER THE FINANCIAL INFORMATION ACT
FOR THE YEAR ENDED MARCH 31, 2017
RECONCILIATION Prepared Under Financial Information Regulation, Schedule 1, Section 6 and 7
30

Appendix 1

VANCOUVER ISLAND UNIVERSITY
CONSOLIDATED FINANCIAL STATEMENTS
MARCH 31, 2017


KPMG LLP St. Andrew’s Square II 800-730 View Street Victoria BC V8W 3Y7 Canada Telephone (250) 480-3500 Fax (250) 480-3539
KPMG LLP is a Canadian limited liability partnership and a member firm of the KPMG network of independent member firms affiliated with KPMG International Cooperative (“KPMG International”), a Swiss entity. KPMG Canada provides services to KPMG LLP.
INDEPENDENT AUDITORS’ REPORT To the Board of Governors of Vancouver Island University and the Minister of Advanced Education
We have audited the accompanying consolidated financial statements of Vancouver Island University, which comprise the consolidated statement of financial position as at March 31, 2017, the consolidated statements of operations and accumulated operating surplus, changes in net debt, cash flows and remeasurement gains and losses for the year then ended, and notes, comprising a summary of significant accounting policies and other explanatory information.
Management's Responsibility for the Consolidated Financial Statements
Management is responsible for the preparation of these consolidated financial statements in accordance with the financial reporting provisions of Section 23.1 of the Budget Transparency and Accountability Act of the Province of British Columbia, and for such internal control as management determines is necessary to enable the preparation of consolidated financial statements that are free from material misstatement, whether due to fraud or error.
Auditors’ Responsibility
Our responsibility is to express an opinion on these consolidated financial statements based on our audit. We conducted our audit in accordance with Canadian generally accepted auditing standards. Those standards require that we comply with ethical requirements and plan and perform the audit to obtain reasonable assurance about whether the consolidated financial statements are free from material misstatement.
An audit involves performing procedures to obtain audit evidence about the amounts and disclosures in the consolidated financial statements. The procedures selected depend on our judgment, including the assessment of the risks of material misstatement of the consolidated financial statements, whether due to fraud or error. In making those risk assessments, we consider internal control relevant to the entity's preparation of the consolidated financial statements in order to design audit procedures that are appropriate in the circumstances, but not for the purpose of expressing an opinion on the effectiveness of the entity's internal control. An audit also includes evaluating the appropriateness of accounting policies used and the reasonableness of accounting estimates made by management, as well as evaluating the overall presentation of the consolidated financial statements.
Vancouver Island University Page 2
We believe that the audit evidence we have obtained is sufficient and appropriate to provide a basis for our audit opinion.
Opinion
In our opinion, the consolidated financial statements of Vancouver Island University as at March 31, 2017, are prepared, in all material respects, in accordance with the financial reporting provisions of Section 23.1 of the Budget Transparency and Accountability Act of the Province of British Columbia.
Emphasis of Matter
Without modifying our opinion, we draw attention to note 1(a) to the consolidated financial statements which describes the basis of accounting and the significant differences between such basis of accounting and Canadian public sector accounting standards.
Chartered Professional Accountants May 25, 2017 Victoria, Canada


VANCOUVER ISLAND UNIVERSITYConsolidated Statement of Operations and Accumulated Operating Surplus
As at March 31, 2017, with comparative information for March 31, 2016
Budget 2017 2016
(note 1(k))
RevenueProvince of British Columbia grants 57,567,996$ 61,699,256$ 60,946,959$
Government of Canada grants 1,412,190 898,605 1,284,213
Other grants and contracts 3,188,384 2,682,192 2,527,741
Tuition and student fees 58,183,415 56,039,529 56,477,453
Sales of goods and services 8,519,114 8,275,520 8,280,894
Rental income 2,844,093 2,721,815 2,912,784
Investment income 1,309,746 1,562,859 1,866,719
Gifts, grants and bequests 683,000 1,575,564 1,033,935
Revenue recognized from deferred capital contributions (note 9) 4,711,132 5,284,173 4,884,273
Actuarial plan curtailment gain (note 6) - - 2,468,500
Loss on investments - (19,256) (566)
Other 918,568 1,475,117 792,349
139,337,638 142,195,374 143,475,254
Expenses (note 15)
Instruction and student support 127,522,918 130,905,889 126,391,824
Ancillary 11,814,720 12,429,894 11,783,010
139,337,638 143,335,783 138,174,834
Annual operating surplus (deficit) - (1,140,409) 5,300,420
Endowment contributions (note 14) - 391,491 289,337
Annual surplus (deficit) - (748,918) 5,589,757
Accumulated operating surplus, beginning of year 77,232,189 77,232,189 71,642,432
Accumulated operating surplus, end of year 77,232,189$ 76,483,271$ 77,232,189$
See accompanying notes to consolidated financial statements.
2

VANCOUVER ISLAND UNIVERSITY
Consolidated Statement of Changes in Net Debt
As at March 31, 2017, with comparative information for March 31, 2016
Budget 2017 2016
(note 1(k))
Annual surplus (deficit) -$ (748,918)$ 5,589,757$
Acquisition of tangible capital assets - (9,359,648) (8,606,513)
Write-off of tangible capital assets - - 137,113
Amortization of tangible capital assets - 8,655,729 8,147,061
- (703,919) (322,339)
Acquisition of prepaid expense - 27,306 246,071
Net restricted endowment contributions - (392,469) (308,645)
Net effect of remeasurement gains - 270,262 (388,121)
- (94,901) (450,695)
Decrease (increase) in net debt - (1,547,738) 4,816,723
Net debt, beginning of year (86,494,258) (86,494,258) (91,310,981)
Net debt, end of year (86,494,258)$ (88,041,996)$ (86,494,258)$
See accompanying notes to consolidated financial statements.
3
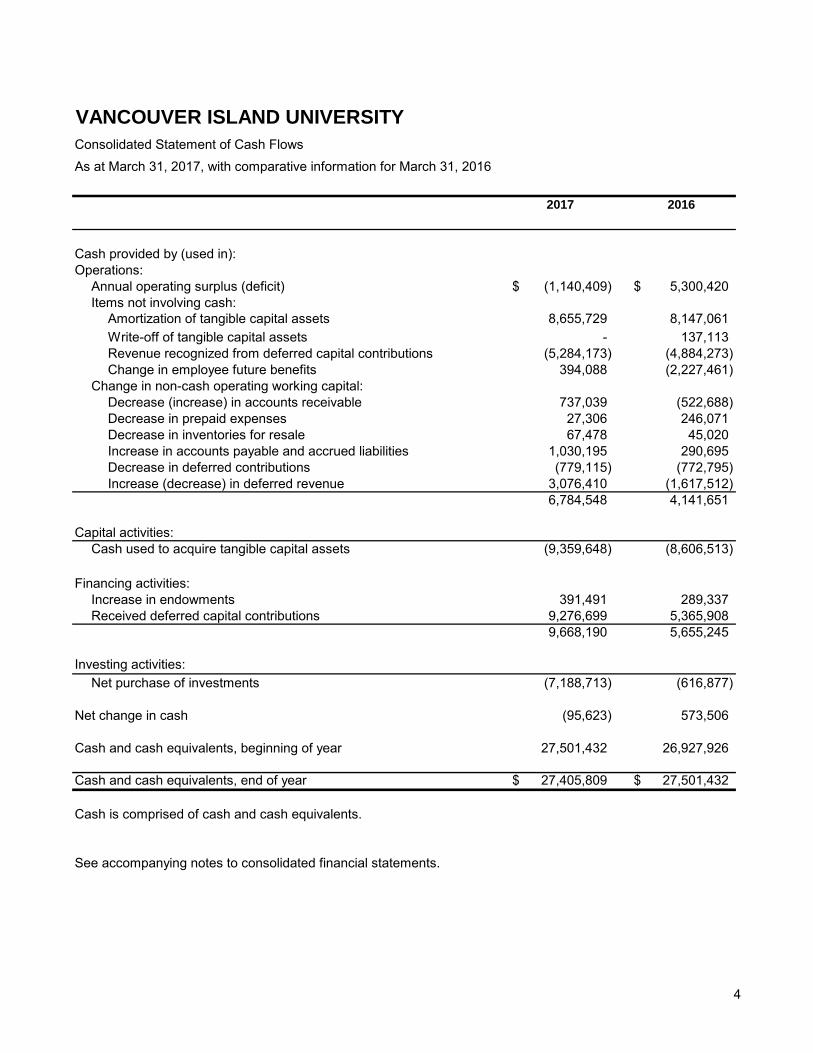
VANCOUVER ISLAND UNIVERSITY
Consolidated Statement of Cash Flows
As at March 31, 2017, with comparative information for March 31, 2016
2017 2016
Cash provided by (used in):
Operations:
Annual operating surplus (deficit) (1,140,409)$ 5,300,420$
Items not involving cash:
Amortization of tangible capital assets 8,655,729 8,147,061
Write-off of tangible capital assets - 137,113
Revenue recognized from deferred capital contributions (5,284,173) (4,884,273)
Change in employee future benefits 394,088 (2,227,461)
Change in non-cash operating working capital:
Decrease (increase) in accounts receivable 737,039 (522,688)
Decrease in prepaid expenses 27,306 246,071
Decrease in inventories for resale 67,478 45,020
Increase in accounts payable and accrued liabilities 1,030,195 290,695
Decrease in deferred contributions (779,115) (772,795)
Increase (decrease) in deferred revenue 3,076,410 (1,617,512)
6,784,548 4,141,651
Capital activities:
Cash used to acquire tangible capital assets (9,359,648) (8,606,513)
Financing activities:
Increase in endowments 391,491 289,337
Received deferred capital contributions 9,276,699 5,365,908
9,668,190 5,655,245
Investing activities:
Net purchase of investments (7,188,713) (616,877)
Net change in cash (95,623) 573,506
Cash and cash equivalents, beginning of year 27,501,432 26,927,926
Cash and cash equivalents, end of year 27,405,809$ 27,501,432$
Cash is comprised of cash and cash equivalents.
See accompanying notes to consolidated financial statements.
4

VANCOUVER ISLAND UNIVERSITY
Consolidated Statement of Remeasurement Gains and Losses
As at March 31, 2017, with comparative information for March 31, 2016
2017 2016
Unrealized gains (losses) attributed to:
Long term bonds 12,156$ (107,494)$
Equity investments 253,932 (274,264)
Foreign currency translation - (5,000)
266,088 (386,758)
Amounts reclassified to the statement of operations:
Equity investments (826) 566
Foreign currency translation 5,000 (1,929)
4,174 (1,363)
Net remeasurement gains (losses) for the year 270,262 (388,121)
Accumulated remeasurement gains, beginning of year 601,991 990,112
Accumulated remeasurement gains, end of year 872,253$ 601,991$
See accompanying notes to consolidated financial statements.
5

VANCOUVER ISLAND UNIVERSITY Notes to Consolidated Financial Statements Year Ended March 31, 2017
6
Vancouver Island University (the "University") is a post-secondary educational institution incorporated under the University Act. The University is a registered charity, governed by a Board of Governors, the majority of which are appointed by the Provincial Government of British Columbia. The University offers a broad range of program options including undergraduate and graduate degrees, career diplomas, and trades training at its Nanaimo, Cowichan, Parksville and Powell River campuses. 1. Significant accounting policies
These consolidated financial statements are prepared in accordance with the following principles: a. Basis of accounting
Budget Transparency and Accountability Act These consolidated financial statements have been prepared in accordance with Section 23.1 of the Budget Transparency and Accountability Act of the Province of British Columbia supplemented by certain regulations (257/2010 and 198/2011) issued by the Province of British Columbia Treasury Board. The Budget Transparency and Accountability Act requires that the consolidated financial statements be prepared in accordance with the set of standards and guidelines that comprise generally accepted accounting principles for senior governments in Canada, or if the Treasury Board makes a regulation, the set of standards and guidelines that comprise generally accepted accounting principles for senior governments in Canada as modified by the alternate standard or guideline or part thereof adopted in the regulation. The issued regulations require all taxpayer supported organizations in the school, University, college and hospital sectors to adopt Canadian public sector accounting standards without any PS4200 elections, effective their first fiscal year commencing after January 1, 2012. The regulations require that restricted contributions received or receivable are to be reported as revenue depending on the nature of the restrictions on the use of the funds by the contributors as follows: (i) Contributions for the purpose of acquiring or developing a depreciable tangible capital asset or contributions in the form of a depreciable tangible capital asset are recorded and, referred to as deferred capital contributions, recognized in revenue at the same rate that amortization of the related tangible capital asset is recorded. The reduction of the deferred capital contributions and the recognition of the revenue are accounted for in the fiscal period during which the tangible capital asset is used to provide services. (ii) Contributions restricted for specific purposes other than those for the acquisition or development of a depreciable tangible capital asset are recorded as deferred contributions and recognized in revenue in the year in which the stipulation or restriction on the contributions have been met. For British Columbia taxpayer supported organizations, these contributions include government transfers and externally restricted contributions.
VANCOUVER ISLAND UNIVERSITY Notes to Consolidated Financial Statements Year Ended March 31, 2017
7
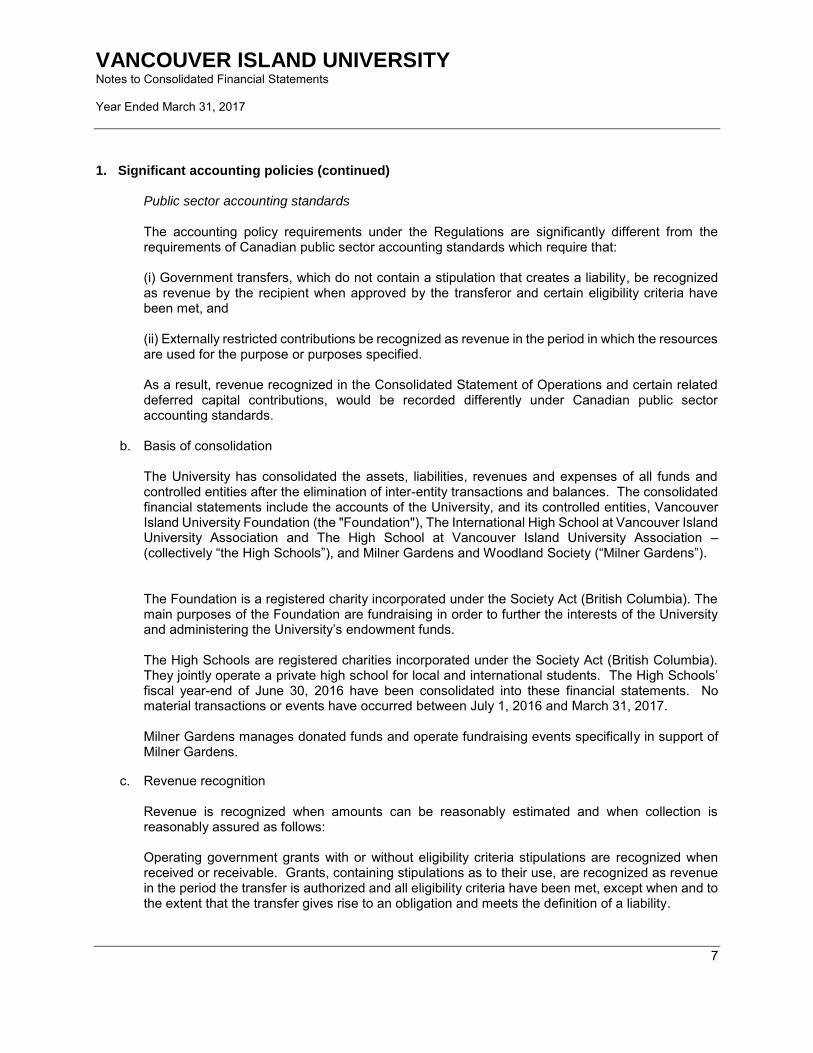
1. Significant accounting policies (continued) Public sector accounting standards
The accounting policy requirements under the Regulations are significantly different from the requirements of Canadian public sector accounting standards which require that: (i) Government transfers, which do not contain a stipulation that creates a liability, be recognized as revenue by the recipient when approved by the transferor and certain eligibility criteria have been met, and (ii) Externally restricted contributions be recognized as revenue in the period in which the resources are used for the purpose or purposes specified. As a result, revenue recognized in the Consolidated Statement of Operations and certain related deferred capital contributions, would be recorded differently under Canadian public sector accounting standards.
b. Basis of consolidation The University has consolidated the assets, liabilities, revenues and expenses of all funds and controlled entities after the elimination of inter-entity transactions and balances. The consolidated financial statements include the accounts of the University, and its controlled entities, Vancouver Island University Foundation (the "Foundation"), The International High School at Vancouver Island University Association and The High School at Vancouver Island University Association – (collectively “the High Schools”), and Milner Gardens and Woodland Society (“Milner Gardens”). The Foundation is a registered charity incorporated under the Society Act (British Columbia). The main purposes of the Foundation are fundraising in order to further the interests of the University and administering the University’s endowment funds. The High Schools are registered charities incorporated under the Society Act (British Columbia). They jointly operate a private high school for local and international students. The High Schools’ fiscal year-end of June 30, 2016 have been consolidated into these financial statements. No material transactions or events have occurred between July 1, 2016 and March 31, 2017. Milner Gardens manages donated funds and operate fundraising events specifically in support of Milner Gardens.
c. Revenue recognition Revenue is recognized when amounts can be reasonably estimated and when collection is reasonably assured as follows: Operating government grants with or without eligibility criteria stipulations are recognized when received or receivable. Grants, containing stipulations as to their use, are recognized as revenue in the period the transfer is authorized and all eligibility criteria have been met, except when and to the extent that the transfer gives rise to an obligation and meets the definition of a liability.
VANCOUVER ISLAND UNIVERSITY Notes to Consolidated Financial Statements Year Ended March 31, 2017
8
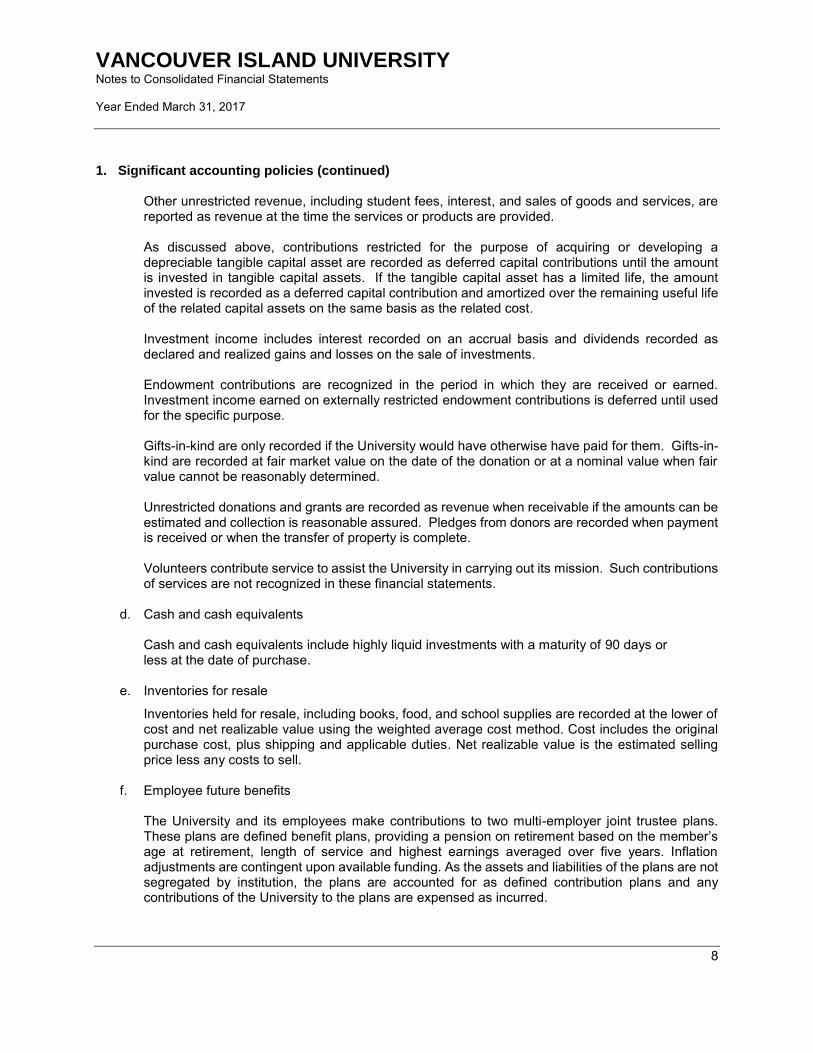
1. Significant accounting policies (continued) Other unrestricted revenue, including student fees, interest, and sales of goods and services, are reported as revenue at the time the services or products are provided. As discussed above, contributions restricted for the purpose of acquiring or developing a depreciable tangible capital asset are recorded as deferred capital contributions until the amount is invested in tangible capital assets. If the tangible capital asset has a limited life, the amount invested is recorded as a deferred capital contribution and amortized over the remaining useful life of the related capital assets on the same basis as the related cost. Investment income includes interest recorded on an accrual basis and dividends recorded as declared and realized gains and losses on the sale of investments. Endowment contributions are recognized in the period in which they are received or earned. Investment income earned on externally restricted endowment contributions is deferred until used for the specific purpose. Gifts-in-kind are only recorded if the University would have otherwise have paid for them. Gifts-in-kind are recorded at fair market value on the date of the donation or at a nominal value when fair value cannot be reasonably determined. Unrestricted donations and grants are recorded as revenue when receivable if the amounts can be estimated and collection is reasonable assured. Pledges from donors are recorded when payment is received or when the transfer of property is complete. Volunteers contribute service to assist the University in carrying out its mission. Such contributions of services are not recognized in these financial statements.
d. Cash and cash equivalents Cash and cash equivalents include highly liquid investments with a maturity of 90 days or less at the date of purchase.
e. Inventories for resale
Inventories held for resale, including books, food, and school supplies are recorded at the lower of cost and net realizable value using the weighted average cost method. Cost includes the original purchase cost, plus shipping and applicable duties. Net realizable value is the estimated selling price less any costs to sell.
f. Employee future benefits
The University and its employees make contributions to two multi-employer joint trustee plans. These plans are defined benefit plans, providing a pension on retirement based on the member’s age at retirement, length of service and highest earnings averaged over five years. Inflation adjustments are contingent upon available funding. As the assets and liabilities of the plans are not segregated by institution, the plans are accounted for as defined contribution plans and any contributions of the University to the plans are expensed as incurred.
VANCOUVER ISLAND UNIVERSITY Notes to Consolidated Financial Statements Year Ended March 31, 2017
9
1. Significant accounting policies (continued) Sick leave benefits and retirement severance benefits are also available to the University’s employees. The costs of these benefits are actuarially determined based on service and best estimates of retirement ages and expected future salary and wage increases. The obligation under these benefit plans are accrued based on projected benefits as the employees render services necessary to earn the future benefits. Actuarial gains and losses are amortized over the expected average remaining service life of the employees. Vacation entitlements earned by employees for future use are valued at the fiscal year end and accrued as a liability.
g. Non-financial assets
Non-financial assets are not available to discharge existing liabilities and are held for use in the provision of services. They have useful lives extending beyond the current year and are not intended for sale in the ordinary course of operations.
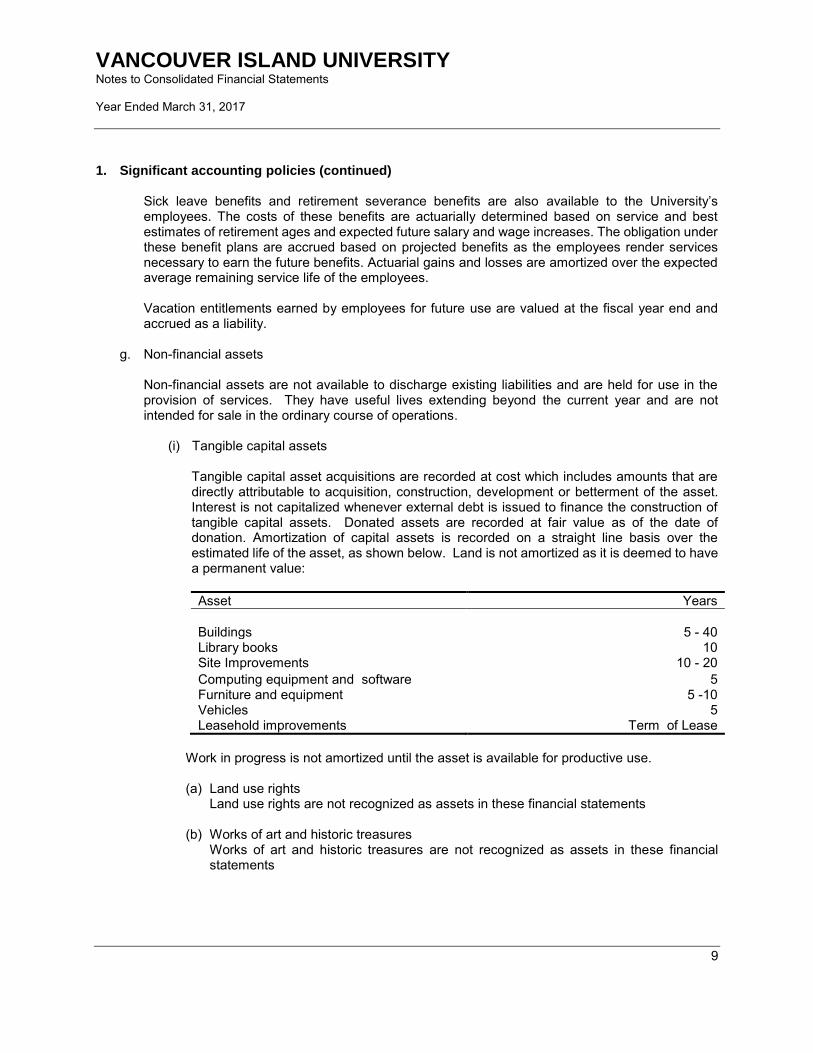
(i) Tangible capital assets
Tangible capital asset acquisitions are recorded at cost which includes amounts that are directly attributable to acquisition, construction, development or betterment of the asset. Interest is not capitalized whenever external debt is issued to finance the construction of tangible capital assets. Donated assets are recorded at fair value as of the date of donation. Amortization of capital assets is recorded on a straight line basis over the estimated life of the asset, as shown below. Land is not amortized as it is deemed to have a permanent value:
Asset Years
Buildings 5 - 40 Library books 10 Site Improvements 10 - 20
Computing equipment and software 5 Furniture and equipment 5 -10 Vehicles 5 Leasehold improvements Term of Lease
Work in progress is not amortized until the asset is available for productive use. (a) Land use rights
Land use rights are not recognized as assets in these financial statements (b) Works of art and historic treasures
Works of art and historic treasures are not recognized as assets in these financial statements

VANCOUVER ISLAND UNIVERSITY Notes to Consolidated Financial Statements Year Ended March 31, 2017
10
1. Significant accounting policies (continued)
h. Foreign currency translation Transaction amounts denominated in foreign currencies are translated into their Canadian dollar equivalents at exchange rates prevailing at the transaction dates. Carrying values of monetary assets and liabilities denominated in a foreign currency are translated using the exchange rates at the Statement of Financial Position date. Any gain or loss resulting from a change in rates between the transaction date and Statement of Financial Position date is recognized in the Statement of Remeasurement Gains and Losses. In the period of settlement, the related cumulative remeasurement gain or loss is reversed in the Statement of Remeasurement Gains and Losses and the exchange gain or loss in relation to the exchange rate at the date of the item’s initial recognition is recognized in the Statement of Operations.
i. Use of estimates
The preparation of financial statements requires management to make estimates and assumptions that affect the reported amounts of assets and liabilities and disclosure of contingent assets and liabilities at the date of the financial statements, and the reported amounts of revenue and expenses during the reporting period. Significant areas requiring the use of management estimates include the impairment of assets (provisions are made for slow moving and obsolete inventory), provision for doubtful accounts, amortization period for tangible capital assets and deferred capital contributions, and actuarial assumptions for employee future benefits. Actual results could differ from management’s best estimates as additional information becomes available in future years. As adjustments to estimates become necessary they are reported in earnings in the period in which they become known.
j. Financial instruments Financial instruments are classified into two categories: fair value or cost. (i) Fair value category: Cash and cash equivalents are recorded at fair value due to the short term
nature of the instrument. Investments that are managed and evaluated as a group and derivative instruments are reflected at fair value as at the reporting date. Sales and purchases of investments are recorded on the trade date. Transaction costs related to the acquisition of investments are recorded as an expense. Unrealized gains and losses on financial assets are recognized in the Statement of Remeasurement Gains and Losses until such time that the financial asset is derecognized due to disposal or impairment. At the time of derecognition, the related realized gains and losses are recognized in the Statement of Operations and Accumulated Surplus and related balances reversed from the Statement of Remeasurement Gains and Losses.
(ii) Cost category: Gains and losses are recognized in the Statement of Operations and Accumulated Surplus when the financial asset is derecognized due to disposal or impairment.
(a) Accounts receivable and due from government/other government organizations are measured at amortized cost using the effective interest method.

VANCOUVER ISLAND UNIVERSITY Notes to Consolidated Financial Statements Year Ended March 31, 2017
11
1. Significant accounting policies (continued)
(b) Accounts payable and accrued liabilities are measured at amortized cost. Any gains, losses or interest expense is recorded on the Statement of Operations and Accumulated Surplus depending on the nature of the financial liability that gave rise to the gain, loss or expense.
k. Budget figures
Budget figures have been provided for comparative purposes and have been derived from the 2016-2017 Consolidated Resource Plan approved by the Board of Governors of the University on March 24, 2016. The budget is reflected in the Statement of Operations and Accumulated Surplus and the Statement of Changes in Net Financial Debt.
2. Financial instruments
Fair value of financial instruments Public Sector Accounting Standards define the fair value of a financial instrument as the amount at which the instrument could be exchanged in a current transaction between willing parties. The University uses the following methods and assumptions to estimate the fair value of each class of financial instruments for which the carrying amounts are included in the Consolidated Statement of Financial Position under the following captions:
Cash and cash equivalents, accounts receivable, and accounts payable and accrued liabilities approximate fair value because of the short maturity of these instruments
The Standards require an organization to classify fair value measurements using a fair value hierarchy, which includes three levels of information that may be used to measure fair value:
Level 1 - Unadjusted quoted market prices in an active market for identical assets or liabilities,
Level 2 - Observable or corroborated inputs, other than level 1, such as quoted prices for similar assets or liabilities in inactive markets or market data for substantially the full term of the assets or liabilities; and
Level 3 - Unobservable inputs that are supported by little or no market activity and that are significant to the fair value of the assets and liabilities.
Bonds and fixed term instruments and pooled funds are classified as level 2 in the fair value hierarchy.
VANCOUVER ISLAND UNIVERSITY Notes to Consolidated Financial Statements Year Ended March 31, 2017
12
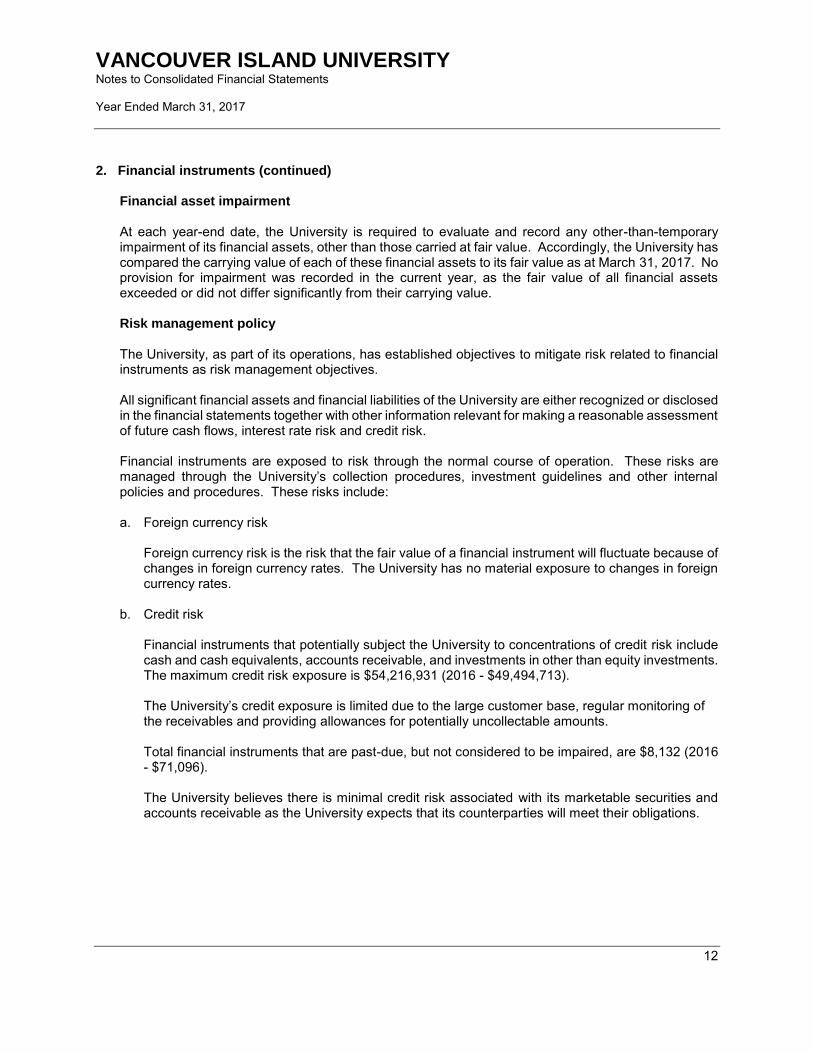
2. Financial instruments (continued) Financial asset impairment At each year-end date, the University is required to evaluate and record any other-than-temporary impairment of its financial assets, other than those carried at fair value. Accordingly, the University has compared the carrying value of each of these financial assets to its fair value as at March 31, 2017. No provision for impairment was recorded in the current year, as the fair value of all financial assets exceeded or did not differ significantly from their carrying value. Risk management policy The University, as part of its operations, has established objectives to mitigate risk related to financial instruments as risk management objectives. All significant financial assets and financial liabilities of the University are either recognized or disclosed in the financial statements together with other information relevant for making a reasonable assessment of future cash flows, interest rate risk and credit risk. Financial instruments are exposed to risk through the normal course of operation. These risks are managed through the University’s collection procedures, investment guidelines and other internal policies and procedures. These risks include: a. Foreign currency risk
Foreign currency risk is the risk that the fair value of a financial instrument will fluctuate because of changes in foreign currency rates. The University has no material exposure to changes in foreign currency rates.
b. Credit risk Financial instruments that potentially subject the University to concentrations of credit risk include cash and cash equivalents, accounts receivable, and investments in other than equity investments. The maximum credit risk exposure is $54,216,931 (2016 - $49,494,713). The University’s credit exposure is limited due to the large customer base, regular monitoring of the receivables and providing allowances for potentially uncollectable amounts. Total financial instruments that are past-due, but not considered to be impaired, are $8,132 (2016 - $71,096). The University believes there is minimal credit risk associated with its marketable securities and accounts receivable as the University expects that its counterparties will meet their obligations.

VANCOUVER ISLAND UNIVERSITY Notes to Consolidated Financial Statements Year Ended March 31, 2017
13
2. Financial instruments (continued)
c. Interest rate risk Interest rate risk is the risk that the fair value or future cash flows of a financial instrument might be adversely affected by a change in interest rates. Changes in market interest rates may have an effect on the cash flows associated with some financial assets and liabilities, known as cash flow risk, and on the fair value of other financial assets or liabilities, known as price risk. In seeking to minimize the risks from interest rate fluctuations, the University manages exposure on its marketable securities, short term investments, and endowment and other investments which have fixed interest rates by varying the maturity dates. The University manages exposure on the interest-bearing investments by investing in a widely diversified portfolio with varying interest rates and maturity dates.
d. Liquidity risk
Liquidity risk is the risk that the University will encounter difficulty in meeting obligations associated with financial liabilities. The University enters into transactions to purchase goods and services, lease premises and to borrow funds from financial institutions to finance capital projects for which payments are required at various dates. Liquidity risk is measured by reviewing the University’s future net cash flows for the possibility of a negative net cash flow.
e. Other price risk Other price risk is the risk that the fair value or future cash flows of a financial instrument will fluctuate because of changes in market prices (other than those arising from interest rate risk or foreign currency risk), whether those changes are caused by factors specific to the individual financial instrument or its issuer, or factors affecting all similar financial instruments traded in the market. The University enters into transactions to purchase investments, for which the market price fluctuates. The University manages this risk through its investment policy which prescribes the maximum amount of investments that can be made in any one investment type.
VANCOUVER ISLAND UNIVERSITY Notes to Consolidated Financial Statements Year Ended March 31, 2017
14
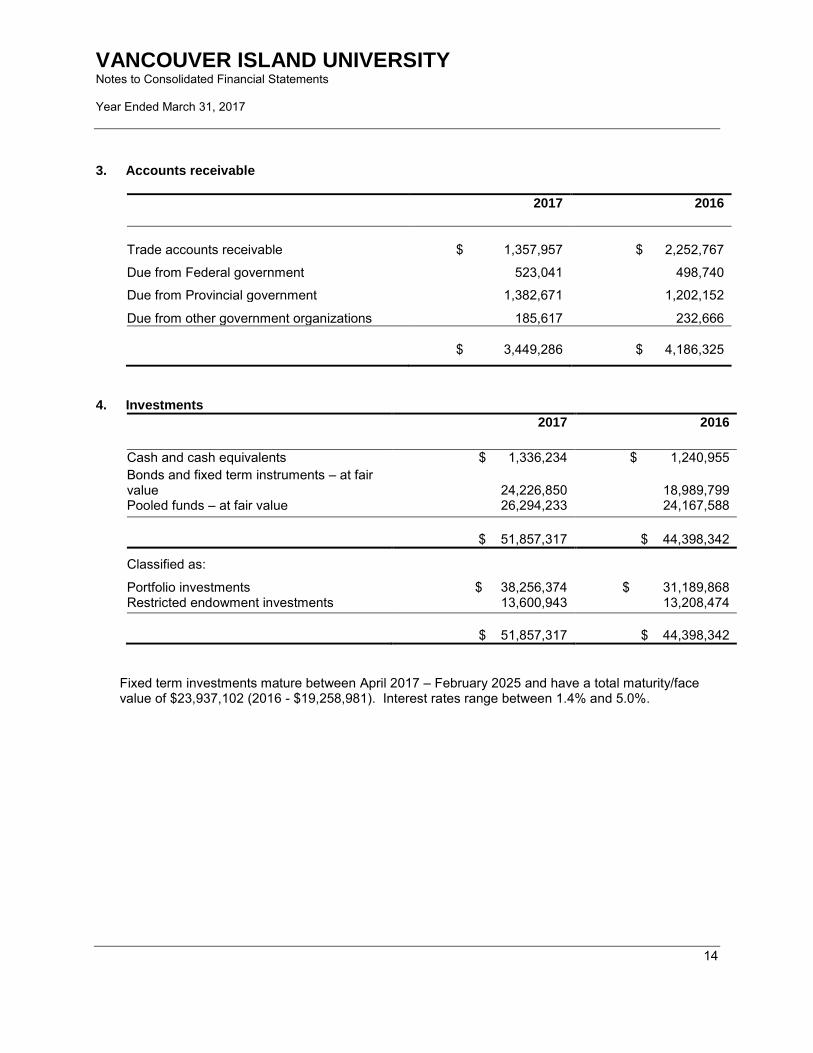
3. Accounts receivable
2017 2016
Trade accounts receivable
$ 1,357,957
$ 2,252,767
Due from Federal government 523,041 498,740
Due from Provincial government 1,382,671 1,202,152
Due from other government organizations 185,617 232,666
$ 3,449,286 $ 4,186,325
4. Investments
2017 2016
Cash and cash equivalents $ 1,336,234 $ 1,240,955
Bonds and fixed term instruments – at fair value 24,226,850 18,989,799 Pooled funds – at fair value 26,294,233 24,167,588
$ 51,857,317 $ 44,398,342
Classified as:
Portfolio investments $ 38,256,374 $ 31,189,868 Restricted endowment investments 13,600,943 13,208,474
$ 51,857,317 $ 44,398,342
Fixed term investments mature between April 2017 – February 2025 and have a total maturity/face value of $23,937,102 (2016 - $19,258,981). Interest rates range between 1.4% and 5.0%.

VANCOUVER ISLAND UNIVERSITY Notes to Consolidated Financial Statements Year Ended March 31, 2017
15
5. Accounts payable and accrued liabilities
2017 2016
Trade payables and accrued liabilities
$ 7,409,309
$ 6,758,286
Salaries and benefits payable 3,811,471 3,560,560
Payable to government agencies 1,752,030 1,623,769
$ 12,972,810 $ 11,942,615
6. Employee future benefits
a. Vacation, termination benefits, and compensated absences
Employees with ten or more years of service are entitled to receive special payments upon retirement or termination as specified by collective and administrator agreements. These payments are based upon accumulated sick credits and entitlements for each year of service.
2017 2016
Accrued benefit obligation, beginning of year $ 12,515,895 $ 14,666,060 Unamortized actuarial gains , beginning of year 573,667 650,963
13,089,562 15,317,023 Current service cost 813,899 894,921 Interest cost 156,200 223,100 Benefits paid (477,679) (1,015,321) Gain loss on event driven liabilities - (2,468,500) Amortization of actuarial (gain) (57,366) (65,106) Increase (decrease) in vacation liability (40,966) 203,445
Accrued benefit obligation, end of year $ 13,483,650 $ 13,089,562
Accrued benefit obligation, end of year consists of:
Accrued liability, end of year $ 12,457,530 $ 12,515,895 Unamortized actuarial gains, end of year 1,026,120 573,667
Accrued benefit obligation, end of year $ 13,483,650 $ 13,089,562

VANCOUVER ISLAND UNIVERSITY Notes to Consolidated Financial Statements Year Ended March 31, 2017
16
6. Employee Future Benefits (continued)
The significant actuarial assumptions adopted in measuring the University’s accrued benefit obligation are as follows:
2017 2016
Discount rate for termination benefits 2.70% 2.70% Expected future inflation rate 2.70% 2.70%
b. Pension liability The University and its employees contribute to the College Pension Plan and Municipal Pension Plan (jointly trusteed pension plans). The boards of trustees for these plans, representing plan members and employers, are responsible for administering the pension plans, including investing assets and administering benefits. The plans are multi-employer defined benefit pension plans. Basic pension benefits provided are based on a formula. As at August 31, 2016, the College Pension Plan has about 14,000 active members, and approximately 7,000 retired members. As at December 31, 2015, the Municipal Pension Plan has about 189,000 active members, including approximately 5,800 from colleges. The most recent actuarial valuation for the College Pension Plan as at August 31, 2015, indicated a $67 million surplus for basic pension benefits. The next valuation will be August 31, 2018, with results available in 2019. The most recent actuarial valuation for the Municipal Pension Plan as at December 31, 2015, indicated a $2,224 million funding surplus for basic pension benefits. The next valuation will be December 31, 2018, with results available in 2019. Employers participating in the plans record their pension expense as the amount of employer contributions made during the fiscal year (defined contribution pension plan accounting). This is because the plans record accrued liabilities and accrued assets for the plans in aggregate, resulting in no consistent and reliable basis for allocating the obligation, assets and cost to individual employers participating in the plans. The University paid $7,113,531 (2016 - $6,937,934) for employer contributions to the plan in fiscal 2017.
7. Deferred revenue
Deferred revenue includes unspent funds externally restricted for non-capital purposes from all sources except Federal and Provincial government reporting entities. The main components are tuition, grant and contract service funding, and donations as listed below.
2017 2016
Tuition $ 13,056,726 $ 11,999,754
Donations 7,603,913 6,684,940
Grant and contract service funding 3,971,492 2,968,861
Other 381,689 283,855
$ 25,013,820 $ 21,937,410

VANCOUVER ISLAND UNIVERSITY Notes to Consolidated Financial Statements Year Ended March 31, 2017
17
8. Deferred contributions
Deferred operating contributions include unspent grant and contract services contributions externally restricted for non-capital purposes from Federal and Provincial government reporting entities. Changes in deferred contributions are as follows:
2017 2016
Balance, beginning of year $ 4,227,841 $ 5,000,636
Contributions received during the year 3,448,726 4,281,626
Revenue recognized from deferred contributions (4,227,841) (5,054,421)
Balance, end of year $ 3,448,726 $ 4,227,841
9. Deferred capital contributions
Contributions for capital that meet the definition of a liability are referred to as deferred capital contributions. Amounts are recognized into revenue as the liability is extinguished over the useful life of the asset. Treasury Board provided direction on accounting treatment as disclosed in note 1. Changes in the deferred capital contributions balance are as follows:
2017 2016
Balance, beginning of year
$ 99,358,625
$ 98,876,990
Contributions received during the year - cash 9,276,699 5,365,908 Revenue recognized from deferred capital contributions (5,284,173) (4,884,273)
Balance, end of year $ 103,351,151 $ 99,358,625
At March 31, 2017 $6,481,507 (2015 - $701,399) in deferred capital contributions were included in deferred capital contributions where assets have not yet been completed and placed in service.
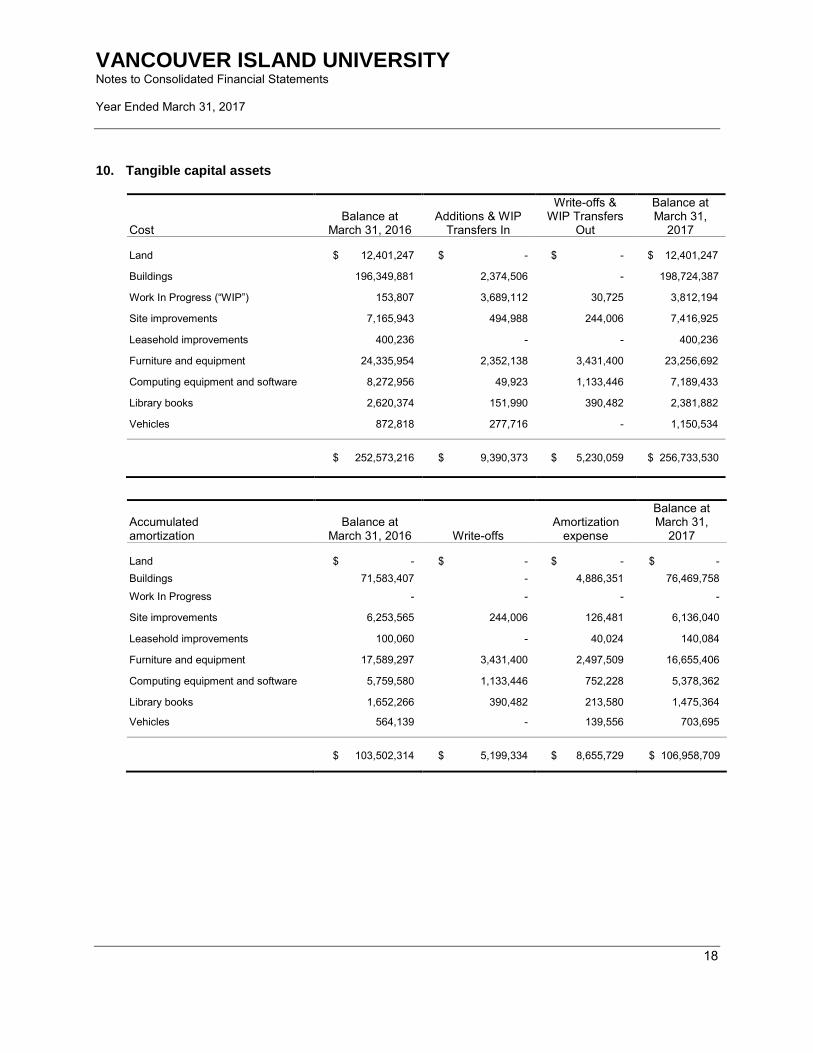
VANCOUVER ISLAND UNIVERSITY Notes to Consolidated Financial Statements Year Ended March 31, 2017
18
10. Tangible capital assets
Cost Balance at
March 31, 2016 Additions & WIP
Transfers In
Write-offs & WIP Transfers
Out
Balance at March 31,
2017 Land $ 12,401,247 $ - $ - $ 12,401,247
Buildings 196,349,881 2,374,506 - 198,724,387
Work In Progress (“WIP”) 153,807 3,689,112 30,725 3,812,194
Site improvements 7,165,943 494,988 244,006 7,416,925
Leasehold improvements 400,236 - - 400,236
Furniture and equipment 24,335,954 2,352,138 3,431,400 23,256,692
Computing equipment and software 8,272,956 49,923 1,133,446 7,189,433
Library books 2,620,374 151,990 390,482 2,381,882
Vehicles 872,818 277,716 - 1,150,534
$ 252,573,216 $ 9,390,373 $ 5,230,059 $ 256,733,530
Accumulated amortization
Balance at March 31, 2016 Write-offs
Amortization expense
Balance at March 31,
2017 Land $ - $ - $ - $ -
Buildings 71,583,407 - 4,886,351 76,469,758
Work In Progress - - - -
Site improvements 6,253,565 244,006 126,481 6,136,040
Leasehold improvements 100,060 - 40,024 140,084
Furniture and equipment 17,589,297 3,431,400 2,497,509 16,655,406
Computing equipment and software 5,759,580 1,133,446 752,228 5,378,362
Library books 1,652,266 390,482 213,580 1,475,364
Vehicles 564,139 - 139,556 703,695
$ 103,502,314 $ 5,199,334 $ 8,655,729 $ 106,958,709
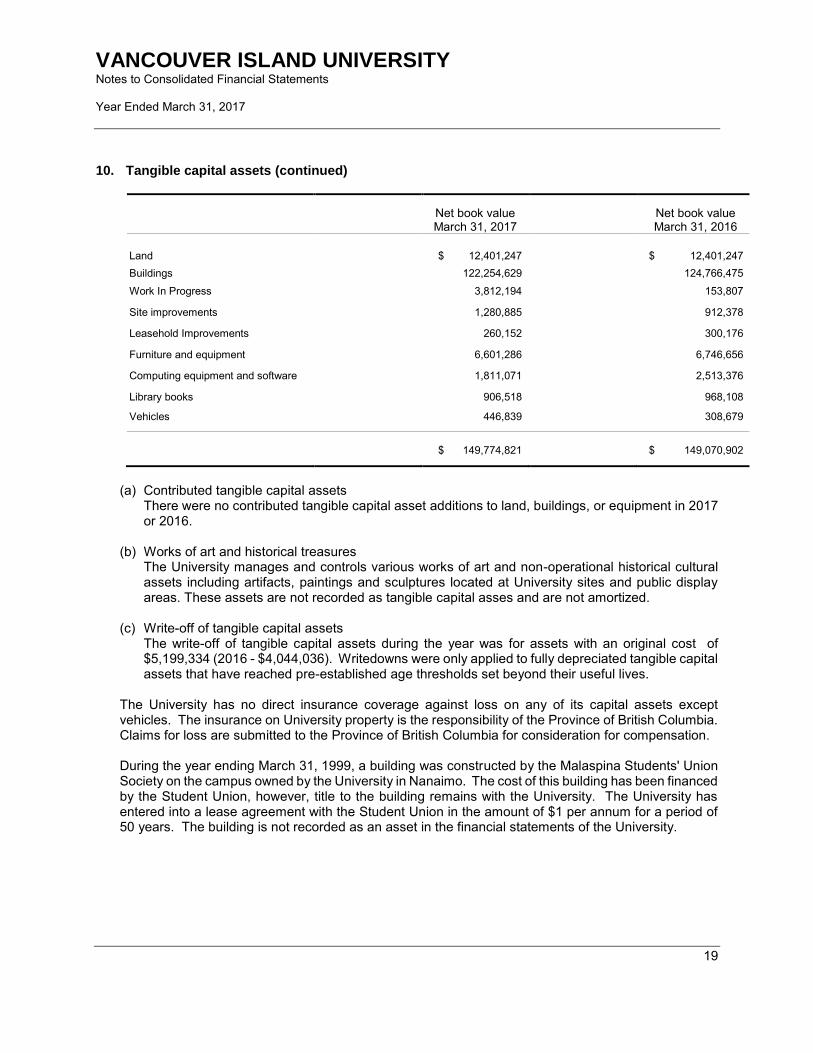
VANCOUVER ISLAND UNIVERSITY Notes to Consolidated Financial Statements Year Ended March 31, 2017
19
10. Tangible capital assets (continued)
Net book value March 31, 2017
Net book value March 31, 2016
Land $ 12,401,247 $ 12,401,247
Buildings 122,254,629 124,766,475
Work In Progress 3,812,194 153,807
Site improvements 1,280,885 912,378
Leasehold Improvements 260,152 300,176
Furniture and equipment 6,601,286 6,746,656
Computing equipment and software 1,811,071 2,513,376
Library books 906,518 968,108
Vehicles 446,839 308,679
$ 149,774,821 $ 149,070,902
(a) Contributed tangible capital assets
There were no contributed tangible capital asset additions to land, buildings, or equipment in 2017 or 2016.
(b) Works of art and historical treasures
The University manages and controls various works of art and non-operational historical cultural assets including artifacts, paintings and sculptures located at University sites and public display areas. These assets are not recorded as tangible capital asses and are not amortized.
(c) Write-off of tangible capital assets The write-off of tangible capital assets during the year was for assets with an original cost of $5,199,334 (2016 - $4,044,036). Writedowns were only applied to fully depreciated tangible capital assets that have reached pre-established age thresholds set beyond their useful lives.
The University has no direct insurance coverage against loss on any of its capital assets except vehicles. The insurance on University property is the responsibility of the Province of British Columbia. Claims for loss are submitted to the Province of British Columbia for consideration for compensation. During the year ending March 31, 1999, a building was constructed by the Malaspina Students' Union Society on the campus owned by the University in Nanaimo. The cost of this building has been financed by the Student Union, however, title to the building remains with the University. The University has entered into a lease agreement with the Student Union in the amount of $1 per annum for a period of 50 years. The building is not recorded as an asset in the financial statements of the University.

VANCOUVER ISLAND UNIVERSITY Notes to Consolidated Financial Statements Year Ended March 31, 2017
20
11. Accumulated operating surplus The accumulated operating surplus is comprised of the following:
2017 2016
Investment in tangible capital assets
$ 49,092,982
$ 50,259,868
Endowments (note 14) 13,600,943 13,208,474
Internally restricted surplus 13,789,346 13,763,847
$ 76,483,271 $ 77,232,189
12. Contractual obligations
The nature of the University’s activities can result in multiyear contracts and obligations whereby the University will be committed to make future payments. Currently the University has $49,858,208 in contractual obligations related to operations that extend beyond the 2016-17 fiscal year.
13. Contingencies
a. Letters of credit: The University had a total of $543,338 in letters of credit outstanding at March 31, 2017 for a bond posted on behalf of the High Schools to the Ministry of Finance and Corporate Relations. These letters of credit can be drawn upon to refund tuition to students if the High Schools fail to provide or complete the related academic program. No provision has been made for this contingency in the financial statements.
b. Legal claims: The nature of the University’s activities is such that there is usually litigation pending or in process at any time. With respect to unsettled claims at March 31, 2017, management believes the University has valid defenses and appropriate insurance coverage in place. In the event any claims are successful, management believes that such claims are not expected to have a material effect on the University’s financial position.

VANCOUVER ISLAND UNIVERSITY Notes to Consolidated Financial Statements Year Ended March 31, 2017
21
14. Endowments Endowments form part of the accumulated surplus balance and consist of externally restricted donations, the principal of which is required to be maintained in perpetuity. The endowment fund balance is restricted for the payment of scholarships and bursaries, and the two BC Regional Innovation Chairs (Tourism and Sustainable Rural Development & Aboriginal and Early Childhood Education). Investments are managed by an external fund management company. Scholarships and bursaries are controlled by the Foundation and chairs are controlled by VIU. On March 15, 2012, the VIU Board of Governors passed policy 42.11 granting full authority to the Foundation to manage VIU endowment funds consistent with Foundation policy. Endowments included as part of accumulated surplus is as follows:
2017 2016
Balance, beginning of year
$ 13,208,474
$ 12,899,829
Contributions received 391,491 289,337
Capitalized interest 978 19,308
$ 13,600,943 $ 13,208,474
15. Expenses by object
The following is a summary of expenses by object:
2017 2016
Salaries & benefits
$ 99,774,576
$ 97,401,645
Fees & purchased services 10,995,386 10,615,693
Travel & training 2,936,830 2,905,176
Scholarships & bursaries 3,714,560 3,028,941
Equipment rental & maintenance 1,618,043 1,554,672
Utilities, insurance & taxes 3,047,648 2,851,378
Materials & supplies 8,021,439 7,561,155
Amortization of capital assets 8,655,729 8,147,061
Cost of goods sold 4,571,572 4,109,113
$ 143,335,783 $ 138,174,834
Under the University Act, the University has been designated a special purpose teaching university. As such, the University’s primary purpose is the delivery of educational services. Segmented reporting has not been provided as it would not provide additional material information to users of the financial statements.

VANCOUVER ISLAND UNIVERSITY Notes to Consolidated Financial Statements Year Ended March 31, 2017
22
16. Comparative figures Certain comparative figures have been reclassified to conform to current year presentation.