Statement of Basis - US EPA · 2015-08-21 · Statement of Basis . Greenhouse Gas Prevention of...
42
Transcript of Statement of Basis - US EPA · 2015-08-21 · Statement of Basis . Greenhouse Gas Prevention of...


Statement of Basis Greenhouse Gas Prevention of Significant Deterioration Preconstruction Permit
for Channel Energy Center (CEC), LLC
Permit Number: PSD-TX-955-GHG
August 2012
This document serves as the Statement of Basis required by 40 CFR 124.7. This document sets forth the legal and factual basis for the draft permit conditions and provides references to the statutory or regulatory provisions, including provisions under 40 CFR 52.21, that would apply if the permit is finalized. This document is intended for use by all parties interested in the permit. I. Executive Summary On November 3, 2011, the Channel Energy Center (CEC), LLC, submitted to EPA Region 6 a Prevention of Significant Deterioration (PSD) permit application for Greenhouse Gas (GHG) emissions from proposed construction of a natural gas-fired combined-cycle combustion turbine generator (CTG) at the existing CEC facility. In connection with the same proposed project, CEC submitted a PSD permit application for non-GHG pollutants to the Texas Commission on Environmental Quality (TCEQ) on November 3, 2011. On December 11, 2011, February 7, April 2, April 30, and June 22, 2012 respectively, CEC submitted additional information to amend their permit applications to both EPA and TCEQ, revising the permit applications to incorporate a multiphase construction of the proposed CTG. The revised project at the CEC plant proposes phased construction of the natural gas-fired combined-cycle CTG with a generating capacity of approximately 180 megawatts that will be completed in two stages of construction. In the initial phase, CEC intends to construct a Siemens Model FD2 combustion turbine that will be subsequently upgraded in performance as a FD3-series combustion turbine in the second stage of construction. Modification of the FD2 combustion turbine to the FD3-series would commence within eighteen (18) months of completion of construction or beginning of commercial operation of the initial project. After reviewing the application, EPA Region 6 has prepared the following Statement of Basis (SOB) and draft air permit to authorize phased construction of air emission sources at CEC. This SOB documents the information and analysis EPA used to support the decisions EPA made in drafting the air permit. It includes a description of the proposed facility, the applicable air permit requirements, and an analysis showing how the applicant complied with the requirements. EPA Region 6 concludes that CEC’s application is complete and provides the necessary information to demonstrate that the proposed project meets the applicable air permit regulations. EPA's conclusions rely upon information provided in the permit application, supplemental

Channel Energy Center, LLC Page 2 of 2 Pasadena, Texas (Harris County)
information EPA requested and provided by CEC and EPA's own technical analysis. EPA is making all this information available as part of the public record.1 II. Applicant Channel Energy Center, LLC 717 Texas, Suite 1000 Houston, TX 77002 Physical Address: 451 Light Company Road Pasadena, TX 77506 Contact: Patrick Blanchard Director, Environmental Services Calpine Corporation 717 Texas, Suite 1000 Houston, TX 77002 III. Permitting Authority On May 3, 2011, EPA published a federal implementation plan that makes EPA Region 6 the PSD permitting authority for the pollutant GHGs. 75 FR 25178 (promulgating 40 CFR § 52.2305). Texas still retains approval of its plan and PSD program for pollutants that were subject to regulation before January 2, 2011, i.e., regulated NSR pollutants other than GHGs. The GHG PSD Permitting Authority for the State of Texas is: EPA, Region 6 1445 Ross Avenue Dallas, TX 75202
1 Note: Calpine intends to construct a nearly identical combustion turbine generator/heat recovery steam generator at their other Harris County facility, Deer Park Energy Center (DPEC), permit number PSD-TX-979-GHG, with a phased construction plan to install a Siemens FD2 series combustion turbine first, followed by the subsequent upgrade to the FD3 series, all within similar timeframes of the CEC permit. Calpine Corporation submitted both permit applications of DPEC and CEC to EPA, Region 6 within one month of each other. Hence, much of the information concerning the Calpine DPEC GHG permit (Permit Number: PSD-TX-955-GHG) and the resulting BACT analysis is similar to the information presented in the Calpine CEC GHG permit and CEC’s BACT analysis.

Channel Energy Center, LLC Page 3 of 3 Pasadena, Texas (Harris County)
The EPA, Region 6 Permit Writer is: Alfred C. “AC” Dumaual, Ph.D. Air Permitting Section (6PD-R) (214) 665-6613 The Non-GHG PSD Permitting Authority for the State of Texas is: Air Permits Division (MC-163) TCEQ P.O. Box 13087 Austin, TX 78711-3087
(NEXT PAGE)

Channel Energy Center, LLC Page 4 of 4 Pasadena, Texas (Harris County)
IV. Facility Location The CEC plant is located in Harris County, Texas, and this area is currently considered to be in attainment for all NAAQS with the exception of the 8 hour Ozone standard, for which it is classified as a marginal non-attainment area as of April 2012. The geographic coordinates for this facility are as follows: Latitude: 29º 43’ 08” North (29.718889) Longitude: 95º 13’ 55” West (-95.231944) The figures below illustrate the facility location for this draft permit in city of Pasadena, Harris County, Texas.

Channel Energy Center, LLC Page 5 of 5 Pasadena, Texas (Harris County)
V. Applicability of Prevention of Significant Deterioration (PSD) Regulations EPA concludes Calpine’s proposed modification is subject to PSD review for the pollutant GHG, because the project would lead to an emissions increase of GHGs for a facility as described at 40 CFR §§ 52.21(b)(23) and (49)(iv). Under the project, GHG emissions are calculated to increase over zero tons per year (tpy) on a mass basis and well exceed the applicability threshold of 75,000 tpy CO2e. (EPA calculates CO2e emissions of 1,045,635 tpy in the initial phase of construction which is increased to 1,060,783 tpy after the final phase of construction). EPA Region 6 implements a GHG PSD FIP for Texas under the provisions of 40 CFR § 52.21 (except paragraph (a)(1)). See 40 CFR § 52.2305. As the permitting authority for regulated NSR pollutants other than GHGs, TCEQ has determined the modification is subject to PSD review for non-GHG pollutants. Accordingly, under the circumstances of this project, the State will issue the non-GHG portion of the permit and EPA will issue the GHG portion.2
EPA Region 6 applies the policies and practices reflected in the EPA document entitled “PSD and Title V Permitting Guidance for Greenhouse Gases” (March 2011). Consistent with that guidance, we have not required the applicant to model or conduct ambient monitoring for GHGs, and EPA Region 6 has not required any assessment of impacts of GHGs in the context of the additional impacts analysis or Class I area provisions. Instead, EPA has determined that compliance with the BACT analysis is the best technique that can be employed at present to satisfy the additional impacts analysis and Class I area requirements of the rules related to GHGs. We note again, however, that the project has triggered review for regulated NSR pollutants that are non-GHG pollutants under the PSD permit sought from TCEQ. VI. Project Description
The proposed GHG PSD permit, if finalized, will allow the Channel Energy Center to initiate a multiphase construction of a new 180 MW natural gas-fired Siemens 501 F-series combined-cycle combustion turbine generator, identified as CTG3, with a plant-wide generating capacity of approximately 750-850 MW following the modification, depending on ambient conditions. The construction for this project will be carried out in two stages. In the initial stage, CEC proposes to construct a natural gas-fired Siemens 168 MW FD2 combined-cycle combustion turbine as described above upon issuance of the PSD GHG permit. In the final stage, the FD2 combustion turbine will be upgraded to a 180 MW FD3 combustion turbine, this involves replacement of a limited number of internal components of the turbine which will be accomplished in the timeframe of a routine outage. The modification includes improvements to the turbine blades, vanes and improved compressors seals that allow the turbine to regain generation capacity that is lost in the summer months due to hot ambient conditions. CEC plans to install the turbine using the FD2 configuration to ensure the project is online and available to supply needed power to the Electric Reliability Council of Texas (ERCOT) grid for the summer of 2014 peak season. Additional time may be required to install the parts required for an FD3 configuration, and hence
2 U.S. Environmental Protection Agency, Question and Answer Document: Issuing Permits for Sources with Dual PSD Permitting Authorities, April 19, 2011,< http://www.epa.gov/nsr/ghgdocs/ghgissuedualpermitting.pdf> (April 2011).

Channel Energy Center, LLC Page 6 of 6 Pasadena, Texas (Harris County)
a two-stage construction period is required to avoid compromising the scheduled construction and installation of the combustion turbine. CEC intends to complete the upgrade of the Siemens 501 FD2-series engine to the FD3-series within an eighteen (18) month period following commercial operation of the FD2 series unit.. Completion of construction of the initial project will occur the date that commercial operation of the FD2 phase of the project begins, or no later than eighteen (18) months after initial testing is completed in order to account for any additional work that may take place during the “shakedown period” that immediately follows first fire of the proposed turbine. The increased changes in CO2 emissions due to this modification are presented in the calculations of the original application as submitted on October 28, 2011. It was calculated that the proposed combustion turbine is an FD3-series engine will generate more CO2 emissions than the FD2-series; however, the efficiency in terms of heat rate (in Btu/kWh) is the same for both configurations. Some or all of the steam produced from the new combustion turbine will either exhaust to a dedicated Heat Recovery Steam Generator (HRSG) to produce steam or be sold to a neighboring facility. The steam produced from the HRSG is then routed to an existing shared 200 MW steam turbine unit to produce electricity for sale to the ERCOT power grid. CTG3 will be fired exclusively with pipeline-quality natural gas. However, the duct burners associated with HRSG3 will be fueled by either pipeline-quality natural gas or “off” gas provided by an adjacent refinery or a mixture of the two. Listed in the table below is a summary of the emissions for this project, a detailed analysis of the calculations can be found in the Statement of Basis Appendix, Tables 1 through 8:
Total GHG Potential Emissions – Phase 1 of Construction
Potential Emissions (Mass Basis)
TPY
CO2e Potential Emissions
TPY
CO2 984,393 CO2 984,393
CH4 25.66 CH4 539
N2O 1.82 N2O 565
SF6 0.00018 SF6 4.3 Total Potential Emissions (Mass Basis) 984,421 Total CO2e 985,501
Total GHG Potential Emissions – Phase 2 of Construction
Potential Emissions (Mass Basis)
TPY
CO2e Potential Emissions
TPY
CO2 1,002,391 1,002,39 1,002,391
CH4 26.00 CH4 546
N2O 1.86 N2O 575
SF6 0.00018 SF6 4.3 Total Potential Emissions (Mass Basis) 1,002,419 Total CO2e 1,003,516

Channel Energy Center, LLC Page 7 of 7 Pasadena, Texas (Harris County)
VII. General Format of the BACT Analysis The BACT analyses was conducted in accordance with the “Top-Down” Best Available Control Technology Guidance Document outlined in the 1990 draft U.S. EPA New Source Review Workshop Manual, which outlines the steps for conducting a top-down BACT analysis. Those steps are listed below.
(1) Identify all potentially available control options; (2) Eliminate technically infeasible control options; (3) Rank remaining control technologies; (4) Evaluate the most effective controls and document the results; and (5) Select BACT.
Also in accordance with the top-down BACT guidance, the BACT analyses also takes into account the energy, environmental, and economic impacts of the control options during step 4. Emission reductions may be determined through the application of available control techniques, process design, and/or operational limitations. Such reductions are necessary to demonstrate that the emissions remaining after application of BACT will not cause adverse environmental effects to public health and the environment. Each of the emission unit submitted in the PSD GHG application was evaluated separately in the top-down 5-step BACT analysis. VIII. Applicable Emission Units Subject to BACT
The following devices are subject to this GHG PSD permit:
• Natural Gas-Fired Combined-cycle Combustion Turbine Generator (CTG3) and Heat Recovery Steam Generator (HRSG3)
• Fugitive Natural Gas emissions from piping components (NG-FUG)
• SF6 Insulated Electrical Equipment (SF6-FUG)

Channel Energy Center, LLC Page 8 of 8 Pasadena, Texas (Harris County)
IX. GHG BACT for the Natural-Gas Fired Combined-Cycle Combustion Turbine Generator (CTG3) and Heat Recovery System Generator (HRSG3)
The new combined-cycle combustion turbine generator (CTG) is proposed to be as efficient, but with improved environmental controls, compared to the other two existing CTG at the site. If approved, initially, a Siemens 501 FD2-series combined-cycle combustion generator with a generating capacity of approximately 168 MW will be constructed and will be upgraded to a FD3-series with a electrical generating capacity of 180 MW within an 18-month period under terms of conditions of the permit. The FD3 upgrade includes improvements to the turbine blades and vanes and improved compressor seals to allow the turbine to regain generation capacity that is lost during the summer months due to hot ambient conditions. The FD3-series combustion turbine will generate more CO2 emissions on an annual basis than the FD2-series; however the efficiency, in terms of heat rate (in Btu/kWh), is the same for both series. The CTG will be fired exclusively with pipeline-quality natural gas with a fuel sulfur content of up to 5 grains of sulfur per 100 dry standard cubic feet (gr S/100 dscf). However, the duct burners associated with the HRSG will be fueled by either pipeline-quality natural gas or “off” gas provided by an adjacent refinery or a mixture of the two. With regards to BACT, the CTG3 and HRSG3 are treated as one emission unit. EPA has reviewed CEC’s BACT analysis for the two-stage construction of a natural gas-fired combined-cycle combustion turbine generator and has incorporated portions of it into EPA’s proposed BACT analysis, as summarized below. Step One: Identify All Potentially Available Control Technologies As part of the PSD review, CEC provides in the GHG permit application a 5-step top-down BACT analysis for the new combustion turbine emission unit. In this analysis, the following technologies are identified in the BACT analysis:
(A) the use of carbon capture and storage (CCS) including CO2 capture/compression, CO2 transport and CO2 storage;
(B) Inherently lower-emitting processes, practices, and designs which are further subdivided into: (1) Combustion turbine energy efficiency processes, practices and designs; (2) Heat recovery steam generator energy efficiency process, practices and designs; and (3) Plant-wide energy efficiency processes, practices, and designs;
(A) Carbon Capture and Storage
For purposes of the BACT analysis, CCS is classified as an add-on pollution control technology for “facilities emitting CO2 in large concentrations, including fossil fuel-fired power plants, and for industrial facilities with high-purity CO2 streams (e.g., hydrogen production, ammonia production, natural gas processing, ethanol production, ethylene oxide production, cement production, and iron and steel manufacturing).”3 CCS involves the
3U.S. Environmental Protection Agency, Office of Air Quality Planning and Standards, PSD and Title V Permitting Guidance for Greenhouse Gases, March 2011, <http:/www.epa.gov/nsr/ghgdocs/ghgpermittingguidance.pdf> (March 2011)

Channel Energy Center, LLC Page 9 of 9 Pasadena, Texas (Harris County)
separation and capture of CO2 from the combustion process flue gas, the pressurizing of the captured CO2 and then the transportation of the compressed CO2 by pipeline or other means of transportation, if necessary, where it is injected into a long-term geological location. Several technologies are in various stages of development and are being considered for CO2 separation and capture. As it stands currently, CCS technology and its components can be summarized in the following table adopted from IPCC’s Carbon Dioxide Capture and Storage4 report:
CCS Component CCS Technology
Capture
Post-combustion Pre-combustion
Oxy-fuel combustion Industrial separation (natural gas processing,
ammonia production)
Transportation Pipeline Shipping
Geological Storage Enhanced Oil Recovery (EOR)
Gas or oil fields Saline formations
Enhanced Coal Bed Methane Recovery (ECBM)
Ocean Storage Direct injection (dissolution type) Direct injection (lake type)
Mineral carbonation Natural silicate minerals Waste minerals
CO2 Utilization/Application Industrial Uses of CO2 (e.g. carbonated products) For large, point sources, there are three types of capture configurations – pre-combustion capture, post-combustion capture, and oxy-combustion capture:
1) Pre-combustion capture implies as named, the capture of CO2 prior to combustion. It is a technological option available to integrated coal gasification combined-cycle (IGCC) plants. In these plants, coal is gasified to form synthesis gas (syngas with key components of carbon monoxide and hydrogen). Carbon monoxide (CO) is reacted with steam to form CO2 which is then removed and the hydrogen is then diluted with nitrogen and fed into the gas turbine combined-cycle.
2) Post-combustion capture involves extracting CO2 in a purified form from the flue gas
following combustion of the fuel. Primarily for coal-fired power plants and electric generating units (EGU), other industries can benefit. Currently, all commercial post-
4 Intergovernmental Panel on Climate Change (IPCC) Special Report, Bert Metz, Ogunlade Davidson, Heleen de Coninck, Manuela Loos and Leo Meyer (Eds.), Carbon Dioxide Capture and Storage (New York: Cambridge University Press, 2005), Table SPM.2, 8. <http://www.ipcc.ch/pdf/special-reports/srccs/srccs_wholereport.pdf>

Channel Energy Center, LLC Page 10 of 10 Pasadena, Texas (Harris County)
combustion capture is via chemical absorption process using monoethanolamine (MEA)-based solvents.5
3) Oxy-combustion technology is primarily applied to coal-burning power plants where
the capture of CO2 is obtained from a pulverized coal oxy-fuel combustion in which fossil fuels are burned in a mixture of recirculated flue gas and oxygen rather than air. The remainder of the flue gas, that is not recirculated, is rich in carbon dioxide and water vapor, which is treated by condensation of the water vapor to capture the CO2.6 When combusting coal with air (which is done in nearly all existing coal-burning power plants), nitrogen is formed as byproduct of the combustion and is present in high concentrations in the flue gas. Post-combustion capture of CO2 is essentially the separation of nitrogen and carbon dioxide, which can be done but at a high cost. However if there were no nitrogen present as in the case of oxy-combustion, then CO2 capture from flue gas would be greatly simplified7. It is implied that an optimized oxy-combustion power plant will have ultra-low CO2 emissions as a result.
Once CO2 is captured from the flue gas, CO2 is compressed to 100 atmospheres (atm) or higher for ease of transport (usually by pipeline) into a storage area, in most cases, a geological storage area. It is also possible that CO2 can be stored and shipped via all different modes of transportation via land, air and sea. Geological storage of CO2 involves the injection of compressed CO2 into deep geologic formations (injection zones) overlain by competent sealing formations and geologic traps that will prevent the CO2 from escaping, there are five types of geologic formations that are considered: clastic formations; carbonate formations; deep, unmineable coal seams; organic-rich shales; and basalt interflow zones. There is a large body of ongoing research and field studies focused on developing better understanding of the science and technologies for CO2 storage.8
(B) Inherently lower-emitting processes, practices, and designs
Methods techniques and systems to increase energy efficiency is the key GHG reducing direction that falls under “lower polluting processes/practices.” Use of inherently lower-emitting technologies, including energy efficiency measures, represents an opportunity for GHG reductions in these types of BACT reviews. In some cases, a more energy efficient process or project design may be used effectively alone; where in other cases, energy efficient measure may be used effectively in tandem with end-of-stack controls to achieve additional control criteria pollutants. Applying the most energy efficient technologies at a source should in most cases translate into fewer overall emissions of all air pollutants per unit
5 Wes Hermann et al. An Assessment of Carbon Capture Technology and Research Opportunities - GCEP Energy Assessment Analysis, Spring 2005. <http://gcep.stanford.edu/pdfs/assessments/carbon_capture_assessment.pdf> 6 U.S. Department of Energy, Office of Fossil Energy, National Energy Technology Laboratory, “Oxy-Fuel Combustion”, August 2008. < http://www.netl.doe.gov/publications/factsheets/rd/R&D127.pdf> 7 Herzog et al., page 4-5 8 U.S. Department of Energy, Office of Fossil Energy, National Energy Technology Laboratory Carbon Sequestration Program: Technology Program Plan, , February 2011 <http://www.netl.doe.gov/technologies/carbon_seq/refshelf/2011_Sequestration_Program_Plan.pdf>

Channel Energy Center, LLC Page 11 of 11 Pasadena, Texas (Harris County)
of energy produced. Selecting technologies, measures and options that are energy efficient translates not only in the reduction of emissions of the particular regulated NSR air pollutant undergoing BACT review, but it also may achieve collateral reductions of emissions of other pollutants as well as GHGs. Inherently lowering emitting processes, practices, and designs is divided into two basic categories. The first category of energy efficient improvement options includes improvement options or processes that maximize the energy efficiency of the individual emissions unit. The second category of energy efficiency improvements includes options that could reduce emissions is more appropriate for new Greenfield facilities that includes equipment or processes that have the effect of lowering emissions by improving the utilization of thermal energy and electricity that is generated and used on the site.
(1) In the case of combustion turbine energy efficiency processes, practices and designs, one of the current efficient ways of generating electricity from a natural gas fuel source is through a combined-cycle design. For fossil fuel technologies, efficiency ranges from 30 to 50 percent higher heating value (HHV). A typical coal-fired Rankine cycle power plant has a base load efficiency of approximately 30% HHV while a modern F-Class natural gas fired combined-cycle turbine generator operating under optimal conditions has a baseload efficiency of approximately 50% HHV.
The combined-cycle unit operates based on a combination of two thermodynamic cycles: the Brayton and Rankine cycles. The combustion turbine operates on the Brayton cycle while the HRSG and steam turbine operate on the Rankine cycle. The combination of both of these cycles contributes to the higher efficiency of the combined-cycle power plants. While there are number of modifications to a combustion turbine generator that exist, CEC has identified the following additional processes, practices and designs that are applicable for the combined combustion turbine generator:
(a) Periodic Burner Tuning: The modern F-Class combustion turbines have a regularly scheduled maintenance program for optimal efficiency of the turbine. Three basic maintenance levels exist: combustion inspections, hot gas path inspections, and major overhauls with combustion inspections being the most common. As a part of the maintenance activity, combustors are tuned to restore the highly efficient low-emission operation.
(b) Reduction in Heat Loss: Use of insulation blankets help minimize heat loss at cooler temperatures, as well as protect personnel and nearby auxiliary equipment, insulation blankets will be deployed around the combustion turbine casing. Uses of the blankets immediately minimize any heat loss from the combustion turbine shell and increase the overall efficiency of the machine.
(c) Instrumentation and Controls: Operation of the combustion turbine is all under automatic control via the distributed control system (DCS). DCS

Channel Energy Center, LLC Page 12 of 12 Pasadena, Texas (Harris County)
oversees all aspects of the operation including fuel feed and burner operations to achieve efficient low-NOx combustion. The control system monitors the operational parameters of the unit and modulates the fuel flow and turbine operations to achieve optimal high-efficiency low-emission performance for full-load and part-load conditions.
CEC proposed the use of a new combined-cycle combustion turbine, which is more energy efficient compared with the emissions from a simple-cycle gas turbine in the following table.
GHG Control Technologies Emission Rate (lb CO2/MWh)
New combined-cycle gas CTG 774 Existing combined-cycle CTG 824-996 Simple cycle CT ~1,319
CEC has elected to construct the Siemens 501F CTG/HRSG with a CTG rated at 180 MW nominal and a duct burner-fired heat recovery steam generator (HRSG). The maximum design rated capacity of the duct burners will be 475 million British thermal units per hour (MMBtu/hr). The CTG will be fired exclusively with pipeline-quality natural gas and the HRSG will be fired with pipeline quality natural gas, “off” gas from an adjacent refining facility or a combination of the two. The Siemens 501F turbine was chosen for CEC because it has the appropriate size needed for this facility, CEC is already equipped with two (2) operating Siemens 501F turbines, and several Siemens 501F turbines are ready for use at CEC’s sister facilities. In comparison with other turbines, EPA has identified the several high energy efficient models commercially available around the 180 MW range. For a CTG, efficiency can be determined by the heat rate, which can be expressed as Btu of the fuel combusted divided by kWh of electricity produced (Btu/kWh). The lower the overall numbers, the less heat needed to produce a unit of electricity. Using data provided by the manufacturer for CTG under ISO test conditions, EPA identified the following models:
Manufacturer Model Net Plant Output (kW)9
LHV10 ISO Heat Rate (Btu/kWh)
%Net ISO Plant
Efficiency (ISO)
Rolls-Royce 2 x Trent 60 DLE 149 7,129 45.5 Rolls-Royce 2 x Trent 60 WLE ISI 153 7,281 44.5 Mitsubishi MPCP1 (M501) 167 7,000 46.3 Siemens SCC6-2000F 1x1
(FD2/FD3) 171 7,007 46.2 Hitachi 206FA 215 6,800 47.7
9 Net plant output is calculated using specific design (i.e., ISO) test criteria 10 Lower heat rate is determined by subtracting the heat of vaporization of water from the higher heating value.

Channel Energy Center, LLC Page 13 of 13 Pasadena, Texas (Harris County)
As listed in the previous table, the Siemens 501F-series turbine has a calculated efficiency of 46.2% which is a similar efficiency to the other listed natural gas-fired combined-cycle combustion turbines (efficiencies tend to range from 40% to 60% with larger kW-producing turbines typically having the highest efficiencies)11. Since age, ambient and operating conditions will affect efficiency, the heat rate numbers presented above are used to compare efficiency between turbine models and do not translate directly into permit limitations.
(2) For the heat recovery steam generator, energy efficient processes, practices and design include:
a. Heat Exchanger Design: Heat exchanger design is optimized to provide maximum heat exchange transfer from the waste heat of the combustion turbine exhaust using multiple thin-walled tubes filled with fluid and at the same time minimizing the overall size of the HRSG.
b. Insulation: Similar to the combustion turbine practice, use of insulation to
minimize heat loss to the surroundings is used to help improve the overall efficiency of the HRSG. Insulation is applied to the HRSG panels that make up the shell of the unit, to the high-temperature steam and water lines, and typically to the bottom portion of the stack.
c. Minimizing Fouling of Heat Exchange Surfaces: Since HRSGs are made up of
numerous tubes within the shell of the unit are used to generate steam from the combustion turbine, the tubes and their extended surfaces must be kept as clean as possible to maximize heat transfer. Fouling occurs from the constituents within the exhaust gas stream. To minimize fouling, filtration of the inlet air to the combustion turbine is performed. Additionally, cleaning of the tubes is performed during periodic outages.
d. Minimized Vented Steam and Repair of Steam Leaks: Routine maintenance
checks will include inspection of valves and pipes for steam leaks and re-ducting steam escaping which would result in large losses in efficiency in power generation.
The HRSG duct burners will be fueled by pipeline-quality natural gas, “off” gas from a nearby refining facility or a combination of the two. The “off” gas from the nearby facility will have a mixture of different fuels but is primarily composed of methane and hydrogen gas. As a measure of energy conservation and efficiency, CEC makes efficient use of the “off” gas from the nearby refining facility because normally the “off” gas would be combusted into the atmosphere as a waste product via flare. A “typical” analytical composition of the “off” gas is listed in the following table:
11 United States Environmental Protection Agency, Combined Heat and Power Partnership, Technology Characterization: Steam Turbines, December 2008, p.8-9 <http://www.epa.gov/chp/documents/catalog_chptech_steam_turbines.pdf>

Channel Energy Center, LLC Page 14 of 14 Pasadena, Texas (Harris County)
Formula Name Mole %
Molecular Weight (lb/ lb-
mol)
HHV (Btu/scf)
Weight %
lb mol carbon/ lb
mol component
lb mol C/ lb mol fuel
lb C/ lb fuel
CH4 Methane 42.23 16.04 1012 36.65 0.7481 0.3159 0.2408 C2H6 Ethane 10.41 30.07 1773 15.56 0.7981 0.0831 0.0633 C3H8 Propane 2.04 44.09 2524 11.65 0.8165 0.0167 0.0127 C4H10 n-Butane 0.28 58.12 3271 4.57 0.8259 0.0023 0.0018
i- C4H10 Isobutane 0.18 58.12 3261 3.47 0.8259 0.0015 0.0011 n-C5H12 n-Pentane 0.03 72.15 4020 1.99 0.8316 0.0002 0.0002 i- C5H12 Isopentane 0.05 72.15 4011 1.7 0.8316 0.0004 0.0003 C5H12 Neopentane 72.15 3994 0 0.8316 0.0000 0.0000 C6H14 n-Hexane 86.17 4768 4.72 0.8356 0.0000 0.0000 C7H16 n-Heptane 100.2 5503 0 0.8383 0.0000 0.0000 C2H4 Ethylene 2.07 28.05 1604 3.02 0.8556 0.0177 0.0135 C3H6 Propylene 0.97 42.08 2340 2.8 0.8555 0.0083 0.0063 C4H8 n-Butene 56.1 3084 1.25 0.8556 0.0000 0.0000
i- C4H8 Isobutene 56.1 3069 0 0.8556 0.0000 0.0000 C5H10 n-Pentene 70.13 3837 0 0.8556 0.0000 0.0000 C6H6 Benzene 78.11 3752 0 0.9218 0.0000 0.0000 C7H8 Toluene 92.13 4486 0 0.9118 0.0000 0.0000 C8H10 Xylene 106.16 5230 0 0.9043 0.0000 0.0000 C2H2 Acetylene 26.04 1477 0 0.9217 0.0000 0.0000 C10H8 Naphthalene 128.16 5854 0 0.9363 0.0000 0.0000
CH3OH Methyl Alcohol 32.04 868 0 0.3745 0.0000 0.0000
C2H5OH Ethyl Alcohol
46.07 1600 0 0.5209 0.0000 0.0000
H2S Hydrogen
Sulfide 0 34.08 646 0 0.0000 0.0000 0.0000 H2O Water Vapor 18.02 0 0 0.0000 0.0000 0.0000 H2 Hydrogen 31.14 2.02 325 7.45 0.0000 0.0000 0.0000 O2 Oxygen 0.7 32 0 0 0.0000 0.0000 0.0000 N2 Nitrogen 9.18 28.01 0 4.2 0.0000 0.0000 0.0000
CO Carbon
Monoxide 0.72 28.01 321 0.88 0.4284 0.0031 0.0024
CO2 Carbon Dioxide 0.002 44.01 0 0.07 0.2727 0.0000 0.0000
TOTAL 99.99 99.98
Total lb C/lb fuel 0.3424
wt %C for “off” gas 34.24%

Channel Energy Center, LLC Page 15 of 15 Pasadena, Texas (Harris County)
The use of “off” gas in the duct burners is variable based on the availability of “off” gas produced by the adjacent refinery and the need for the “off” gas as a fuel at the CEC facility. As a result, it is difficult to estimate how much “off” gas is used in the duct burners on an annual basis and resulting calculated emissions. However, based on the representative sample data presented in the table (previous page), approximately 30% of the “off” gas is hydrogen gas which does not contain any carbon and therefore does not create carbon dioxide as a by-product of combustion. In comparison, pipeline quality natural gas is typically 94% or higher of methane (CH4) which produces a proportional amount of CO2. Hence, the overall carbon content and BTU value of “off” gas or any mixture of “off” gas and natural gas will always be lower than pipeline quality natural gas. Therefore, since use of “off” gas will not result in an increase CO2e emissions compared to combusting only natural gas in the HRSG duct burners. EPA set BACT for the HRSG3 unit assuming 100% natural gas combustion.
(3) Plant-wide energy efficient processes include fuel gas preheating, drain operation, multiple combustion/HRSG trains and boiler feed pump fluid drivers.
a. Fuel gas preheating: The overall efficiency is increased with increased fuel inlet temperatures. For the F-class combustion turbine, the fuel gas is heated with high temperature water from the HRSG.
b. Drain operation: Drains are required to allow for draining the equipment for
maintenance (maintenance drains) and allow condensate to be removed from the steam piping and drains for operation (operation drains) and prevent loss of energy from the cycle.
c. Multiple combustion turbine/HRSG trains: Multiple combustion
turbine/HRSG trains help with part-load operation and allow for higher overall plant part-load efficiency by shutting down trains operating at less efficiency part-load conditions and ramping up the remaining train(s) to high-efficiency full-load operations.
d. Boiler feed pump fluid drivers: Boiler feed pumps are used as a means to
impart high pressure on the working fluid. The pumps require considerable power and to minimize the power consumption at part-loads, fluid drives are being used to minimize power consumption at part-load at part-load, improving the facility’s overall efficiency.
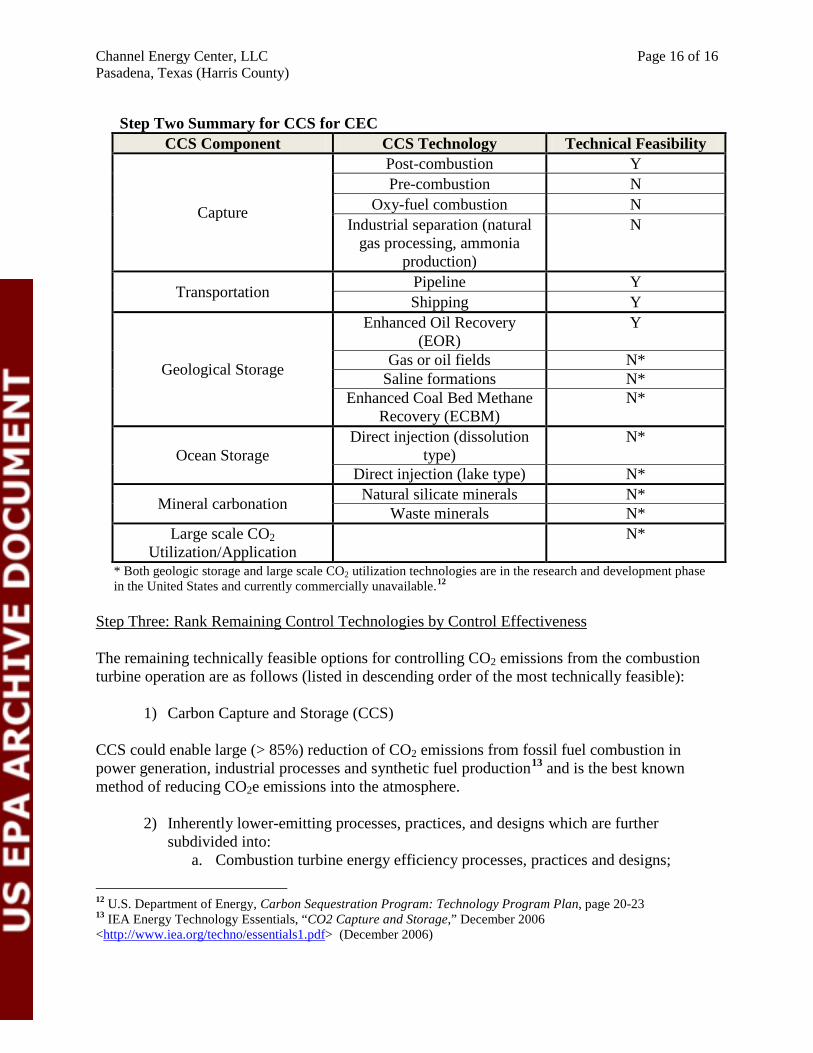
Step Two: Eliminate Technically Infeasible Control Options Based on the information reviewed for this BACT analysis, while there are some portions of CCS that are technically infeasible, EPA has determined that overall CCS technology is technologically feasible at this source. Listed below is a summary of those CCS components that are technically feasible and those CCS components that are not technically feasible for CEC.
Channel Energy Center, LLC Page 16 of 16 Pasadena, Texas (Harris County)
Step Two Summary for CCS for CEC
CCS Component CCS Technology Technical Feasibility
Capture
Post-combustion Y Pre-combustion N
Oxy-fuel combustion N Industrial separation (natural
gas processing, ammonia production)
N
Transportation Pipeline Y Shipping Y
Geological Storage
Enhanced Oil Recovery (EOR)
Y
Gas or oil fields N* Saline formations N*
Enhanced Coal Bed Methane Recovery (ECBM)
N*
Ocean Storage Direct injection (dissolution
type) N*
Direct injection (lake type) N*
Mineral carbonation Natural silicate minerals N* Waste minerals N*
Large scale CO2 Utilization/Application
N*
* Both geologic storage and large scale CO2 utilization technologies are in the research and development phase in the United States and currently commercially unavailable.12
Step Three: Rank Remaining Control Technologies by Control Effectiveness The remaining technically feasible options for controlling CO2 emissions from the combustion turbine operation are as follows (listed in descending order of the most technically feasible):
1) Carbon Capture and Storage (CCS)
CCS could enable large (> 85%) reduction of CO2 emissions from fossil fuel combustion in power generation, industrial processes and synthetic fuel production13 and is the best known method of reducing CO2e emissions into the atmosphere.
2) Inherently lower-emitting processes, practices, and designs which are further
subdivided into: a. Combustion turbine energy efficiency processes, practices and designs;
12 U.S. Department of Energy, Carbon Sequestration Program: Technology Program Plan, page 20-23 13 IEA Energy Technology Essentials, “CO2 Capture and Storage,” December 2006 <http://www.iea.org/techno/essentials1.pdf> (December 2006)

Channel Energy Center, LLC Page 17 of 17 Pasadena, Texas (Harris County)
b. Heat recovery steam generator energy efficiency process, practices and designs; and
c. Plant-wide energy efficiency processes, practices, and designs; To date, other similar facilities with a GHG BACT limit are summarized in the table below:
Company / Location
Process Description Control Device
BACT Emission Limit /
Requirements Year
Issued Reference
Lower Colorado River Authority (LCRA), Thomas C. Ferguson Plant Horseshoe Bay, TX
combined-cycle combustion turbine and heat recovery steam generator
Energy Efficiency/ Good Design & Combustion Practices
Combustion turbine annual net heat rate limited to 7,720 Btu/kWh (HHV) GHG BACT limit of 0.459 tons CO2/MWh (net) 365-day average, rolling daily for the combustion turbine unit Fugitive methane emissions and SF6 emissions are monitored and maintained using best practice standards.
2011 PSD-TX-1244-GHG
Palmdale Hybrid Power Plant Project Palmdale, CA
combined-cycle combustion turbine and heat recovery steam generator, plus a 50 MW solar array*
Energy Efficiency/ Good Design & Combustion Practices, and use of the solar array
Combustion turbine annual net heat rate limited to 7,319 Btu/kWh (HHV) GHG BACT limit of 0.387 tons CO2/MWh (net) 365-day average, rolling daily for the combustion turbine unit Auxiliary boiler and heater heat input limit of 110 MMBtu/hr and 500 hours operation on 365-day rolling total SF6 Circuit Breakers BACT limit of 9.56 tpy CO2e
2011 SE 09-01
Calpine Russell City Energy
600 MW combined-cycle power
Energy Efficiency/ Good Design & Combustion
Combustion turbine Operational limit of 2,038.6 MMBtu/kWh
2011 15487

Channel Energy Center, LLC Page 18 of 18 Pasadena, Texas (Harris County)
Hayward, CA
plant Practices Fire Pump Diesel Engine GHG BACT limit of 7.6 tpy CO2e SF6 Circuit Breaker annual limit of 39.3 tpy CO2e
PacifiCorp Energy Lakeside, UT
combined-cycle turbine
Energy Efficiency/ Good Design & Combustion Practices
Combustion turbine BACT limit of 950 lb CO2e/MWh
2011 DAQE-IN0130310010-11
Kennecott Utah Copper- Repowering South Jordan, UT
275 MW combined combustion
Energy Efficiency/ Good Design & Combustion Practices
Combustion turbine BACT limit of 1,162,552 tpy CO2e rolling 12-month period
2011 DAQE-IN105720026-11
Calpine Deer Park Energy Center (DPEC) Deer Park, TX
180 MW combined-cycle combustion turbine generator and heat recovery steam generator
Energy Efficiency/ Good Design & Combustion Practices
Combustion turbine annual net heat rate limited to 7,728 Btu/kWh (HHV) GHG BACT limit of 0.460 tons CO2/ MWh (net) on 30-day rolling average Annual limit of 1,045,635 tons CO2e for the FD2 CTG and 1,063,650 CO2e for the FD3 CTG on a 365-day average, rolling daily Fugitive methane emissions and SF6 emissions are monitored and maintained using best practice standards and Auditory, Visual, and Olfactory (AVO) Monitoring
2012 (currently on Public Notice)
PSD-TX-979-GHG
*Palmdale is unique as the applicant proposed to include, and thus the BACT analysis and eventual limit included, use of a solar component that includes up to 50 MW of potential solar thermal power generation, which represents an inherently lower-emitting technology for that proposed facility. Step Four: Evaluate Top Control Alternatives - Economic, Energy, and Environmental Impacts EPA Region 6 reviewed CEC’s CCS cost estimate and believes the overall cost estimation is financially prohibitive given the high cost of this GHG control strategy in comparison to the overall cost of the project. CCS costs include installation and operation of carbon capture

Channel Energy Center, LLC Page 19 of 19 Pasadena, Texas (Harris County)
controls and construction of a new pipeline to transport the CO2 approximately 15 miles14 (24 kilometers) to the closest site with recognized potential for geological storage of CO2, which is the enhanced oil recovery (EOR) operations located at the Hastings oil field, southwest of Houston, Texas. The bulk of the cost for CCS is attributable to the post-combustion capture and compression system, and the additional operating cost estimates are listed in detail in Table 9 of Statement of Basis Appendix. As it stands, the estimated cost to construct and install a CCS system to the turbine is approximately $113 million15, around 50% of the cost of a typical gas-fired combined cycle turbine without CCS. Additionally CEC, using EPA guidance documents, has provided an estimation that the overall average operating costs for the entire CCS system could add approximately $80 million annually (See Statement of Basis Appendix). While CEC has provided information suggesting that annual operating costs for CCS could increase overall costs by as little as 20%16, EPA notes that CEC arrives at this figure by including the lowest estimated cost for each and every step of the CCS process. CEC’s analysis also included an estimate of the annual operating costs for CCS if the highest costs were needed for each and every step of the CCS process, and estimated the annual operating cost increase to be approximately 58%. Since it is unlikely that either the lowest costs or the highest costs could be achieved for each and every step of the process, EPA has instead relied upon the average costs and determined that the average combined costs of installation and operation of a CCS system still makes CCS economically infeasible for this project. In addition, EPA notes that implementing CCS would result in energy penalty simply because the CCS process will use energy produced by the plant. This may, in turn, potentially increase the natural gas fuel use of the plant, with resulting increases in emissions of non-GHG pollutants, to overcome these efficiency losses, or would result in less energy being produced for use on the grid. The Report of the Interagency Task Force on Carbon Capture and Storage has estimated that an energy penalty of as much as 15% would result from inclusion of CO2 capture (Reference 4, page A-14) and an overall loss of energy efficiency of approximately 7%17. It was concluded in the same report18 that while CCS is technically feasible at this time, the costs for the capture and compression of CO2 remains the biggest barrier to widespread commercialization of CCS. Therefore, CCS has been eliminated as BACT for this particular project based upon research and analysis showing that there is a significant negative economic impact due to the additional projected capital costs of implementing and operating CCS as the control technology at the proposed combustion turbine. In addition, the potential negative environmental and energy impacts of increased non-GHG pollutant emissions, the overall loss in energy efficiency, and/or
14University of Texas at Austin, Bureau of Economic Geology, Gulf Coast Carbon Center, <http://www.beg.utexas.edu/gccc/miocene/> 15 Natural Gas Combined-Cycle Plants With and Without Carbon Capture & Sequestration, DOE <http://www.netl.doe.gov/energy-analyses/pubs/deskreference/B_NGCC_051507.pdf> 16 The minimum cost factor found for implementation/operation of the CO2 capture systems within the cost-related information reviewed for CCS technology was found from the “Properties” section of the Greenhouse Gas Mitigation Strategies Database ( last accessed April 2010) (<http:/ghg.ie.unc.edu:8080/GHGMDB/#data>), which was obtained through the EPA GHG web site (<http://www.epa.gov/nsr/ghgpermitting.html>). 17 IPCC Special Report of the Interagency Task Force on Carbon Capture and Storage (August 2010) 18 Ibid., p. 33-51

Channel Energy Center, LLC Page 20 of 20 Pasadena, Texas (Harris County)
decreased energy produced for use on the grid also provide a basis for excluding CCS as BACT for this facility. Step Five: Select BACT CEC intends to initially construct and install an FD2-series combustion turbine with plans to modify it within an eighteen (18) month period after commercial operation of the FD-2 series turbine to the FD3-series combustion turbine. The proposed BACT limits are in terms of efficiency measured in units of Btu of fuel energy consumed in order to generate a kilowatt of electric energy (Btu/kWh). Since CCS has been eliminated as BACT for CTG3, then BACT for the new combined-cycle combustion turbine is the high efficiency processes, practices and designs which are made enforceable by output-based and annual BACT limits. The average heat rate in terms of Btu/kWh (HHV) will be the same for the FD2 configuration as the FD3 configuration when in continuous operation, since the FD2-series and FD3-series combustion turbines have the same efficiency. However, the FD3 configuration provides greater output at high ambient temperatures during base load periods. Therefore, for the FD3, the potential annual electric generation (MWh) and fuel usage, as well as corresponding GHG emissions, will be higher on an annual basis, maximum CO2e potential emissions will increase by only two percent (2%) from 1,045,635 tons for the FD2-series to 1,063,650 tons of CO2e for the FD3-series combustion turbine (see Statement of Basis Appendix, Tables 1 and 2). a) Degradation consideration for combined-cycle combustion turbine generator efficiency To establish an enforceable BACT condition that can be achieved over the life of the facility, it is important that the permit limit accounts for the anticipated degradation of the equipment over time between regular maintenance cycles. A 48,000-operating-hour degradation curve provided by the manufacturer, Siemens, reflects anticipated recoverable and non-recoverable degradation in heat rate between major maintenance overhauls of approximately five percent (5%). The results of the degradation curves differentiate between “recoverable” and “non-recoverable” degradation. Components of the turbine and combustion system subject to high thermal and mechanical stress are designed for periodic refurbishment or replacement. The turbine components most affected by the combustion process include combustion liners, fuel nozzle assemblies, transition pieces, turbine nozzles, stationary shrouds, and turbine buckets. These components are often referred to as “hot gas path” components. “Recoverable” degradation is mostly attributable to turbine blade fouling due to impurities in intake air and fuel. This type of degradation can be mitigated through inspection programs, on-line turbine water washes, instrument calibration, and other maintenance activities. “Non-recoverable” degradation is mainly attributed to blade surface roughness, erosion and blade tip rubs and cannot be restored upon a maintenance overhaul. The manufacturer’s degradation results only account for the anticipated degradation within the first 48,000 hours of the gas turbine’s useful life; they do not reflect any potential increase in this rate of degradation which might be expected after the first major overhaul and/or as the equipment approaches the end of its useful life. Further, the projected 5% degradation rate represents the average, and not the maximum or guaranteed rate of degradation for the turbines. Therefore, CEC proposes that, for the purposes of deriving an enforceable BACT limit on the

Channel Energy Center, LLC Page 21 of 21 Pasadena, Texas (Harris County)
proposed facility’s heat rate, gas turbine degradation may be reasonably be estimated at six percent (6%) of the facility’s heat rate. Finally, in addition to the heat rate degradation from normal wear and tear on the turbines, CEC also suggested a compliance margin based on potential degradation in other elements of the combined-cycle plant that would cause the overall plant heat rate to rise (i.e., cause efficiency to fall). CEC proposed a 3% degradation rate to account for these factors. The other elements of the combined-cycle plant include the following:
• Degradation in Turbine Exhaust Flow: The gas turbine manufacturer’s degradation curves predict potential recoverable and non-recoverable degradation in gas turbine exhaust flow over the 48,000-maintenance cycle. This degradation in exhaust flow could result in a direct reduction in the ability of the steam turbine to generate power, which could further degrade the plant’s overall efficiency. While degradation in the exhaust flow is expected to be partially offset by degradation in exhaust temperature (which raises over the maintenance cycle), this offset is not expected to make up for anticipated degradation in the reduction in steam turbine power as a result of reduced exhaust flow.
• Degradation in Performance of Steam Turbine and Other Equipment: Degradation in the performance of the heat recovery steam generator, steam turbine, heat transfer, cooling tower, and ancillary equipment such as pumps and motors is also expected to occur over the course of a major maintenance cycle.
b) BACT Limit: By establishing the energy efficiency for the combined-cycle turbine as BACT, permit conditions must be developed to ensure that CEC installs and operate an energy efficient turbine in an energy efficient manner. EPA has developed an emission limit in tons of GHG per MWh produced that must be met during the initial and periodic stack testing. Since ambient conditions can affect the efficiency during a stack test and cannot be predicted at this time, the emission limit is being set using International Organization for Standardization (ISO) conditions. ISO 3977-2 is corrected for the following conditions: • Ambient Dry Bulb Temperature: 59oF • Ambient Relative Humidity: 60% • Barometric Pressure: 14.69 psia • Fuel Lower Heating Value: 20,647 Btu/lb • Fuel HHV/LHV Ratio: 1.1086 1) BACT Limit for the Combined-Cycle Combustion Turbine Generator To ensure CEC operates its facility to minimize greenhouse gases, EPA proposes to establish a CO2 emission limit/MWh. To determine an appropriate heat rate limit for continuous operations, the baseline annual average heat rate (HHV) of 6,852 Btu/kWh is used with the 3.3% design margin taken into account followed by a six percent (6%) performance margin reflecting

Channel Energy Center, LLC Page 22 of 22 Pasadena, Texas (Harris County)
efficiency losses due to equipment degradation prior to maintenance overhauls, and then a three percent (3%) degradation margin reflecting the variability in operation in auxiliary plant equipment due to use over time, resulting in the annual average heat rate (HHV) of 7,728 Btu/kWh (See Statement of Basis Appendix, Table 4). Additionally, to determine the heat input limit for this facility, the heat rate is calculated assuming that all steam generated in the heat recovery steam generator is used to generate electricity in the existing on-site steam turbine even though there are periods when some or all of the generated steam is sold to a neighboring facility rather than sent to the on-site steam turbine. The proposed GHG PSD permit, if approved, requires an output-based BACT limit of 0.460 tons CO2/MWh (net) for both the FD2 and FD3 engines on a 30-day rolling average and an annual GHG BACT limit of 985,340 tons CO2e per year for the FD2 series engine and 1,003,355 tons of CO2e per year for the FD3 series engine on a 365-day rolling average. This is with the understanding that the FD2 series will be upgraded to the FD3 series within a statutory timeframe of 18 months under the conditions of this permit. In establishing an enforceable BACT limit over the lifetime of the turbine, Calpine accounted for the anticipated degradation of the equipment over time between regular maintenance cycles, as discussed in this section. (See Statement of Basis Appendix, Table 4 for calculations) c) Operating Conditions Listed below are the operating conditions and work practices for the heat recovery steam
generator and the plant-wide operations that ensure that CTG3 is operating at the highest possible efficiency.
1) HRSG3 Unit Operating Conditions The Heat Recovery Steam Generator (HRSG3) energy efficiency processes, practices and designs considered include:
i. Energy efficient heat exchanger design. In this design, each pressure level incorporates an economizer section(s), evaporator section, and superheater section(s);
ii. Addition of insulation to the HRSG3 panels, high-temperature steam and water lines and to the bottom portion of the stack;
iii. Filtration of the inlet air to the combustion turbine and periodic cleaning of the tubes (performed at least every 18 months) is performed to minimize fouling; and
iv. Minimization of steam vents and repairs of steam leaks.
2) Plant Wide Operating Conditions Within the combined-cycle power plant, several plant-wide, overall energy efficiency processes, practices and designs are included as BACT requirements because the additional operating conditions/practices help maintain the efficiency of the turbine. The requirements include:

Channel Energy Center, LLC Page 23 of 23 Pasadena, Texas (Harris County)
i. Fuel gas preheating. For the F-class combustion turbine based combined-cycle, the fuel gas is pre-heated to temperature of approximately 300oF with high temperature water from the HRSG;
ii. Drain operation. Operation drains are controlled to minimize the loss of energy from the cycle but closing the drains as soon as the appropriate steam conditions are achieved;
iii. Multiple combustion turbine/HRSG trains. Multiple combustion turbine/HRSH trains help with part-load operation. A higher overall plant part-load efficiency is achieved by shutting down trains operating at less efficient part-load conditions and ramping up the remaining train(s) to high-efficiency full-load operation;
iv. Boiler feed pump fluid drives. To minimize the power consumption at part-loads, the use of fluid drives or variable-frequency drives are used to minimize the power consumption at part-load conditions;
d) BACT Compliance: For both the FD2 and FD3-series, the combined-cycle combustion turbine unit is designed with a number of features to improve the overall efficiency. The additional combustion turbine design features include:
1. Periodic burner tuning as part of a regularly scheduled maintenance program to help ensure a more reliable operation of the unit and maintain optimal efficiency; 2. Insulation blankets are utilized to minimize the heat loss through the combustion turbine shell and help improve the overall efficiency of the machine; and 3. Air will be used to cool the generators resulting in a lower electrical loss and higher unit efficiency.
Calpine CEC’s proposed method to demonstrate compliance with the CO2 emission limit of 0.460 tons of CO2 per MWh (net)19 established as BACT by using fuel flow meters to monitor the quantity of fuel combusted in the electric generating unit and performing periodic scheduled fuel sampling pursuant to 40 CFR 75.10(3)(ii) and the procedures listed in 40 CFR 75, Appendix G. Results of the fuel sampling will be used to calculate a site-specific Fc factor, and that factor will be used in the equation below to calculated CO2 mass emissions. As an alternative, Calpine may determine the CO2 hourly emission rate and CO2 mass emissions using an O2 monitor pursuant to 40 CFR Subpart 75 and Appendix F of 40 CFR Subpart 75. The proposed permit also includes an alternative compliance demonstration method in which Calpine CEC may install, calibrate, and operate a CO2 CEMS and volumetric stack gas flow monitoring system with an automated data acquisition and handling system for measuring and recording CO2 emissions. To demonstrate compliance with the CO2 BACT limit of 0.460 tons of CO2 per MWh
19 Output-based limit is based on ton of CO2 versus ton of CO2e per megawatt-hour because all emissions determined by compliance monitoring in accordance to 40 CFR Part 75 are done in lbs of CO2 as opposed to lbs of CO2e.

Channel Energy Center, LLC Page 24 of 24 Pasadena, Texas (Harris County)
(net) using CO2 CEMS, the measured hourly CO2 emissions are divided by the net hourly energy output and averaged daily. Currently, the two existing natural gas-fired turbines at CEC utilize fuel flow meters and monthly GCV (Gross Calorific Value) sampling in order to comply with the Acid Rain quality assurance and monitoring requirements of 40 CFR 75, Appendix D and G. The proposed natural gas-fired turbine identified as CTG3/HRSG3 will also comply with the fuel flow metering and GCV sampling requirements listed in Appendix D. Calpine CEC proposes to determine a site-specific Fc factor using the ultimate analysis and GCV in equation F-7b of 40 CFR 75, Appendix F. The site-specific Fc factor will be re-determined annually in according to 40 CFR 75, Appendix F, §3.3.6. The equation for estimating CO2 emissions as specified in 40 CFR 75.10(3)(ii) is as follows:
Where:
WCO2 = CO2 emitted from combustion, tons/hour MWCO2 = molecular weight of CO2, 44.0 lbs/mole Fc = Carbon-based Fc-Factor, 1040 scf/MMBtu for natural gas or site-specific Fc factor H = hourly heat input in MMBtu, as calculated using the procedure in 40 CFR 75, Appendix F, §5
Uf = 1/385 scf CO2/lb-mole at 14.7 psia and 68°F
CEC is subject to all applicable requirements for fuel flow monitoring and quality assurance pursuant to 40 CFR 75, Appendix D, which includes:
• Fuel flow meter- meets an accuracy of 2.0%, required to be tested once each calendar quarter pursuant to 40 CFR 75, Appendix D, §2.1.5 and §2.1.6(a))
• Gross Calorific Value (GCV)- determine the GCV of pipeline natural gas at least once per calendar month pursuant to 40 CFR 75, Appendix D, §2.3.4.1
If oxygen analyzers are used for compliance, CEC is subject to all applicable requirements for the oxygen analyzers and quality assurance using cylinder gas audits (CGAs) at least quarterly in accordance with 40 CFR Part 60, Appendix F, Procedure 1, § 5.1.2, with the following exception: a relative accuracy test audit is not required once every four quarters (i.e., two successive semiannual CGAs may be conducted). CEC may comply with the quality assurance provisions of 40 CFR Part 75, Appendix B, in lieu of complying with the provisions of 40 CFR Part 60, Appendix F. The emission limits associated with CH4 and N2O are calculated based on emission factors provided in 40 CFR Part 98, Table C-2 and the actual heat input (HHV). To calculate the CO2e emissions, the draft permit requires calculation of the emissions based on the procedures and Global Warming Potentials (GWP) contained in the Greenhouse Gas Regulations, 40 CFR Part 98, Subpart A, Table A-1. Records of the calculations would be required to be kept to demonstrate compliance with the emission limits on a 365-day average, rolling daily. Emissions from CH4 and N2O are very low compared to the emissions from CO2 which contribute the most (greater than 99%) to the overall emissions from the CTGs, so additional emissions analysis is

Channel Energy Center, LLC Page 25 of 25 Pasadena, Texas (Harris County)
not required for CH4 and N2O. In addition, while an initial stack test demonstration will be required for CO2 emissions from emission unit, an initial stack test demonstration for CH4 and N2O emissions is not required because the CH4 and N2O emission are approximately 0.09% of the total CO2e emissions from the CTGs and are considered a de minimis level in comparison to the CO2 emissions. For startup and shutdown operating scenarios for the proposed CTG, BACT will be achieved by minimizing the duration of the start-up and shutdown events, consistent with market demands, and by engaging the pollution control equipment (e.g., the SCR system in combined-cycle) as soon as practicable, based on vendor recommendations and guarantees. During periods of startup and shutdown, the permittee must record the time, date, fuel heat input (HHV) in MMBtu/hr and the duration of each startup and shutdown event. All emissions during startup and shutdown are minimized by limiting the duration of operation. The estimated 70 tons/hour (See Statement of Basis Appendix, Table 5) illustrate that startup and shutdown emissions are lower than “normal” emissions and are accounted for in the Annual Facility Emissions (Statement of Basis Appendix, Table 1). To demonstrate compliance with the startup and shutdown emissions, Calpine shall record the time, date, fuel heat input and duration of each startup and shutdown event. The duration of operation during startup and shutdown are defined as follows:
1. A startup of CTG3 is defined as the period that begins when there is measureable fuel flow to the CTG3 and ends when the CTG3 load reaches 60 percent. A startup for each CTG3 is limited to 480 minutes.
2. A shutdown of each CTG3 is defined as the period that begins when CTG3 load falls below 60 percent and ends when there is no longer measureable fuel flow to CTG3. A shutdown for CTG3 is limited to 180 minutes.
Under draft terms, records of all emission limit calculations and startup and shutdown events shall be kept on-site for a period of 5-years. After review of the submitted materials, EPA agrees with and adopts Calpine’s BACT analysis for the natural gas-fired combined-cycle combustion turbines. X. GHG BACT for the Fugitive Emission Sources (NG-FUG/Fuel Gas Piping) Step One: Identify All Potentially Available Control Technologies The control technology for process fugitive emissions of GHGs are: • Leakless Technology • Instrument Leak detection and repair (LDAR) programs • Remote Sensing • Auditory, Visual, and Olfactory (AVO) Monitoring Step Two: Eliminate Technically Infeasible Control Options • Leakless Technology – Leakless technology valves may be incorporated in situations where
highly toxic or otherwise hazardous materials are present. Likewise, some technologies, such as bellows valves, cannot be repaired without a unit shutdown. Because natural gas is not considered highly toxic nor a hazardous material, this gas does not warrant the risk of unit

Channel Energy Center, LLC Page 26 of 26 Pasadena, Texas (Harris County)
shutdown for repair, and therefore leakless valve technology for fuel lines is considered technically impracticable.
• Instrument LDAR Programs – Is considered technically feasible. • Remote Sensing – Is considered technically feasible. • AVO Monitoring – Is considered technically feasible.
Step Three: Rank Remaining Control Technologies by Control Effectiveness Instrument LDAR programs and the alternative work practice of remote sensing using an infrared camera have been determined by EPA to be equivalent methods of piping fugitive controls.20 The most stringent LDAR program, 28LAER, provides for 97% control credit for valves, flanges, and connectors. As-observed AVO methods are generally somewhat less effective than instrument LDAR and remote sensing, since they are not conducted at specific intervals. However, since pipeline natural gas is odorized with very small quantities of mercaptan, as-observed olfactory observation is a very effective method for identifying and correcting leaks in natural gas systems. Due to the pressure and other physical properties of plant fuel gas, as-observed audio and visual observations of potential fugitive leaks are likewise moderately effective. Step Four: Evaluate Top Control Alternatives Although instrument LDAR and/or remote sensing of piping fugitive emissions in natural gas lines may be somewhat more effective than as-observed AVO methods, these methods are not economically practicable for GHG control from components in fuel gas service. The incremental GHGs controlled by implementation of the 28LAER or a comparable remote sensing program is less than 156 tons CO2e per year, or 0.01% of the total project’s proposed CO2e emissions. Step Five: Select BACT EPA has reviewed and CEC’s Fugitive Emission Sources top-down BACT analysis. Based on the economic impracticability of instrument monitoring and remote sensing for fuel gas piping components, EPA proposes to incorporate as-observed AVO as BACT for the piping components in new combustion turbine generator and heat recovery steam generator and proposes an annual BACT emission limit of 157 tons per year CO2e. Calpine also identified and adopted the use of dry compressor seals, use of rod packing for reciprocating compressors, and the use of low-bleed gas-driven pneumatic controllers or air-driven pneumatic controllers as BACT for fugitives. EPA determines that the AVO program for fugitives for control of CH4 emissions is BACT. XI. GHG BACT for the SF6 Insulated Electrical Equipment (SF6-FUG) 20 73 FR 78199-78219, December 22, 2008.
Channel Energy Center, LLC Page 27 of 27 Pasadena, Texas (Harris County)
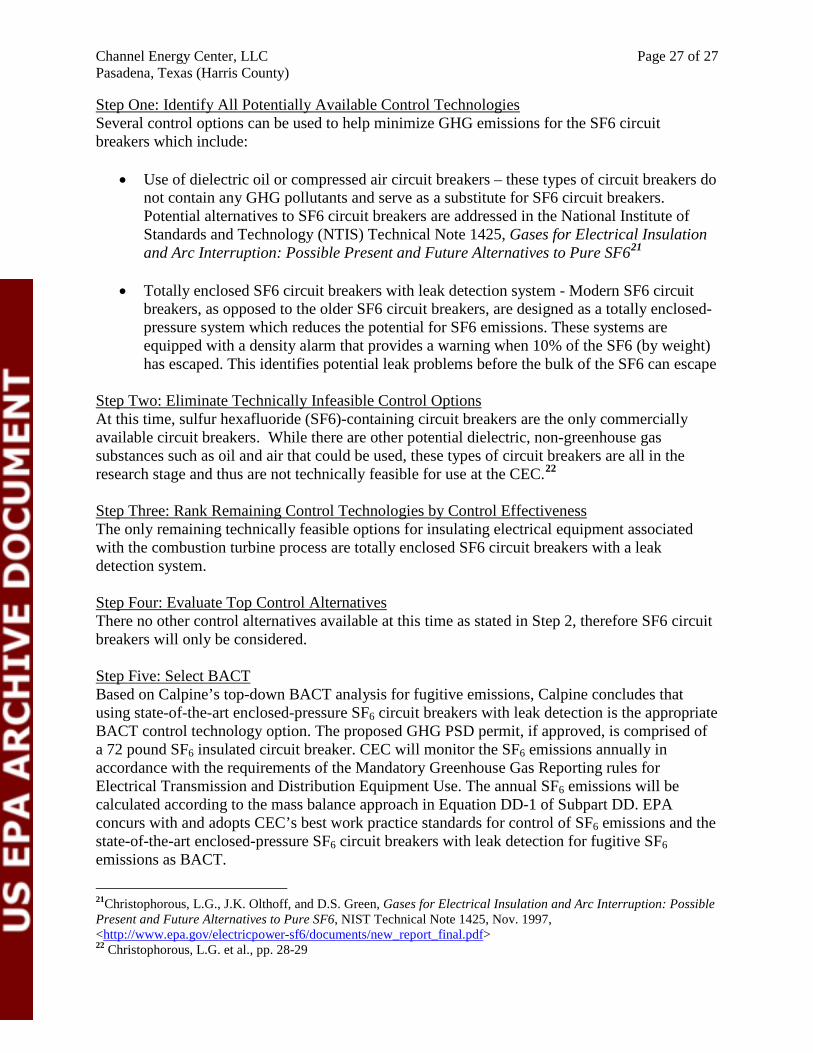
Step One: Identify All Potentially Available Control Technologies Several control options can be used to help minimize GHG emissions for the SF6 circuit breakers which include:
• Use of dielectric oil or compressed air circuit breakers – these types of circuit breakers do not contain any GHG pollutants and serve as a substitute for SF6 circuit breakers. Potential alternatives to SF6 circuit breakers are addressed in the National Institute of Standards and Technology (NTIS) Technical Note 1425, Gases for Electrical Insulation and Arc Interruption: Possible Present and Future Alternatives to Pure SF621
• Totally enclosed SF6 circuit breakers with leak detection system - Modern SF6 circuit breakers, as opposed to the older SF6 circuit breakers, are designed as a totally enclosed-pressure system which reduces the potential for SF6 emissions. These systems are equipped with a density alarm that provides a warning when 10% of the SF6 (by weight) has escaped. This identifies potential leak problems before the bulk of the SF6 can escape
Step Two: Eliminate Technically Infeasible Control Options At this time, sulfur hexafluoride (SF6)-containing circuit breakers are the only commercially available circuit breakers. While there are other potential dielectric, non-greenhouse gas substances such as oil and air that could be used, these types of circuit breakers are all in the research stage and thus are not technically feasible for use at the CEC.22 Step Three: Rank Remaining Control Technologies by Control Effectiveness The only remaining technically feasible options for insulating electrical equipment associated with the combustion turbine process are totally enclosed SF6 circuit breakers with a leak detection system. Step Four: Evaluate Top Control Alternatives There no other control alternatives available at this time as stated in Step 2, therefore SF6 circuit breakers will only be considered. Step Five: Select BACT Based on Calpine’s top-down BACT analysis for fugitive emissions, Calpine concludes that using state-of-the-art enclosed-pressure SF6 circuit breakers with leak detection is the appropriate BACT control technology option. The proposed GHG PSD permit, if approved, is comprised of a 72 pound SF6 insulated circuit breaker. CEC will monitor the SF6 emissions annually in accordance with the requirements of the Mandatory Greenhouse Gas Reporting rules for Electrical Transmission and Distribution Equipment Use. The annual SF6 emissions will be calculated according to the mass balance approach in Equation DD-1 of Subpart DD. EPA concurs with and adopts CEC’s best work practice standards for control of SF6 emissions and the state-of-the-art enclosed-pressure SF6 circuit breakers with leak detection for fugitive SF6 emissions as BACT.
21Christophorous, L.G., J.K. Olthoff, and D.S. Green, Gases for Electrical Insulation and Arc Interruption: Possible Present and Future Alternatives to Pure SF6, NIST Technical Note 1425, Nov. 1997, <http://www.epa.gov/electricpower-sf6/documents/new_report_final.pdf> 22 Christophorous, L.G. et al., pp. 28-29

Channel Energy Center, LLC Page 28 of 28 Pasadena, Texas (Harris County)
XII. Threatened and Endangered Species Pursuant to Section 7(a)(2) of the Endangered Species Act (ESA) (16 U.S.C. 1536) and its implementing regulations at 50 CFR Part 402, EPA is required to insure that any action authorized, funded, or carried out by EPA is not likely to jeopardize the continued existence of any federally-listed endangered or threatened species or result in the destruction or adverse modification of such species’ designated critical habitat.
To meet the requirements of Section 7, EPA is relying on a Biological Assessment (BA) prepared by the applicant and reviewed by EPA. Further, EPA designated CEC as its non-federal representative for purposes of preparation of the BA and for conducting informal consultation. A draft BA has identified twelve (12) species as federally endangered or threatened in Harris County by the U.S. Fish and Wildlife Service (USFWS), National Marine Fisheries Service (NMFS) and the Texas Parks and Wildlife Department (TPWD). EPA has determined that issuance of the proposed permit to CEC for construction of the combustion turbine generator/heat recovery steam generator will have no effect on five (5) of these listed species, specifically the smalltooth sawfish (Pristis pectinata), the red-cockaded woodpecker (Picoides borealis), the whooping crane (Grus americana), the Louisiana black bear (Ursus americanus luteolus), and the red wolf (Canis rufus). These species are either thought to be extirpated from the county or Texas or are not present in the action area. The remaining seven (7) species identified are species that may be present in the action area in certain circumstances. As a result of this potential occurrence and based on the information provided in the draft BA, the issuance of the permit may affect, but is not likely to adversely affect the following species. As a result, EPA will submit the final draft BA to the Southwest Region, Clear Lake, Texas Ecological Services Field Office of the USFWS for its concurrence that issuance of the permit may affect, but is not likely to adversely affect the following species:
• Houston toad (Bufo houstonensis). • Texas prairie dawn-flower (Hymenoxys texana).
EPA will also submit the final draft BA to the NOAA Southeast Regional Office, Protected Resources Division of NMFS for its concurrence that issuance of the permit may affect, but is not likely to adversely affect the following species:
• leatherback sea turtle (Dermochelys coriacea) • green sea turtle (Chelonia mydas) • Kemp’s ridley sea turtle (Lepidochelys kempii) • loggerhead sea turtle (Caretta caretta) • West Indian manatee (Trichechus manatus)

Channel Energy Center, LLC Page 29 of 29 Pasadena, Texas (Harris County)
Any interested party is welcome to bring particular concerns or information to our attention regarding this project’s potential effect on endangered species. The final draft biological assessment can be found at EPA’s Region 6 Air Permits website at http://yosemite.epa.gov/r6/Apermit.nsf/AirP. XIII. Magnuson-Stevens Act The 1996 Essential Fish Habitat (EFH) amendments to the Magnuson-Stevens Fishery Conservation and Management Act (Magnuson-Stevens Act) set forth a mandate for NOAA’s National Marine Fisheries Service (NMFS), regional fishery management councils (FMC), and other federal agencies to identify and protect important marine and anadromous fish habitat. To meet the requirements of the Magnuson-Stevens Act, EPA is relying on an EFH Assessment prepared by the applicant and reviewed by EPA. Tidally influenced portions of the Buffalo Bayou (Houston Ship Channel) which connects to Upper Galveston Bay are located less than one mile from the project site. These tidally influenced portions have been identified as potential habitats of postlarval, juvenile, and subadult red drum (Sciaenops ocellatus), Spanish mackerel (Scomberomorus maculatus), pink shrimp (Penaeus duorarum), white shrimp (Penaeus setiferus) and brown shrimp (Farfantepenaeus aztecus). The EFH Amendment information was obtained from the Gulf of Mexico Fishery Management Council (http://www.gulfcouncil.org/). Based on the information provided in the EFH Assessment, EPA concludes that the proposed PSD permit allowing CEC to construct the combustion turbine generator/heat recovery generator, identified as CTG3/HRSG3, will have no adverse impacts on listed marine and fish habitats.
XIV. National Historic Preservation Act (NHPA) Section 106 of the NHPA requires EPA to consider the effects of this permit action on properties eligible for inclusion in the National Register of Historic Places. To make this determination, EPA relied on a cultural resource report prepared by Blanton and Associates, Inc. (“Blanton”), CEC’s consultant, submitted on May 4, 2012. Blanton conducted an a cultural resource review within a 1,000-meter radius area of potential effect (APE) of the construction site which included a review of the Texas Historical Commission’s online Texas Archaeological Site Atlas (TASA) and a pedestrian survey. Based on the information provided in the cultural resources report, no archaeological resources or historic structures were found within the APE. The construction site is located in a modern industrial facility in a highly developed, industrialized zone surrounded by oil and gas refineries. Upon receipt of the report, EPA sent letters to Indian tribes identified by the Texas Historical Commission as having historical interests in Texas to inquire if any of the tribes have historical

Channel Energy Center, LLC Page 30 of 30 Pasadena, Texas (Harris County)
interest in the particular location of the project and to inquire whether any of the tribes wished to consult with EPA in the Section 106 process. EPA received no tribal requests for participation as a consulting party or comments about the project. After considering the report submitted by the applicant, EPA Region 6 determines that because no historic properties are located within the APE and that a potential for the location of archaeological resources within the construction footprint itself is low, issuance of the permit to CEC will not affect properties potentially eligible for listing on the National Register. EPA will provide a copy of this report to the State Historic Preservation Officer for consultation and concurrence with this determination. Any interested party is welcome to bring particular concerns or information to our attention regarding this project’s potential effect on historic properties. XV. Environmental Justice (EJ) Executive Order (EO) 12898 (59 FR 7629 (Feb. 16, 1994)) establishes federal executive branch policy on environmental justice. Based on this Executive Order, the EPA’s Environmental Appeals Board (EAB) has held that environmental justice issues must be considered in connection with the issuance of federal Prevention of Significant Deterioration (PSD) permits issued by EPA Regional Offices [See, e.g., In re Prairie State Generating Company, 13 E.A.D. 1, 123 (EAB 2006); In re Knauf Fiber Glass, Gmbh, 8 E.A.D. 121, 174-75 (EAB 1999)]. This permitting action, if finalized, authorizes emissions of GHG, controlled by what we have determined is the Best Available Control Technology for those emissions. It does not select environmental controls for any other pollutants. Unlike the criteria pollutants for which EPA has historically issued PSD permits, there is no National Ambient Air Quality Standard (NAAQS) for GHG. The global climate-change inducing effects of GHG emissions, according to the “Endangerment and Cause or Contribute Finding”, are far-reaching and multi-dimensional (75 FR 66497). Climate change modeling and evaluations of risks and impacts are typically conducted for changes in emissions that are orders of magnitude larger than the emissions from individual projects that might be analyzed in PSD permit reviews. Quantifying the exact impacts attributable to a specific GHG source obtaining a permit in specific places and points would not be possible [PSD and Title V Permitting Guidance for GHGS at 48]. Thus, we conclude it would not be meaningful to evaluate impacts of GHG emissions on a local community in the context of a single permit. Accordingly, we have determined an environmental justice analysis is not necessary for the permitting record. XVI. Conclusion and Proposed Action Based on the information supplied by CEC, our review of the analyses contained in the TCEQ PSD Permit Application and the GHG PSD Permit Application, and our independent evaluation of the information contained in our Administrative Record, it is our determination that the proposed facility would employ BACT for GHGs under the terms contained in the draft permit. Therefore, EPA is proposing to issue CEC a PSD permit for GHGs for the facility, subject to the

Channel Energy Center, LLC Page 31 of 31 Pasadena, Texas (Harris County)
PSD permit conditions specified therein. This permit is subject to review and comments. A final decision on issuance of the permit will be made by EPA after considering comments received during the public comment period.

Channel Energy Center, LLC Page 32 of 32 Pasadena, Texas (Harris County)
Statement of Basis
Appendix
for
Channel Energy Center (CEC), LLC Greenhouse Gas Prevention of Significant Deterioration
Preconstruction Permit
Permit Number: PSD-TX-955-GHG

Channel Energy Center, LLC Page 33 of 33 Pasadena, Texas (Harris County)
Table 1. Annual Facility Emissions
Output-based emissions, in tons per megawatt-hour (tons/MWh) on a 30-day rolling average, and annual emissions, in tons per year (TPY) on a 365-day rolling average basis shall not exceed the following:
Phase 1 of Construction
Emission Unit Description
GHG Mass Basis BACT
GHG Potential Emissions (TPY)2,3
Output-based BACT CO2
Limit1
Tons per year
CO2e2,3
Annual BACT Limit
(TPY CO2e2,3)
CTG3 (FD2) / HRSG3
CTG3/HRSG3 Annual Emissions
CO2 984,393 CO2 0.460
tons/MWh
7,730 Btu/KWh
984,393
985,340
CH4 18.22 CH4 383
N2O 1.82 N2O 565
NG-FUG /
Fuel Gas Piping
Fugitive Natural Gas emissions from piping components & Fuel Gas Piping
CO2 0.29 CO2
0.29 157
CH44 7.44 CH4
4 156.23
SF6-FUG
SF6 Insulated Electrical Equipment SF6 0.00018 SF6
4.3
4.3
1. Compliance with the output-based emission limits (on a per hour basis) is based on a 30-day rolling average.
2. Compliance with the annual emission limits (tons per year) is based on a 365-day rolling average. 3. The tpy emission limits specified in this table are not to be exceeded for this facility and includes emissions
only from the facility during normal operations and startup and shutdown activities. 4. Because the emissions from this unit are calculated to be 96% methane (CH4), the remaining pollutant
emission (CO2) is not presented in the table. 5. Because the emissions from this unit are calculated to be over 99.9% carbon dioxide (CO2), the remaining
pollutant emissions (CH4 and N2O) are not presented in the table.

Channel Energy Center, LLC Page 34 of 34 Pasadena, Texas (Harris County)
Phase 2 of Construction
Emission Unit Description
GHG Mass Basis BACT
GHG Potential Emissions (TPY)2,3
Output-based BACT CO2
Limit1
Tons per year
CO2e2,3
Annual BACT Limit
(TPY CO2e2,3)
CTG3 (FD3) / HRSG3
CTG3/HRSG3 Annual Emissions
CO2 1,002,0391 CO2 0.460
tons/MWh
7,730 Btu/KWh
1,002,391
1,003,355
CH4 18.55 CH4 390
N2O 1.86 N2O 575
NG-FUG /
Fuel Gas Piping
Fugitive Natural Gas emissions from piping components & Fuel Gas Piping
CO2 0.29 CO2
0.29 157
CH44 7.44 CH4
4 156.23
SF6-FUG
SF6 Insulated Electrical Equipment SF6 0.00018 SF6
4.3
4.3
1. Compliance with the output-based emission limits (on a per hour basis) is based on a 30-day rolling
average. 2. Compliance with the annual emission limits (tons per year) is based on a 365-day rolling average. 3. The tpy emission limits specified in this table are not to be exceeded for this facility and includes emissions
only from the facility during normal operations and startup and shutdown activities. 4. Because the emissions from this unit are calculated to be 96% methane (CH4), the remaining pollutant
emission (CO2) is not presented in the table. 5. Because the emissions from this unit are calculated to be over 99.9% carbon dioxide (CO2), the remaining
pollutant emissions (CH4 and N2O) are not presented in the table.
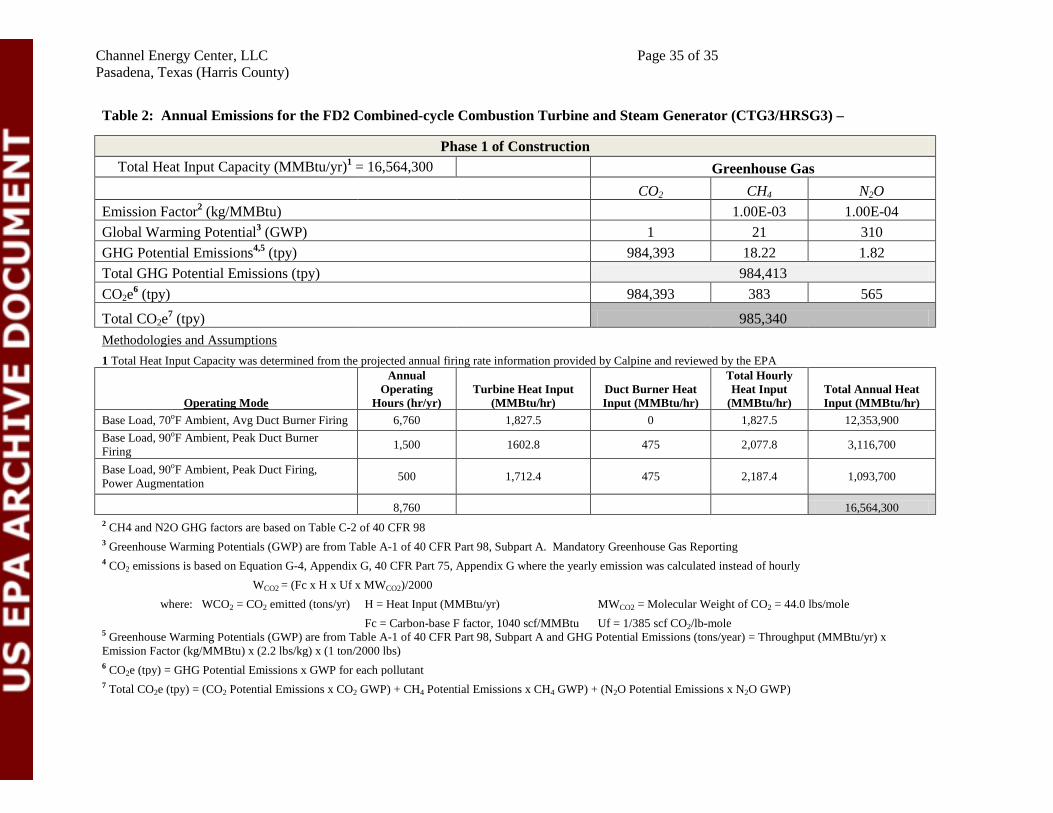
Channel Energy Center, LLC Page 35 of 35 Pasadena, Texas (Harris County)
Table 2: Annual Emissions for the FD2 Combined-cycle Combustion Turbine and Steam Generator (CTG3/HRSG3) –
Phase 1 of Construction Total Heat Input Capacity (MMBtu/yr)1 = 16,564,300
Greenhouse Gas
CO2 CH4 N2O
Emission Factor2 (kg/MMBtu)
1.00E-03 1.00E-04 Global Warming Potential3 (GWP) 1 21 310 GHG Potential Emissions4,5 (tpy) 984,393 18.22 1.82 Total GHG Potential Emissions (tpy) 984,413 CO2e6 (tpy) 984,393 383 565 Total CO2e7 (tpy) 985,340 Methodologies and Assumptions
1 Total Heat Input Capacity was determined from the projected annual firing rate information provided by Calpine and reviewed by the EPA
Operating Mode
Annual Operating
Hours (hr/yr) Turbine Heat Input
(MMBtu/hr) Duct Burner Heat Input (MMBtu/hr)
Total Hourly Heat Input
(MMBtu/hr) Total Annual Heat Input (MMBtu/hr)
Base Load, 70oF Ambient, Avg Duct Burner Firing 6,760 1,827.5 0 1,827.5 12,353,900 Base Load, 90oF Ambient, Peak Duct Burner Firing 1,500 1602.8 475 2,077.8 3,116,700
Base Load, 90oF Ambient, Peak Duct Firing, Power Augmentation 500 1,712.4 475 2,187.4 1,093,700
8,760
16,564,300 2 CH4 and N2O GHG factors are based on Table C-2 of 40 CFR 98 3 Greenhouse Warming Potentials (GWP) are from Table A-1 of 40 CFR Part 98, Subpart A. Mandatory Greenhouse Gas Reporting 4 CO2 emissions is based on Equation G-4, Appendix G, 40 CFR Part 75, Appendix G where the yearly emission was calculated instead of hourly
WCO2 = (Fc x H x Uf x MWCO2)/2000 where: WCO2 = CO2 emitted (tons/yr) H = Heat Input (MMBtu/yr) MWCO2 = Molecular Weight of CO2 = 44.0 lbs/mole
Fc = Carbon-base F factor, 1040 scf/MMBtu Uf = 1/385 scf CO2/lb-mole
5 Greenhouse Warming Potentials (GWP) are from Table A-1 of 40 CFR Part 98, Subpart A and GHG Potential Emissions (tons/year) = Throughput (MMBtu/yr) x Emission Factor (kg/MMBtu) x (2.2 lbs/kg) x (1 ton/2000 lbs) 6 CO2e (tpy) = GHG Potential Emissions x GWP for each pollutant 7 Total CO2e (tpy) = (CO2 Potential Emissions x CO2 GWP) + CH4 Potential Emissions x CH4 GWP) + (N2O Potential Emissions x N2O GWP)

Channel Energy Center, LLC Page 36 of 36 Pasadena, Texas (Harris County)
Table 3: Annual Emissions for the FD3 Combined-Cycle Combustion Turbine and Steam Generator (CTG3/HRSG3)
Phase 2 of Construction Total Heat Input Capacity (MMBtu/yr)1 16,867,150
Greenhouse Gas
CO2 CH4 N2O Emission Factor2 (kg/MMBtu) 1.00E-03 1.00E-04 Global Warming Potential3 (GWP) 1 21 310 GHG Potential Emissionsb (tpy) 1,002,391 18.55 1.86 Total GHG Potential Emissions (tpy) 1,002,411 CO2e6 (tpy) 1,002,391 390 575 Total CO2e7 (tpy) 1,003,355 Methodologies and Assumptions
1 Total Heat Input Capacity was determined from the projected annual firing rate information provided by Calpine and reviewed by the EPA
Operating Mode Annual Operating
Hours (hr/yr) Turbine Heat Input
(MMBtu/hr)
Duct Burner Heat Input
(MMBtu/hr) Total Hourly Heat Input (MMBtu/hr)
Total Annual Heat Input (MMBtu/hr)
Base Load, 70oF Ambient, Avg Duct Burner Firing 6,760 1,873 0 1827.5 12,353,900
Base Load, 90oF Ambient, Peak Duct Burner Firing 1,500 1,752 475 2,226.7 3,340,050
Base Load, 90oF Ambient, Peak Duct Firing, Power Augmentation
500 1,871 475 2,346,4 1,173,200
8,760 16,867,150 2 CH4 and N2O GHG factors are based on Table C-2 of 40 CFR 98
3 Greenhouse Warming Potentials (GWP) are from Table A-1 of 40 CFR Part 98, Subpart A. Mandatory Greenhouse Gas Reporting 4 CO2 emissions is based on Equation G-4, Appendix G, 40 CFR Part 75, Appendix G where the yearly emission was calculated instead of hourly
WCO2 = (Fc x H x Uf x MWCO2)/2000 where: WCO2 = CO2 emitted (tons/yr) H = Heat Input (MMBtu/yr) MWCO2 = Molecular Weight of CO2 = 44.0 lbs/mole
Fc = Carbon-base F factor, 1040 scf/MMBtu
Uf = 1/385 scf CO2/lb-mole 5 Greenhouse Warming Potentials (GWP) are from Table A-1 of 40 CFR Part 98, Subpart A and GHG Potential Emissions (tons/year) = Throughput (MMBtu/yr) x
Emission Factor (kg/MMBtu) x (2.2 lbs/kg) x (1 ton/2000 lbs) 6 CO2e (tpy) = GHG Potential Emissions x GWP for each pollutant
7 Total CO2e (tpy) = (CO2 Potential Emissions x CO2 GWP) + CH4 Potential Emissions x CH4 GWP) + (N2O Potential Emissions x N2O GWP)

Channel Energy Center, LLC Page 37 of 37 Pasadena, Texas (Harris County)
Table 4: Output-Based BACT Limits for FD2 and FD3 Combined-Cycle Combustion Turbine and Steam Generator (CTG3/HRSG3)
Base Net Heat Rate in Btu/kWh (HHV) (without duct firing) 6,852.0
+3.30% Design Margin
Heat Rate due to Design Margin (Btu/kWh (HHV)1 7,078.1
+6.00% Performance Margin
Heat Rate due to Performance Margin and Design Margin (Btu/kWh (HHV)) 7,502.8
+3.00% Degradation Margin Calculated Base Net Heat Rate with Compliance
Margins (Btu/kWh (HHV)) 7,727.9
Calculation of Output-Based BACT Limit (ton CO2/MWh) for CTG3/HRSG35
EPN
Base Heat Rate
(Btu/kWh)6
Heat Input Required to Produce 1
MW (MMBtu/h)2
tons CO2e per
year3
Total Heat Input
Capacity (MMBtu/yr)3 tons
CO2e/MWh4 CTG3/
HRSG3 7727.9 7.73 1,063,650 17,880,750 0.460
1Base Heat Rate was calculated accounting for a 3.3% margin of error in design and construction of the new turbine 2Heat Input was calculated by dividing the Base Heat Rate by a factor of 1000
3Values obtained from Table 2 for the FD2 series and Table 3 for the FD3 series of the SOB Appendix 4tons CO2e/MWh = ((tons CO2e per year)/(total heat input capacity/Heat Input Required to produce 1 MW)). 1
Output-based limits will be based on ton of CO2 versus ton of CO2e because all emissions determined by monitoring methodology in accordance to 40 CFR Part 75 are done in lbs of CO2 as opposed to lbs of CO2e.
5Ongoing Output-based BACT limit averaged over each 30-day consecutive period 6Base Heat Rate was calculated accounting for 3.3% design margin, 6.0% performance margin and a 3.0%
degradation margin (See SOB, Step 5 discussion of GHG BACT for the Combined-cycle Combustion Turbine Generator)

Channel Energy Center, LLC Page 38 of 38 Pasadena, Texas (Harris County)
Table 5. Startup and Shutdown Emissions
Total Heat Input Capacity (MMBtu/yr)1 1,164
Greenhouse Gas
CO2 CH4 N2O
Emission Factor2 (kg/MMBtu) 1.00E-03 1.00E-04 Global Warming Potential3 (GWP) 1 21 310 GHG Potential Emissions4,5 (tons per hour) 69 1.28E-03 1.28E-04 Total GHG Potential Emissions (tons per hour) 69 CO2e6 (tons per hour) 69 2.69E-02 3.97E-02
Total CO2eb (tons per hour) 69
Methodologies and Assumptions 1 Total Heat Input Capacity was determined from the hourly firing rate information provided by Calpine and
reviewed by the EPA
Operating Mode
Turbine Heat Input
(MMBtu/hr)
Duct Burner Heat Input
(MMBtu/hr)
Total Hourly Heat
Input (MMBtu/hr)
Maximum Hourly Heat Input
Base Load, 20oF Ambient, Max Duct
Burner Firing 2,017 452 2,469
Maximum Hourly Heat Input during Startup
Base Load, 90oF Ambient, Peak Duct
Burner Firing 1,164 0 1,164
2 CH4 and N2O GHG factors are based on Table C-2 of 40 CFR 98 3 Greenhouse Warming Potentials (GWP) are from Table A-1 of 40 CFR Part 98, Subpart A. Mandatory Greenhouse Gas
Reporting 4 CO2 emissions is based on Equation G-4, Appendix G, 40 CFR Part 75, Appendix G where the yearly emission was calculated instead of hourly
WCO2 = (Fc x H x Uf x MWCO2)/2000 where: WCO2 = CO2 emitted (tons/yr) H = Heat Input (MMBtu/yr) MWCO2 = Molecular Weight of CO2 = 44.0 lbs/mole
Fc = Carbon-base F factor, 1040 scf/MMBtu Uf = 1/385 scf CO2/lb-mole
5 Greenhouse Warming Potentials (GWP) are from Table A-1 of 40 CFR Part 98, Subpart A and GHG Potential Emissions (tons/year) = Throughput (MMBtu/yr) x Emission Factor (kg/MMBtu) x (2.2 lbs/kg) x (1 ton/2000 lbs) 6 CO2e (tpy) = GHG Potential Emissions x GWP for each pollutant
7 Total CO2e (tpy) = (CO2 Potential Emissions x CO2 GWP) + CH4 Potential Emissions x CH4 GWP) + (N2O Potential Emissions x N2O GWP)

Channel Energy Center, LLC Page 39 of 39 Pasadena, Texas (Harris County)
Table 6. Fugitive Emissions (Valves)
Source Types Fluid State Count
Emission Factor1
(scf/hr/comp) Greenhouse Gas
CO22 CH4
3
NG-FUG
Valves Gas/vapor 60 0.123 0.05 1.27
Flanges Gas/vapor 240 0.017 0.03 0.70 Relief Valves Gas/vapor 8 0.196 0.01 0.27
Sampling Collections Gas/vapor 18 0. 123 0.01 0.38
Fuel Gas Piping
Valves Gas/vapor 148 0.123 0.12 3.13
Flanges Gas/vapor 162 0.017 0.03 0.47
Relief Valves Gas/vapor 0 0.196 0.00 0.00
Sampling Collections Gas/vapor 58 0.123 0.05 1.22
Global Warming Potential3 (GWP) 1 21 GHG Potential Emissions4 (tpy) 0.29 7.44 Total GHG Potential Emissions (tpy) 7.73 CO2e5 (tpy) 0.29 156.23 Annual CO2e BACT Limit (tpy) 157
Methodologies and Assumptions 1 Emission factors from Table W-1A of 40 CFR 98 Mandatory Greenhouse Gas Reporting
2 CO2 emissions based on vol% of CO2 in natural gas (1.33% from Natural Gas Analysis) 3 CH4 emissions based on vol% of CH4 in natural gas (94.44% from natural gas analysis) 4 Greenhouse Warming Potentials (GWP) are from Table A-1 of 40 CFR Part 98, Subpart A 5 CO2e (tpy) = GHG Potential Emissions x GWP for each pollutant 6 Total CO2e (tpy) = (CO2 Potential Emissions x CO2 GWP) + CH4 Potential Emissions x CH4 GWP) + (N2O
Potential Emissions x N2O GWP)
sample calc
%CO2
60 valves 0.123 scf 0.0133 lb-mole 44.01 lb CO2 8760 hr ton hr*valve 385.5 scf lb-mole yr 2000 lb
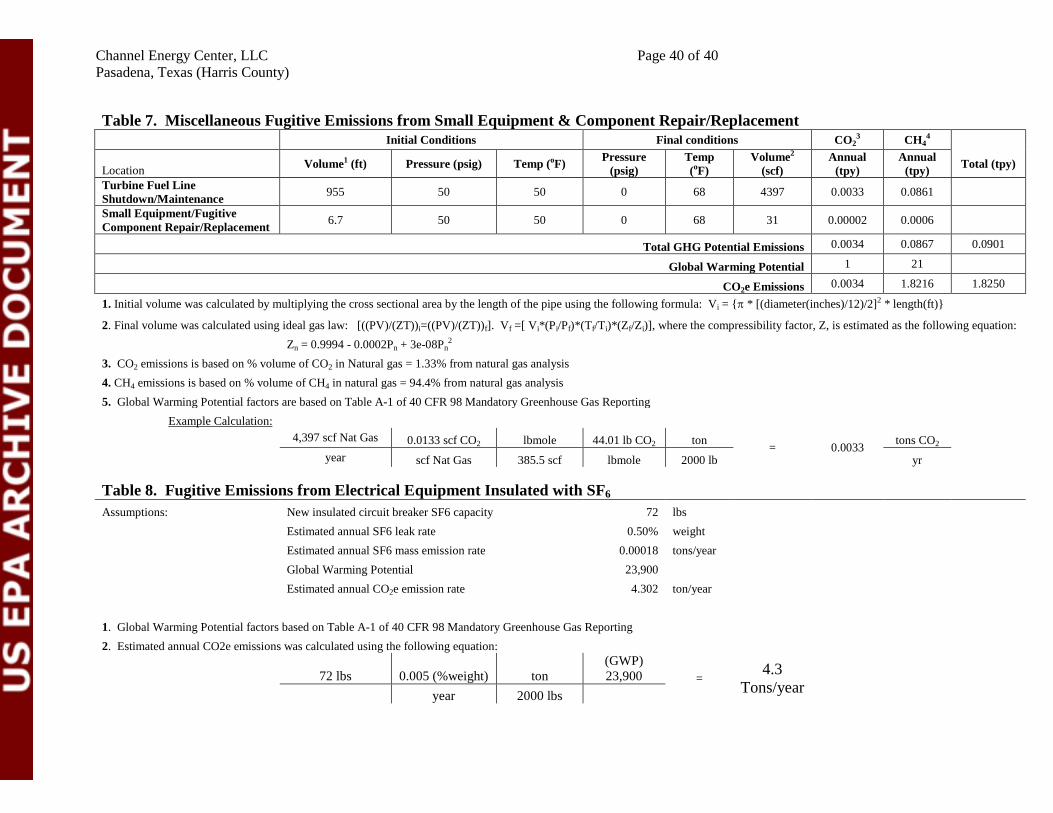
Channel Energy Center, LLC Page 40 of 40 Pasadena, Texas (Harris County)
Table 7. Miscellaneous Fugitive Emissions from Small Equipment & Component Repair/Replacement Initial Conditions Final conditions CO2
3 CH44
Location Volume1 (ft) Pressure (psig) Temp (oF) Pressure (psig)
Temp (oF)
Volume2 (scf)
Annual (tpy)
Annual (tpy) Total (tpy)
Turbine Fuel Line Shutdown/Maintenance 955 50 50 0 68 4397 0.0033 0.0861
Small Equipment/Fugitive Component Repair/Replacement 6.7 50 50 0 68 31 0.00002 0.0006
Total GHG Potential Emissions 0.0034 0.0867 0.0901
Global Warming Potential 1 21
CO2e Emissions 0.0034 1.8216 1.8250
1. Initial volume was calculated by multiplying the cross sectional area by the length of the pipe using the following formula: Vi = {π * [(diameter(inches)/12)/2]2 * length(ft)}
2. Final volume was calculated using ideal gas law: [((PV)/(ZT))i=((PV)/(ZT))f]. Vf =[ Vi*(Pi/Pf)*(Tf/Ti)*(Zf/Zi)], where the compressibility factor, Z, is estimated as the following equation:
Zn = 0.9994 - 0.0002Pn + 3e-08Pn
2 3. CO2 emissions is based on % volume of CO2 in Natural gas = 1.33% from natural gas analysis
4. CH4 emissions is based on % volume of CH4 in natural gas = 94.4% from natural gas analysis 5. Global Warming Potential factors are based on Table A-1 of 40 CFR 98 Mandatory Greenhouse Gas Reporting
Example Calculation:
4,397 scf Nat Gas 0.0133 scf CO2 lbmole 44.01 lb CO2 ton = 0.0033 tons CO2
year scf Nat Gas 385.5 scf lbmole 2000 lb yr
Table 8. Fugitive Emissions from Electrical Equipment Insulated with SF6
Assumptions: New insulated circuit breaker SF6 capacity 72 lbs
Estimated annual SF6 leak rate
0.50% weight
Estimated annual SF6 mass emission rate 0.00018 tons/year
Global Warming Potential
23,900
Estimated annual CO2e emission rate 4.302 ton/year
1. Global Warming Potential factors based on Table A-1 of 40 CFR 98 Mandatory Greenhouse Gas Reporting 2. Estimated annual CO2e emissions was calculated using the following equation:
72 lbs 0.005 (%weight) ton
(GWP) 23,900 =
4.3 Tons/year
year 2000 lbs
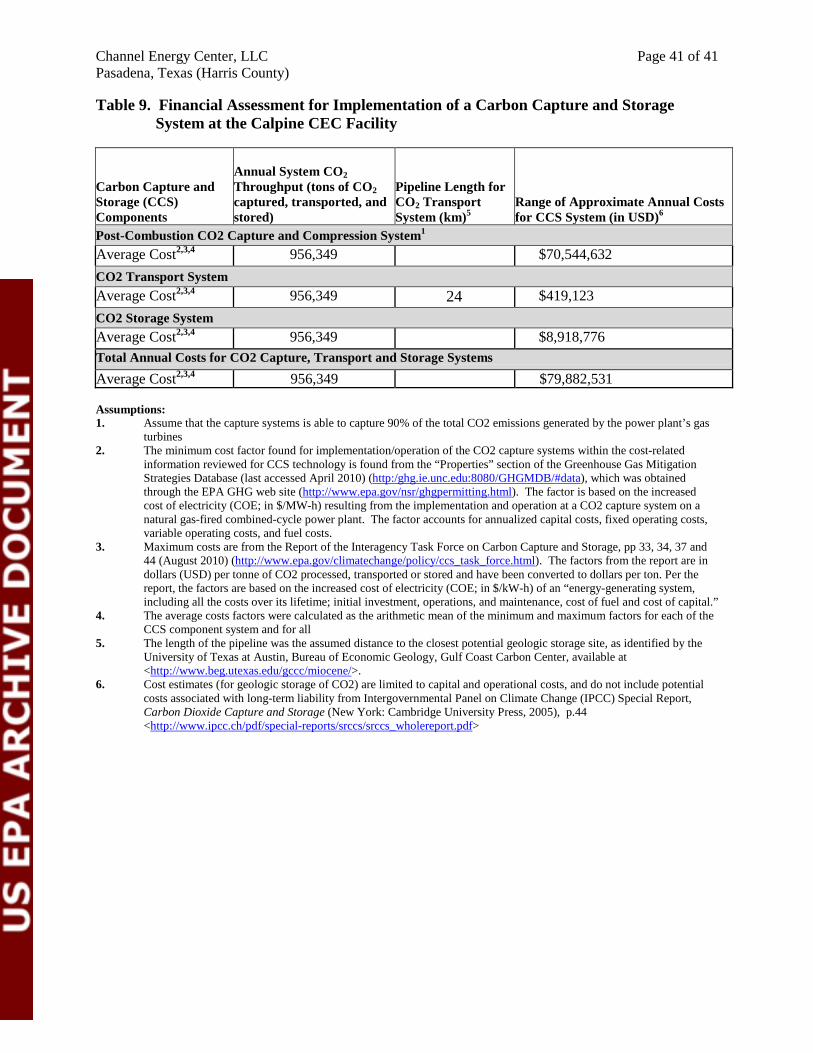
Channel Energy Center, LLC Page 41 of 41 Pasadena, Texas (Harris County)
Table 9. Financial Assessment for Implementation of a Carbon Capture and Storage System at the Calpine CEC Facility
Carbon Capture and Storage (CCS) Components
Annual System CO2 Throughput (tons of CO2 captured, transported, and stored)
Pipeline Length for CO2 Transport System (km)5
Range of Approximate Annual Costs for CCS System (in USD)6
Post-Combustion CO2 Capture and Compression System1 Average Cost2,3,4 956,349 $70,544,632 CO2 Transport System Average Cost2,3,4 956,349 24 $419,123 CO2 Storage System Average Cost2,3,4 956,349 $8,918,776 Total Annual Costs for CO2 Capture, Transport and Storage Systems Average Cost2,3,4 956,349 $79,882,531 Assumptions: 1. Assume that the capture systems is able to capture 90% of the total CO2 emissions generated by the power plant’s gas
turbines 2. The minimum cost factor found for implementation/operation of the CO2 capture systems within the cost-related
information reviewed for CCS technology is found from the “Properties” section of the Greenhouse Gas Mitigation Strategies Database (last accessed April 2010) (http:/ghg.ie.unc.edu:8080/GHGMDB/#data), which was obtained through the EPA GHG web site (http://www.epa.gov/nsr/ghgpermitting.html). The factor is based on the increased cost of electricity (COE; in $/MW-h) resulting from the implementation and operation at a CO2 capture system on a natural gas-fired combined-cycle power plant. The factor accounts for annualized capital costs, fixed operating costs, variable operating costs, and fuel costs.
3. Maximum costs are from the Report of the Interagency Task Force on Carbon Capture and Storage, pp 33, 34, 37 and 44 (August 2010) (http://www.epa.gov/climatechange/policy/ccs_task_force.html). The factors from the report are in dollars (USD) per tonne of CO2 processed, transported or stored and have been converted to dollars per ton. Per the report, the factors are based on the increased cost of electricity (COE; in $/kW-h) of an “energy-generating system, including all the costs over its lifetime; initial investment, operations, and maintenance, cost of fuel and cost of capital.”
4. The average costs factors were calculated as the arithmetic mean of the minimum and maximum factors for each of the CCS component system and for all
5. The length of the pipeline was the assumed distance to the closest potential geologic storage site, as identified by the University of Texas at Austin, Bureau of Economic Geology, Gulf Coast Carbon Center, available at <http://www.beg.utexas.edu/gccc/miocene/>.
6. Cost estimates (for geologic storage of CO2) are limited to capital and operational costs, and do not include potential costs associated with long-term liability from Intergovernmental Panel on Climate Change (IPCC) Special Report, Carbon Dioxide Capture and Storage (New York: Cambridge University Press, 2005), p.44 <http://www.ipcc.ch/pdf/special-reports/srccs/srccs_wholereport.pdf>