State- Tamil Nadu - AMRUT.Gov.in Tamil Nadu State Annual Action Plan (SAAP) TABLE OF CONTENTS...
68
State Annual Action Plan (SAAP) STATE ANNUAL ACTION PLAN (SAAP) (FY2017-20) State- Tamil Nadu
Transcript of State- Tamil Nadu - AMRUT.Gov.in Tamil Nadu State Annual Action Plan (SAAP) TABLE OF CONTENTS...
State Annual Action Plan (SAAP)
STATE ANNUAL ACTION PLAN (SAAP)
(FY2017-20)
State- Tamil Nadu
State Annual Action Plan (SAAP)
TABLE OF CONTENTS
Checklist – Consolidated State Annual Action Plan of all ULBs to be sent for Assessment by MoUD (as per
table 6.2) ____________________________________________________________________________________________________ 3
Minutes of State High Powered Steering Committee (SHPSC) Meeting __________________________ 5
Chapter 1: Project Background and Summary _____________________________________________________________ 6
1.1 BACKGROUND _______________________________________________________________________ 6
1.2 THRUST AREAS ______________________________________________________________________ 6
1.3 COVERAGE OF CITIES UNDER MISSION _____________________________________________ 6
1.4 PROGRAMME MANAGEMENT STRUcTURE AND FUNDING ALLOCATION ___________ 7
Chapter 2: Review of SAAPs _______________________________________________________________________________ 1
2.1 Project Progress ______________________________________________________________________ 1
2.2 Service Levels ________________________________________________________________________ 6
2.3 Capacity Building ___________________________________________________________________ 13
2.4 Reforms _____________________________________________________________________________ 15
2.5 Use of A&OE ________________________________________________________________________ 17
2.6 Funds flow __________________________________________________________________________ 18
2.7 Funds disbursements and Conditions ______________________________________________ 20
Chapter 3: STATE ANNUAL ACTION PLAN (SAAP) _______________________________________________________ 21
3.1 Principles of Prioritization __________________________________________________________ 28
3.2 Importance of O&M _________________________________________________________________ 29
3.3 Reform Implementation _____________________________________________________________ 30
3.4 Annual Capacity Building Plan _____________________________________________________ 32
3.5 A&OE _______________________________________________________________________________ 33
3.6 Financing of Projects _______________________________________________________________ 34
Chapter 4: TABLES: ______________________________________________________________________________________ 36

State Annual Action Plan (SAAP)
Checklist – Consolidated State Annual Action Plan of all ULBs to be sent for Assessment by MoUD (as per table 6.2)
S.No. Points of Consideration Yes/No Give Details
1. Have all the Cities prepared SLIP
as per the suggested approach? Yes
As per MoUD Principles of prioritization,
the SLIPs for all cities have been
prepared. First Priority has been given
to universal coverage of water supply
and second has been given to
sewerage system.
2.
Has the SAAP prioritized cities
for investment as per priority
sectors and gap assessment?
Yes
Prioritization has been done based on
the principles of MoUD for priority
sectors and based on gap assessment
3.
Is the indicator wise summary of
improvements proposed (both
investments and management
improvements) by State in
place?
Yes
Indicator wise summary of
improvements (both investments and
management improvements) are
summarized in the State Annual Action
Plan.
4.
Have all the cities under Mission
identified/done baseline
assessments of service coverage
indicators?
Yes
All the cities have identified service
coverage indicators and incorporated in
the Service Level Improvement Plan.
5.
Is the SAAP derived from an
approach towards meeting
Service Level Benchmarks
agreed by Ministry for each
Sector?
Yes
SAAP has been prepared to meet out
the Service Level benchmarks agreed
by MoUD for each sector.
6.
Is the investment proposed
commensurate to the level of
improvement envisaged in the
indicator?
Yes
The investment proposed will improve
the service level indicators to desired
levels as envisaged in SLIP and SAAP.
7.
Are State Share and ULB share
in line with proposed Mission
approach?
Yes
As per AMRUT Guidelines, depending
upon the size of the city the State Share
and ULBs Share has been considered.
At least 20% of fund contribution by the
State.
8. Is there a need for additional Yes Action has been taken to converge the
additional funds through State

State Annual Action Plan (SAAP)
S.No. Points of Consideration Yes/No Give Details
resources and have state
considered raising additional
resources (State programs,
aided projects, additional
devolution to cities, 14th Finance
Commission, external sources)?
Programmes, 14th Finance commission,
TNSUDP, JICA and KFW.
9.
Does State Annual Action Plan
verify that the cities have
undertaken financial projections
to identify revenue requirements
for O&M and repayments?
Yes
Cities have undertaken financial
projections to identify revenue
requirements for O&M and repayments
for each project considered in the State
Annual Action Plan.
10.
Has the State Annual Action
Plan considered the resource
mobilization capacity of each
ULB to ensure that ULB share
can be mobilized?
Yes
The State Annual Action Plan has
considered the financial capacity of
each ULB and if required, ULB share
can be mobilized through other financial
institutions.
11.
Has the process of establishment
of PDMC been initiated and
completed?
Yes
CMWSSB and TWAD Board are
designated as PDMC for Chennai city
and other AMRUT Cities in Tamil Nadu
12.
Has a roadmap been prepared to
realize the resource potential of
the ULB?
Yes
The CDP/CCBP prepared for the ULBs
has identified the road map to realize
the resource potential of respective
ULBs
13.
Is the implementation plan for
projects and reforms in place
(Timelines and yearly
milestones)?
Yes Timelines and yearly milestones are
proposed in SLIP and SAAP.
14.
Has the prioritization of projects
in ULBs been done in
accordance with
para 7.2 of the guidelines?
Yes
The projects for each ULBs has been
prioritized based on the principles of
AMRUT guidelines viz., gap analysis
and financial strength of ULBs,
consultation with local MPs, Mayors
and Commissioners etc.,
State Mission Director
State Annual Action Plan (SAAP)
Minutes of State High Powered Steering Committee (SHPSC) Meeting
Copy of Minutes enclosed.

State Annual Action Plan (SAAP)
Chapter 1: Project Background and Summary
1.1 BACKGROUND
Cities are engines of growth for the economy of every nation, including India. Nearly 31% of India’s
current population lives in urban areas and contributes 63% of India’s GDP (Census 2011). With
increasing urbanization, urban areas are expected to house 40% of India’s population and contribute
75% of India’s GDP by 2030. This requires comprehensive development of physical, institutional,
social and economic infrastructure. All are important in improving the quality of life and attracting
investments to the City, setting in motion a virtuous cycle of growth and development. In this regard,
the Government of India launched Atal Mission for Rejuvenation and Urban Transformation (AMRUT),
a flagship programme on 25th June, 2015.
The aim of the mission is to provide basic services (e.g. Water supply, Sewerage, Storm Water
drainage, Non-Motorized transport and green spaces) to households and build amenities in cities,
which will improve the quality of life for all, especially the poor and the disadvantaged. Under this
programme, Government of India have selected 500 AMRUT Cities in the Country based on the urban
population of the State/ UT. In which 32 Cities / Towns, have been selected in Tamil Nadu viz., 12 City
Municipal Corporations (includes 5 ULBs merged with Corporations), 14 Municipalities and 1 Town
Panchayat. Recently, Rameswaram Municipality has been added under AMRUT by Government of
India.
1.2 THRUST AREAS
The Mission will focus on the following Thrust Areas. Viz.,
Water Supply,
Sewerage facilities and Septage Management,
Storm Water Drains to reduce flooding,
Pedestrian, Non-motorized and public transport facilities, parking spaces, and
Enhancing amenity value of cities by creating and upgrading green spaces, parks and recreation
centers, especially for children.
1.3 COVERAGE OF CITIES UNDER MISSION
Out of 33 Cities /Towns, four municipalities are merged with Corporation of Chennai and one
municipality merged with Coimbatore City Municipal Corporation. The list of cities/towns and the
population of the respective cities/towns are mentioned below. The total population of the AMRUT
Cities are 1,37,73,346.
List of Urban Local Bodies
S.No Name of the Corporations Name of the ULBs Merged
1 Chennai Corporation Madavaram, Ambattur, Alandur, Tiruvottiyur
2 Coimbatore Municipal Corporation Kurichi
Other Cities
3 Ambur Municipality 16 Pudukottai Municipality
4 Avadi Municipality 17 Rajapalayam Municipality

State Annual Action Plan (SAAP)
S.No Name of the Corporations Name of the ULBs Merged
5 Cuddalore Municipality 18 Salem Municipal Corporation
6 Dindigul Municipal Corporation 19 Tambaram Municipality
7 Erode Municipal Corporation 20 Thanjavur Municipal Corporation
8 Hosur Municipality 21 Thiruvannamalai Municipality
9 Kancheepuram Municipality 22 Thoothukkudi Municipal Corporation
10 Karaikudi Municipality 23 Tiruchirappalli Municipal Corporation
11 Kumbakonam Municipality 24 Tirunelveli Municipal Corporation
12 Madurai Municipal Corporation 25 Tiruppur Municipal Corporation
13 Nagapattinam Municipality 26 Velankanni Town Panchayat
14 Nagercoil Municipality 27 Vellore Corporation
15 Pallavaram Municipality 28 Rameswaram Municipality
1.4 PROGRAMME MANAGEMENT STRUCTURE AND FUNDING ALLOCATION
A three tier Programme Management Structure exists in the AMRUT Mission, i.e.
National Level: An APEX COMMITTEE, under the Chairmanship of Secretary, MoUD, GoI,
consisting of representatives of concerned ministries and organizations, which will consider and
approve the projects at National Level and supervise the Mission.
State Level: - A State Level High Powered Steering Committee (SHPSC), constituted as per the
AMRUT guidelines, which is headed by the Chief Secretary, Govt. of Tamil Nadu. The State Mission is
headed by the Chairperson and Managing Director, Tamil Nadu Urban Finance Infrastructure
Development Corporation, who is the State Mission Director. In addition, State Mission Management
Unit provides handholding support to State Mission Directorate.
City Level: - The projects will be executed in city level by the Urban Local Bodies, parastatal
agencies (i.e) Chennai Metropolitan Water Supply and Sewerage Board, Tamil Nadu Water Supply
and Drainage Board etc.
FUND ALLOCATION - The Mission funds consist of the following four parts as per guidelines
Project fund - 80% of the annual budgetary allocation
Incentive for Reforms - 10% of the annual budgetary allocation
State funds for Administrative & Office Expenses (A&OE) - 8% of the annual budgetary allocation
MoUD funds for Administrative & Office Expenses (A&OE) - 2% of the annual budgetary allocation
State Share for the Mission shall be not less than 20% for all the ULBs.
ULB Share shall be 30% for all the ULBs, except Chennai, Madurai and Coimbatore
PROJECT FUND -MoUD, GoI, vide D.O.No.K-14012/95/2015-AMRUT-I dated June 6th 2016 has
allocated an amount of Rs. 1801.37 Crores to Projects and A&OE of Rs.144.11 Cr for Tamil Nadu.

State Annual Action Plan (SAAP)
Table 1.1 Breakup of Total MoUD Allocation in AMRUT
(Amount in Crores) – Year 2017-20
Total Central Funds allocated to State (2016-17)
Allocation of Central funds
for A&OE (@8% of
Total given in coloumn 1)
Allocation of Funds for AMRUT (Central Share)
Project proposal Submitted - CA
*State /ULB share
Total AMRUT annual size (cols.2+4+5)
1 2 3 4 5 6
1801.370 144.11 1801.37 1802.74 2308.32 4255.17
* State /ULB share is more than GoI Contribution since 3 cities (Chennai, Madurai and Coimbatore) have population more
than 10 lakhs and hence the GoI contribution is 1/3rd of the project cost.
Table 1.2.1Abstract-Sector Wise Proposed Total Project Fund and Sharing Pattern
(Amount in Crores) – Year 2017-20
S.No Sector No.of
Project GoI State ULB Convergence Total
1 Water supply 3 275.27 146.74 311.69 0.00 733.70
2 Sewerage and Septage management
13 1482.44 657.46 1147.40 0.00 3287.29
3 Storm Water Drainage 0 0.00 0.00 0.00 0.00 0.00
4 Non-Motorized transport 0 0.00 0.00 0.00 0.00 0.00
5 Green Space 28 45.03 18.01 27.02 0.00 90.07
Grand Total 44 1802.74 822.21 1486.11 0.00 4111.06
Table 1.2.2Abstract-Break-up of Total Fund Sharing Pattern
(Amount in Crores) – Year 2017-20
S.No
Sector GoI State ULB
Total 14th
FC Others Total
14th FC
Others Total
1 Water supply
275.27 0 146.74 146.74 0 311.69 311.69 733.70
2 Sewerage 1482.44 0 657.46 657.46 0 1147.40 1147.40 3287.29
3 Drainage 0.00 0 0.00 0.00 0 0.00 0.00 0.00
4 NMT 0.00 0 0.00 0.00 0 0.00 0.00 0.00
5 Green space
45.03 0 18.01 18.01 0 27.02 27.02 90.07
Total 1802.74 0.00 822.21 822.21 0.00 1486.11 1486.11 4111.06

State Annual Action Plan (SAAP)
Table 1.3 Abstract-Uses of Funds on Projects: On Going and New
(Amount in Crores) – Sanctioned 2015-16 and proposed 2017-20funds Amount in Cr
Table 1.3 Abstract-Use of Funds on Projects: On Going and New
S.No.
Sector
Total Project Investment
Committed Expenditure (if any from Previous Year)
Proposed Spending during current financial year
Balance Carry Forward for the next 3 yers upto 2020
Center
State ULB Center
State ULB Cent
er
State ULB
14th FC
Other
Total
14th FC
Other
Total
14th FC
Other
Total
14th FC
Other
Total
14th FC
Other
Total
14th FC
Other
Total
1 Water supply
5661.67 0 0 0 0 0 0 0
457.93 0
305.93
305.93
0.00
368.47
368.47
1831.72 0
1223.73
1223.73 0
1473.88
1473.88
2 Sewerage
5295.42 0 0 0 0 0 0 0
469.91 0
211.82
211.82
0.00
377.36
377.36
1879.65 0
847.27
847.27 0
1509.42
1509.42
3 Drainage 0.00 0 0 0 0 0 0 0 0.00 0 0.00 0.00
0.00 0.00 0.00 0.00 0 0.00 0.00 0 0.00 0.00
4 NMT 0.00 0 0 0 0 0 0 0 0.00 0 0.00 0.00
0.00 0.00 0.00 0.00 0 0.00 0.00 0 0.00 0.00
5 Green space 237.69 0 0 0 0 0 0 0
23.77 0 9.51 9.51
0.00
14.26
14.26
95.08 0
38.03
38.03 0
57.04
57.04
Total 11194.
78 0 0 0 0 0 0 0 951.61 0
527.26
527.26 0
760.09
760.09
3806.45 0
2109.03
2109.03 0
3040.34
3040.34

State Annual Action Plan (SAAP)
Table 1.4 Abstract-Plans for Achieving Service Level Benchmarks
Proposed Priority Projects
Total Project
Cost Indicator Baseline
Annual Targets
(Increment from the Baseline Value)
FY 2016 FY FY FY FY
H1 H2 2017 2018 2019 2020
Water Supply
733.70
1.Household coverage of direct water supply connections
54% 55% 58% 65% 73% 78% 100%
2.Per capita quantum of water supplied
74 74 77 87 97 122 135
3.Quality of water supplied
79% 81% 85% 87% 93% 95% 100%
Sewerage 3287.29
4.Coverage of Latrines (Individual or community)
82% 84% 86% 90% 94% 98% 100%
5.Coverage of sewerage network services
23% 29% 33% 51% 66% 83% 100%
6.Efficiency of Collection of Sewerage
23% 32% 36% 55% 66% 79% 100%
7.Efficiency in treatment
49% 49% 51% 66% 75% 82% 100%

State Annual Action Plan (SAAP)
Table 3.2 SAAP - Sector Wise Breakup of Consolidated Investments for all ULBs in the State
Rs.in Cr
S.n Name of the
City Water supply
Sewerage Drainage NMT Green space
Grand Total
1 Ambur 0.00 275.00 0.00 0.00 2.73 277.73
2 Avadi 0.00 0.00 0.00 0.00 2.73 2.73
3 Chennai 88.70 317.29 0.00 0.00 13.65 419.64
4 Coimbatore 0.00 331.00 0.00 0.00 5.46 336.46
5 Cuddalore 0.00 0.00 0.00 0.00 2.73 2.73
6 Dindigul 0.00 0.00 0.00 0.00 2.73 2.73
7 Erode 0.00 0.00 0.00 0.00 2.73 2.73
8 Hosur 0.00 0.00 0.00 0.00 2.73 2.73
9 Kancheepuram 0.00 50.00 0.00 0.00 2.73 52.73
10 Karaikudi 0.00 0.00 0.00 0.00 2.73 2.73
11 Kumbakonam 0.00 0.00 0.00 0.00 2.73 2.73
12 Madurai 450.00 300.00 0.00 0.00 2.73 752.73
13 Nagapattinam 0.00 0.00 0.00 0.00 2.73 2.73
14 Nagercoil 0.00 310.00 0.00 0.00 2.73 312.73
15 Pallavaram 0.00 22.00 0.00 0.00 2.73 24.73
16 Pudukottai 195.00 0.00 0.00 0.00 2.73 197.73
17 Rajapalayam 0.00 194.00 0.00 0.00 2.73 196.73
18 Salem 0.00 0.00 0.00 0.00 2.73 2.73
19 Tambaram 0.00 35.00 0.00 0.00 2.73 37.73
20 Thanjavur 0.00 0.00 0.00 0.00 2.73 2.73
21 Thiruvannamalai 0.00 260.00 0.00 0.00 2.73 262.73
22 Thoothukkudi 0.00 0.00 0.00 0.00 2.73 2.73
23 Tiruchirappalli 0.00 453.00 0.00 0.00 2.73 455.73
24 Tirunelveli 0.00 0.00 0.00 0.00 2.73 2.73
25 Tiruppur 0.00 415.00 0.00 0.00 2.73 417.73
26 Velankanni 0.00 0.00 0.00 0.00 2.73 2.73
27 Vellore 0.00 325.00 0.00 0.00 2.73 327.73
28 Rameswaram 0.00 0.00 0.00 0.00 2.73 2.73
Total Project Investments 733.70 3287.29 0.00 0.00 90.07 4111.06
A &OE 144.11
Grand Total 4255.17

State Annual Action Plan (SAAP)
Table 3.4 SAAP - Year Wise Share of Investments for All Sectors (ULB Wise)
S.No
Name of the Cities Total Project
Investment
Committed Expenditure (if any from Previous Year) Proposed Spending during current financial year Balance Carry Forward for the next Year
Center
State ULB Cente
r
State ULB Center
State ULB
14th FC
Other
Total
14th FC
Other
Total
14th FC Other Total
14th FC Other Total
14th FC Other Total
14th FC Other Total
1 Ambur 387.77 0 0.00 0.00 0.00 0.00 0.00 0.00 38.78 0.00 15.51 15.51 0.00 23.27 23.27 155.11 0.00 62.04 62.04 0.00 93.06 93.06
2 Avadi 7.51 0 0.00 0.00 0.00 0.00 0.00 0.00 0.75 0.00 0.30 0.30 0.00 0.45 0.45 3.00 0.00 1.20 1.20 0.00 1.80 1.80
3 Chennai 2391.35
0 0.00 0.00 0.00 0.00 0.00 0.00 159.1
5 0.00 164.8
3 164.8
3 0.00 154.2
9 154.2
9 636.60 0.00 659.31 659.31 0.00 617.17 617.17
4 Coimbatore 1120.84 0 0.00 0.00 0.00 0.00 0.00 0.00 74.61 0.00 50.86 50.86 0.00 98.70 98.70 298.43 0.00 203.44 203.44 0.00 394.80 394.80
5 Cuddalore 7.51 0 0.00 0.00 0.00 0.00 0.00 0.00 0.75 0.00 0.30 0.30 0.00 0.45 0.45 3.00 0.00 1.20 1.20 0.00 1.80 1.80
6 Dindigul 7.51 0 0.00 0.00 0.00 0.00 0.00 0.00 0.75 0.00 0.30 0.30 0.00 0.45 0.45 3.00 0.00 1.20 1.20 0.00 1.80 1.80
7 Erode 249.51 0 0.00 0.00 0.00 0.00 0.00 0.00 24.95 0.00 9.98 9.98 0.00 14.97 14.97 99.80 0.00 39.92 39.92 0.00 59.88 59.88
8 Hosur 151.51 0 0.00 0.00 0.00 0.00 0.00 0.00 15.15 0.00 6.06 6.06 0.00 9.09 9.09 60.60 0.00 24.24 24.24 0.00 36.36 36.36
9 Kancheepura 57.51 0 0.00 0.00 0.00 0.00 0.00 0.00 5.75 0.00 2.30 2.30 0.00 3.45 3.45 23.00 0.00 9.20 9.20 0.00 13.80 13.80
10 Karaikudi 7.51 0 0.00 0.00 0.00 0.00 0.00 0.00 0.75 0.00 0.30 0.30 0.00 0.45 0.45 3.00 0.00 1.20 1.20 0.00 1.80 1.80
11 Kumbakonam 72.82 0 0.00 0.00 0.00 0.00 0.00 0.00 7.28 0.00 2.91 2.91 0.00 4.37 4.37 29.13 0.00 11.65 11.65 0.00 17.48 17.48
12 Madurai 1514.81
0 0.00 0.00 0.00 0.00 0.00 0.00 100.3
6 0.00 64.86 64.86 0.00 137.7
5 137.7
5 401.42 0.00 259.44 259.44 0.00 550.99 550.99
13 Nagapattinam 7.51 0 0.00 0.00 0.00 0.00 0.00 0.00 0.75 0.00 0.30 0.30 0.00 0.45 0.45 3.00 0.00 1.20 1.20 0.00 1.80 1.80
14 Nagercoil 557.51 0 0.00 0.00 0.00 0.00 0.00 0.00 55.75 0.00 22.30 22.30 0.00 33.45 33.45 223.00 0.00 89.20 89.20 0.00 133.80 133.80
15 Pallavaram 303.51 0 0.00 0.00 0.00 0.00 0.00 0.00 30.35 0.00 12.14 12.14 0.00 18.21 18.21 121.40 0.00 48.56 48.56 0.00 72.84 72.84
16 Pudukottai 202.51 0 0.00 0.00 0.00 0.00 0.00 0.00 20.25 0.00 8.10 8.10 0.00 12.15 12.15 81.00 0.00 32.40 32.40 0.00 48.60 48.60
17 Rajapalayam 443.87 0 0.00 0.00 0.00 0.00 0.00 0.00 44.39 0.00 17.75 17.75 0.00 26.63 26.63 177.55 0.00 71.02 71.02 0.00 106.53 106.53
18 Salem 7.51 0 0.00 0.00 0.00 0.00 0.00 0.00 0.75 0.00 0.30 0.30 0.00 0.45 0.45 3.00 0.00 1.20 1.20 0.00 1.80 1.80
19 Tambaram 362.51 0 0.00 0.00 0.00 0.00 0.00 0.00 36.25 0.00 14.50 14.50 0.00 21.75 21.75 145.00 0.00 58.00 58.00 0.00 87.00 87.00
20 Thanjavur 182.51 0 0.00 0.00 0.00 0.00 0.00 0.00 18.25 0.00 7.30 7.30 0.00 10.95 10.95 73.00 0.00 29.20 29.20 0.00 43.80 43.80
21 Thiruvannamalai
267.51 0 0.00 0.00 0.00 0.00 0.00 0.00 26.75 0.00 10.70 10.70 0.00 16.05 16.05 107.00 0.00 42.80 42.80 0.00 64.20 64.20
22 Thoothukkudi 7.51 0 0.00 0.00 0.00 0.00 0.00 0.00 0.75 0.00 0.30 0.30 0.00 0.45 0.45 3.00 0.00 1.20 1.20 0.00 1.80 1.80
23 Tiruchirappalli 899.72 0 0.00 0.00 0.00 0.00 0.00 0.00 89.97 0.00 35.99 35.99 0.00 53.98 53.98 359.89 0.00 143.95 143.95 0.00 215.93 215.93
24 Tirunelveli 304.51 0 0.00 0.00 0.00 0.00 0.00 0.00 30.45 0.00 12.18 12.18 0.00 18.27 18.27 121.80 0.00 48.72 48.72 0.00 73.08 73.08
25 Tiruppur 652.51 0 0.00 0.00 0.00 0.00 0.00 0.00 65.25 0.00 26.10 26.10 0.00 39.15 39.15 261.00 0.00 104.40 104.40 0.00 156.60 156.60
26 Velankanni 38.58 0 0.00 0.00 0.00 0.00 0.00 0.00 3.86 0.00 1.54 1.54 0.00 2.31 2.31 15.43 0.00 6.17 6.17 0.00 9.26 9.26
27 Vellore 930.51 0 0.00 0.00 0.00 0.00 0.00 0.00 93.05 0.00 37.22 37.22 0.00 55.83 55.83 372.20 0.00 148.88 148.88 0.00 223.32 223.32
28 Rameswaram 50.39 0 0.00 0.00 0.00 0.00 0.00 0.00 5.04 0.00 2.02 2.02 0.00 3.02 3.02 20.15 0.00 8.06 8.06 0.00 12.09 12.09
11194.78 0.00 0.00 0.00 0.00 0.00 0.00 0.00
950.89
0.00 527.2
6 527.2
6 0.00
760.81
760.81
3803.57
0.00 2109.0
3 2109.0
3 0.00
3043.22
3043.22

State Annual Action Plan (SAAP)
Chapter 2: Review of SAAPs
The state is required to prepare SAAP every year and get it approved by the Apex Committee. Before
preparing the current year’s SAAP 2017-20, a key requirement is to review the performance of the
approved SAAP 2015-16 & SAAP 2016-17. This chapter reviews the performance of the
implementation of the past SAAPs on key themes in the AMRUT Guidelines. In Tamil Nadu, the SAAP
2016-17 has been prepared at a cost of Rs. 1582.89 and it has been approved by APEX committee.
2.1 PROJECT PROGRESS
As per SAAP 2015-16 there are 10 water supply projects, 1 sewerage projects and 25 Green space
projects have been approved by the SLHPSC. The physical and financial progress of projects is
tabularized below;
SAAP 2015-16
S.N. Name of ULB Approved SAAP DPR SLTC
Work Order
Implementation in Progress
Amount Disbursem
ent Till Date Project
Name Amount Rs..Cr Y/N Y/N Y/N
Physical (%)
Financial (%)
1 Ambur
Water Supply
50.90
Yes Yes No
0% 20%
11.71
2 Chennai 954.00 205.31
3 Coimbatore 395.41 97.67
4 Erode 484.45 111.42
5 Hosur 87.91 20.22
6 Madurai 320.00 79.04
7 Nagercoil 223.44 51.39
8 Rajapalayam 180.05 41.41
9 Thanjavur 48.14 11.07
10 Tiruppur 250.00 57.50
11 Vellore 234.93 54.04
TOTAL (A) 3229.23 740.78
B SEWERAGE
1 Velankanni 23.32 Yes Yes No 5.36
B TOTAL (B) 23.32 5.36
C GREEN SPACE
1 Ambur 1.33
Yes Yes No
0.30
2 Avadi 2.06 0.47
3 Chennai 11.01 2.53
4 Coimbatore 4.28 0.98
5 Cuddalore 2.13 0.49

State Annual Action Plan (SAAP)
2
SAAP 2015-16
S.N. Name of ULB Approved SAAP DPR SLTC
Work Order
Implementation in Progress
Amount Disbursem
ent Till Date Project
Name Amount Rs..Cr Y/N Y/N Y/N
Physical (%)
Financial (%)
6 Dindigul 2.14 0.49
7 Erode 2.27 0.52
8 Hosur 2.07 0.48
9 Kancheepuram 2.14 0.49
10 Karaikudi 2.16 0.50
11 Kumbakonam 2.17 0.50
12 Madurai 2.22 0.51
13 Nagercoil 1.98 0.46
14 Pallavaram 2.02 0.46
15 Pudukottai 2.07 0.47
16 Rajapalayam 2.26 0.52
17 Salem 1.93 0.44
18 Tambaram 2.14 0.49
19 Thanjavur 2.14 0.49
20 Thiruvannamalai 2.14 0.49
21 Thoothukkudi 1.99 0.46
22 Tiruchirappalli 2.14 0.49
23 Tirunelveli 2.72 0.63
24 Tiruppur 2.16 0.50
25 Vellore 2.01 0.46
C TOTAL (C) 63.67 14.64
GRAND TOTAL (A+B+C) 3316.22 760.78
As per SAAP 2016-17, there are 5 water supply projects, 7 sewerage projects and 25 Green space
projects have been approved by the SLHPSC. The physical and financial progress of projects is
tabularized below;
SAAP 2016-17
Approved SAAP DPR SLTC Work Order
Implementation in Progress
Amount Disbursement till date
S.No. Name of the
ULBs Project Name
Amount Rs in Cr
Y/N Y/N Y/N Physical
% Financi
al %
1 Chennai
Water Supply
723.96
Yes
Yes
NA NA NA NA 2 Pallavaram 274 Yes
3 Tambaram 320 Yes
4 Kumbakonam 25.67 No

State Annual Action Plan (SAAP)
3
SAAP 2016-17
Approved SAAP DPR SLTC Work Order
Implementation in Progress
Amount Disbursement till date
S.No. Name of the
ULBs Project Name
Amount Rs in Cr
Y/N Y/N Y/N Physical
% Financi
al %
5 Madurai 437.3 No
Total
1780.93
NA Chennai
Sewer age
482.72
Yes
Yes
NA NA NA NA
Coimbatore 322.83
No Kumbakonam 39.64
Tiruchirappalli 439.21
Tirunelveli 297
Vellore 348 YES
Rameswaram 45.02 No
Total
1974.42
1 Ambur
Green space
0
Yes Yes NA NA NA NA
2 Avadi 2.638
3 Chennai 13.19
4 Coimbatore 5.276
5 Cuddalore 2.638
6 Dindigul 2.638
7 Erode 2.638
8 Hosur 2.638
8 Kancheepuram 2.638
10 Karaikudi 2.638
11 Kumbakonam 2.638
12 Madurai 2.638
13 Nagapattinam 2.638
14 Nagercoil 2.638
15 Pallavaram 2.638
16 Pudukottai 2.638
17 Rajapalayam 0
18 Salem 2.638
19 Tambaram 2.638
20 Thanjavur 2.638
21 Thiruvannamalai 2.638
22 Thoothukkudi 2.638
23 Tiruchirappalli 2.638
24 Tirunelveli 2.638
25 Tiruppur 2.638
26 Velankanni 0
27 Vellore 2.638

State Annual Action Plan (SAAP)
4
SAAP 2016-17
Approved SAAP DPR SLTC Work Order
Implementation in Progress
Amount Disbursement till date
S.No. Name of the
ULBs Project Name
Amount Rs in Cr
Y/N Y/N Y/N Physical
% Financi
al %
28 Rameswaram 2.638
Total Project Cost
79.14
Grand Total
3834.49
1) Have DPRs been prepared for all projects approved earlier? If not then which are the
projects for which DPR is pending and why? (500 words)
As per above table, there are 74 projects are approved in 2015-16 &2016-17 under AMRUT
mission. In which, 16 water supply projects, 8 sewerage projects and 50 green space projects.
The DPRs for all 74 projects has been prepared.
2) What is the plan of action for the pending DPRs? (300 words)
NA
3) How many SLTC meetings had been held in the State? How many DPRs have been
approved by the SLTC till date? (250 words)
Three State Level Technical Committee has been conducted till date and 44 projects of SAAP
2015-16 worth Rs.3321.02Cr and 33 projects of SAAP 2016-17 worth Rs. 1444.42Cr have been
approved out of 39 projects.
4) By when will the pending DPRs be approved by the SLTC and when will implementation
start? (250 words)
The pending DPR are likely to be approved by State Level Technical Committee by end of March
2017. In which all the pending projects will be approved. On receiving approval from SLTC,
tendering procedure will be started. We are expecting all these projects will be tendered before
end of March 2017. Implementation of water supply projects and green space projects approved
on SAAP 2015-16 has already started.
5) Based on the identification of delayed projects and the reasons for slow physical
progress, what is the plan of action to speed-up the projects? (300 words)
Due to the cyclone impact of the state. The Urban Local Bodies were not in a position to proceed
with the tenders for the sanctioned projects. The projects are expected to be tendered before end
of March 2017. The proposed plan of action is summarized below:
To conduct weekly and monthly review of project progress
To prepare micro level plan involving resource allocation,
To make the ULBs to adhere the timeline.

State Annual Action Plan (SAAP)
5
6) How much amount has been utilized and what is the percentage share of the funding
agencies? Are there any deviations from the approved funding pattern approved by the
Apex Committee? (tabular form and 500 words)
The amount received from GoI has already been distributed to ULBs as per the approved projects
for SAAP 2015-16. The total amount utilized till date are Rs. 286.79Cr. Since the process of
bidding has just been started actual utilization of fund will improve in next 2-3 months. There is no
deviation in funding pattern approved by the Apex Committee. The funding pattern for towns with
population less than 10 lacs is State share is 20% and ULB share is 30% and towns with
population above 10 lacs is State share is 33% and ULB share is 47%.
7) List out the projects where release of funds to ULBs by the State was delayed?
There is no delay in the release of funds to ULBs by the State.
8) In how many ULBs implementation was done by agencies other than ULBs? Was a
resolution taken from all ULBs? (tabular and 200 words)
Based on the projects approved by SAAP 2015-16, all ULBs expect Chennai, the water supply
projects will be executed by Chennai Metro Water Supply and Sewerage Board.
9) List out the projects where the assessed value approved by the Apex Committee was
greater than the tendered value and there was a saving? Was this addressed by the HPSC
in the present SAAP? (tabular and 200 words)
Following projects are assessed value lesser than the approved by the apex committee.2015-16
& 2016-17
Rs.in Cr
S.n Name of the
City
Projects Approved in
SAAP 2015-16
Projects Approved in SHPSC
Name of the City
Projects Approved in
SAAP 2016-17
Projects Approved in
SHPSC
Water Supply
1 Chennai 741.14 954.00 Chennai 723.96
802.02 2 Coimbatore 452.00 395.41 Pallavaram 274.00
3 Rajapalayam 245.00 180.05 Tambaram 320.00
4 Vellore 250.00 234.93 Kumbakonam 25.67 -
5 Erode 242.00 484.45 Madurai 437.30 -
6 Hosur 144.00 87.91
7 Madurai 320.00 320.00
8 Ambur 107.90 50.9
9 Thanjavur 175.00 48.14
10 Nagercoil 240.00 223.44
11 Tiruppur 230.00 250.00
Sewerage
12 Velankanni 33.71 23.32 Chennai 482.72 223.00
13 Coimbatore 322.83 -
14 Kumbakonam 39.64 -

State Annual Action Plan (SAAP)
6
Rs.in Cr
S.n Name of the
City
Projects Approved in
SAAP 2015-16
Projects Approved in SHPSC
Name of the City
Projects Approved in
SAAP 2016-17
Projects Approved in
SHPSC
Trichirappalli 439.21 -
Tirunelveli 297.00 -
Vellore 348.00 343.69
Rameswaram 45.02 -
10) List out the number of city-wise projects where the second and third installments were
claimed. (Tabular form).
It has been planned to claim the second installment during May- 2017 after the implementation of
the projects.
11) List out the city-wise completed projects. Was the targeted benchmark achieved? Explain
the reasons for non-achievement (tabular form and 400 words)
Nil. Due to the cyclone impact, the projects could not be commenced till Jan - 2017.
12) List out the details of projects taken up in PPP model. Describe the type of PPP (tabular;
300 words)
No projects have been taken up in PPP model.
13) List out and describe any out-of-the-box initiatives/Smart Solutions/resilience
used/incorporated in the projects under implementation. What is the nature of the
innovation in the projects? (tabular; 300 words)
It is proposed to include the smart solutions in water management and sewerage system apart from
on-line consumer compliant redressal and billing / payment system.
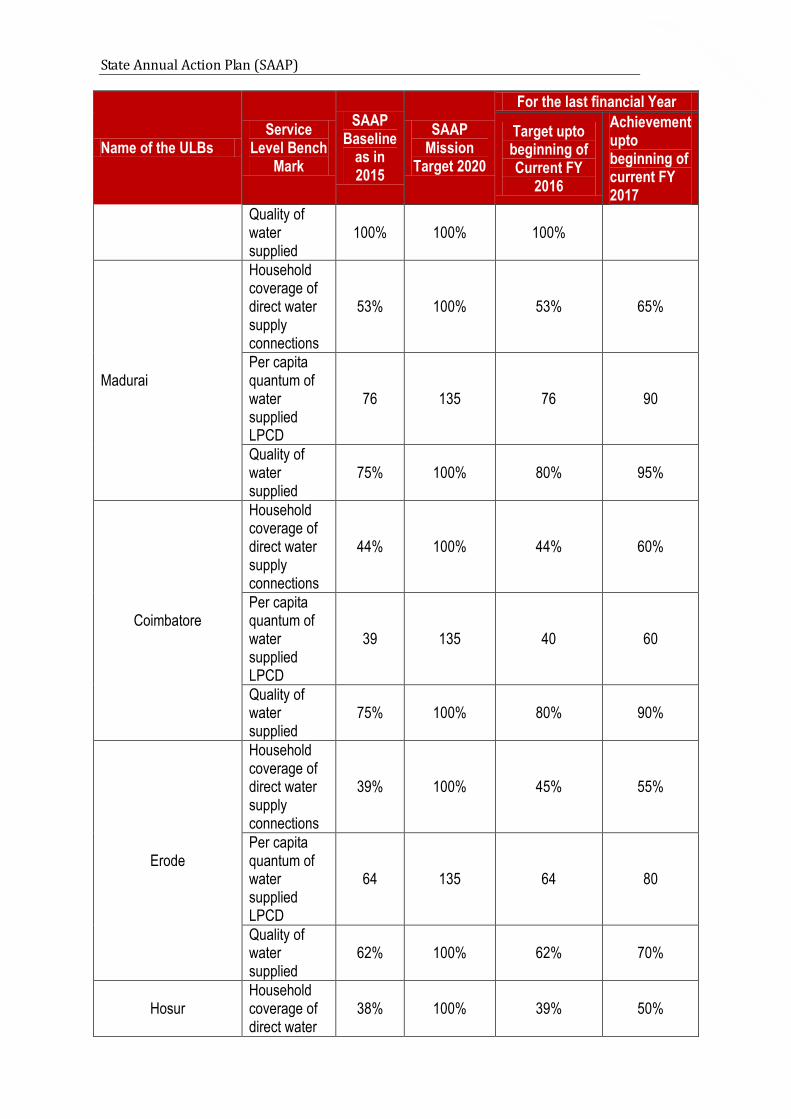
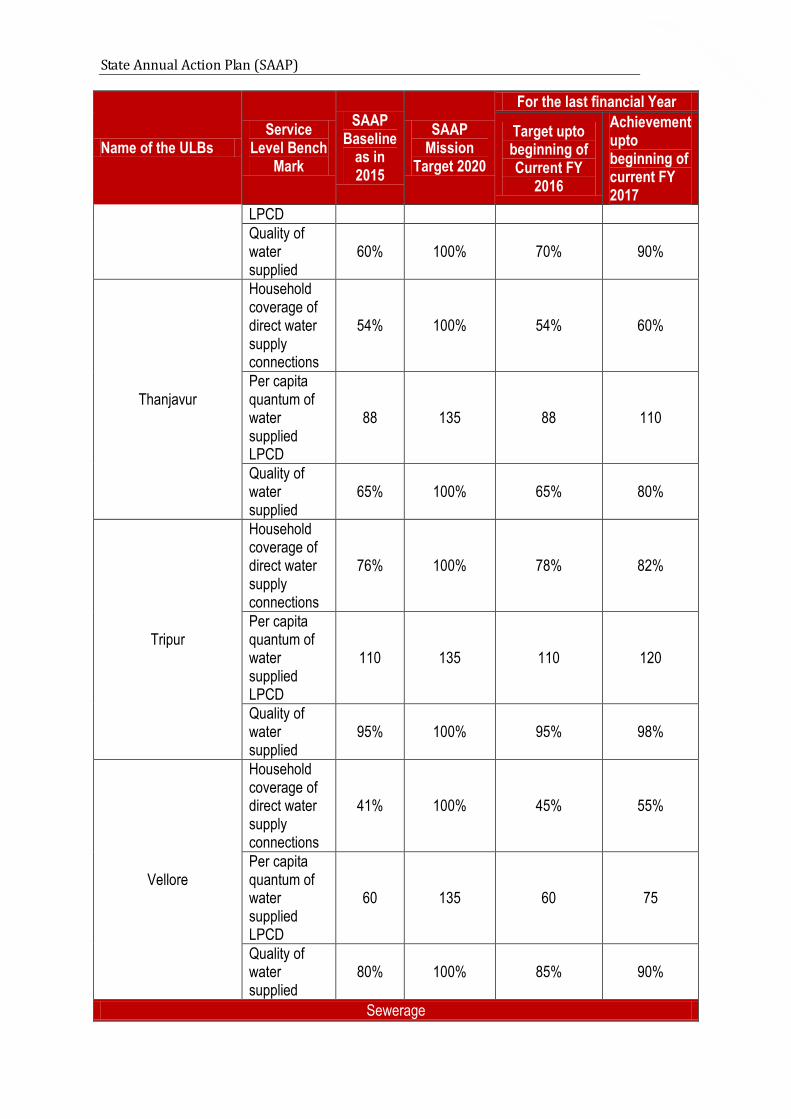
2.2 SERVICE LEVELS
The focus of AMRUT is to achieve service level benchmarks, such as universal coverage in water
supply, sewer connections, and so on. In the approved SAAPs, the States/ULBs have targeted the
benchmark of universal coverage. The SAAP has to review the progress towards targets set by the
States/ULBs to move towards achievement of universal coverage, etc. Please complete the following
table and respond to the questions based on the table.
Name of the ULBs Service
Level Bench Mark
SAAP Baseline
as in 2015
SAAP Mission
Target 2020
For the last financial Year
Target upto beginning of Current FY
2016
Achievement upto beginning of current FY 2017
Water Supply
Chennai Corporation
Household coverage of direct water supply
55% 100% 55% 70%

State Annual Action Plan (SAAP)
7
Name of the ULBs Service
Level Bench Mark
SAAP Baseline
as in 2015
SAAP Mission
Target 2020
For the last financial Year
Target upto beginning of Current FY
2016
Achievement upto beginning of current FY 2017
connections
Per capita quantum of water supplied LPCD
75.22 135 75 100
Quality of water supplied
92% 100% 94% 97%
Pallavaram
Household coverage of direct water supply connections
35% 100% 45% 70%
Per capita quantum of water supplied LPCD
30 135 30 60
Quality of water supplied
99% 100% 99% 99%
Tambaram
Household coverage of direct water supply connections
39% 100% 42% 50%
Per capita quantum of water supplied LPCD
68.00 135 72 80
Quality of water supplied
50% 100% 55% 70%
Kumbakonam
Household coverage of direct water supply connections
43% 100% 45% 55%
Per capita quantum of water supplied LPCD
113 135 113 120
State Annual Action Plan (SAAP)
8
Name of the ULBs Service
Level Bench Mark
SAAP Baseline
as in 2015
SAAP Mission
Target 2020
For the last financial Year
Target upto beginning of Current FY
2016
Achievement upto beginning of current FY 2017
Quality of water supplied
100% 100% 100%
Madurai
Household coverage of direct water supply connections
53% 100% 53% 65%
Per capita quantum of water supplied LPCD
76 135 76 90
Quality of water supplied
75% 100% 80% 95%
Coimbatore
Household coverage of direct water supply connections
44% 100% 44% 60%
Per capita quantum of water supplied LPCD
39 135 40 60
Quality of water supplied
75% 100% 80% 90%
Erode
Household coverage of direct water supply connections
39% 100% 45% 55%
Per capita quantum of water supplied LPCD
64 135 64 80
Quality of water supplied
62% 100% 62% 70%
Hosur Household coverage of direct water
38% 100% 39% 50%

State Annual Action Plan (SAAP)
9
Name of the ULBs Service
Level Bench Mark
SAAP Baseline
as in 2015
SAAP Mission
Target 2020
For the last financial Year
Target upto beginning of Current FY
2016
Achievement upto beginning of current FY 2017
supply connections
Per capita quantum of water supplied LPCD
65 135 65 70
Quality of water supplied
80% 100% 80% 85%
Madurai
Household coverage of direct water supply connections
53% 100% 53% 65%
Per capita quantum of water supplied LPCD
76 135 76 90
Quality of water supplied
75% 100% 80% 95%
Nagercoil
Household coverage of direct water supply connections
57% 100% 57% 65%
Per capita quantum of water supplied LPCD
93 135 93 100
Quality of water supplied
95% 100% 95% 95%
Rajapalayam
Household coverage of direct water supply connections
49% 100% 53% 60%
Per capita quantum of water supplied
58 135 61 61
State Annual Action Plan (SAAP)
10
Name of the ULBs Service
Level Bench Mark
SAAP Baseline
as in 2015
SAAP Mission
Target 2020
For the last financial Year
Target upto beginning of Current FY
2016
Achievement upto beginning of current FY 2017
LPCD
Quality of water supplied
60% 100% 70% 90%
Thanjavur
Household coverage of direct water supply connections
54% 100% 54% 60%
Per capita quantum of water supplied LPCD
88 135 88 110
Quality of water supplied
65% 100% 65% 80%
Tripur
Household coverage of direct water supply connections
76% 100% 78% 82%
Per capita quantum of water supplied LPCD
110 135 110 120
Quality of water supplied
95% 100% 95% 98%
Vellore
Household coverage of direct water supply connections
41% 100% 45% 55%
Per capita quantum of water supplied LPCD
60 135 60 75
Quality of water supplied
80% 100% 85% 90%
Sewerage

State Annual Action Plan (SAAP)
11
Name of the ULBs Service
Level Bench Mark
SAAP Baseline
as in 2015
SAAP Mission
Target 2020
For the last financial Year
Target upto beginning of Current FY
2016
Achievement upto beginning of current FY 2017
Chennai Corporation
Coverage of Latrines (Individual or community)
75% 100% 80% 95%
Coverage of sewerage network services
67% 100% 75% 90%
Efficiency of Collection of Sewerage
88% 100% 95% 97%
Efficiency in treatment
53% 100% 65% 90%
Coimbatore Municipal Corporation
Coverage of Latrines (Individual or community)
80% 100% 87% 92%
Coverage of sewerage network services
28% 100% 30% 50%
Efficiency of Collection of Sewerage
19% 100% 50% 77%
Efficiency in treatment
75% 100% 75% 85%
Kumbakonam Municipality
Coverage of Latrines (Individual or community)
79% 100% 80% 85%
Coverage of sewerage network services
40% 100% 45% 70%
Efficiency of Collection of Sewerage
69% 100% 69% 75%
Efficiency in treatment
86% 100% 86% 90%
Tiruchirappalli Municipal Corporation
Coverage of Latrines (Individual or community)
80% 100% 80% 90%
Coverage of sewerage
25% 100% 32% 55%

State Annual Action Plan (SAAP)
12
Name of the ULBs Service
Level Bench Mark
SAAP Baseline
as in 2015
SAAP Mission
Target 2020
For the last financial Year
Target upto beginning of Current FY
2016
Achievement upto beginning of current FY 2017
network services
Efficiency of Collection of Sewerage
26% 100% 35% 60%
Efficiency in treatment
69% 100% 72% 82%
Tirunelveli Municipal Corporation
Coverage of Latrines (Individual or community)
86% 100% 86% 90%
Coverage of sewerage network services
16% 100% 25% 50%
Efficiency of Collection of Sewerage
20% 100% 25% 45%
Efficiency in treatment
100% 100% 100% 100%
Vellore Municipal Corporation
Coverage of Latrines (Individual or community)
72% 100% 73% 82%
Coverage of sewerage network services
0% 100% 25% 35%
Efficiency of Collection of Sewerage
0% 100% 7% 35%
Efficiency in treatment
100% 100% 100% 100%
Rameswaram
Coverage of Latrines (Individual or community)
44% 100% 44% 45%
Coverage of sewerage network services
0% 100% 0% 25%
Efficiency of Collection of Sewerage
0% 100% 0% 25%
Efficiency in 0% 100% 0% 25%
State Annual Action Plan (SAAP)
13
Name of the ULBs Service
Level Bench Mark
SAAP Baseline
as in 2015
SAAP Mission
Target 2020
For the last financial Year
Target upto beginning of Current FY
2016
Achievement upto beginning of current FY 2017
treatment
14) In how many projects, city-wise, have targets not been achieved? What is the Plan for
Action to achieve the targets? (tabular form; 500 words)
Once the projects are commenced, the target specified for each of the projects will be monitored and
it will be ensured that all the projects are completed within the target period.
15) What are the status of the ongoing DPR preparation and the plan of action for the pending
DPRs? (300 words)
DPRs have already been prepared. The Chennai Water Supply Projects and green space DPRs
approved by the State Level High Powered Steering Committee. There pending DPRs may be
approved by SLTC on Feb - 2017.
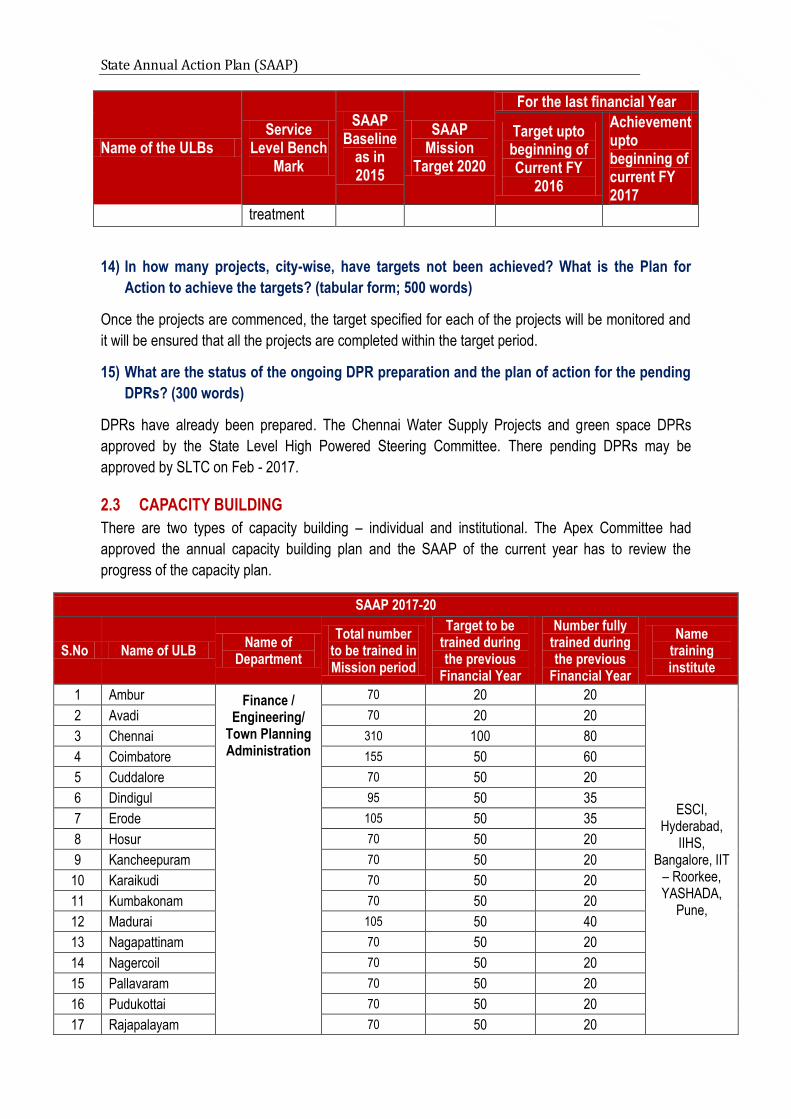
2.3 CAPACITY BUILDING
There are two types of capacity building – individual and institutional. The Apex Committee had
approved the annual capacity building plan and the SAAP of the current year has to review the
progress of the capacity plan.
SAAP 2017-20
S.No Name of ULB Name of
Department
Total number to be trained in Mission period
Target to be trained during the previous
Financial Year
Number fully trained during the previous
Financial Year
Name training institute
1 Ambur Finance / Engineering/
Town Planning Administration
70 20 20
ESCI, Hyderabad,
IIHS, Bangalore, IIT
– Roorkee, YASHADA,
Pune,
2 Avadi 70 20 20
3 Chennai 310 100 80
4 Coimbatore 155 50 60
5 Cuddalore 70 50 20
6 Dindigul 95 50 35
7 Erode 105 50 35
8 Hosur 70 50 20
9 Kancheepuram 70 50 20
10 Karaikudi 70 50 20
11 Kumbakonam 70 50 20
12 Madurai 105 50 40
13 Nagapattinam 70 50 20
14 Nagercoil 70 50 20
15 Pallavaram 70 50 20
16 Pudukottai 70 50 20
17 Rajapalayam 70 50 20

State Annual Action Plan (SAAP)
14
SAAP 2017-20
S.No Name of ULB Name of
Department
Total number to be trained in Mission period
Target to be trained during the previous
Financial Year
Number fully trained during the previous
Financial Year
Name training institute
18 Salem
105 50 35
19 Tambaram 70 50 20
20 Thanjavur 95 50 35
21 Thiruvannamalai 70 50 20
22 Thoothukudi 105 50 35
23 Tiruchirapalli 105 50 35
24 Tirunelveli 105 50 30
25 Tiruppur 80 50 30
26 Velankanni TP 65 10 20
27 Vellore 105 50 30
Total 2515 1300 780
16) In how many departments was training completed as approved in the SAAP of the last
Financial Year? In how many departments was training partially done and in how many
departments training not done at all? Please give reasons (300 words)
Training are being conducted in all the four departments viz., Finance , Engineering and Public Health,
Town Planning and Administration
17) List out the training institutes that could not complete training of targeted functionaries.
What were the reasons and how will this be avoided in future? (tabular; 300 words)
Nil
18) What is the status of utilization of funds? (250 words)
The fund utilized under capacity building during the FY – 2015-16 is Rs. 0.49 lakhs towards
SMMU unit, Residential Training Programme and workshops.
19) Have the participants visited best practice sites? Give details (350 words)
An exposure visit to Ahmedabad for the Officials of ULBs was conducted between 15th and 16th
November 2016.The officials were exposed to various successful project sites including the
following:
1. Solid Waste Management / SBM Project
2. SNP / Housing Project
3. Sewerage Treatment Plant
4. E - Governance & CCRS
5. BRTS Control Room Visit & Presentation
6. Riverfront Park Visit

State Annual Action Plan (SAAP)
15
20) Have the participants attended any national/international workshops, as per guideline
(Annexure 7)? (350 words)
A workshop on Making Chennai Smart in IT field for the officials of ULBs was conducted on
08.09.2016 at Hotel Rain Tree Chennai. The following were discussed during the workshop
programme.
1. Basic Infrastructure required for Chennai City and ensuring how future requirements are
to be met
2. Discussion on the application layer that will rest on top of this infrastructure.
3. Discussion on how to use these IT tools to make Chennai a Smart, Sensitive and
Responsive City.
21) What is the plan of action for the pending activities, if any? (400 words)
There are no pending activities.
2.4 REFORMS
According to Guideline 4.3, incentives of previous year will be given at the start of succeeding year,
for which States are required to do a self-assessment, on receipt of which incentives will be awarded.
A key requirement to claim incentives is to achieve at least 70 per cent Reforms for that year. Some
of the criteria to be considered while doing the assessment are as follows:
S.n Milestones Activities to be achieved Implementation Time Line
Target for last Financial Year
Achievement for the last financial
year
No.of ULBs
Achieved
No.of ULBs not
Achieved
1 E-Governance
1. Coverage with E-MAAS (from the date of hosting the software
24 Months
28
Registration of Birth, Death and Marriage
Water & Sewerage Charges
Grievance redressal
Property Tax
Advertisement Tax
Issuance of Licenses
Building permissions
Mutations
Payroll
Pension and e-procurement
2 Constitution and professionalization of municipal cadre
Establishment of Municipal cadre
24 Months
28
3 Augmenting double entry accounting
Appointment of internal auditor
24 Months
Local Fund Auditor
28

State Annual Action Plan (SAAP)
16
already available
4 Urban Planning and City level Plans
Make a State Level Policy for implementing the parameters given in the National mission for Sustainable Habitat
24 Months
28
5 Devolution of Funds and Functions
Implementation of SFC recommendations within timeline
24 Months
Already in Place
28
6 Review of Building Bye Laws
State to formulate a policy and action plan for having a solar roof top in all buildings having an area greater than 500 square meters and all public buildings
24 Months
Already in place
28
State to formulate a policy and action plan for having Rain water harvesting structures in all commercial, public buildings and new buildings on plots of 300 sq. meters and above.
24 Months
Already in Place
28
8 Set-up financial intermediary at state level
Establish and Operationalize Financial intermediary-pool, finance, access external funds, float municipal bonds
24 Months
Already in Place
28
9 Credit Rating Complete the credit ratings of the ULBs
24 Months
28
10 Energy and Water audit
Give incentives for green buildings (e.g. rebate in property tax or charges connected to building permission/development charges).
28
1) Have the Reform formats prescribed by the TCPO furnished?
Yes
2) Did the State as a whole complete 70 percent of Reforms? If, yes was the incentive
claimed? (100 words)
Yes. For Year 2015-16 incentive grant is already achieved. The incentive fund for FY 2016-17 will be claimed separately.
3) What was the amount of incentive claimed? How was it distributed among the ULBs and
what was it used for? (tabular; 300 words)
As per the MoUD guidelines in this regard, 10% of the annual budgetary allocation is admissible for
incentive for reforms and same will be distributed to ULBs as per their achievement will be distributed
to ULBs, as per the direction of State Level High Powered Sanctioning Committee.

State Annual Action Plan (SAAP)
17
4) What is the status of Reforms to be completed in the Mission period? Has advance action
been taken and a Plan of Action prepared? (500 words)
80% of reforms are already achieved for the FY 2016-17 milestones. The State has plan of action to
achieve as per the time line and as suggested by the TCPO. The following studies are under progress
viz., credit rating, water audit, energy audit, GIS Master Plan etc.,
5) Give any instances of innovation in Reform implementation. (300 words)
There are no any instances of new innovation
2.5 USE OF A&OE
6) What are the items for which the A&OE has been used? (tabular; 250 words)
A&OE funds have been utilized viz.
1. Expenses incurred by State Mission Management Unit
2. Conduct National Workshop on Smart Solutions
3. Conduct Residential Training Programmes and visit to projects / utilities which are having
best practices
7) Are the items similar to the approved items in SAAP or there is any deviation? If yes, list
the items with reasons (tabular; 300 words)
Yes.
8) What is the utilization status of funds? (tabular; 250 words)
S.No Particulars Expenditure Amount Rs. In Cr.
1 2 3
1 State Mission Management 0.43
2 Conduct National Level Workshop on Smart Solutions 0.02
3 Conduct Residential Training Programme and visit to projects / utilities which are having best practices
0.12
9) Has the IRMA been appointed? What was the procedure followed?(250 words)
IRMA not appointed
10) If not appointed, give reason for delay and the likely date of appointment (100 words)
IRMA to be appointed by MoUD
11) Have you taken up activities connected to E-Municipality as a Service (E-MAAS)? Please
give details. (250 words)
Commissionerate of Municipal Administration is in the process of developing Centralized Web Based
Software consisting of 29 modules and it is proposed to be completed in 4 months.

State Annual Action Plan (SAAP)
18
12) Have you displayed the logo and tagline of AMRUT prominently on all projects? Please
give list. (tabular; 100 words)
Already instructions have been issued to all the ULBs to display the logo and tag line of AMRUT
prominently in the project sites.
13) Have you utilized the funds on any of the inadmissible components (Para 4.4)? If yes, give
list and reasons. (tabular; 350 words)
No
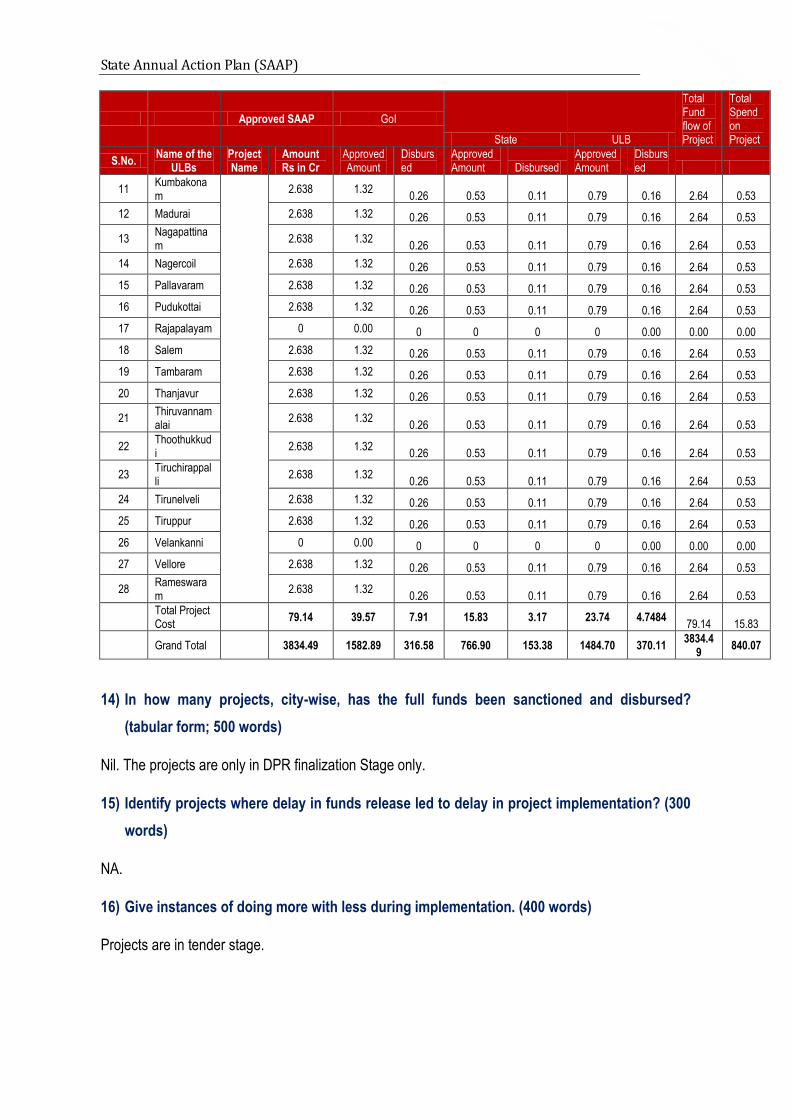
2.6 FUNDS FLOW
One reason for project delay has been delayed release of funds. In the following table indicate the
status of funds release and resource mobilization.
Approved SAAP GoI
State ULB
Total Fund flow of Project
Total Spend on Project
S.No. Name of the
ULBs Project Name
Amount Rs in Cr
Approved Amount
Disbursed
Approved Amount Disbursed
Approved Amount
Disbursed
1 Chennai
Water Supply
723.96 238.91 47.78 144.79 28.96 340.26 102.08 723.96 178.82
2 Pallavaram 274 137.00 27.40 54.8 10.96 82.20 24.66 274.00 63.02
3 Tambaram 320 160.00 32.00 64 12.80 96.00 28.80 320.00 73.60
4 Kumbakonam
25.67 12.84 2.57 5.134 1.03 7.70 2.31 25.67 5.90
5 Madurai 437.3 144.31 28.86 87.46 17.49 205.53 61.66 437.30 108.01
Total
1780.93 693.05 138.61 356.19 71.24 731.69 219.51
1780.93
429.36
1 Chennai
Sewerage
482.72 159.30 31.86 96.54 19.31 226.88 45.38 482.72 96.54
2 Coimbatore 322.83 106.53 21.31 64.57 12.91 151.73 30.35 322.83 64.57
3 Kumbakonam
39.64 19.82 3.96 7.93 1.59 11.89 2.38 39.64 7.93
4 Tiruchirappalli
439.21 219.61 43.92 87.84 17.57 131.76 26.35 439.21 87.84
5 Tirunelveli 297 148.50 29.70 59.4 11.88 89.10 17.82 297.00 59.40
6 Vellore 348 174.00 34.80 69.6 13.92 104.40 20.88 348.00 69.60
7 Rameswaram
45.02 22.51 4.50 9.004 1.80 13.51 2.70 45.02 9.00
Total
1974.42 850.27
170.05 394.88 78.98 729.27 145.85 1974.4
2 394.88
1 Ambur
Green space
0 0.00 0 0 0 0 0 0.00 0.00
2 Avadi 2.638 1.32 0.26 0.53 0.11 0.79 0.16 2.64 0.53
3 Chennai 13.19 6.60 1.32 2.64 0.53 3.96 0.79 13.19 2.64
4 Coimbatore 5.276 2.64 0.53 1.06 0.21 1.58 0.32 5.28 1.06
5 Cuddalore 2.638 1.32 0.26 0.53 0.11 0.79 0.16 2.64 0.53
6 Dindigul 2.638 1.32 0.26 0.53 0.11 0.79 0.16 2.64 0.53
7 Erode 2.638 1.32 0.26 0.53 0.11 0.79 0.16 2.64 0.53
8 Hosur 2.638 1.32 0.26 0.53 0.11 0.79 0.16 2.64 0.53
9 Kancheepuram
2.638 1.32 0.26 0.53 0.11 0.79 0.16 2.64 0.53
10 Karaikudi 2.638 1.32 0.26 0.53 0.11 0.79 0.16 2.64 0.53
State Annual Action Plan (SAAP)
19
Approved SAAP GoI
State ULB
Total Fund flow of Project
Total Spend on Project
S.No. Name of the
ULBs Project Name
Amount Rs in Cr
Approved Amount
Disbursed
Approved Amount Disbursed
Approved Amount
Disbursed
11 Kumbakonam
2.638 1.32 0.26 0.53 0.11 0.79 0.16 2.64 0.53
12 Madurai 2.638 1.32 0.26 0.53 0.11 0.79 0.16 2.64 0.53
13 Nagapattinam
2.638 1.32 0.26 0.53 0.11 0.79 0.16 2.64 0.53
14 Nagercoil 2.638 1.32 0.26 0.53 0.11 0.79 0.16 2.64 0.53
15 Pallavaram 2.638 1.32 0.26 0.53 0.11 0.79 0.16 2.64 0.53
16 Pudukottai 2.638 1.32 0.26 0.53 0.11 0.79 0.16 2.64 0.53
17 Rajapalayam 0 0.00 0 0 0 0 0.00 0.00 0.00
18 Salem 2.638 1.32 0.26 0.53 0.11 0.79 0.16 2.64 0.53
19 Tambaram 2.638 1.32 0.26 0.53 0.11 0.79 0.16 2.64 0.53
20 Thanjavur 2.638 1.32 0.26 0.53 0.11 0.79 0.16 2.64 0.53
21 Thiruvannamalai
2.638 1.32 0.26 0.53 0.11 0.79 0.16 2.64 0.53
22 Thoothukkudi
2.638 1.32 0.26 0.53 0.11 0.79 0.16 2.64 0.53
23 Tiruchirappalli
2.638 1.32 0.26 0.53 0.11 0.79 0.16 2.64 0.53
24 Tirunelveli 2.638 1.32 0.26 0.53 0.11 0.79 0.16 2.64 0.53
25 Tiruppur 2.638 1.32 0.26 0.53 0.11 0.79 0.16 2.64 0.53
26 Velankanni 0 0.00 0 0 0 0 0.00 0.00 0.00
27 Vellore 2.638 1.32 0.26 0.53 0.11 0.79 0.16 2.64 0.53
28 Rameswaram
2.638 1.32 0.26 0.53 0.11 0.79 0.16 2.64 0.53
Total Project Cost
79.14 39.57 7.91 15.83 3.17 23.74 4.7484 79.14 15.83
Grand Total
3834.49 1582.89 316.58 766.90 153.38 1484.70 370.11
3834.49
840.07
14) In how many projects, city-wise, has the full funds been sanctioned and disbursed?
(tabular form; 500 words)
Nil. The projects are only in DPR finalization Stage only.
15) Identify projects where delay in funds release led to delay in project implementation? (300
words)
NA.
16) Give instances of doing more with less during implementation. (400 words)
Projects are in tender stage.

State Annual Action Plan (SAAP)
20
2.7 FUNDS DISBURSEMENTS AND CONDITIONS
17) How many project fund request has been made to the GoI? (250 words)
There is no request made to GoI so far.
18) How many installments the GoI has released? (250 words)
The GoI has released only the first installment (20%) of SAAP 2015-16 & SAAP 2016-17
19) Is there any observation from the GoI regarding the claims made? (350 words)
No.
20) List out the conditions imposed by the Apex Committee, State HPSC and the SLTC. Have
all the conditions been complied with? If, no identify the conditions not complied with and
give reasons for non-compliance. (tabular; 500 words)
APEX Committee General Conditions SAAP 2015-16 and SAAP 2016-17 for approval of SAAP -2017-20
S.No GoI Condition Status
1 Projects amounting to atleast 25% against SAAP I to be contracted
Out of the sanctioned project cost of Rs.3316.22 Cr, projects Rs.295.27 Cr has been contracted (9%)
2 Projects amounting to at least 50% of total approvals (SAAP I & II) to have the DPRs approved
The total approved cost of SAAP I & II is Rs.7150.71 Cr. The SHPSC of AMRUT has approved projects at a cost of Rs.4217.43 Cr (50 % achieved)
3
100% of Central fund and corresponding State share against the SAAP-I and SAAP-II to be transferred to the State Mission Directorate / ULBs / Parastatals (as the case may be)
GOI share – 591.04 crores received (SAAP I & 2) GoTN share - SAAP 1 – Rs 352.53 crores received
4
PDMC should have been appointed and be in place CMWSSB and TWAD are preparing the DPRs and executing the projects. Both are acting as PDMC for Tamil Nadu. PDMC is in place.
5 Regarding credit rating, work must be awarded for all Mission Cities and Credit Rating targeted to be completed by March 2017
Credit Rating has been completed for all AMRUT Cities.
State Annual Action Plan (SAAP)
21
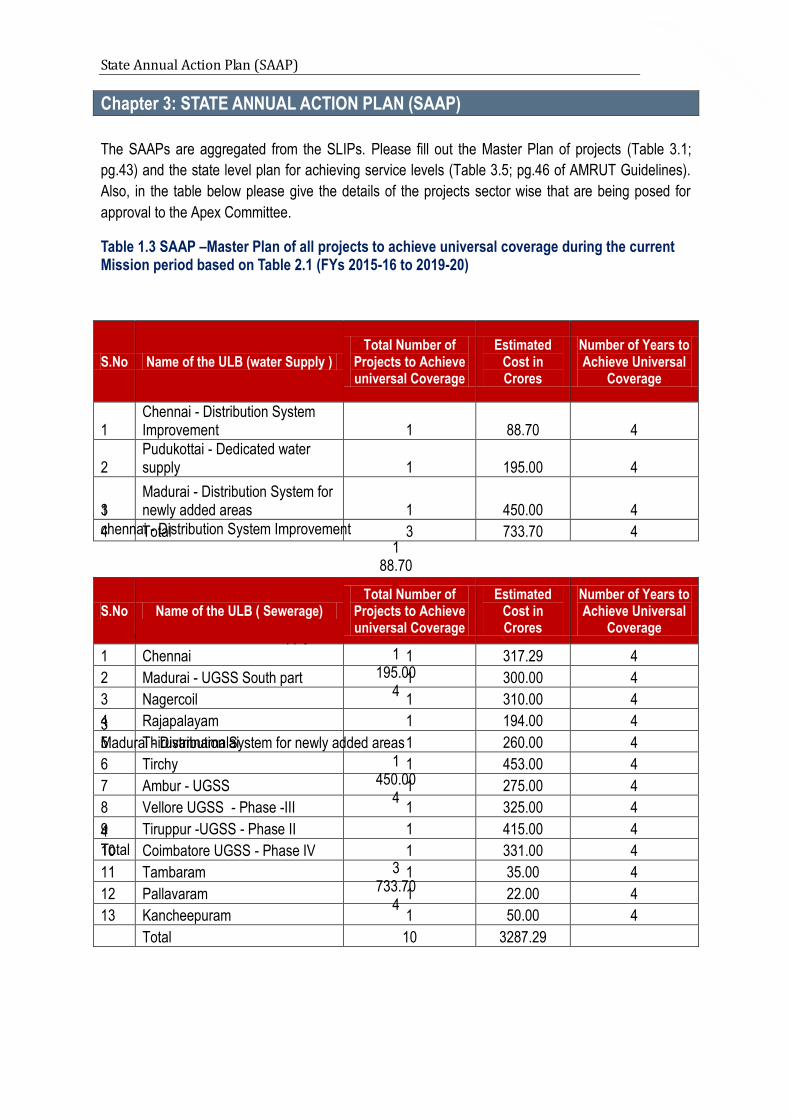
Chapter 3: STATE ANNUAL ACTION PLAN (SAAP)
The SAAPs are aggregated from the SLIPs. Please fill out the Master Plan of projects (Table 3.1;
pg.43) and the state level plan for achieving service levels (Table 3.5; pg.46 of AMRUT Guidelines).
Also, in the table below please give the details of the projects sector wise that are being posed for
approval to the Apex Committee.
Table 1.3 SAAP –Master Plan of all projects to achieve universal coverage during the current Mission period based on Table 2.1 (FYs 2015-16 to 2019-20)
S.No
Name of the ULB (water Supply ) Total Number of Projects to Achieve universal Coverage
Estimated Cost in Crores Number of Years to Achieve Universal Coverage
1 chennai - Distribution System Improvement
1 88.70
4
2 Pudukottai - Dedicated water supply
1 195.00
4
3 Madurai - Distribution System for newly added areas
1 450.00
4
4 Total
3 733.70
4
S.No Name of the ULB (water Supply ) Total Number of
Projects to Achieve universal Coverage
Estimated Cost in Crores
Number of Years to Achieve Universal
Coverage
1 Chennai - Distribution System Improvement 1 88.70 4
2 Pudukottai - Dedicated water supply 1 195.00 4
3 Madurai - Distribution System for newly added areas 1 450.00 4
4 Total 3 733.70 4
S.No Name of the ULB ( Sewerage) Total Number of
Projects to Achieve universal Coverage
Estimated Cost in Crores
Number of Years to Achieve Universal
Coverage
1 Chennai 1 317.29 4
2 Madurai - UGSS South part 1 300.00 4
3 Nagercoil 1 310.00 4
4 Rajapalayam 1 194.00 4
5 Thiruvannamalai 1 260.00 4
6 Tirchy 1 453.00 4
7 Ambur - UGSS 1 275.00 4
8 Vellore UGSS - Phase -III 1 325.00 4
9 Tiruppur -UGSS - Phase II 1 415.00 4
10 Coimbatore UGSS - Phase IV 1 331.00 4
11 Tambaram 1 35.00 4
12 Pallavaram 1 22.00 4
13 Kancheepuram 1 50.00 4
Total 10 3287.29

State Annual Action Plan (SAAP)
22
S.No Name of the AMRUT Cities
(Green Space)
Total Number of Projects to Achieve universal Coverage
Estimated Cost in Crores
Number of Years to Achieve Universal
Coverage
1 Ambur 1 2.73 4
2 Avadi 1 2.73 4
3 Chennai 1 13.65 4
4 Coimbatore 1 5.46 4
5 Cuddalore 1 2.73 4
6 Dindigul 1 2.73 4
7 Erode 1 2.73 4
8 Hosur 1 2.73 4
9 Kancheepuram 1 2.73 4
10 Karaikudi 1 2.73 4
11 Kumbakonam 1 2.73 4
12 Madurai 1 2.73 4
13 Nagapattinam 1 2.73 4
14 Nagercoil 1 2.73 4
15 Pallavaram 1 2.73 4
16 Pudukottai 1 2.73 4
17 Rajapalayam 1 2.73 4
18 Salem 1 2.73 4
19 Tambaram 1 2.73 4
20 Thanjavur 1 2.73 4
21 Thiruvannamalai 1 2.73 4
22 Thoothukkudi 1 2.73 4
23 Tiruchirappalli 1 2.73 4
24 Tirunelveli 1 2.73 4
25 Tiruppur 1 2.73 4
26 Velankanni 1 2.73 4
27 Vellore 1 2.73 4
28 Rameswaram 1 2.73 4
Total Project Cost 28 90.07
State Annual Action Plan (SAAP)
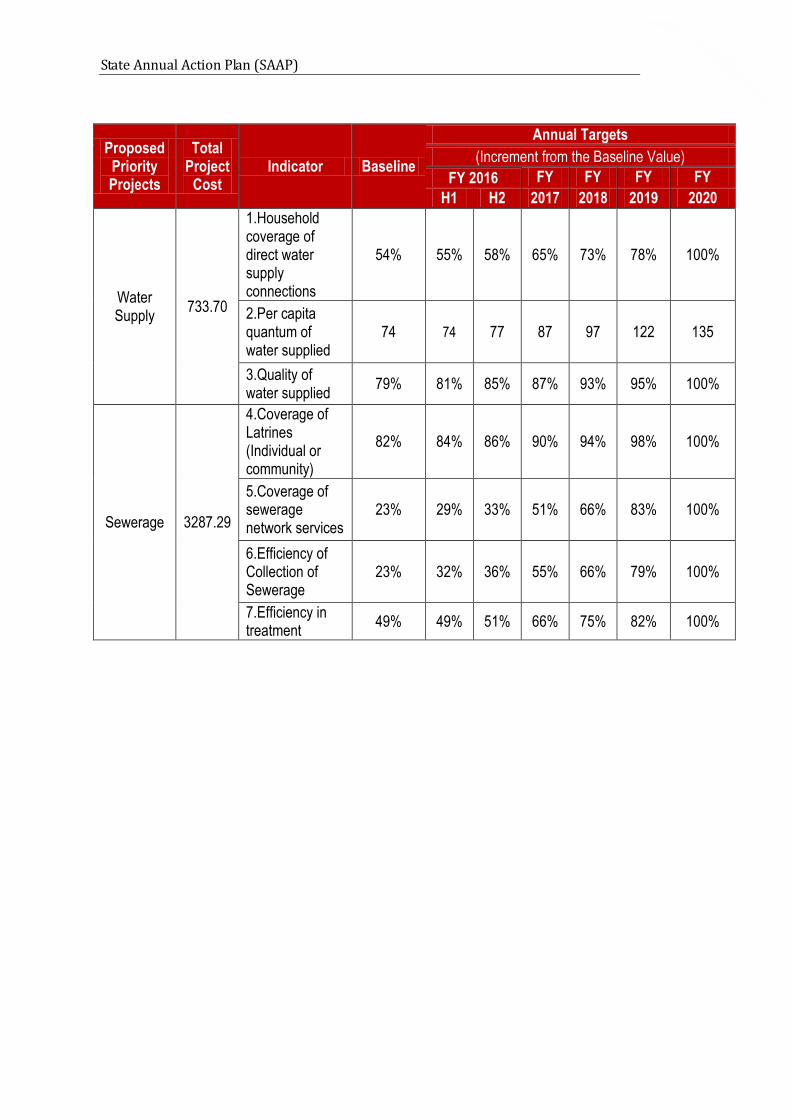
23
Proposed Priority Projects
Total Project
Cost Indicator Baseline
Annual Targets
(Increment from the Baseline Value)
FY 2016 FY FY FY FY
H1 H2 2017 2018 2019 2020
Water Supply
733.70
1.Household coverage of direct water supply connections
54% 55% 58% 65% 73% 78% 100%
2.Per capita quantum of water supplied
74 74 77 87 97 122 135
3.Quality of water supplied
79% 81% 85% 87% 93% 95% 100%
Sewerage 3287.29
4.Coverage of Latrines (Individual or community)
82% 84% 86% 90% 94% 98% 100%
5.Coverage of sewerage network services
23% 29% 33% 51% 66% 83% 100%
6.Efficiency of Collection of Sewerage
23% 32% 36% 55% 66% 79% 100%
7.Efficiency in treatment
49% 49% 51% 66% 75% 82% 100%
State Annual Action Plan (SAAP)
24
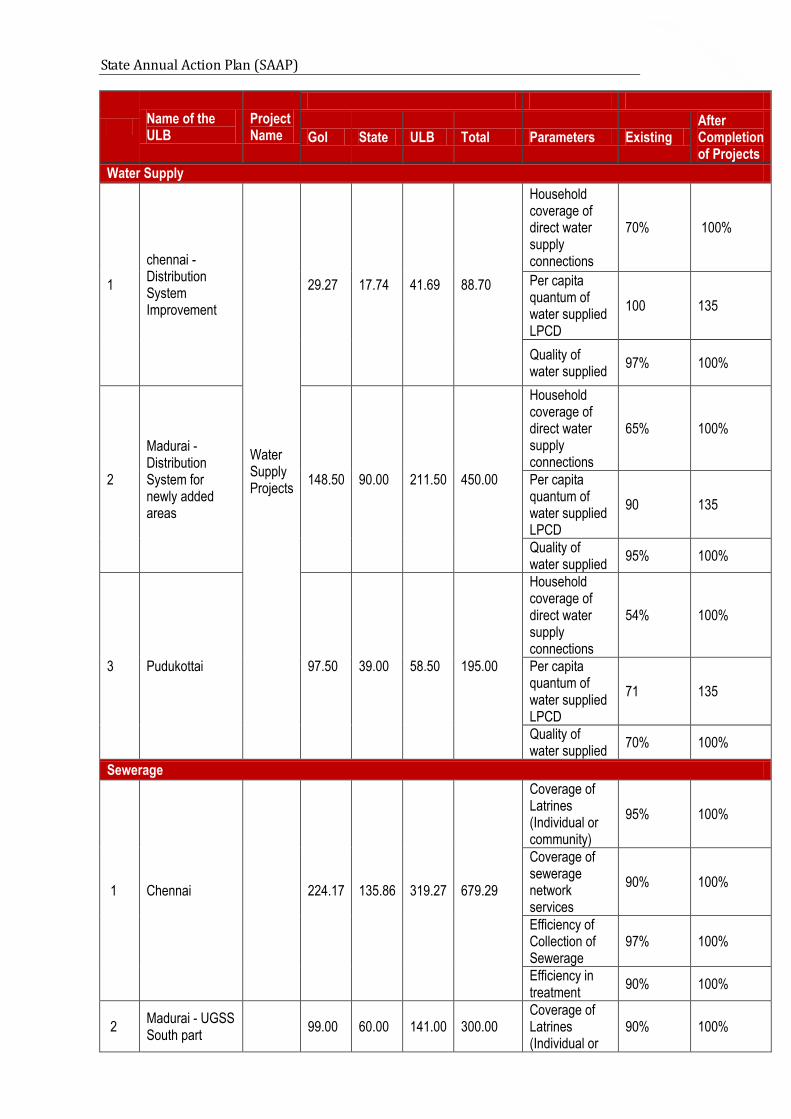
Name of the ULB
Project Name
GoI State ULB Total Parameters Existing After Completion of Projects
Water Supply
1
chennai - Distribution System Improvement
Water Supply Projects
29.27 17.74 41.69 88.70
Household coverage of direct water supply connections
70% 100%
Per capita quantum of water supplied LPCD
100 135
Quality of water supplied
97% 100%
2
Madurai - Distribution System for newly added areas
148.50 90.00 211.50 450.00
Household coverage of direct water supply connections
65% 100%
Per capita quantum of water supplied LPCD
90 135
Quality of water supplied
95% 100%
3 Pudukottai 97.50 39.00 58.50 195.00
Household coverage of direct water supply connections
54% 100%
Per capita quantum of water supplied LPCD
71 135
Quality of water supplied
70% 100%
Sewerage
1 Chennai 224.17 135.86 319.27 679.29
Coverage of Latrines (Individual or community)
95% 100%
Coverage of sewerage network services
90% 100%
Efficiency of Collection of Sewerage
97% 100%
Efficiency in treatment
90% 100%
2 Madurai - UGSS South part
99.00 60.00 141.00 300.00 Coverage of Latrines (Individual or
90% 100%
State Annual Action Plan (SAAP)
25
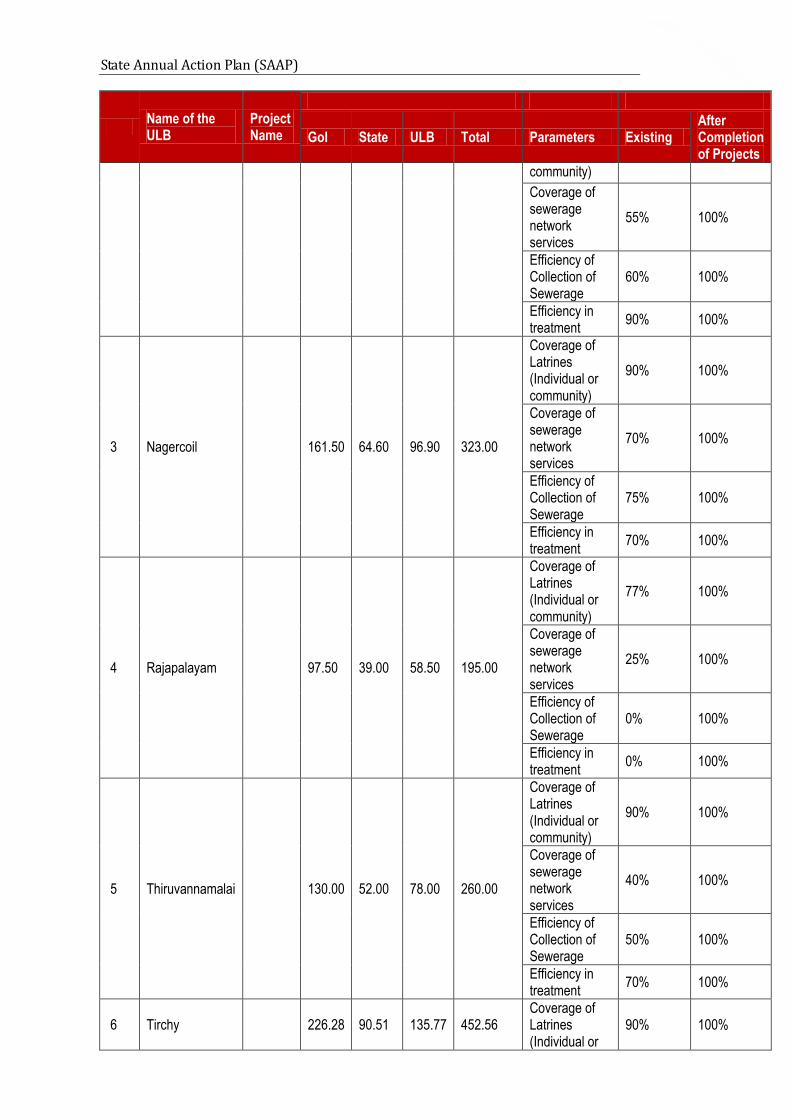
Name of the ULB
Project Name
GoI State ULB Total Parameters Existing After Completion of Projects
community)
Coverage of sewerage network services
55% 100%
Efficiency of Collection of Sewerage
60% 100%
Efficiency in treatment
90% 100%
3 Nagercoil 161.50 64.60 96.90 323.00
Coverage of Latrines (Individual or community)
90% 100%
Coverage of sewerage network services
70% 100%
Efficiency of Collection of Sewerage
75% 100%
Efficiency in treatment
70% 100%
4 Rajapalayam 97.50 39.00 58.50 195.00
Coverage of Latrines (Individual or community)
77% 100%
Coverage of sewerage network services
25% 100%
Efficiency of Collection of Sewerage
0% 100%
Efficiency in treatment
0% 100%
5 Thiruvannamalai 130.00 52.00 78.00 260.00
Coverage of Latrines (Individual or community)
90% 100%
Coverage of sewerage network services
40% 100%
Efficiency of Collection of Sewerage
50% 100%
Efficiency in treatment
70% 100%
6 Tirchy 226.28 90.51 135.77 452.56 Coverage of Latrines (Individual or
90% 100%

State Annual Action Plan (SAAP)
26
Name of the ULB
Project Name
GoI State ULB Total Parameters Existing After Completion of Projects
community)
Coverage of sewerage network services
55% 100%
Efficiency of Collection of Sewerage
60% 100%
Efficiency in treatment
82% 100%
7 Ambur - UGSS 137.50 55.00 82.50 275.00
Coverage of Latrines (Individual or community)
95% 100%
Coverage of sewerage network services
45% 100%
Efficiency of Collection of Sewerage
50% 100%
Efficiency in treatment
60% 100%
8 Vellore UGSS - Phase -III
162.50 65.00 97.50 325.00
Coverage of Latrines (Individual or community)
82% 100%
Coverage of sewerage network services
35% 100%
Efficiency of Collection of Sewerage
35% 100%
Efficiency in treatment
100% 100%
9 Tiruppur -UGSS - Phase II
212.50 85.00 127.50 425.00
Coverage of Latrines (Individual or community)
95% 100%
Coverage of sewerage network services
45% 100%

State Annual Action Plan (SAAP)
27
Name of the ULB
Project Name
GoI State ULB Total Parameters Existing After Completion of Projects
Efficiency of Collection of Sewerage
50% 100%
Efficiency in treatment
35% 100%
10 Coimbatore UGSS - Phase IV
115.50 70.00 164.50 350.00
Coverage of Latrines (Individual or community)
92% 100%
Coverage of sewerage network services
50% 100%
Efficiency of Collection of Sewerage
77% 100%
Efficiency in treatment
85% 100%
Tambaram UGSS 17.50 7.00 10.50 35.00
Coverage of Latrines (Individual or community) 80% 100%
Coverage of sewerage network services 0% 100%
Efficiency of Collection of Sewerage 0% 100%
Pallavaram UGSS 11.00 4.40 6.60 22.00
Coverage of Latrines (Individual or community)
36% 100%
Coverage of sewerage network services
78% 100%
Efficiency of Collection of Sewerage
75% 100%
Kancheepuram Municipality
UGSS 25.00 10.00 15.00 50.00
Coverage of Latrines (Individual or community)
95% 100%
Coverage of sewerage
45% 100%
State Annual Action Plan (SAAP)
28
Name of the ULB
Project Name
GoI State ULB Total Parameters Existing After Completion of Projects
network services
Efficiency of Collection of Sewerage
52% 100%
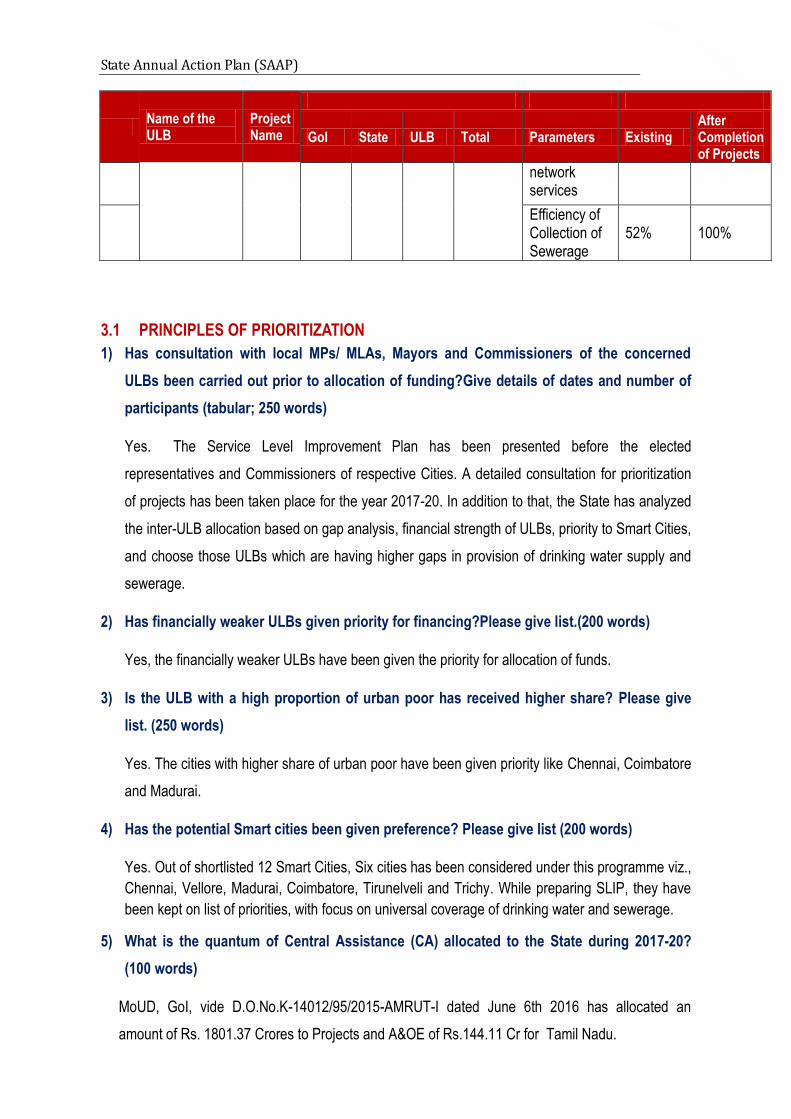
3.1 PRINCIPLES OF PRIORITIZATION
1) Has consultation with local MPs/ MLAs, Mayors and Commissioners of the concerned
ULBs been carried out prior to allocation of funding?Give details of dates and number of
participants (tabular; 250 words)
Yes. The Service Level Improvement Plan has been presented before the elected
representatives and Commissioners of respective Cities. A detailed consultation for prioritization
of projects has been taken place for the year 2017-20. In addition to that, the State has analyzed
the inter-ULB allocation based on gap analysis, financial strength of ULBs, priority to Smart Cities,
and choose those ULBs which are having higher gaps in provision of drinking water supply and
sewerage.
2) Has financially weaker ULBs given priority for financing?Please give list.(200 words)
Yes, the financially weaker ULBs have been given the priority for allocation of funds.
3) Is the ULB with a high proportion of urban poor has received higher share? Please give
list. (250 words)
Yes. The cities with higher share of urban poor have been given priority like Chennai, Coimbatore
and Madurai.
4) Has the potential Smart cities been given preference? Please give list (200 words)
Yes. Out of shortlisted 12 Smart Cities, Six cities has been considered under this programme viz.,
Chennai, Vellore, Madurai, Coimbatore, Tirunelveli and Trichy. While preparing SLIP, they have
been kept on list of priorities, with focus on universal coverage of drinking water and sewerage.
5) What is the quantum of Central Assistance (CA) allocated to the State during 2017-20?
(100 words)
MoUD, GoI, vide D.O.No.K-14012/95/2015-AMRUT-I dated June 6th 2016 has allocated an
amount of Rs. 1801.37 Crores to Projects and A&OE of Rs.144.11 Cr for Tamil Nadu.

State Annual Action Plan (SAAP)
29
6) Has the allocation to different ULBs within State is consistent with the urban profile of the
state? (260 words)
Yes. The fund allocation has been considered based on some crucial urban parameters like urban
poor, urban revenue potential, urbanization trend etc.
3.2 IMPORTANCE OF O&M
It has been observed that ULBs pay little attention to the operation and maintenance of infrastructure
assets created after completion of projects. This tendency on the part of implementing agencies leads
to shear loss off national assets. Please fill out the Plan of action for A&OE expenses given in Table 4
(pg-48) of AMRUT Guidelines and answer the following questions.
1) Do projects proposed in the SAAP include O&M for at least five years?What is the nature
of O&M? (tabular; 300 words)
Yes. All projects being proposed in the SAAP include O & M for five years. Tenders and bids will be
invited considering that Operation and Maintenance would be the responsibility of the contractor /
agency, who will implement the project. ULB will take care of expenses for O & M by ways of
recovery of user charges etc.
2) How O&M expenditures are propose to be funded by ULBs/ parastatal? (200 words)
As stated above, O & M expenditure of the assets created under AMRUT Scheme are proposed to
recover through user charges and one time connection charges.
3) Is it by way of levy of user charges or other revenue streams? (100 words)
The prime source of revenue is through user charges. It is also planned to meet O&M through
expanding the connection/ service network, strengthening billing and collection systems and cross
verification with other data bases like Property Tax assessment etc. and through expenditure
reduction by way of redeployment of man power, energy conservation and efficiency improvement,
reduction of NRW (Non- Revenue Water), reuse and recycling of waste water, Metering, SCADA etc.
4) Has O&M cost been excluded from project cost for the purpose of funding? (100 words)
Yes, O&M cost has been excluded from project cost for the purpose of funding and shall be borne by
ULB through user charges.
5) What kind of model been proposed by States/ULBs to fund the O&M? Please discuss. (250
words)
Project contract will include responsibility of 5 years O& M liability. Innovative mechanism & cost
effective technology will be adopted for deigning the project.
6) Is it through an appropriate cost recovery mechanism in order to make them self-reliant
and cost-effective? How? (250 words)
State Annual Action Plan (SAAP)
30
Yes. As stated above, efforts will be made for 100% O & M recovery. It is proposed to adopt
appropriate strategies to meet the O&M costs through user charges, effective billing and collection,
tariff rationalization, reduce unauthorized connections, use ICT solutions like SMART Meter, SCADA
etc..
3.3 REFORM IMPLEMENTATION
In order to become eligible to claim the 10% incentive, the State is required to implement the Reforms
prescribed by GoI. The states are also required to a self-assessment and based on the score the
Apex committee will decide the eligibility of the state. Please fill out Table 5.2; pg. 52 of AMRUT
Guidelines and respond to the following. Some of the criteria that should be considered while
preparing the SAAP:
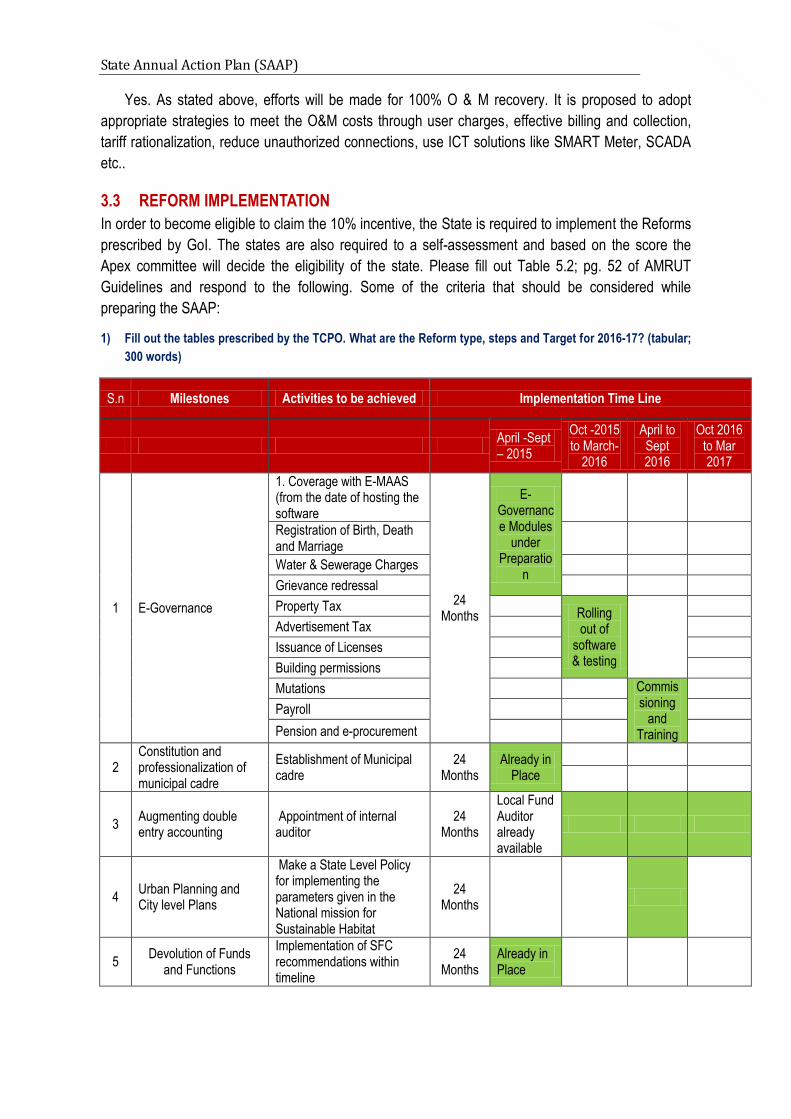
1) Fill out the tables prescribed by the TCPO. What are the Reform type, steps and Target for 2016-17? (tabular;
300 words)
S.n Milestones Activities to be achieved Implementation Time Line
April -Sept – 2015
Oct -2015 to March-
2016
April to Sept 2016
Oct 2016 to Mar 2017
1 E-Governance
1. Coverage with E-MAAS (from the date of hosting the software
24 Months
E-Governance Modules
under Preparatio
n
Registration of Birth, Death and Marriage
Water & Sewerage Charges
Grievance redressal
Property Tax Rolling out of
software & testing
Advertisement Tax
Issuance of Licenses
Building permissions
Mutations Commissioning
and Training
Payroll
Pension and e-procurement
2 Constitution and professionalization of municipal cadre
Establishment of Municipal cadre
24 Months
Already in Place
3 Augmenting double entry accounting
Appointment of internal auditor
24 Months
Local Fund Auditor already available
4 Urban Planning and City level Plans
Make a State Level Policy for implementing the parameters given in the National mission for Sustainable Habitat
24 Months
5 Devolution of Funds
and Functions
Implementation of SFC recommendations within timeline
24 Months
Already in Place

State Annual Action Plan (SAAP)
31
S.n Milestones Activities to be achieved Implementation Time Line
April -Sept – 2015
Oct -2015 to March-
2016
April to Sept 2016
Oct 2016 to Mar 2017
6 Review of Building Bye Laws
State to formulate a policy and action plan for having a solar roof top in all buildings having an area greater than 500 square meters and all public buildings
24 Months
Already in place
State to formulate a policy and action plan for having Rain water harvesting structures in all commercial, public buildings and new buildings on plots of 300 sq. meters and above.
24 Months
Already in Place
8 Set-up financial intermediary at state level
Establish and Operationalize Financial intermediary-pool, finance, access external funds, float municipal bonds
24 Months
Already in Place
9 Credit Rating Complete the credit ratings of the ULBs
24 Months
10 Energy and Water
audit
Give incentives for green buildings (e.g. rebate in property tax or charges connected to building permission/development charges).
2) Fill out Table 5.5 (pg. 54) given in the AMRUT Guidelines. What is the outcome of the self-
evaluation done for reporting progress on reform implementation in order to receive the
10% incentive? (tabular; 350 words)
Out of 28 milestones, to be completed by March 2016, Tamil Nadu has completed 27
Milestones, which scores about 94.05%. The process has already been initiated to complete the
remaining Milestones.
3) Have any issues been identified during the review by HPSC on Reforms implementation?
What are the issues? (250 words)
No issues have been identified by HPSC.
4) Have these issues been considered while planning for reform implementation? How?
(tabular; 250 words)
Not Applicable

State Annual Action Plan (SAAP)
32
3.4 ANNUAL CAPACITY BUILDING PLAN
The state is required to submit a Capacity Development Plan along with the SAAP for approval by the
MoUD, to empower municipal functionaries and lead to timely completion of projects. Please prepare
the individual and institutional capacity building plan by filling out Tables 7.2.1, 7.2.2, 7.2.3 and
statement in Table 7.2.4 (pgs. 70 – 72) of AMRUT Guidelines and give the following responses.
5) What is the physical and financial Progress of capacity development at state level? (350
words)
Memorandum of Understanding [MOU] has been entered into the following 11 training entities
empanelled by the Ministry of Urban Development, New Delhi for imparting capacity building
programmes for the ULB functionaries under CBUD of AMRUT Scheme.
[
1). ESCI, Hyderabad
2). IIHS, Bangalore
3). IIT, Roorkee
4). YASHADA, Pune
5). IMG, Thiruvananthapuram
6). RCEUS, Lucknow
7). AIILSG, Mumbai
8). ASCI, Hyderabad
9). Dr MCR HRD Institute, Hyderabad
10). ISPER, Panchkula
11). TNIUS, Coimbatore
Subsequently, the following are the training Programmes conducted
Training Programme on Engineering and Public Health for the Commissioners, Engineers
and Public Health Officers of ULBs through IIT – Roorkee [Capsule – I completed] covering
90 participants in 3 batches
Training Course on Finance and Revenue for the Officials of ULBs through YASHADA, Pune
[Capsule – I & II completed] covering 90 participants in 3 batches
Training Programmes for the Assistant Engineers and Public Health Officers of ULBs
through ESCI, Hyderabad [Capsule – I & II completed] covering 90 participants in 3 batches
Training Programmes for the Town Planning Officers of ULBs through IIHS, Bangalore
[Capsule – I & II completed] covering 90 participants in 3 batches
Training Programmes for the Administrative Staff of ULBs through IMG, Thiruvananthapuram
[Capsule – I] to be conducted during February 2017 covering 90 participants in 3 batches
Training Programmes for the Town Planning Officers of ULBs through ISPER, Panchkula
[Capsule – I] to be conducted during February 2017 covering 90 participants in 3 batches.
Training Programme for the Sanitary Workers of ULBs through TNIUS, Coimbatore during
February – March 2017 covering 2100 participants in 70 batches.

State Annual Action Plan (SAAP)
33
6) Do you feel that there is a need to include any other category of official, new department or
module? (400 words)
No
7) What are the issues that are been identified during the review? (350 words)
There are no issues.
8) Have the activities in your current year Capacity Building Plan – training, exposure visits
(ULB staff and elected representatives), seminars/workshops, etc. – been vetted/approved
by NIUA?
The training plan being sent to NIUA for vetting and approval
9) What is the present institutional capacity in the ULBs of the state; have the RPMC, UMC,
etc. been appointed? Are there other PMUs, PIUs, etc. which are still operational?
The erstwhile State Reforms Performance Management Cell has been converted into State
Mission Management Unit
10) What has been the progress during the previous year/s in institutional capacity building,
especially but not only in the seven areas that are mentioned in the AMRUT Guidelines?
(p. 67)
ASCI, Hyderabad has been appointed as handholding agency for preparation of Smart City
Proposal for the Smart Cities selection competition.
Assisting in implementing the reform agenda focusing on outcomes, as given in AMRUT
Reforms and identified indicators in the CCBP toolkit15.
Providing all kind of support to the Special Purpose Vehicles (SPVs) to be established under
the Smart City Mission.
Develop multi-layer GIS maps connected to data (attribute tables) in order to enable ULBs to
use GIS for decision-making – Tender Process Initiated
11) Attach the Quarterly Score Cards on p. 73 of the Mission Guidelines.
Nil
12) Have those issues been addressed? How? (500 words)
There are no issues.
3.5 A&OE
The 10% allocation for A&OE has been divided into two parts, 8% State fund and 2% GoI fund.
Please fill out the Plan of Action Table given in the AMRUT Guidelines (Table 4; pgs.48, 49) and
answer the following questions.

State Annual Action Plan (SAAP)
34
(Rs. in Cr.)
S.N Items
proposed for A&OE
Total Allocation
Committed Expenditure
from previous year (if any)
Proposed spending for
Current Financial
year
Balance to Carry Forward
FY 2018 FY 2019 FY 2020
1 Preparation of SLIP and SAAP
34.25 0 6.85 6.85 6.85 6.85
2 PDMC 23.76 0 4.75 4.75 4.75 4.75
3
Procuring Third Party Independent Review and Monitoring Agency
5.00 0 1.00 1.00 1.00 1.00
4
Publications (e-Newsletter, guidelines, brochures etc.)
15.00 0 3.00 3.00 3.00 3.00
5
Capacity Building and
15.91 0 3.58 3.58 3.58 5.17 Training - CCBP, if Applicable - Others
6 Reform implementation
37.80 0 7.56 7.56 7.56 7.56
7 DPR Preparation
78.65 15.73 15.73 15.73 15.73 15.73
Total 210.37 15.73 41.97 41.97 41.97 44.06
13) What is the committed expenditure from previous year? (200 words)
Nil
14) What are the issues that are been identified during the review? (350 words)
There are no issues
15) Have the A&OE fund used only for admissible components? (200 words)
Yes
16) How the ULB/State wants to carry out the implementation of the projects, (establishment of
IRMA/PDMC/SMMU/CMMU)? (350 words)
The IRMA/PDMC/CMMU will be established through Tender.
3.6 FINANCING OF PROJECTS
Financing is an important element of the SAAP. Each state has been given the maximum share that
will be given by the Central Government. (Para 5 of AMRUT Guidelines). The State has planned for
the remaining resource generation at the time of preparation of the SAAP. The financial share of cities
State Annual Action Plan (SAAP)
35
will vary across ULBs. Information responding to the following questions regarding financing of the
projects proposed under AMRUT, in words has been indicated below:
1) What is the State contribution to the SAAP? (should be greater than 20 percent, Para 7.4
of AMRUT Guidelines) (150 words)
As per the Mission Guidelines, the State contribution to the SAAP will not be less than 20 percent of
the total project cost. The Tamil Nadu Government has already contributed 20 percent of share in the
first installment release.
2) Fill out Table 3.4 at pg.45 of AMRUT Guideline. How the residual financing (over and above
Central Government share) is shared between the States, ULBs? (tabular; 200 words)
Residual financing shall be meet out through debt funding viz., KFW, TNSUDP, and from14th
Finance Commission, MP, MLA Funds, own income etc.
3) Fill out Table 3.3 at pg 44 of AMRUT Guidelines. Has any other sources identified by the
State/ULB (e.g. PPP, market borrowing)? Please discuss. (tabular; 250 words)
The State fund requirements will be meet out through debt funding viz., KFW, TNSUDP, and
from14th Finance Commission, MP, MLA Funds, own income etc.
4) Whether complete project cost is linked with revenue sources in SAAP? Please describe?
(250 words)
Yes. The SAAP has been prepared accordingly.
5) Has projects been dovetailed with other sectoral and financial programme of the Centre
and State Governments? (250 words)
Yes. The projects are converged with various GoI/GoTN programmes like Smart Cities
programme, Integrated Urban Development Mission and through external financial assistance
viz., World Bank , KFW JICA etc.
6) Has States/UTs explored the possibility of using Public Private Partnerships (PPP), as a
preferred execution model? Please discuss. (300 words)
Yes. Public Private Partnership model has been considered for the prioritized projects for
operation and maintenance. Based on the approval of prioritized projects under AMRUT, the
detailed feasibility study will be undertaken.
7) Are PPP options included appropriate Service Level Agreements (SLAs) which may lead to
the People Public Private Partnership (PPPP) model? How? (300 words)
PPP options with added dimension of involvement of People are at pilot stage. Performance
monitoring by people and outcome basis of work is at serious consideration. An attempt will be made
for making appropriate Service Level Agreement in future projects..

State Annual Action Plan (SAAP)
Chapter 4: TABLES:
Name of State: Tamil Nadu
FY-2017-20 – Amount in Cr.
Total Central Funds allocated to State
Allocation of Central funds for A&OE (@8% of Total given in coloumn 1)
Allocation of Funds for AMRUT
(Central Share)
Project proposal Submitted
State/ULB
share
Total AMRUT annual size (cols.2+4+5)
1 2 3 4 5 6
1801.370 144.11 1801.37 1802.74 2308.32 4255.17
Table 1.1Breakup of total MoUD allocation for AMRUT

State Annual Action Plan (SAAP)
Table 1.2.2: Abstract-Break-up of Total Fund Sharing Pattern
(Amount in Rs.) FY2017-20 (Amount in Crores) – Year 2017-20
S.No Sector No.of Project GoI State ULB Convergence Total
1 Water supply 3 275.27 146.74 311.69 0.00 733.70
2 Sewerage and Septage management
13 1482.44 657.46 1147.40 0.00 3287.29
3 Storm Water Drainage 0 0.00 0.00 0.00 0.00 0.00
4 Non-Motorized transport 0 0.00 0.00 0.00 0.00 0.00
5 Green Space 28 45.03 18.01 27.02 0.00 90.07
Grand Total 44 1802.74 822.21 1486.11 0.00 4111.06
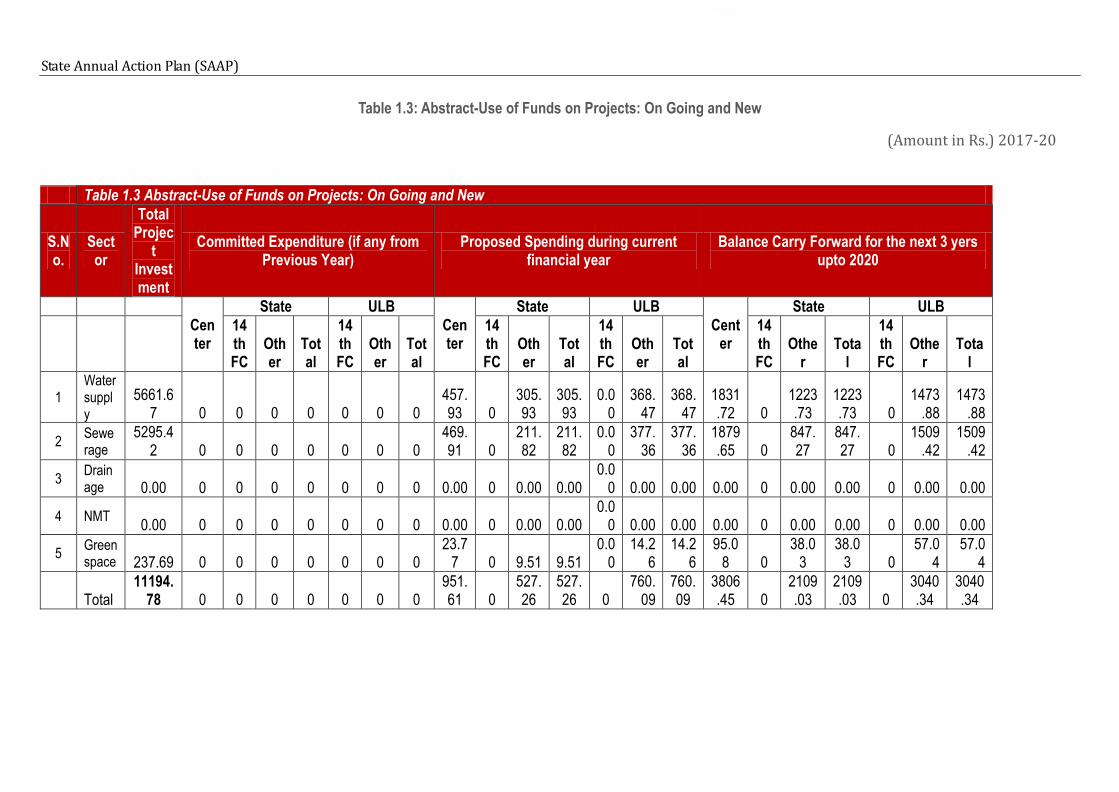
State Annual Action Plan (SAAP)
Table 1.3: Abstract-Use of Funds on Projects: On Going and New
(Amount in Rs.) 2017-20
Table 1.3 Abstract-Use of Funds on Projects: On Going and New
S.No.
Sector
Total Projec
t Investment
Committed Expenditure (if any from Previous Year)
Proposed Spending during current financial year
Balance Carry Forward for the next 3 yers upto 2020
Center
State ULB Center
State ULB Cent
er
State ULB
14th FC
Other
Total
14th FC
Other
Total
14th FC
Other
Total
14th FC
Other
Total
14th FC
Other
Total
14th FC
Other
Total
1 Water supply
5661.67 0 0 0 0 0 0 0
457.93 0
305.93
305.93
0.00
368.47
368.47
1831.72 0
1223.73
1223.73 0
1473.88
1473.88
2 Sewerage
5295.42 0 0 0 0 0 0 0
469.91 0
211.82
211.82
0.00
377.36
377.36
1879.65 0
847.27
847.27 0
1509.42
1509.42
3 Drainage 0.00 0 0 0 0 0 0 0 0.00 0 0.00 0.00
0.00 0.00 0.00 0.00 0 0.00 0.00 0 0.00 0.00
4 NMT 0.00 0 0 0 0 0 0 0 0.00 0 0.00 0.00
0.00 0.00 0.00 0.00 0 0.00 0.00 0 0.00 0.00
5 Green space 237.69 0 0 0 0 0 0 0
23.77 0 9.51 9.51
0.00
14.26
14.26
95.08 0
38.03
38.03 0
57.04
57.04
Total 11194.
78 0 0 0 0 0 0 0 951.61 0
527.26
527.26 0
760.09
760.09
3806.45 0
2109.03
2109.03 0
3040.34
3040.34
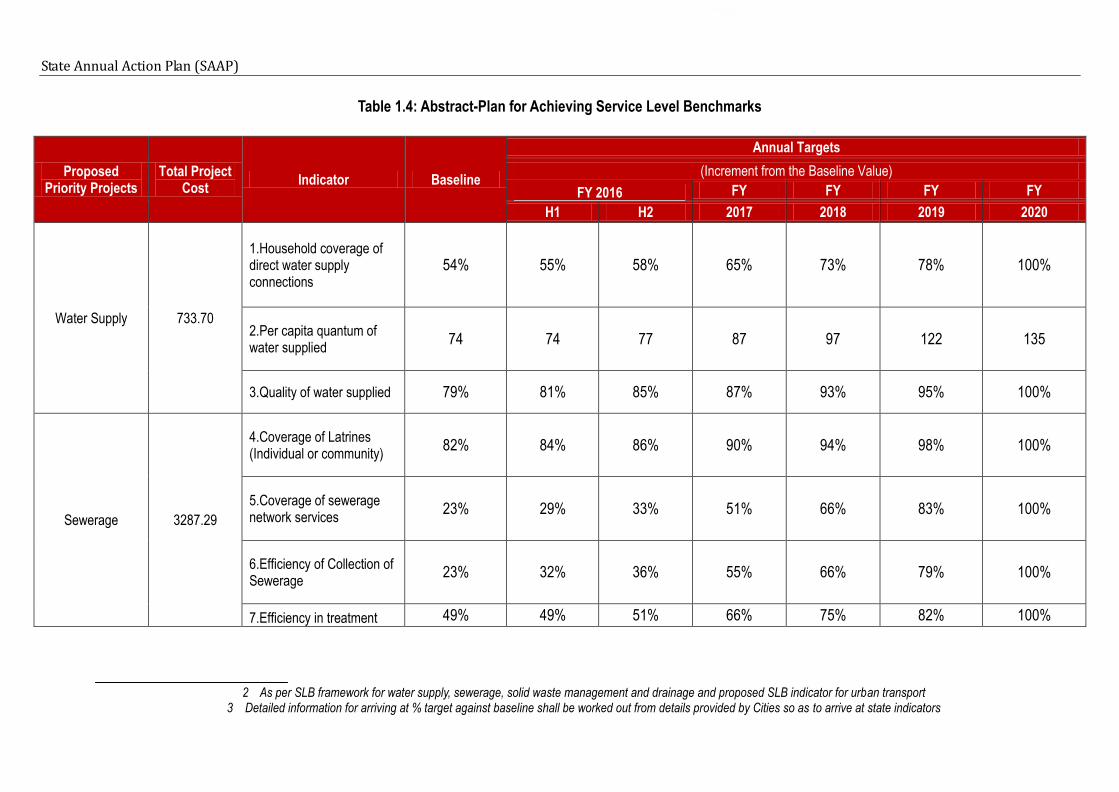
State Annual Action Plan (SAAP)
Table 1.4: Abstract-Plan for Achieving Service Level Benchmarks
Proposed Priority Projects
Total Project Cost
Indicator Baseline
Annual Targets
(Increment from the Baseline Value)
FY 2016 FY FY FY FY
H1 H2 2017 2018 2019 2020
Water Supply 733.70
1.Household coverage of direct water supply connections
54% 55% 58% 65% 73% 78% 100%
2.Per capita quantum of water supplied
74 74 77 87 97 122 135
3.Quality of water supplied 79% 81% 85% 87% 93% 95% 100%
Sewerage 3287.29
4.Coverage of Latrines (Individual or community)
82% 84% 86% 90% 94% 98% 100%
5.Coverage of sewerage network services
23% 29% 33% 51% 66% 83% 100%
6.Efficiency of Collection of Sewerage
23% 32% 36% 55% 66% 79% 100%
7.Efficiency in treatment 49% 49% 51% 66% 75% 82% 100%
2 As per SLB framework for water supply, sewerage, solid waste management and drainage and proposed SLB indicator for urban transport 3 Detailed information for arriving at % target against baseline shall be worked out from details provided by Cities so as to arrive at state indicators

State Annual Action Plan (SAAP)
Table 3.2: SAAP - Sector Wise Breakup of Consolidated Investments for all ULBs in the Name of State: Tamil Nadu
FY 2017-20 (Amount in Rs.Cr)
Rs.in Cr
S.n Name of the City Water supply Sewerage Drainage NMT Green space Grand Total
1 Ambur 0.00 275.00 0.00 0.00 2.73 277.73
2 Avadi 0.00 0.00 0.00 0.00 2.73 2.73
3 Chennai 88.70 317.29 0.00 0.00 13.65 419.64
4 Coimbatore 0.00 331.00 0.00 0.00 5.46 336.46
5 Cuddalore 0.00 0.00 0.00 0.00 2.73 2.73
6 Dindigul 0.00 0.00 0.00 0.00 2.73 2.73
7 Erode 0.00 0.00 0.00 0.00 2.73 2.73
8 Hosur 0.00 0.00 0.00 0.00 2.73 2.73
9 Kancheepuram 0.00 50.00 0.00 0.00 2.73 52.73
10 Karaikudi 0.00 0.00 0.00 0.00 2.73 2.73
11 Kumbakonam 0.00 0.00 0.00 0.00 2.73 2.73
12 Madurai 450.00 300.00 0.00 0.00 2.73 752.73
13 Nagapattinam 0.00 0.00 0.00 0.00 2.73 2.73
14 Nagercoil 0.00 310.00 0.00 0.00 2.73 312.73
15 Pallavaram 0.00 22.00 0.00 0.00 2.73 24.73
16 Pudukottai 195.00 0.00 0.00 0.00 2.73 197.73
17 Rajapalayam 0.00 194.00 0.00 0.00 2.73 196.73
18 Salem 0.00 0.00 0.00 0.00 2.73 2.73
19 Tambaram 0.00 35.00 0.00 0.00 2.73 37.73
20 Thanjavur 0.00 0.00 0.00 0.00 2.73 2.73
21 Thiruvannamalai 0.00 260.00 0.00 0.00 2.73 262.73
22 Thoothukkudi 0.00 0.00 0.00 0.00 2.73 2.73
23 Tiruchirappalli 0.00 453.00 0.00 0.00 2.73 455.73
24 Tirunelveli 0.00 0.00 0.00 0.00 2.73 2.73
25 Tiruppur 0.00 415.00 0.00 0.00 2.73 417.73
26 Velankanni 0.00 0.00 0.00 0.00 2.73 2.73
27 Vellore 0.00 325.00 0.00 0.00 2.73 327.73
28 Rameswaram 0.00 0.00 0.00 0.00 2.73 2.73
Total Project Investments 733.70 3287.29 0.00 0.00 90.07 4111.06
A &OE 144.11
Grand Total 4255.17

State Annual Action Plan (SAAP)
Table 3.4: SAAP - Year Wise Share of Investments for All Sectors (ULB Wise)
Name of State: Tamil Nadu
FY 2017-20
(Amount in Rs.)
S.No
Name of the Cities
Total Project Investment
Committed Expenditure (if any from Previous Year)
Proposed Spending during current financial year
Balance Carry Forward for the next Year
Center
State ULB Center
State ULB Cent
er
State ULB
14th FC
Other
Total
14th FC
Other
Total
14th FC
Other
Total
14th FC
Other
Total
14th FC
Other
Total
14th FC
Other
Total
1 Ambur 387.77
0 0.00 0.00
0.00 0.00
0.00
0.00
38.78 0.00
15.51
15.51 0.00
23.27
23.27
155.11 0.00
62.04
62.04 0.00
93.06
93.06
2 Avadi 7.51
0 0.00 0.00
0.00 0.00
0.00
0.00 0.75 0.00
0.30
0.30 0.00
0.45
0.45 3.00 0.00 1.20 1.20 0.00 1.80 1.80
3 Chennai 2391.35
0 0.00 0.00
0.00 0.00
0.00
0.00
159.15 0.00
164.83
164.83 0.00
154.29
154.29
636.60 0.00
659.31
659.31 0.00
617.17
617.17
4 Coimbatore
1120.84 0 0.00
0.00
0.00 0.00
0.00
0.00
74.61 0.00
50.86
50.86 0.00
98.70
98.70
298.43 0.00
203.44
203.44 0.00
394.80
394.80
5 Cuddalore 7.51
0 0.00 0.00
0.00 0.00
0.00
0.00 0.75 0.00
0.30
0.30 0.00
0.45
0.45 3.00 0.00 1.20 1.20 0.00 1.80 1.80
6 Dindigul 7.51
0 0.00 0.00
0.00 0.00
0.00
0.00 0.75 0.00
0.30
0.30 0.00
0.45
0.45 3.00 0.00 1.20 1.20 0.00 1.80 1.80
7 Erode 249.51
0 0.00 0.00
0.00 0.00
0.00
0.00
24.95 0.00
9.98
9.98 0.00
14.97
14.97
99.80 0.00
39.92
39.92 0.00
59.88
59.88
8 Hosur 151.51
0 0.00 0.00
0.00 0.00
0.00
0.00
15.15 0.00
6.06
6.06 0.00
9.09
9.09
60.60 0.00
24.24
24.24 0.00
36.36
36.36
9 Kancheepura
57.51 0 0.00
0.00
0.00 0.00
0.00
0.00 5.75 0.00
2.30
2.30 0.00
3.45
3.45
23.00 0.00 9.20 9.20 0.00
13.80
13.80
10 Karaikudi 7.51
0 0.00 0.00
0.00 0.00
0.00
0.00 0.75 0.00
0.30
0.30 0.00
0.45
0.45 3.00 0.00 1.20 1.20 0.00 1.80 1.80
11 Kumbakonam
72.82 0 0.00
0.00
0.00 0.00
0.00
0.00 7.28 0.00
2.91
2.91 0.00
4.37
4.37
29.13 0.00
11.65
11.65 0.00
17.48
17.48
12 Madurai 1514.81 0 0.00 0.0 0.0 0.00 0.0 0.0 100. 0.00 64. 64. 0.00 137 137 401. 0.00 259. 259. 0.00 550. 550.

State Annual Action Plan (SAAP)
0 0 0 0 36 86 86 .75 .75 42 44 44 99 99
13 Nagapattinam
7.51 0 0.00
0.00
0.00 0.00
0.00
0.00 0.75 0.00
0.30
0.30 0.00
0.45
0.45 3.00 0.00 1.20 1.20 0.00 1.80 1.80
14 Nagercoil 557.51
0 0.00 0.00
0.00 0.00
0.00
0.00
55.75 0.00
22.30
22.30 0.00
33.45
33.45
223.00 0.00
89.20
89.20 0.00
133.80
133.80
15 Pallavaram
303.51 0 0.00
0.00
0.00 0.00
0.00
0.00
30.35 0.00
12.14
12.14 0.00
18.21
18.21
121.40 0.00
48.56
48.56 0.00
72.84
72.84
16 Pudukottai
202.51 0 0.00
0.00
0.00 0.00
0.00
0.00
20.25 0.00
8.10
8.10 0.00
12.15
12.15
81.00 0.00
32.40
32.40 0.00
48.60
48.60
17 Rajapalayam
443.87 0 0.00
0.00
0.00 0.00
0.00
0.00
44.39 0.00
17.75
17.75 0.00
26.63
26.63
177.55 0.00
71.02
71.02 0.00
106.53
106.53
18 Salem 7.51
0 0.00 0.00
0.00 0.00
0.00
0.00 0.75 0.00
0.30
0.30 0.00
0.45
0.45 3.00 0.00 1.20 1.20 0.00 1.80 1.80
19 Tambaram
362.51 0 0.00
0.00
0.00 0.00
0.00
0.00
36.25 0.00
14.50
14.50 0.00
21.75
21.75
145.00 0.00
58.00
58.00 0.00
87.00
87.00
20 Thanjavur 182.51
0 0.00 0.00
0.00 0.00
0.00
0.00
18.25 0.00
7.30
7.30 0.00
10.95
10.95
73.00 0.00
29.20
29.20 0.00
43.80
43.80
21 Thiruvannamalai
267.51 0 0.00
0.00
0.00 0.00
0.00
0.00
26.75 0.00
10.70
10.70 0.00
16.05
16.05
107.00 0.00
42.80
42.80 0.00
64.20
64.20
22 Thoothukkudi
7.51 0 0.00
0.00
0.00 0.00
0.00
0.00 0.75 0.00
0.30
0.30 0.00
0.45
0.45 3.00 0.00 1.20 1.20 0.00 1.80 1.80
23 Tiruchirappalli
899.72 0 0.00
0.00
0.00 0.00
0.00
0.00
89.97 0.00
35.99
35.99 0.00
53.98
53.98
359.89 0.00
143.95
143.95 0.00
215.93
215.93
24 Tirunelveli 304.51
0 0.00 0.00
0.00 0.00
0.00
0.00
30.45 0.00
12.18
12.18 0.00
18.27
18.27
121.80 0.00
48.72
48.72 0.00
73.08
73.08
25 Tiruppur 652.51
0 0.00 0.00
0.00 0.00
0.00
0.00
65.25 0.00
26.10
26.10 0.00
39.15
39.15
261.00 0.00
104.40
104.40 0.00
156.60
156.60
26 Velankanni
38.58 0 0.00
0.00
0.00 0.00
0.00
0.00 3.86 0.00
1.54
1.54 0.00
2.31
2.31
15.43 0.00 6.17 6.17 0.00 9.26 9.26
27 Vellore 930.51
0 0.00 0.00
0.00 0.00
0.00
0.00
93.05 0.00
37.22
37.22 0.00
55.83
55.83
372.20 0.00
148.88
148.88 0.00
223.32
223.32
28 Rameswaram
50.39 0 0.00
0.00
0.00 0.00
0.00
0.00 5.04 0.00
2.02
2.02 0.00
3.02
3.02
20.15 0.00 8.06 8.06 0.00
12.09
12.09
11194.78 0.00 0.00
0.00
0.00
0.00 0.00
0.00
950.89
0.00 527.26
527.26
0.00 760.81
760.81
3803.57
0.00 2109.03
2109.03
0.00 3043.22
3043.22

State Annual Action Plan (SAAP)

State Annual Action Plan (SAAP)
Table 7.4: Quarterly Score Cards for States
Financial and physical progress on capacity building (State level)
Total number of ULBs:28
Quarter ending -March 2016
Number of ULBs above/below
proportionate target ( from table 7.3 of
AMRUT guideline)
Name of the department/pos
ition
Physical Financial Total number
trained, if relevant, upto quarter
Total funds utilized upto
quarter
Total target in FY Proportionate target upto
quarter
Funds allocated in current FY
Proportionate target upto
quarter
above
Individual training
1300 325 15.20 Cr 3.8 1537
Institutional capacity building
Below RPMC and UMC 0.14
Other- specify
Other-specify

State Annual Action Plan (SAAP)
Table 3.1: SAAP – Master Plan of all projects details to achieve universal coverage during the current Mission period based on Table 2.1 (FYs 2015-16 and 2019-20) (Amount in Rs.)
Name of State: Tamil Nadu Current Mission period 2015-20
S.No Name of the ULB (water Supply ) Total Number of
Projects to Achieve universal Coverage
Estimated Cost in Crores
Number of Years to Achieve Universal
Coverage
1 chennai - Distribution System Improvement 1 88.70 4
2 Pudukottai - Dedicated water supply 1 195.00 4
3 Madurai - Distribution System for newly added areas 1 450.00 4
chennai - Distribution System Improvement 1 88.70 4
S.No Name of the ULB ( Sewerage) Total Number of
Projects to Achieve universal Coverage
Estimated Cost in Crores
Number of Years to Achieve Universal
Coverage
1 Chennai 1 317.29 4
2 Madurai - UGSS South part 1 300.00 4
3 Nagercoil 1 310.00 4
4 Rajapalayam 1 194.00 4
5 Thiruvannamalai 1 260.00 4
6 Tirchy 1 453.00 4
7 Ambur - UGSS 1 275.00 4
8 Vellore UGSS - Phase -III 1 325.00 4
9 Tiruppur -UGSS - Phase II 1 415.00 4
10 Coimbatore UGSS - Phase IV 1 331.00 4
11 Tambaram 1 35.00 4
12 Pallavaram 1 22.00 4
13 Kancheepuram 1 50.00 4
Total 10 3287.29

State Annual Action Plan (SAAP)
Table 3.5: SAAP- – State level Plan for Achieving Service Level Benchmarks
Name of State – Tamil Nadu Mission Period- 2017-20
Proposed Priority Projects
Total Project
Cost Indicator Baseline
Annual Targets
(Increment from the Baseline Value)
FY 2016 FY FY FY FY
H1 H2 2017 2018 2019 2020
Water Supply
733.70
1.Household coverage of direct water supply connections
54% 54% 58% 65% 73% 78% 100%
2.Per capita quantum of water supplied
74 74 77 87 97 122 135
3.Quality of water supplied
79% 81% 85% 87% 93% 95% 100%
Sewerage 3329.85
4.Coverage of Latrines (Individual or community)
82% 84% 86% 90% 94% 98% 100%
5.Coverage of sewerage network services
23% 29% 33% 51% 66% 83% 100%
6.Efficiency of Collection of Sewerage
23% 32% 36% 55% 66% 79% 100%
7.Efficiency in treatment 49% 49% 51% 66% 75% 82% 100%
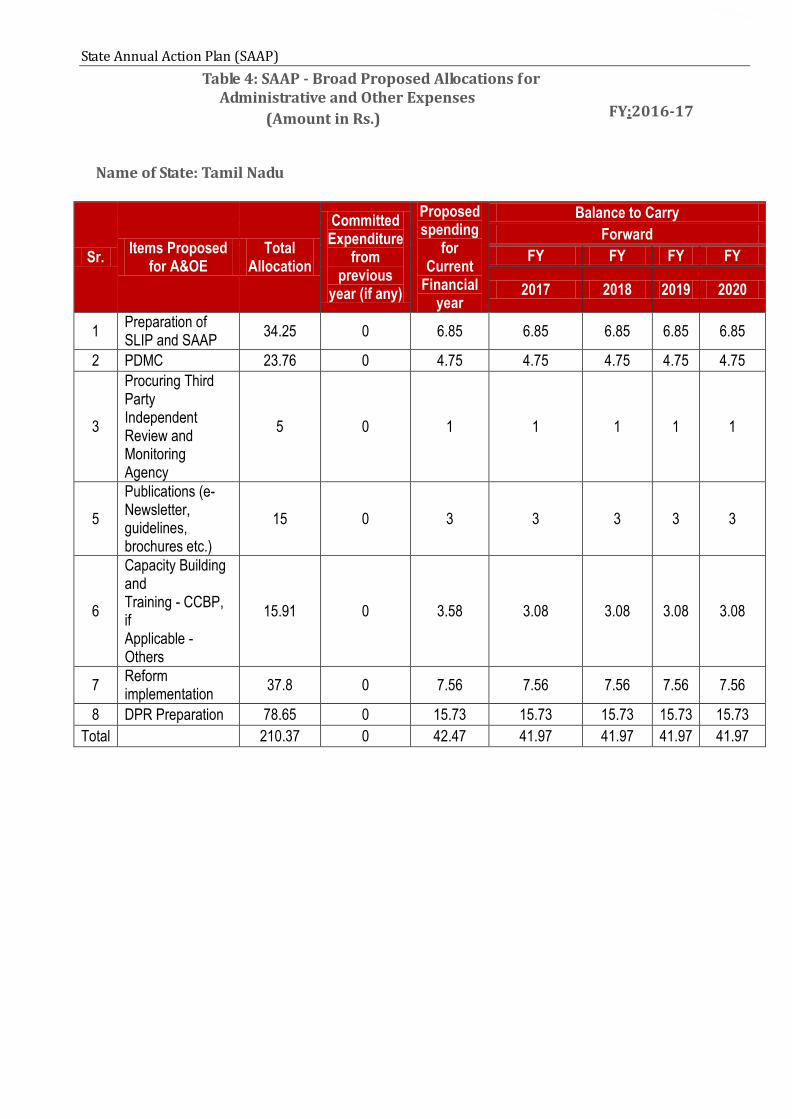
State Annual Action Plan (SAAP)
Table 4: SAAP - Broad Proposed Allocations for Administrative and Other Expenses
(Amount in Rs.)
Name of State: Tamil Nadu
FY:2016-17
Sr. Items Proposed
for A&OE Total
Allocation
Committed Expenditure
from previous
year (if any)
Proposed spending
for Current
Financial year
Balance to Carry
Forward
FY FY FY FY
2017 2018 2019 2020
1 Preparation of SLIP and SAAP
34.25 0 6.85 6.85 6.85 6.85 6.85
2 PDMC 23.76 0 4.75 4.75 4.75 4.75 4.75
3
Procuring Third Party Independent Review and Monitoring Agency
5 0 1 1 1 1 1
5
Publications (e-Newsletter, guidelines, brochures etc.)
15 0 3 3 3 3 3
6
Capacity Building and Training - CCBP, if Applicable - Others
15.91 0 3.58 3.08 3.08 3.08 3.08
7 Reform implementation
37.8 0 7.56 7.56 7.56 7.56 7.56
8 DPR Preparation 78.65 0 15.73 15.73 15.73 15.73 15.73
Total 210.37 0 42.47 41.97 41.97 41.97 41.97

State Annual Action Plan (SAAP)
Table5.2:SAAP-Reforms Type, Steps and Target for AMRUT Cities FY-2017-20
S.n Milestones Activities to be achieved Implementation Time Line
April -Sept – 2015
Oct -2015 to March-2016
April to Sept 2016
Oct 2016 to Mar 2017
1 E-Governance
1. Coverage with E-MAAS (from the date of hosting the software
24 Months
E-Governance Modules under
Preparation
Registration of Birth, Death and Marriage
Water & Sewerage Charges
Grievance redressal
Property Tax Rolling out of software &
testing
Advertisement Tax
Issuance of Licenses
Building permissions
Mutations Commissioning
and Training
Payroll
Pension and e-procurement
2 Constitution and professionalization of municipal cadre
Establishment of Municipal cadre 24
Months Already in
Place
3 Augmenting double entry accounting
Appointment of internal auditor 24
Months
Local Fund Auditor already available
4 Urban Planning and City level Plans
Make a State Level Policy for implementing the parameters given in the National mission for Sustainable Habitat
24 Months
5 Devolution of Funds and Functions
Implementation of SFC recommendations within timeline 24
Months Already in Place
6 Review of Building Bye Laws State to formulate a policy and action plan for having a solar roof top in all buildings having an area greater than 500 square meters and all public buildings
24 Months
Already in place
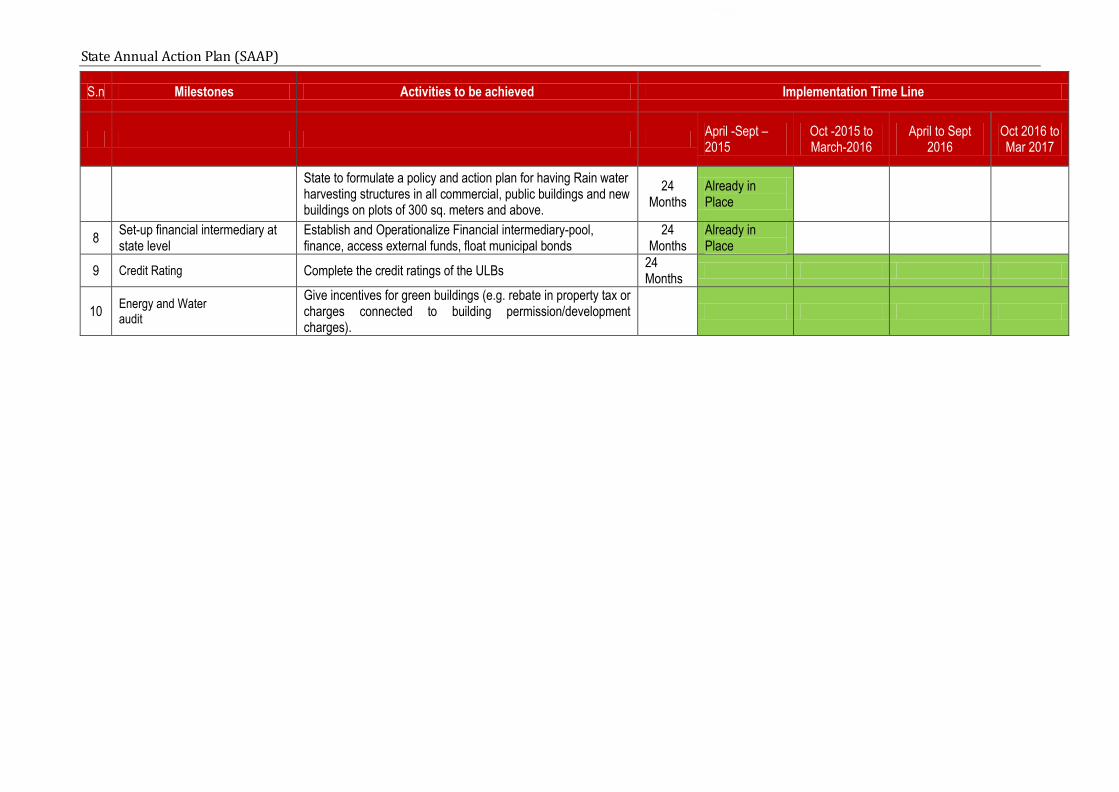
State Annual Action Plan (SAAP)
S.n Milestones Activities to be achieved Implementation Time Line
April -Sept – 2015
Oct -2015 to March-2016
April to Sept 2016
Oct 2016 to Mar 2017
State to formulate a policy and action plan for having Rain water harvesting structures in all commercial, public buildings and new buildings on plots of 300 sq. meters and above.
24 Months
Already in Place
8 Set-up financial intermediary at state level
Establish and Operationalize Financial intermediary-pool, finance, access external funds, float municipal bonds
24 Months
Already in Place
9 Credit Rating Complete the credit ratings of the ULBs 24 Months
10 Energy and Water audit
Give incentives for green buildings (e.g. rebate in property tax or charges connected to building permission/development charges).
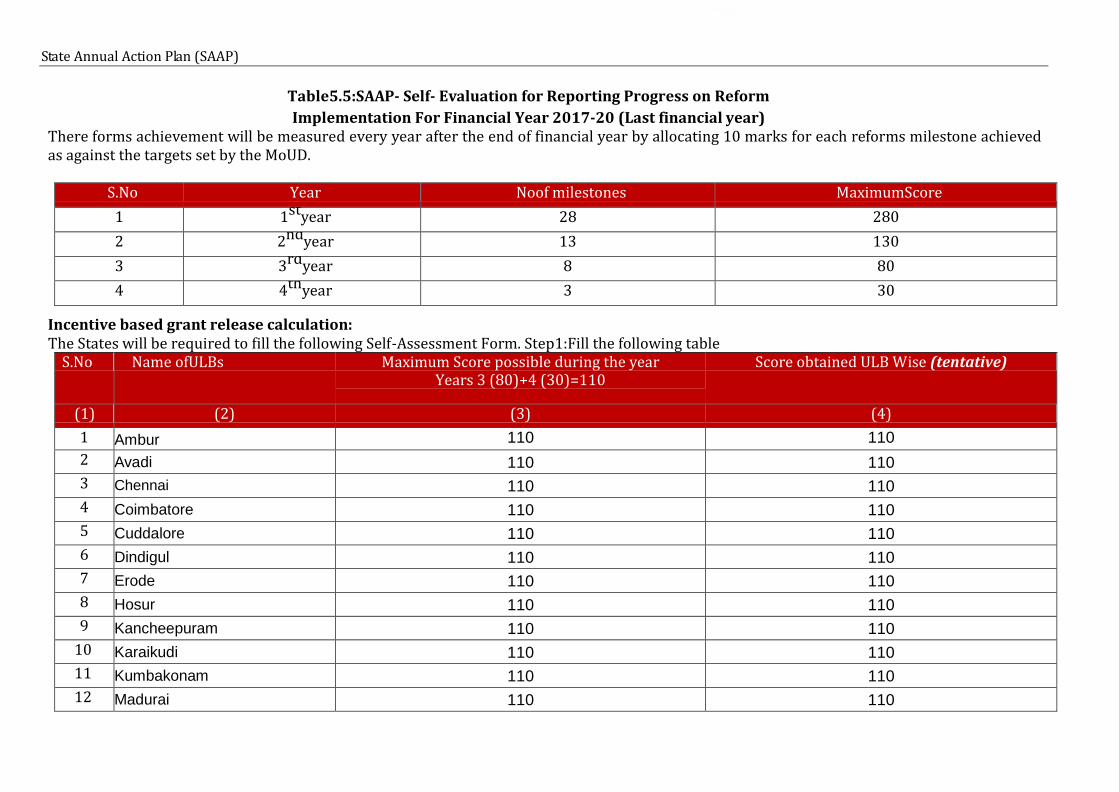
State Annual Action Plan (SAAP)
Table5.5:SAAP- Self- Evaluation for Reporting Progress on Reform
Implementation For Financial Year 2017-20 (Last financial year) There forms achievement will be measured every year after the end of financial year by allocating 10 marks for each reforms milestone achieved as against the targets set by the MoUD.
S.No Year Noof milestones MaximumScore
1 1styear 28 280
2 2ndyear 13 130
3 3rdyear 8 80
4 4thyear 3 30 Incentive based grant release calculation: The States will be required to fill the following Self-Assessment Form. Step1:Fill the following table
S.No Name ofULBs Maximum Score possible during the year Years 3 (80)+4 (30)=110
Score obtained ULB Wise (tentative)
(1) (2) (3) (4)
1 Ambur 110 110
2 Avadi 110 110
3 Chennai 110 110
4 Coimbatore 110 110
5 Cuddalore 110 110
6 Dindigul 110 110
7 Erode 110 110
8 Hosur 110 110
9 Kancheepuram 110 110
10 Karaikudi 110 110
11 Kumbakonam 110 110
12 Madurai 110 110

State Annual Action Plan (SAAP)
S.No Name ofULBs Maximum Score possible during the year Years 3 (80)+4 (30)=110
Score obtained ULB Wise (tentative)
(1) (2) (3) (4)
13 Nagapattinam 110 110
14 Nagercoil 110 110
15 Pallavaram 110 110
16 Pudukottai 110 110
17 Rajapalayam 110 110
18 Salem 110 110
19 Tambaram 110 110
20 Thanjavur 110 110
21 Thiruvannamalai 110 110
22 Thoothukkudi 110 110
23 Tiruchirappalli 110 110
24 Tirunelveli 110 110
25 Tiruppur 110 110
26 Velankanni 110 110
27 Vellore 110 110
28 Rameswaram 110 110
Subtotal ULB 110 110
1 Average of State 110 110
Sub total State 110 110
Overall 110 110
Step 2: Calculate the overall score in percentage obtained by the state (State score plus ULB score).
Step 3: Only those States achieving 70 percent and above overall reform score will be considered for incentive.
Step 4: If the overall score is greater than 70 percent, the incentive amount will be distributed among the states depending upon
the number of ULBs that have achieved a score of more than 70 percent in the state.
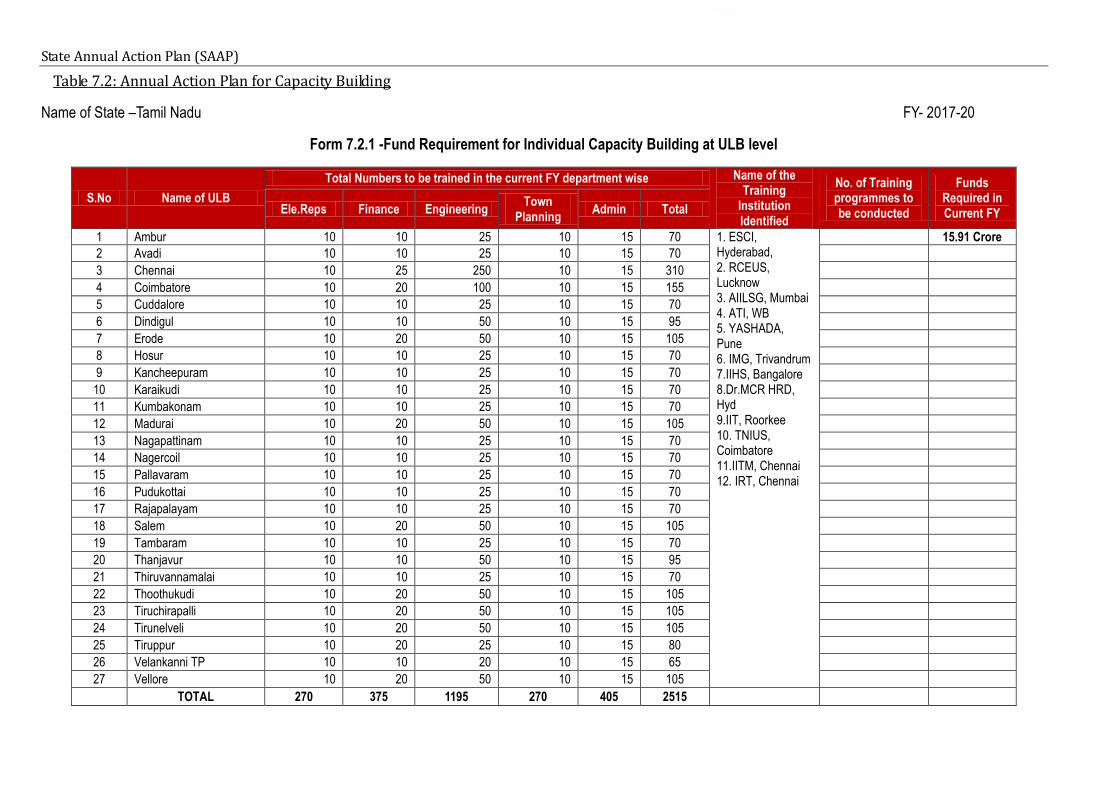
State Annual Action Plan (SAAP)
Table 7.2: Annual Action Plan for Capacity Building
Name of State –Tamil Nadu FY- 2017-20
Form 7.2.1 -Fund Requirement for Individual Capacity Building at ULB level
S.No Name of ULB
Total Numbers to be trained in the current FY department wise Name of the Training
Institution Identified
No. of Training programmes to be conducted
Funds Required in Current FY Ele.Reps Finance Engineering
Town Planning
Admin Total
1 Ambur 10 10 25 10 15 70 1. ESCI, Hyderabad, 2. RCEUS, Lucknow 3. AIILSG, Mumbai 4. ATI, WB 5. YASHADA, Pune 6. IMG, Trivandrum 7.IIHS, Bangalore 8.Dr.MCR HRD, Hyd 9.IIT, Roorkee 10. TNIUS, Coimbatore 11.IITM, Chennai 12. IRT, Chennai
15.91 Crore
2 Avadi 10 10 25 10 15 70
3 Chennai 10 25 250 10 15 310
4 Coimbatore 10 20 100 10 15 155
5 Cuddalore 10 10 25 10 15 70
6 Dindigul 10 10 50 10 15 95
7 Erode 10 20 50 10 15 105
8 Hosur 10 10 25 10 15 70
9 Kancheepuram 10 10 25 10 15 70
10 Karaikudi 10 10 25 10 15 70
11 Kumbakonam 10 10 25 10 15 70
12 Madurai 10 20 50 10 15 105
13 Nagapattinam 10 10 25 10 15 70
14 Nagercoil 10 10 25 10 15 70
15 Pallavaram 10 10 25 10 15 70
16 Pudukottai 10 10 25 10 15 70
17 Rajapalayam 10 10 25 10 15 70
18 Salem 10 20 50 10 15 105
19 Tambaram 10 10 25 10 15 70
20 Thanjavur 10 10 50 10 15 95
21 Thiruvannamalai 10 10 25 10 15 70
22 Thoothukudi 10 20 50 10 15 105
23 Tiruchirapalli 10 20 50 10 15 105
24 Tirunelveli 10 20 50 10 15 105
25 Tiruppur 10 20 25 10 15 80
26 Velankanni TP 10 10 20 10 15 65
27 Vellore 10 20 50 10 15 105
TOTAL 270 375 1195 270 405 2515
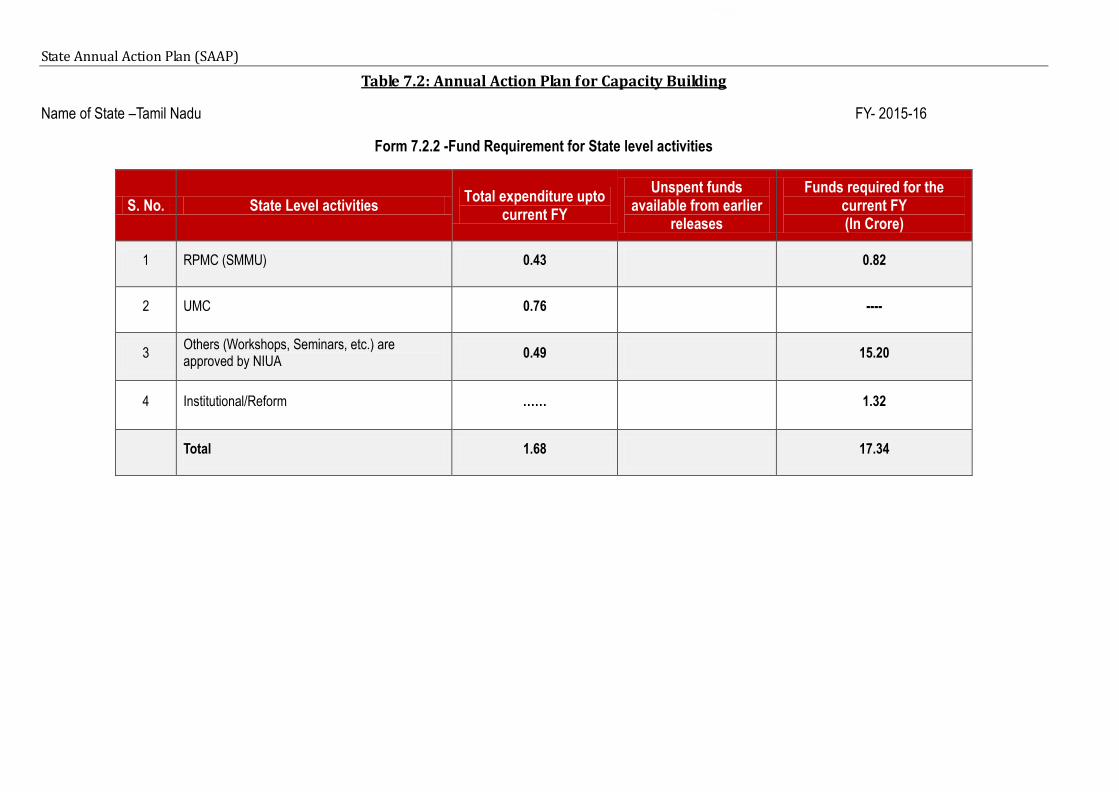
State Annual Action Plan (SAAP)
Table 7.2: Annual Action Plan for Capacity Building
Name of State –Tamil Nadu FY- 2015-16
Form 7.2.2 -Fund Requirement for State level activities
S. No. State Level activities Total expenditure upto
current FY
Unspent funds available from earlier
releases
Funds required for the current FY (In Crore)
1 RPMC (SMMU) 0.43 0.82
2 UMC 0.76 ----
3 Others (Workshops, Seminars, etc.) are approved by NIUA
0.49 15.20
4 Institutional/Reform …… 1.32
Total 1.68 17.34

State Annual Action Plan (SAAP)
Table 7.2.3: Annual Action Plan for Capacity Building
Name of State – Tamil Nadu FY- 2015-16
Form 7.2.3 -Total Fund Requirement for Capacity Building
Sl.
No. Fund requirement
Individual (Training &
Workshop) Institutional/ Reform SMMU/RPMC/CMMU Others Total (In Crore)
1 Total release since start of
Mission (2015) - - - - -
2 Total utilisation-Central
Share - - - - -
3 Balance available-Central
Share - - - - -
4 Amount required-Central
Share 15.20 5.25 - - -
5
Total fund required for
capacity building in current
FY 2015-16
15.20 5.25 2.14 22.59

State Annual Action Plan (SAAP)
Form 7.2.4 Details of Institutional Capacity Building
a. Is the State willing to revise their town planning laws and rules to include land pooling?
Already in place.
b. List of ULBs willing to have a credit rating done as the first step to issue bonds?
The consultants are appointed to undertake the credit rating study for all the AMRUT Cities. Based on
the credit rating, the ULBs will decide to issue bonds.
c. Is the State willing to integrate all work done in GIS in order to make GIS useful for decision
making in ULBs?
GIS Master Plan for AMRUT Cities are under preparation
d. Is the State willing to take assistance for using land as a fiscal tool in ULBs?
Yes.
e. Does the State require assistance to professionalize the municipal cadre?
No
f. Does the State require assistance to reduce non-revenue water in ULBs?
Yes. Tamil Nadu has Chennai Metro Water Supply and Sewerage Board and Tamil Nadu Water
Supply and Drainage Board for implementing the water supply projects. The ULBs are maintaining the
water supply system created by the above mentioned Boards. The State Government have initiated
various actions to reduce the NRW. However State is also eager to learn better technology and
options to reduce NRW and losses.
g. Does the State require assistance to improve property tax assessment and collections in
ULBs?
Yes with the help of GIS, the property tax assessment will be improved. The E-Governance initiatives
will enhance collection in the ULBs.
h. Does the State require assistance to establish a financial intermediary?
No. Tamil Nadu Urban Finance and Infrastructure Development Corporation and Tamil Nadu Urban
Infrastructure Financial Services Limited are acting as financial intermediaries in Tamil Nadu.

State Annual Action Plan (SAAP)
Name of State : Tamil Nadu FY 2017-20
Rs.in Cr
S.n Name of the
City Water supply
Sewerage Drainage NMT Green space
Grand Total
1 Ambur 0.00 275.00 0.00 0.00 2.73 277.73
2 Avadi 0.00 0.00 0.00 0.00 2.73 2.73
3 Chennai 88.70 317.29 0.00 0.00 13.65 419.64
4 Coimbatore 0.00 331.00 0.00 0.00 5.46 336.46
5 Cuddalore 0.00 0.00 0.00 0.00 2.73 2.73
6 Dindigul 0.00 0.00 0.00 0.00 2.73 2.73
7 Erode 0.00 0.00 0.00 0.00 2.73 2.73
8 Hosur 0.00 0.00 0.00 0.00 2.73 2.73
9 Kancheepuram 0.00 50.00 0.00 0.00 2.73 52.73
10 Karaikudi 0.00 0.00 0.00 0.00 2.73 2.73
11 Kumbakonam 0.00 0.00 0.00 0.00 2.73 2.73
12 Madurai 450.00 300.00 0.00 0.00 2.73 752.73
13 Nagapattinam 0.00 0.00 0.00 0.00 2.73 2.73
14 Nagercoil 0.00 310.00 0.00 0.00 2.73 312.73
15 Pallavaram 0.00 22.00 0.00 0.00 2.73 24.73
16 Pudukottai 195.00 0.00 0.00 0.00 2.73 197.73
17 Rajapalayam 0.00 194.00 0.00 0.00 2.73 196.73
18 Salem 0.00 0.00 0.00 0.00 2.73 2.73
19 Tambaram 0.00 35.00 0.00 0.00 2.73 37.73
20 Thanjavur 0.00 0.00 0.00 0.00 2.73 2.73
21 Thiruvannamalai 0.00 260.00 0.00 0.00 2.73 262.73
22 Thoothukkudi 0.00 0.00 0.00 0.00 2.73 2.73
23 Tiruchirappalli 0.00 453.00 0.00 0.00 2.73 455.73
24 Tirunelveli 0.00 0.00 0.00 0.00 2.73 2.73
25 Tiruppur 0.00 415.00 0.00 0.00 2.73 417.73
26 Velankanni 0.00 0.00 0.00 0.00 2.73 2.73
27 Vellore 0.00 325.00 0.00 0.00 2.73 327.73
28 Rameswaram 0.00 0.00 0.00 0.00 2.73 2.73