State Share of Instructio n
29
COMMUNITY COLLEGES FY 2014 May 2013 State Share of Instruction
description
State Share of Instructio n. Community Colleges FY 2014 May 2013. State Share of Instruction. Overall allocations determined by Governor & Legislature Cost-Based Model Distributive or Rationing Formula Based on 3-year averages (starting FY14). Components and Sources. - PowerPoint PPT Presentation
Transcript of State Share of Instructio n

COMMUNITY COLLEGESFY 2014
May 2013
State Share of Instruction

State Share of Instruction
Overall allocations determined by Governor & Legislature
Cost-Based Model
Distributive or Rationing Formula
Based on 3-year averages (starting FY14)

Components and Sources
Main Components:
Enrollments Course Completions Success Points Stop-Loss
Major Players:
End of Term processes Success Points process CN File SN File CI File DC File FF File FX File CX File

Community College Funding Model
2013Enrollments (90%)
Success Points (10%)
Course Completions
(0%)
96% Stop-Loss
2014Enrollments (50%)
Success Points (25%)
Course Completions
(25%)
97% Stop-Loss

https://www.ohiohighered.org/hei
Processes & Utilities – Provides Explanations of these Processes Course Inventory Expert System Download Your Institutions Data (IPEDS) End-of-Term Process Resource Analysis Subsidy FTE Enrollment Success Points Process Selection of Degrees for SSI Process

https://www.ohiohighered.org/hei
Important Links Data Input Site (login required) Data and Reports File Submission Schedule Unrestricted Outputs Restricted Outputs (login required)

HEI Restricted Outputs
Academic Calendar Administration Liaisons Only (use for Liaison administrative functions)
End-of-Term (use to calculate Subsidy FTE and to finalize the term)
Subsidy Process/Success Challenge/Resource Analysis
Mobility Tracking Query Restricted Queries (choose from several restricted queries) HEI Secure File Transfer

HEI End-of-Term Processing
Request End-of-Term Reports -- Creates Subsidy Eligible FTE Completed FTE At-Risk FTE Success Points (if applicable) Degrees (if applicable)
Review Reports Created!
Finalize End-of-Term Releases data for use in reports and queries

HEI Restricted Outputs
Academic Calendar Administration Liaisons Only (use for Liaison administrative functions)
End-of-Term (use to calculate Subsidy FTE and to finalize the term)
Subsidy Process/Success Challenge/Resource Analysis
Mobility Tracking Query Restricted Queries (choose from several restricted queries) HEI Secure File Transfer

Subsidy Process/Success Challenge/Resource Analysis
Subsidy FTE Query Unit record data of FTE
Subsidy Process Summary of Credit Hours
Eligible, Completed & At-risk (completed)
Selection of Degrees for SSI Student Success Initiative
Summary of Success Points by TypeSuccess Challenge Query Resource Analysis Query Resource Analysis Cost Allocation reports

HEI Subsidy FTE Query
General Factors Fiscal Year, Term, Campus
Course Factors Subject field, Course Level, Subsidy Model Subsidy Eligible Switch Course Credit Attempted, Course Credit Completed
Student Factors Subsidy Eligible Status Rank, Major At-Risk Switch

Subsidy Process/Success Challenge/Resource Analysis
Subsidy FTE Query Unit record data of FTE
Subsidy Process Summary of Credit Hours
Eligible, Completed & At-risk (completed)
Selection of Degrees for SSI Student Success Initiative
Summary of Success Points by TypeSuccess Challenge Query Resource Analysis Query Resource Analysis Cost Allocation reports

HEI Subsidy Page
Total Enrollments by Source (Step 1)Total Enrollments by Reason for Exclusion
(Step 2) Ineligible students or courses… Audits
Total Enrollments by Method of Mapping to Subsidy Model (Step 4) Verification Table Match or not
Total Enrollments by Subsidy Model (Step 5)Journal Entry Transactions (Step 9)Final Report Total Enrollments by Model and
Source of Enrollments

Subsidy Process/Success Challenge/Resource Analysis
Subsidy FTE Query Unit record data of FTE
Subsidy Process Summary of Credit Hours
Eligible, Completed & At-risk (completed)
Selection of Degrees for SSI Student Success Initiative
Summary of Success Points by TypeSuccess Challenge Query Resource Analysis Query Resource Analysis Cost Allocation reports

Community College Success Points
Success Points are Earned for Students Who:
1. Earn 15 college-level credits at this institution2. Earn 30 college-level credits at this institution3. Earn an Associate Degree at this institution4. Complete first Developmental (DEV) Course*5. Complete DEV math & enroll in college-level math*6. Complete DEV English & enroll in college-level
English*7. Enroll at a USO University after earning 15 credits
at your college
*Institution only gets 2/3 of a point for this

Student Success Initiative Report
Total Enrollments (Step 1)Points Earned from College and Developmental Credits
(Step 2) Type 1, Type 2, & Type 4 Points
Points Earned from Associate Degrees (Step 3) Degrees awarded, Students, & Type 3 Points
Points Earned from Developmental Level Courses (Step 4) Type 5 (English) Points Type 6 (Math) Points
Points Earned by USO University Students (Steps 5-6) Type 7 Points
Totals Summary Table, all points, and students

Subsidy Process/Success Challenge/Resource Analysis
Subsidy FTE Query Unit record data of FTE
Subsidy Process Summary of Credit Hours
Eligible, Completed & At-risk (completed)
Selection of Degrees for SSI Student Success Initiative
Summary of Success Points by TypeSuccess Challenge Query Resource Analysis Query Resource Analysis Cost Allocation reports

HEI Resource Analysis Query
Select: Fiscal Year Unrestricted or Total Costs Institution Type, Institution(s), or Campus(es) Subject Field(s), Subject Code(s)… & Level(s) OR
Subsidy Model(s)Returns:
Instructor Compensation Costs for Student Services, Academic Support,
Institutional Support, Library… Student FTE Instructor Credit Hours

Model Cost
Courses are grouped into models Based on CIP code (Subject Field) and Level = Model
Costs are associated with models Costs are determined using a 6-year average Resource Analysis
Based on data reported by campuses FF, FX, & CX files
All costs are based on the STATEWIDE average
STEM Weights are added where appropriate
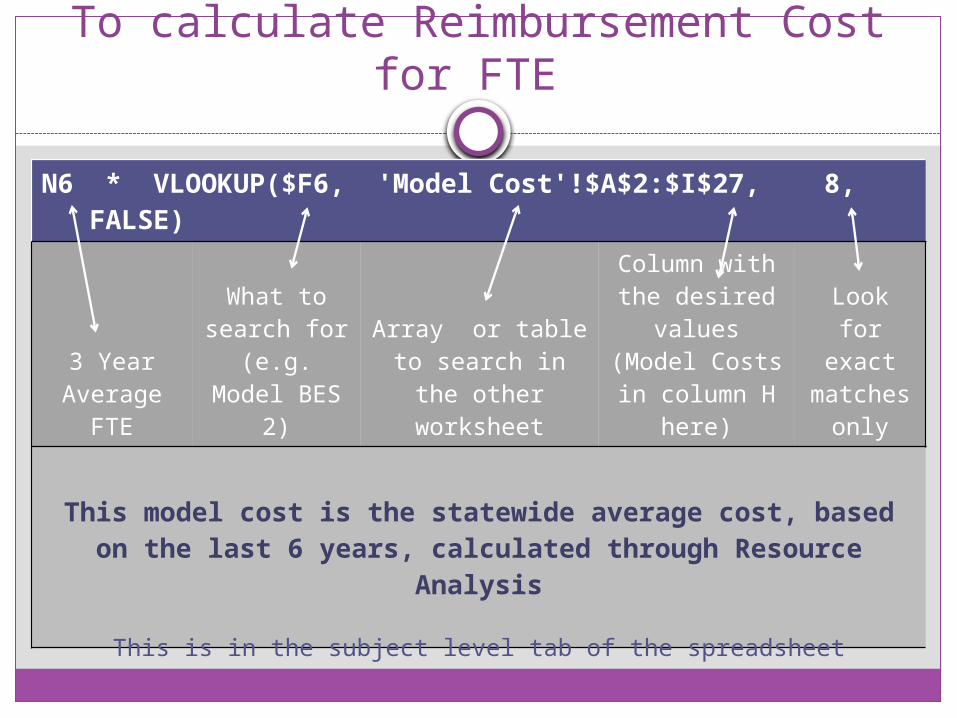
To calculate Reimbursement Cost for FTE
N6 * VLOOKUP($F6, 'Model Cost'!$A$2:$I$27, 8, FALSE)
3 Year Average
FTE
What to search for (e.g. Model
BES 2)
Array or table to search in the
other worksheet
Column with the desired
values (Model Costs in
column H here)
Look for exact
matches only
This model cost is the statewide average cost, based on the last 6 years, calculated through Resource Analysis
This is in the subject level tab of the spreadsheet

To calculate SSI for FTE for a model
$X$5763 *( T6 / $T$5762 )
Total allocation for that component
Reimbursement cost at the given school in the given model (see
previous slide)
Total sector reimbursement cost for that component
This (t6/t5762) gives the share of reimbursement cost attributable to a given
model at a given school
This ensures that the total amount allocated to that component (e.g. eligible or completed FTE) is
distributed equitably based on the college’s share of the total sector reimbursement cost for that
component This is in the subject level tab of the spreadsheet

To calculate SSI for FTE for the school
SUM( IF ('subject level'!$C$6:$C$5760=$A9,‘ subject level'!$W$6:$W$5760))
If the condition
is true then Sum
Condition: The cell in column C for the given row in the subject level tab must match cell A9
in this tab
Values to be summed (Values in column W will be included if and
only if column C in that row matches cell A9 in the CC
summary tab)
This sums by school all of the SSI calculated by school and model in the previous formula
This is in the CC summary tab of the spreadsheet

To calculate SSI for Success Points
$E$7* VLOOKUP(A9, 'success points'!$L$30:$U$53, 10,FALSE)
Total sector allocation for
Success Points
What to search for
(e.g. CYCC)
Array or table to search in the
other worksheet
Column with the desired
values (school’s share of
success points in col U)
Look for exact
matches only
This ensures that the total amount allocated to Success Points is distributed equitably based on the college’s share
of the total success points in the sector.
This is in the CC summary tab of the spreadsheet

Stop Loss
1. Calculates amount below stop-loss for each institution
2. Calculates each institution's contribution• Based on their allocation in iterations 1 &2• Based on their amount over stop loss in iteration 3
3. Net is original allocation + or – any changes due to stop loss
4. Goes through up to 3 iterations• 3rd iteration uses amount above stop-loss as pool• Ensures all institutions will be at or above stop-loss at
end

Amount Below Stop Loss
IF (1+I9 <$J$4, $H9* $J$4 -F9, 0 )
IF 1 plus the
percent difference between
this year’s SSI and
last year’s SSI
Is less than the stop loss
percentage (e.g. 97%)
Multiply last year’s SSI
By the stop loss percentage (e.g.
see what 97% of
last year was) and
Subtract this year’s SSI to get
the difference
b/t this year’s SSI & 97% of last year’s
SSI
ELSE (i.e. if 1 plus the percent
difference between this
year’s SSI and last year’s SSI
is NOT less than the stop
loss percentage)
put zero
This creates a column with a negative number if the institution is below the stop loss and zero if not. This is in the CC summary tab of the spreadsheet
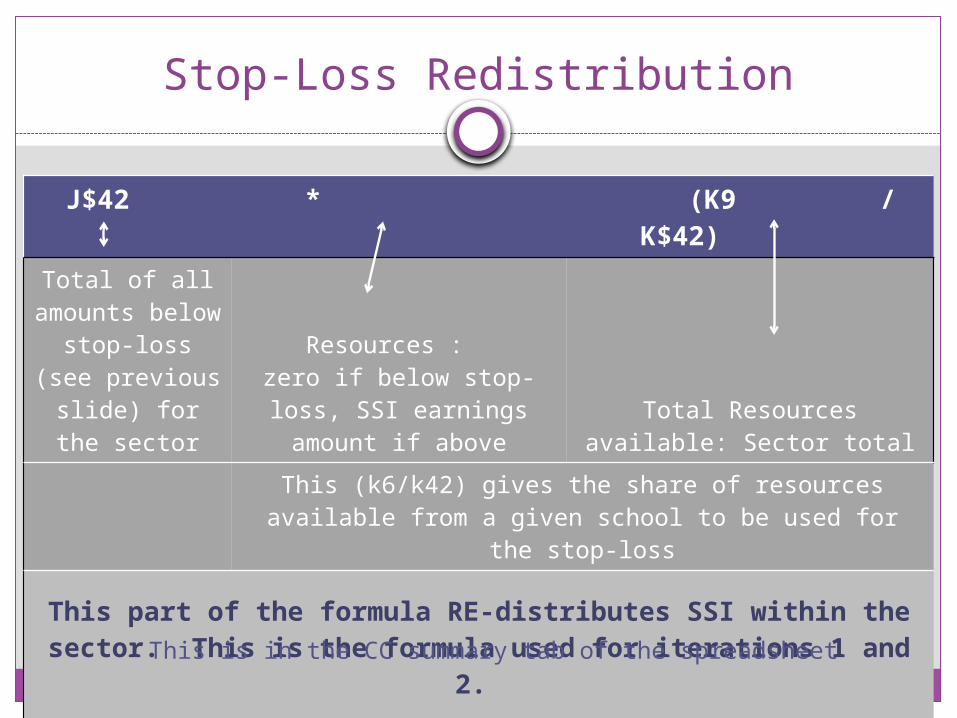
Stop-Loss Redistribution
J$42 * (K9 / K$42)
Total of all amounts below stop-loss (see previous slide) for the sector
Resources : zero if below stop-loss, SSI earnings amount if
aboveTotal Resources available:
Sector total
This (k6/k42) gives the share of resources available from a given school to be used for the stop-loss
This part of the formula RE-distributes SSI within the sector. This is the formula used for iterations 1 and 2.
This is in the CC summary tab of the spreadsheet

Resources for Stop-Loss Iteration 3
IF (T9+O9+J9=0, R9 - H9*$J$4 , 0)
IF amount below stop-loss after each
step/iteration = zero
Net amount from stop-loss
iteration 2 LESS
Previous year earnings * stop loss percent (e.g. 97% of
FY13 earnings) – this is the amount
the school cannot go under
If below stop-loss
at any step,
then = zero
This (R9 – H9*$J$4) gives the amount over the stop loss
By basing resources available from each school on the amount above the stop-loss, it ensures that no school will
be under the stop-loss at the end of iteration 3.
This is in the CC summary tab of the spreadsheet

Stop-Loss Redistribution
T$42 * (U9 / U$42)
Total of all amounts below
stop-loss
Resources : zero if below stop-loss or amount above stop-loss if
aboveTotal Resources available:
Sector total
U9 = zero if the institution was not below the stop loss at any step; and = the amount above the stop loss if above (used total allocation in
iterations 1 & 2)
This part of the formula RE-distributes SSI within the sector but only draws from amounts that are above the
stop loss to ensure no school is under the stop-loss percentage. This is the formula used for iteration 3, the
final iteration. This is in the CC summary tab of the spreadsheet


![Watson.guptill.[How to Draw] Portrait Drawing a Step-By-Step Art Instructio](https://static.fdocuments.us/doc/165x107/577d1e031a28ab4e1e8d8a36/watsonguptillhow-to-draw-portrait-drawing-a-step-by-step-art-instructio.jpg)