State Police, Oregon
18
State Police, Oregon Annual Performance Progress Report Reporting Year 2020 Published: 9/29/2020 5:21:25 PM
Transcript of State Police, Oregon

State Police, OregonAnnual Performance Progress Report
Reporting Year 2020
Published: 9/29/2020 5:21:25 PM

KPM # Approved Key Performance Measures (KPMs)
1 Transportation Safety - Enhance transportation safety by reducing fatal crashes on state and interstate highways to fewer than 5.06 per 100,000,000 vehicle miles traveled (VMT) where the Oregon State Police (OSP) have primary responsibility.
2 Traffic Incident Management - Percent of lane blocking crashes cleared within 90 minutes.
3Criminal Apprehension/Detection - Reduce criminal activity on Oregon's transportation system through the Criminal Apprehension through Patrol Enforcement (CAPE) program, by achieving a percentage of traffic stops resulting in an arrest or criminalcitation due to the detection illegal activities.
4 Ignition Interlock Device Compliance - Increase compliance with the requirement of offenders to install Ignition Interlock Devices to reduce crashes and improve transportation safety on Oregon roadways.
5 Angler and Hunter Contacts - Increase interactions with anglers and hunters.
6 Illegal Harvest - Improve detection of illegally harvested fish and wildlife.
7 Crime Reduction - Percent of major crime team call-outs resolved within 12 months from date of call-out.
8 Crime Reduction - Number of Dismantled or Disrupted Drug Trafficking Organizations (DTO's).
9 Forensic Analysis - Percentage of analytical requests completed within 30 days or less.
10Criminal Justice Information Services (CJIS) Division Turnaround Time - Average turnaround time, from the date of receipt of manual and electronic criminal justice fingerprint cards by the CJIS Division, until the criminal justice data is posted into theComputerized Criminal History (CCH) Files.
11 Property Protection - The percentage of threatened residential and commercial properties saved from destruction by an approaching wildfire after initiation of operations by OSFM mobilized resources.
12 RESIDENTIAL FIRE DEATH RATE: - Number of Oregonians per capita that die in a residential fire.
13 Customer Satisfaction - Percent of customers rating their satisfaction with the agency customer service as "good" or "excellent": overall customer service, timeliness, accuracy, helpfulness, expertise and availability of information.
Performance Summary Green Yellow Red
= Target to -5% = Target -5% to -15% = Target > -15%
Summary Stats: 46.15% 15.38% 38.46%
redgreenyellow

KPM #1 Transportation Safety - Enhance transportation safety by reducing fatal crashes on state and interstate highways to fewer than 5.06 per 100,000,000 vehicle miles traveled (VMT) where theOregon State Police (OSP) have primary responsibility.Data Collection Period: Jan 01 - Dec 31
* Upward Trend = negative result
Report Year 2016 2017 2018 2019 2020
Transportation SafetyActual 7.53 7.79 9.97 8.64 9.19Target 5.06 5.06 5.06 5.06 5.06
How Are We DoingThe previous metric for this Key Performance Metric (KPM) was to reduce fatal crashes on state and interstate highways where OSP has primary responsibility by 2.5% annually (from 2012 to 2022),reaching a target of 101 fatal crashes by 2022. Due to factors beyond OSP’s control, such as licensed number of drivers and vehicle miles traveled, it was unlikely OSP would be able to achieve apurely nominal target.
Instead, OSP changed the metric based on the number of fatal crashes vehicle miles traveled (VMT) on highways segments where Oregon State Police has primary responsibility. In 2015, the fatalcrash rate per 1,000,000,000 VMT was 7.79. Between 2010 - 2015, the lowest fatal crash rate per 1,000,000,000 VMT was 5.63 (in 2013). Using an average of 100 fatal crashes per 1,000,000,000VMT over a six-year period (2010 - 2015), OSP’s new target is a fatal crash rate of 5.06 or lower per 1,000,000,000 VMT.
In calendar year 2018 (the most recent validated data from ODOT’s Crash Analysis Unit), the fatal crash rate per 1,000,000,000 VMT was 9.19. This is higher than the 8.69 fatal crash rate in calendaryear 2017 and the 6.74 average fatal crash rate between 2010 – 2015.
Factors Affecting ResultsEnforcement plans focused on changing driving behaviors in an effort to reduce crashes are developed and implemented. Patrol offices around the state also work with ODOT and other partners onengineering and education efforts aimed at reducing crashes. There are other variables that affect crash rates outside the control of OSP’s enforcement, education, engineering and emergencymedical services efforts. Some of these variables include the economy, adverse weather events, number of licensed drivers, and changes in annual vehicle miles traveled. In fact, the number of
actual target

vehicle miles travelled on Oregon’s highways in calendar year 2018 was the highest on record (21,771,800,000), and the number of fatal crashes was the second highest on record since 2008 (200). It is worth noting VMT has a positive correlation to the number of fatal crashes, which helps explain the increased crashed rate.

KPM #2 Traffic Incident Management - Percent of lane blocking crashes cleared within 90 minutes.Data Collection Period: Jan 01 - Dec 31
* Upward Trend = positive result
Report Year 2016 2017 2018 2019 2020
Percentage of crashes cleared within 90 minutes on highways where OSP has primary responsibilityActual 71% 71% 71% 75% 75%Target 80% 80% 80% 80% 80%
How Are We DoingThe clearance rate on highways where OSP has primary responsibility has been relatively stable and shown steady improvement during the last four calendar years: 2015 – 71%, 2016 – 71%, 2017 -71%, and 2018 – 75%. Although OSP missed the target by 5-percentage points this report period, this matches the 4-percentage point improvement experienced in 2018 over the previous years andthe highest during the last five years.
Factors Affecting ResultsActions to clear travel lanes after a crash can range from being simple, such as when vehicles are still drivable, to the more complex. Factors affecting results can include such things as theavailability of first responder resources, complex investigations, the number of vehicles travelling the roadways and infrastructure. OSP, along with its partners in this effort continue to be dedicated toreducing time on scene through implementation of Traffic Incident Management principles.
actual target

KPM #3 Criminal Apprehension/Detection - Reduce criminal activity on Oregon's transportation system through the Criminal Apprehension through Patrol Enforcement (CAPE) program, by achievinga percentage of traffic stops resulting in an arrest or criminal citation due to the detection illegal activities.Data Collection Period: Jan 01 - Dec 31
* Upward Trend = positive result
Report Year 2016 2017 2018 2019 2020
Criminal Apprehension/DetectionActual 1.40% 1.45% 1.57% 1.54% 1.53%Target 0.80% 0.80% 0.80% 1.54% 1.54%
How Are We DoingAfter upgrading the Department’s computer aided dispatch (CAD) system in 2013, a new target of 0.8% of all traffic stops resulting in an arrest or criminal citation was established beginning incalendar year 2015. However, after years of exceeding the target (2015 = 1.10%, 2016 = 1.40%, 2017 = 1.45%), OSP determined the target needed to be revised. Increasing the average of 1.4%routine contacts/self-initiated stops resulting in an arrest or criminal citation staff made by Patrol Division staff between 2015 – 2017 by 10%, the new target of 1.54% was established.
In calendar year 2019, there were 3,179 Patrol Division routine contacts that resulted in an arrest or criminal citation out of 207,874 Patrol Division total routine contacts. This calculates to apercentage of routine contacts resulting in an arrest or criminal citation of 1.53%. This just misses the target of 1.54% Patrol Division traffic stops resulting in an arrest or criminal citation approved bythe 2019 Legislature. However, the 2019 results are comparable to the outcomes for 2017 (1.57%) and 2018 (1.54%) respectively.
Factors Affecting ResultsWhile the outcome of 1.53% in calendar year 2019 is just slightly under the goal, two of the main factors affecting this KPM are staffing and training. Trooper knowledge of current case law is critical toensure successful prosecution of criminal cases investigated during traffic stops. In addition, success in achieving this KPM goal is also based on the anticipated hiring of troopers, the efforts theagency has and will place on enhanced training to improve skills at detecting criminal activity during routine contacts, and continuing to provide supportive resources such as narcotic canines.
actual target
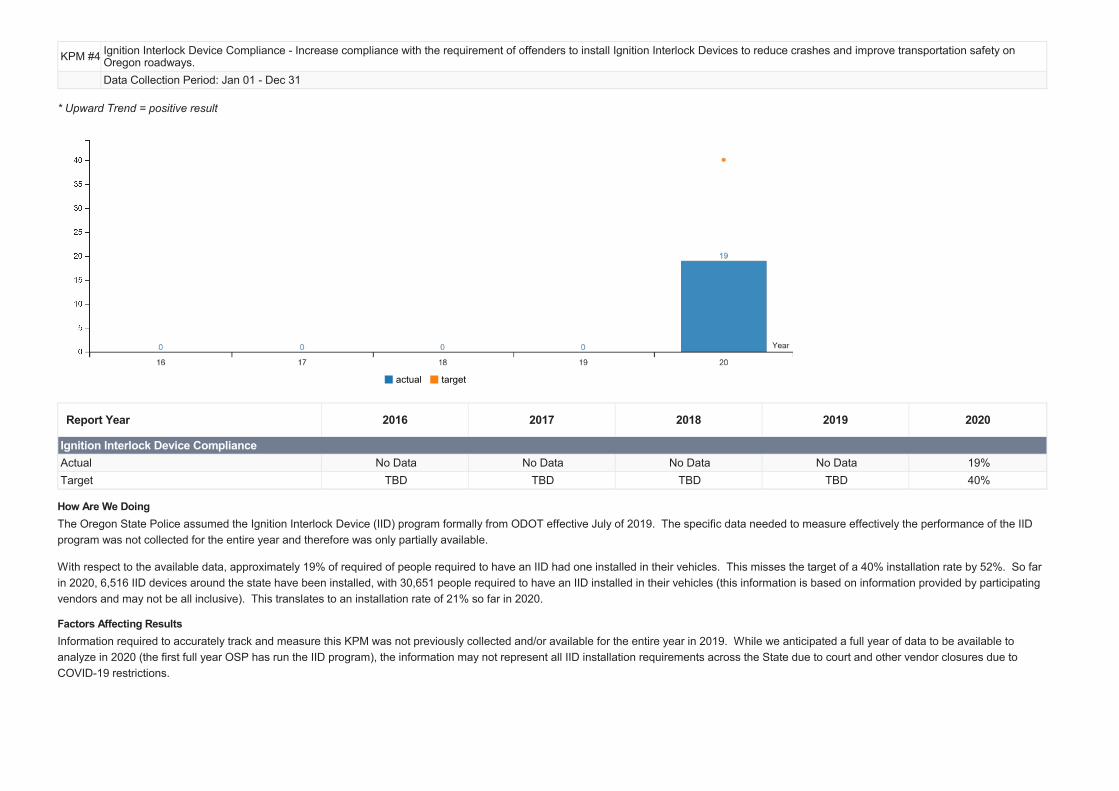
KPM #4 Ignition Interlock Device Compliance - Increase compliance with the requirement of offenders to install Ignition Interlock Devices to reduce crashes and improve transportation safety onOregon roadways.Data Collection Period: Jan 01 - Dec 31
* Upward Trend = positive result
Report Year 2016 2017 2018 2019 2020
Ignition Interlock Device ComplianceActual No Data No Data No Data No Data 19%Target TBD TBD TBD TBD 40%
How Are We DoingThe Oregon State Police assumed the Ignition Interlock Device (IID) program formally from ODOT effective July of 2019. The specific data needed to measure effectively the performance of the IIDprogram was not collected for the entire year and therefore was only partially available.
With respect to the available data, approximately 19% of required of people required to have an IID had one installed in their vehicles. This misses the target of a 40% installation rate by 52%. So farin 2020, 6,516 IID devices around the state have been installed, with 30,651 people required to have an IID installed in their vehicles (this information is based on information provided by participatingvendors and may not be all inclusive). This translates to an installation rate of 21% so far in 2020.
Factors Affecting ResultsInformation required to accurately track and measure this KPM was not previously collected and/or available for the entire year in 2019. While we anticipated a full year of data to be available toanalyze in 2020 (the first full year OSP has run the IID program), the information may not represent all IID installation requirements across the State due to court and other vendor closures due toCOVID-19 restrictions.
actual target

KPM #5 Angler and Hunter Contacts - Increase interactions with anglers and hunters.Data Collection Period: Jan 01 - Dec 31
* Upward Trend = positive result
Report Year 2016 2017 2018 2019 2020
Number of Angler and Hunter ContactsActual 68,742 72,490 72,924 83,320 84,568Target 85,000 85,000 85,000 85,000 85,000
How Are We DoingIn calendar year 2019, the Fish and Wildlife Division achieved 84,568 angler and hunter contacts, achieving 99% percent of the target level of 85,000 angler and hunter contacts per year. The Divisionincreased the number of angler and hunter contacts by over 1,200 when compared to 2018. In fact, the 84,568 contacts achieved in 2019 is the highest number of contacts during the past 6 years.
Factors Affecting ResultsThe KPM target was nearly reached in 2019 and 2018. One contributing factor for this success has been the launch of its mobile application. The mobile application has allowed troopers andsupervisors to track the number of contacts they have made in near real time. As a result, the Division is able to develop schedules and utilize resources to contact hunters/anglers more effectivelyand record those activities more accurately.
However, the outlook for 2020 is bleak – even with technology advances. The Fish and Wildlife Division have the most vacancies in recent history (24) due to losses in funding. If existing vacanciesare not filled or an increase in attrition occurs, the number of contacts will surely be lower and the KPM target will not be met.
actual target

KPM #6 Illegal Harvest - Improve detection of illegally harvested fish and wildlife.Data Collection Period: Jan 01 - Dec 31
* Upward Trend = positive result
Report Year 2016 2017 2018 2019 2020
Number of detections of illegally harvested of fish and wildlifeActual 6,949 5,987 5,570 5,939 4,408Target 6,100 6,100 6,100 6,500 6,500
How Are We DoingIn calendar year 2019, Fish and Wildlife Division Troopers detected approximately 4,408 illegally harvested fish and wildlife species, missing the target of 6,500 detections by 32%. This is the lowestnumber of reported detections since 2011. From 2012 through 2018, the Division had averaged 5,862 detections of illegally harvested fish and wildlife species annually, with a high of 6,949 in 2015.
Factors Affecting ResultsAlthough a KPM of the Fish and Wildlife Division is to detect illegally harvested fish and wildlife species, the goal of the Division is to deter individuals from violating Oregon's wildlife laws. In recentyears, the Division has undertaken several strategies to educate and deter people from the illegal harvesting of fish and wildlife. These efforts include the Division's increased use of social media tohighlight enforcement efforts and activities likely provided some deterrent effect to illegal harvest. Another factor is the increased contacts and interactions of Fish and Wildlife Troopers with membersof the public. In calendar year 2019, the Division made the most contacts with individuals since 2009. These interactions allow Troopers to educate and deter people from committing violations ofOregon's wildlife laws.
Another significant factor affecting the results of this KPM is how the target was established in 2014 (adopted in 2015). Although the intent of the KPM was to measure illegally harvested fish andwildlife as the result of sporting/recreational activities, the measure was established using all species from all activities (e.g. commercial activities, shellfish, etc.). Consequently, to report the outcomeof this KPM with the original intent in mind, staff has had to identify and eliminate the "outliers" in the data set (e.g. illegally harvested shellfish, wildlife due to commercial activities, etc.). As a result,the Division is reporting a smaller number of illegally harvested wildlife than it actually detects in a given year, while holding itself to a target that was established using all species. To remedy thissituation, the Division will be requesting to adjust its target to align with the original intent of the KPM by focusing only on illegally harvested fish and wildlife as the results of sporting/recreationalactivities.
actual target

KPM #7 Crime Reduction - Percent of major crime team call-outs resolved within 12 months from date of call-out.Data Collection Period: Jan 01 - Dec 31
* Upward Trend = positive result
Report Year 2016 2017 2018 2019 2020
Percent of major crime team call-outs resolved within 12 months from date of call-outActual 93% 94% 97% 97% 96%Target 93% 93% 93% 93% 95%
How Are We DoingBetween January and December of 2018, Major Crime Section detectives responded to 127 major crime team call-outs across the state. Of those, 122 were resolved within 12 months for a resolutionrate of 96 percent.
In 2009, a target of 93% was established which was exceeded in 2009 and 2010 with a resolution rate of 94% in both years. In 2011 (reported in 2013), the target was narrowly missed as theresolution rate was 91%. For 2012 (reported in 2014) the resolution rate was 91%, again narrowly missing the 93% resolution rate. In 2013 (reported in 2015) the resolution rate was 88%, with 2014(reported in 2016) showing marked improvement with a resolution rate of 93%. The resolution rate for 2015 (reported in 2017) rose slightly to 94%, and 2016 (reported in 2018) exceeded the target byobtaining a resolution rate of 97%. The resolution rate for 2017 (reported in 2019) exceeded the target by again obtaining a resolution rate of 97%. The target was raised to 95% for the 2018 reportingyear (reported in 2020). The resolution rate for 2018 continued to exceed the target by obtaining a 96% resolution rate.
Factors Affecting ResultsThe complex nature of major crime investigations, the availability of resources in relation to the scope of the investigation, and the geographical location of the investigation team may impact the resultof this performance measure. Other contributing factors are attrition to our workforce, and an increased role in Oregon’s distressed timber counties. For instance, in June 2012, the Josephine CountySheriff’s Office began referring a large portion of all their criminal investigations.
actual target

KPM #8 Crime Reduction - Number of Dismantled or Disrupted Drug Trafficking Organizations (DTO's).Data Collection Period: Jan 01 - Dec 31
* Upward Trend = positive result
Report Year 2016 2017 2018 2019 2020
Number of Drug Trafficking Organizations Dismantled / DisruptedActual 30 59 52 25 73Target 20 20 20 25 35
How Are We DoingThe number of Drug Trafficking Organizations (DTOs) the Oregon State Police (OSP) assisted in dismantling or disrupting increased from 22 in 2013 (reported in 2014), to 30 in 2014 and 2015(reported in 2015 and 2016 respectively). For calendar year 2016, that number jumped to 59 and in 2017, the number of DTOs dismantled or disrupted was 52. In calendar year 2018, OSP met thetarget by dismantling or disrupting 25 DTOs. It is worth noting the target for the number of DTOs dismantled or disrupted was increased from 20 to 25 beginning in 2018. In calendar year 2019, thetarget was increased again from 25 to 35. The number of DTOs dismantled or disrupted dramatically increased to 73.
Factors Affecting ResultsTask forces vary in their mission and focus to target street-level, mid-level or upper-level drug investigations. Mid to upper-level narcotic investigations, focusing on DTO’s, are more complex andlonger in duration while street level investigations tend to be direct in nature and short-term. The increase in DTO’s dismantled or disrupted can be attributed to the on-going, widespread, consistentand reinforced knowledge of the definition of a DTO that has been standardized by the Office of National Drug Control Policy. A concerted effort has been made by drug task forces to accuratelycapture data based on the standardized DTO criteria and submit documentation to HIDTA and/or the appropriate law enforcement reporting agency reflecting their efforts and end results. In addition,OSP has had a consistent, tenured presence on drug task forces statewide, particularly those larger in size, that have a greater case volume and are focused on higher level illegal drug activity.
actual target

KPM #9 Forensic Analysis - Percentage of analytical requests completed within 30 days or less.Data Collection Period: Jan 01 - Dec 31
* Upward Trend = positive result
Report Year 2016 2017 2018 2019 2020
Percentage of analytical requests completed within 30 daysActual 28% 26% 25% 24% 28%Target 56% 59% 62% 65% 68%
How Are We DoingIn the calendar year 2019, the percentage of analytical requests completed in 30 days or less was 28%. This was a marked improvement over the 24% in 2018 as well as the previous two years(2017 = 25%, 2016 = 26%). The increase in the KPM was anticipated, as efficiencies from the integration of Lean Six Sigma, decreasing SAFE kit backlog, new technology (LC-QTOF in Toxicology),and completion of employee training programs took effect. While our KPM numbers have improved, we continue to work with a backlog meaning that the oldest requests are processed first, whichmeans that overall KPM comes down as analysts work those cases. Significant improvements have been made in the Toxicology discipline, which accounts for the highest proportion of our requestsat 34%. In 2019, the Toxicology backlog for cases over 30 days decreased by 57% and pending toxicology requests over 90 days decreased by 72%, much of which accounted for the Division’s 30%overall backlog reduction for cases greater than 90 days old.
Factors Affecting ResultsAs we have continued to manage attrition, face hiring challenges, and function without much of the administrative support needed to meet the demands of the work efficiently, the Division continued tomaintain a high level of production. While down slightly from our most productive year ever in 2018, the FSD completed 31, 099 requests at 2.26/hours per request (2018 = 33, 947 requests at 2.20hours/request).
The methodology the division used to calculate its turnaround time changed in April of 2014. Prior to April 2014, when a piece of evidence was submitted to the division, the turnaround time wascalculated using the length of time it took to perform each forensic analysis discipline separately. Beginning in April 2014, the turnaround time has been calculated as the time between when evidenceis submitted to the Division to when all analysis has been completed and the results have been provided to the customer. This has two adverse effects on the data: it increases overall averageturnaround time and it biases the data in favor of cases in the “over 90 day” category.
actual target

KPM #10 Criminal Justice Information Services (CJIS) Division Turnaround Time - Average turnaround time, from the date of receipt of manual and electronic criminal justice fingerprint cards by theCJIS Division, until the criminal justice data is posted into the Computerized Criminal History (CCH) Files.Data Collection Period: Jan 01 - Dec 31
Report Year 2016 2017 2018 2019 2020
Manual Fingerprint Cards Average Turnaround (Days)Actual 3.90 4.60 2.80 2.30 12.60Target 4 4 4 4 4a. Electronic Fingerprint Cards Average Turnaround (Hours)Actual 1.50 1.40 1.70 2.24 2.55Target 2 2 2 2 2
How Are We DoingThe Oregon State Police’s ability to meet this performance measure solely depends on staff resources within the CJIS Division. Livescan technology and automated processing improvements havesignificantly reduced that dependency and a revised target of 4 days became possible, down from the previous 8-day turnaround.
For calendar year 2019, the 4-day manual card turnaround target was not met; instead the manual card average turnaround time was 12.6 days. In 2019, manual cards represented 3% of the totalcriminal card submissions. Automated submissions, which represented 97% of the total criminal cards received, were completed within 2.55 hours (153 minutes) of receipt of the submission. Forautomated submissions, 2.55 hours is above the 2-hour turnaround target. Our current technology reporting software cannot parse out cards sent to us by agencies with errors such as incomplete orwrong data. When we receive cards with bad data, we must contact the submitting agency and wait for a response from them in order to process the card (we call these cards “stuck” cards). The2.55 hours in our automated submissions incudes our “stuck” transactions.
We are in a technology upgrade project for CJIS called LEDS 20/20. When we go live with the ABIS portion of the technology upgrade, we will be able to parse out the “stuck” cards verses the cardsthat can be processed immediately.
Factors Affecting ResultsStaffing levels and agencies use of Livescan technology have a direct effect on our performance results, as does the availability of our infrastructure systems. All of Oregon’s county jail facilities use
actual target
Livescan technology to submit their arrest fingerprint cards, with a growing number of local police departments also acquiring Livescan technology. All agencies using Livescan devices submitfingerprints using the automated process. However, there continue to be instances where manually captured prints are necessary due to either an agency not having a Livescan machine orcircumstances that make a manual print necessary (i.e. nature disaster, power issues etc.). Therefore, OSP will continue to maintain some level of accepted manual processing services in order tomeet this need. During this reporting period, vacancies, turnover, a reorganization, and increased workload had an impact on the turnaround time for manual cards. Specifically, because of theaforementioned circumstances a large amount of backlogged regulatory cards developed, which affected CJIS’ ability to keep up with the manual cards.

KPM #11 Property Protection - The percentage of threatened residential and commercial properties saved from destruction by an approaching wildfire after initiation of operations by OSFM mobilizedresources.Data Collection Period: Jan 01 - Dec 31
* Upward Trend = positive result
Report Year 2016 2017 2018 2019 2020
Percentage of threatened structures saved from approaching wildfires by OSFM mobilizationsActual 95.40% 99.80% 99.80% 98.80% 100%Target 100% 100% 100% 100% 100%
How Are We DoingThe 2019 wildland fire season was relatively quiet in comparison to previous years. OSFM did not respond to any declared conflagrations, and therefore no structures were lost to conflagration fires. The last time there was not any declared conflagrations was the 2012 wildland fire season.
Factors Affecting ResultsThe primary factors affecting the results of this measure are the location of fire, the weather conditions of the area, the speed and effectiveness of the initial fire responses, and the determinationsmade by the involved county’s Fire Defense Board Chief and local Incident Commander.
Ultimately, a variety of factors including the size and rate of advancement of the fire will be the determining factor affecting the need for a conflagration request and therefore the results of this keyperformance measure. Recent fires in California, Washington, Idaho and Montana have resulted in catastrophic losses in the number of residences destroyed by the fast-moving wildland fires. Thehazards and vulnerabilities faced in these other states are similar to those in Oregon.
actual target

KPM #12 RESIDENTIAL FIRE DEATH RATE: - Number of Oregonians per capita that die in a residential fire.Data Collection Period: Jan 01 - Dec 31
* Upward Trend = negative result
Report Year 2016 2017 2018 2019 2020
Number of fire fatalities per million (Numbers exclude vehicle, homicides, suicides, and other nonresidential fire deaths)Actual 4 5.20 5.30 3.30 3.30Target 4.08 4.08 3.50 3.50 4
How Are We DoingThe residential fire death rate in Oregon for calendar year 2019 was 3.30 deaths per million population, which was lower than the target of 4.00 deaths per million population by approximately 18%. Incalendar year 2018, the residential fire death rate was also 3.30 deaths per million population. In calendar year 2017, the rate was 5.30, which exceeded the target (3.50 deaths per million population)by 51 percent.
Factors Affecting ResultsA complex set of variables influence whether a fire incident results in a fatality. The fatality data is contributed by responding fire departments from across the state, all of which have varyingprotection capacities. The Office of State Fire Marshal provides resources to increase prevention capabilities of local responders. The OSFM Analytics & Intelligence Unit’s analysis of fatal firesconsidered fire cause, location, time, property characteristics, victim demographics and socioeconomics, human factors, smoke alarm presence, and sprinkler presence. Fire prevention and life safetyeducation are critical to reducing the number of fire deaths. Socioeconomic, cultural, cognitive, and educational influences affect an individual’s ability to understand how to prevent fires in theirresidences. Cultural differences prevent understanding of the life-saving capacity of smoke alarms and in-home fire prevention habits. Older and low-income housing is less likely to have a sufficientnumber of working smoke alarms. The OSFM works to address these issues in its fire prevention and life safety education programs. In addition, key regulations regarding smoke alarms (OAR837.045), fire standard compliant cigarettes (OAR 837.035), and novelty/toylike lighters (OAR 837.046) were put in place with the intent of reducing fires, injuries, and fatalities. Still, the biggest factoraffecting the results in this area is the awareness and behavior of the individuals in and around a residence that catches fire.
actual target

KPM #13 Customer Satisfaction - Percent of customers rating their satisfaction with the agency customer service as "good" or "excellent": overall customer service, timeliness, accuracy, helpfulness,expertise and availability of information.Data Collection Period: Jan 01 - Dec 31
Report Year 2016 2017 2018 2019 2020
1. TimelinessActual 73% No Data 75% No Data 71%Target 88% TBD 88% TBD 90%2. HelpfulnessActual 91% No Data 94% No Data 100%Target 88% TBD 88% TBD 95%3. ExpertiseActual 95% No Data 99% No Data 96%Target 88% TBD 88% TBD 100%4. Availability of InformationActual 72% No Data 88% No Data 85%Target 88% TBD 88% TBD 90%5. AccuracyActual 86% No Data 95% No Data 94%Target 88% TBD 88% TBD 95%6. OverallActual 81% No Data 90% No Data 89%Target 88% TBD 88% TBD 90%
How Are We Doing
actual target

In 2006, the Oregon State Police conducted its initial customer satisfaction survey of its key stakeholders in consultation with Portland State University and a private contractor to ensure that surveydesign and methods were sound. The agency used the 2006 survey results for customer satisfaction to establish a preliminary baseline target of 88 percent (percent that “agree” or “strongly agree”they are satisfied) for each of the six satisfaction categories: Accuracy; Availability of Information; Expertise; Helpfulness; Timeliness; and Overall Satisfaction with the Department.
In 2018, the Legislature adjusted the targets for each of the six satisfaction categories based on historical performance data. The new targets are as follows:
Accuracy = 95%Availability of Information = 90%Expertise = 100%Helpfulness = 95%Timeliness = 90%Overall Satisfaction = 90%
The most recent survey results showed the Oregon State Police (OSP) improved in five out of six customer satisfaction categories when compared to 2016 data and reflects a similar trend to 2018data:
Accuracy (2020 = 94% | 2018 = 95% | 2016 = 86%)Availability of Information (2020 = 85% | 2018 = 88% | 2016 = 72%)Expertise (2020 = 96% | 2018 = 99% | 2016 = 95%)Helpfulness (2020 = 100% | 2018 = 94% | 2016 = 91%)Timeliness (2020 = 71% | 2018 = 75% | 2016 = 73%)Overall Satisfaction (2020 = 89% | 2018 = 90% | 2016 = 81%)
In five out of the six categories, OSP exceeded or was within five percentage points of the newly established performance targets. In 2016, the Department would not have met any of the newlyestablished targets and would have been within five percentage points in only two categories. If the new targets were applied to 2018 data, the Department would have performed similar to 2020.
Factors Affecting ResultsEvaluation of the respondents’ comments revealed they were satisfied with the Oregon State Police. A reoccurring theme in the comments made by respondents was how dedicated and hard OSPstaff worked to deliver quality services. However, respondents frequently commented how they perceived the agency has having too few resources and/or services to adequately meet the publicsafety sector’s needs. This perception caused some respondents to indicate they were unsatisfied/concerned with the agency’s capability to deliver the necessary services, especially as Oregon’spopulation continues to grow. In particular, this sentiment was reflected in the respondents’ rating of the Department’s Timeliness.
The agency will continue to strive to train and equip staff, to protect and serve the people of Oregon. In addition, the Department will seek ways to leverage technology and partnerships with other lawenforcement partners to enhance the efficiencies and effectiveness of services provided.