© State of Victoria, Melbourne & Olympic Parks Trust 2015. · Melbourne & Olympic Parks, these...
60
ANNUAL REPORT 2015
Transcript of © State of Victoria, Melbourne & Olympic Parks Trust 2015. · Melbourne & Olympic Parks, these...

ANNUAL REPORT 2015

Cover photo supplied by Peter Bennetts.
This report has been printed on 100% post consumer recycled stock.
© State of Victoria, Melbourne & Olympic Parks Trust 2015. This publication is copyright. No part may be reproduced by any process except in accordance with the provisions of the Copyright Act 1968.
CONTENTS
Governance 4
The Chairman’s Report 6
The CEO’s Report 7
Highlights 2014-15 9
Our Partners 11
Financial Overview 12
Financial Statements 13
Administrative Reporting Requirements 56
Disclosure Index 59
GOVERNANCE
EstablishmentThe Melbourne and Olympic Parks Trust (MOPT) was established on 5 October 1995 pursuant to the provisions of the Melbourne and Olympic Parks Act 1985 (as amended). It was created by the merger of the National Tennis Centre Trust (established 13 Nov 1985) and the Olympic Park Committee of Management (formed originally in 1909). The Act is jointly administered by both the Premier of Victoria, the Honourable Daniel Andrews, and the Minister for Tourism and Major Events, the Honourable John Eren.
The Melbourne and Olympic Parks Act 1985
The Purpose of the Act:The purposes of the Act as outlined in Section 3 are:
• To create a Melbourne and Olympic Parks Trust to administer Melbourne Park, Olympic Park and certain other land and facilities for the purposes of tennis, other sports, recreation and entertainment.
• To provide for the management and operation of Melbourne Park and Olympic Park.
• To provide for the use and promotion of Melbourne Park and Olympic Park.
• To provide for the development, promotion, management, operation and use of sports, recreation and entertainment facilities and services in Victoria in addition to those at Melbourne Park and Olympic Park.
Under the Act, the Trust has the following primary functions:
• To accept appointment and act as a committee of management of Crown lands.
• To be responsible for the care, improvement, use and promotion of Melbourne Park and Olympic Park as facilities for tennis, other sports, recreation and entertainment.
• To operate Melbourne Park and Olympic Park efficiently and effectively to obtain the best possible use of the facilities.
• To provide planning for the operation of Melbourne Park and Olympic Park, which is coordinated between the two facilities.
• To be responsible for proper financial management of Melbourne Park and Olympic Park.
• To provide for the planning, development, promotion, management, operation and use of other sports, recreation and entertainment facilities and services in Victoria.
• To provide for the development, promotion, management, operation and use of facilities and services for the parking of vehicles and other necessary services to be used in conjunction with any of the facilities operated or managed by the Trust.
• To provide for the management of Gosch’s Paddock by the Trust as a committee of management under the Crown Lands (Reserves) Act 1978.
Melbourne & Olympic Parks’ Formula for SuccessMelbourne & Olympic Parks' strategic direction is outlined by the following purpose, vision and goals:
PurposeTo administer, manage and promote the use of Melbourne & Olympic Park lands for the purposes of tennis, other sports, recreation and entertainment (Melbourne and Olympic Parks Act).
Vision Melbourne & Olympic Parks – a world class business delivering world class customer experiences.
Our Goals1. Maintain our financial sustainability.
2. Increase benefits to the people of Victoria.
3. Ensure the customer experience is at the heart of everything we do.
4. Grow by expanding into new markets.
5. Transform our business processes to deliver cost effective services.
6. Build an integrated team of talented people who consistently strive to achieve.
4
MEL
BOUR
NE &
OLY
MPI
C PA
RKS
TRUS
T
GOVERNANCE
TRUSTEES
Mr Brian Morris – Chief Executive Officer
Mr Russell Fakira – Director of People & Operations
Mr Greg George – Director of Commercial & Strategy
Ms Enna Giampiccolo – Corporate Communications Manager
Mr Travis Mardling – Chief Financial Officer
Mr Shane Mates – General Manager AAMI Park
Mr Geoff McDonald – Director of Infrastructure
EXECUTIVE TEAM
Mr Russell Caplan (Chairman)
Ms Deborah Beale (to 12 November 2014)
Mr Steve Healy
Ms Sharelle McMahon
Ms Diana Nicholson
Mr Kenneth Roche AO
Mr Raymond Smith
Ms Mikaela Stafrace (from 22 July 2014)
Mr David Stobart
Mr Scott Tanner
Statement of Corporate GovernanceProcedures have been established at the Trust and executive management level, which are designed to safeguard the assets and interests of the Trust and to ensure integrity of reporting. The Trust acknowledges the need for and continued maintenance of the highest standards of corporate governance practice and ethical conduct by all Trustees and employees of the Trust.
Remuneration CommitteeThe Trust has established a Remuneration Committee to govern the Trust’s policy and practice for executive remuneration and to determine the individual remuneration packages for its executive staff. The Committee meets as required and makes recommendations to the Trust on specific issues. The members of the Committee during the year ended 30 June 2015 were:
Mr Russell Caplan (Chair) Ms Diana Nicholson Mr Kenneth Roche AO Mr Raymond Smith
Finance Audit and Risk CommitteeThe Trust has established a Finance Audit and Risk Committee to provide advice in relation to matters falling into the broad areas of:
• financial reporting, accounting policies and internal controls
• risk management
• governance, and
• funding.
The Committee meets monthly, or more often as required, and makes recommendations to the Trust on specific issues.
The members of the Committee during the year ended 30 June 2015 were:
All Finance, Audit and Risk Committee members are independent from management.
Strategic Planning Committee
The Trust’s Strategic Planning Committee is established to provide independent and expert advice to assist the Trust to discharge its strategic planning responsibilities.
The Members of the Committee during the year ended 30 June 2015 were:
Mr Raymond Smith (Chair) Ms Deborah Beale (to 12 November 2014) Mr Russell Caplan
Ms Diana Nicholson Mr Kenneth Roche AO Ms Mikaela Stafrace
Mr Russell Caplan (Chair) Ms Deborah Beale (to 12 November 2014)
Mr Raymond Smith Ms Mikaela Stafrace Mr Scott Tanner
5
MEL
BOUR
NE &
OLY
MPI
C PA
RKS
TRUS
T
THE CHAIRMAN’S REPORT
The Melbourne & Olympic Parks precinct continues to serve our patrons and stakeholders well, while at the same time delivering world class new and expanded facilities in a comprehensive redevelopment set out in the Melbourne Park Master Plan.
The Trust produced positive financial results in FY2015, reporting a net profit of $745,000. This is despite the significant increase in depreciation stemming from the major investment in facilities and non-revenue earning infrastructure and a cyclical downturn in the number of events at Rod Laver Arena, partly offset by an increase in new local music events at Margaret Court Arena and a strong focus on cost control.
Our earnings are reinvested into the precinct, so that it is operated and maintained at a level that enhances its reputation in Melbourne and around the world.
The redevelopment of Melbourne Park continued throughout the year. Stage 1 of the Master Plan was completed with the opening of the refurbished Margaret Court Arena, now a genuine, multi-purpose venue with a distinctive retractable roof. Melbourne Park is the only tennis Grand Slam venue in the world with three operable roofs, allowing play to continue regardless of the weather - an important contributor to the ongoing success of the Australian Open.
In February, construction began on a new building that will house meeting rooms, production spaces, a media centre for events and offices for Tennis Australia and for the Melbourne & Olympic Parks team. Design work also began on the new footbridge connecting Melbourne Park and Birrarung Marr, Flinders Street Station and the CBD.
Rod Laver Arena is nearing its 30th birthday and as part of the Master Plan will undergo a comprehensive refurbishment to benefit patrons, players and performers and to ensure it retains its preeminent global standing. In June, the Victorian Government unveiled the designs prepared by Cox Architects and work will begin following the 2016 Australian Open. The refurbishment is part of the already announced Stage 2 funding of the Melbourne Park redevelopment, to which the Trust is contributing $40 million. The Trust appreciates the support provided by successive Victorian Governments to ensure that Melbourne & Olympic Parks maintains its world class venue status.
The 2015 Australian Open was again a great success, attended by a record 703,899 patrons. Margaret Court Arena was acclaimed as a wonderful new addition to the tournament, thrilling fans with its superior comfort and up-close-and-personal viewing. Hisense Arena with its more than 10,000 seats was opened up this year to the public as a general admission area. This along with increased external court seating and shade areas provided tennis fans with more options and opportunity to view outstanding tennis for the price of a ground pass. Both Tennis Australia and M&OP staff deserve congratulations for conducting yet another outstanding tournament and ensuring the safety, comfort and enjoyment of all attendees.
AAMI Park also had an unforgettable year. It hosted the biggest football tournament ever played in Australia - the Asian Cup. More than 125,000 soccer fans attended AAMI Park throughout January to witness first class football. AAMI Park in all its glory
was beamed into hundreds of millions of homes across the world, delivering the most incredible advertisement for our venue and its award-winning pitch. In May, the stadium hosted the A-League Grand Final which resulted in Melbourne Victory defeating Sydney FC. This was the perfect way to cap off an incredible year for the AAMI Park team.
Hisense Arena continues to cement its reputation as an outstanding venue for indoor sports. This year saw the introduction of a centre hung video cube and enhanced audio capability, improving the game experience in-line with international trends. Both home teams, the Melbourne Vixens and Melbourne United continue to grow. The velodrome was also in action this year with the hosting of the 117th Austral Wheelrace.
Construction is now well advanced on the new Collingwood Football Club Community Facility at Olympic Park. The centre will provide new public amenities, sports change rooms and a health and wellness facility. As a part of the ongoing enhancement of Melbourne & Olympic Parks, these facilities will provide greater recreational opportunities for the public, for schools and for sporting and community groups.
I would like to express my thanks to the Premier of Victoria, the Honourable Daniel Andrews, and the Minister for Tourism and Major Events, the Honourable John Eren, for their strong, continued support for Melbourne & Olympic Parks. The Trust deeply appreciates the bipartisan backing of the precinct in the Parliament.
I would like also to record the Trust’s appreciation to CEO Brian Morris and the team at Melbourne & Olympic Parks for their expertise and their commitment to delivering exceptional guest experiences, despite the ongoing challenges presented by the major redevelopment works.
Finally, thanks to my fellow Trustees for their contribution and support and, in particular, thanks to Deborah Beale who completed her term as a Trustee in the last year. She made an outstanding contribution as a member of the Finance Audit and Risk Committee and the Strategic Planning Committee, and I thank her very much for all her hard work and drive.
In accordance with the Financial Management Act 1994, I am pleased to present the Report of Operations for the Melbourne and Olympic Parks Trust for the year ending 30 June 2015.
Russell Caplan
6
MEL
BOUR
NE &
OLY
MPI
C PA
RKS
TRUS
T
THE CEO’S REPORT
In January, Melbourne & Olympic Parks was front and centre on the world’s stage as we simultaneously delivered two international sporting tournaments, each generating priceless global broadcast coverage and cementing our reputation as an unbeatable sport and entertainment precinct. A record-breaking Australian Open, the fortnight-long Asian Cup (football) as well as the opening of Margaret Court Arena as a sport and entertainment venue, made for an unforgettable 2015 financial year.
Overall PerformanceThe Trust reported a positive result with a net profit after depreciation of $745,000. The year ended with earnings (EBITDA) of $31.617 million which was 2 per cent down on the prior year due mainly to a slowdown in the international live music touring market. This had a significant impact on Rod Laver Arena earnings, which were partly offset by the strong performance of AAMI Park, Margaret Court Arena and Hisense Arena. A concentration on cost management also helped to maintain profitability.
The precinct total of 194 stadium and arena event days was slightly up on the prior year figure of 191. Total number of contracted days ie, the number of days our venues were booked by hirers increased from 213 last year to 237 in 2014/15.
Australian OpenA record 703,899 patrons broke the attendance record at the 2015 Australian Open. The Melbourne weather provided perfect conditions, helping to lure almost 70,000 more fans to the event than the prior year. Margaret Court Arena made its debut at the Australian Open as a new venue and received high praise for its stylish design and exceptional patron amenities. Hisense Arena was opened to the public this year to allow ground passes to witness some of the biggest stars in action. During the second week, Hisense Arena was transformed into a Disney activation, providing families with a great new option as part of the tennis experience.
Rod Laver ArenaIn total Rod Laver Arena attracted 597,045 patrons over 52 event days. Katy Perry performed eight capacity shows, providing delighted fans with a series of fun, energetic and thoroughly entertaining concerts. This year we also saw the return of music legends, The Eagles, John Farnham and Olivia Newton-John, Rod Stewart and the ever-popular, Kylie Minogue.
As set out in the Melbourne Park Master Plan, the next phase of the $700 million transformation of our site includes a comprehensive refurbishment of our much-loved Rod Laver Arena. Early designs were released to the public in June and were met with much excitement from industry and the general public. Rod Laver Arena was opened in 1988 and at the time was seen as ground breaking with its opening roof and modern facilities. However, the needs of patrons and the entertainment landscape have changed considerably since then and we welcome refurbishments that will ensure Rod Laver Arena remains in the top echelon of multi-purpose arenas worldwide.
Hisense Arena
In total, Hisense Arena attracted 259,325 patrons to 54 event days, six event days up on 2013/14. Sport continues to be a primary focus for this arena with ongoing investments in improving the team and patron experience.
Netball and basketball again proved the major drawcard; with the Melbourne Vixens and Melbourne United each continuing to draw good crowds throughout their seasons. During the year the venue team introduced patrons to the “Cube”, a four-sided viewing and entertainment platform designed to improve the game experience. The pilot proved successful and the Trust will now invest in new technology to add an exciting dimension to the viewing experience of indoor sports at Hisense Arena.
In December, the world’s best cyclists returned to the velodrome at Hisense Arena to compete in the 117th Austral Wheelrace while in May, following a successful first year in FY2014, we saw the return of the Australian Gymnastics Championships.
The arena’s versatility was brought to the fore throughout the year with: electronic dance music events, Disney on Ice and Dancesports also adding to the long list of varied events at Hisense Arena.
AAMI ParkA total of 84 event days drew 855,872 patrons to AAMI Park in a year where the stadium hosted the Asian Cup, an A-League Grand Final and two Monster Jam events.
The transformation of AAMI Park to a monster truck obstacle course captured the imagination of many, with more than 40,000 people attending the two shows. Meticulous preparation ensured the stadium’s award-winning pitch was well-equipped to handle the 3.5-metre tall, five-tonne machines. Dedicated crews worked around the clock to build a custom-designed racetrack from 3,000 cubic metres of dirt, dropped into the stadium specifically for the event.
In November, the AAMI Park pitch was replaced – the first time since the stadium opened in 2010. The refurbishment ensured the pitch was in optimum condition for the seven Asian Cup games at AAMI Park in January.
AAMI Park hosted the Asian Cup opening ceremony, where a sold-out sea of yellow and green football fans cheered on the Socceroos to victory. More than 125,000 fans attended the seven matches at the stadium – an outstanding result and an excellent advertisement for the game.
The A-League Grand Final was also hosted at AAMI Park, with a thrilling premiership win by home club, Melbourne Victory. Congratulations to Ian Robson, Kevin Muscat and all of the team at Melbourne Victory.
Our other stadium teams, Melbourne City, Melbourne Storm and Melbourne Rebels also enjoyed strong performances and growing game attendances.
7
MEL
BOUR
NE &
OLY
MPI
C PA
RKS
TRUS
T
Margaret Court Arena
This year saw the opening of Margaret Court Arena as a venue in its own right, following its stunning transformation from an outdoor showcourt to an arena in its own right. A number of test events were held in October, followed by the first commercial event in November – an NBL game between Melbourne United and the Cairns Taipans. Australian hip-hop pioneers the Hilltop Hoods were the first ticketed act to grace the stage when they brought their ‘Cosby Sweater Tour’ to the arena in late 2014.
A total of 101,075 patrons attended 16 event days at Margaret Court Arena, which was well above expectations and an excellent indication the arena is an exciting new addition to Melbourne’s live music scene. The boutique arena provides an intimate atmosphere and world-class sound, and can accommodate around 6,500 people when in concert mode.
Melbourne United and Melbourne Vixens have also played a selection of matches from their respective fixtures at Margaret Court Arena, which again proves the flexibility of our venues in hosting a wide range of sport and entertainment events.
Community Activities
The Trust continues to strengthen its connection to the community both through the provision of quality parkland, public open space and support for community activities.
This year Rod Laver Arena featured in Open House Melbourne which provided a rare and exclusive behind the scenes tour of the arena, taking in backstage areas, green rooms and Australian Open change rooms. Staff who acted as guides provided visitors with personal anecdotes, which added to the unique experience.
Three other community events were supported by Melbourne & Olympic Parks, including the Great Amazing Race (raising money for the Royal Children’s Hospital Foundation), the Seven Parks Walk (mass participation event, raising funds for the Cancer Council Victoria) and the Rapid Ascent CityTrail (participation event utilising the unique footprint of the precinct).
Two charity partnerships were signed this year. Melbourne & Olympic Parks continued to strengthen its relationship with its charity partner Alkira, delivering programs in support of those with an intellectual disability. An Alkira student completed an eight-week work placement with M&OP’s Horticulture team in FY2015, helping to build work-ready skills. A new partnership with Whitelion – an organisation working to support at-risk youth – was also started this year.
Capital Projects & Infrastructure
The Trust currently has assets under management of $1.3 billion, requiring an intensive maintenance and capital replacement regime. During the year the more than $17.9 million was spent or committed by the Trust on capital works to improve and upgrade facilities and infrastructure. The Trust also committed $40 million to the Stage 2 Master Plan Redevelopment.
Some significant projects undertaken by the Trust during the year included:
• upgrades to the concourse, lifts, plant, catering and the operable roof at Rod Laver Arena
• improvements to the Hisense Arena concourse and patron amenities
• significant improvements to plant and lifts in Rod Laver Arena
• AAMI Park pitch replacement and retail improvements, and
• amenity refurbishments at the Melbourne Park Function Centre.
Works began on the Stage 2 of the Melbourne Park Master Plan with all three significant projects underway. Construction of the new administration building to the north of the site is advancing well, so too is the design and planning for the new bridge connecting Birrarung Marr to Melbourne Park and for the extensive upgrades to Rod Laver Arena.
Gosch’s PaddockGosch’s Paddock continues to be used for training by Melbourne Football Club, Melbourne Victory and Melbourne Storm, as well as a variety of other organisations. Its fields and surrounds are open for public use when not used for formal training. Annual renovations were carried out on all the pitches to ensure they were maintained to a high standard. Except for the small areas under maintenance, Gosch’s Paddock was not closed to the public during the year.
Health & SafetyM&OP continues its strong commitment to health and safety, this year maintaining its AS4801 accreditation for Safety Management Systems. Employee, patron and tenant safety continues to be an important focus in event planning, event delivery and in the workplace.
Finally, my deep appreciation to the Chairman of the Trust, Russell Caplan and all of the Trustees, Dr Peter Hertan from Major Sporting Events at the Department of Economic Development, Jobs, Transport and Resources, Tim Bamford at Major Projects Victoria, and their respective teams, for their support during the year. A special thanks to the Melbourne & Olympic Parks team who should feel very proud of the role they are playing at this very significant time in the history of the precinct.
Brian Morris
THE CEO’S REPORT
8
MEL
BOUR
NE &
OLY
MPI
C PA
RKS
TRUS
T
HIGHLIGHTS 2014-2015
Events
Rod Laver ArenaInternational Ice HockeyWWE 2014Lady GagaQueen + Adam Lambert Kanye WestRobbie WilliamsGabriel IglesiasAndrea BocelliThe Footy Show Grand Final EditionMiley CyrusThe Rolling StonesMariah CareyKaty PerryThe WigglesSting & Paul Simon on Stage TogetherRoxetteGuy SebastianThe Eagles DrakeLady AntebellumKylie MinogueRod StewartRussell PetersEd SheeranJohn Farnham & Oliva Newton-JohnThe ScriptRicky MartinBackstreet BoysAlt – JMotley CrueNickelbackSpandau Ballet
2015 Ice Hockey Classic5 Seconds of Summer
Hisense ArenaDisney on Ice Presents – Treasure TroveThe Voice LiveStory NightVictorian State School Spectacular 2014Australia v New Zealand International Test MatchThe Madden BrothersMundine v Rabchenko69th Australian DanceSport Championship 2014The Austral WheelraceA State of TranceWalking with DinosaursPlanetshakers Conference 20152015 Australian Gymnastic ChampionshipsAtlantisX-Factor Auditions 2015Melbourne United – NBL (7 home games)Vixens – ANZ Championships (4 home games)
AAMI ParkMelbourne City – Hyundai A-League (13 home matches)Melbourne Rebels – Super Rugby (8 home matches)Melbourne Rising – National Rugby Championship (4 home matches and 1 final)
Melbourne Storm – NRL (11 home matches and 1 final)Melbourne Victory – Hyundai A-League (8 home matches)Monster Jam (2 shows)Rugby League 4 Nations – Australia v EnglandAFC Asian Cup 2015 (7 matches)Hyundai A-League Grand Final – Melbourne Victory v Sydney FC
Margaret Court ArenaMushroom Free for All Hilltop HoodsLaura PausiniAngus & Julia StoneBilly Idol AmplifyDemi LovatoBen HowardHarlem GlobetrottersMelbourne United – NBL (4 home games)Vixens – ANZ Championships (3 home games)
Melbourne ParkAustralian Open 2015 (19 Jan - 1 Feb 2015)
Key Statistics
2014/15 2013/14 Number of contracted days - Melbourne Park arenas 237 213 Number of contracted days - AAMI Park 84 58Number of contracted days - Melbourne Park Function Centre 123 159 Total ticketed patronage 2,518,843 2,431,567Rod Laver Arena event ticketed attendance 597,045 914,387 Hisense Arena event ticketed attendance 259,325 202,667 AAMI Park event ticketed attendance 855,872* 674,059 Margaret Court Arena (opened in November 2014) 101,075 N/AMelbourne Park Function Centre patrons 67,994 89,532 Attendance at Australian Open 703,899 640,454 Number of website visitors (all M&OP sites) 1,139,786 1,086,694
*including 125,368 at the Asian Cup9
MEL
BOUR
NE &
OLY
MPI
C PA
RKS
TRUS
T
HIGHLIGHTS 2014-2015
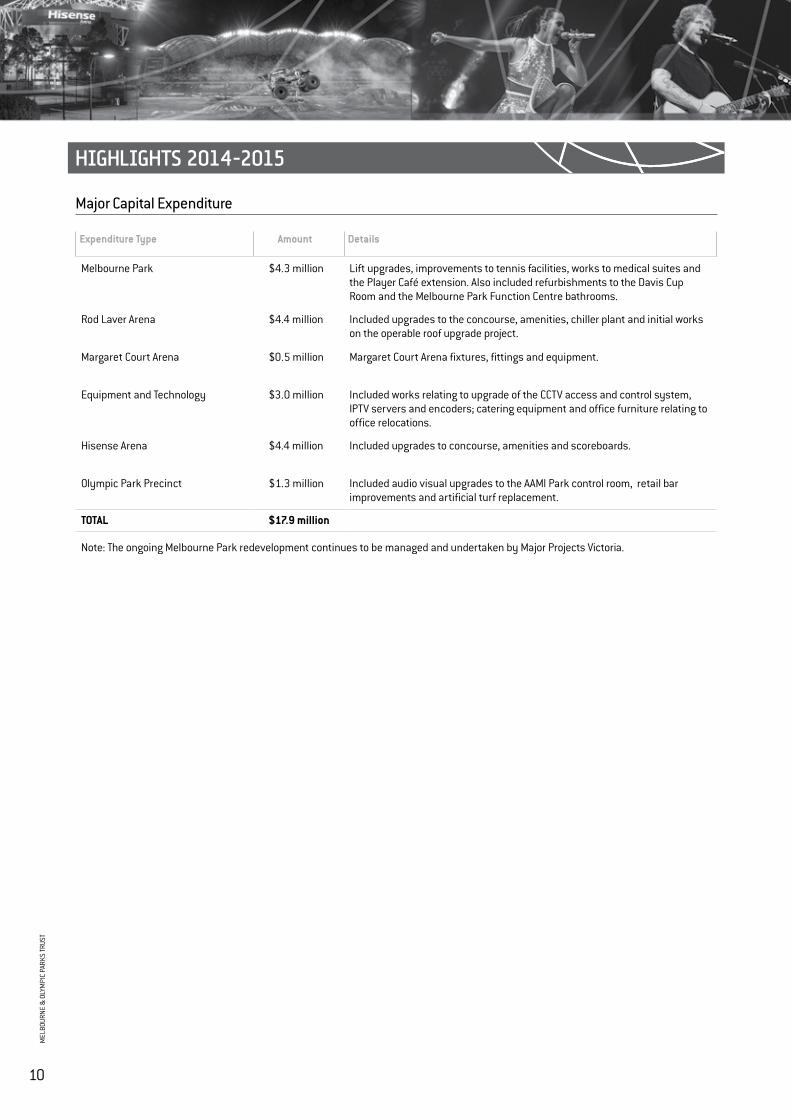
Major Capital Expenditure
Expenditure Type Amount Details
Melbourne Park $4.3 million Lift upgrades, improvements to tennis facilities, works to medical suites and the Player Café extension. Also included refurbishments to the Davis Cup Room and the Melbourne Park Function Centre bathrooms.
Rod Laver Arena $4.4 million Included upgrades to the concourse, amenities, chiller plant and initial works on the operable roof upgrade project.
Margaret Court Arena $0.5 million Margaret Court Arena fixtures, fittings and equipment.
Equipment and Technology $3.0 million Included works relating to upgrade of the CCTV access and control system, IPTV servers and encoders; catering equipment and office furniture relating to office relocations.
Hisense Arena $4.4 million Included upgrades to concourse, amenities and scoreboards.
Olympic Park Precinct $1.3 million Included audio visual upgrades to the AAMI Park control room, retail bar improvements and artificial turf replacement.
TOTAL $17.9 million
Note: The ongoing Melbourne Park redevelopment continues to be managed and undertaken by Major Projects Victoria.
10
MEL
BOUR
NE &
OLY
MPI
C PA
RKS
TRUS
T
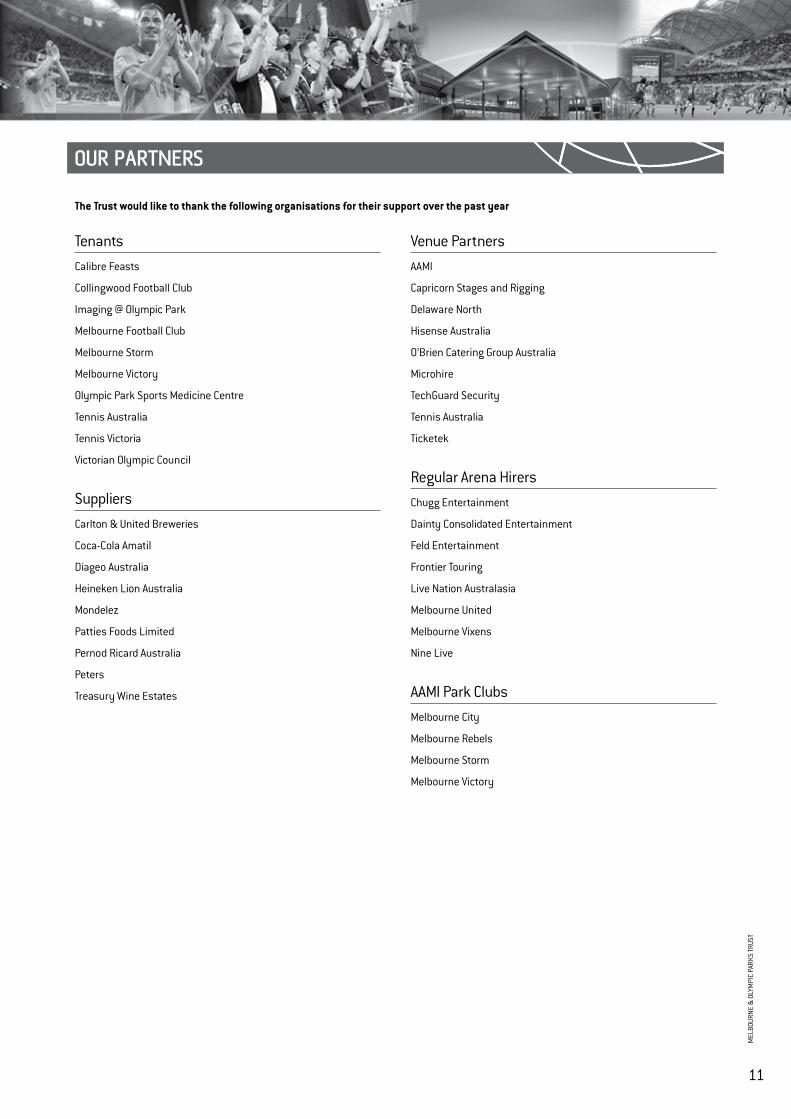
OUR PARTNERS
The Trust would like to thank the following organisations for their support over the past year
TenantsCalibre Feasts
Collingwood Football Club
Imaging @ Olympic Park
Melbourne Football Club
Melbourne Storm
Melbourne Victory
Olympic Park Sports Medicine Centre
Tennis Australia
Tennis Victoria
Victorian Olympic Council
SuppliersCarlton & United Breweries
Coca-Cola Amatil
Diageo Australia
Heineken Lion Australia
Mondelez
Patties Foods Limited
Pernod Ricard Australia
Peters
Treasury Wine Estates
Venue PartnersAAMI
Capricorn Stages and Rigging
Delaware North
Hisense Australia
O’Brien Catering Group Australia
Microhire
TechGuard Security
Tennis Australia
Ticketek
Regular Arena HirersChugg Entertainment
Dainty Consolidated Entertainment
Feld Entertainment
Frontier Touring
Live Nation Australasia
Melbourne United
Melbourne Vixens
Nine Live
AAMI Park ClubsMelbourne City
Melbourne Rebels
Melbourne Storm
Melbourne Victory
11
MEL
BOUR
NE &
OLY
MPI
C PA
RKS
TRUS
T
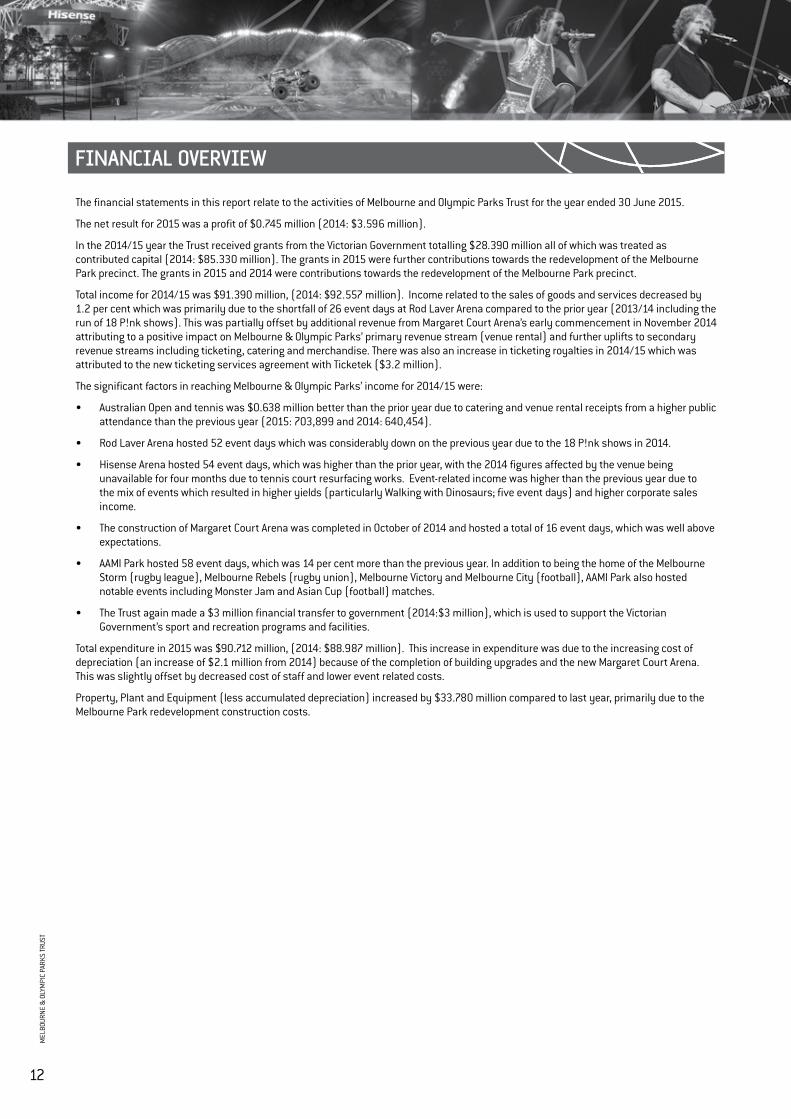
FINANCIAL OVERVIEW
The financial statements in this report relate to the activities of Melbourne and Olympic Parks Trust for the year ended 30 June 2015.
The net result for 2015 was a profit of $0.745 million (2014: $3.596 million).
In the 2014/15 year the Trust received grants from the Victorian Government totalling $28.390 million all of which was treated as contributed capital (2014: $85.330 million). The grants in 2015 were further contributions towards the redevelopment of the Melbourne Park precinct. The grants in 2015 and 2014 were contributions towards the redevelopment of the Melbourne Park precinct.
Total income for 2014/15 was $91.390 million, (2014: $92.557 million). Income related to the sales of goods and services decreased by 1.2 per cent which was primarily due to the shortfall of 26 event days at Rod Laver Arena compared to the prior year (2013/14 including the run of 18 P!nk shows). This was partially offset by additional revenue from Margaret Court Arena’s early commencement in November 2014 attributing to a positive impact on Melbourne & Olympic Parks’ primary revenue stream (venue rental) and further uplifts to secondary revenue streams including ticketing, catering and merchandise. There was also an increase in ticketing royalties in 2014/15 which was attributed to the new ticketing services agreement with Ticketek ($3.2 million).
The significant factors in reaching Melbourne & Olympic Parks’ income for 2014/15 were:
• Australian Open and tennis was $0.638 million better than the prior year due to catering and venue rental receipts from a higher public attendance than the previous year (2015: 703,899 and 2014: 640,454).
• Rod Laver Arena hosted 52 event days which was considerably down on the previous year due to the 18 P!nk shows in 2014.
• Hisense Arena hosted 54 event days, which was higher than the prior year, with the 2014 figures affected by the venue being unavailable for four months due to tennis court resurfacing works. Event-related income was higher than the previous year due to the mix of events which resulted in higher yields (particularly Walking with Dinosaurs; five event days) and higher corporate sales income.
• The construction of Margaret Court Arena was completed in October of 2014 and hosted a total of 16 event days, which was well above expectations.
• AAMI Park hosted 58 event days, which was 14 per cent more than the previous year. In addition to being the home of the Melbourne Storm (rugby league), Melbourne Rebels (rugby union), Melbourne Victory and Melbourne City (football), AAMI Park also hosted notable events including Monster Jam and Asian Cup (football) matches.
• The Trust again made a $3 million financial transfer to government (2014:$3 million), which is used to support the Victorian Government’s sport and recreation programs and facilities.
Total expenditure in 2015 was $90.712 million, (2014: $88.987 million). This increase in expenditure was due to the increasing cost of depreciation (an increase of $2.1 million from 2014) because of the completion of building upgrades and the new Margaret Court Arena. This was slightly offset by decreased cost of staff and lower event related costs.
Property, Plant and Equipment (less accumulated depreciation) increased by $33.780 million compared to last year, primarily due to the Melbourne Park redevelopment construction costs.
12
MEL
BOUR
NE &
OLY
MPI
C PA
RKS
TRUS
T
MELBOURNE & OLYMPIC PARKS TRUSTFINANCIAL STATEMENTS
Comprehensive Operating StatementBalance SheetStatement of Changes in EquityCash Flow StatementFinancial Year Ended 30 June 2015
13
MEL
BOUR
NE &
OLY
MPI
C PA
RKS
TRUS
T
NOTE 2015 $’000
2014 $’000
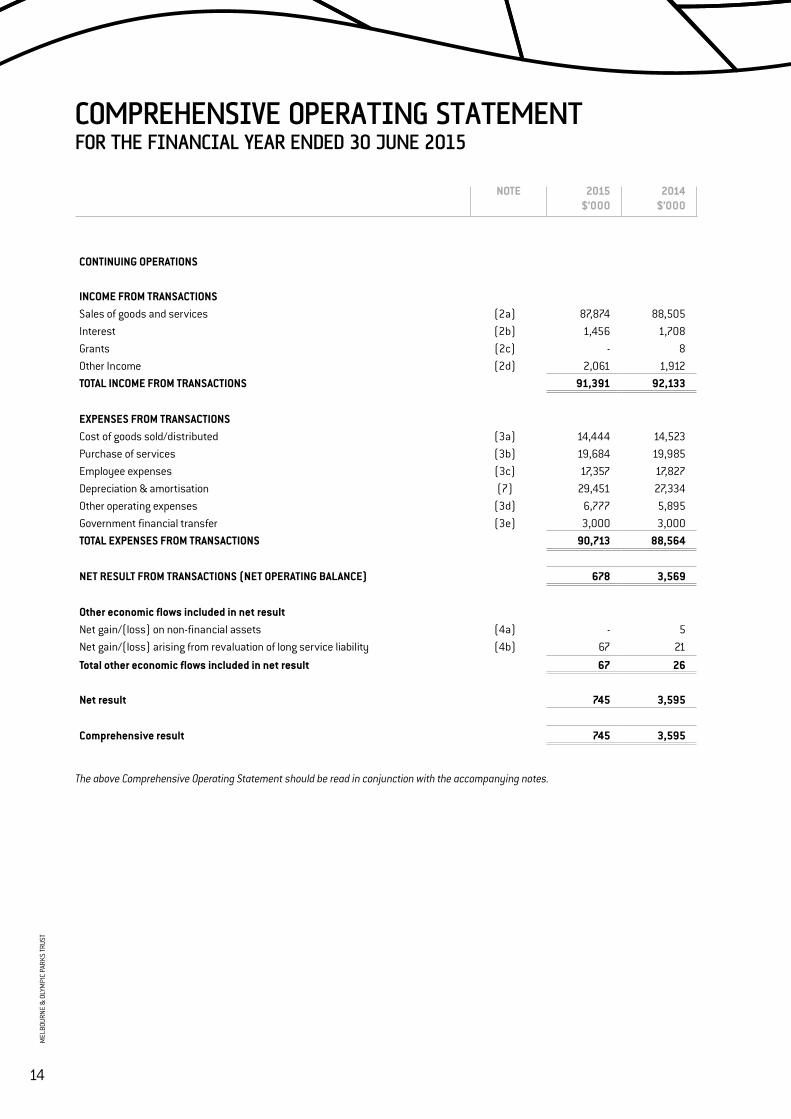
CONTINUING OPERATIONS
INCOME FROM TRANSACTIONSSales of goods and services (2a) 87,874 88,505 Interest (2b) 1,456 1,708 Grants (2c) - 8 Other Income (2d) 2,061 1,912 TOTAL INCOME FROM TRANSACTIONS 91,391 92,133
EXPENSES FROM TRANSACTIONSCost of goods sold/distributed (3a) 14,444 14,523 Purchase of services (3b) 19,684 19,985 Employee expenses (3c) 17,357 17,827 Depreciation & amortisation (7) 29,451 27,334 Other operating expenses (3d) 6,777 5,895 Government financial transfer (3e) 3,000 3,000 TOTAL EXPENSES FROM TRANSACTIONS 90,713 88,564
NET RESULT FROM TRANSACTIONS (NET OPERATING BALANCE) 678 3,569
Other economic flows included in net resultNet gain/(loss) on non-financial assets (4a) - 5 Net gain/(loss) arising from revaluation of long service liability (4b) 67 21
Total other economic flows included in net result 67 26
Net result 745 3,595
Comprehensive result 745 3,595
The above Comprehensive Operating Statement should be read in conjunction with the accompanying notes.
COMPREHENSIVE OPERATING STATEMENTFOR THE FINANCIAL YEAR ENDED 30 JUNE 2015
14
MEL
BOUR
NE &
OLY
MPI
C PA
RKS
TRUS
T
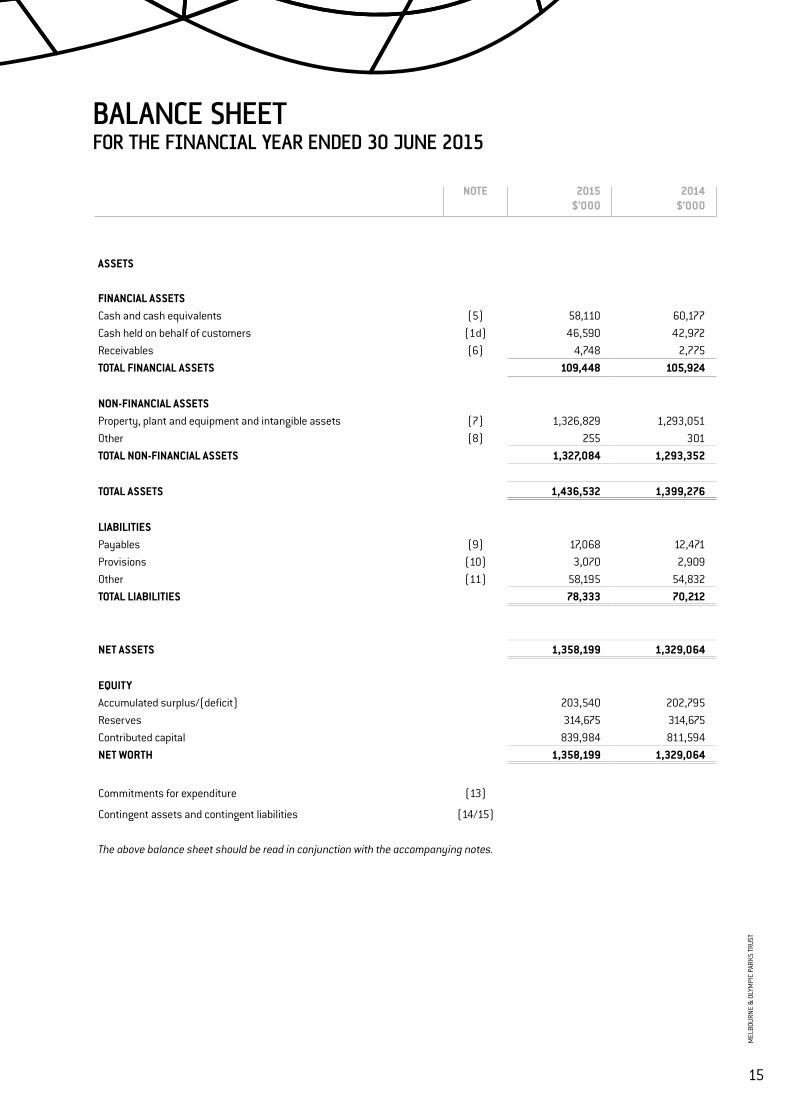
BALANCE SHEETFOR THE FINANCIAL YEAR ENDED 30 JUNE 2015
NOTE 2015 $’000
2014 $’000
ASSETS
FINANCIAL ASSETSCash and cash equivalents (5) 58,110 60,177 Cash held on behalf of customers (1d) 46,590 42,972 Receivables (6) 4,748 2,775 TOTAL FINANCIAL ASSETS 109,448 105,924
NON-FINANCIAL ASSETSProperty, plant and equipment and intangible assets (7) 1,326,829 1,293,051 Other (8) 255 301 TOTAL NON-FINANCIAL ASSETS 1,327,084 1,293,352
TOTAL ASSETS 1,436,532 1,399,276
LIABILITIESPayables (9) 17,068 12,471 Provisions (10) 3,070 2,909 Other (11) 58,195 54,832 TOTAL LIABILITIES 78,333 70,212
NET ASSETS 1,358,199 1,329,064
EQUITYAccumulated surplus/(deficit) 203,540 202,795 Reserves 314,675 314,675 Contributed capital 839,984 811,594 NET WORTH 1,358,199 1,329,064
Commitments for expenditure (13)
Contingent assets and contingent liabilities (14/15)
The above balance sheet should be read in conjunction with the accompanying notes.
15
MEL
BOUR
NE &
OLY
MPI
C PA
RKS
TRUS
T
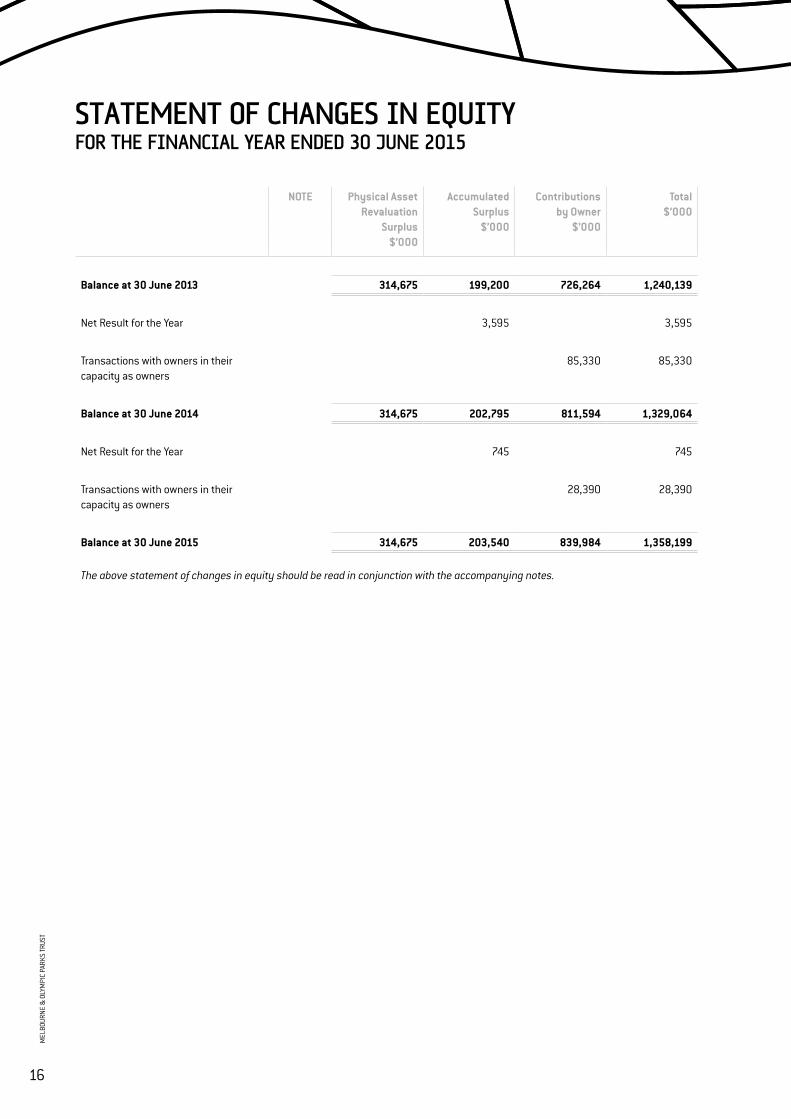
STATEMENT OF CHANGES IN EQUITYFOR THE FINANCIAL YEAR ENDED 30 JUNE 2015
NOTE Physical AssetRevaluation
Surplus$’000
AccumulatedSurplus
$’000
Contributions by Owner
$’000
Total$’000
Balance at 30 June 2013 314,675 199,200 726,264 1,240,139
Net Result for the Year 3,595 3,595
Transactions with owners in their capacity as owners
85,330 85,330
Balance at 30 June 2014 314,675 202,795 811,594 1,329,064
Net Result for the Year 745 745
Transactions with owners in their capacity as owners
28,390 28,390
Balance at 30 June 2015 314,675 203,540 839,984 1,358,199
The above statement of changes in equity should be read in conjunction with the accompanying notes.
16
MEL
BOUR
NE &
OLY
MPI
C PA
RKS
TRUS
T
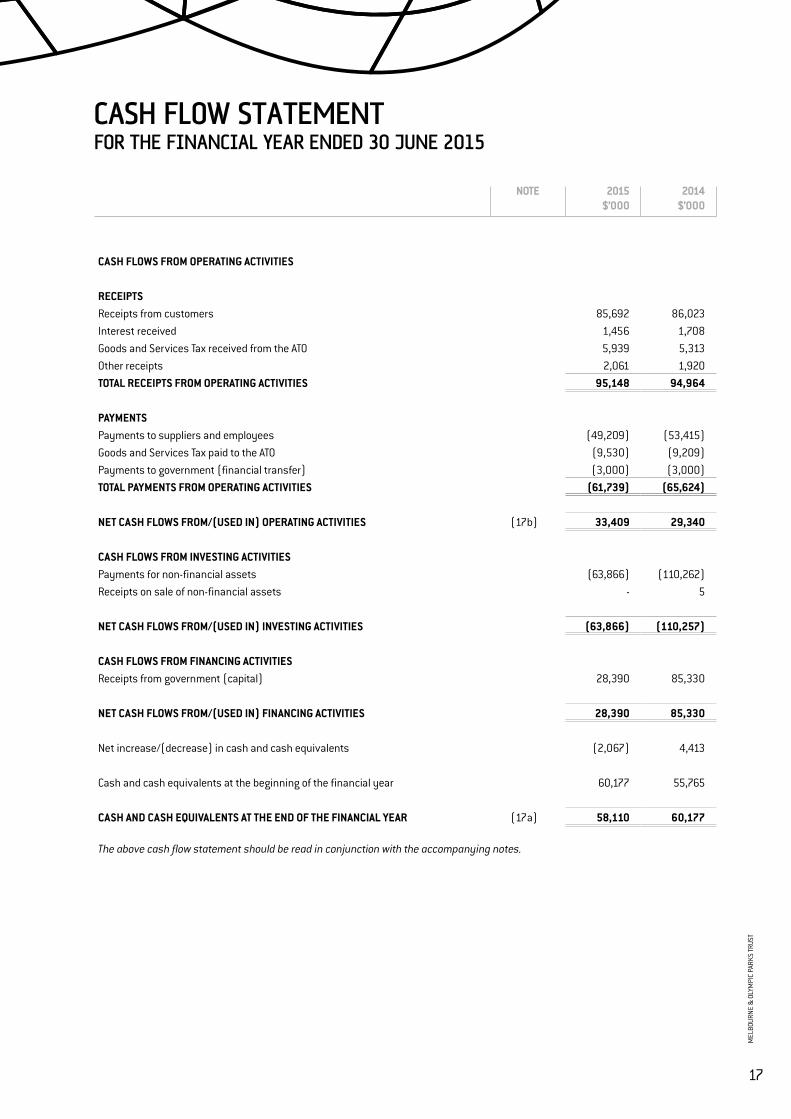
CASH FLOW STATEMENTFOR THE FINANCIAL YEAR ENDED 30 JUNE 2015
NOTE 2015 $’000
2014 $’000
CASH FLOWS FROM OPERATING ACTIVITIES
RECEIPTSReceipts from customers 85,692 86,023 Interest received 1,456 1,708 Goods and Services Tax received from the ATO 5,939 5,313 Other receipts 2,061 1,920 TOTAL RECEIPTS FROM OPERATING ACTIVITIES 95,148 94,964
PAYMENTSPayments to suppliers and employees (49,209) (53,415) Goods and Services Tax paid to the ATO (9,530) (9,209) Payments to government (financial transfer) (3,000) (3,000) TOTAL PAYMENTS FROM OPERATING ACTIVITIES (61,739) (65,624)
NET CASH FLOWS FROM/(USED IN) OPERATING ACTIVITIES (17b) 33,409 29,340
CASH FLOWS FROM INVESTING ACTIVITIESPayments for non-financial assets (63,866) (110,262) Receipts on sale of non-financial assets - 5
NET CASH FLOWS FROM/(USED IN) INVESTING ACTIVITIES (63,866) (110,257)
CASH FLOWS FROM FINANCING ACTIVITIESReceipts from government (capital) 28,390 85,330
NET CASH FLOWS FROM/(USED IN) FINANCING ACTIVITIES 28,390 85,330
Net increase/(decrease) in cash and cash equivalents (2,067) 4,413
Cash and cash equivalents at the beginning of the financial year 60,177 55,765
CASH AND CASH EQUIVALENTS AT THE END OF THE FINANCIAL YEAR (17a) 58,110 60,177
The above cash flow statement should be read in conjunction with the accompanying notes.
17
MEL
BOUR
NE &
OLY
MPI
C PA
RKS
TRUS
T
NOTES TO FINANCIAL STATEMENTSFOR THE FINANCIAL YEAR ENDED 30 JUNE 2015
1. SUMMARY OF SIGNIFICANT ACCOUNTING POLICIES
(a) Statement of ComplianceThese general-purpose financial statements have been prepared in accordance with the Financial Management Act 1994 (FMA), applicable Australian Accounting Standards (AAS), which includes the Australian accounting standards issued by the Australian Accounting Standards Board (AASB). In particular, they are presented in a manner consistent with the requirements of AASB 1049 Whole of Government and General Government Sector Financial Reporting.
Where appropriate, those AASs paragraphs applicable to not-for-profit entities have been applied.
Accounting policies are selected and applied in a manner which ensures that the resulting financial information satisfies the concepts of relevance and reliability, thereby ensuring that the substance of the underlying transactions or other events is reported.
To gain a better understanding of the terminology used in this report, a glossary of terms and style conventions can be found in Note 23.
(b) Basis of accounting preparation and measurementThe accrual basis of accounting has been applied in the preparation of these financial statements whereby assets, liabilities, equity, income and expenses are recognised in the reporting period to which they relate, regardless of when cash is received or paid.
Judgements, estimates and assumptions are required to be made about the carrying values of assets and liabilities that are not readily apparent from other sources. The estimates and associated assumptions are based on professional judgements derived from historical experience and various other factors that are believed to be reasonable under the circumstances. Actual results may differ from these estimates.
The estimates and underlying assumptions are reviewed on an ongoing basis. Revisions to accounting estimates are recognised in the period in which the estimate is revised if the revision affects only that period or in the period of the revision, and future periods if the revision affects both current and future periods. Judgements and assumptions made by management in the application of AASs that have significant effects on the financial statements and estimates relate to:
• the fair value of land, buildings, infrastructure, plant and equipment, (refer to Note 1(j)), and
• actuarial assumptions for employee benefit provisions based on likely tenure of existing staff, patterns of leave claims, future salary movements and future discount rates (refer to Note 1(k)).
Consistent with AASB 13 Fair Value Management, Melbourne and Olympic Parks Trust (the Trust) determines the policies and procedures for recurring fair value measurements for property, plant and equipment, in accordance with the requirements of AASB 13 and the relevant Financial Reporting Directions.
All assets and liabilities for which fair value is measured or disclosed in the financial statements are categorised within the fair value hierarchy, described as follows, based on the lowest level input that is significant to the fair value measurement as a whole:
• Level 1 – Quoted (unadjusted) market prices in active markets for identical assets or liabilities;
• Level 2 – Valuation techniques for which the lowest level input that is significant to the fair value measurement is directly or indirectly observable; and
• Level 3 – Valuation techniques for which the lowest level input that is significant to the fair value measurement is unobservable.
For the purpose of fair value disclosures, the Trust has determined classes of assets and liabilities based on the nature, characteristics and risks of the asset or liability and the level of the fair value hierarchy as explained above.
In addition, the Trust determines whether transfers have occurred between levels in the hierarchy by re-assessing categorisation (based on the lowest level input that is significant to the fair value measurement as a whole) at the end of each reporting period.
The Valuer-General Victoria (VGV) is the Trust’s independent valuation agency. VGV has utilised the services of Napier & Blakeley, a third party valuer to determine fair value of the Trust’s assets.
The Trust, in conjunction with VGV (and Napier & Blakeley), monitors changes in the fair value of each asset and liability through relevant data sources to determine whether revaluation is required.
These financial statements are presented in Australian dollars, the functional and presentation currency of the Trust.
The accounting policies set out below have been applied in preparing the financial statements for the year ended 30 June 2015 and the comparative information presented for the year ended 30 June 2014.
(c) Reporting entityThe financial statements cover the Trust as an individual reporting entity. The Trust is a government agency of the State of Victoria, established pursuant to the provisions of the Melbourne and Olympic Parks Act 1985. Its principal address is:
Melbourne and Olympic Parks TrustBatman AvenueMelbourne VIC 3001
(d) Scope and presentations of financial statementsComprehensive Operating StatementThe Comprehensive Operating Statement comprises three components, being ‘net result from transactions’ (or termed as ‘net operating balance’), ‘other economic flows included in net result’, as well as ‘other economic flows – other comprehensive income’. The sum of the former two, together with the net result from discontinued operations, represents the net result.
18
MEL
BOUR
NE &
OLY
MPI
C PA
RKS
TRUS
T
NOTES TO FINANCIAL STATEMENTSFOR THE FINANCIAL YEAR ENDED 30 JUNE 2015
The net result is equivalent to profit or loss derived in accordance with AASs.
‘Other economic flows’ are changes arising from market remeasurements. They include:
• gains and losses from disposals of non-financial assets
• revaluations and impairments of non-financial physical and tangible assets
• remeasurement arising from defined benefit superannuation plans
• fair value changes of financial instruments and agricultural assets, and
• depletion of natural assets (non-produced) from their use or removal.
This classification is consistent with the whole of government reporting format and is allowed under AASB 101 Presentation of Financial Statements.
Refer to Note 23 Glossary for the definitions of ‘net result from transactions, ‘other economic flows included in net result’ and ‘other economic flows – other comprehensive income’.
Balance sheetAssets and liabilities are presented in liquidity order with assets aggregated into, financial assets and non-financial assets.Current and non-current assets or liabilities (those expected to be recovered or settled beyond 12 months) are disclosed in the notes, where relevant.
Cash held on behalf of customers represents cash received for event ticket sales which is held at bank from the time tickets are purchased and paid out to the hirer after the event has taken place.
Cash flow statementCash flows are classified according to whether or not they arise from operating activities, investing activities, or financing activities. This classification is consistent with requirements under AASB 107 Statement of Cash Flows.
For cash flow statement presentation purposes, cash and cash equivalents include bank overdrafts, which are included as current borrowings on the balance sheet.
Statement of changes in equityThe statement of changes in equity presents reconciliations of non-owner and owner changes in equity from opening balance at the beginning of the reporting period to the closing balance at the end of the reporting period. It also shows separately changes due to amounts recognised in the ‘comprehensive result’ and amounts recognised in ‘other economic flows – other movements in equity’ related to ‘transactions with owner in its capacity as owner’.
(e) Changes in accounting policiesSubsequent to the 2013-14 reporting period, the following new and revised Standards have been adopted for the first time in the current period with their financial impacts disclosed.
AASB 10 Consolidated Financial Statements
AASB 10 provides a new approach to determine whether an entity has control over an entity, and therefore must present consolidated financial statements. The new approach requires the satisfaction of all three criteria for control to exist over an entity for financial reporting purposes:(a) The investor has control over the investee(b) The investor has exposure, or rights to variable returns from
its involvement with the investee, and(c) The investor has the ability to use its power over the investee
to affect the amount of the investor’s returns.
Based on the new criteria prescribed in AASB 10, the Trust has reviewed the existing arrangements to determine if there are any additional entities that need to be consolidated into the group. The Trust has concluded that no additional entities have met the control criteria.
(f) Events after reporting dateAssets, liabilities, income or expenses arise from past transactions or other past events. Where the transactions result from an agreement between the Trust and other parties, the transactions are only recognised when the agreement is irrevocable at or before the end of the reporting period.
Adjustments are made to amounts recognised in the financial statements for events which occur after the reporting period and before the date the financial statements are authorised for issue, where those events provide information about conditions which existed in the reporting period. Note disclosure is made about events between the end of the reporting period and the date the financial statements are authorised for issue where the events relate to conditions which arose after the end of the reporting period and which may have a material impact on the results of subsequent reporting periods.
(g) Goods and Services Tax (GST)Income, expenses and assets are recognised net of the amount of associated GST, unless the GST incurred is not recoverable from the taxation authority. In this case it is recognised as part of the cost of acquisition of the asset or as part of the expense.
Receivables and payables are stated inclusive of the amount of GST receivable or payable. The net amount of GST recoverable from, or payable to, the taxation authority is included with other receivables or payables in the balance sheet.
Cash flows are presented on a gross basis. The GST components of cash flows arising from investing or financing activities which are recoverable from, or payable to the taxation authority, are presented as operating cash flows.
19
MEL
BOUR
NE &
OLY
MPI
C PA
RKS
TRUS
T
NOTES TO FINANCIAL STATEMENTSFOR THE FINANCIAL YEAR ENDED 30 JUNE 2015
(h) Income from transactionsIncome is measured at the fair value of the consideration received or receivable. Amounts disclosed as income are net of returns, trade allowances and duties and taxes.Sale of goods and servicesSale of goods and services is recognised upon delivery of the goods and services to the customer and when the Trust gains control of the underlying assets.
InterestInterest income is recognised on a time proportionate basis that takes into account the effective yield on the financial asset.
GrantsGrants from third parties are recognised as income in the reporting period in which the Trust gains control over the contribution.
Other incomeSinking fund income is recognised as income in the reporting period in which the Trust gains control over the underlying assets.
(i) Expenses from transactionsPayments to third parties are recognised as an expense in the reporting period in which they are paid or are payable.
Cost of goods sold/distributedPurchase of cost of goods sold/distributed are recognised as an expense in the reporting period in which they are incurred.
Purchase of servicesPurchase of services are recognised as an expense in the reporting period in which they are incurred.
Employee expensesThese expenses include all costs related to employment (other than superannuation which is accounted for separately) including wages and salaries, Fringe Benefits Tax, leave entitlements, redundancy payments and WorkCover premiums.
SuperannuationThe amount recognised in the Comprehensive Operating Statement is the employer contributions for members of both defined benefit and defined contribution superannuation plans that are paid or payable during the reporting period.
Details of the funds which the Trust made superannuation contributions to during the year are disclosed in Note 21.
Depreciation and amortisationIn compliance with Australian Accounting Standard AASB116 Property, Plant and Equipment, depreciation and amortisation has been charged on all fixed assets and capital works developments, with the exception of Land. The provisions for depreciation are made using the straight-line method, at rates appropriate to the estimated useful life to the Trust of each individual asset. Estimates of the remaining useful lives for all assets are reviewed annually and range from greater than zero up to 110 years. The Trust’s policy is to capitalise assets valued over $5,000, whilst assets of less than $5,000 in value are expensed immediately.
The following are typical estimated useful lives for different asset classes for both current and prior years:
Asset Class Useful Life
Buildings 50 - 110 years
Property Plant & Equipment 5 - 60 years
Motor Vehicles 5 years
Intangible Assets 5 years
Other operating expensesOther operating expenses generally represent the day-to-day running costs incurred in normal operations and are recognised as an expense in the reporting period in which they are incurred.
Government financial transfersGovernment financial transfers represents payment made by the Trust to the Government for support of sport and recreation programs.
(j) Other economic flows included in the net resultNet gain/(loss) on non-financial assets
(i) Net gain/(loss) on disposal of non-financial assets Any gain or loss on disposal of non-current assets is
recognised at the date control of the asset is passed to the buyer and is determined after deducting from the proceeds the carrying value of the asset at that time.
(ii) Impairment of non-financial assets All of the Trust’s assets are assessed annually for
indications of impairment.
If there is an indication of impairment, the assets concerned are tested as to whether their carrying value exceeds their possible recoverable amount. Where an asset’s carrying value exceeds its recoverable amount, the difference is written-off by a charge to the Comprehensive Operating Statement except to the extent that the write-down can be debited to an asset revaluation reserve amount applicable to that class of asset.
It is deemed that, in the event of the loss of an asset, the future economic benefits arising from the use of the asset will be replaced unless a specific decision to the contrary has been made. The recoverable amount of most major assets is measured at the higher of the depreciated replacement cost and fair value less costs to sell. The depreciated replacement cost is the current replacement cost of an asset less, where applicable, accumulated depreciation calculated on the basis of such cost to reflect the already consumed or expired future economic benefits of the asset.
Net gain/(loss) arising from revaluation of long service leave liability Net gain/(loss) from the revaluation of long service
leave liability arises due to changes in the bond interest rates;
20
MEL
BOUR
NE &
OLY
MPI
C PA
RKS
TRUS
T
NOTES TO FINANCIAL STATEMENTSFOR THE FINANCIAL YEAR ENDED 30 JUNE 2015
(k) Financial instrumentsFinancial instruments arise out of contractual agreements that give rise to a financial asset of one entity and a financial liability or equity instrument of another entity. Due to the nature of the Trust’s activities, certain financial assets and financial liabilities arise under statute rather than a contract. Such financial assets and financial liabilities do not meet the definition of financial instruments in AASB 132 Financial Instruments: Presentation. For example, statutory receivables arising from taxes, fines and penalties do not meet the definition of financial instruments as they do not arise under contract.
Where relevant, for note disclosure purposes, a distinction is made between those financial assets and financial liabilities that meet the definition of financial instruments in accordance with AASB 132 and those that do not.
The following refers to financial instruments unless otherwise stated.
Categories of non-derivative financial instruments
Loans and receivablesLoans and receivables are financial instrument assets with fixed and determinable payments that are not quoted on an active market. These assets are initially recognised at fair value plus any directly attributable transaction costs. Subsequent to initial measurement, loans and receivables are measured at amortised cost using effective interest method, less any impairment.
Loans and receivables category includes cash and cash equivalents (refer to Note 1 (l)), term deposits with maturity greater than three months, trade receivables, loans and other receivables, but not statutory receivables.
Available-for-sale financial assetsAvailable-for-sale financial instrument assets are those designated as available-for-sale or not classified in any other category of financial instrument asset.
Such assets are initially recognised at fair value. Subsequent to initial recognition, they are measured at fair value with gains and losses arising from changes in fair value, recognised in ‘other economic flows – other comprehensive income’ until the investments are disposed.
Movements resulting from impairment and foreign currency changes are recognised in the net result as other economic flows. On disposal, the cumulative gain or loss previously recognised in ‘other economic flows – other comprehensive income’ is transferred to other economic flows in the net result.
Available-for-sale category includes certain equity investments and those debt securities that are designated as available-for-sale.
Held-to-maturity financial assetsIf the Trust has the positive intent and ability to hold nominated investments to maturity, then such financial assets may be classified as held-to-maturity. Held-to-maturity financial assets are recognised initially at fair value plus any directly attributable
transaction costs. Subsequent to initial recognition held-to-maturity financial assets are measured at amortised cost using the effective interest method, less any impairment losses.
The Trust makes limited use of this classification because any sale or reclassification of more than an insignificant amount of held-to-maturity investments not close to their maturity, would result in the whole category being reclassified as available-for-sale. The Trust would also be prevented from classifying investment securities as held-to-maturity for the current and the following two financial years.
The held-to-maturity category includes certain term deposits and debt securities for which the entity concerned intends to hold to maturity.
Financial assets and liabilities at fair value through profit and lossFinancial assets are categorised as fair value through profit or loss at trade date if they are classified as held for trading or designated as such upon initial recognition. Financial instrument assets are designated at fair value through profit or loss on the basis that the financial assets form part of a group of financial assets that are managed by the entity concerned based on their fair values, and have their performance evaluated in accordance with documented risk management and investment strategies.
Financial instruments at fair value through profit or loss are initially measured at fair value and attributable transaction costs are expensed as incurred. Subsequently, any changes in fair value are recognised in the net result as other economic flows. Any dividend or interest on a financial asset is recognised in the net result from transactions.
Financial liabilities amortised at costFinancial instrument liabilities are initially recognised on the date they are originated. They are initially measured at fair value plus any directly attributable transaction costs. Subsequent to initial recognition, these financial instruments are measured at amortised cost with any difference between the initial recognised amount and the redemption value being recognised in profit and loss over the period of the interest-bearing liability, using the effective interest rate method.
Financial instrument liabilities measured at amortised cost include all of the Trusts contractual payables, deposits held and advances received, and interest-bearing arrangements other than those designated at fair value through profit or loss.
Derivative financial instrumentsDerivative financial instruments are classified as held for trading financial assets and liabilities. They are initially recognised at fair value on the date on which a derivative contract is entered into. Derivatives are carried as assets when their fair value is positive and as liabilities when their fair value is negative. Any gains or losses arising from changes in the fair value of derivatives after initial recognition, are recognised in the consolidated comprehensive operating statement as another economic flow included in the net result.
21
MEL
BOUR
NE &
OLY
MPI
C PA
RKS
TRUS
T
NOTES TO FINANCIAL STATEMENTSFOR THE FINANCIAL YEAR ENDED 30 JUNE 2015
Offsetting financial instrumentsFinancial instrument assets and liabilities are offset and the net amount presented in the consolidated balance sheet when, and only when, the Trust concerned has a legal right to offset the amounts and intend either to settle on a net basis or to realise the asset and settle the liability simultaneously.
Some master netting arrangements do not result in an offset of balance sheet assets and liabilities. Where the Trust does not have a legally enforceable right to offset recognised amounts, because the right to offset is enforceable only on the occurrence of future events such as default, insolvency or bankruptcy, they are reported on a gross basis.
Reclassification of financial instrumentsSubsequent to initial recognition and under rare circumstances, non-derivative financial instruments assets that have not been designated at fair value through profit or loss upon recognition may be reclassified out of the fair value through profit or loss category, if they are no longer held for the purpose of selling or repurchasing in the near term.
Financial instrument assets that meet the definition of loans and receivables may be reclassified out of the fair value through profit and loss category into the loans and receivables category, where they would have met the definition of loans and receivables had they not been required to be classified as fair value through profit and loss. In these cases, the financial instrument assets may be reclassified out of the fair value through profit and loss category, if there is the intention and ability to hold them for the foreseeable future or until maturity.
Available-for-sale financial instrument assets that meet the definition of loans and receivables may be reclassified into the loans and receivables category if there is the intention and ability to hold them for the foreseeable future or until maturity.
(l) AssetsAll assets controlled by the Trust are reported in the balance sheet.
Cash and cash equivalentsCash and cash equivalents, comprise cash on hand and cash at bank, deposits at call and those highly liquid investments with an original maturity of three months or less, which are held for the purpose of meeting short term cash commitments rather than for investment purposes, and which are readily convertible to known amounts of cash and are subject to an insignificant risk of changes in value.
ReceivablesReceivables consist of:• statutory receivables, which include predominantly
amounts owing from the Victorian Government and GST input tax credits recoverable, and
• contractual receivables, which include mainly debtors in relation to goods and services and accrued investment income.
Receivables that are contractual are classified as financial instruments. Statutory receivables are not classified as financial instruments.
Receivables are recognised initially at fair value and subsequently measured at amortised cost, using the effective interest method, less an allowance for impairment.
A provision for doubtful receivables is made when there is objective evidence that the debts will not be collected. Bad debts are written-off when identified.
Property, Plant and EquipmentLand, buildings and plant and equipment are recognised initially at cost and subsequently measured at fair value, less accumulated depreciation and impairment.
Revaluations of non-current physical assetsNon-current physical assets measured at fair value are revalued in accordance with the new FRD 103F issued by the Minister for Finance. A full revaluation occurs at least every five years, based on the asset’s government purpose classification, but may occur more frequently if fair value assessments indicate material changes in values. Independent valuers are used to conduct these scheduled revaluations and any interim revaluations are determined in accordance with the requirements of the FRDs.
Revaluation increases or decreases arise from differences between an asset’s carrying value and fair value.
Revaluation increases are credited directly to equity in the revaluation reserve, except that, to the extent that an increment reverses a revaluation decrement in respect of that class of asset previously recognised as an expense in the net result, the increment is recognised as income in determining the net result.
Revaluation decreases are recognised immediately as expenses in the net result, except that, to the extent that a credit balance exists in the revaluation reserve in respect of the same class of assets, they are debited to the revaluation reserve.
Revaluation increases and revaluation decreases relating to individual assets within a class of Property, Plant and Equipment are offset against one another within that class but are not offset in respect of assets in different classes.
OtherPrepaymentsOther non-financial assets include prepayments which represent payments in advance of receipts of goods and services or that part of expenditure made in one accounting period covering a term extending beyond that period.
(m) LiabilitiesPayablesPayables consist of:• contractual payables, such as accounts payable, and
unearned income including deferred income from concession notes. Accounts payable represent liabilities for goods and services provided to the Trust prior to the end of the financial year that are unpaid, and arise when the Trust becomes obliged to make future payments in respect of the purchase of those goods and services, and
• statutory payables, such as goods and services tax and fringe benefits tax payables.
22
MEL
BOUR
NE &
OLY
MPI
C PA
RKS
TRUS
T
NOTES TO FINANCIAL STATEMENTSFOR THE FINANCIAL YEAR ENDED 30 JUNE 2015
ProvisionsProvisions are recognised when the Trust has a present obligation, the future sacrifice of economic benefits is probable and the amount of the provision can be measured reliably.
The amount recognised as a provision is the best estimate of the consideration required to settle the present obligation at reporting date, taking into account the risks and uncertainties surrounding the obligation. Where a provision is measured using the cash flows estimated to settle the present obligation, its carrying amount is the present value of those cash flows, using a discount rate that reflects the time value of money and risks specific to the provision.
Employee Benefits(i) Wages, salaries and annual leave
Liabilities for wages and salaries, including non-monetary benefits and annual leave are recognised in the provision for employee benefits as ‘current liabilities’ because the Trust does not have an unconditional right to defer settlements of these liabilities.
Depending on the expectation of the timing of the settlement, liabilities for wages and salaries and annual leave are measured at:
• undiscounted value – if the Trust expects to wholly settle within 12 months, or
• present value – if the Trust does not expect to wholly settle within 12 months.
(ii) Long Service Leave A liability for Long Service Leave (LSL) is recognised, and is
measured as the present value of expected future payments to be made in respect of services provided by employees up to the reporting date. Consideration is given to expected future wage and salary levels, experience of employee departures and period of service. All unconditional vested LSL representing seven years or greater of continuous service is disclosed in accordance with AASB 101 Presentation of Financial Statements, as a current liability.
Liability for LSL is recognised in the provision for employee benefits.
• Current liability unconditional LSL (representing seven or more years of continuous service for staff) is disclosed as a current liability even where the Trust does not expect to settle the liability within 12 months because it will not have the unconditional right to defer the settlement of the entitlement should an employee take leave within 12 months.
The components of this current LSL liability are measured at: – present value – component that the Trust does not
expect to settle within 12 months, and – nominal value – component that the Trust expects to
settle within 12 months.
• Non-current liability – conditional LSL (representing less than seven years of continuous service for staff) is disclosed as a non-current liability. There is an unconditional right to defer the settlement of the entitlement until the employee has completed the requisite years of service.
This non-current LSL liability is measured at present value.Any gain or loss following revaluation of the present value of non-current LSL liability is recognised in the ‘net result from transactions’, except to the extent that a gain or loss arises due to changes in bond interest rates for which it is then recognised in the net result as another economic flow.
(iii) Termination benefits Termination benefits are payable when employment is
terminated before the normal retirement date, or when an employee accepts voluntary redundancy in exchange for these benefits. The Trust recognises termination benefits when it is demonstrably committed to either terminating the employment of current employees according to a detailed formal plan without possibility of withdrawal or providing termination benefits as a result of an offer made to encourage voluntary redundancy. Benefits falling due more than 12 months after balance sheet date are discounted to present value.
Employee Benefit On-Costs Employee benefits on-costs such as Payroll Tax and workers compensation are recognised separately from the provision for employee benefits.
(n) Income taxesThe Australian Taxation Office has deemed the Trust to be a “Public Authority” within the terms of Section 50-25 of the Income Tax Assessment Act 1997 and therefore any income shall be exempt from income tax. The Trust is not subject to the National Tax Equivalent Regime. No provisions for income taxes payable have been raised.
(o) Contingent assets and contingent liabilitiesContingent assets and contingent liabilities are not recognised in the balance sheet, but are disclosed by way of a note and, if quantifiable, are measured at nominal value.
(p) Cash flow statementFor the purposes of the cash flow statement, cash comprises petty cash, cash floats, deposits in bank accounts, cash at bank and short-term deposits.
(q) Rounding of AmountsAmounts in the financial statements have been rounded to the nearest $1,000 unless otherwise stated.
(r) Contributed CapitalTransfers from the Department of Economic Development, Jobs, Transport and Resources (Ecodev) that are in the nature of contributions or distributions of capital have also been designated as contributed capital. Other transfers that are in the nature of contributions or distributions have also been designated as contributions by owners.
(s) Intangible assetsIntangible assets represent identifiable non-monetary assets without physical substance. Intangible assets are recognised at cost. Cost incurred subsequent to initial acquisition are capitalised when it is expected that additional future economic benefits will flow to the Trust.
23
MEL
BOUR
NE &
OLY
MPI
C PA
RKS
TRUS
T
(t) Leased assetsAll leased assets are classified as operating leases.
Operating lease payments, including any contingent rentals, are recognised as an expense in the Comprehensive Operating Statement on a straight line basis over the lease term, except where another systematic basis is more representative of the time pattern of the benefits derived from the use of the leased asset. The leased asset is not recognised in the balance sheet.
(u) CommitmentsCommitments for future expenditure include operating and capital commitments arising from contracts. These commitments are disclosed by way of a note (refer to Note 13 Commitments for expenditure) at their nominal value and inclusive of the GST payable. In addition, where it is considered appropriate and
provides additional relevant information to users, the net present values of significant individual projects are stated. These future expenditures cease to be disclosed as commitments once the related liabilities are recognised in the balance sheet.
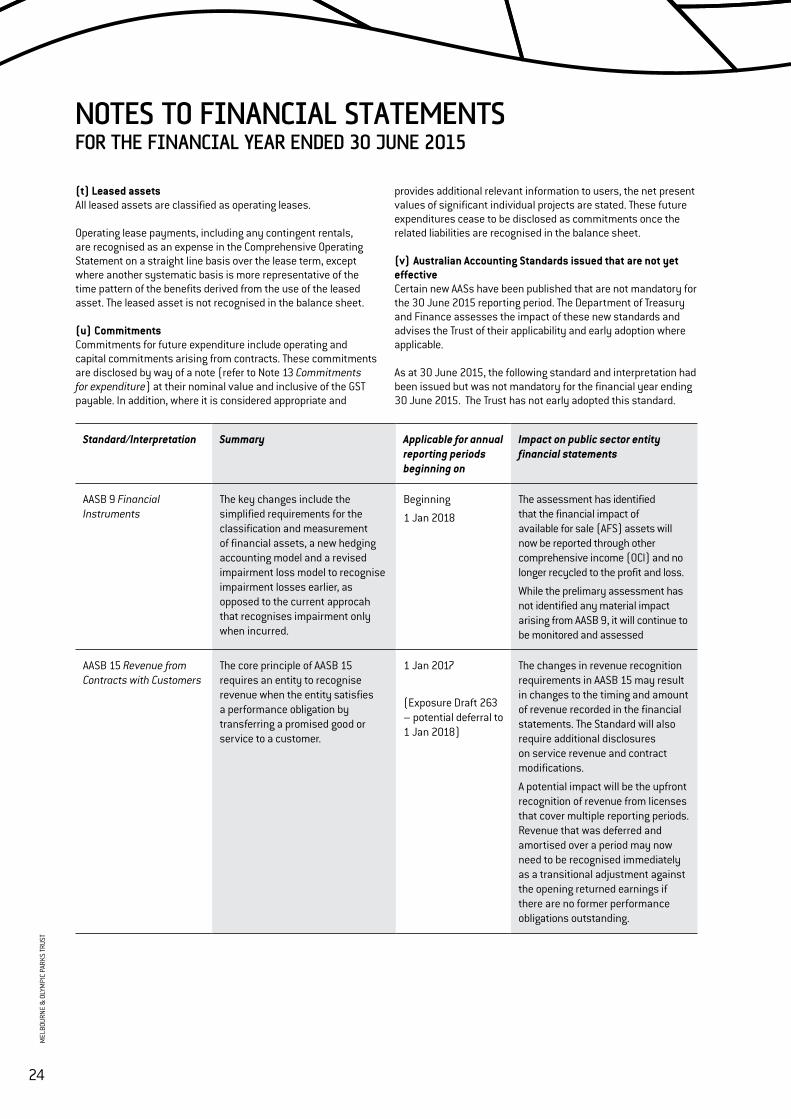
(v) Australian Accounting Standards issued that are not yet effectiveCertain new AASs have been published that are not mandatory for the 30 June 2015 reporting period. The Department of Treasury and Finance assesses the impact of these new standards and advises the Trust of their applicability and early adoption where applicable.
As at 30 June 2015, the following standard and interpretation had been issued but was not mandatory for the financial year ending 30 June 2015. The Trust has not early adopted this standard.
Standard/Interpretation Summary Applicable for annual reporting periods beginning on
Impact on public sector entity financial statements
AASB 9 Financial Instruments
The key changes include the simplified requirements for the classification and measurement of financial assets, a new hedging accounting model and a revised impairment loss model to recognise impairment losses earlier, as opposed to the current approcah that recognises impairment only when incurred.
Beginning
1 Jan 2018
The assessment has identified that the financial impact of available for sale (AFS) assets will now be reported through other comprehensive income (OCI) and no longer recycled to the profit and loss.
While the prelimary assessment has not identified any material impact arising from AASB 9, it will continue to be monitored and assessed
AASB 15 Revenue from Contracts with Customers
The core principle of AASB 15 requires an entity to recognise revenue when the entity satisfies a performance obligation by transferring a promised good or service to a customer.
1 Jan 2017
(Exposure Draft 263 – potential deferral to 1 Jan 2018)
The changes in revenue recognition requirements in AASB 15 may result in changes to the timing and amount of revenue recorded in the financial statements. The Standard will also require additional disclosures on service revenue and contract modifications.
A potential impact will be the upfront recognition of revenue from licenses that cover multiple reporting periods. Revenue that was deferred and amortised over a period may now need to be recognised immediately as a transitional adjustment against the opening returned earnings if there are no former performance obligations outstanding.
NOTES TO FINANCIAL STATEMENTSFOR THE FINANCIAL YEAR ENDED 30 JUNE 2015
24
MEL
BOUR
NE &
OLY
MPI
C PA
RKS
TRUS
T
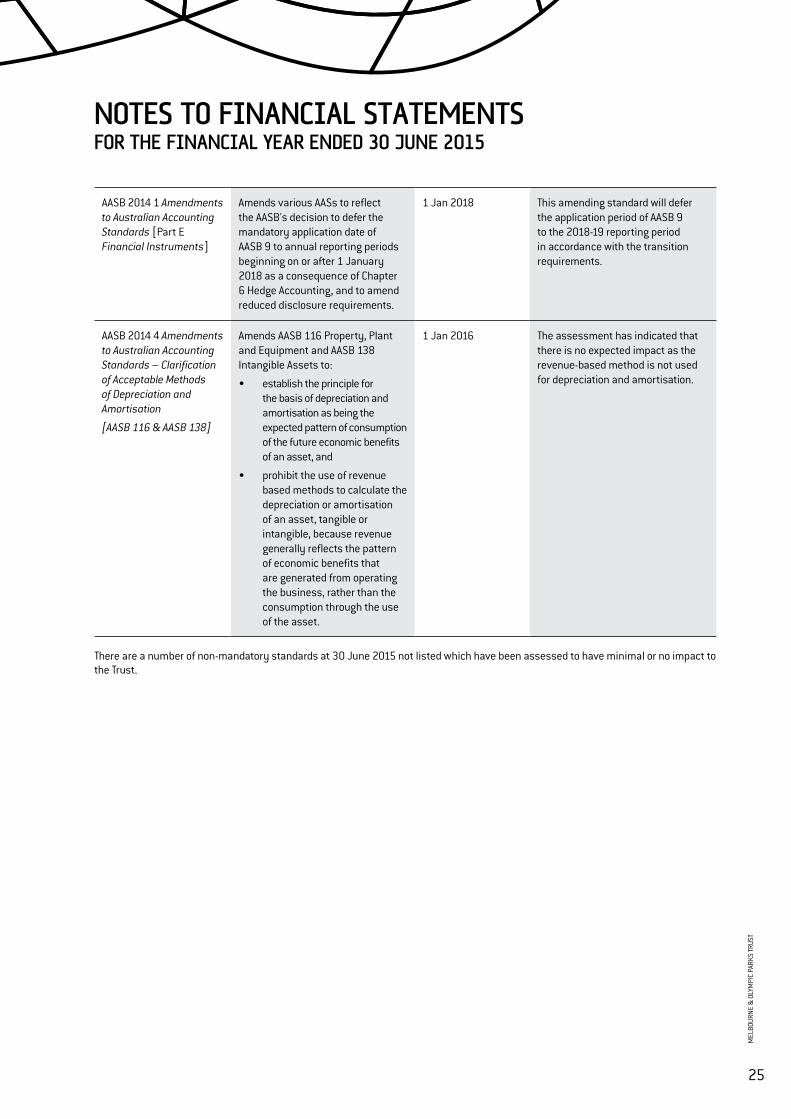
AASB 2014 1 Amendments to Australian Accounting Standards [Part E Financial Instruments]
Amends various AASs to reflect the AASB's decision to defer the mandatory application date of AASB 9 to annual reporting periods beginning on or after 1 January 2018 as a consequence of Chapter 6 Hedge Accounting, and to amend reduced disclosure requirements.
1 Jan 2018 This amending standard will defer the application period of AASB 9 to the 2018-19 reporting period in accordance with the transition requirements.
AASB 2014 4 Amendments to Australian Accounting Standards – Clarification of Acceptable Methods of Depreciation and Amortisation
[AASB 116 & AASB 138]
Amends AASB 116 Property, Plant and Equipment and AASB 138 Intangible Assets to:
• establish the principle for the basis of depreciation and amortisation as being the expected pattern of consumption of the future economic benefits of an asset, and
• prohibit the use of revenue based methods to calculate the depreciation or amortisation of an asset, tangible or intangible, because revenue generally reflects the pattern of economic benefits that are generated from operating the business, rather than the consumption through the use of the asset.
1 Jan 2016 The assessment has indicated that there is no expected impact as the revenue-based method is not used for depreciation and amortisation.
There are a number of non-mandatory standards at 30 June 2015 not listed which have been assessed to have minimal or no impact to the Trust.
NOTES TO FINANCIAL STATEMENTSFOR THE FINANCIAL YEAR ENDED 30 JUNE 2015
25
MEL
BOUR
NE &
OLY
MPI
C PA
RKS
TRUS
T
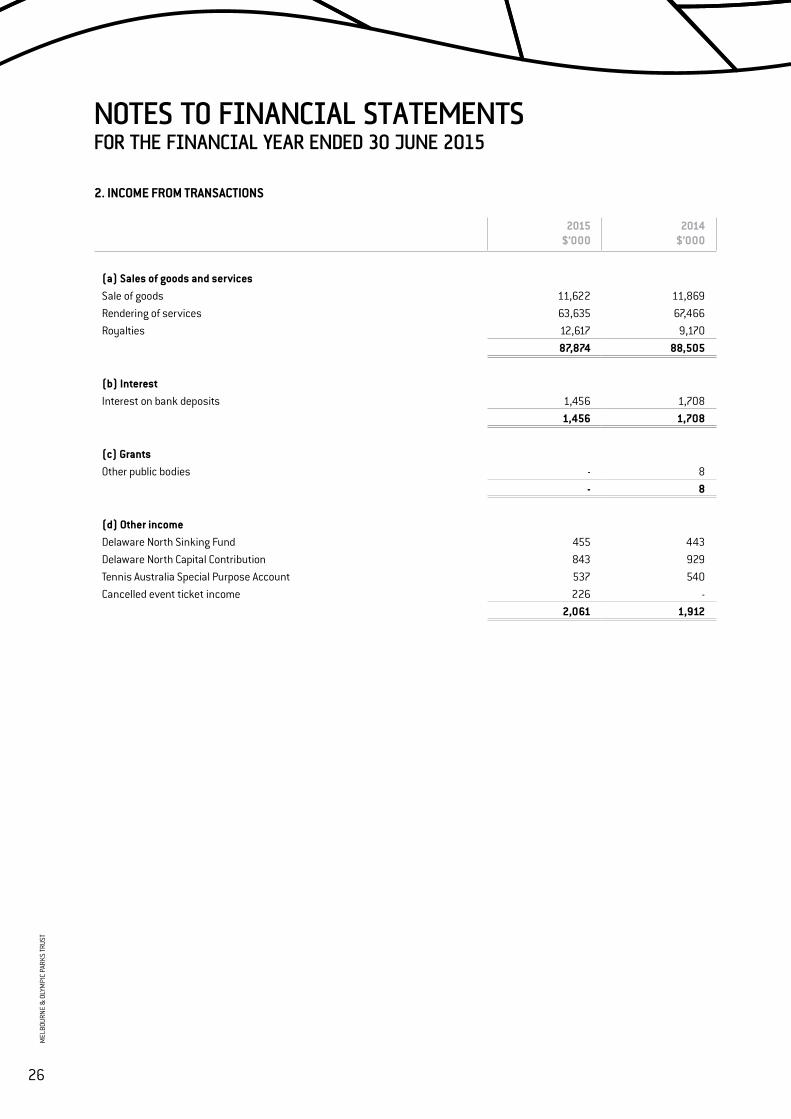
2. INCOME FROM TRANSACTIONS
2015$’000
2014$’000
(a) Sales of goods and servicesSale of goods 11,622 11,869 Rendering of services 63,635 67,466 Royalties 12,617 9,170
87,874 88,505
(b) InterestInterest on bank deposits 1,456 1,708
1,456 1,708
(c) GrantsOther public bodies - 8
- 8
(d) Other incomeDelaware North Sinking Fund 455 443 Delaware North Capital Contribution 843 929 Tennis Australia Special Purpose Account 537 540 Cancelled event ticket income 226 -
2,061 1,912
NOTES TO FINANCIAL STATEMENTSFOR THE FINANCIAL YEAR ENDED 30 JUNE 2015
26
MEL
BOUR
NE &
OLY
MPI
C PA
RKS
TRUS
T
NOTES TO FINANCIAL STATEMENTSFOR THE FINANCIAL YEAR ENDED 30 JUNE 2015
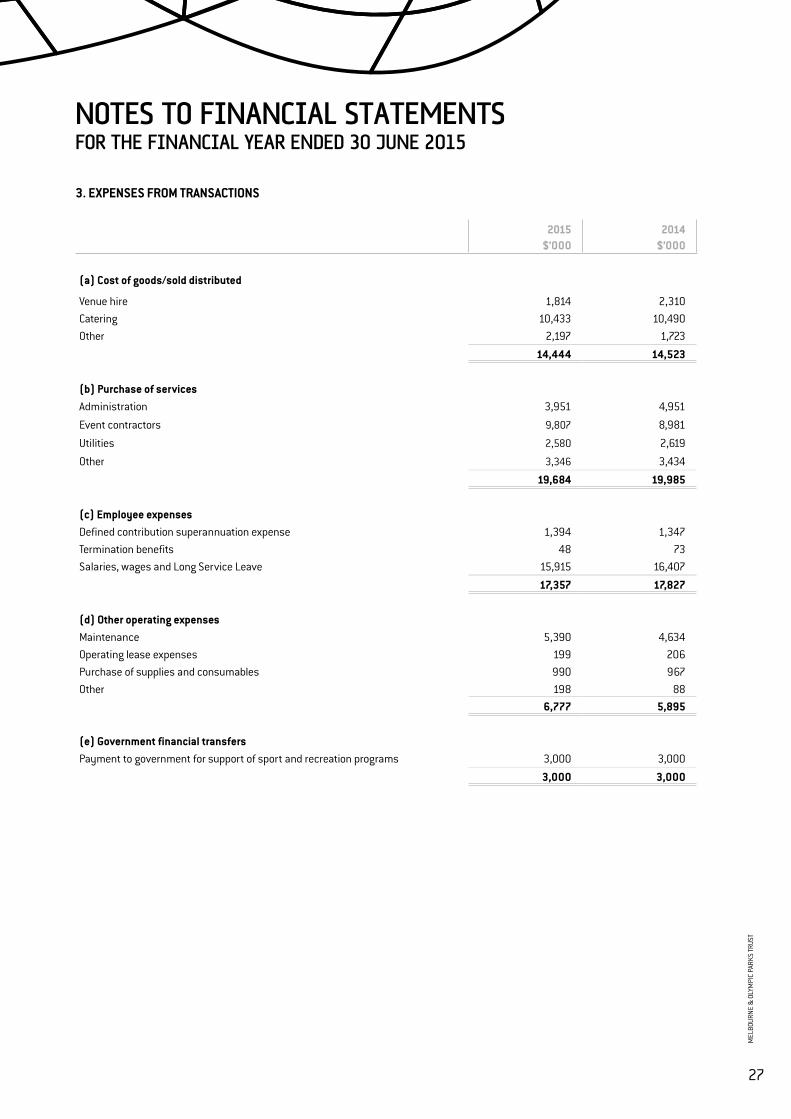
3. EXPENSES FROM TRANSACTIONS
2015$’000
2014$’000
(a) Cost of goods/sold distributed
Venue hire 1,814 2,310 Catering 10,433 10,490 Other 2,197 1,723
14,444 14,523
(b) Purchase of servicesAdministration 3,951 4,951
Event contractors 9,807 8,981
Utilities 2,580 2,619
Other 3,346 3,434
19,684 19,985
(c) Employee expensesDefined contribution superannuation expense 1,394 1,347 Termination benefits 48 73 Salaries, wages and Long Service Leave 15,915 16,407
17,357 17,827
(d) Other operating expensesMaintenance 5,390 4,634 Operating lease expenses 199 206 Purchase of supplies and consumables 990 967 Other 198 88
6,777 5,895
(e) Government financial transfersPayment to government for support of sport and recreation programs 3,000 3,000
3,000 3,000
27
MEL
BOUR
NE &
OLY
MPI
C PA
RKS
TRUS
T
NOTES TO FINANCIAL STATEMENTSFOR THE FINANCIAL YEAR ENDED 30 JUNE 2015
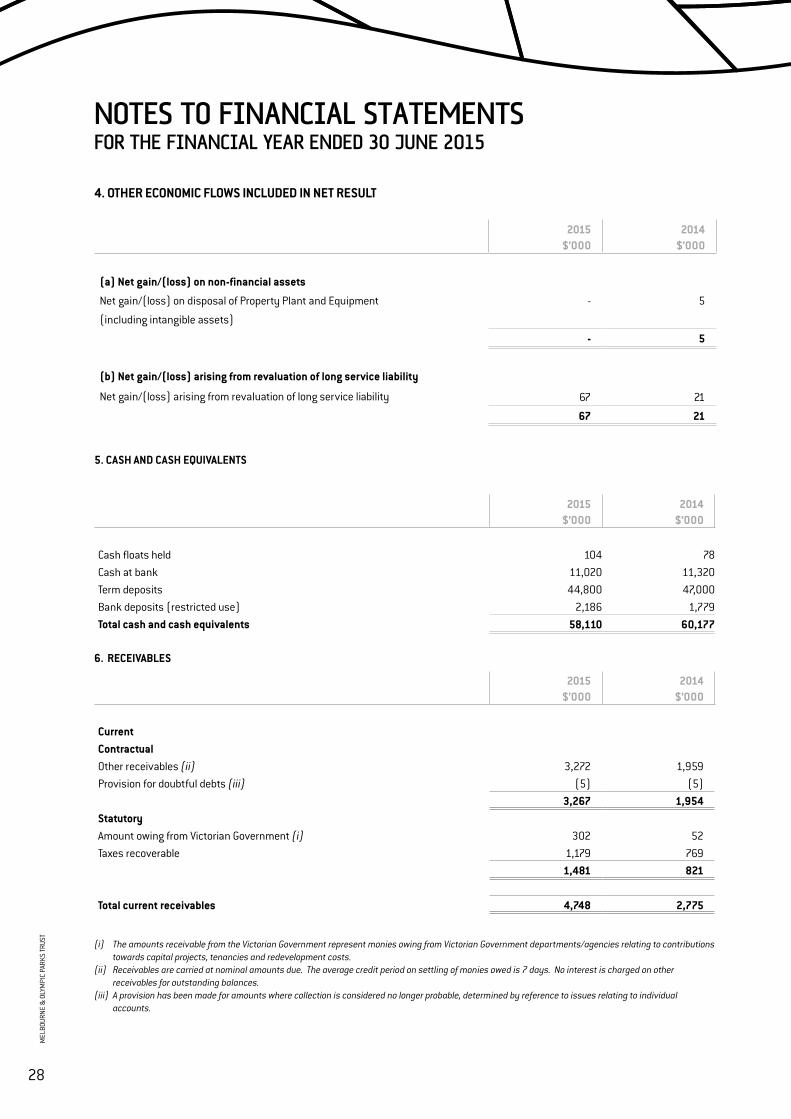
4. OTHER ECONOMIC FLOWS INCLUDED IN NET RESULT
2015$’000
2014$’000
(a) Net gain/(loss) on non-financial assets
Net gain/(loss) on disposal of Property Plant and Equipment - 5
(including intangible assets)
- 5
(b) Net gain/(loss) arising from revaluation of long service liability
Net gain/(loss) arising from revaluation of long service liability 67 21
67 21
5. CASH AND CASH EQUIVALENTS
2015$’000
2014$’000
Cash floats held 104 78 Cash at bank 11,020 11,320Term deposits 44,800 47,000 Bank deposits (restricted use) 2,186 1,779 Total cash and cash equivalents 58,110 60,177
6. RECEIVABLES
2015$’000
2014$’000
CurrentContractualOther receivables (ii) 3,272 1,959 Provision for doubtful debts (iii) (5) (5)
3,267 1,954 StatutoryAmount owing from Victorian Government (i) 302 52 Taxes recoverable 1,179 769
1,481 821
Total current receivables 4,748 2,775
(i) The amounts receivable from the Victorian Government represent monies owing from Victorian Government departments/agencies relating to contributions towards capital projects, tenancies and redevelopment costs.
(ii) Receivables are carried at nominal amounts due. The average credit period on settling of monies owed is 7 days. No interest is charged on other receivables for outstanding balances.
(iii) A provision has been made for amounts where collection is considered no longer probable, determined by reference to issues relating to individual accounts.
28
MEL
BOUR
NE &
OLY
MPI
C PA
RKS
TRUS
T
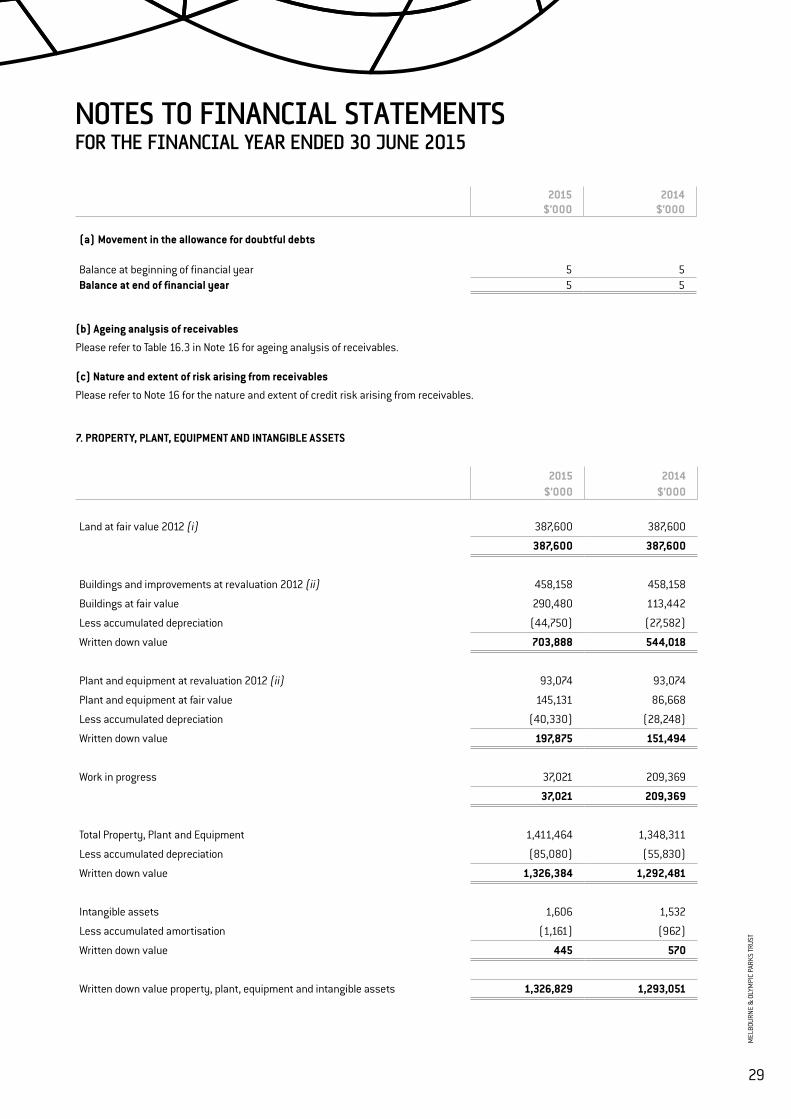
NOTES TO FINANCIAL STATEMENTSFOR THE FINANCIAL YEAR ENDED 30 JUNE 2015
2015$’000
2014$’000
(a) Movement in the allowance for doubtful debts
Balance at beginning of financial year 5 5 Balance at end of financial year 5 5
(b) Ageing analysis of receivables
Please refer to Table 16.3 in Note 16 for ageing analysis of receivables.
(c) Nature and extent of risk arising from receivables
Please refer to Note 16 for the nature and extent of credit risk arising from receivables.
7. PROPERTY, PLANT, EQUIPMENT AND INTANGIBLE ASSETS
2015$’000
2014$’000
Land at fair value 2012 (i) 387,600 387,600
387,600 387,600
Buildings and improvements at revaluation 2012 (ii) 458,158 458,158
Buildings at fair value 290,480 113,442
Less accumulated depreciation (44,750) (27,582)
Written down value 703,888 544,018
Plant and equipment at revaluation 2012 (ii) 93,074 93,074
Plant and equipment at fair value 145,131 86,668
Less accumulated depreciation (40,330) (28,248)
Written down value 197,875 151,494
Work in progress 37,021 209,369
37,021 209,369
Total Property, Plant and Equipment 1,411,464 1,348,311
Less accumulated depreciation (85,080) (55,830)
Written down value 1,326,384 1,292,481
Intangible assets 1,606 1,532
Less accumulated amortisation (1,161) (962)
Written down value 445 570
Written down value property, plant, equipment and intangible assets 1,326,829 1,293,051
29
MEL
BOUR
NE &
OLY
MPI
C PA
RKS
TRUS
T
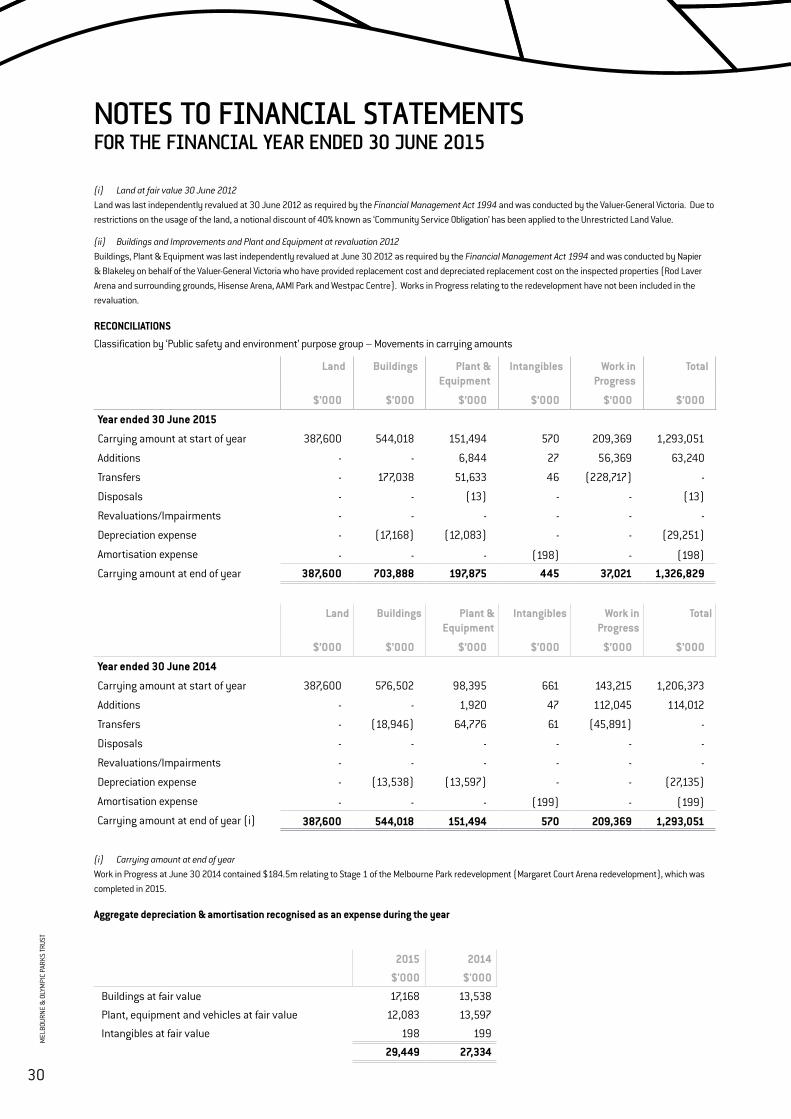
NOTES TO FINANCIAL STATEMENTSFOR THE FINANCIAL YEAR ENDED 30 JUNE 2015
(i) Land at fair value 30 June 2012 Land was last independently revalued at 30 June 2012 as required by the Financial Management Act 1994 and was conducted by the Valuer-General Victoria. Due to restrictions on the usage of the land, a notional discount of 40% known as ‘Community Service Obligation’ has been applied to the Unrestricted Land Value.
(ii) Buildings and Improvements and Plant and Equipment at revaluation 2012 Buildings, Plant & Equipment was last independently revalued at June 30 2012 as required by the Financial Management Act 1994 and was conducted by Napier & Blakeley on behalf of the Valuer-General Victoria who have provided replacement cost and depreciated replacement cost on the inspected properties (Rod Laver Arena and surrounding grounds, Hisense Arena, AAMI Park and Westpac Centre). Works in Progress relating to the redevelopment have not been included in the revaluation.
RECONCILIATIONS
Classification by ‘Public safety and environment’ purpose group – Movements in carrying amounts
Land Buildings Plant &Equipment
Intangibles Work inProgress
Total
$’000 $’000 $’000 $’000 $’000 $’000
Year ended 30 June 2015
Carrying amount at start of year 387,600 544,018 151,494 570 209,369 1,293,051
Additions - - 6,844 27 56,369 63,240
Transfers - 177,038 51,633 46 (228,717) -
Disposals - - (13) - - (13)
Revaluations/Impairments - - - - - -
Depreciation expense - (17,168) (12,083) - - (29,251)
Amortisation expense - - - (198) - (198)
Carrying amount at end of year 387,600 703,888 197,875 445 37,021 1,326,829
Land Buildings Plant &Equipment
Intangibles Work inProgress
Total
$’000 $’000 $’000 $’000 $’000 $’000
Year ended 30 June 2014
Carrying amount at start of year 387,600 576,502 98,395 661 143,215 1,206,373
Additions - - 1,920 47 112,045 114,012
Transfers - (18,946) 64,776 61 (45,891) -
Disposals - - - - - -
Revaluations/Impairments - - - - - -
Depreciation expense - (13,538) (13,597) - - (27,135)
Amortisation expense - - - (199) - (199)
Carrying amount at end of year (i) 387,600 544,018 151,494 570 209,369 1,293,051
(i) Carrying amount at end of year Work in Progress at June 30 2014 contained $184.5m relating to Stage 1 of the Melbourne Park redevelopment (Margaret Court Arena redevelopment), which was completed in 2015.
Aggregate depreciation & amortisation recognised as an expense during the year
2015 2014
$'000 $'000
Buildings at fair value 17,168 13,538
Plant, equipment and vehicles at fair value 12,083 13,597
Intangibles at fair value 198 199
29,449 27,334
30
MEL
BOUR
NE &
OLY
MPI
C PA
RKS
TRUS
T

NOTES TO FINANCIAL STATEMENTSFOR THE FINANCIAL YEAR ENDED 30 JUNE 2015
Fair value measurement hierarchy for assets
Carrying amount as at 30 June
2015
Fair Value Measurement at end of reporting period using:
Level 1 Level 2 Level 3
$’000 $’000 $’000 $’000
Land at fair value
Specialised land 387,600 - - 387,600
Total of land at fair value 387,600 - - 387,600
Buildings at fair value
Specialised buildings 703,888 - - 703,888
Total of buildings at fair value 703,888 - - 703,888
Plant, equipment and vehicles at fair value
Vehicles 298 - - 298
Plant and equipment 197,577 - - 197,577
Total of plant, equipment and vehicles at fair value 197,875 - - 197,875
Carrying amount as at 30 June
2014
Fair Value Measurement at end of reporting period using:
Level 1 Level 2 Level 3
$’000 $’000 $’000 $’000
Land at fair value
Specialised land 387,600 - - 387,600
Total of land at fair value 387,600 - - 387,600
Buildings at fair value
Specialised buildings 544,018 - - 544,018
Total of buildings at fair value 544,018 - - 544,018
Plant, equipment and vehicles at fair value
Vehicles 349 - - 349
Plant and equipment 151,145 - - 151,145
Total of plant, equipment and vehicles at fair value 151,494 - - 151,494
Specialised land and specialised buildingsThe market approach is also used for specialised land, although is adjusted for the Community Service Obligation (CSO) to reflect the specialised nature of the land being valued.
The CSO adjustment is a reflection of the valuer’s assessment of the impact of restrictions associated with an asset to the extent that is also equally applicable to market participants. This approach is in light of the highest and best use consideration required for fair value measurement, and takes into account the use of the asset that is physically possible, legally permissible, and financially feasible. As adjustments of CSO are considered as significant unobservable inputs, specialised land would be classified as Level 3 assets.
For the Trust’s majority of specialised buildings, the depreciated replacement cost method is used, adjusting for the associated depreciations. As depreciation adjustments are considered as significant, unobservable inputs in nature, specialised buildings are classified as Level 3 fair value measurements.
An independent valuation of the Trust’s specialised land and specialised buildings was performed by the Valuer-General Victoria. The effective date of the valuation is 30 June 2012.
31
MEL
BOUR
NE &
OLY
MPI
C PA
RKS
TRUS
T
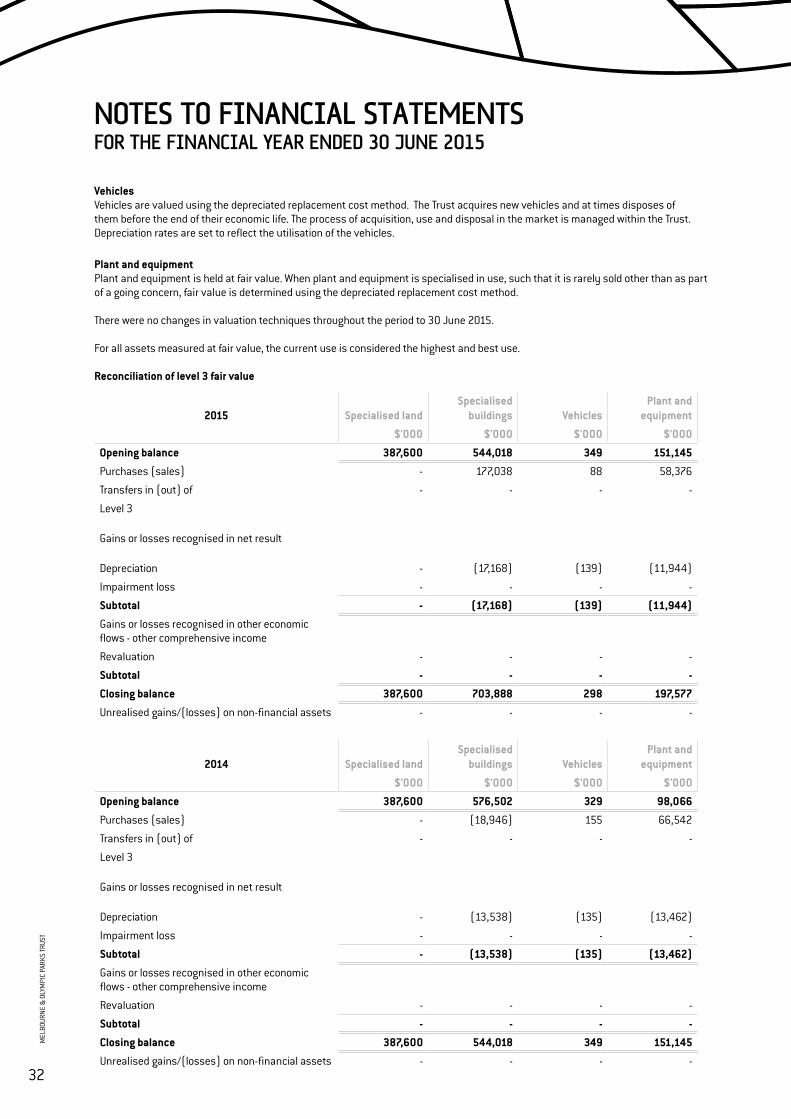
2015 Specialised landSpecialised
buildings VehiclesPlant and
equipment
$'000 $'000 $'000 $'000
Opening balance 387,600 544,018 349 151,145
Purchases (sales) - 177,038 88 58,376
Transfers in (out) of - - - -
Level 3
Gains or losses recognised in net result
Depreciation - (17,168) (139) (11,944)
Impairment loss - - - -
Subtotal - (17,168) (139) (11,944)
Gains or losses recognised in other economic flows - other comprehensive income
Revaluation - - - -
Subtotal - - - -
Closing balance 387,600 703,888 298 197,577
Unrealised gains/(losses) on non-financial assets - - - -
2014 Specialised landSpecialised
buildings VehiclesPlant and
equipment
$'000 $'000 $'000 $'000
Opening balance 387,600 576,502 329 98,066
Purchases (sales) - (18,946) 155 66,542
Transfers in (out) of - - - -
Level 3
Gains or losses recognised in net result
Depreciation - (13,538) (135) (13,462)
Impairment loss - - - -
Subtotal - (13,538) (135) (13,462)
Gains or losses recognised in other economic flows - other comprehensive income
Revaluation - - - -
Subtotal - - - -
Closing balance 387,600 544,018 349 151,145
Unrealised gains/(losses) on non-financial assets - - - -
NOTES TO FINANCIAL STATEMENTSFOR THE FINANCIAL YEAR ENDED 30 JUNE 2015
VehiclesVehicles are valued using the depreciated replacement cost method. The Trust acquires new vehicles and at times disposes of them before the end of their economic life. The process of acquisition, use and disposal in the market is managed within the Trust. Depreciation rates are set to reflect the utilisation of the vehicles.
Plant and equipmentPlant and equipment is held at fair value. When plant and equipment is specialised in use, such that it is rarely sold other than as part of a going concern, fair value is determined using the depreciated replacement cost method.
There were no changes in valuation techniques throughout the period to 30 June 2015.
For all assets measured at fair value, the current use is considered the highest and best use.
Reconciliation of level 3 fair value
32
MEL
BOUR
NE &
OLY
MPI
C PA
RKS
TRUS
T
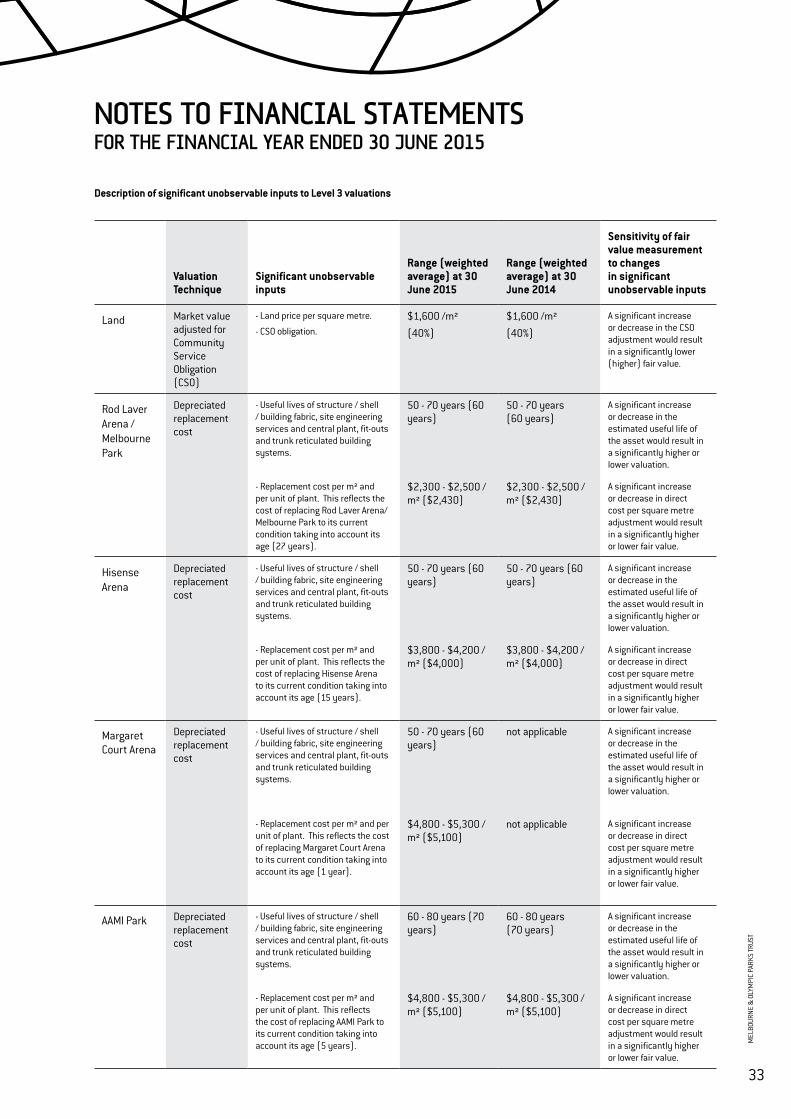
NOTES TO FINANCIAL STATEMENTSFOR THE FINANCIAL YEAR ENDED 30 JUNE 2015
Description of significant unobservable inputs to Level 3 valuations
Valuation Technique
Significant unobservable inputs
Range (weighted average) at 30 June 2015
Range (weighted average) at 30 June 2014
Sensitivity of fair value measurement to changes in significant unobservable inputs
Land Market value adjusted for Community Service Obligation (CSO)
- Land price per square metre.
- CSO obligation.$1,600 /m²(40%)
$1,600 /m²(40%)
A significant increase or decrease in the CSO adjustment would result in a significantly lower (higher) fair value.
Rod Laver Arena / Melbourne Park
Depreciated replacement cost
- Useful lives of structure / shell / building fabric, site engineering services and central plant, fit-outs and trunk reticulated building systems.
50 - 70 years (60 years)
50 - 70 years (60 years)
A significant increase or decrease in the estimated useful life of the asset would result in a significantly higher or lower valuation.
- Replacement cost per m² and per unit of plant. This reflects the cost of replacing Rod Laver Arena/Melbourne Park to its current condition taking into account its age (27 years).
$2,300 - $2,500 / m² ($2,430)
$2,300 - $2,500 / m² ($2,430)
A significant increase or decrease in direct cost per square metre adjustment would result in a significantly higher or lower fair value.
Hisense Arena
Depreciated replacement cost
- Useful lives of structure / shell / building fabric, site engineering services and central plant, fit-outs and trunk reticulated building systems.
50 - 70 years (60 years)
50 - 70 years (60 years)
A significant increase or decrease in the estimated useful life of the asset would result in a significantly higher or lower valuation.
- Replacement cost per m² and per unit of plant. This reflects the cost of replacing Hisense Arena to its current condition taking into account its age (15 years).
$3,800 - $4,200 / m² ($4,000)
$3,800 - $4,200 / m² ($4,000)
A significant increase or decrease in direct cost per square metre adjustment would result in a significantly higher or lower fair value.
Margaret Court Arena
Depreciated replacement cost
- Useful lives of structure / shell / building fabric, site engineering services and central plant, fit-outs and trunk reticulated building systems.
50 - 70 years (60 years)
not applicable A significant increase or decrease in the estimated useful life of the asset would result in a significantly higher or lower valuation.
- Replacement cost per m² and per unit of plant. This reflects the cost of replacing Margaret Court Arena to its current condition taking into account its age (1 year).
$4,800 - $5,300 / m² ($5,100)
not applicable A significant increase or decrease in direct cost per square metre adjustment would result in a significantly higher or lower fair value.
AAMI Park Depreciated replacement cost
- Useful lives of structure / shell / building fabric, site engineering services and central plant, fit-outs and trunk reticulated building systems.
60 - 80 years (70 years)
60 - 80 years (70 years)
A significant increase or decrease in the estimated useful life of the asset would result in a significantly higher or lower valuation.
- Replacement cost per m² and per unit of plant. This reflects the cost of replacing AAMI Park to its current condition taking into account its age (5 years).
$4,800 - $5,300 / m² ($5,100)
$4,800 - $5,300 / m² ($5,100)
A significant increase or decrease in direct cost per square metre adjustment would result in a significantly higher or lower fair value.
33
MEL
BOUR
NE &
OLY
MPI
C PA
RKS
TRUS
T
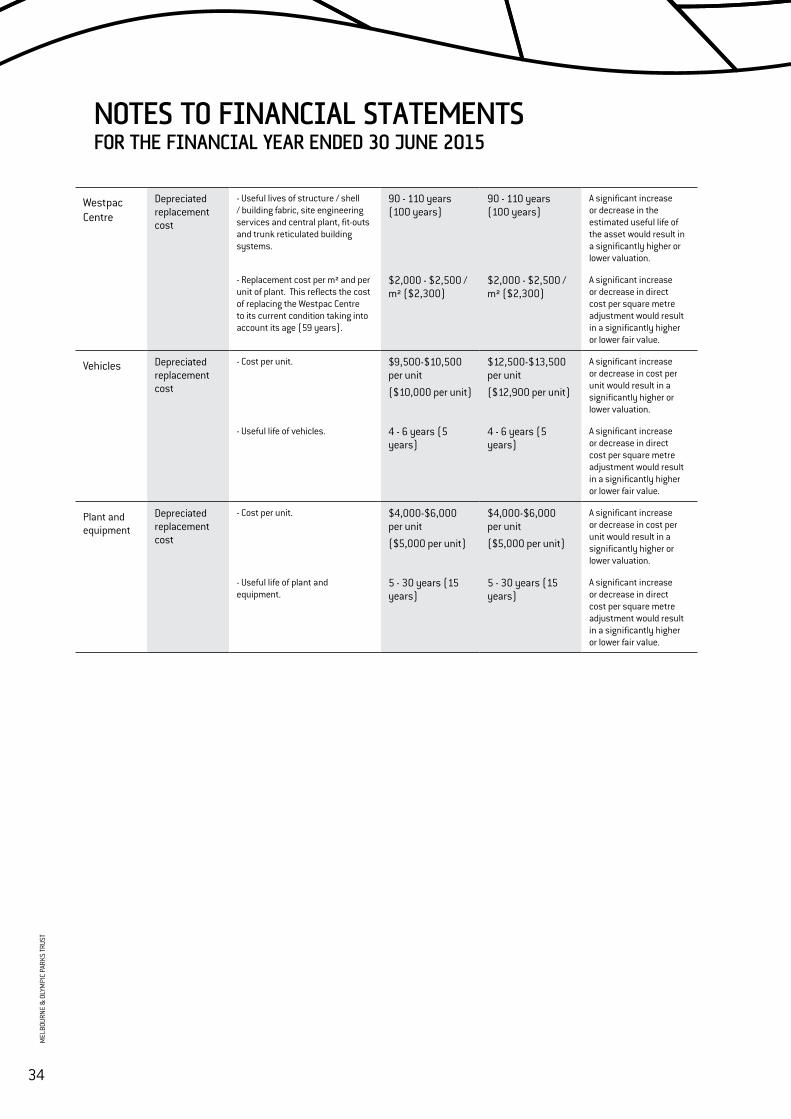
Westpac Centre
Depreciated replacement cost
- Useful lives of structure / shell / building fabric, site engineering services and central plant, fit-outs and trunk reticulated building systems.
90 - 110 years (100 years)
90 - 110 years (100 years)
A significant increase or decrease in the estimated useful life of the asset would result in a significantly higher or lower valuation.
- Replacement cost per m² and per unit of plant. This reflects the cost of replacing the Westpac Centre to its current condition taking into account its age (59 years).
$2,000 - $2,500 / m² ($2,300)
$2,000 - $2,500 / m² ($2,300)
A significant increase or decrease in direct cost per square metre adjustment would result in a significantly higher or lower fair value.
Vehicles Depreciated replacement cost
- Cost per unit. $9,500-$10,500 per unit($10,000 per unit)
$12,500-$13,500 per unit($12,900 per unit)
A significant increase or decrease in cost per unit would result in a significantly higher or lower valuation.
- Useful life of vehicles. 4 - 6 years (5 years)
4 - 6 years (5 years)
A significant increase or decrease in direct cost per square metre adjustment would result in a significantly higher or lower fair value.
Plant and equipment
Depreciated replacement cost
- Cost per unit. $4,000-$6,000 per unit($5,000 per unit)
$4,000-$6,000 per unit($5,000 per unit)
A significant increase or decrease in cost per unit would result in a significantly higher or lower valuation.
- Useful life of plant and equipment.
5 - 30 years (15 years)
5 - 30 years (15 years)
A significant increase or decrease in direct cost per square metre adjustment would result in a significantly higher or lower fair value.
NOTES TO FINANCIAL STATEMENTSFOR THE FINANCIAL YEAR ENDED 30 JUNE 2015
34
MEL
BOUR
NE &
OLY
MPI
C PA
RKS
TRUS
T
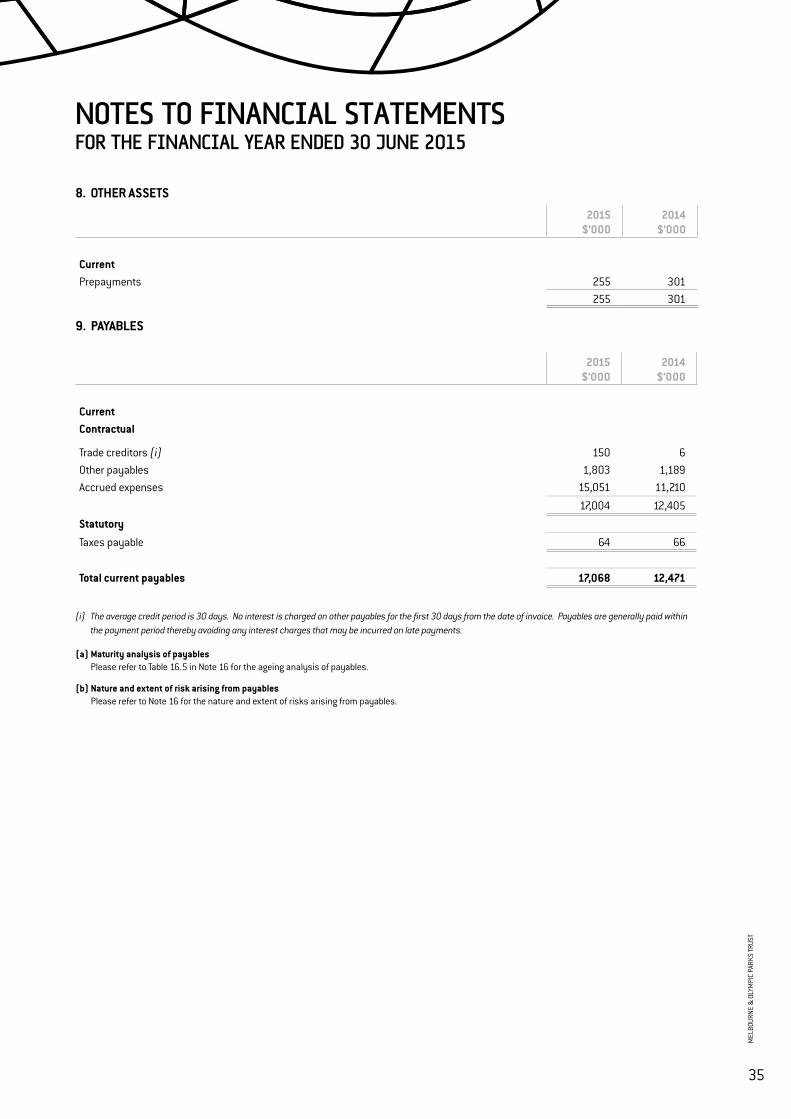
8. OTHER ASSETS
2015$’000
2014$’000
CurrentPrepayments 255 301
255 301
9. PAYABLES
2015$’000
2014$’000
CurrentContractual
Trade creditors (i) 150 6 Other payables 1,803 1,189 Accrued expenses 15,051 11,210
17,004 12,405
Statutory
Taxes payable 64 66
Total current payables 17,068 12,471
(i) The average credit period is 30 days. No interest is charged on other payables for the first 30 days from the date of invoice. Payables are generally paid within
the payment period thereby avoiding any interest charges that may be incurred on late payments.
(a) Maturity analysis of payables Please refer to Table 16.5 in Note 16 for the ageing analysis of payables.
(b) Nature and extent of risk arising from payables Please refer to Note 16 for the nature and extent of risks arising from payables.
NOTES TO FINANCIAL STATEMENTSFOR THE FINANCIAL YEAR ENDED 30 JUNE 2015
35
MEL
BOUR
NE &
OLY
MPI
C PA
RKS
TRUS
T
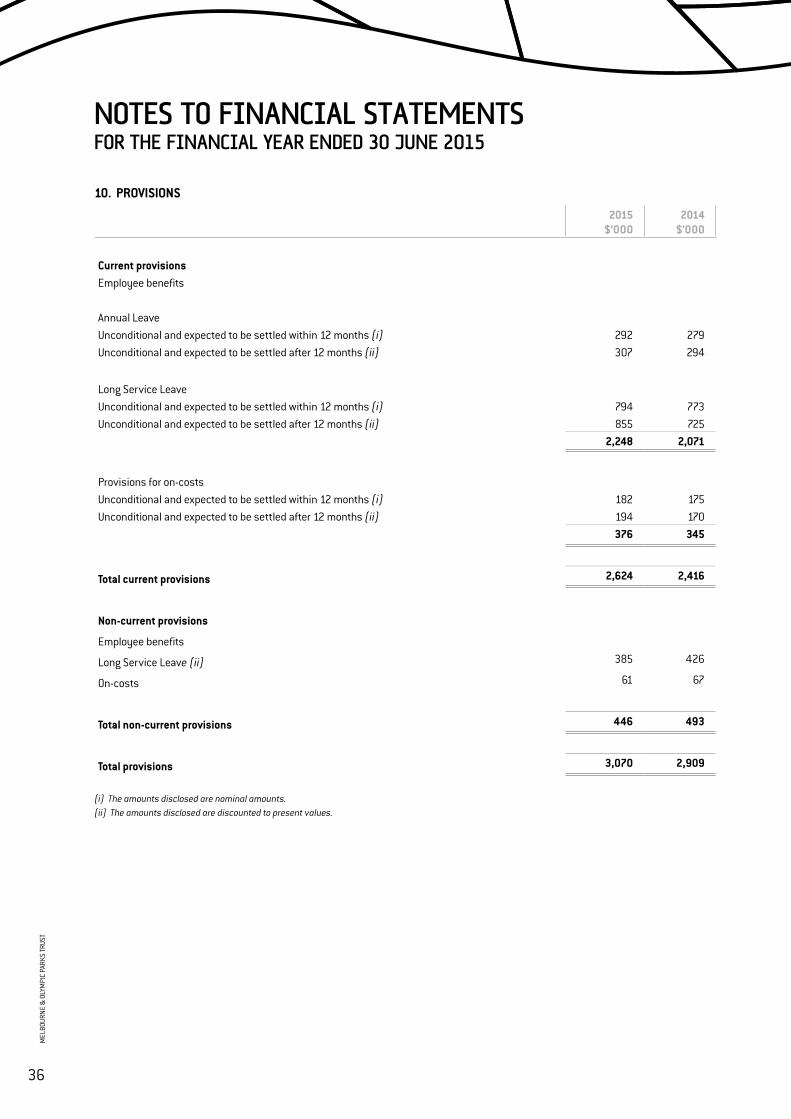
NOTES TO FINANCIAL STATEMENTSFOR THE FINANCIAL YEAR ENDED 30 JUNE 2015
10. PROVISIONS
2015$’000
2014$’000
Current provisionsEmployee benefits
Annual LeaveUnconditional and expected to be settled within 12 months (i) 292 279 Unconditional and expected to be settled after 12 months (ii) 307 294
Long Service LeaveUnconditional and expected to be settled within 12 months (i) 794 773 Unconditional and expected to be settled after 12 months (ii) 855 725
2,248 2,071
Provisions for on-costsUnconditional and expected to be settled within 12 months (i) 182 175 Unconditional and expected to be settled after 12 months (ii) 194 170
376 345
Total current provisions 2,624 2,416
Non-current provisions
Employee benefits
Long Service Leave (ii) 385 426
On-costs 61 67
Total non-current provisions 446 493
Total provisions 3,070 2,909
(i) The amounts disclosed are nominal amounts. (ii) The amounts disclosed are discounted to present values.
36
MEL
BOUR
NE &
OLY
MPI
C PA
RKS
TRUS
T
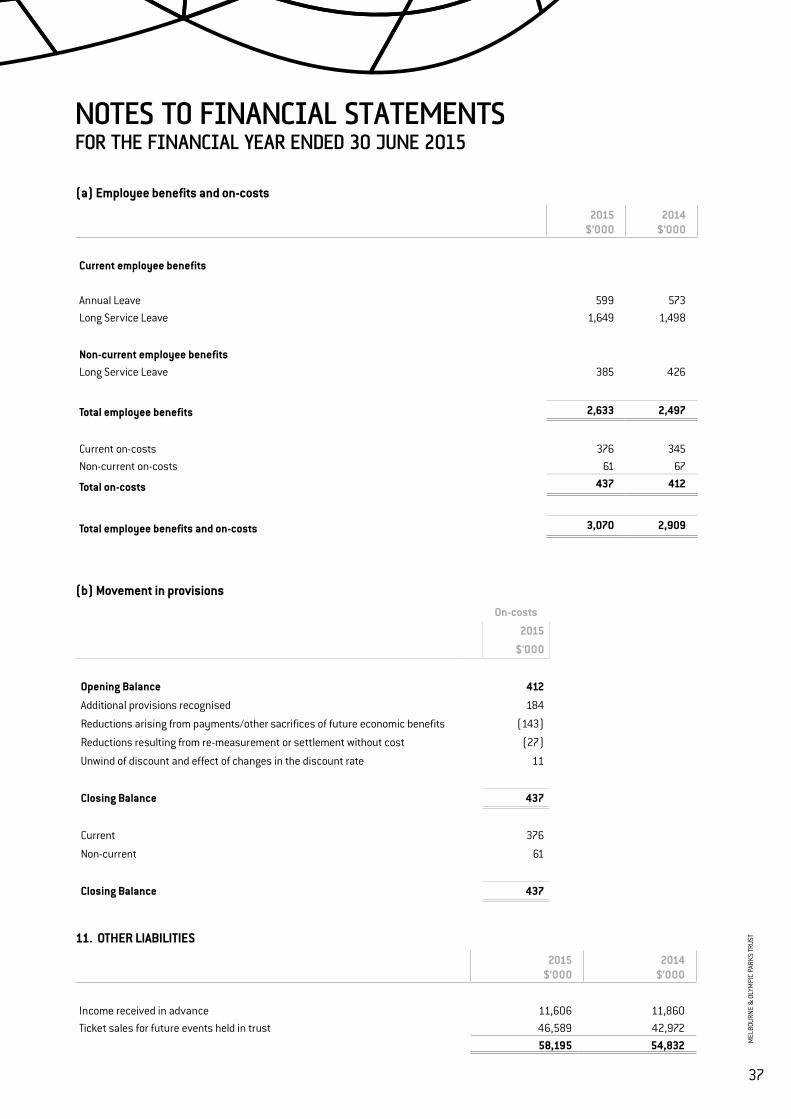
NOTES TO FINANCIAL STATEMENTSFOR THE FINANCIAL YEAR ENDED 30 JUNE 2015
(a) Employee benefits and on-costs
2015$’000
2014$’000
Current employee benefits
Annual Leave 599 573 Long Service Leave 1,649 1,498
Non-current employee benefitsLong Service Leave 385 426
Total employee benefits 2,633 2,497
Current on-costs 376 345 Non-current on-costs 61 67
Total on-costs 437 412
Total employee benefits and on-costs 3,070 2,909
(b) Movement in provisionsOn-costs
2015
$'000
Opening Balance 412
Additional provisions recognised 184
Reductions arising from payments/other sacrifices of future economic benefits (143)
Reductions resulting from re-measurement or settlement without cost (27)
Unwind of discount and effect of changes in the discount rate 11
Closing Balance 437
Current 376
Non-current 61
Closing Balance 437
11. OTHER LIABILITIES
2015$’000
2014$’000
Income received in advance 11,606 11,860 Ticket sales for future events held in trust 46,589 42,972
58,195 54,832
37
MEL
BOUR
NE &
OLY
MPI
C PA
RKS
TRUS
T
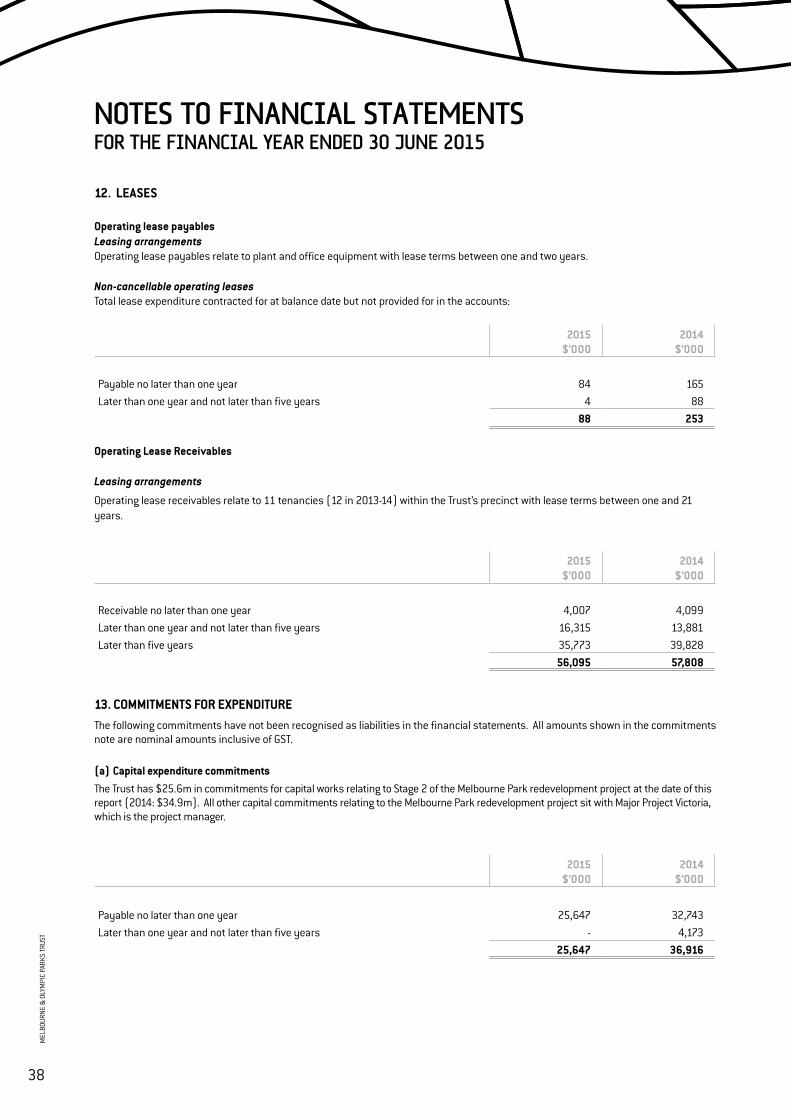
NOTES TO FINANCIAL STATEMENTSFOR THE FINANCIAL YEAR ENDED 30 JUNE 2015
Operating Lease Receivables
Leasing arrangements
Operating lease receivables relate to 11 tenancies (12 in 2013-14) within the Trust’s precinct with lease terms between one and 21 years.
2015$’000
2014$’000
Receivable no later than one year 4,007 4,099 Later than one year and not later than five years 16,315 13,881 Later than five years 35,773 39,828
56,095 57,808
13. COMMITMENTS FOR EXPENDITUREThe following commitments have not been recognised as liabilities in the financial statements. All amounts shown in the commitments note are nominal amounts inclusive of GST.
(a) Capital expenditure commitmentsThe Trust has $25.6m in commitments for capital works relating to Stage 2 of the Melbourne Park redevelopment project at the date of this report (2014: $34.9m). All other capital commitments relating to the Melbourne Park redevelopment project sit with Major Project Victoria, which is the project manager.
2015$’000
2014$’000
Payable no later than one year 25,647 32,743 Later than one year and not later than five years - 4,173
25,647 36,916
12. LEASES
Operating lease payablesLeasing arrangementsOperating lease payables relate to plant and office equipment with lease terms between one and two years.
Non-cancellable operating leasesTotal lease expenditure contracted for at balance date but not provided for in the accounts:
2015$’000
2014$’000
Payable no later than one year 84 165 Later than one year and not later than five years 4 88
88 253
38
MEL
BOUR
NE &
OLY
MPI
C PA
RKS
TRUS
T
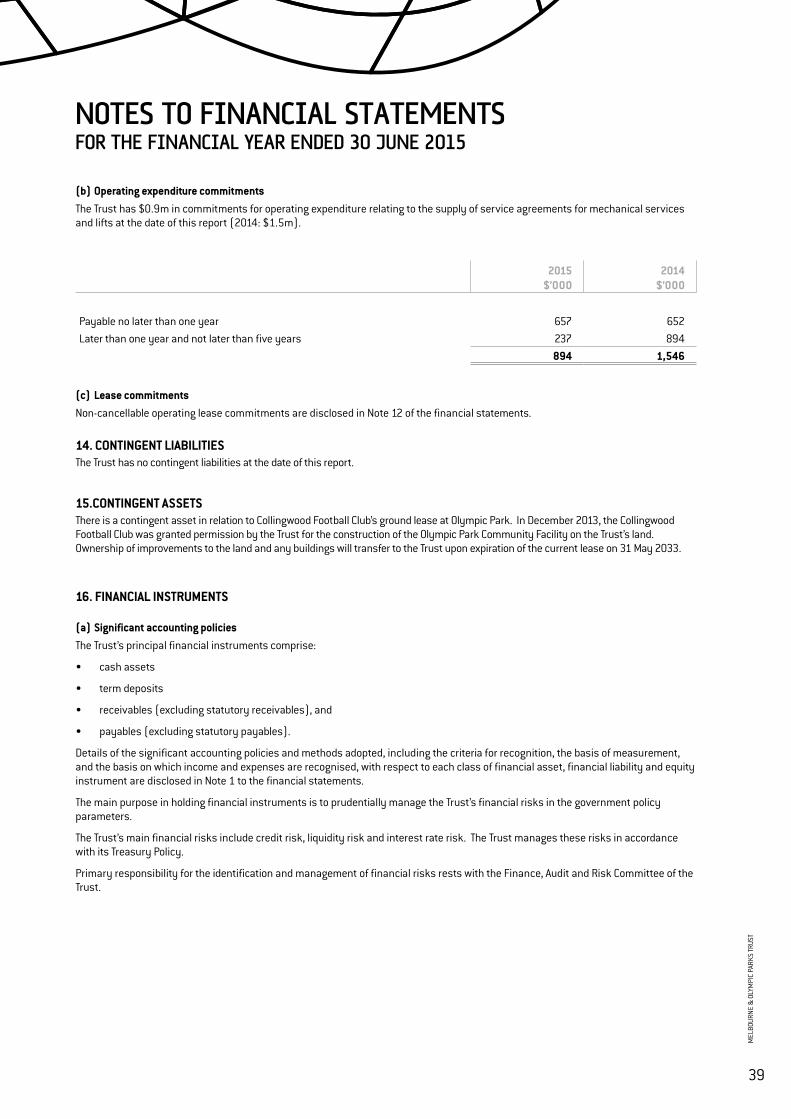
NOTES TO FINANCIAL STATEMENTSFOR THE FINANCIAL YEAR ENDED 30 JUNE 2015
14. CONTINGENT LIABILITIESThe Trust has no contingent liabilities at the date of this report.
15.CONTINGENT ASSETSThere is a contingent asset in relation to Collingwood Football Club’s ground lease at Olympic Park. In December 2013, the Collingwood Football Club was granted permission by the Trust for the construction of the Olympic Park Community Facility on the Trust’s land. Ownership of improvements to the land and any buildings will transfer to the Trust upon expiration of the current lease on 31 May 2033.
16. FINANCIAL INSTRUMENTS
(a) Significant accounting policiesThe Trust’s principal financial instruments comprise:
• cash assets
• term deposits
• receivables (excluding statutory receivables), and
• payables (excluding statutory payables).
Details of the significant accounting policies and methods adopted, including the criteria for recognition, the basis of measurement, and the basis on which income and expenses are recognised, with respect to each class of financial asset, financial liability and equity instrument are disclosed in Note 1 to the financial statements.
The main purpose in holding financial instruments is to prudentially manage the Trust’s financial risks in the government policy parameters.
The Trust’s main financial risks include credit risk, liquidity risk and interest rate risk. The Trust manages these risks in accordance with its Treasury Policy.
Primary responsibility for the identification and management of financial risks rests with the Finance, Audit and Risk Committee of the Trust.
(b) Operating expenditure commitmentsThe Trust has $0.9m in commitments for operating expenditure relating to the supply of service agreements for mechanical services and lifts at the date of this report (2014: $1.5m).
2015$’000
2014$’000
Payable no later than one year 657 652 Later than one year and not later than five years 237 894
894 1,546
(c) Lease commitmentsNon-cancellable operating lease commitments are disclosed in Note 12 of the financial statements.
39
MEL
BOUR
NE &
OLY
MPI
C PA
RKS
TRUS
T
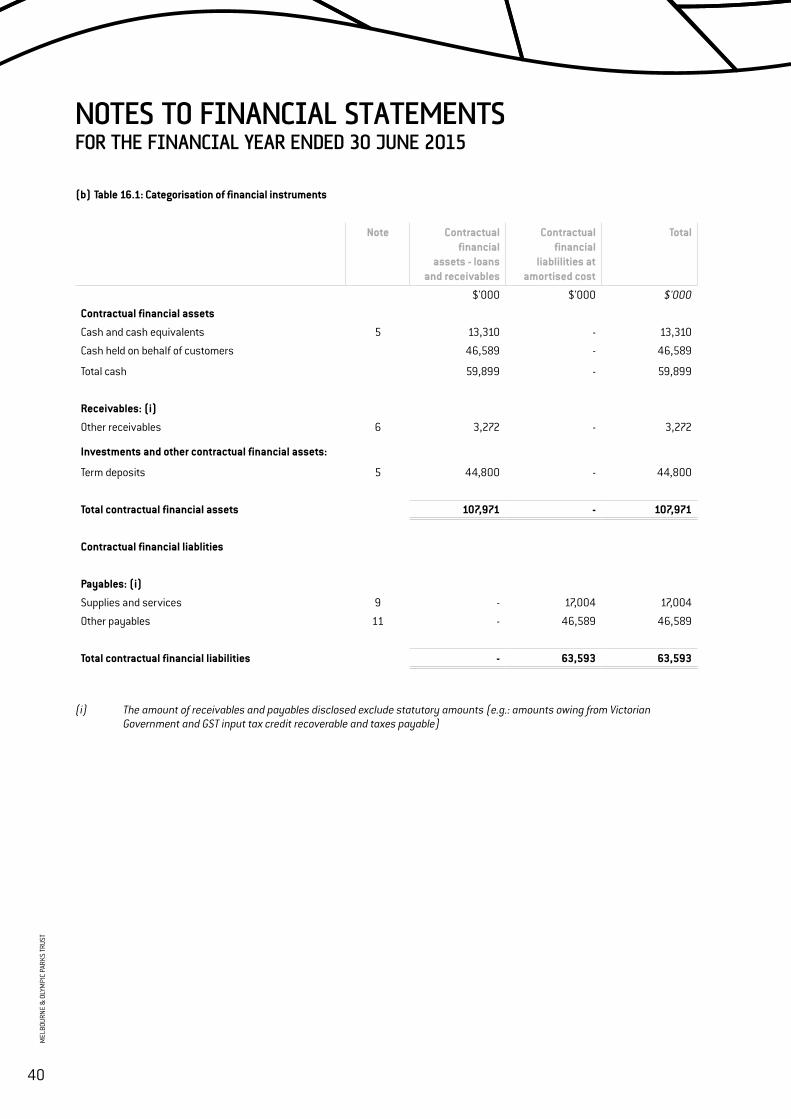
NOTES TO FINANCIAL STATEMENTSFOR THE FINANCIAL YEAR ENDED 30 JUNE 2015
(b) Table 16.1: Categorisation of financial instruments
Note Contractual financial
assets - loans and receivables
Contractual financial
liablilities at amortised cost
Total
$'000 $'000 $'000
Contractual financial assets
Cash and cash equivalents 5 13,310 - 13,310
Cash held on behalf of customers 46,589 - 46,589
Total cash 59,899 - 59,899
Receivables: (i)
Other receivables 6 3,272 - 3,272
Investments and other contractual financial assets:
Term deposits 5 44,800 - 44,800
Total contractual financial assets 107,971 - 107,971
Contractual financial liablities
Payables: (i)
Supplies and services 9 - 17,004 17,004
Other payables 11 - 46,589 46,589
Total contractual financial liabilities - 63,593 63,593
(i) The amount of receivables and payables disclosed exclude statutory amounts (e.g.: amounts owing from Victorian Government and GST input tax credit recoverable and taxes payable)
40
MEL
BOUR
NE &
OLY
MPI
C PA
RKS
TRUS
T
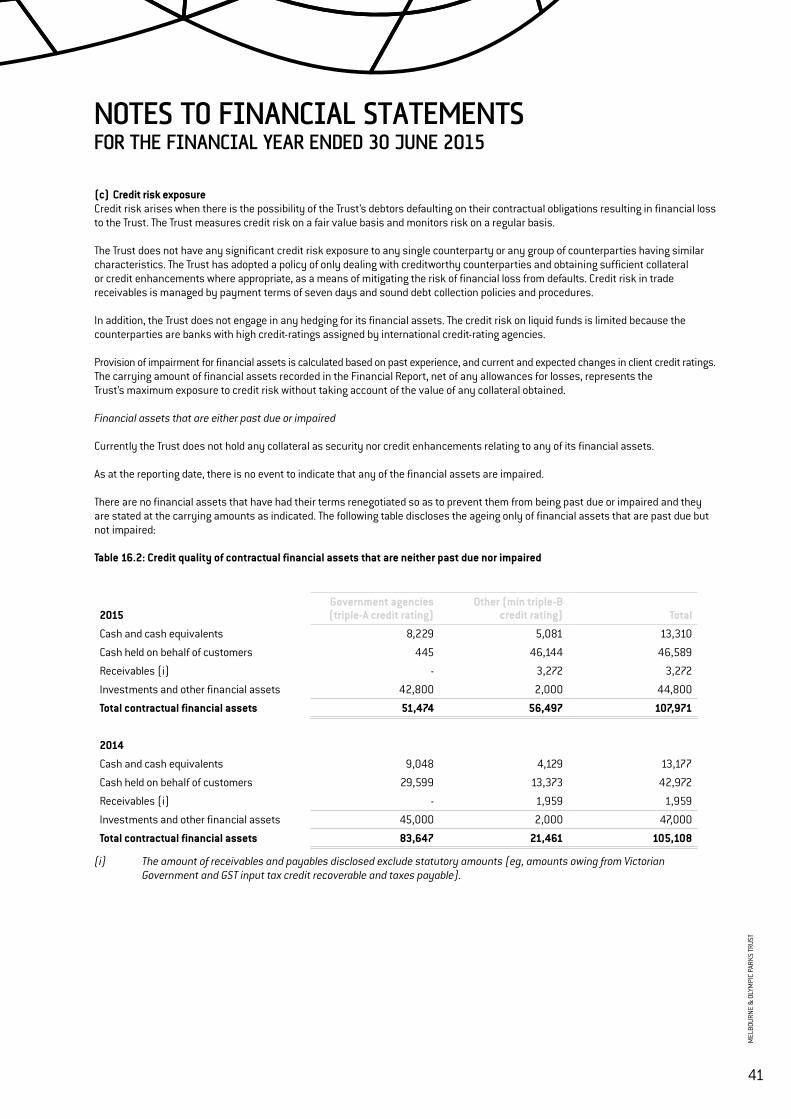
(c) Credit risk exposureCredit risk arises when there is the possibility of the Trust’s debtors defaulting on their contractual obligations resulting in financial loss to the Trust. The Trust measures credit risk on a fair value basis and monitors risk on a regular basis.
The Trust does not have any significant credit risk exposure to any single counterparty or any group of counterparties having similar characteristics. The Trust has adopted a policy of only dealing with creditworthy counterparties and obtaining sufficient collateral or credit enhancements where appropriate, as a means of mitigating the risk of financial loss from defaults. Credit risk in trade receivables is managed by payment terms of seven days and sound debt collection policies and procedures.
In addition, the Trust does not engage in any hedging for its financial assets. The credit risk on liquid funds is limited because the counterparties are banks with high credit-ratings assigned by international credit-rating agencies.
Provision of impairment for financial assets is calculated based on past experience, and current and expected changes in client credit ratings.The carrying amount of financial assets recorded in the Financial Report, net of any allowances for losses, represents theTrust’s maximum exposure to credit risk without taking account of the value of any collateral obtained.
Financial assets that are either past due or impaired
Currently the Trust does not hold any collateral as security nor credit enhancements relating to any of its financial assets.
As at the reporting date, there is no event to indicate that any of the financial assets are impaired.
There are no financial assets that have had their terms renegotiated so as to prevent them from being past due or impaired and they are stated at the carrying amounts as indicated. The following table discloses the ageing only of financial assets that are past due but not impaired:
NOTES TO FINANCIAL STATEMENTSFOR THE FINANCIAL YEAR ENDED 30 JUNE 2015
Table 16.2: Credit quality of contractual financial assets that are neither past due nor impaired
2015Government agencies (triple-A credit rating)
Other (min triple-B credit rating) Total
Cash and cash equivalents 8,229 5,081 13,310
Cash held on behalf of customers 445 46,144 46,589
Receivables (i) - 3,272 3,272
Investments and other financial assets 42,800 2,000 44,800
Total contractual financial assets 51,474 56,497 107,971
2014
Cash and cash equivalents 9,048 4,129 13,177
Cash held on behalf of customers 29,599 13,373 42,972
Receivables (i) - 1,959 1,959
Investments and other financial assets 45,000 2,000 47,000
Total contractual financial assets 83,647 21,461 105,108
(i) The amount of receivables and payables disclosed exclude statutory amounts (eg, amounts owing from Victorian Government and GST input tax credit recoverable and taxes payable).
41
MEL
BOUR
NE &
OLY
MPI
C PA
RKS
TRUS
T
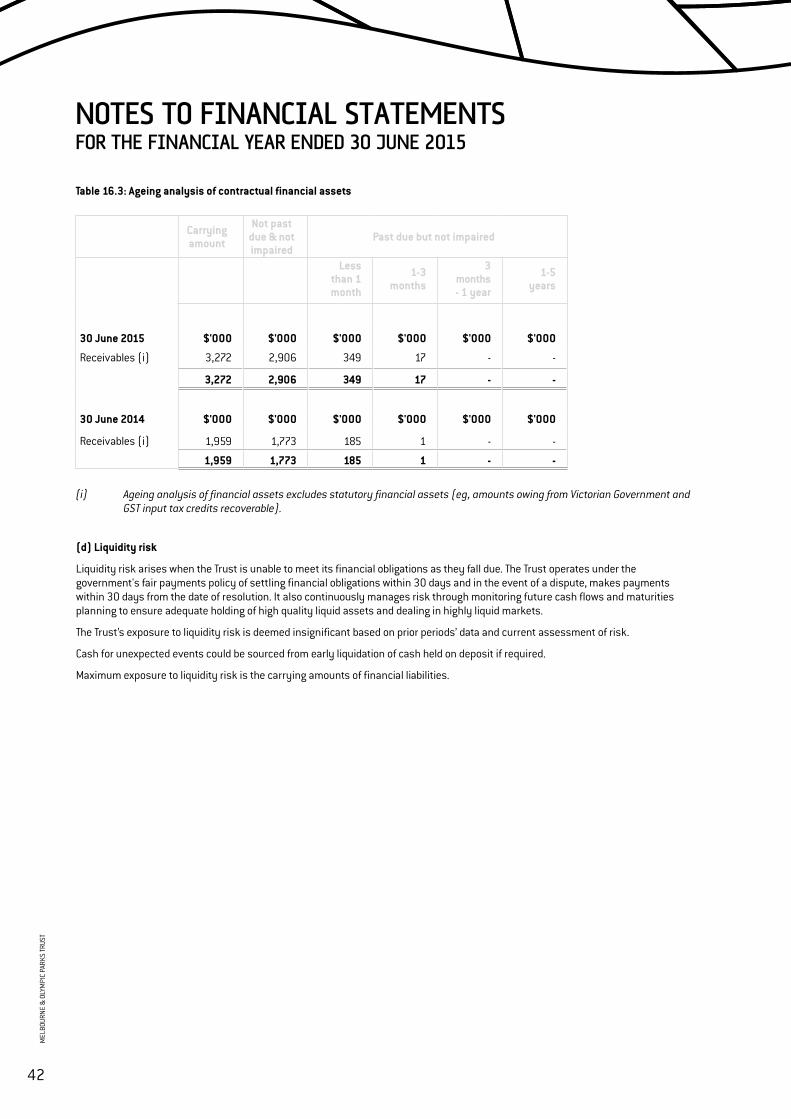
NOTES TO FINANCIAL STATEMENTSFOR THE FINANCIAL YEAR ENDED 30 JUNE 2015
(d) Liquidity risk
Liquidity risk arises when the Trust is unable to meet its financial obligations as they fall due. The Trust operates under the government's fair payments policy of settling financial obligations within 30 days and in the event of a dispute, makes payments within 30 days from the date of resolution. It also continuously manages risk through monitoring future cash flows and maturities planning to ensure adequate holding of high quality liquid assets and dealing in highly liquid markets.
The Trust’s exposure to liquidity risk is deemed insignificant based on prior periods’ data and current assessment of risk.
Cash for unexpected events could be sourced from early liquidation of cash held on deposit if required.
Maximum exposure to liquidity risk is the carrying amounts of financial liabilities.
Table 16.3: Ageing analysis of contractual financial assets
Carryingamount
Not pastdue & notimpaired
Past due but not impaired
Lessthan 1month
1-3months
3months- 1 year
1-5years
30 June 2015 $'000 $'000 $'000 $'000 $'000 $'000
Receivables (i) 3,272 2,906 349 17 - -
3,272 2,906 349 17 - -
30 June 2014 $'000 $'000 $'000 $'000 $'000 $'000
Receivables (i) 1,959 1,773 185 1 - -
1,959 1,773 185 1 - -
(i) Ageing analysis of financial assets excludes statutory financial assets (eg, amounts owing from Victorian Government and GST input tax credits recoverable).
42
MEL
BOUR
NE &
OLY
MPI
C PA
RKS
TRUS
T
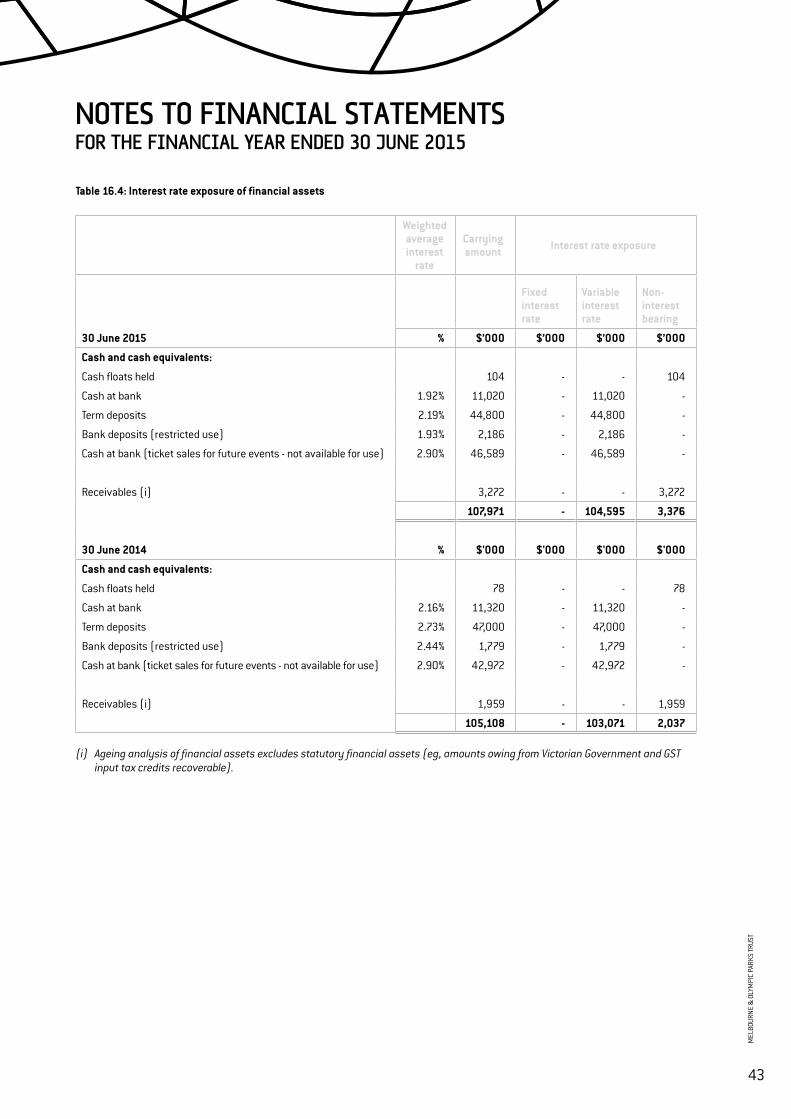
NOTES TO FINANCIAL STATEMENTSFOR THE FINANCIAL YEAR ENDED 30 JUNE 2015
Table 16.4: Interest rate exposure of financial assets
Weighted average interest
rate
Carrying amount Interest rate exposure
Fixed interest rate
Variable interest rate
Non-interest bearing
30 June 2015 % $’000 $’000 $’000 $’000
Cash and cash equivalents:
Cash floats held 104 - - 104
Cash at bank 1.92% 11,020 - 11,020 -
Term deposits 2.19% 44,800 - 44,800 -
Bank deposits (restricted use) 1.93% 2,186 - 2,186 -
Cash at bank (ticket sales for future events - not available for use) 2.90% 46,589 - 46,589 -
Receivables (i) 3,272 - - 3,272
107,971 - 104,595 3,376
30 June 2014 % $'000 $'000 $'000 $'000
Cash and cash equivalents:
Cash floats held 78 - - 78
Cash at bank 2.16% 11,320 - 11,320 -
Term deposits 2.73% 47,000 - 47,000 -
Bank deposits (restricted use) 2.44% 1,779 - 1,779 -
Cash at bank (ticket sales for future events - not available for use) 2.90% 42,972 - 42,972 -
Receivables (i) 1,959 - - 1,959
105,108 - 103,071 2,037
(i) Ageing analysis of financial assets excludes statutory financial assets (eg, amounts owing from Victorian Government and GST input tax credits recoverable).
43
MEL
BOUR
NE &
OLY
MPI
C PA
RKS
TRUS
T
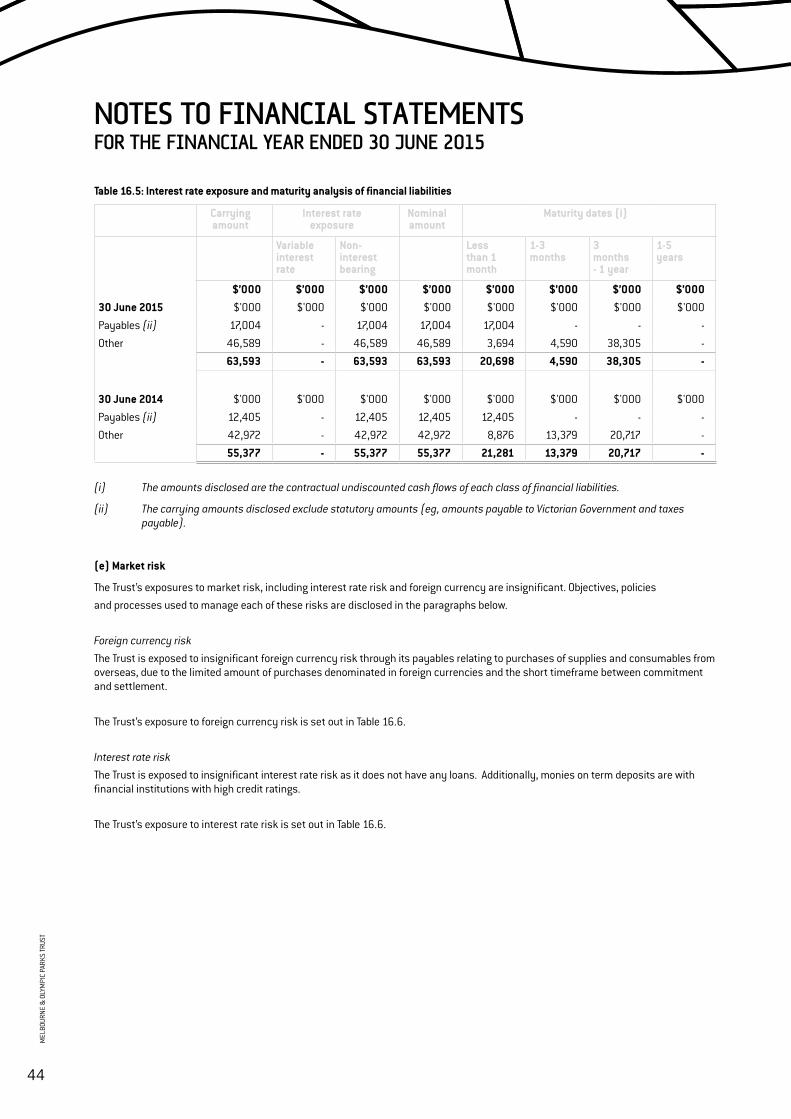
NOTES TO FINANCIAL STATEMENTSFOR THE FINANCIAL YEAR ENDED 30 JUNE 2015
Table 16.5: Interest rate exposure and maturity analysis of financial liabilities
Carryingamount
Interest rate exposure
Nominalamount
Maturity dates (i)
Variableinterestrate
Non-interestbearing
Lessthan 1month
1-3months
3months- 1 year
1-5years
$’000 $’000 $’000 $’000 $’000 $’000 $’000 $’000 30 June 2015 $'000 $'000 $'000 $'000 $'000 $'000 $'000 $'000 Payables (ii) 17,004 - 17,004 17,004 17,004 - - - Other 46,589 - 46,589 46,589 3,694 4,590 38,305 -
63,593 - 63,593 63,593 20,698 4,590 38,305 -
30 June 2014 $'000 $'000 $'000 $'000 $'000 $'000 $'000 $'000 Payables (ii) 12,405 - 12,405 12,405 12,405 - - - Other 42,972 - 42,972 42,972 8,876 13,379 20,717 -
55,377 - 55,377 55,377 21,281 13,379 20,717 -
(i) The amounts disclosed are the contractual undiscounted cash flows of each class of financial liabilities.
(ii) The carrying amounts disclosed exclude statutory amounts (eg, amounts payable to Victorian Government and taxes payable).
(e) Market risk
The Trust’s exposures to market risk, including interest rate risk and foreign currency are insignificant. Objectives, policiesand processes used to manage each of these risks are disclosed in the paragraphs below.
Foreign currency riskThe Trust is exposed to insignificant foreign currency risk through its payables relating to purchases of supplies and consumables from overseas, due to the limited amount of purchases denominated in foreign currencies and the short timeframe between commitment and settlement.
The Trust’s exposure to foreign currency risk is set out in Table 16.6.
Interest rate riskThe Trust is exposed to insignificant interest rate risk as it does not have any loans. Additionally, monies on term deposits are with financial institutions with high credit ratings.
The Trust’s exposure to interest rate risk is set out in Table 16.6.
44
MEL
BOUR
NE &
OLY
MPI
C PA
RKS
TRUS
T
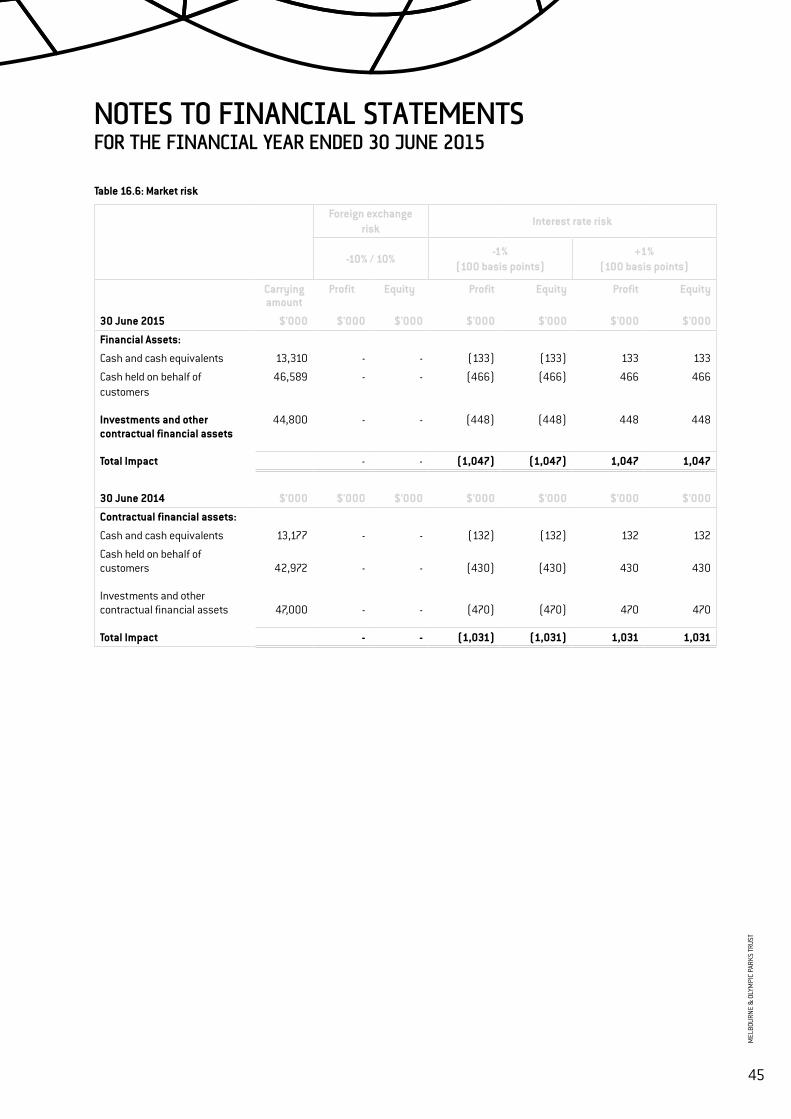
NOTES TO FINANCIAL STATEMENTSFOR THE FINANCIAL YEAR ENDED 30 JUNE 2015
Table 16.6: Market risk
Foreign exchangerisk
Interest rate risk
-10% / 10% -1%
(100 basis points)+1%
(100 basis points)
Carryingamount
Profit Equity Profit Equity Profit Equity
30 June 2015 $'000 $'000 $'000 $'000 $'000 $'000 $'000
Financial Assets:
Cash and cash equivalents 13,310 - - (133) (133) 133 133
Cash held on behalf of customers
46,589 - - (466) (466) 466 466
Investments and other contractual financial assets
44,800 - - (448) (448) 448 448
Total Impact - - (1,047) (1,047) 1,047 1,047
30 June 2014 $'000 $'000 $'000 $'000 $'000 $'000 $'000
Contractual financial assets:
Cash and cash equivalents 13,177 - - (132) (132) 132 132
Cash held on behalf of customers 42,972 - - (430) (430) 430 430
Investments and other contractual financial assets 47,000 - - (470) (470) 470 470
Total Impact - - (1,031) (1,031) 1,031 1,031
45
MEL
BOUR
NE &
OLY
MPI
C PA
RKS
TRUS
T
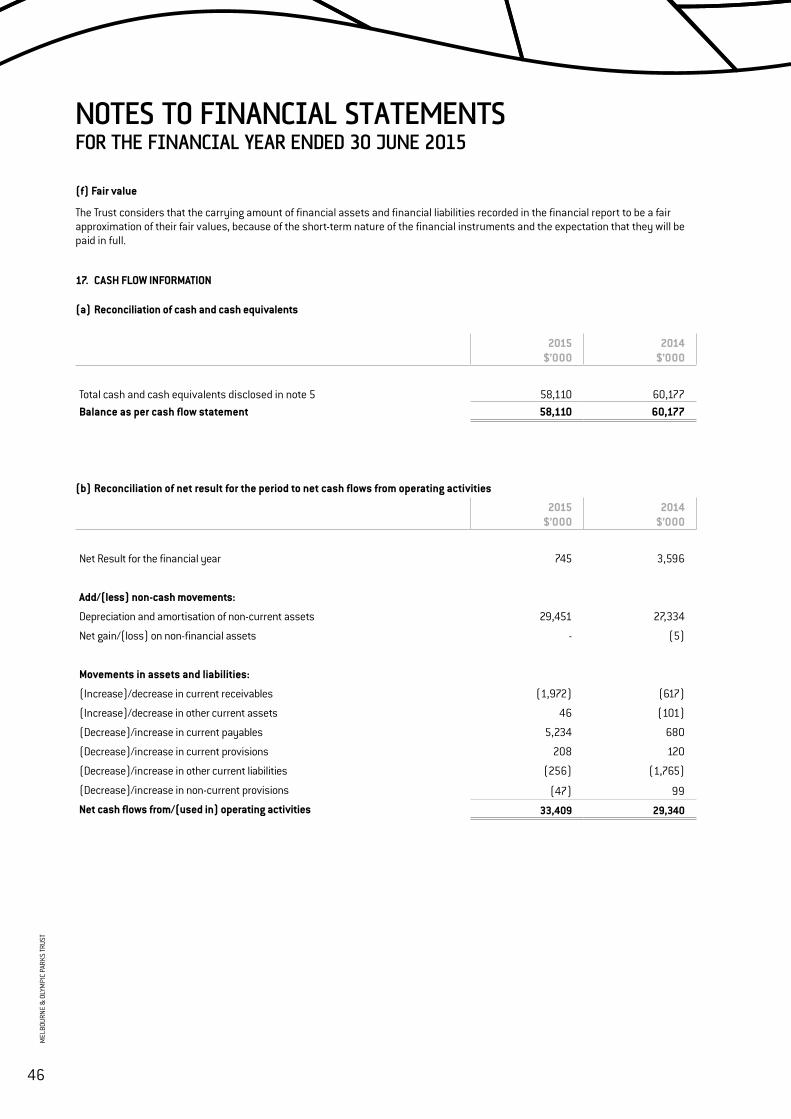
NOTES TO FINANCIAL STATEMENTSFOR THE FINANCIAL YEAR ENDED 30 JUNE 2015
(f) Fair value
The Trust considers that the carrying amount of financial assets and financial liabilities recorded in the financial report to be a fair approximation of their fair values, because of the short-term nature of the financial instruments and the expectation that they will be paid in full.
17. CASH FLOW INFORMATION
(a) Reconciliation of cash and cash equivalents
2015$’000
2014$’000
Total cash and cash equivalents disclosed in note 5 58,110 60,177 Balance as per cash flow statement 58,110 60,177
(b) Reconciliation of net result for the period to net cash flows from operating activities
2015$’000
2014$’000
Net Result for the financial year 745 3,596
Add/(less) non-cash movements:
Depreciation and amortisation of non-current assets 29,451 27,334
Net gain/(loss) on non-financial assets - (5)
Movements in assets and liabilities:
(Increase)/decrease in current receivables (1,972) (617)
(Increase)/decrease in other current assets 46 (101)
(Decrease)/increase in current payables 5,234 680
(Decrease)/increase in current provisions 208 120
(Decrease)/increase in other current liabilities (256) (1,765)
(Decrease)/increase in non-current provisions (47) 99
Net cash flows from/(used in) operating activities 33,409 29,340
46
MEL
BOUR
NE &
OLY
MPI
C PA
RKS
TRUS
T
18. RESPONSIBLE PERSONS
In accordance with the Ministerial Directions issued by the Minister for Finance under the Financial Management Act 1994, the following disclosures are made regarding responsible persons for the reporting period.
NamesThe persons who held the positions of Ministers and Accountable Officers for the Trust are as follows:
PremierThe Honourable Denis Napthine, Premier of Victoria (to 03/12/14)The Honourable Daniel Andrews, Premier of Victoria (from 04/12/14)
MinisterThe Honourable Damian Drum, Minister for Sport and Recreation (to 03/12/14)The Honourable John Eren, Minister for Sport, Minister for Tourism and Major Events and Minister for Veterans Affairs (from 04/12/14)
TrustMr Russell Caplan (Chairman)Ms Deborah Beale (to 12/11/14)Mr Stephen HealyMs Sharelle McMahonMs Diana NicholsonMr Kenneth Roche, AOMr Raymond SmithMs Mikaela Stafrace (from 22/07/14)Mr David StobartMr Scott Tanner
Trust Secretary and Chief Executive OfficerMr Brian Morris
RemunerationTotal remuneration (including incentive payments) received or receivable by the Accountable Officer in connection with the management of the Trust during the reporting period was in the range of $450,000 - $459,999 ($420,000 - $429,999 in 2013-14).
Trustees did not receive any remuneration from the Trust during the financial year. (2013-14: $0).
Related party transactionsCommercial dealings were undertaken during the reporting period with Tennis Australia and Tennis Victoria, both of which have representatives holding positions as Trustees on the Melbourne and Olympic Parks Trust.
During 2014-15, the Trust invoiced Tennis Australia $30,077,095 ($28,432,448 in 2013-14) and as at 30 June 2015, Tennis Australia owed the Trust $640,400 ($560,764 at 30 June 2014). Mr Stephen Healy and Mr Scott Tanner hold positions on the Melbourne and Olympic Parks Trust and also hold positions at Tennis Australia (President and Director respectively). Tennis Australia is the promoter of the Australian Open event, runs a court hire business on the Trust’s premises and rents office space from the Trust.
During 2014-15, the Trust invoiced Tennis Victoria $199,062 ($132,343 in 2013-14) and at 30 June 2015, Tennis Victoria owed the Trust $11,731 ($0 at 30 June 2014). Mr David Stobart holds a position on the Melbourne and Olympic Parks Trust and also holds the position of President of Tennis Victoria. Tennis Victoria rents office space on the Trust’s premises and purchase related services from the Trust.
There are no other receivable amounts or loans outstanding in relation to related parties, as at 30 June 2015.
NOTES TO FINANCIAL STATEMENTSFOR THE FINANCIAL YEAR ENDED 30 JUNE 2015
47
MEL
BOUR
NE &
OLY
MPI
C PA
RKS
TRUS
T
NOTES TO FINANCIAL STATEMENTSFOR THE FINANCIAL YEAR ENDED 30 JUNE 2015
19. REMUNERATION OF EXECUTIVES AND PAYMENTS TO OTHER PERSONNEL
(a) Remuneration of executivesThe number of Executive Officers and employees with management responsibilities, other than the Accountable Officer, and their total remuneration during the reporting period are shown in the first two columns in the tables below in their relevant income bands. The base remuneration of is shown in the third column and a comparative to the prior year in the fourth column. Base remuneration is exclusive of bonus payments, long service leave payments, redundancy payments and retirement benefits.
Income band Total Remuneration Base Remuneration
2015 2014 2015 2014 No. No. No. No.
< $99,999 - - - 1$110,000 - $119,999 1 1 2 - $120,000 - $129,999 1 - - - $140,000 - $149,999 - 3 - 3$150,000 - $159,999 3 2 3 2$160,000 - $169,999 2 - 2 - $220,000 - $229,999 1 1 1 1$230,000 - $239,999 1 - 1 - $240,000 - $249,999 - 1 - 1$250,000 - $259,999 1 - 1 - $240,000 - $249,999 - 1 - 1$250,000 - $259,999 1 - 1 - Total numbers of executives 10 8 10 8
Total annualised employee equivalents (i) 10 8 10 8
$’000 $’000 $’000 $’000
Total remuneration 1,742 1,345 1,736 1,279
Note: (i) Annualised employee equivalent is based on paid working hour of 38 ordinary hours per week over the 52 weeks for a reporting period.
(b) Remuneration of employees with management responsibilities
Income band Total Remuneration Base Remuneration
2015 2014 2015 2014 No. No. No. No.
< $99,999 - - - 1$100,000 - $109,999 4 4 4 4$110,000 - $119,999 4 1 4 2$120,000 - $129,999 1 3 1 2$130,000 - $139,999 3 3 3 3$140,000 - $149,999 1 - 1 - $150,000 - $159,999 - 1 - - Total numbers 13 12 13 12
$’000 $’000 $’000 $’000
Total remuneration 1,559 1,480 1,555 1,408
48
MEL
BOUR
NE &
OLY
MPI
C PA
RKS
TRUS
T
20. REMUNERATION OF AUDITORS
Audit fees paid or payable to the Victorian Auditor-General’s Office for the audit of the Trust’s financial report and KPMG for the Trust’s internal audit program:
2015$’000
2014$’000
Audit or review of the financial statements 56 54 Internal audit services 81 105
137 159
NOTES TO FINANCIAL STATEMENTSFOR THE FINANCIAL YEAR ENDED 30 JUNE 2015
(c) Payments to other personnel (i.e. contractors with significant management responsibilities)The following disclosures are made in relation to other personnel of Melbourne and Olympic Parks Trust, i.e. contractors charged with significant management responsibilities.
Payments have been made to a contractor with significant management responsibilities, which are disclosed in the $10,000 expense band. This contractor is responsible for planning, directing or controlling, directly or indirectly, the Trust’s activities.
The change in the total expenses from 2014 to 2015 was driven by a contractor with significant management responsibilities being formally employed by the Trust during the 2015 reporting period.
Expense band Total Expenses (exclusive of GST)
2015 2014
No. No.
$100,000 - $109,999 - 1
$170,000 - $179,999 1 -
$240,000 - $249,999 - 1
Total numbers 1 2
$’000 $’000
Total expenses (exclusive of GST) 172 345
49
MEL
BOUR
NE &
OLY
MPI
C PA
RKS
TRUS
T
NOTES TO FINANCIAL STATEMENTSFOR THE FINANCIAL YEAR ENDED 30 JUNE 2015
At the reporting date, superannuation contributions outstanding were $0 (2014 $0).
22. SUBSEQUENT EVENTS
No material or significant events occurred after the reporting date.
21. EMPLOYEE SUPERANNUATION
Superannuation contributions for the reporting period are included as part of employee benefits and on-costs in the comprehensive operating statement of the Trust.
The name and details of the major employee superannuation funds and contributions (above $10,000) made by the Trust during the reporting period are as follows:
2015$’000
2014$’000
AustralianSuper 860 847 HOSTPLUS 105 89 NAVIGATOR Super Solutions 78 104 CARE Super 35 22 VicSuper Pty Ltd 34 36 RETAIL Employees Superannuation Pty Ltd 34 29 Colonial First State First Choice Personal Super 24 16 First State Super 22 22 OnePath MasterFund 20 6 AMP Flexible Lifetime Super (901245955) 16 12 BT Super for Life 14 5 C+BUS 14 15 Optimum Corporate Super 13 2 Others 126 144 Emergency Services Superannuation Scheme 11 4 Others 125 139 TOTAL 1,394 1,347
50
MEL
BOUR
NE &
OLY
MPI
C PA
RKS
TRUS
T
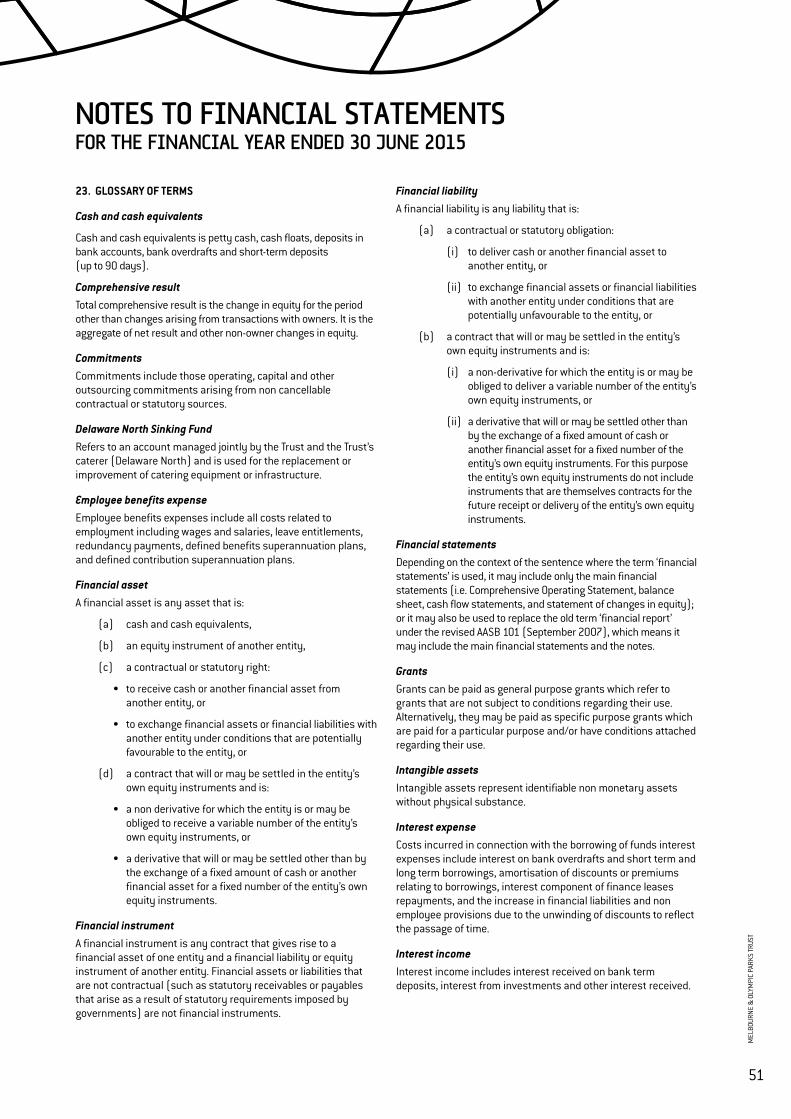
NOTES TO FINANCIAL STATEMENTSFOR THE FINANCIAL YEAR ENDED 30 JUNE 2015
23. GLOSSARY OF TERMS
Cash and cash equivalents
Cash and cash equivalents is petty cash, cash floats, deposits in bank accounts, bank overdrafts and short-term deposits (up to 90 days).
Comprehensive resultTotal comprehensive result is the change in equity for the period other than changes arising from transactions with owners. It is the aggregate of net result and other non-owner changes in equity.
CommitmentsCommitments include those operating, capital and other outsourcing commitments arising from non cancellable contractual or statutory sources.
Delaware North Sinking FundRefers to an account managed jointly by the Trust and the Trust’s caterer (Delaware North) and is used for the replacement or improvement of catering equipment or infrastructure.
Employee benefits expenseEmployee benefits expenses include all costs related to employment including wages and salaries, leave entitlements, redundancy payments, defined benefits superannuation plans, and defined contribution superannuation plans.
Financial assetA financial asset is any asset that is:
(a) cash and cash equivalents,
(b) an equity instrument of another entity,
(c) a contractual or statutory right:
• to receive cash or another financial asset from another entity, or
• to exchange financial assets or financial liabilities with another entity under conditions that are potentially favourable to the entity, or
(d) a contract that will or may be settled in the entity’s own equity instruments and is:
• a non derivative for which the entity is or may be obliged to receive a variable number of the entity’s own equity instruments, or
• a derivative that will or may be settled other than by the exchange of a fixed amount of cash or another financial asset for a fixed number of the entity’s own equity instruments.
Financial instrumentA financial instrument is any contract that gives rise to a financial asset of one entity and a financial liability or equity instrument of another entity. Financial assets or liabilities that are not contractual (such as statutory receivables or payables that arise as a result of statutory requirements imposed by governments) are not financial instruments.
Financial liabilityA financial liability is any liability that is:
(a) a contractual or statutory obligation:
(i) to deliver cash or another financial asset to another entity, or
(ii) to exchange financial assets or financial liabilities with another entity under conditions that are potentially unfavourable to the entity, or
(b) a contract that will or may be settled in the entity’s own equity instruments and is:
(i) a non-derivative for which the entity is or may be obliged to deliver a variable number of the entity’s own equity instruments, or
(ii) a derivative that will or may be settled other than by the exchange of a fixed amount of cash or another financial asset for a fixed number of the entity’s own equity instruments. For this purpose the entity’s own equity instruments do not include instruments that are themselves contracts for the future receipt or delivery of the entity’s own equity instruments.
Financial statementsDepending on the context of the sentence where the term ‘financial statements’ is used, it may include only the main financial statements (i.e. Comprehensive Operating Statement, balance sheet, cash flow statements, and statement of changes in equity); or it may also be used to replace the old term ‘financial report’ under the revised AASB 101 (September 2007), which means it may include the main financial statements and the notes.
GrantsGrants can be paid as general purpose grants which refer to grants that are not subject to conditions regarding their use. Alternatively, they may be paid as specific purpose grants which are paid for a particular purpose and/or have conditions attached regarding their use.
Intangible assetsIntangible assets represent identifiable non monetary assets without physical substance.
Interest expenseCosts incurred in connection with the borrowing of funds interest expenses include interest on bank overdrafts and short term and long term borrowings, amortisation of discounts or premiums relating to borrowings, interest component of finance leases repayments, and the increase in financial liabilities and non employee provisions due to the unwinding of discounts to reflect the passage of time.
Interest incomeInterest income includes interest received on bank term deposits, interest from investments and other interest received.
51
MEL
BOUR
NE &
OLY
MPI
C PA
RKS
TRUS
T
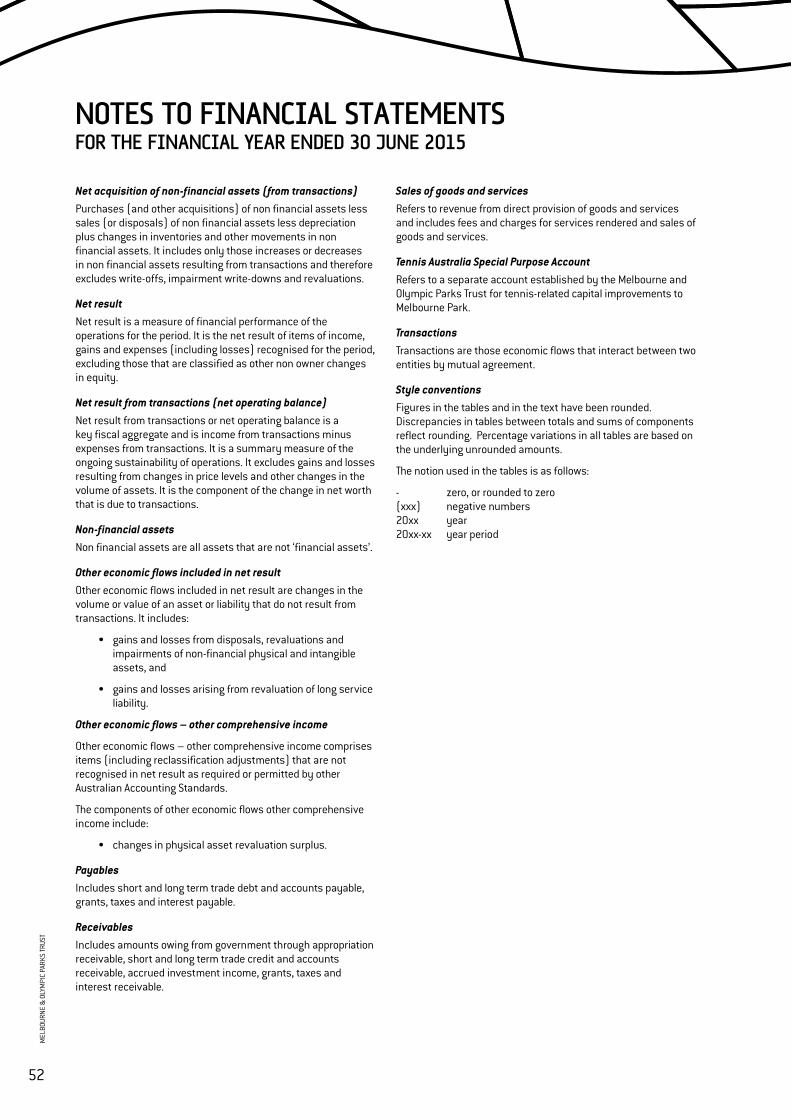
NOTES TO FINANCIAL STATEMENTSFOR THE FINANCIAL YEAR ENDED 30 JUNE 2015
Net acquisition of non-financial assets (from transactions)Purchases (and other acquisitions) of non financial assets less sales (or disposals) of non financial assets less depreciation plus changes in inventories and other movements in non financial assets. It includes only those increases or decreases in non financial assets resulting from transactions and therefore excludes write-offs, impairment write-downs and revaluations.
Net resultNet result is a measure of financial performance of the operations for the period. It is the net result of items of income, gains and expenses (including losses) recognised for the period, excluding those that are classified as other non owner changes in equity.
Net result from transactions (net operating balance)Net result from transactions or net operating balance is a key fiscal aggregate and is income from transactions minus expenses from transactions. It is a summary measure of the ongoing sustainability of operations. It excludes gains and losses resulting from changes in price levels and other changes in the volume of assets. It is the component of the change in net worth that is due to transactions.
Non-financial assetsNon financial assets are all assets that are not ‘financial assets’.
Other economic flows included in net resultOther economic flows included in net result are changes in the volume or value of an asset or liability that do not result from transactions. It includes:
• gains and losses from disposals, revaluations and impairments of non-financial physical and intangible assets, and
• gains and losses arising from revaluation of long service liability.
Other economic flows – other comprehensive income
Other economic flows – other comprehensive income comprises items (including reclassification adjustments) that are not recognised in net result as required or permitted by other Australian Accounting Standards.
The components of other economic flows other comprehensive income include:
• changes in physical asset revaluation surplus.
PayablesIncludes short and long term trade debt and accounts payable, grants, taxes and interest payable.
ReceivablesIncludes amounts owing from government through appropriation receivable, short and long term trade credit and accounts receivable, accrued investment income, grants, taxes and interest receivable.
Sales of goods and servicesRefers to revenue from direct provision of goods and services and includes fees and charges for services rendered and sales of goods and services.
Tennis Australia Special Purpose AccountRefers to a separate account established by the Melbourne and Olympic Parks Trust for tennis-related capital improvements to Melbourne Park.
TransactionsTransactions are those economic flows that interact between two entities by mutual agreement.
Style conventionsFigures in the tables and in the text have been rounded. Discrepancies in tables between totals and sums of components reflect rounding. Percentage variations in all tables are based on the underlying unrounded amounts.
The notion used in the tables is as follows:
- zero, or rounded to zero (xxx) negative numbers 20xx year 20xx-xx year period
52
MEL
BOUR
NE &
OLY
MPI
C PA
RKS
TRUS
T
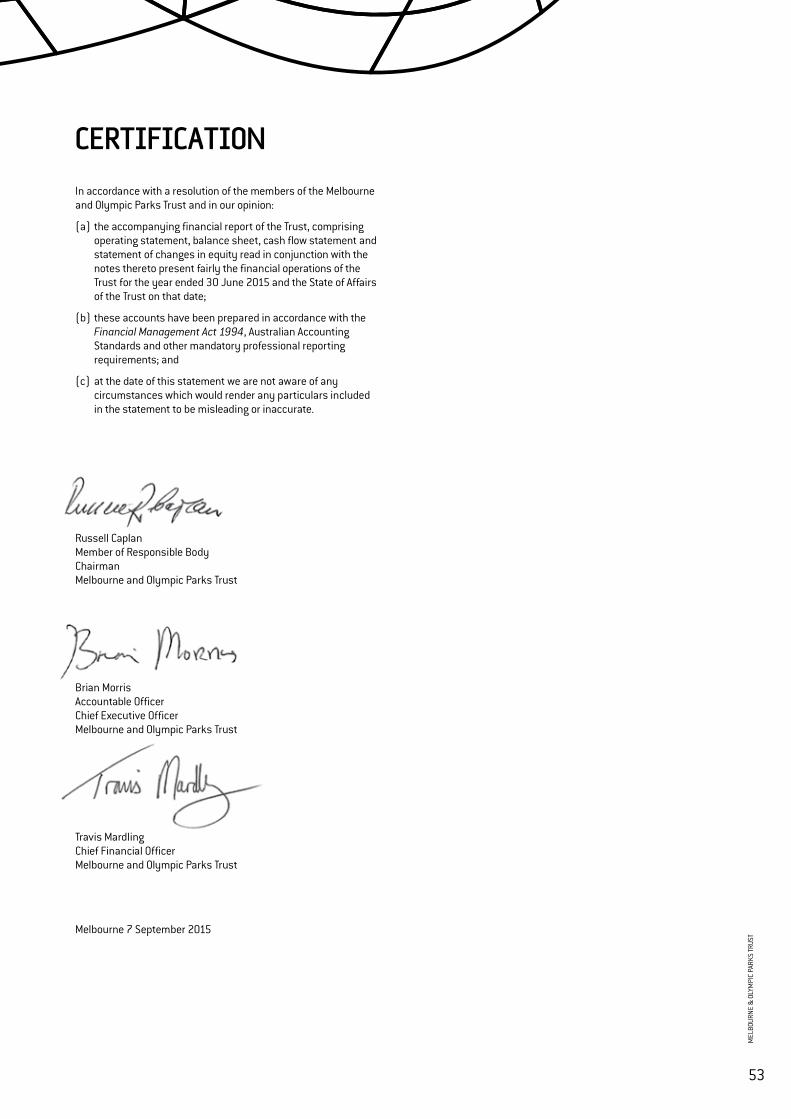
CERTIFICATION
In accordance with a resolution of the members of the Melbourne and Olympic Parks Trust and in our opinion:
(a) the accompanying financial report of the Trust, comprising operating statement, balance sheet, cash flow statement and statement of changes in equity read in conjunction with the notes thereto present fairly the financial operations of the Trust for the year ended 30 June 2015 and the State of Affairs of the Trust on that date;
(b) these accounts have been prepared in accordance with the Financial Management Act 1994, Australian Accounting Standards and other mandatory professional reporting requirements; and
(c) at the date of this statement we are not aware of any circumstances which would render any particulars included in the statement to be misleading or inaccurate.
Russell Caplan Member of Responsible Body Chairman Melbourne and Olympic Parks Trust
Brian Morris Accountable Officer Chief Executive Officer Melbourne and Olympic Parks Trust
Travis Mardling Chief Financial Officer Melbourne and Olympic Parks Trust
Melbourne 7 September 2015
53
MEL
BOUR
NE &
OLY
MPI
C PA
RKS
TRUS
T
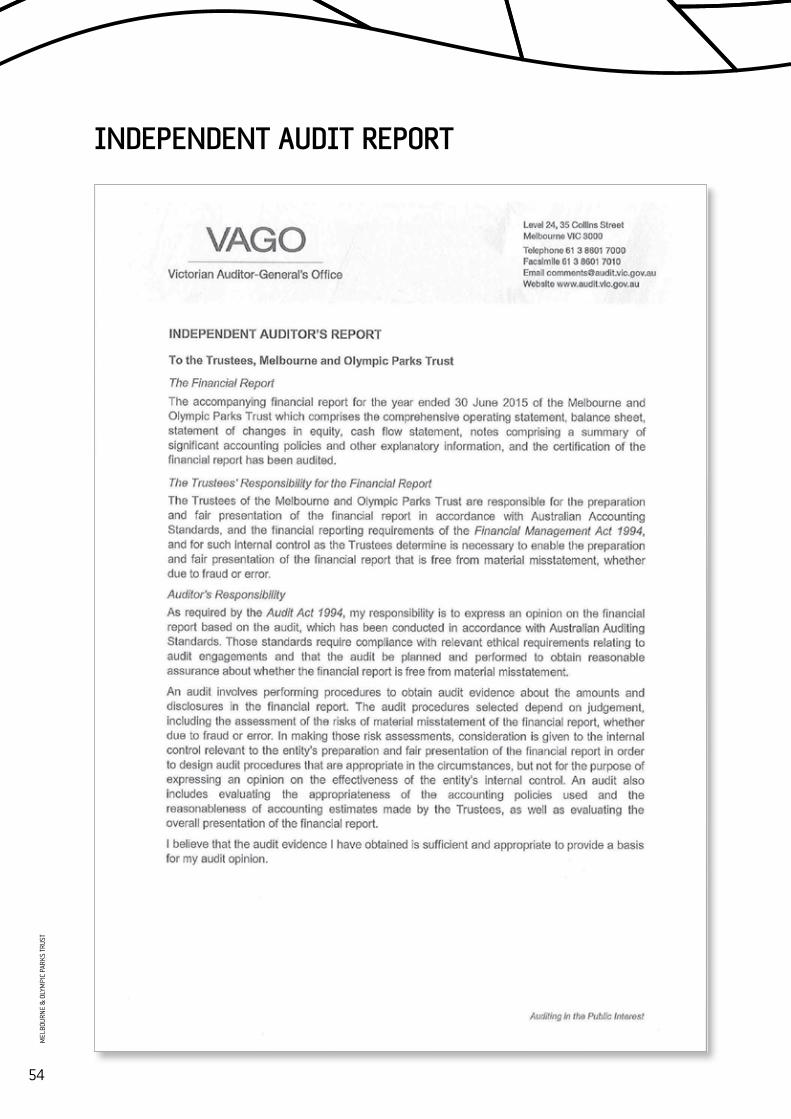
INDEPENDENT AUDIT REPORT
54
MEL
BOUR
NE &
OLY
MPI
C PA
RKS
TRUS
T
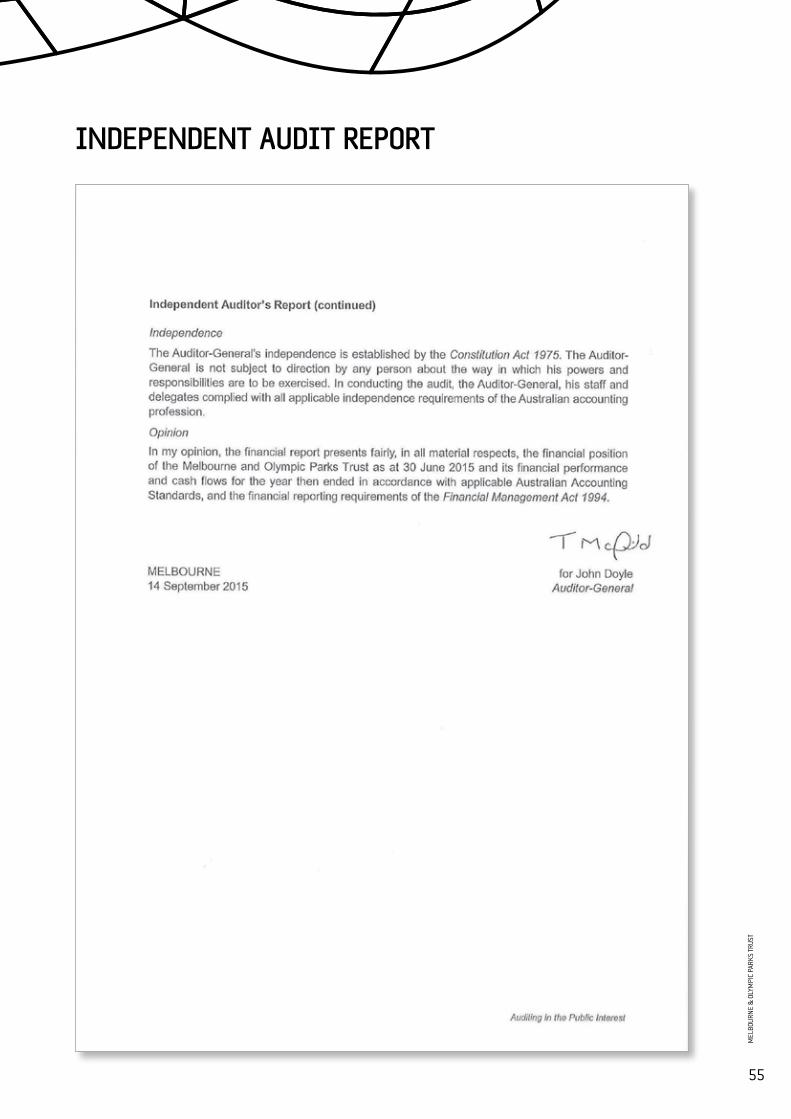
INDEPENDENT AUDIT REPORT
55
MEL
BOUR
NE &
OLY
MPI
C PA
RKS
TRUS
T
ADMINISTRATIVE REPORTING REQUIREMENTS
Competitive Neutrality Policy complianceThe Trust regularly reviews whether its activities are subject to the requirements of the National Competition Policy, including compliance with the requirements of the policy statement ‘Competitive Neutrality Policy Victoria’, and takes necessary action to implement competitive neutrality measures where required.
Statement of compliance with the Building Act 1993.The Trust complies with the relevant guidelines, pursuant to Section 220 of the Building Act 1993.
Implementation of the Victorian Industry Participation Policy In October 2003, the Victorian Parliament passed the Victorian Industry Participation Policy Act 2003 which required public bodies and departments to report on the implementation of the Victorian Industry Participation Policy (VIPP). The Trust is required to apply the VIPP where Trust funding exceeds $3 million in metropolitan Melbourne and $1 million in regional Victoria.
There were no projects undertaken by the Trust in 2014/15 to which the VIPP applied.
Financial and other information retained by the accountable officerRelevant information detailed in Financial Reporting Direction (FRD) 22D ‘Standard Disclosures in the Report of Operations’ under the Financial Management Act 1994 Section 3 is retained by the Trust’s Accountable Officer and is available on request, subject to the Freedom of Information Act 1982.
Protected Disclosure Act 2012Melbourne & Olympic Parks is committed to the aims and objectives of the Protected Disclosure Act. It recognises the value of transparency and accountability in its administrative and management practices, and supports the making of disclosures that reveal improper conduct. It does not tolerate improper conduct by the organisation, its employees, officers or members, nor the taking of detrimental action in reprisal against those who come forward to disclose such conduct. According to the Independent Broad-based Anti-corruption Commission (“IBAC”), M&OP is not permitted to receive disclosures made under the Act. Therefore, those wishing to make a disclosure about M&OP, its officers, members or employees, will need to make that disclosure directly to the IBAC. If M&OP believes a disclosure may be a protected disclosure made in accordance with the Act, it will ask for that disclosure to be made to the IBAC. The IBAC will deal with the disclosure. Procedures in relation to the Protected Disclosure Act 2012 are available on the M&OP website.
Disability Act (2006)M&OP is committed to providing equitable, dignified access to goods and services to premises used by the public. A key focus of the $700 million redevelopment of Melbourne Park has been the inclusion of universal design principles. This proactive work ensures the design of new buildings or upgraded infrastructure are centred around improved access for all Victorians.
Throughout the course of this financial year, M&OP continued to implement its Diversity and Inclusion Plan, setting short, medium and long term goals to improve the guest experience for people with a disability. A copy of the plan is available at www.mopt.com.au
Occupational Health and Safety (OH&S)M&OP is committed to providing and maintaining an environment that is safe for all who visit and work within the precinct or who may be affected by its business operations. M&OP aspires to eliminate risks to health and safety, and where elimination is not reasonably achievable, to reduce risks to health and safety so far as is reasonably practicable. As part of delivering world class customer experience, M&OP is commited to the safety of the multitude of guests who step into the precinct grounds each year.
M&OP maintained AS4801 accreditation for Safety Management Systems (AS4801). This achievement is underpinned by M&OP’s leadership-driven safety culture, which encourages collaboration, consultation and ownership throughout all of the organisation levels. M&OP’s commitment to continuous improvement, is reflected in its updated Health and Safety Policy, which highlights the accountabilities shared across the workforce. The importance of Toolbox meetings continues to be reinforced with 177 meetings held across the precinct during the financial year. In addition, 282 workplace inspections were carried out, which ensures a proactive approach to safety is adopted.
Key achievements for the year included a 38 per cent improvement in the number of injuries sustained across the precinct compared to 13/14 results, which includes a 36 per cent reduction in guest injuries. An organisation-wide training program targeted at incident, hazard and injury management was completed. A strong consultative approach to safety is reflected in Toolbox meetings, workplace inspections, audits, training, hazard reporting and incident investigation. An engaged OHS Committee have also helped produce positive OH&S outcomes this year.
A full copy of the Trust’s OHS policy is available on M&OP’s website – www.mopt.com.au
56
MEL
BOUR
NE &
OLY
MPI
C PA
RKS
TRUS
T
ADMINISTRATIVE REPORTING REQUIREMENTS
Statement of Workforce DataMelbourne and Olympic Parks Trust employed 106 full time and part time staff as at 30 June 2015 (2014:100). The number of Full Time Equivalent (FTE) staff at 30 June 2015 was 100 (2014:96). The number of fixed term and casual employees at 30 June 2015 was 706 (2014:904) and a large number of
contractors provided by our key partners also contribute to M&OP’s workforce (TechGuard Security, Capricorn Stages and Rigging, Delaware North, O’Brien Catering Group Australia and Ticketek).
The breakdown of staff is as follows:
Employees (Headcount)
Full time (Headcount)
Part time (Headcount)
FTEFixed Term & Casual
Employees
June 2015 106 88 18 100 706
June 2014 100 84 16 96 904
June 2015 June 2014
Employees (Headcount)
FTEFixed Term & Casual
Employees
Employee (Headcount)
FTEFixed Term & Casual
Employees
Accountable Officer 1 1 1 1 1 1
Executive Officers 6 6 6 5 5 4
Administration Staff 99 93 699 94 90 899
Males 64 63 360 56 55 457
Females 42 37 346 44 41 447
Freedom of information The Freedom of Information Act 1982 allows the public a right of access to documents held by Melbourne and Olympic Parks Trust. For the 12 months ending June 2015, the Trust received one FOI request.
The Chief Financial Officer is the contact officer in relation to all Freedom of Information requests. Access to documents may be obtained through written request to the Chief Financial Officer, addressed as follows:
Freedom of Information Melbourne and Olympic Parks Trust GPO Box 4611, Melbourne VIC 3001 Requests can also be lodged via email to [email protected].
All requests must be accompanied by the application fee ($27.20 from 1 July 2015 but may be waived in certain circumstances) and must provide such information concerning the document as is reasonably necessary to enable M&OP to identify the document. Charges may also apply once documents have been processed and a decision on access is made; for example photocopying and search and retrieval charges.
57
MEL
BOUR
NE &
OLY
MPI
C PA
RKS
TRUS
T
Consultants
Details of consultancies over $10,000
Consultant Purpose of consultancy Start date End date Total expenditure 2014/15 (excluding GST)
Future commitments
Iouriv Water Solutions
Advice in relation to AAMI Park rainwater harvesting
April 2015 June 2015 $25,750 Nil
Details of consultancies less than $10,000 Number: 3 Total Amount: $11,000
Gosch’s PaddockGosch’s Paddock remained open at all times throughout the 2014/15 year.
Risk Attestation Statement
I, Chair of the Trust, certify that the Melbourne and Olympic Parks Trust has risk management processes in place consistent with the Australian/New Zealand Risk Management Standard (AS/NZS ISO 31000:2009) and an internal control system is in place that enables the executive to understand, manage and satisfactorily control risk exposures. The Trust verifies this assurance and that the risk profile of the Melbourne and Olympic Parks Trust has been critically reviewed within the last 12 months.
Melbourne and Olympic Parks Trust has complied with the Ministerial Standing Direction 4.5.5 – Risk Management Framework and Processes.
Russell Caplan Chairman Melbourne and Olympic Parks Trust
ADMINISTRATIVE REPORTING REQUIREMENTS
58
MEL
BOUR
NE &
OLY
MPI
C PA
RKS
TRUS
T
DISCLOSURE INDEX
The Annual Report of Melbourne and Olympic Parks Trust is prepared in accordance with all Victorian Legislation.This index has been prepared to facilitate identification of compliance with statutory disclosure requirements.
Ministerial Directions
Charter and PurposeFRD 22D Manner of establishment and the relevant Minister 4FRD 22D Objectives, functions, powers and duties 4FRD 22D Nature and range of services provided 4
Management and structureFRD 22D Organisational Structure 5
Financial and other informationFRD 10 Disclosure index 59FRD 15B Executive officer disclosures 48FRD 22D Application and operation of Freedom of Information Act 1982 57FRD 22D Application and operation of the Protected Disclosure Act 2012 56FRD 22D Compliance with building and maintenance provision of Building Act 1993 56FRD 22D Details of consultancies over $10,000 58FRD 22D Details of consultancies under $10,000 58FRD 22D Major changes or factors affecting performance 12FRD 22D Occupational Health and Safety 56SD 4.5.5 Risk Management Compliance 58FRD 22D Statement of availability of other information 56FRD 22D Statement on Competitive Neutrality Policy 56FRD 22D Summary of financial results for the year 12FRD 22D Summary of major activities 9-10FRD 22D Subsequent events N/AFRD 25A Victorian Industry Participation Policy disclosures 56FRD 29 Statement on Workforce Data 57
Financial Statements required under Part 7 of the FMASD 4.2 (a) Financial Statements 13-55SD 4.2 (b) Balance Sheet 15SD 4.2 (b) Cash Flow Statement 17SD 4.2 (b) Comprehensive Operating Statement 14SD 4.2 (b) Statement of Changes in Equity 19SD 4.2 (c) Accountable officer’s declaration 53SD 4.2 (c) Compliance with Australian accounting standards and other authoritative
pronouncement18
SD 4.2 (c) Compliance with Ministerial Directions 44SD 4.2 (d) Rounding of amounts 52
Other disclosures in notes to the financial statementsFRD 9A Departmental disclosure of administered assets and liabilities N/AFRD 11 Disclosure of ex-gratia payments N/AFRD 13 Disclosure of parliamentary appropriations N/AFRD 21B Responsible person and executive officer disclosures 47, 48
Legislation
Audit Act 1994Building Act 1993Crown Land (Reserves) Act 1978Disability Act 2006Financial Management Act 1994Freedom of Information Act 1982
Melbourne and Olympic Parks Act 1985 (amended)Occupational Health and Safety Act 2004Protected Disclosure Act 2012Public Administration Act 2004Victorian Industry Participation Policy Act 2003Victorian Managed Insurance Authority Act 1996
59
MEL
BOUR
NE &
OLY
MPI
C PA
RKS
TRUS
T