State of Vermont Department of Taxes ANNUAL...
119
ANNUAL REPORT BASED ON 2015 GRAND LIST DATA State of Vermont Department of Taxes Division of Property, Valuation and Review 133 State Street Montpelier, VT 05633-1401
Transcript of State of Vermont Department of Taxes ANNUAL...

ANNUAL REPORTBASED ON 2015 GRAND LIST DATA
State of VermontDepartment of Taxes
Division of Property, Valuation and Review133 State StreetMontpelier, VT 05633-1401


State of VermontDepartment of Taxes133 State StreetMontpelier, VT 05633-1401
Agency of Administration
www.tax.vermont.gov
To: Honorable Shap Smith, Speaker of the House Honorable John Campbell, Senate President Pro Tem
From: Douglas R. Farnham, Director, Property Valuation and Review Division, Vermont Department of Taxes
Date: January 2016
Subject: Annual Report of Property Valuation and Review Division
I am pleased to present the Vermont Department of Taxes Property Valuation and Review Division 2016 Annual Report of the 2015 Grand List Year. This document fulfills the requirements of 32 V.S.A. § 3412. A copy will be provided to the selectboard of each town.
cc Governor Peter Shumlin
Mary Peterson, Commissioner
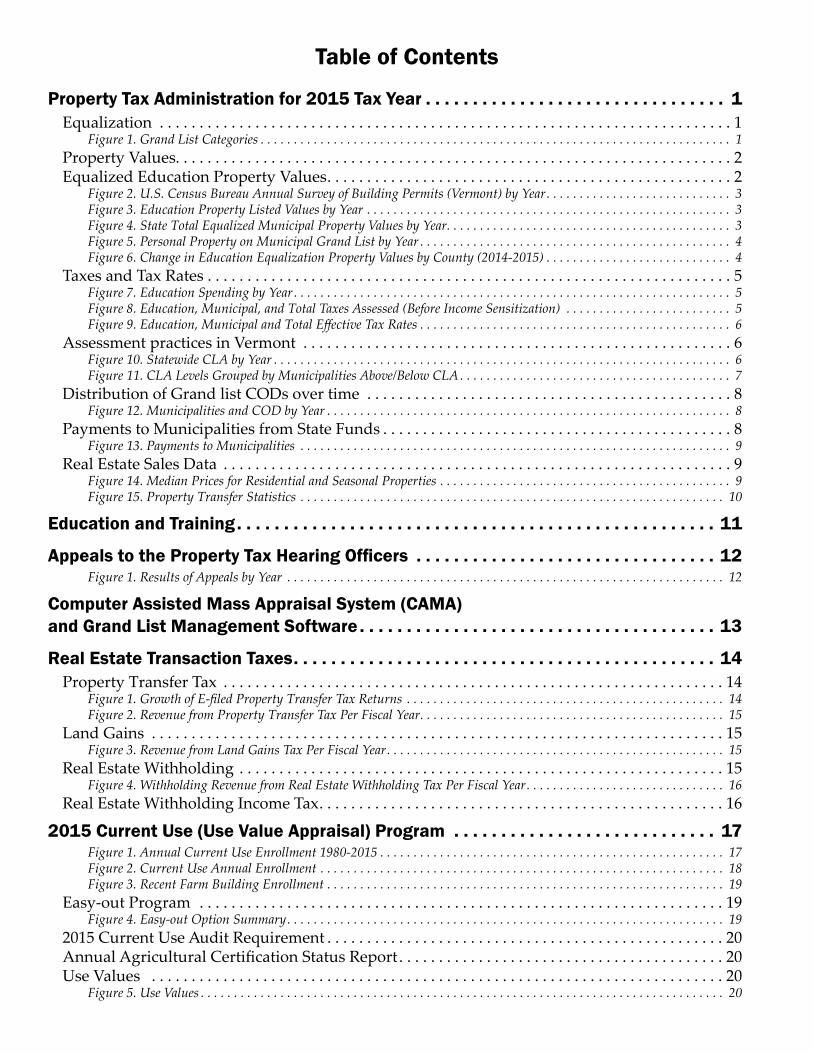
table of Contents
property tax Administration for 2015 tax Year . . . . . . . . . . . . . . . . . . . . . . . . . . . . . . . . 1Equalization . . . . . . . . . . . . . . . . . . . . . . . . . . . . . . . . . . . . . . . . . . . . . . . . . . . . . . . . . . . . . . . . . . . . . . . . 1
Figure 1. Grand List Categories . . . . . . . . . . . . . . . . . . . . . . . . . . . . . . . . . . . . . . . . . . . . . . . . . . . . . . . . . . . . . . . . . . . . . . . 1Property Values. . . . . . . . . . . . . . . . . . . . . . . . . . . . . . . . . . . . . . . . . . . . . . . . . . . . . . . . . . . . . . . . . . . . . . 2Equalized Education Property Values . . . . . . . . . . . . . . . . . . . . . . . . . . . . . . . . . . . . . . . . . . . . . . . . . . . 2
Figure 2. U.S. Census Bureau Annual Survey of Building Permits (Vermont) by Year . . . . . . . . . . . . . . . . . . . . . . . . . . . . 3Figure 3. Education Property Listed Values by Year . . . . . . . . . . . . . . . . . . . . . . . . . . . . . . . . . . . . . . . . . . . . . . . . . . . . . . . 3Figure 4. State Total Equalized Municipal Property Values by Year . . . . . . . . . . . . . . . . . . . . . . . . . . . . . . . . . . . . . . . . . . . 3Figure 5. Personal Property on Municipal Grand List by Year . . . . . . . . . . . . . . . . . . . . . . . . . . . . . . . . . . . . . . . . . . . . . . . 4Figure 6. Change in Education Equalization Property Values by County (2014-2015) . . . . . . . . . . . . . . . . . . . . . . . . . . . . 4
Taxes and Tax Rates . . . . . . . . . . . . . . . . . . . . . . . . . . . . . . . . . . . . . . . . . . . . . . . . . . . . . . . . . . . . . . . . . . 5Figure 7. Education Spending by Year . . . . . . . . . . . . . . . . . . . . . . . . . . . . . . . . . . . . . . . . . . . . . . . . . . . . . . . . . . . . . . . . . . 5Figure 8. Education, Municipal, and Total Taxes Assessed (Before Income Sensitization) . . . . . . . . . . . . . . . . . . . . . . . . . 5Figure 9. Education, Municipal and Total Effective Tax Rates . . . . . . . . . . . . . . . . . . . . . . . . . . . . . . . . . . . . . . . . . . . . . . . 6
Assessment practices in Vermont . . . . . . . . . . . . . . . . . . . . . . . . . . . . . . . . . . . . . . . . . . . . . . . . . . . . . . 6Figure 10. Statewide CLA by Year . . . . . . . . . . . . . . . . . . . . . . . . . . . . . . . . . . . . . . . . . . . . . . . . . . . . . . . . . . . . . . . . . . . . . 6Figure 11. CLA Levels Grouped by Municipalities Above/Below CLA . . . . . . . . . . . . . . . . . . . . . . . . . . . . . . . . . . . . . . . . . 7
Distribution of Grand list CODs over time . . . . . . . . . . . . . . . . . . . . . . . . . . . . . . . . . . . . . . . . . . . . . . 8Figure 12. Municipalities and COD by Year . . . . . . . . . . . . . . . . . . . . . . . . . . . . . . . . . . . . . . . . . . . . . . . . . . . . . . . . . . . . . 8
Payments to Municipalities from State Funds . . . . . . . . . . . . . . . . . . . . . . . . . . . . . . . . . . . . . . . . . . . . 8Figure 13. Payments to Municipalities . . . . . . . . . . . . . . . . . . . . . . . . . . . . . . . . . . . . . . . . . . . . . . . . . . . . . . . . . . . . . . . . . 9
Real Estate Sales Data . . . . . . . . . . . . . . . . . . . . . . . . . . . . . . . . . . . . . . . . . . . . . . . . . . . . . . . . . . . . . . . . 9Figure 14. Median Prices for Residential and Seasonal Properties . . . . . . . . . . . . . . . . . . . . . . . . . . . . . . . . . . . . . . . . . . . . 9Figure 15. Property Transfer Statistics . . . . . . . . . . . . . . . . . . . . . . . . . . . . . . . . . . . . . . . . . . . . . . . . . . . . . . . . . . . . . . . . 10
education and training . . . . . . . . . . . . . . . . . . . . . . . . . . . . . . . . . . . . . . . . . . . . . . . . . . . 11
Appeals to the Property Tax Hearing Officers . . . . . . . . . . . . . . . . . . . . . . . . . . . . . . . . 12Figure 1. Results of Appeals by Year . . . . . . . . . . . . . . . . . . . . . . . . . . . . . . . . . . . . . . . . . . . . . . . . . . . . . . . . . . . . . . . . . . 12
Computer Assisted Mass Appraisal System (CAMA) and Grand list Management Software . . . . . . . . . . . . . . . . . . . . . . . . . . . . . . . . . . . . . . 13
Real estate transaction taxes . . . . . . . . . . . . . . . . . . . . . . . . . . . . . . . . . . . . . . . . . . . . . 14Property Transfer Tax . . . . . . . . . . . . . . . . . . . . . . . . . . . . . . . . . . . . . . . . . . . . . . . . . . . . . . . . . . . . . . . 14
Figure 1. Growth of E-filed Property Transfer Tax Returns . . . . . . . . . . . . . . . . . . . . . . . . . . . . . . . . . . . . . . . . . . . . . . . . 14Figure 2. Revenue from Property Transfer Tax Per Fiscal Year . . . . . . . . . . . . . . . . . . . . . . . . . . . . . . . . . . . . . . . . . . . . . . 15
Land Gains . . . . . . . . . . . . . . . . . . . . . . . . . . . . . . . . . . . . . . . . . . . . . . . . . . . . . . . . . . . . . . . . . . . . . . . . 15Figure 3. Revenue from Land Gains Tax Per Fiscal Year . . . . . . . . . . . . . . . . . . . . . . . . . . . . . . . . . . . . . . . . . . . . . . . . . . . 15
Real Estate Withholding . . . . . . . . . . . . . . . . . . . . . . . . . . . . . . . . . . . . . . . . . . . . . . . . . . . . . . . . . . . . . 15Figure 4. Withholding Revenue from Real Estate Withholding Tax Per Fiscal Year . . . . . . . . . . . . . . . . . . . . . . . . . . . . . . 16
Real Estate Withholding Income Tax . . . . . . . . . . . . . . . . . . . . . . . . . . . . . . . . . . . . . . . . . . . . . . . . . . . 16
2015 Current use (use Value Appraisal) program . . . . . . . . . . . . . . . . . . . . . . . . . . . . 17Figure 1. Annual Current Use Enrollment 1980-2015 . . . . . . . . . . . . . . . . . . . . . . . . . . . . . . . . . . . . . . . . . . . . . . . . . . . . 17Figure 2. Current Use Annual Enrollment . . . . . . . . . . . . . . . . . . . . . . . . . . . . . . . . . . . . . . . . . . . . . . . . . . . . . . . . . . . . . 18Figure 3. Recent Farm Building Enrollment . . . . . . . . . . . . . . . . . . . . . . . . . . . . . . . . . . . . . . . . . . . . . . . . . . . . . . . . . . . . 19
Easy-out Program . . . . . . . . . . . . . . . . . . . . . . . . . . . . . . . . . . . . . . . . . . . . . . . . . . . . . . . . . . . . . . . . . . 19Figure 4. Easy-out Option Summary . . . . . . . . . . . . . . . . . . . . . . . . . . . . . . . . . . . . . . . . . . . . . . . . . . . . . . . . . . . . . . . . . . 19
2015 Current Use Audit Requirement . . . . . . . . . . . . . . . . . . . . . . . . . . . . . . . . . . . . . . . . . . . . . . . . . . 20Annual Agricultural Certification Status Report . . . . . . . . . . . . . . . . . . . . . . . . . . . . . . . . . . . . . . . . . 20Use Values . . . . . . . . . . . . . . . . . . . . . . . . . . . . . . . . . . . . . . . . . . . . . . . . . . . . . . . . . . . . . . . . . . . . . . . . 20
Figure 5. Use Values . . . . . . . . . . . . . . . . . . . . . . . . . . . . . . . . . . . . . . . . . . . . . . . . . . . . . . . . . . . . . . . . . . . . . . . . . . . . . . . 20
Program Costs and Tax Saving . . . . . . . . . . . . . . . . . . . . . . . . . . . . . . . . . . . . . . . . . . . . . . . . . . . . . . . . 21Figure 6. Tax Savings to Landowners . . . . . . . . . . . . . . . . . . . . . . . . . . . . . . . . . . . . . . . . . . . . . . . . . . . . . . . . . . . . . . . . . 21
Land Use Change Tax . . . . . . . . . . . . . . . . . . . . . . . . . . . . . . . . . . . . . . . . . . . . . . . . . . . . . . . . . . . . . . . 21Figure 7. Development and Discontinuance of Enrolled Land . . . . . . . . . . . . . . . . . . . . . . . . . . . . . . . . . . . . . . . . . . . . . . 22Figure 8. Current Use Appraisal Program Participant Tax Savings for Tax Year 2015 . . . . . . . . . . . . . . . . . . . . . . . . . . . 23
equalization Study Based on 2015 Grand lists . . . . . . . . . . . . . . . . . . . . . . . . . . . . . . . 31Figure 1. Equalized Education Grand Lists by County, Town . . . . . . . . . . . . . . . . . . . . . . . . . . . . . . . . . . . . . . . . . . . . . . 32Figure 2. Summary of Listed Values and Equalized Educations Values by Category . . . . . . . . . . . . . . . . . . . . . . . . . . . . . 46Figure 3. 2015 Summary of Education Equalized Values . . . . . . . . . . . . . . . . . . . . . . . . . . . . . . . . . . . . . . . . . . . . . . . . . . 47Figure 4. 2015 Summary of Listed Values and Equalized Municipal Values by Category . . . . . . . . . . . . . . . . . . . . . . . . . 48Figure 5. 2015 Summary of Municipal Equalized Values . . . . . . . . . . . . . . . . . . . . . . . . . . . . . . . . . . . . . . . . . . . . . . . . . . 49
Statutory exemptions . . . . . . . . . . . . . . . . . . . . . . . . . . . . . . . . . . . . . . . . . . . . . . . . . . . . 50Figure 1. Statutory Exemptions by County, Town . . . . . . . . . . . . . . . . . . . . . . . . . . . . . . . . . . . . . . . . . . . . . . . . . . . . . . . 51
property tax Adjustment Credits . . . . . . . . . . . . . . . . . . . . . . . . . . . . . . . . . . . . . . . . . . . 64Figure 1. Education Property Tax Adjustments by Year . . . . . . . . . . . . . . . . . . . . . . . . . . . . . . . . . . . . . . . . . . . . . . . . . . . 64Figure 2. Tax Year 2014 Property Tax Reduction Payment Summary . . . . . . . . . . . . . . . . . . . . . . . . . . . . . . . . . . . . . . . . 65
taxes and tax Rates . . . . . . . . . . . . . . . . . . . . . . . . . . . . . . . . . . . . . . . . . . . . . . . . . . . . . 73Figure 1. Education Base Rates for Homesteads and Nonresidential Properties . . . . . . . . . . . . . . . . . . . . . . . . . . . . . . . . . 73Figure 2. 2015 Taxes and Tax Rates . . . . . . . . . . . . . . . . . . . . . . . . . . . . . . . . . . . . . . . . . . . . . . . . . . . . . . . . . . . . . . . . . . . 74
effective tax Rates . . . . . . . . . . . . . . . . . . . . . . . . . . . . . . . . . . . . . . . . . . . . . . . . . . . . . . 87Effective education tax rate . . . . . . . . . . . . . . . . . . . . . . . . . . . . . . . . . . . . . . . . . . . . . . . . . . . . . . . . . . . 87Municipal effective tax rate . . . . . . . . . . . . . . . . . . . . . . . . . . . . . . . . . . . . . . . . . . . . . . . . . . . . . . . . . . . 87
Figure 1. 2015 Effective Tax Rates . . . . . . . . . . . . . . . . . . . . . . . . . . . . . . . . . . . . . . . . . . . . . . . . . . . . . . . . . . . . . . . . . . . 88Figure 2. 2015 Total Estimated Effective Tax Rates for Homestead Properties Listed Low to High . . . . . . . . . . . . . . . . 101Figure 3. 2015 Total Estimated Effective Tax Rates for Non-Residential Properties . . . . . . . . . . . . . . . . . . . . . . . . . . . . 105
property Assessment Recommendations . . . . . . . . . . . . . . . . . . . . . . . . . . . . . . . . . . . 109Recommendation 1: Adjust How CLAs Are Applied . . . . . . . . . . . . . . . . . . . . . . . . . . . . . . . . . . . 109Recommendation 2: Update Property Card Data Regularly . . . . . . . . . . . . . . . . . . . . . . . . . . . . . 110Recommendation 3: Make VPA Program Mandatory . . . . . . . . . . . . . . . . . . . . . . . . . . . . . . . . . . . 110Recommendation 4: Establish a Central Appeals Board . . . . . . . . . . . . . . . . . . . . . . . . . . . . . . . . . 111
Acronyms and terms . . . . . . . . . . . . . . . . . . . . . . . . . . . . . . . . . . . . . . . . . . . . . . . . . . . . 112


1
property tax Administration for 2015 tax Year
equalizationThe Division of Property Valuation and Review (PVR) of the Vermont Department of Taxes annually determines the equalized education property value (EEPV) and coefficient of dispersion (COD) for each school district in Vermont. The EEPV is the study’s estimate of market value for a municipality. The EEPVs determined as part of the 2015 equalization study are a measure of the property wealth of a school district and are used as an important data element in the setting of education tax rates for all Vermont school districts. The ratio of a school district’s total taxable unequalized education property value to the total taxable EEPV is the common level of appraisal (CLA). The CLA is used to equalize the education property tax rates throughout the state. This year’s equalization study was based on the assessed value of property as established by each municipality as of April 1, 2015.
The procedures for completing the study may be generally described as follows:
1) Data for each sale occurring in each municipality is collected using information extracted from the Property Transfer Tax Returns filed with the Department. Information from sales for the current year and the two prior years is used in the study.
2) The records of the sales are sent to the municipality where the sales are recorded for verification and a review of the circumstances of each sale. In addition, verification letters are mailed to sellers and buyers, with an emphasis on sales that would constitute outliers, to gather information about the circumstances of the sale. The results of the verification process are used to eliminate sales that do not represent arm’s length sales.
3) When there are insufficient sales (fewer than five) for a reliable sample at the town level, supplemental appraisals are obtained to ensure that a reliable sample is available for equalization.
4) All sales that are approved for inclusion in the study are classified into the 15 grand list categories.
Figure 1. Grand List Categories

2
5) The ratio of listed-value-to-sales-price is calculated for all included sales. Individual ratios are examined for unusual values and are flagged for investigation and possible exclusion from the sample.
6) The ratios for the included sales are aggregated at the grand list category, class, and for the municipality as a whole. In addition, a statistical analysis is applied to determine whether the aggregated ratios are within a 10% margin of error at a 90% confidence interval for each grand list category and use class. If the aggregate ratio of the sample is reliable at the category or class level, that ratio is applied to equalize the category or class. If the ratios are not reliable at the category level, the class level is used. If the aggregate ratio is not reliable at the class level the ratio is computed at the municipal level.
7) The resulting reliable ratios are applied to the aggregate grand list value for the appropriate category, class, or the municipality as a whole to compute the EEPV for the municipality. The equalized education property tax grand list is 1% of the EEPV for the municipality.
8) The COD is also calculated from the results of the equalization study to assess the internal fairness of each municipal grand list. The COD represents the degree to which individual property valuations vary from the average level of appraisal in that particular municipality. A high COD indicates a need for a reappraisal.
In 2014, the parameters of the study were revised to require a minimum sample size of five before a ratio is used for equalization purposes. Previously the minimum sample size was three. Although the smaller sample produced reliable results in prior years, the Department and the Vermont Assessors and Listers Association collaborated in assessing the value of using an increased sample size. The conclusion was that the increased sample size would enhance public confidence in the results of the study, although the increase made no difference in the statistical reliability of the study.
property ValuesStatewide, the total unequalized listed value went up about 1.3%. Two factors generally affect the change in unequalized listed values: new construction and reappraisals.
New construction has not fully recovered from the recent recession but, at least within the residential real estate market, it began to pick up in 2013 (see Figure 2).
For TY2015, there were reappraisals in 11 towns. This compares to 17, 19, 20, 20, and 35 reappraisals in the five prior years. In four of the towns, the reappraisal resulted in a smaller grand list for 2015. The market has stabilized and is showing signs of recovery.
equalized education property ValuesThe state total equalized education property value increased by about 1.4% this year. This compares favorably to an increase of about 0.8% in the prior year, indicating that the Vermont’s real estate market continues to recover from the downturn that began in 2008-2009.
The equalized municipal property value is derived from the unequalized grand list that municipalities use to assess municipal (i.e., non-education) property taxes. Some of the differences between the equalized municipal property values (see Figure 4) and the equalized education property values result from the inclusion of business personal property (machinery and equipment, inventory) in the equalized municipal property values. There are also differences in the allowable veterans’ exemptions ($10,000 limit for state equalized education property value and up to $40,000 for municipal education property value).

3
Figure 2. U.S. Census Bureau Annual Survey of Building Permits (Vermont) by Year
Figure 3. Education Property Listed Values by Year
Figure 4. State Total Equalized Municipal Property Values by Year
4
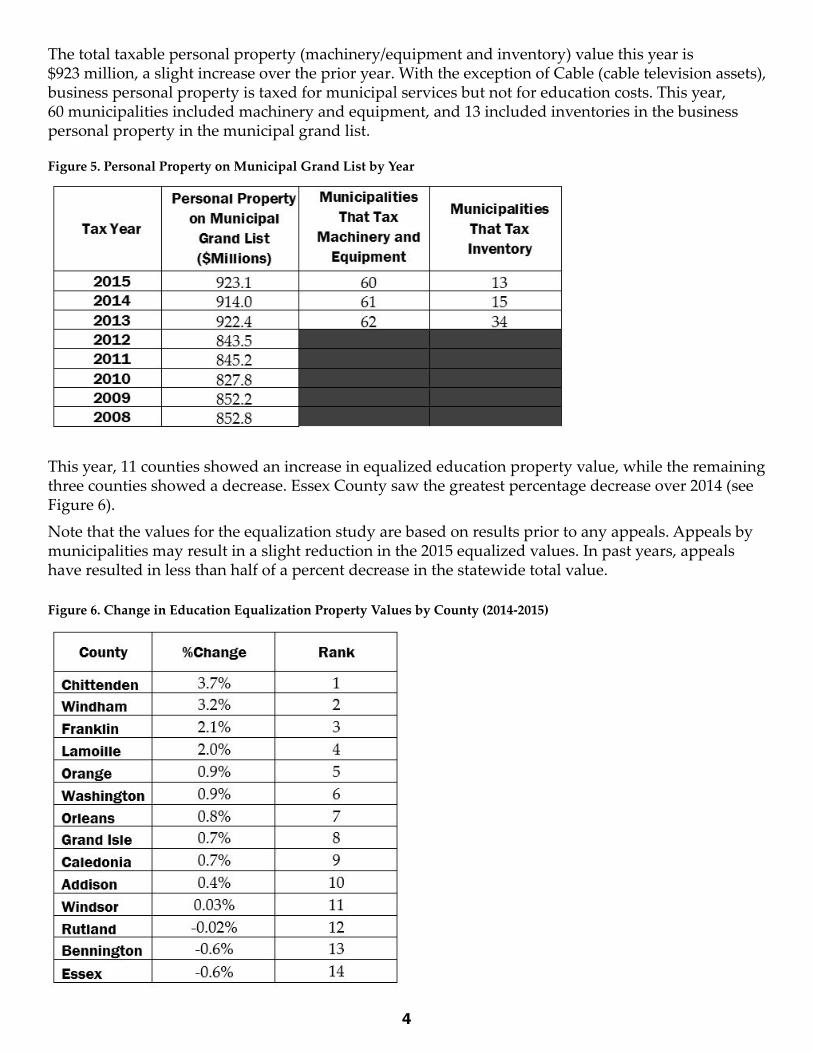
The total taxable personal property (machinery/equipment and inventory) value this year is $923 million, a slight increase over the prior year. With the exception of Cable (cable television assets), business personal property is taxed for municipal services but not for education costs. This year, 60 municipalities included machinery and equipment, and 13 included inventories in the business personal property in the municipal grand list.
Figure 5. Personal Property on Municipal Grand List by Year
This year, 11 counties showed an increase in equalized education property value, while the remaining three counties showed a decrease. Essex County saw the greatest percentage decrease over 2014 (see Figure 6).
Note that the values for the equalization study are based on results prior to any appeals. Appeals by municipalities may result in a slight reduction in the 2015 equalized values. In past years, appeals have resulted in less than half of a percent decrease in the statewide total value.
Figure 6. Change in Education Equalization Property Values by County (2014-2015)
5
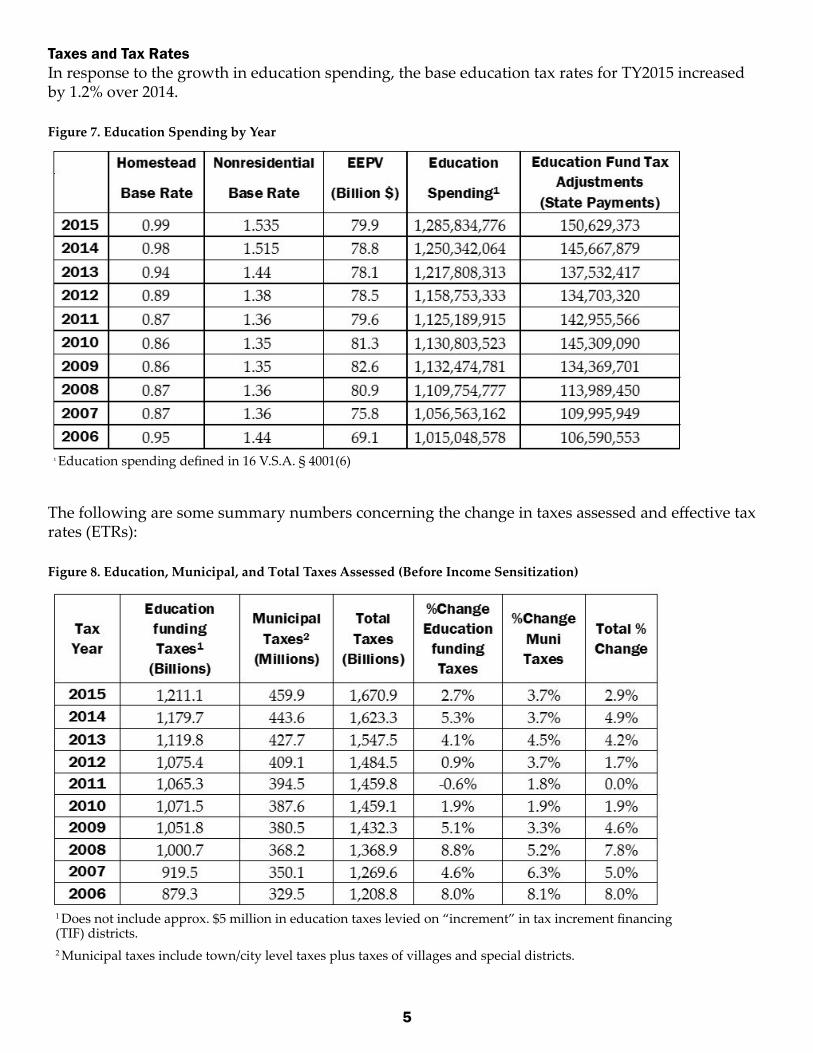
taxes and tax RatesIn response to the growth in education spending, the base education tax rates for TY2015 increased by 1.2% over 2014.
Figure 7. Education Spending by Year
The following are some summary numbers concerning the change in taxes assessed and effective tax rates (ETRs):
Figure 8. Education, Municipal, and Total Taxes Assessed (Before Income Sensitization)
1 Education spending defined in 16 V.S.A. § 4001(6)
1 Does not include approx. $5 million in education taxes levied on “increment” in tax increment financing (TIF) districts.2 Municipal taxes include town/city level taxes plus taxes of villages and special districts.

6
Figure 9. Education, Municipal and Total Effective Tax Rates
Assessment practices in VermontThere are two widely used measures for evaluating assessment practices in Vermont—the common level of appraisal (CLA) and the coefficient of dispersion (COD). The CLA is the ratio of a municipality’s total grand list value to its corresponding “equalized” value derived through PVR’s equalization study. The statewide CLA was 100.2% this year.
Figure 10. Statewide CLA by Year
The CLA can also be used to evaluate assessment practices by considering the change in the number of municipalities that have extremely low CLAs, and are therefore far from Vermont’s statutorily set standard of 100% of fair market value. As the CLA decreases, indicating valuations that are further away from true market value, the more difficult it is for property owners to analyze whether their valuation is equitable. In 1981, 41 municipalities were appraising property at less than 30% of fair market value. In 2007 there were only 26 districts with a CLA less than 60%. By 2015 there are no
1 Municipal taxes include town/city level taxes plus taxes of villages and special districts.
7
longer any districts that have a CLA under 80%, the statutory threshold below which a district will receive a reappraisal order from PVR.
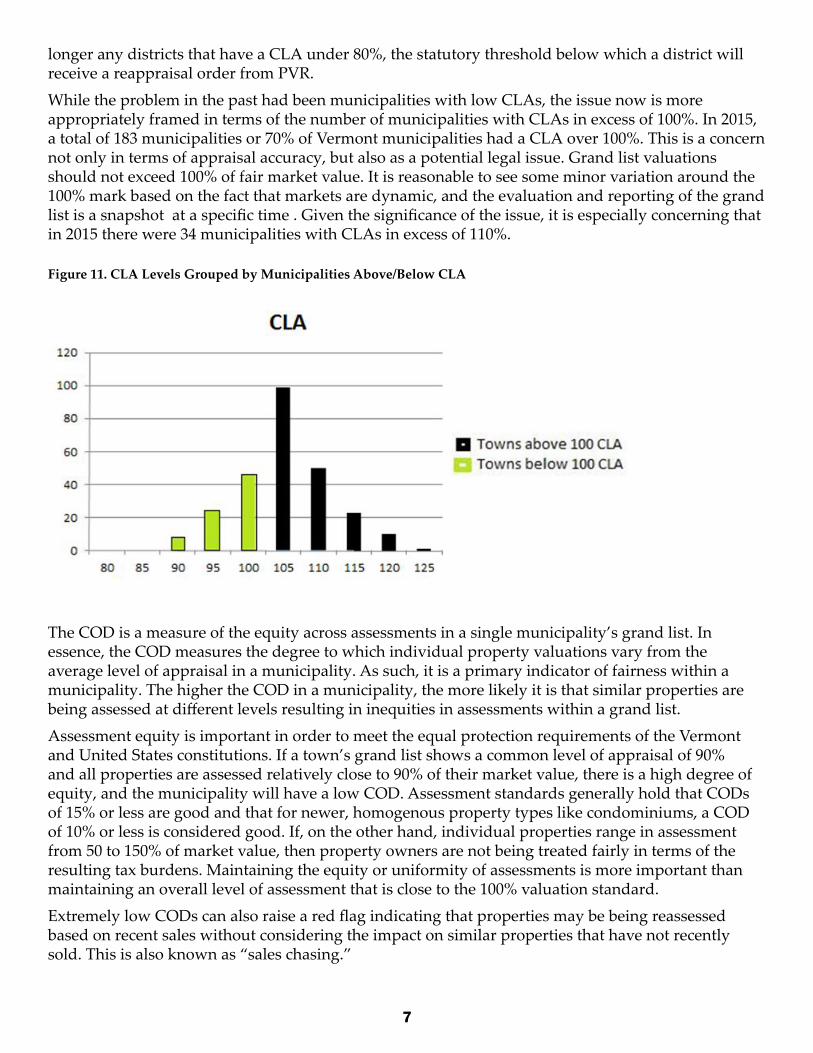
While the problem in the past had been municipalities with low CLAs, the issue now is more appropriately framed in terms of the number of municipalities with CLAs in excess of 100%. In 2015, a total of 183 municipalities or 70% of Vermont municipalities had a CLA over 100%. This is a concern not only in terms of appraisal accuracy, but also as a potential legal issue. Grand list valuations should not exceed 100% of fair market value. It is reasonable to see some minor variation around the 100% mark based on the fact that markets are dynamic, and the evaluation and reporting of the grand list is a snapshot at a specific time . Given the significance of the issue, it is especially concerning that in 2015 there were 34 municipalities with CLAs in excess of 110%.
Figure 11. CLA Levels Grouped by Municipalities Above/Below CLA
The COD is a measure of the equity across assessments in a single municipality’s grand list. In essence, the COD measures the degree to which individual property valuations vary from the average level of appraisal in a municipality. As such, it is a primary indicator of fairness within a municipality. The higher the COD in a municipality, the more likely it is that similar properties are being assessed at different levels resulting in inequities in assessments within a grand list.
Assessment equity is important in order to meet the equal protection requirements of the Vermont and United States constitutions. If a town’s grand list shows a common level of appraisal of 90% and all properties are assessed relatively close to 90% of their market value, there is a high degree of equity, and the municipality will have a low COD. Assessment standards generally hold that CODs of 15% or less are good and that for newer, homogenous property types like condominiums, a COD of 10% or less is considered good. If, on the other hand, individual properties range in assessment from 50 to 150% of market value, then property owners are not being treated fairly in terms of the resulting tax burdens. Maintaining the equity or uniformity of assessments is more important than maintaining an overall level of assessment that is close to the 100% valuation standard.
Extremely low CODs can also raise a red flag indicating that properties may be being reassessed based on recent sales without considering the impact on similar properties that have not recently sold. This is also known as “sales chasing.”
8
The objective of ratio studies is to determine appraisal performance for the populations of properties—both sold and unsold parcels. As long as standardized schedules and formulas are used in the valuation process, there is little reason to expect any significant difference in appraisal performance between sold and unsold parcels. If, however, sold parcels are selectively reappraised based on their sales prices or other criteria, the appraised values used in ratio studies will not be representative and ratio statistics will be distorted. In all probability, calculated measures of central tendency will be artificially high and measure of dispersion will be artificially low.1
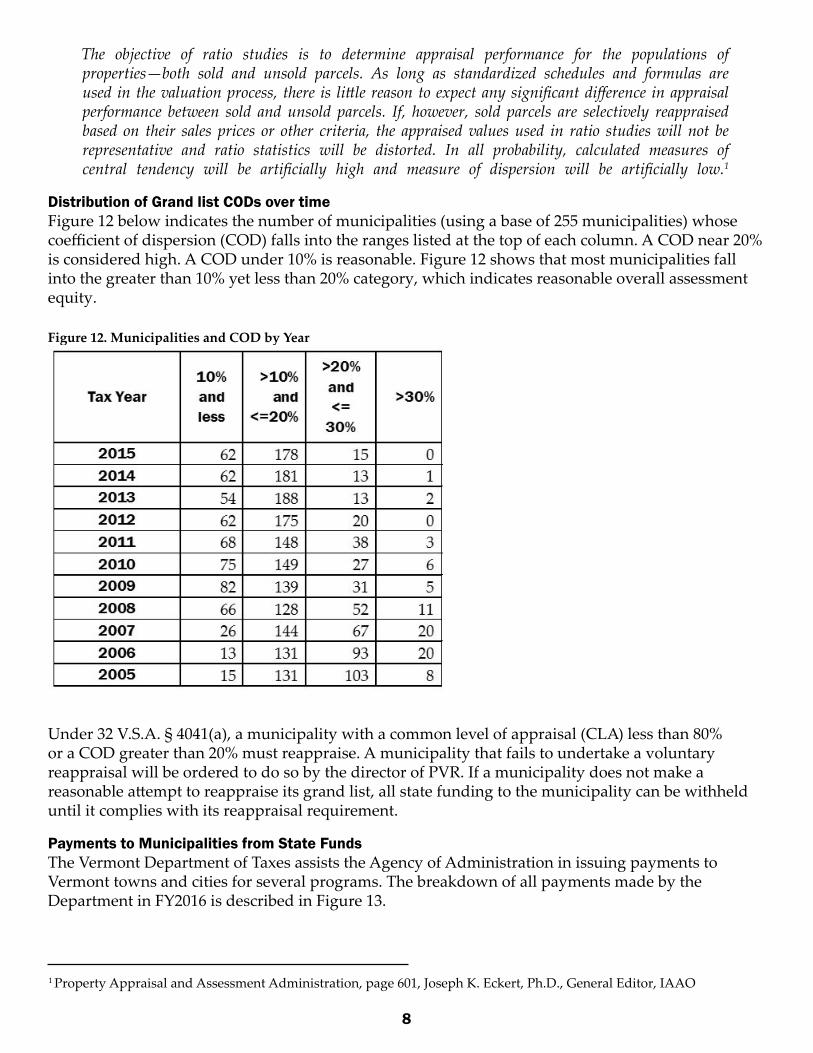
Distribution of Grand list CoDs over timeFigure 12 below indicates the number of municipalities (using a base of 255 municipalities) whose coefficient of dispersion (COD) falls into the ranges listed at the top of each column. A COD near 20% is considered high. A COD under 10% is reasonable. Figure 12 shows that most municipalities fall into the greater than 10% yet less than 20% category, which indicates reasonable overall assessment equity.
Figure 12. Municipalities and COD by Year
Under 32 V.S.A. § 4041(a), a municipality with a common level of appraisal (CLA) less than 80% or a COD greater than 20% must reappraise. A municipality that fails to undertake a voluntary reappraisal will be ordered to do so by the director of PVR. If a municipality does not make a reasonable attempt to reappraise its grand list, all state funding to the municipality can be withheld until it complies with its reappraisal requirement.
payments to Municipalities from State FundsThe Vermont Department of Taxes assists the Agency of Administration in issuing payments to Vermont towns and cities for several programs. The breakdown of all payments made by the Department in FY2016 is described in Figure 13.
1 Property Appraisal and Assessment Administration, page 601, Joseph K. Eckert, Ph.D., General Editor, IAAO

9
Figure 13. Payments to Municipalities
The largest of the Department programs is the municipal hold harmless payment for the Current Use Program. This program reimburses municipalities for property tax revenue not collected from persons enrolled in the Current Use Program. The Current Use Program is described in detail starting on page 17.
The Department’s second largest payment program is Payment-In-Lieu-Of-Taxes (PILOT). Annual PILOT payments are made to municipalities to compensate for municipal taxes not collected due to presence of state-owned buildings in a municipality. These payments are made annually on or before the end of October. Payment is based on the value of state-owned property under 32 V.S.A. § 3701. In FY2016, State Buildings PILOT payments totaled about $6.4 million.
For the most part, the remaining program provides payments to municipalities to assist them with the cost of grand list maintenance and to help pay for the cost of reappraisals. These programs make annual payments to municipalities for the following:
• Payments to pay for educational opportunities for listers and assessors• Payments that must be used by a municipality for grand list maintenance and reappraisal costs • Payments to reimburse municipalities for the assistance they provide to PVR in conducting the annual equalization study
Real estate Sales DataThe median R1 category (residential under 6 acres) sale price is up by 0.5%, though this may be more reflective of the types of properties selling than of the market as a whole. Moderately priced homes appear to be selling in greater numbers than high-end houses.
The median S1 category (seasonal under 6 acres) sale price is unchanged, possibly due to market trends being slow on reinvestment on secondary home ownership due to a slow economy.
Figure 14. Median Prices for Residential and Seasonal Properties
1 The term “Vacation” was changed in 2009 to “Seasonal” to better define the category. Seasonal homes are dwelling that are built for less than full-year occupancy, such as cabins, hunting camps, camps or cottages on lake or ponds, etc.
10
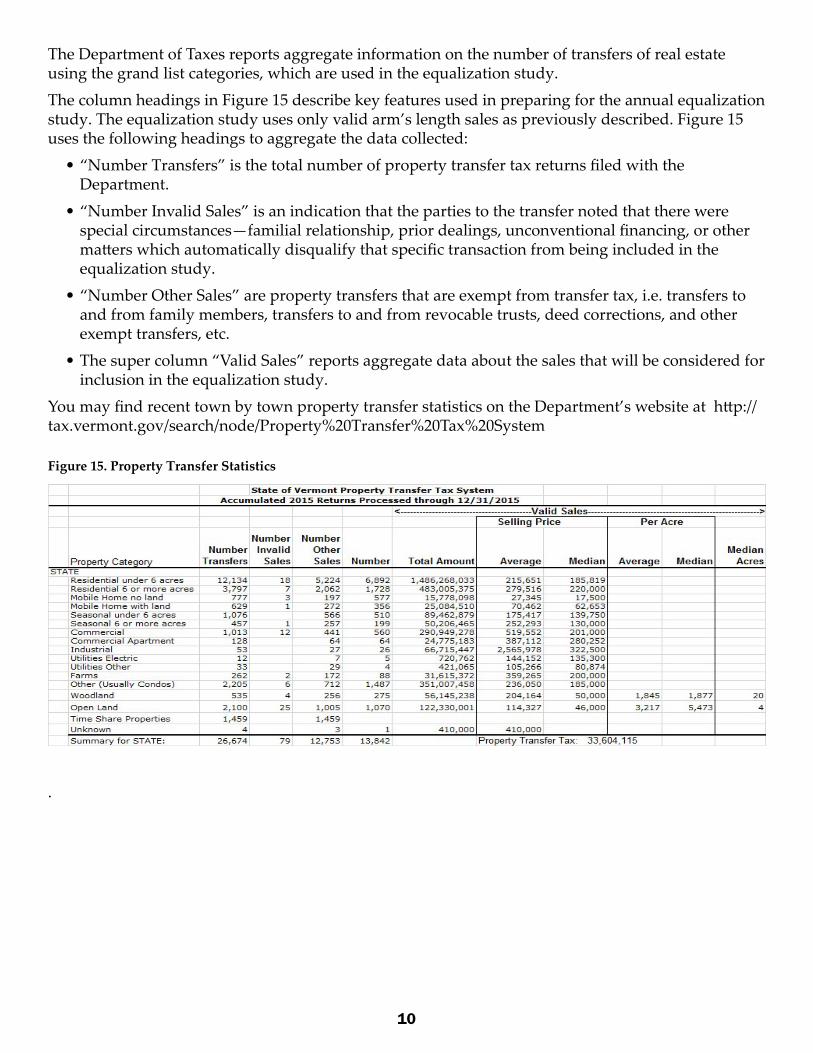
The Department of Taxes reports aggregate information on the number of transfers of real estate using the grand list categories, which are used in the equalization study.
The column headings in Figure 15 describe key features used in preparing for the annual equalization study. The equalization study uses only valid arm’s length sales as previously described. Figure 15 uses the following headings to aggregate the data collected:
• “Number Transfers” is the total number of property transfer tax returns filed with the Department.
• “Number Invalid Sales” is an indication that the parties to the transfer noted that there were special circumstances—familial relationship, prior dealings, unconventional financing, or other matters which automatically disqualify that specific transaction from being included in the equalization study.
• “Number Other Sales” are property transfers that are exempt from transfer tax, i.e. transfers to and from family members, transfers to and from revocable trusts, deed corrections, and other exempt transfers, etc.
• The super column “Valid Sales” reports aggregate data about the sales that will be considered for inclusion in the equalization study.
You may find recent town by town property transfer statistics on the Department’s website at http://tax.vermont.gov/search/node/Property%20Transfer%20Tax%20System
Figure 15. Property Transfer Statistics
.
11
education and training
Part of PVR’s mission is to encourage, promote, and provide educational opportunities and advancement for listers and assessors throughout the state. PVR accomplishes this mission by the following guidelines and steps for advancement:
• seeking and promoting new and relevant educational opportunities• developing cooperative relationships with assessment education entities• communicating with Vermont officials and the public
• providing guidelines for fair and equitable standards.
During 2015, PVR provided a full training program to listers, assessors, and other valuation professionals in many aspects of property valuation, tax administration, and assessment. A range of offerings was provided so that everyone, from new listers to seasoned assessors, could take a class appropriate to their level of experience and understanding. There were seven topics presented during the year at various locations around the state, with 165 total participants.
PVR staff presented the following classes: Lister Training, Advanced Lister Training, Residential Data Collection, and Developing a Land Schedule. PVR also sponsored three International Association of Assessing Officers (IAAO) courses as follows: Fundamentals of Mass Appraisal, Residential Modeling Concepts and Understanding Real Property Appraisal, which were taught by IAAO certified instructors. There were also individual training sessions for town-specific issues.
PVR continues its collaboration with the University of Vermont Extension Service to provide seminars at the Town Officer Education Conference. Listers again were the largest audience at the 2015 spring sessions held at various locations around the state. PVR staff presented one workshop: Solar Valuation: Working Through the New Law. In addition, PVR staff assisted members of Vermont Assessors and Listers Association (VALA) in presenting the Lister Forum.
Education continues to be a high priority for PVR and for the Vermont legislature. The funds appropriated to towns for lister education provide opportunities for those listers who otherwise would not have the resources to attend classes. Listers continue to actively participate in PVR’s Lister Education Program, which enables them to understand their responsibilities as listers and better perform the duties of the office. Many towns have benefitted from the classes developed by PVR and will benefit going forward as we continue our mission of providing education and training to elected officials.
PVR is continually looking to introduce new ways of presenting courses which will better reach the target audience and enable more municipal officials to participate in education programs. To that end, PVR has been collaborating with VALA and the New England Municipal Resource Center to offer an assortment of different learning environments such as webinars, online courses and the traditional classroom setting.
PVR is now in the third year of the Vermont Property Appraiser Certification Program (VPACP) for listers and assessors. VPACP creates four levels of designation. Each level has prerequisites and requirements, including levels of work experience and training.
The program has awarded 72 designations since its inception:• Vermont Property Assessor level 1 (VPA 1) – 34 • Vermont Property Assessor level 2 (VPA II) – 19 • Vermont Property Assessor level 3 (VPA III) – 14• Vermont Master Property Assessor level 4 (VMPA IV) – 5
12
Appeals to the Property Tax Hearing Officers
Under 32 V.S.A. §§ 4461-4469, property owners have the right to appeal decisions of the local boards of civil authority to either the Superior Court or the director of PVR. The director appoints hearing officers to hear and decide appeals. Currently there are four hearing officers.
As of December 2015, PVR has received 63 appeals based on 2015 grand list activity. The one 2015 appeal that has been heard and decided by the hearing officer so far resulted in a reduction in value.
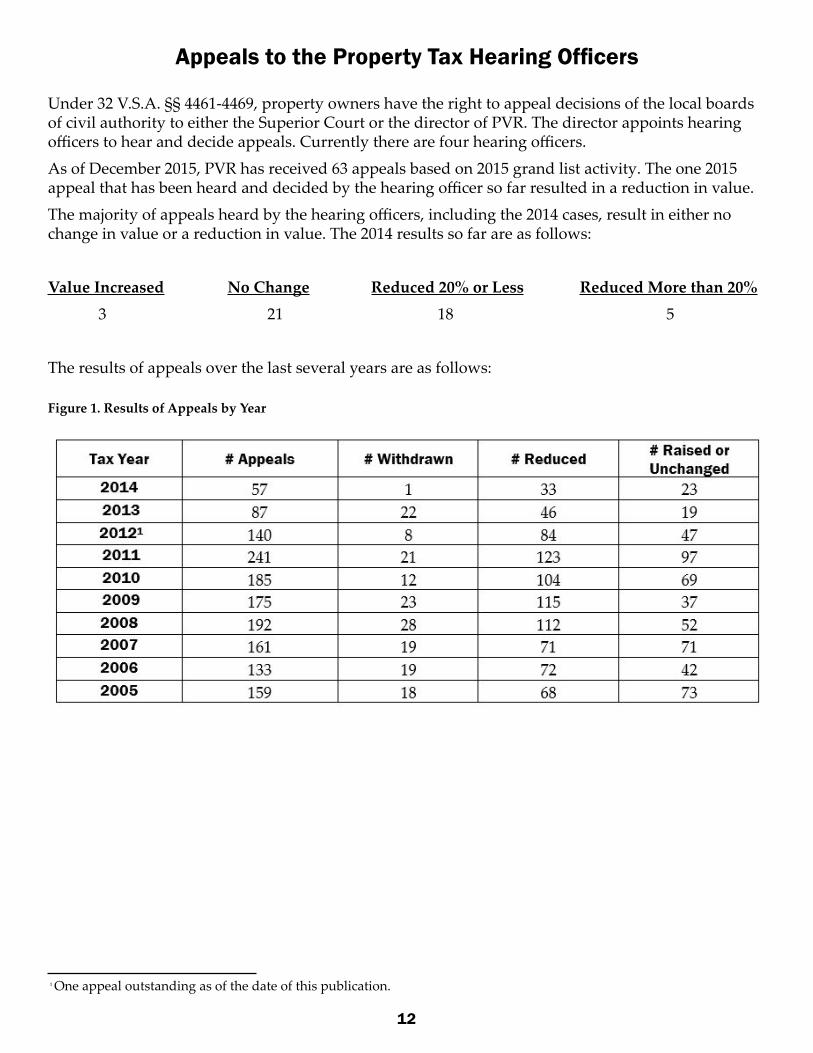
The majority of appeals heard by the hearing officers, including the 2014 cases, result in either no change in value or a reduction in value. The 2014 results so far are as follows:
Value Increased No Change Reduced 20% or Less Reduced More than 20% 3 21 18 5
The results of appeals over the last several years are as follows:
Figure 1. Results of Appeals by Year
1 One appeal outstanding as of the date of this publication.

13
Computer Assisted Mass Appraisal System (CAMA) and Grand list Management Software
Under 32 V.S.A. § 3411(8), PVR is required to develop and recommend to the Vermont legislature improved methods for standardizing property assessment procedures and to provide technical assistance and instruction to the listers in a uniform appraisal system. A tool used by PVR to assist in meeting the challenge of enhancing assessment uniformity is the Computer Assisted Mass Appraisal (CAMA) system.
The Department currently supports two Windows-based software applications. One is MicroSolve, a CAMA product that is supplied by the New England Municipal Resource Center (NEMRC) and which uses the Marshall and Swift cost tables for the cost approach. MicroSolve is also capable of generating values using the market comparison approach and the income approach. The second software application is a tax administration application called the Grand List Administration Module, which is also supplied by NEMRC. The two systems are linked so that values generated in MicroSolve are automatically transferred to the Grand List module.
The Department’s Information Technology Division (IT) provides Help Desk staff to assist municipalities with questions about the two programs. The IT Help Desk is currently supporting 194 municipalities using MicroSolve. All municipalities in Vermont use the NEMRC Grand List Administration Module.
PVR’s goal is to continue to support educational services that offer comprehensive training for the assessment community.
PVR is engaged in a long-term plan to improve the architecture and capabilities of the CAMA software. The CAMA evaluation group continues to meet to re-evaluate, define, and prioritize major system enhancements. These recommendations are passed to PVR for approval and once approved sent to NEMRC for implementation.
Although no major changes were implemented this year, minor updates and enhancements were completed.
14
Real estate transaction taxes
PVR administers real estate transaction taxes, including Property Transfer Tax, Land Gains Tax, Real Estate Withholding, and Real Estate Withholding Income Tax.
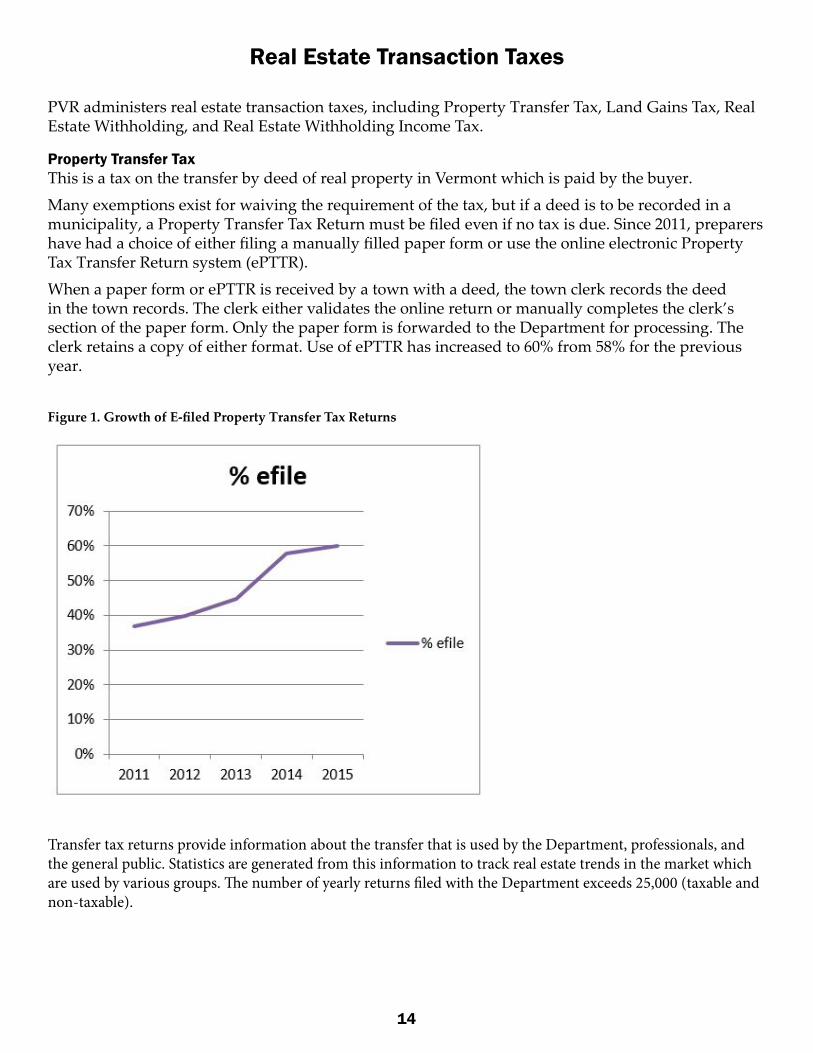
property transfer taxThis is a tax on the transfer by deed of real property in Vermont which is paid by the buyer.
Many exemptions exist for waiving the requirement of the tax, but if a deed is to be recorded in a municipality, a Property Transfer Tax Return must be filed even if no tax is due. Since 2011, preparers have had a choice of either filing a manually filled paper form or use the online electronic Property Tax Transfer Return system (ePTTR).
When a paper form or ePTTR is received by a town with a deed, the town clerk records the deed in the town records. The clerk either validates the online return or manually completes the clerk’s section of the paper form. Only the paper form is forwarded to the Department for processing. The clerk retains a copy of either format. Use of ePTTR has increased to 60% from 58% for the previous year.
Figure 1. Growth of E-filed Property Transfer Tax Returns
Transfer tax returns provide information about the transfer that is used by the Department, professionals, and the general public. Statistics are generated from this information to track real estate trends in the market which are used by various groups. The number of yearly returns filed with the Department exceeds 25,000 (taxable and non-taxable).

15
Figure 2. Revenue from Property Transfer Tax Per Fiscal Year
land GainsThis is a tax on the gain from the sale or exchange of land that has been held for fewer than six years. The tax is typically paid by the seller, though in certain circumstances this liability is transferred to the buyer. Exemptions do exist to waive the payment of the tax, but generally, if land is held for fewer than six years, the buyer is required to withhold 10% of the purchase price of the land.
The seller is required to file a Land Gains Tax return to report the sale. The withholding is used to pay any tax owed. The seller may avoid withholding by either obtaining a certificate from the Department or by paying the tax at closing. Though this tax does provide some revenue to the state, its main purpose is to discourage “speculation,” the holding of land for a short period and then selling it at a profit. Thus, the tax rate is on a sliding scale based on the seller’s holding period and the percentage of the gain bears to the basis. The longer the holding period and the smaller the percentage, less tax is paid. The number of yearly returns filed with the Department exceeds 1,500 (taxable and non-taxable).
Figure 3. Revenue from Land Gains Tax Per Fiscal Year
Real estate WithholdingThis is a withholding tax on the sale or exchange of real estate by nonresidents of Vermont. The withholding is the responsibility of the buyer, but it is a credit for the seller to be used on the seller’s income tax return. Gains from the sale of real estate are taxable to nonresidents, and the withholding is security to the state that an income tax return will be filed. The rate of withholding is 2.5% of the sales price. Certificates of reduced withholding are issued by the Department when the seller can establish no tax is due or that the 2.5% amount exceeds the seller’s maximum tax liability. The number of yearly returns filed with the Department exceeds 2,000.

16
Figure 4. Withholding Revenue from Real Estate Withholding Tax Per Fiscal Year
Real estate Withholding income taxThis is a tax on income from capital gains on the sale of real estate by nonresidents. The withholding that occurred at sale is a credit against this tax, and any balance is refunded to the taxpayer. If the withholding is not enough to cover the liability, the taxpayer pays the difference. The Real Estate Withholding Tax and the corresponding income tax return ensure that nonresidents pay their fair share of tax on Vermont real estate sales. Approximately 2,000 income returns with real estate withholding are filed annually. Revenue figures from this tax are unavailable as they are part of the overall income tax figures.
17
2015 Current use (use Value Appraisal) program
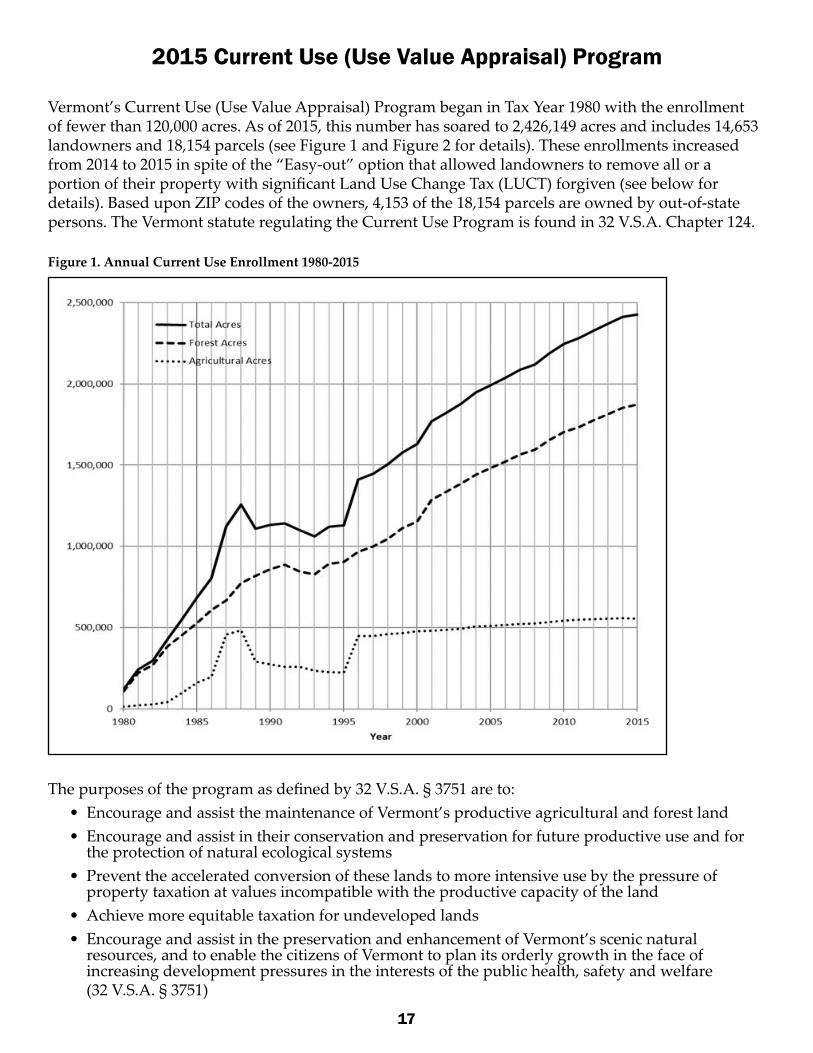
Vermont’s Current Use (Use Value Appraisal) Program began in Tax Year 1980 with the enrollment of fewer than 120,000 acres. As of 2015, this number has soared to 2,426,149 acres and includes 14,653 landowners and 18,154 parcels (see Figure 1 and Figure 2 for details). These enrollments increased from 2014 to 2015 in spite of the “Easy-out” option that allowed landowners to remove all or a portion of their property with significant Land Use Change Tax (LUCT) forgiven (see below for details). Based upon ZIP codes of the owners, 4,153 of the 18,154 parcels are owned by out-of-state persons. The Vermont statute regulating the Current Use Program is found in 32 V.S.A. Chapter 124.
Figure 1. Annual Current Use Enrollment 1980-2015
The purposes of the program as defined by 32 V.S.A. § 3751 are to:• Encourage and assist the maintenance of Vermont’s productive agricultural and forest land • Encourage and assist in their conservation and preservation for future productive use and for
the protection of natural ecological systems • Prevent the accelerated conversion of these lands to more intensive use by the pressure of
property taxation at values incompatible with the productive capacity of the land• Achieve more equitable taxation for undeveloped lands• Encourage and assist in the preservation and enhancement of Vermont’s scenic natural
resources, and to enable the citizens of Vermont to plan its orderly growth in the face of increasing development pressures in the interests of the public health, safety and welfare (32 V.S.A. § 3751)
18
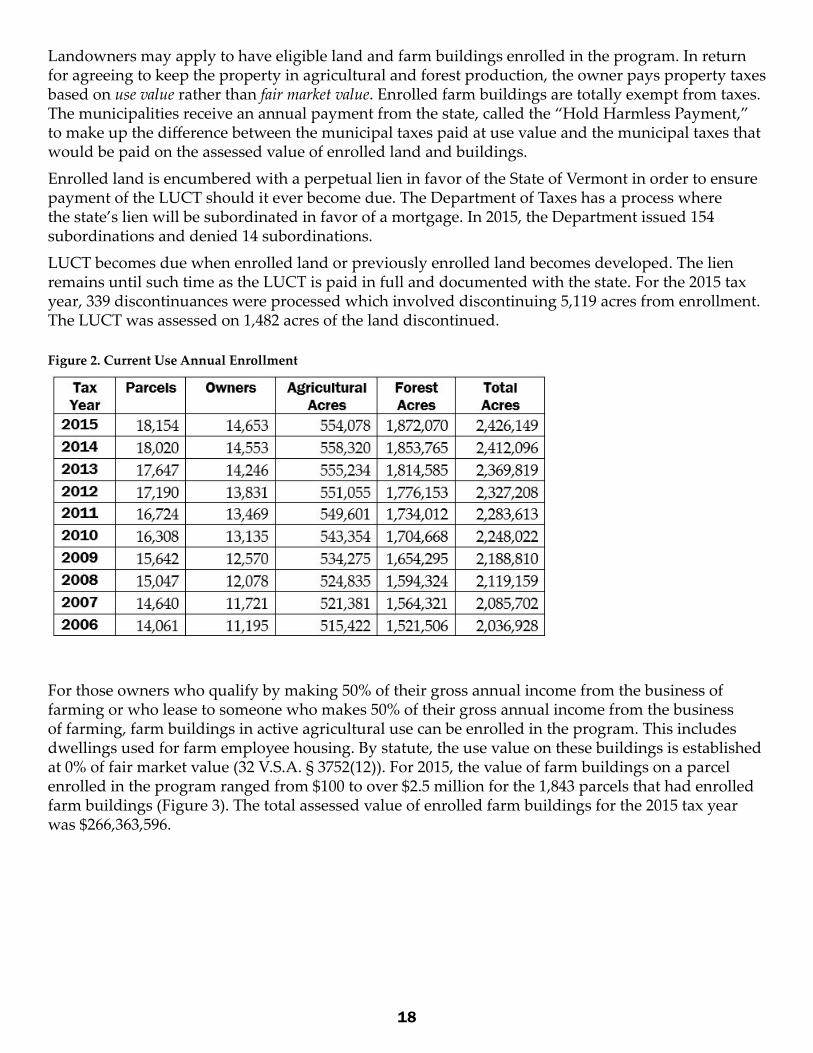
Landowners may apply to have eligible land and farm buildings enrolled in the program. In return for agreeing to keep the property in agricultural and forest production, the owner pays property taxes based on use value rather than fair market value. Enrolled farm buildings are totally exempt from taxes. The municipalities receive an annual payment from the state, called the “Hold Harmless Payment,” to make up the difference between the municipal taxes paid at use value and the municipal taxes that would be paid on the assessed value of enrolled land and buildings.
Enrolled land is encumbered with a perpetual lien in favor of the State of Vermont in order to ensure payment of the LUCT should it ever become due. The Department of Taxes has a process where the state’s lien will be subordinated in favor of a mortgage. In 2015, the Department issued 154 subordinations and denied 14 subordinations.
LUCT becomes due when enrolled land or previously enrolled land becomes developed. The lien remains until such time as the LUCT is paid in full and documented with the state. For the 2015 tax year, 339 discontinuances were processed which involved discontinuing 5,119 acres from enrollment. The LUCT was assessed on 1,482 acres of the land discontinued.
Figure 2. Current Use Annual Enrollment
For those owners who qualify by making 50% of their gross annual income from the business of farming or who lease to someone who makes 50% of their gross annual income from the business of farming, farm buildings in active agricultural use can be enrolled in the program. This includes dwellings used for farm employee housing. By statute, the use value on these buildings is established at 0% of fair market value (32 V.S.A. § 3752(12)). For 2015, the value of farm buildings on a parcel enrolled in the program ranged from $100 to over $2.5 million for the 1,843 parcels that had enrolled farm buildings (Figure 3). The total assessed value of enrolled farm buildings for the 2015 tax year was $266,363,596.

19
Figure 3. Recent Farm Building Enrollment
Based upon prior year trends, the program anticipates 1,200 transfers of enrollments and 400 applications to increase enrollments for the 2016 tax year.
easy-out program In the 2015 Vermont legislative session, Section 53 of Act 57 created the Easy-out program to allow current use enrollees discontinue enrollment of all or a portion of their land in current use and be relieved of the first $50,000 of the LUCT liability. The change applied retroactively to the April 1, 2015, grand list. The legislation requires that the land cannot be re-enrolled in the program for five years.
More than 900 applications were received for the Easy-out program. Of these applications, 273 parcels were removed entirely from the program and 606 parcels had a portion of land removed from the program. Several landowners chose to withdraw their applications. Twenty applications were denied because they did not meet the legislative criteria for the program. Figure 4 provides a summary of the Easy-out program.
The Easy-out program involved 1% of all land enrolled in the program. The median acreage removed was 10 acres and the average was 28 acres. In total, $38M of land value was removed from the program. This saves the state approximately $200,000 in hold harmless payments annually and generated approximately $600,000 for the Education Fund for FY2016. Even without accounting for increases in property values or tax rates over the next 5 years, this represents approximately $4,000,000 in savings in hold-harmless payments and increases to the Education Fund over the time period that the land cannot be re-enrolled.
Figure 4. Easy-out Option Summary

20
2015 Current use Audit RequirementIn the 2015 Vermont legislative session Act 57 Section 56 added 32 V.S.A. § 3760a to require the Director of PVR to, on an annual basis, audit three towns with land enrolled in Current Use. These audit findings could have a significant impact on the hold harmless payments in 2017 and moving forward. The 2015 Current Use Audit has been completed for 1 out of the 3 towns and will be completed in January 2016 for the other 2 towns. A sum-mary of these finding will be included in the next Annual Report.
Annual Agricultural Certification Status ReportIn the 2015 Vermont legislative session Act 57 Section 57 added the requirement for landowners to certify ag-ricultural land Use eligibility. In August of 2015 over 7,300 Annual Agricultural Certifications (Ag Certs) were mailed to Current Use enrollees; Ag Certs which have been returned to the Department are currently being evaluated and a second mailing will be generated in January of 2016 to address issues identified or non-respon-sive enrollees. Ag Certs submitted on or before Sept. 1, 2015 will impact the enrollment status for tax year 2016 to remain consistent with the annual application cycle.Impacts of the Ag Certs to Current Use enrollments will not be available for analysis until the summer of 2016. Initial assessment of the Ag Certs by PVR indicates that some recipients of the Ag Cert chose to file an easy-out application to remove their land from Current Use. However, this observation will take some time to validate.
use Values The Current Use Advisory Board (CUAB) is charged with adopting rules, providing administrative oversight, and establishing use values. The CUAB meets annually to review data presented by the Agency of Agriculture, Food and Markets and by the Department of Forests, Parks and Recreation regarding the appropriate use values to be assigned for the next property tax year. The data is used to establish the use values for computing the taxes on enrolled land (see Figure 5). The net annual stumpage value per acre is a key component for forest land use value rate. Pasture and crop land rental values are the key component for agricultural land. Enrolled farm build-ing use value is established in statute as 0% of the fair market value, so no taxes are paid by the landowner on these buildings.
Figure 5. Use Values

21
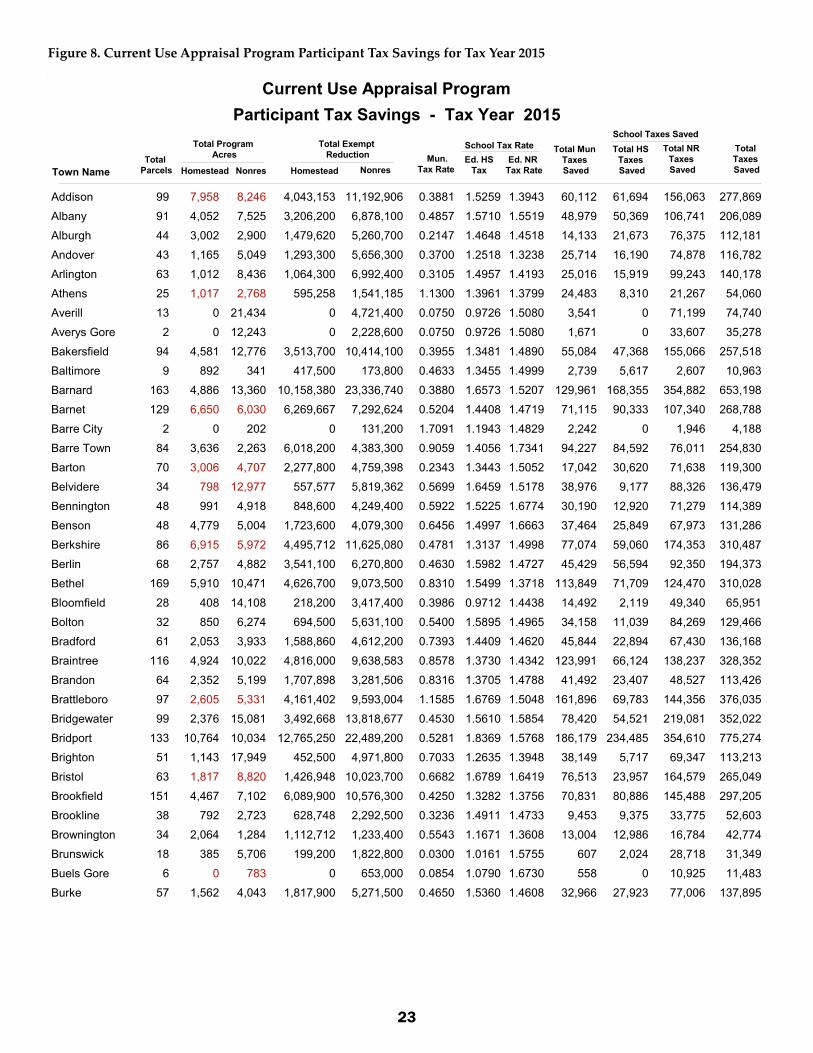
program Costs and tax SavingTax savings to landowners climbed to more than $59,128,471 million in 2015 (see Figure 6). The enrollment in the program also saw a steady increase both in parcels, owners, and acres enrolled except for the “easy-out” years in the 1990s and the slight decline in agricultural land enrollment for 2015 (see Figure 1). As the enrollment has climbed and landowners overall saved more in property taxes, the cost of the program has increased.
The “Municipal Tax Savings to Landowners” column in Figure 6 is the total municipal taxes saved by enrolled land owners and conversely the taxes not paid to the municipality by the landowner due to enrollment in the program. The state provides a “Hold Harmless Payment” to the municipality each year which makes up for the difference in the lost property taxes due to the prior year’s current use enrollment. The Hold Harmless payment in 1980 was just over $400,000. In 2015, it was $15.0 million. The calculations for each municipality’s hold harmless payment are available on the Department’s website at http://tax.vermont.gov/content/reports-hold-harmless.
The “Education Tax Savings to Enrolled Landowners” column in Figure 6 is the total statewide education taxes saved by enrolled land owners and conversely the forgone revenue to the state’s Education Fund. Forgone revenue means that these taxes are never paid into the Education Fund. In 2015, the forgone revenue to the Education Fund was $44,609,223. The drop of $551,923 from 2014 can be attributed to the Easy-out program which applied to the 2015 property tax year that began April 1, 2015. The value of the program to Vermont’s working landscape, relating industries, and environmental quality are not quantified here, but are viewed as significant.
Figure 6. Tax Savings to Landowners
land use Change taxA one-time Land Use Change Tax (LUCT) is levied when enrolled land is “developed” as that term is defined in 32 V.S.A. § 3752(5). Landowners may withdraw from the program without paying the tax provided they have not developed the land. The lien remains on the land until such time as the LUCT tax is paid. The calculation of LUCT changed for property developed or discontinued after Oct. 2, 2015. Due to the overwhelming workload associated with the legislative changes from 2015, no discontinuances have been processed under the new formula. This report only covers those discontinuances done under the previous formula.

22
The acres developed and discontinued are shown in Figure 7 along with the amount of LUCT assessed and the number of discontinuances that were processed by the program. The LUCT is assessed when the land is developed or the land owner wishes to voluntarily remove the lien. By statute, development includes the construction of any building, road, or other structure that is not used for farming. For logging, forestry, or conservation purposes, development includes:
• Any mining, excavation, or landfill activity• Creation of a parcel of fewer than 25 acres unless the transfer is to an immediate relative and
the new parcel is eligible for continued enrollment• Cutting of timber contrary to a forest or conservation management plan• Or a change in the parcel or use of parcel in violation of the conservation management
standards
Land can be discontinued from the program without having been assessed. These acres are show in the “Acres Discontinued, but No Land Use Change Tax Due” column. If the land is then developed in the future, the program might find out about the development through a title search when a parcel is being transferred, through the listers who are aware of the previous enrollment, or it might go undetected for years. In addition to the discontinuance of the land summarized in the table, 18 parcels had all or some of their farm buildings discontinued from the program.
Figure 7. Development and Discontinuance of Enrolled Land
23
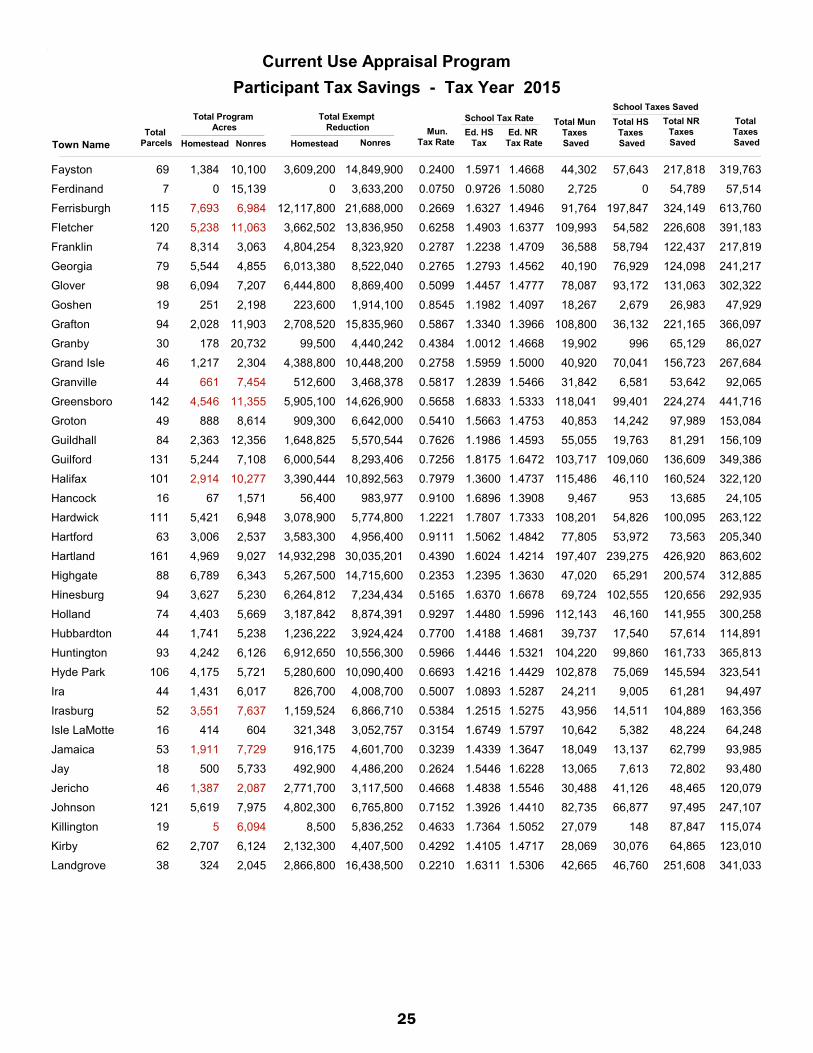
Figure 8. Current Use Appraisal Program Participant Tax Savings for Tax Year 2015
School Taxes Saved
Mun. Tax Rate
Total Parcels Homestead
Total Program Acres Ed. HS
Tax Town Name
Current Use Appraisal Program Participant Tax Savings - Tax Year 2015
Ed. NR Tax Rate
Total Mun Taxes Saved
Total HS Taxes Saved
Total NR Taxes Saved
Total Taxes Saved
School Tax Rate
Nonres
Total Exempt Reduction
Homestead Nonres
8,2467,958 11,192,906Addison 0.3881 1.5259 1.3943 60,112 61,694 156,06399 4,043,153 277,869
7,5254,052 6,878,100Albany 0.4857 1.5710 1.5519 48,979 50,369 106,74191 3,206,200 206,089
2,9003,002 5,260,700Alburgh 0.2147 1.4648 1.4518 14,133 21,673 76,37544 1,479,620 112,181
5,0491,165 5,656,300Andover 0.3700 1.2518 1.3238 25,714 16,190 74,87843 1,293,300 116,782
8,4361,012 6,992,400Arlington 0.3105 1.4957 1.4193 25,016 15,919 99,24363 1,064,300 140,178
2,7681,017 1,541,185Athens 1.1300 1.3961 1.3799 24,483 8,310 21,26725 595,258 54,060
21,4340 4,721,400Averill 0.0750 0.9726 1.5080 3,541 0 71,19913 0 74,740
12,2430 2,228,600Averys Gore 0.0750 0.9726 1.5080 1,671 0 33,6072 0 35,278
12,7764,581 10,414,100Bakersfield 0.3955 1.3481 1.4890 55,084 47,368 155,06694 3,513,700 257,518
341892 173,800Baltimore 0.4633 1.3455 1.4999 2,739 5,617 2,6079 417,500 10,963
13,3604,886 23,336,740Barnard 0.3880 1.6573 1.5207 129,961 168,355 354,882163 10,158,380 653,198
6,0306,650 7,292,624Barnet 0.5204 1.4408 1.4719 71,115 90,333 107,340129 6,269,667 268,788
2020 131,200Barre City 1.7091 1.1943 1.4829 2,242 0 1,9462 0 4,188
2,2633,636 4,383,300Barre Town 0.9059 1.4056 1.7341 94,227 84,592 76,01184 6,018,200 254,830
4,7073,006 4,759,398Barton 0.2343 1.3443 1.5052 17,042 30,620 71,63870 2,277,800 119,300
12,977798 5,819,362Belvidere 0.5699 1.6459 1.5178 38,976 9,177 88,32634 557,577 136,479
4,918991 4,249,400Bennington 0.5922 1.5225 1.6774 30,190 12,920 71,27948 848,600 114,389
5,0044,779 4,079,300Benson 0.6456 1.4997 1.6663 37,464 25,849 67,97348 1,723,600 131,286
5,9726,915 11,625,080Berkshire 0.4781 1.3137 1.4998 77,074 59,060 174,35386 4,495,712 310,487
4,8822,757 6,270,800Berlin 0.4630 1.5982 1.4727 45,429 56,594 92,35068 3,541,100 194,373
10,4715,910 9,073,500Bethel 0.8310 1.5499 1.3718 113,849 71,709 124,470169 4,626,700 310,028
14,108408 3,417,400Bloomfield 0.3986 0.9712 1.4438 14,492 2,119 49,34028 218,200 65,951
6,274850 5,631,100Bolton 0.5400 1.5895 1.4965 34,158 11,039 84,26932 694,500 129,466
3,9332,053 4,612,200Bradford 0.7393 1.4409 1.4620 45,844 22,894 67,43061 1,588,860 136,168
10,0224,924 9,638,583Braintree 0.8578 1.3730 1.4342 123,991 66,124 138,237116 4,816,000 328,352
5,1992,352 3,281,506Brandon 0.8316 1.3705 1.4788 41,492 23,407 48,52764 1,707,898 113,426
5,3312,605 9,593,004Brattleboro 1.1585 1.6769 1.5048 161,896 69,783 144,35697 4,161,402 376,035
15,0812,376 13,818,677Bridgewater 0.4530 1.5610 1.5854 78,420 54,521 219,08199 3,492,668 352,022
10,03410,764 22,489,200Bridport 0.5281 1.8369 1.5768 186,179 234,485 354,610133 12,765,250 775,274
17,9491,143 4,971,800Brighton 0.7033 1.2635 1.3948 38,149 5,717 69,34751 452,500 113,213
8,8201,817 10,023,700Bristol 0.6682 1.6789 1.6419 76,513 23,957 164,57963 1,426,948 265,049
7,1024,467 10,576,300Brookfield 0.4250 1.3282 1.3756 70,831 80,886 145,488151 6,089,900 297,205
2,723792 2,292,500Brookline 0.3236 1.4911 1.4733 9,453 9,375 33,77538 628,748 52,603
1,2842,064 1,233,400Brownington 0.5543 1.1671 1.3608 13,004 12,986 16,78434 1,112,712 42,774
5,706385 1,822,800Brunswick 0.0300 1.0161 1.5755 607 2,024 28,71818 199,200 31,349
7830 653,000Buels Gore 0.0854 1.0790 1.6730 558 0 10,9256 0 11,483
4,0431,562 5,271,500Burke 0.4650 1.5360 1.4608 32,966 27,923 77,00657 1,817,900 137,895

24
School Taxes Saved
Mun. Tax Rate
Total Parcels Homestead
Total Program Acres Ed. HS
Tax Town Name
Current Use Appraisal Program Participant Tax Savings - Tax Year 2015
Ed. NR Tax Rate
Total Mun Taxes Saved
Total HS Taxes Saved
Total NR Taxes Saved
Total Taxes Saved
School Tax Rate
Nonres
Total Exempt Reduction
Homestead Nonres
1040 273,300Burlington 0.7926 1.6544 1.7535 2,166 0 4,7922 0 6,958
6,0127,496 9,174,800Cabot 0.5100 1.6511 1.5089 95,113 154,677 138,439141 9,368,100 388,229
6,7476,006 8,209,625Calais 0.5811 1.7580 1.6607 91,267 131,784 136,337139 7,496,265 359,388
16,2406,337 17,615,770Cambridge 0.4200 1.4184 1.4914 104,605 103,403 262,722157 7,290,100 470,730
4,6692,228 2,920,000Canaan 0.6095 1.0380 1.4847 20,660 4,875 43,35334 469,700 68,888
4,8252,739 4,495,200Castleton 0.4233 1.4378 1.5641 28,742 32,993 70,30952 2,294,700 132,044
6,7861,894 8,478,150Cavendish 0.3641 1.4131 1.4004 39,540 33,652 118,72875 2,381,400 191,920
6,4212,893 5,922,400Charleston 0.6886 1.3101 1.6273 53,897 24,953 96,37572 1,904,700 175,225
7,1145,226 27,982,585Charlotte 0.1431 1.5145 1.4609 68,455 300,693 408,798170 19,854,253 777,946
10,2686,246 12,101,719Chelsea 0.5343 1.5825 1.5382 99,094 101,990 186,149177 6,444,846 387,233
12,8554,543 16,049,695Chester 0.6847 1.3228 1.3823 152,120 81,582 221,855178 6,167,375 455,557
6,7881,496 3,266,100Chittenden 0.4966 1.4794 1.6349 21,779 16,562 53,39748 1,119,500 91,738
3,7122,958 4,183,556Clarendon 0.3875 1.4523 1.3870 26,739 39,456 58,02663 2,716,820 124,221
1,4091,021 4,846,884Colchester 0.5405 1.4386 1.5589 32,234 16,067 75,55833 1,116,873 123,859
16,2151,593 12,328,000Concord 0.6097 1.6577 1.4812 83,314 22,158 182,60262 1,336,700 288,074
10,4545,602 10,592,800Corinth 0.6103 1.2810 1.3960 99,048 72,205 147,875162 5,636,600 319,128
5,3082,196 8,167,966Cornwall 0.4659 1.6337 1.4067 51,708 47,877 114,89979 2,930,600 214,484
3,361768 4,658,463Coventry 0.0000 1.3405 1.4316 0 6,686 66,69129 498,800 73,377
8,9415,324 11,702,818Craftsbury 0.6390 1.6936 1.4668 105,105 78,023 171,657138 4,606,934 354,785
12,2412,123 10,567,769Danby 0.4100 1.4803 1.3631 53,369 34,984 144,04958 2,363,275 232,402
8,4078,179 12,490,378Danville 0.4801 1.4244 1.4753 103,389 126,240 184,271162 8,862,700 413,900
4,3303,005 7,772,000Derby 0.3745 1.3175 1.4962 40,108 38,703 116,28563 2,937,640 195,096
6,9391,035 10,824,645Dorset 0.1920 1.5309 1.4530 26,352 44,403 157,28265 2,900,480 228,037
2,877824 5,979,210Dover 0.4107 1.5011 1.4730 30,015 19,951 88,07441 1,329,110 138,040
5,3183,907 12,317,500Dummerston 0.2899 1.7382 1.4886 62,759 162,192 183,358113 9,331,050 408,309
8,6111,002 7,642,000Duxbury 0.7011 1.6641 1.5194 61,964 18,049 116,11363 1,084,600 196,126
19,753114 8,032,000East Haven 0.6708 1.0911 1.4459 54,339 750 116,13515 68,700 171,224
4,6664,718 9,075,786East Montpelier 0.5792 1.9757 1.6312 97,308 152,617 148,044103 7,724,685 397,969
18,5501,734 9,773,635Eden 0.5110 1.5887 1.4842 55,415 17,010 145,06053 1,070,700 217,485
12,4882,975 8,664,600Elmore 0.3600 1.6837 1.4831 46,244 70,395 128,50574 4,181,000 245,144
10,9725,535 12,775,600Enosburgh 0.2695 1.1861 1.5061 44,842 45,821 192,413113 3,863,200 283,076
4190 501,400Essex Jct. 0.4643 1.5644 1.5309 2,328 0 7,6761 0 10,004
1,2171,665 1,854,600Essex Town 0.4861 1.5537 1.5271 20,372 36,299 28,32244 2,336,300 84,993
1,283841 917,100Fair Haven 0.8898 1.1759 1.3157 10,231 2,736 12,06614 232,700 25,033
3,4358,716 7,062,192Fairfax 0.4838 1.3335 1.5985 66,012 87,775 112,88999 6,582,292 266,676
15,03814,163 22,752,525Fairfield 0.5743 1.5588 1.6213 180,880 136,290 368,887184 8,743,246 686,057
4,9471,668 8,584,400Fairlee 0.4866 1.7478 1.5212 61,022 69,143 130,58655 3,956,000 260,751
25
School Taxes Saved
Mun. Tax Rate
Total Parcels Homestead
Total Program Acres Ed. HS
Tax Town Name
Current Use Appraisal Program Participant Tax Savings - Tax Year 2015
Ed. NR Tax Rate
Total Mun Taxes Saved
Total HS Taxes Saved
Total NR Taxes Saved
Total Taxes Saved
School Tax Rate
Nonres
Total Exempt Reduction
Homestead Nonres
10,1001,384 14,849,900Fayston 0.2400 1.5971 1.4668 44,302 57,643 217,81869 3,609,200 319,763
15,1390 3,633,200Ferdinand 0.0750 0.9726 1.5080 2,725 0 54,7897 0 57,514
6,9847,693 21,688,000Ferrisburgh 0.2669 1.6327 1.4946 91,764 197,847 324,149115 12,117,800 613,760
11,0635,238 13,836,950Fletcher 0.6258 1.4903 1.6377 109,993 54,582 226,608120 3,662,502 391,183
3,0638,314 8,323,920Franklin 0.2787 1.2238 1.4709 36,588 58,794 122,43774 4,804,254 217,819
4,8555,544 8,522,040Georgia 0.2765 1.2793 1.4562 40,190 76,929 124,09879 6,013,380 241,217
7,2076,094 8,869,400Glover 0.5099 1.4457 1.4777 78,087 93,172 131,06398 6,444,800 302,322
2,198251 1,914,100Goshen 0.8545 1.1982 1.4097 18,267 2,679 26,98319 223,600 47,929
11,9032,028 15,835,960Grafton 0.5867 1.3340 1.3966 108,800 36,132 221,16594 2,708,520 366,097
20,732178 4,440,242Granby 0.4384 1.0012 1.4668 19,902 996 65,12930 99,500 86,027
2,3041,217 10,448,200Grand Isle 0.2758 1.5959 1.5000 40,920 70,041 156,72346 4,388,800 267,684
7,454661 3,468,378Granville 0.5817 1.2839 1.5466 31,842 6,581 53,64244 512,600 92,065
11,3554,546 14,626,900Greensboro 0.5658 1.6833 1.5333 118,041 99,401 224,274142 5,905,100 441,716
8,614888 6,642,000Groton 0.5410 1.5663 1.4753 40,853 14,242 97,98949 909,300 153,084
12,3562,363 5,570,544Guildhall 0.7626 1.1986 1.4593 55,055 19,763 81,29184 1,648,825 156,109
7,1085,244 8,293,406Guilford 0.7256 1.8175 1.6472 103,717 109,060 136,609131 6,000,544 349,386
10,2772,914 10,892,563Halifax 0.7979 1.3600 1.4737 115,486 46,110 160,524101 3,390,444 322,120
1,57167 983,977Hancock 0.9100 1.6896 1.3908 9,467 953 13,68516 56,400 24,105
6,9485,421 5,774,800Hardwick 1.2221 1.7807 1.7333 108,201 54,826 100,095111 3,078,900 263,122
2,5373,006 4,956,400Hartford 0.9111 1.5062 1.4842 77,805 53,972 73,56363 3,583,300 205,340
9,0274,969 30,035,201Hartland 0.4390 1.6024 1.4214 197,407 239,275 426,920161 14,932,298 863,602
6,3436,789 14,715,600Highgate 0.2353 1.2395 1.3630 47,020 65,291 200,57488 5,267,500 312,885
5,2303,627 7,234,434Hinesburg 0.5165 1.6370 1.6678 69,724 102,555 120,65694 6,264,812 292,935
5,6694,403 8,874,391Holland 0.9297 1.4480 1.5996 112,143 46,160 141,95574 3,187,842 300,258
5,2381,741 3,924,424Hubbardton 0.7700 1.4188 1.4681 39,737 17,540 57,61444 1,236,222 114,891
6,1264,242 10,556,300Huntington 0.5966 1.4446 1.5321 104,220 99,860 161,73393 6,912,650 365,813
5,7214,175 10,090,400Hyde Park 0.6693 1.4216 1.4429 102,878 75,069 145,594106 5,280,600 323,541
6,0171,431 4,008,700Ira 0.5007 1.0893 1.5287 24,211 9,005 61,28144 826,700 94,497
7,6373,551 6,866,710Irasburg 0.5384 1.2515 1.5275 43,956 14,511 104,88952 1,159,524 163,356
604414 3,052,757Isle LaMotte 0.3154 1.6749 1.5797 10,642 5,382 48,22416 321,348 64,248
7,7291,911 4,601,700Jamaica 0.3239 1.4339 1.3647 18,049 13,137 62,79953 916,175 93,985
5,733500 4,486,200Jay 0.2624 1.5446 1.6228 13,065 7,613 72,80218 492,900 93,480
2,0871,387 3,117,500Jericho 0.4668 1.4838 1.5546 30,488 41,126 48,46546 2,771,700 120,079
7,9755,619 6,765,800Johnson 0.7152 1.3926 1.4410 82,735 66,877 97,495121 4,802,300 247,107
6,0945 5,836,252Killington 0.4633 1.7364 1.5052 27,079 148 87,84719 8,500 115,074
6,1242,707 4,407,500Kirby 0.4292 1.4105 1.4717 28,069 30,076 64,86562 2,132,300 123,010
2,045324 16,438,500Landgrove 0.2210 1.6311 1.5306 42,665 46,760 251,60838 2,866,800 341,033

26
School Taxes Saved
Mun. Tax Rate
Total Parcels Homestead
Total Program Acres Ed. HS
Tax Town Name
Current Use Appraisal Program Participant Tax Savings - Tax Year 2015
Ed. NR Tax Rate
Total Mun Taxes Saved
Total HS Taxes Saved
Total NR Taxes Saved
Total Taxes Saved
School Tax Rate
Nonres
Total Exempt Reduction
Homestead Nonres
1,1002,144 1,326,694Leicester 0.2636 1.3964 1.4002 9,474 28,926 18,57633 2,071,444 56,976
11,669113 2,293,527Lemington 0.3262 1.5004 1.4744 7,679 911 33,81612 60,700 42,406
6,6730 943,400Lewis 0.0750 0.9726 1.5080 708 0 14,2261 0 14,934
7,1682,686 11,801,800Lincoln 0.6418 1.5346 1.4857 107,624 74,463 175,339112 4,852,300 357,426
6,9041,237 15,425,300Londonderry 0.2840 1.6390 1.5736 60,822 95,549 242,73378 5,829,700 399,104
12,532918 6,451,400Lowell 0.0111 1.2307 1.4798 805 7,473 95,46868 607,200 103,746
2,6421,064 3,907,900Ludlow 0.2859 1.7347 1.5333 15,317 25,143 59,92038 1,449,400 100,380
10,1352,777 6,991,700Lunenburg 0.4558 1.3619 1.4936 40,597 24,918 104,42891 1,829,650 169,943
3,3593,727 4,006,400Lyndon 0.3013 1.4205 1.4990 24,954 60,170 60,05688 4,235,800 145,180
7,8141,446 4,095,608Maidstone 0.2313 1.0056 1.4472 11,346 8,141 59,27244 809,600 78,759
7,621810 24,373,695Manchester 0.2350 1.4700 1.4812 73,523 89,591 361,02354 6,094,600 524,137
9,3603,089 9,088,200Marlboro 0.3600 1.7320 1.5815 43,527 52,003 143,73096 3,002,500 239,260
9,0984,886 6,866,241Marshfield 0.6567 1.7149 1.6900 74,354 76,418 116,03996 4,456,101 266,811
2,21326 1,993,800Mendon 0.5243 1.3045 1.4844 10,528 187 29,59617 14,300 40,311
7,5722,531 9,487,900Middlebury 0.9803 1.8431 1.6780 118,510 47,945 159,20794 2,601,300 325,662
6,2783,597 6,844,600Middlesex 0.4379 1.7572 1.5761 52,099 88,787 107,87888 5,052,766 248,764
4,7132,240 4,561,202Middletown Springs 0.7230 1.7615 1.4946 47,714 35,905 68,17264 2,038,300 151,791
3,7814,645 6,352,400Milton 0.5188 1.4013 1.4575 55,920 62,026 92,58662 4,426,337 210,532
6,1376,403 7,056,308Monkton 0.4692 1.9064 1.7926 66,263 134,712 126,49196 7,066,321 327,466
14,3664,170 10,189,609Montgomery 0.4160 1.1997 1.5242 60,891 53,360 155,31077 4,447,765 269,561
725449 1,986,300Montpelier 1.0028 1.6026 1.5813 28,319 13,425 31,40913 837,700 73,153
12,0693,302 10,254,145Moretown 0.3798 1.7281 1.4801 54,797 65,695 151,772115 3,801,566 272,264
6,0592,795 4,674,100Morgan 0.3243 1.4173 1.5347 19,657 19,662 71,73345 1,387,300 111,052
7,2015,501 19,094,201Morristown 0.8080 1.3667 1.4605 267,337 191,229 278,871133 13,992,015 737,437
7,6392,476 7,964,650Mount Holly 0.3689 1.5563 1.3417 42,894 57,004 106,86282 3,662,780 206,760
3540 333,300Mount Tabor 0.1000 1.1015 1.4340 333 0 4,7802 0 5,113
8,5247,692 17,335,850New Haven 0.3750 1.5986 1.5210 103,182 162,726 263,678143 10,179,300 529,586
7,5042,880 8,034,200Newark 0.4617 1.4724 1.3922 51,058 44,534 111,85268 3,024,600 207,444
11,9106,452 15,345,500Newbury 0.2250 1.3877 1.4300 53,291 115,729 219,441180 8,339,600 388,461
9,2952,504 11,329,800Newfane 0.4416 1.5595 1.4983 61,903 41,921 169,75487 2,688,100 273,578
1910 1,228,000Newport City 1.2867 1.6127 1.8025 15,801 0 22,1352 0 37,936
6,1654,152 6,487,864Newport Town 0.4644 1.3412 1.3818 45,163 43,416 89,64968 3,237,100 178,228
1,2321,123 3,428,492North Hero 0.2657 1.5489 1.5635 13,314 24,509 53,60428 1,582,377 91,427
10,6994,936 8,825,760Northfield 0.8421 1.4523 1.5313 114,333 67,275 135,149148 4,632,300 316,757
11,8400 2,050,200Norton 0.3650 1.4176 1.6403 9,340 0 33,62912 0 42,969
7,3776,153 20,666,600Norwich 0.5202 1.8468 1.5692 183,095 268,347 324,300145 14,530,400 775,742
9,3052,553 8,969,299Orange 0.4580 1.2813 1.4692 55,441 31,306 131,77756 2,443,268 218,524

27
School Taxes Saved
Mun. Tax Rate
Total Parcels Homestead
Total Program Acres Ed. HS
Tax Town Name
Current Use Appraisal Program Participant Tax Savings - Tax Year 2015
Ed. NR Tax Rate
Total Mun Taxes Saved
Total HS Taxes Saved
Total NR Taxes Saved
Total Taxes Saved
School Tax Rate
Nonres
Total Exempt Reduction
Homestead Nonres
2150 177,800Orleans ID 0.2343 1.3959 1.4913 417 0 2,6523 0 3,069
6,14310,951 10,356,700Orwell 0.4419 1.3436 1.4778 80,620 103,127 153,051107 7,675,400 336,798
4,3421,878 8,697,900Panton 0.5549 1.5518 1.4998 57,951 27,088 130,45142 1,745,600 215,490
11,3165,707 19,125,491Pawlet 0.4059 1.2148 1.3150 106,216 85,554 251,500124 7,042,652 443,270
8,1346,898 13,339,231Peacham 0.3728 1.6427 1.4821 88,522 170,937 197,701147 10,405,862 457,160
1,551609 6,041,500Peru 0.2364 1.5828 1.4852 18,462 27,987 89,72832 1,768,200 136,177
980480 1,428,220Pittsfield 0.5000 1.6746 1.3142 10,155 10,093 18,77024 602,713 39,018
6,6713,273 3,735,800Pittsford 0.4711 1.4867 1.3956 28,052 32,985 52,13777 2,218,700 113,174
3,4492,063 5,292,900Plainfield 0.6766 1.5977 1.5745 64,562 67,889 83,33761 4,249,200 215,788
6,877880 6,859,061Plymouth 0.4100 1.7155 1.5286 31,821 15,478 104,84849 902,260 152,147
12,2284,685 51,615,437Pomfret 0.3767 1.3642 1.4427 271,228 243,141 744,656164 17,823,005 1,259,025
6,7002,553 4,814,006Poultney 0.3125 1.5564 1.5689 20,665 27,995 75,52762 1,798,730 124,187
5,4324,128 4,933,200Pownal 0.4280 1.3937 1.4459 32,800 38,052 71,32974 2,730,300 142,181
1,6140 960,000Proctor 0.8666 1.4083 1.3820 8,319 0 13,26713 0 21,586
2,7434,107 8,562,900Putney 0.6310 1.7889 1.5413 104,348 127,312 131,98084 7,116,800 363,640
6,3988,273 12,171,400Randolph 0.7311 1.3303 1.4222 179,204 159,339 173,102181 11,977,700 511,645
11,0902,109 24,458,685Reading 0.4571 1.7814 1.5387 148,823 144,283 376,34694 8,099,392 669,452
2,4201,077 2,731,416Readsboro 0.9429 1.0287 1.3485 37,965 13,322 36,83340 1,294,992 88,120
10,9874,197 7,002,910Richford 0.8295 1.0804 1.3491 83,560 33,175 94,47685 3,070,590 211,211
5,8373,869 6,721,129Richmond 0.6554 1.4761 1.5466 72,425 61,304 103,94990 4,153,100 237,678
1,665881 2,892,600Ripton 0.4982 1.8507 1.5538 27,214 30,189 44,94536 1,631,200 102,348
11,6792,079 7,976,238Rochester 0.5110 1.3475 1.3958 50,938 26,844 111,33294 1,992,125 189,114
8,1744,295 8,890,800Rockingham 0.9433 1.5818 1.4591 121,353 62,859 129,726112 3,973,900 313,938
8,8641,781 3,294,400Roxbury 0.8685 1.4416 1.4734 35,792 11,326 48,54095 785,674 95,658
5,5614,068 5,559,436Royalton 0.6440 1.4008 1.4171 57,448 43,621 78,78393 3,114,034 179,852
11,8034,899 17,860,551Rupert 0.3588 1.2835 1.4896 91,057 96,491 266,05189 7,517,785 453,599
2970 1,181,400Rutland City 1.5300 1.5683 1.6189 18,075 0 19,1263 0 37,201
2,0001,629 4,035,900Rutland Town 0.1613 1.3747 1.5303 8,802 19,534 61,76136 1,421,000 90,097
4,4974,974 5,147,529Ryegate 0.5664 1.5582 1.4676 42,854 37,686 75,54581 2,418,583 156,085
6,3331,437 15,201,200Salisbury 0.2876 1.7872 1.5532 49,630 36,736 236,10546 2,055,500 322,471
16,5351,374 10,316,534Sandgate 0.4795 1.4013 1.4298 54,594 14,089 147,50657 1,005,440 216,189
52938 362,700Searsburg 0.5339 1.3197 1.5070 2,296 888 5,4663 67,300 8,650
4,9782,631 5,396,620Shaftsbury 0.3854 1.2443 1.4208 36,352 50,216 76,67560 4,035,700 163,243
600 161,500Shaftsbury ID 0.3854 1.5047 1.4420 622 0 2,3291 0 2,951
10,6773,285 9,703,200Sharon 0.6758 1.4157 1.4184 90,665 52,562 137,630119 3,712,800 280,857
5,9472,011 2,714,929Sheffield 0.2337 1.6091 1.4629 9,640 22,688 39,71746 1,410,000 72,045
1,6722,085 13,575,878Shelburne 0.3602 1.4916 1.5577 118,526 282,256 211,47146 18,923,060 612,253

28
School Taxes Saved
Mun. Tax Rate
Total Parcels Homestead
Total Program Acres Ed. HS
Tax Town Name
Current Use Appraisal Program Participant Tax Savings - Tax Year 2015
Ed. NR Tax Rate
Total Mun Taxes Saved
Total HS Taxes Saved
Total NR Taxes Saved
Total Taxes Saved
School Tax Rate
Nonres
Total Exempt Reduction
Homestead Nonres
6,2167,437 16,342,242Sheldon 0.4150 1.2455 1.4838 93,121 75,934 242,48684 6,096,657 411,541
12,0657,820 15,000,488Shoreham 0.5340 1.7187 1.4748 106,061 83,549 221,227123 4,861,198 410,837
8,4883,585 8,354,100Shrewsbury 0.4428 1.3150 1.4827 53,773 48,577 123,86697 3,694,100 226,216
407308 2,163,000South Burlington 0.4560 1.6202 1.5923 12,881 10,722 34,4418 661,800 58,044
2,3371,398 15,062,467South Hero 0.2930 1.5159 1.5194 65,387 109,961 228,85945 7,253,850 404,207
6,4876,193 5,929,420Springfield 1.4070 1.5495 1.3972 155,343 78,797 82,846141 5,085,288 316,986
6,8944,007 18,910,143St. Albans Town 0.3624 1.4238 1.4845 94,199 100,847 280,72188 7,082,976 475,767
481364 528,300St. George 0.2979 1.7441 1.5508 2,825 7,327 8,1938 420,100 18,345
4,1463,099 5,023,912St. Johnsbury 1.1364 1.1718 1.4131 90,921 34,720 70,99382 2,962,923 196,634
2,897199 1,160,800Stamford 0.6297 1.1819 1.4688 7,947 1,196 17,05018 101,200 26,193
1,912529 1,611,300Stannard 0.8500 1.7807 1.5729 18,594 8,387 25,34425 471,000 52,325
10,7445,211 9,017,200Starksboro 0.4558 1.7192 1.6285 60,021 67,724 146,845131 3,939,250 274,590
14,6651,033 7,800,218Stockbridge 0.5354 1.5788 1.5370 45,770 8,225 119,88972 520,950 173,884
10,9101,846 65,865,000Stowe 0.4040 1.4980 1.5356 326,705 224,739 1,011,423121 15,002,600 1,562,867
9,4246,446 11,129,800Strafford 0.6823 1.4947 1.4284 119,825 85,811 158,978164 5,741,000 364,614
2,568182 3,416,000Stratton 0.1403 1.5578 1.5565 5,262 5,216 53,17017 334,800 63,648
4,9191,670 4,503,867Sudbury 0.2947 1.3843 1.2848 18,263 23,038 57,86648 1,664,247 99,167
1,717115 9,316,030Sunderland 0.3247 1.2273 1.3356 33,350 7,120 124,42527 580,100 164,895
3,7892,900 5,574,300Sutton 0.6703 1.2855 1.3644 66,887 32,117 76,05652 2,498,372 175,060
7,6535,404 13,087,200Swanton 0.0396 1.2467 1.3988 7,147 61,848 183,06491 4,960,900 252,059
7,8164,809 13,699,626Thetford 0.5645 1.9109 1.5387 119,111 139,113 210,796156 7,279,989 469,020
6,3152,975 7,549,100Tinmouth 0.5101 1.3362 1.3018 51,519 33,066 98,27470 2,474,600 182,859
11,9362,468 8,956,017Topsham 0.6939 1.2909 1.4067 76,772 27,210 125,984117 2,107,829 229,966
10,6471,689 9,861,996Townshend 0.5020 1.6541 1.4615 59,064 31,491 144,13391 1,903,800 234,688
6,6751,356 8,445,300Troy 0.1823 1.3215 1.5348 17,529 15,462 129,61862 1,170,000 162,609
9,5917,706 17,235,247Tunbridge 0.6796 1.4225 1.3711 203,553 180,895 236,312196 12,716,663 620,760
4,4343,609 6,239,900Underhill 0.5031 1.4391 1.5077 56,562 71,994 94,07990 5,002,700 222,635
480 192,100Vergennes 0.7500 1.5084 1.4699 1,441 0 2,8242 0 4,265
3,150965 6,717,800Vernon 0.4059 1.1618 1.0354 35,616 20,761 69,55639 1,787,000 125,933
10,9824,290 8,944,800Vershire 0.7897 1.7804 1.5496 98,198 62,136 138,609122 3,490,000 298,943
3,294305 1,547,600Victory 0.3481 1.5973 1.5071 6,186 3,664 23,32412 229,400 33,174
5,6681,703 16,262,500Waitsfield 0.3442 1.5419 1.4292 78,835 102,402 232,42472 6,641,300 413,661
3,6424,671 3,898,200Walden 0.6577 1.2584 1.5668 53,137 52,614 61,07777 4,181,000 166,828
3,9912,180 5,400,035Wallingford 0.2948 1.4290 1.3932 25,705 47,436 75,23368 3,319,500 148,374
1,0331,664 1,627,700Waltham 0.3800 1.6575 1.6080 8,793 11,375 26,17324 686,277 46,341
3,7111,208 3,850,570Wardsboro 0.4829 1.4827 1.4760 25,277 20,519 56,83439 1,383,900 102,630
1,6070 410,500Warners Grant 0.0750 0.9726 1.5080 308 0 6,1901 0 6,498

29
School Taxes Saved
Mun. Tax Rate
Total Parcels Homestead
Total Program Acres Ed. HS
Tax Town Name
Current Use Appraisal Program Participant Tax Savings - Tax Year 2015
Ed. NR Tax Rate
Total Mun Taxes Saved
Total HS Taxes Saved
Total NR Taxes Saved
Total Taxes Saved
School Tax Rate
Nonres
Total Exempt Reduction
Homestead Nonres
5,6501,532 15,680,737Warren 0.4200 1.5240 1.5040 82,153 59,124 235,83882 3,879,500 377,115
5,2110 2,039,400Warren Gore 0.0750 0.9726 1.5080 1,530 0 30,7543 0 32,284
8,6375,133 8,644,950Washington 0.4600 1.2366 1.3420 64,726 67,097 116,015119 5,425,900 247,838
3,7072,822 11,196,600Waterbury 0.4050 1.6641 1.5416 79,196 139,085 172,60770 8,358,000 390,888
4,5881,570 3,873,394Waterford 0.4008 1.6059 1.5649 18,645 12,501 60,61544 778,453 91,761
2,3313,432 1,931,400Waterville 0.5086 1.7725 1.6846 22,992 45,895 32,53653 2,589,300 101,423
4,8184,532 6,804,500Weathersfield 0.5963 1.6343 1.5316 71,648 85,163 104,218103 5,211,000 261,029
1,1991,003 1,057,000Wells 0.4034 1.3473 1.4597 7,773 11,721 15,42926 869,990 34,923
20744 331,700Wells River 0.7500 1.5478 1.4579 2,912 875 4,8363 56,500 8,623
6,4822,480 3,822,100West Fairlee 0.8082 1.7572 1.5293 46,054 32,970 58,45173 1,876,300 137,475
9,3481,997 6,725,200West Haven 0.8579 1.5154 1.5074 66,340 15,269 101,37638 1,007,600 182,985
2,823664 1,015,125West Rutland 0.7036 1.3832 1.4582 8,868 3,393 14,80325 245,300 27,064
3,5592,793 9,888,305West Windsor 0.4100 1.6489 1.4774 71,314 123,755 146,09086 7,505,300 341,159
9,9011,791 4,470,900Westfield 0.4728 1.5149 1.5471 28,815 24,597 69,16936 1,623,700 122,581
7,5904,986 7,166,900Westford 0.6387 1.5266 1.5113 78,291 73,011 108,313115 4,782,600 259,615
8,3544,156 10,713,525Westminster 0.5994 1.6551 1.5486 94,044 82,361 165,910133 4,976,200 342,315
5,6175,163 5,536,300Westmore 0.4309 1.2776 1.4389 40,069 48,071 79,66233 3,762,600 167,802
5,0941,056 11,438,445Weston 0.4780 1.6470 1.6502 75,067 70,260 188,75768 4,265,929 334,084
5,2481,467 8,517,634Weybridge 0.4440 2.0581 1.5679 47,761 46,087 133,54849 2,239,276 227,396
10,746745 7,247,800Wheelock 0.5034 1.5369 1.3972 38,616 6,504 101,26674 423,200 146,386
3,9062,045 4,911,374Whiting 0.5322 1.4836 1.5067 33,740 21,190 74,00050 1,428,264 128,930
3,0761,705 5,289,000Whitingham 0.6200 1.7219 1.4245 47,550 40,988 75,34255 2,380,400 163,880
5,2464,213 5,342,000Williamstown 0.6122 1.5567 1.7220 48,174 39,337 91,98998 2,526,940 179,500
1,6362,283 4,464,132Williston 0.2794 1.5541 1.6361 24,201 65,237 73,03839 4,197,766 162,476
2,5771,634 4,656,950Wilmington 0.5015 1.7573 1.4877 38,877 54,390 69,28142 3,095,105 162,548
9,2041,322 6,136,050Windham 0.7130 1.5828 1.4736 52,669 19,799 90,42144 1,250,900 162,889
1,4541,858 1,889,222Windsor 1.2522 1.3235 1.4136 62,494 41,049 26,70640 3,101,525 130,249
1,650372 4,687,400Winhall 0.3827 1.7289 1.6112 20,193 10,183 75,52325 589,000 105,899
7,2154,517 7,583,332Wolcott 0.6543 1.4717 1.4976 79,735 67,741 113,568115 4,602,938 261,044
11,3842,167 5,510,700Woodbury 0.3880 1.6954 1.5116 28,475 30,995 83,30074 1,828,200 142,770
26133 219,000Woodford 0.1310 1.1193 1.3900 359 613 3,0443 54,800 4,016
12,6193,676 53,396,450Woodstock 0.3499 1.7294 1.5679 235,439 240,231 837,203185 13,891,000 1,312,873
7,6293,332 4,942,343Worcester 0.5615 1.5450 1.4851 48,532 57,179 73,39981 3,700,876 179,110

30
School Taxes Saved
Mun. Tax Rate
Total Parcels Homestead
Total Program Acres Ed. HS
Tax Town Name
Current Use Appraisal Program Participant Tax Savings - Tax Year 2015
Ed. NR Tax Rate
Total Mun Taxes Saved
Total HS Taxes Saved
Total NR Taxes Saved
Total Taxes Saved
School Tax Rate
Nonres
Total Exempt Reduction
Homestead Nonres
Program Acreage School Taxes SavedExempt Reduction
STATE TOTALS
18,154 2,426,418 $2,988,471,597 $14,519,248
$13,573,807 $31,035,416
$59,128,471
Total No. Parcels
Total Acreage
Total Reduction Amount
Total Mun Tax Saved
Total State Ed Tax Saved
Total Taxes Saved
1,677,631726,733Homestead Nonresidential
Homestead and
Nonresidential Totals $2,077,674,977$891,898,355Homestead Nonresidential Homestead Nonresidential
$44,609,223
31
equalization Study Based on 2015 Grand lists
PVR conducts an annual study of all the municipal grand lists, commonly called the Equalization Study. The primary purpose of the Equalization Study is to assess how close to fair market value are the grand lists used to raise education property taxes. The reference to “equalization” stems from the fact that most municipalities’ grand lists are not at 100% of fair market value in any given year. If the grand lists were always at 100% of fair market value, there would be no reason for the state to estimate market values and determine common levels of appraisal (CLAs).
PVR has been performing equalization studies since its creation in 1978. Prior to the creation of PVR, the property tax division of the Department of Taxes began conducting equalization studies on a voluntary basis in 1957. In June 1963, the Vermont legislature passed and the governor signed Act 137 of 1963. This became known as “Equalization.” That statute directed the commissioner of taxes to begin establishing the fair market value of all taxable property in each town on an annual basis.
The results of the study have long served as a key factor in the distribution of aid to education. With the passage of Acts 60 (1997) and 68 (2003), the results of the study are even more essential. The education CLA shown in the following tables will be used as one factor in the calculation of actual education tax rates to be used during the 2016 tax year.
For towns that have active tax incremental finance (TIF) districts, the education grand list figure used in the determination of the CLAs includes the value of the “increment.” However, the education Grand list figure reported to the Agency of Education for those municipalities to determine the education tax liability will not include the value of the “increment.”
The Unified Towns and Gores of Essex County (UTGs) are now treated as a single assessment district for the calculation of equalization results (Act 73 of 2013, Section 39). Grand list valuations for the six towns and gores as well as the sales data were combined as part of the process of calculating a single CLA, coefficient of dispersion, and equalized education grand list value for all of the UTGs.
In 2014, the parameters of the study were revised to require a minimum sample size of five before a ratio is used for equalization purposes. Previously, the minimum sample size was three. Although the smaller sample produced reliable results in prior years, the Department and the Vermont Assessors and Listers Association collaborated in assessing the value of using an increased sample size. The conclusion was that the increased sample size would enhance public confidence in the results of the study, although the increase made no difference in the statistical reliability of the study.
The study methodology is covered in first section of this report, “Property Tax Administration for 2015 Tax Year,” and is also described in detail in the document titled “Introduction to Vermont’s Equalization Study,” available at http://tax.vermont.gov/content/introduction-equalization-study.
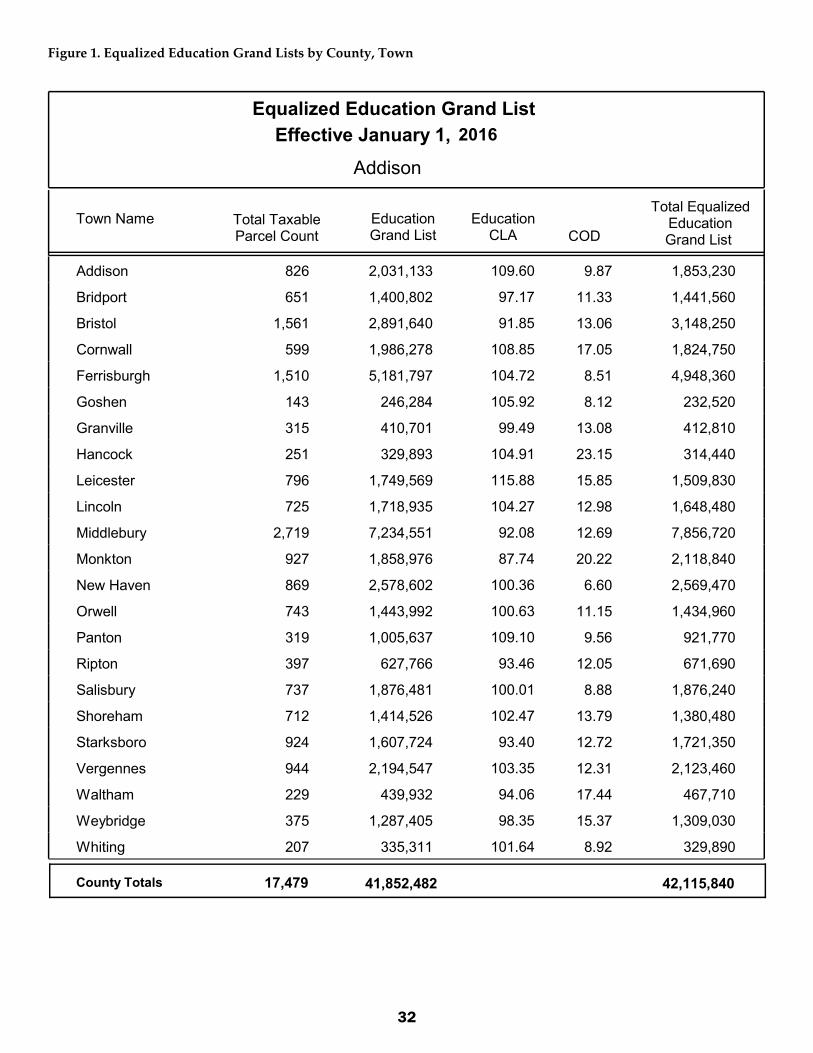
32
Figure 1. Equalized Education Grand Lists by County, Town
2016Equalized Education Grand List
Addison
Effective January 1,
Town Name Education CLA
Total Equalized Education Grand List
Education Grand List COD
Total Taxable Parcel Count
Addison 2,031,133 109.60 9.87 1,853,230826
Bridport 1,400,802 97.17 11.33 1,441,560651
Bristol 2,891,640 91.85 13.06 3,148,2501,561
Cornwall 1,986,278 108.85 17.05 1,824,750599
Ferrisburgh 5,181,797 104.72 8.51 4,948,3601,510
Goshen 246,284 105.92 8.12 232,520143
Granville 410,701 99.49 13.08 412,810315
Hancock 329,893 104.91 23.15 314,440251
Leicester 1,749,569 115.88 15.85 1,509,830796
Lincoln 1,718,935 104.27 12.98 1,648,480725
Middlebury 7,234,551 92.08 12.69 7,856,7202,719
Monkton 1,858,976 87.74 20.22 2,118,840927
New Haven 2,578,602 100.36 6.60 2,569,470869
Orwell 1,443,992 100.63 11.15 1,434,960743
Panton 1,005,637 109.10 9.56 921,770319
Ripton 627,766 93.46 12.05 671,690397
Salisbury 1,876,481 100.01 8.88 1,876,240737
Shoreham 1,414,526 102.47 13.79 1,380,480712
Starksboro 1,607,724 93.40 12.72 1,721,350924
Vergennes 2,194,547 103.35 12.31 2,123,460944
Waltham 439,932 94.06 17.44 467,710229
Weybridge 1,287,405 98.35 15.37 1,309,030375
Whiting 335,311 101.64 8.92 329,890207
County Totals 41,852,482 42,115,84017,479
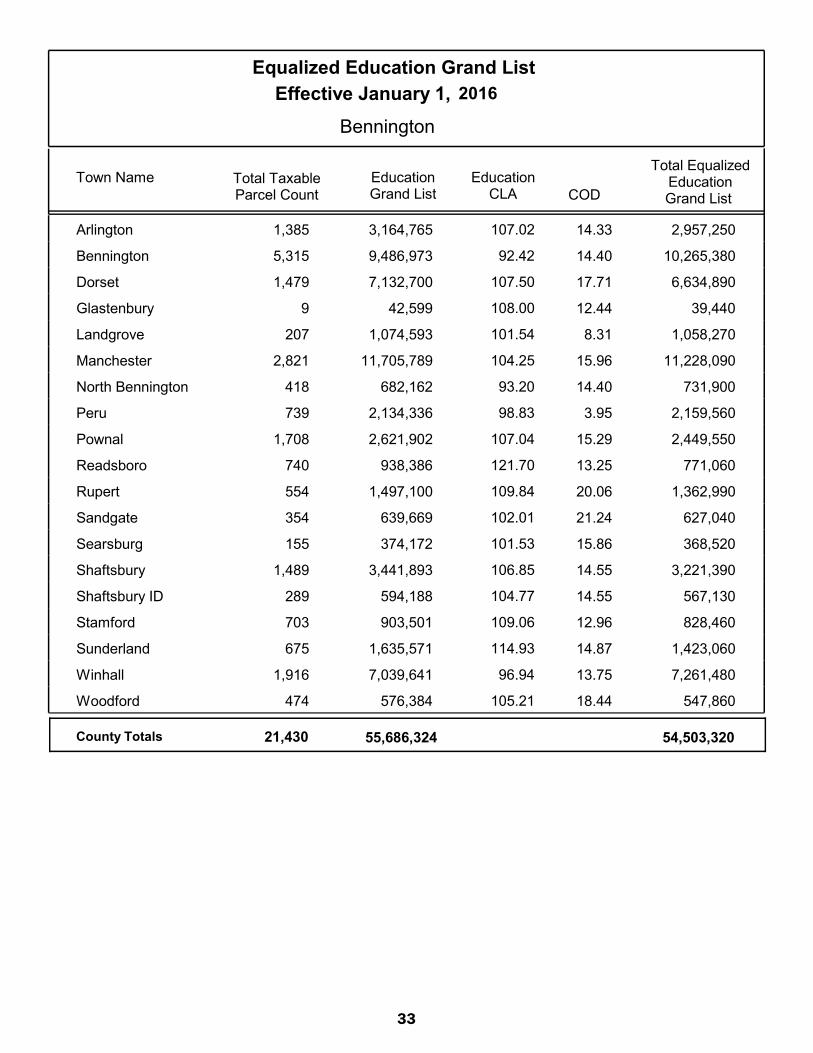
33
2016Equalized Education Grand List
Bennington
Effective January 1,
Town Name Education CLA
Total Equalized Education Grand List
Education Grand List COD
Total Taxable Parcel Count
Arlington 3,164,765 107.02 14.33 2,957,2501,385
Bennington 9,486,973 92.42 14.40 10,265,3805,315
Dorset 7,132,700 107.50 17.71 6,634,8901,479
Glastenbury 42,599 108.00 12.44 39,4409
Landgrove 1,074,593 101.54 8.31 1,058,270207
Manchester 11,705,789 104.25 15.96 11,228,0902,821
North Bennington 682,162 93.20 14.40 731,900418
Peru 2,134,336 98.83 3.95 2,159,560739
Pownal 2,621,902 107.04 15.29 2,449,5501,708
Readsboro 938,386 121.70 13.25 771,060740
Rupert 1,497,100 109.84 20.06 1,362,990554
Sandgate 639,669 102.01 21.24 627,040354
Searsburg 374,172 101.53 15.86 368,520155
Shaftsbury 3,441,893 106.85 14.55 3,221,3901,489
Shaftsbury ID 594,188 104.77 14.55 567,130289
Stamford 903,501 109.06 12.96 828,460703
Sunderland 1,635,571 114.93 14.87 1,423,060675
Winhall 7,039,641 96.94 13.75 7,261,4801,916
Woodford 576,384 105.21 18.44 547,860474
County Totals 55,686,324 54,503,32021,430

34
2016Equalized Education Grand List
Caledonia
Effective January 1,
Town Name Education CLA
Total Equalized Education Grand List
Education Grand List COD
Total Taxable Parcel Count
Barnet 2,474,633 105.52 18.38 2,345,1001,116
Burke 2,555,797 101.12 10.64 2,527,5601,222
Danville 2,916,913 102.88 16.73 2,835,2601,527
Groton 1,189,384 108.96 18.73 1,091,610757
Hardwick 1,674,723 89.41 16.39 1,873,0801,472
Kirby 576,394 98.51 18.67 585,110347
Lyndon 3,619,012 101.28 15.60 3,573,3302,236
Newark 930,330 106.88 15.78 870,430705
Peacham 1,382,715 112.77 29.79 1,226,180669
Ryegate 1,288,991 104.25 8.88 1,236,490741
Sheffield 570,642 102.01 16.01 559,400514
St. Johnsbury 5,551,179 106.12 16.45 5,231,1402,892
Stannard 181,501 94.79 11.57 191,470172
Sutton 1,011,345 111.79 14.19 904,650591
Walden 916,795 96.82 13.27 946,890722
Waterford 1,768,471 102.73 15.61 1,721,500786
Wheelock 613,291 108.88 16.92 563,270568
County Totals 29,222,116 28,282,47017,037

35
2016Equalized Education Grand List
Chittenden
Effective January 1,
Town Name Education CLA
Total Equalized Education Grand List
Education Grand List COD
Total Taxable Parcel Count
Bolton 1,321,064 102.42 11.60 1,289,810755
Buels Gore 27,558 93.76 8.47 29,39027
Burlington 36,105,286 85.09 11.11 42,433,56010,414*Charlotte 9,580,734 102.39 12.01 9,356,9401,740
Colchester 20,376,005 96.60 7.66 21,093,9706,744
Essex Jct. 10,864,260 99.07 5.75 10,965,8403,405
Essex Town 14,096,339 98.98 5.75 14,242,2504,282
Hinesburg 5,224,028 90.31 10.69 5,784,7201,957
Huntington 2,136,069 100.05 1.90 2,134,910896
Jericho 5,777,593 96.87 9.10 5,964,4702,034
Milton 11,274,303 103.60 8.32 10,882,7804,385*Richmond 4,495,587 98.23 11.03 4,576,6101,670
Shelburne 15,112,601 95.84 8.18 15,767,7602,888
South Burlington 29,007,172 96.27 6.36 30,129,5707,463*St. George 701,997 95.95 12.88 731,650336
Underhill 3,836,505 101.17 5.97 3,792,2101,305
Westford 2,364,070 100.95 10.52 2,341,910936
Williston 17,121,899 94.00 7.22 18,215,1304,088
Winooski 5,656,073 93.65 7.83 6,039,5001,781*
County Totals 195,079,143 205,772,98057,106
Municipality has active TIF district. For more information, refer to introduction preceding this report.*
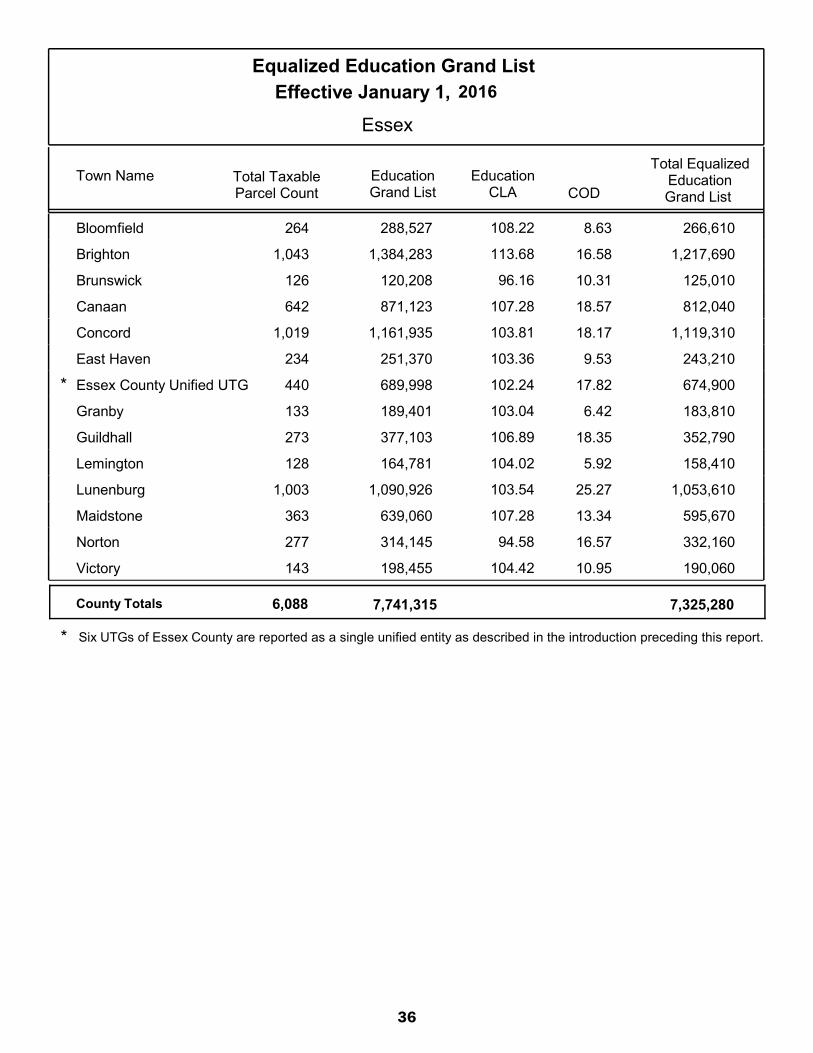
36
2016Equalized Education Grand List
Essex
Effective January 1,
Town Name Education CLA
Total Equalized Education Grand List
Education Grand List COD
Total Taxable Parcel Count
Bloomfield 288,527 108.22 8.63 266,610264
Brighton 1,384,283 113.68 16.58 1,217,6901,043
Brunswick 120,208 96.16 10.31 125,010126
Canaan 871,123 107.28 18.57 812,040642
Concord 1,161,935 103.81 18.17 1,119,3101,019
East Haven 251,370 103.36 9.53 243,210234
Essex County Unified UTG 689,998 102.24 17.82 674,900440*Granby 189,401 103.04 6.42 183,810133
Guildhall 377,103 106.89 18.35 352,790273
Lemington 164,781 104.02 5.92 158,410128
Lunenburg 1,090,926 103.54 25.27 1,053,6101,003
Maidstone 639,060 107.28 13.34 595,670363
Norton 314,145 94.58 16.57 332,160277
Victory 198,455 104.42 10.95 190,060143
County Totals 7,741,315 7,325,2806,088
* Six UTGs of Essex County are reported as a single unified entity as described in the introduction preceding this report.
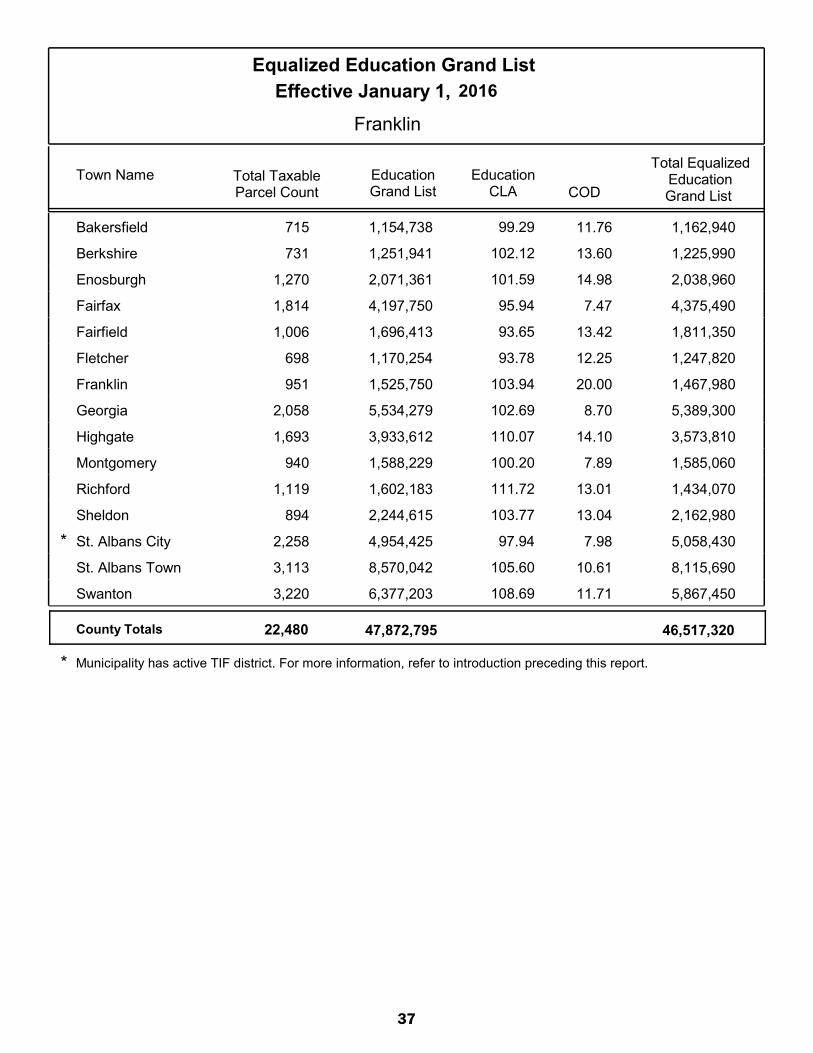
37
2016Equalized Education Grand List
Franklin
Effective January 1,
Town Name Education CLA
Total Equalized Education Grand List
Education Grand List COD
Total Taxable Parcel Count
Bakersfield 1,154,738 99.29 11.76 1,162,940715
Berkshire 1,251,941 102.12 13.60 1,225,990731
Enosburgh 2,071,361 101.59 14.98 2,038,9601,270
Fairfax 4,197,750 95.94 7.47 4,375,4901,814
Fairfield 1,696,413 93.65 13.42 1,811,3501,006
Fletcher 1,170,254 93.78 12.25 1,247,820698
Franklin 1,525,750 103.94 20.00 1,467,980951
Georgia 5,534,279 102.69 8.70 5,389,3002,058
Highgate 3,933,612 110.07 14.10 3,573,8101,693
Montgomery 1,588,229 100.20 7.89 1,585,060940
Richford 1,602,183 111.72 13.01 1,434,0701,119
Sheldon 2,244,615 103.77 13.04 2,162,980894
St. Albans City 4,954,425 97.94 7.98 5,058,4302,258*St. Albans Town 8,570,042 105.60 10.61 8,115,6903,113
Swanton 6,377,203 108.69 11.71 5,867,4503,220
County Totals 47,872,795 46,517,32022,480
Municipality has active TIF district. For more information, refer to introduction preceding this report.*
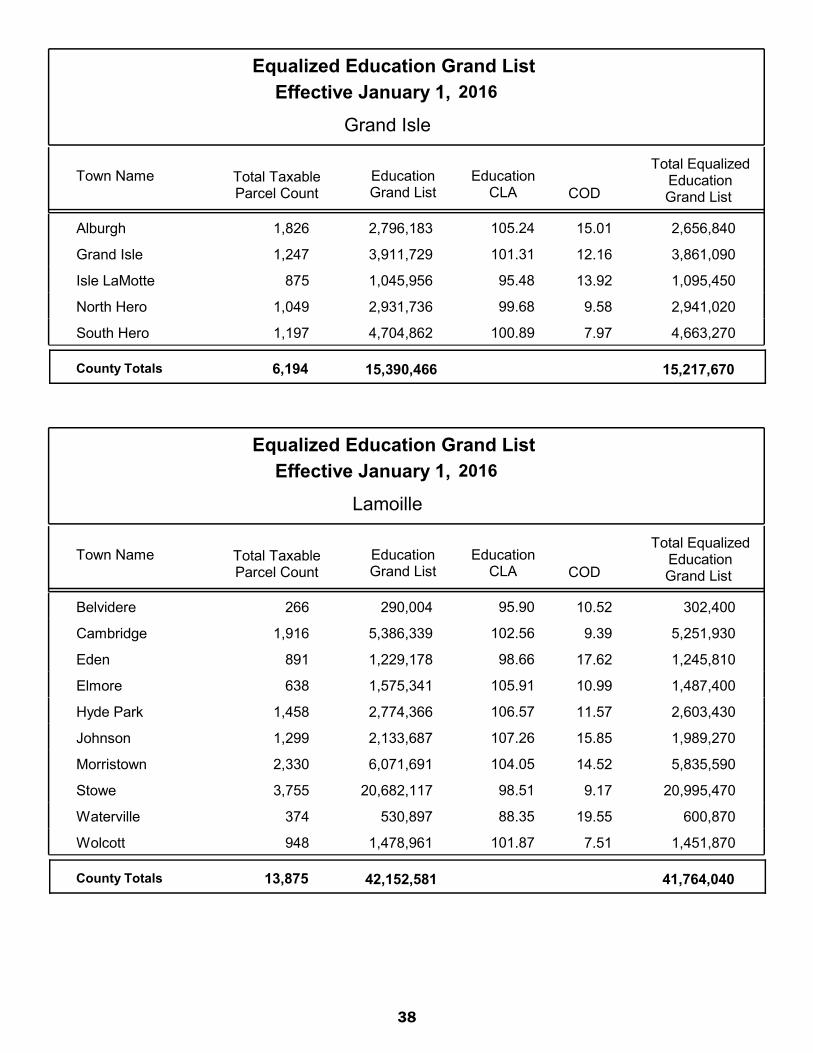
38
2016Equalized Education Grand List
Grand Isle
Effective January 1,
Town Name Education CLA
Total Equalized Education Grand List
Education Grand List COD
Total Taxable Parcel Count
Alburgh 2,796,183 105.24 15.01 2,656,8401,826
Grand Isle 3,911,729 101.31 12.16 3,861,0901,247
Isle LaMotte 1,045,956 95.48 13.92 1,095,450875
North Hero 2,931,736 99.68 9.58 2,941,0201,049
South Hero 4,704,862 100.89 7.97 4,663,2701,197
County Totals 15,390,466 15,217,6706,194
2016Equalized Education Grand List
Lamoille
Effective January 1,
Town Name Education CLA
Total Equalized Education Grand List
Education Grand List COD
Total Taxable Parcel Count
Belvidere 290,004 95.90 10.52 302,400266
Cambridge 5,386,339 102.56 9.39 5,251,9301,916
Eden 1,229,178 98.66 17.62 1,245,810891
Elmore 1,575,341 105.91 10.99 1,487,400638
Hyde Park 2,774,366 106.57 11.57 2,603,4301,458
Johnson 2,133,687 107.26 15.85 1,989,2701,299
Morristown 6,071,691 104.05 14.52 5,835,5902,330
Stowe 20,682,117 98.51 9.17 20,995,4703,755
Waterville 530,897 88.35 19.55 600,870374
Wolcott 1,478,961 101.87 7.51 1,451,870948
County Totals 42,152,581 41,764,04013,875

39
2016Equalized Education Grand List
Orange
Effective January 1,
Town Name Education CLA
Total Equalized Education Grand List
Education Grand List COD
Total Taxable Parcel Count
Bradford 2,409,231 109.66 18.59 2,196,9601,286
Braintree 1,017,434 105.64 19.20 963,120703
Brookfield 1,601,369 111.25 14.52 1,439,460872
Chelsea 1,127,973 105.33 29.68 1,070,850813
Corinth 1,476,156 110.23 16.72 1,339,1401,002
Fairlee 2,048,659 102.94 9.37 1,990,080660
Newbury 2,005,058 106.23 16.53 1,887,5401,389
Orange 980,901 102.50 14.02 956,950608
Randolph 4,371,769 103.71 13.69 4,215,3802,036
Strafford 1,758,517 103.23 8.60 1,703,550680
Thetford 3,439,455 98.83 8.21 3,480,1801,378
Topsham 1,059,029 111.79 15.77 947,360846
Tunbridge 1,637,443 114.93 13.03 1,424,770870
Vershire 676,775 101.54 11.34 666,480499
Washington 1,039,654 111.72 17.15 930,570677
Wells River 289,517 104.02 16.53 278,320181
West Fairlee 701,100 94.61 11.92 741,030429
Williamstown 2,865,248 89.65 14.10 3,196,1401,574
County Totals 30,505,288 29,427,88016,503
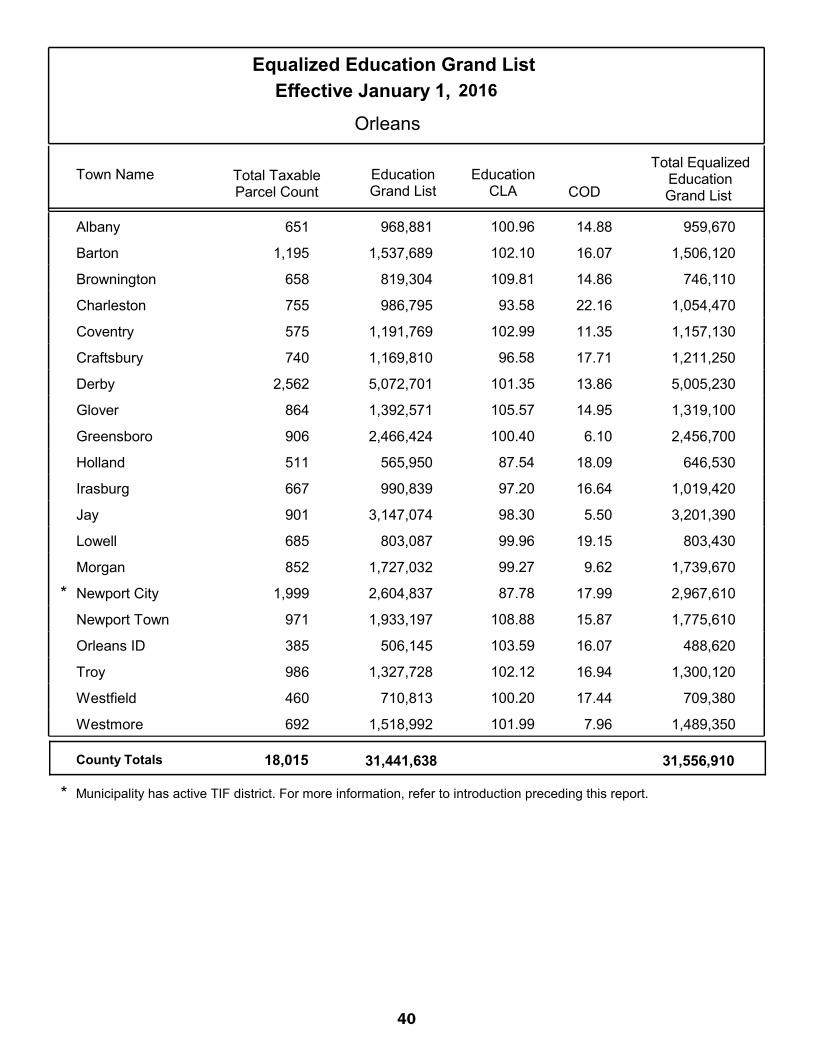
40
2016Equalized Education Grand List
Orleans
Effective January 1,
Town Name Education CLA
Total Equalized Education Grand List
Education Grand List COD
Total Taxable Parcel Count
Albany 968,881 100.96 14.88 959,670651
Barton 1,537,689 102.10 16.07 1,506,1201,195
Brownington 819,304 109.81 14.86 746,110658
Charleston 986,795 93.58 22.16 1,054,470755
Coventry 1,191,769 102.99 11.35 1,157,130575
Craftsbury 1,169,810 96.58 17.71 1,211,250740
Derby 5,072,701 101.35 13.86 5,005,2302,562
Glover 1,392,571 105.57 14.95 1,319,100864
Greensboro 2,466,424 100.40 6.10 2,456,700906
Holland 565,950 87.54 18.09 646,530511
Irasburg 990,839 97.20 16.64 1,019,420667
Jay 3,147,074 98.30 5.50 3,201,390901
Lowell 803,087 99.96 19.15 803,430685
Morgan 1,727,032 99.27 9.62 1,739,670852
Newport City 2,604,837 87.78 17.99 2,967,6101,999*Newport Town 1,933,197 108.88 15.87 1,775,610971
Orleans ID 506,145 103.59 16.07 488,620385
Troy 1,327,728 102.12 16.94 1,300,120986
Westfield 710,813 100.20 17.44 709,380460
Westmore 1,518,992 101.99 7.96 1,489,350692
County Totals 31,441,638 31,556,91018,015
Municipality has active TIF district. For more information, refer to introduction preceding this report.*

41
2016Equalized Education Grand List
Rutland
Effective January 1,
Town Name Education CLA
Total Equalized Education Grand List
Education Grand List COD
Total Taxable Parcel Count
Benson 1,024,774 92.20 11.94 1,111,510619
Brandon 3,322,219 101.63 14.25 3,269,0401,933
Castleton 4,756,830 97.84 7.38 4,862,0402,346
Chittenden 1,648,732 92.62 14.65 1,780,170735
Clarendon 2,688,654 115.70 23.28 2,323,8601,251
Danby 1,792,452 117.33 16.33 1,527,750804
Fair Haven 1,818,827 117.68 17.47 1,545,6001,162
Hubbardton 1,190,381 114.42 29.79 1,040,330695
Ira 447,520 102.69 6.72 435,790281
Killington 7,439,049 103.35 17.55 7,197,9802,939
Mendon 1,771,179 101.15 13.79 1,751,020809
Middletown Springs 883,590 102.94 14.54 858,330478
Mount Holly 2,684,139 114.92 17.60 2,335,7201,204
Mount Tabor 234,473 109.13 9.27 214,850142
Pawlet 1,979,038 115.46 17.07 1,714,070805
Pittsfield 1,007,438 117.79 14.29 855,310507
Pittsford 3,410,575 110.10 13.84 3,097,7601,426
Poultney 3,228,698 96.93 12.08 3,330,8601,699
Proctor 1,224,848 111.99 11.46 1,093,680732
Rutland City 9,727,228 94.50 17.42 10,293,8205,912
Rutland Town 6,074,145 101.41 8.39 5,989,9301,895
Shrewsbury 1,501,222 105.22 12.23 1,426,780697
Sudbury 934,751 113.81 16.98 821,310482
Tinmouth 887,912 118.73 13.22 747,820443
Wallingford 2,414,599 111.85 15.85 2,158,8401,153
Wells 1,795,427 104.84 6.80 1,712,540972
West Haven 310,700 101.14 9.05 307,180165
West Rutland 1,871,278 105.79 12.05 1,768,8201,005
County Totals 68,070,678 65,572,71033,291
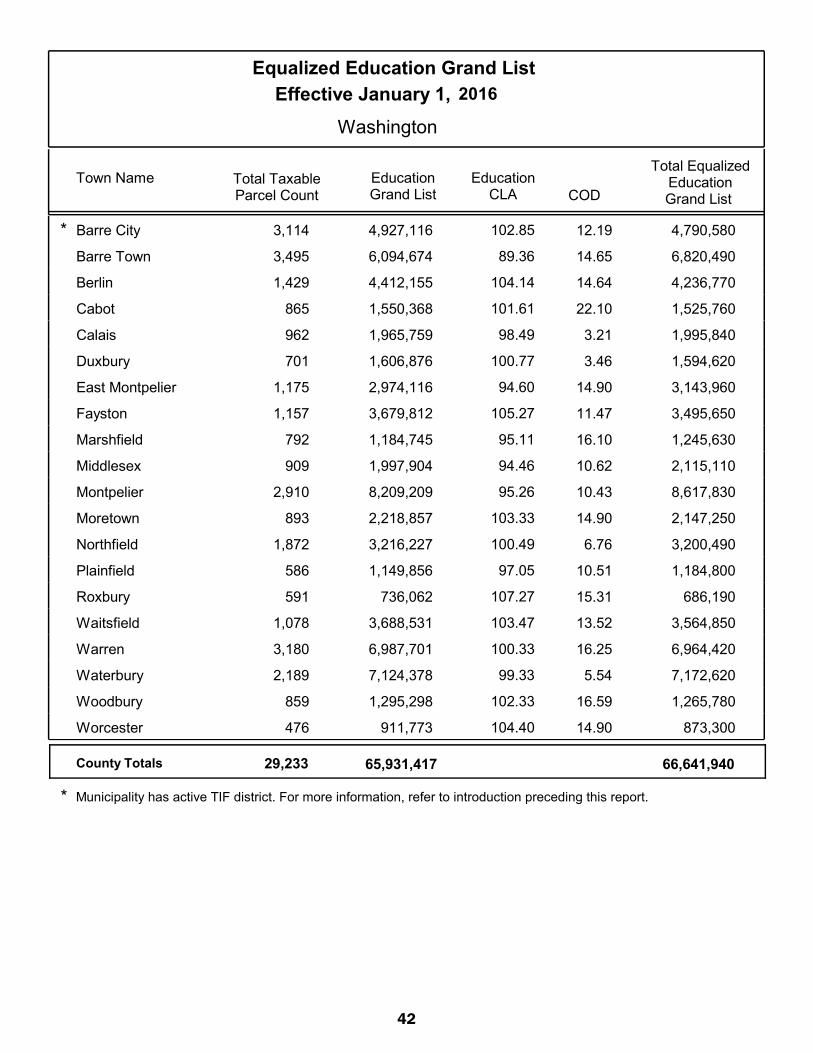
42
2016Equalized Education Grand List
Washington
Effective January 1,
Town Name Education CLA
Total Equalized Education Grand List
Education Grand List COD
Total Taxable Parcel Count
Barre City 4,927,116 102.85 12.19 4,790,5803,114*Barre Town 6,094,674 89.36 14.65 6,820,4903,495
Berlin 4,412,155 104.14 14.64 4,236,7701,429
Cabot 1,550,368 101.61 22.10 1,525,760865
Calais 1,965,759 98.49 3.21 1,995,840962
Duxbury 1,606,876 100.77 3.46 1,594,620701
East Montpelier 2,974,116 94.60 14.90 3,143,9601,175
Fayston 3,679,812 105.27 11.47 3,495,6501,157
Marshfield 1,184,745 95.11 16.10 1,245,630792
Middlesex 1,997,904 94.46 10.62 2,115,110909
Montpelier 8,209,209 95.26 10.43 8,617,8302,910
Moretown 2,218,857 103.33 14.90 2,147,250893
Northfield 3,216,227 100.49 6.76 3,200,4901,872
Plainfield 1,149,856 97.05 10.51 1,184,800586
Roxbury 736,062 107.27 15.31 686,190591
Waitsfield 3,688,531 103.47 13.52 3,564,8501,078
Warren 6,987,701 100.33 16.25 6,964,4203,180
Waterbury 7,124,378 99.33 5.54 7,172,6202,189
Woodbury 1,295,298 102.33 16.59 1,265,780859
Worcester 911,773 104.40 14.90 873,300476
County Totals 65,931,417 66,641,94029,233
Municipality has active TIF district. For more information, refer to introduction preceding this report.*

43
2016Equalized Education Grand List
Windham
Effective January 1,
Town Name Education CLA
Total Equalized Education Grand List
Education Grand List COD
Total Taxable Parcel Count
Athens 367,803 111.74 9.82 329,150253
Brattleboro 11,085,575 103.29 16.06 10,732,3104,288
Brookline 696,849 98.52 10.00 707,320334
Dover 9,549,505 104.20 12.53 9,164,9503,428
Dummerston 2,599,851 106.00 9.29 2,452,640997
Grafton 1,601,400 116.69 11.12 1,372,380609
Guilford 2,120,958 92.86 16.64 2,284,1501,088
Halifax 1,271,140 103.53 18.56 1,227,780639
Jamaica 2,716,183 113.74 26.74 2,387,9601,281
Londonderry 4,193,727 100.86 13.37 4,158,0201,549
Marlboro 1,494,606 100.87 11.17 1,481,730646
Newfane 2,807,177 108.05 21.43 2,598,1301,311
Putney 2,364,192 101.24 7.91 2,335,2401,012
Rockingham 4,883,550 103.90 19.48 4,700,2202,114
Somerset 144,760 98.91 12.32 146,36034
Stratton 7,825,208 98.01 9.33 7,984,4201,584
Townshend 1,776,757 106.90 14.50 1,662,1201,016
Vernon 5,752,125 104.17 12.89 5,522,130890
Wardsboro 1,730,663 107.57 14.92 1,608,8401,021
Westminster 2,817,148 97.93 13.35 2,876,8001,553
Whitingham 2,877,726 112.00 21.41 2,569,4201,155
Wilmington 6,774,041 100.33 17.23 6,751,8903,058
Windham 952,639 102.49 3.31 929,460519
County Totals 78,403,583 75,983,42030,379

44
2016Equalized Education Grand List
Windsor
Effective January 1,
Town Name Education CLA
Total Equalized Education Grand List
Education Grand List COD
Total Taxable Parcel Count
Andover 1,660,090 120.59 17.75 1,376,650550
Baltimore 196,051 100.35 15.63 195,360113
Barnard 2,889,013 100.36 18.78 2,878,580819
Bethel 1,970,162 108.93 9.59 1,808,6801,121
Bridgewater 1,744,063 92.13 17.02 1,893,120730
Cavendish 2,732,702 109.71 12.87 2,490,9101,145
Chester 4,181,454 115.87 21.43 3,608,8701,813
Hartford 13,292,543 102.40 10.05 12,981,5105,437*Hartland 4,242,521 105.37 8.84 4,026,2401,560
Ludlow 13,237,502 102.59 15.60 12,902,7403,451
Norwich 6,986,430 95.35 7.75 7,327,3901,556
Plymouth 2,680,364 105.56 20.00 2,539,1201,165
Pomfret 2,464,999 105.43 19.12 2,337,990588
Reading 1,359,025 101.01 7.99 1,345,440513
Rochester 1,618,072 112.23 18.23 1,441,800927
Royalton 2,542,266 106.75 15.44 2,381,5901,281
Sharon 1,541,641 106.15 12.84 1,452,380762
Springfield 6,320,459 110.47 16.49 5,721,2503,771
Stockbridge 1,092,574 98.28 13.01 1,111,740754
Weathersfield 2,882,054 99.66 14.44 2,891,9501,607
West Windsor 2,625,053 104.04 10.33 2,523,080886
Weston 1,976,736 95.89 12.36 2,061,480633
Windsor 2,463,109 110.59 14.71 2,227,1601,350
Woodstock 8,647,429 96.36 15.87 8,974,3001,894
County Totals 91,346,312 88,499,33034,426
Municipality has active TIF district. For more information, refer to introduction preceding this report.*
800,696,138STATE TOTALS: 799,181,110323,536

45
this page is intentionally blank .
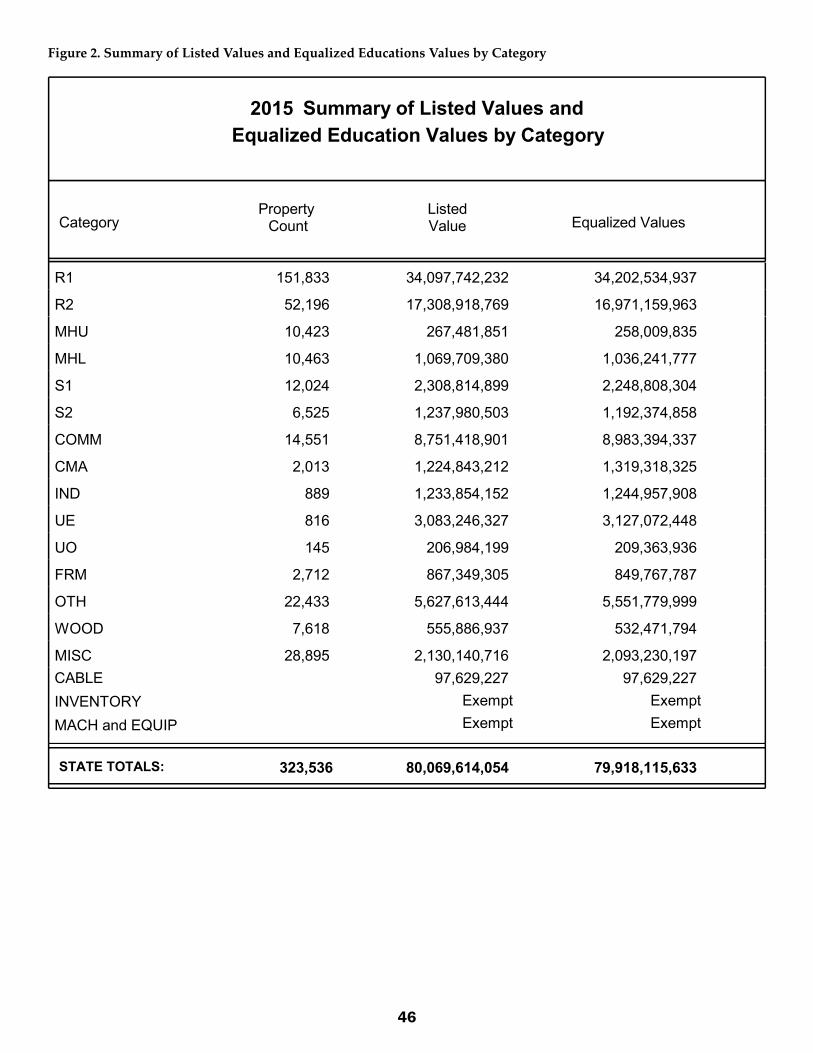
46
2015 Summary of Listed Values and Equalized Education Values by Category
CategoryListed Value Equalized Values
Property Count
R1 151,833 34,097,742,232 34,202,534,937
R2 52,196 17,308,918,769 16,971,159,963
MHU 10,423 267,481,851 258,009,835
MHL 10,463 1,069,709,380 1,036,241,777
S1 12,024 2,308,814,899 2,248,808,304
S2 6,525 1,237,980,503 1,192,374,858
COMM 14,551 8,751,418,901 8,983,394,337
CMA 2,013 1,224,843,212 1,319,318,325
IND 889 1,233,854,152 1,244,957,908
UE 816 3,083,246,327 3,127,072,448
UO 145 206,984,199 209,363,936
FRM 2,712 867,349,305 849,767,787
OTH 22,433 5,627,613,444 5,551,779,999
WOOD 7,618 555,886,937 532,471,794
MISC 28,895 2,130,140,716 2,093,230,19797,629,22797,629,227CABLE
INVENTORYMACH and EQUIP
ExemptExempt
ExemptExempt
323,536STATE TOTALS: 79,918,115,63380,069,614,054
Figure 2. Summary of Listed Values and Equalized Educations Values by Category
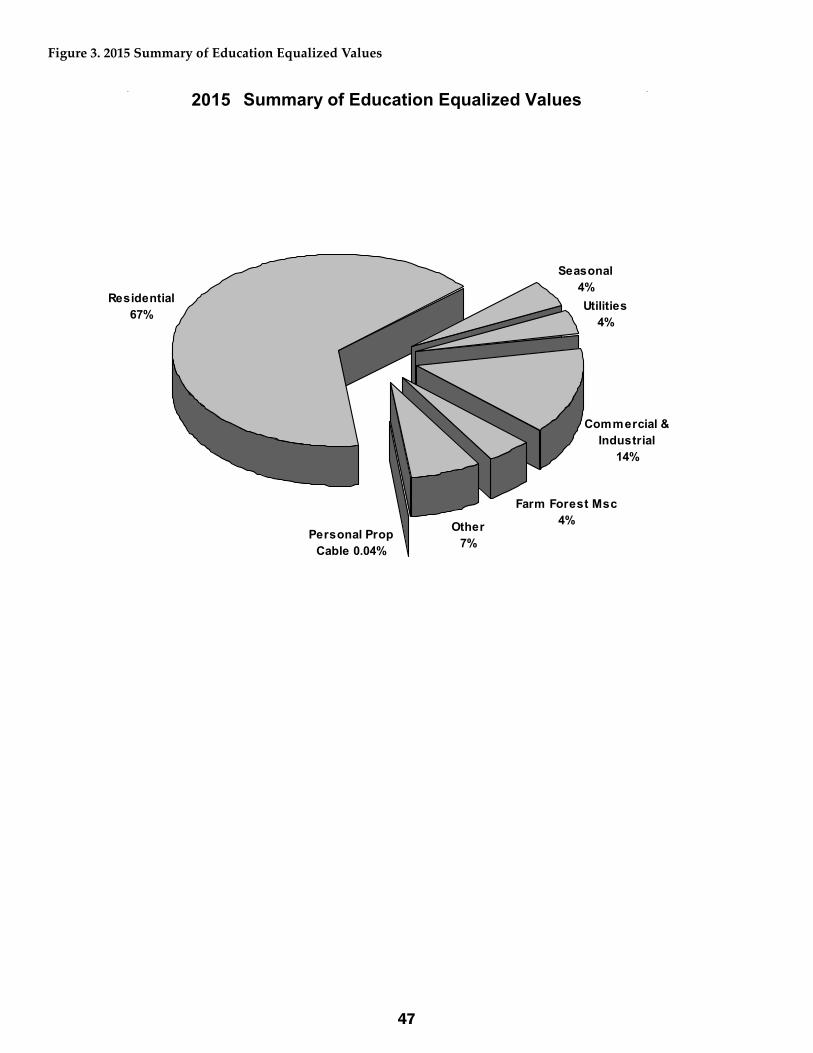
47
Figure 3. 2015 Summary of Education Equalized Values
Summary of Education Equalized Values2015
Commercial & Industrial
14%
Farm Forest Msc4%Other
7%
Residential67%
Seasonal4%Utilities
4%
Personal Prop Cable 0.04%

48
2015 Summary of Listed Values and Equalized Municipal Values by Category
Category Listed Value
Equalized ValuesProperty Count
R1 151,833 34,048,014,694 34,153,484,943
R2 52,196 17,284,087,680 16,946,954,784
MHU 10,423 266,088,651 256,692,296
MHL 10,463 1,066,262,055 1,032,908,669
S1 12,024 2,308,583,299 2,248,595,460
S2 6,525 1,236,991,103 1,191,431,752
COMM 14,551 8,837,969,010 9,067,619,941
CMA 2,013 1,242,307,807 1,336,730,648
IND 889 1,233,465,863 1,244,459,947
UE 816 3,210,859,537 3,255,317,829
UO 145 207,904,758 210,282,379
FRM 2,712 857,487,735 839,945,755
OTH 22,433 5,624,237,844 5,548,361,900
WOOD 7,618 554,093,137 530,856,794
MISC 28,895 2,125,203,176 2,088,381,16732,769,76632,769,766CABLE
INVENTORYMACH and EQUIP
123,927,531123,927,531799,180,358799,180,358
323,536STATE TOTALS: 80,907,901,91781,059,434,004
Figure 4. 2015 Summary of Listed Values and Equalized Municipal Values by Category

49
Summary of Municipal Equalized Values2015
Seasonal4%
Utilities4%
Residential66%
Commercial Industrial
16%
Farm/Forest/Msc6%
Other7%
Personal Property1%
Figure 5. 2015 Summary of Municipal Equalized Values
50
Statutory exemptions
Figure 1 shows the number and values of properties exempt from property taxation according to 32 V.S.A. Chapter 125. The data is reported for each town, organized by county. By statute, several types of properties are exempt, including the following:
• property owned by the United States• state and municipal governments• organizations chartered by act of Congress including veterans’ organizations• the Red Cross
• Boy and Girl Scout organizations
Also covered under this statute are real and personal estate that is:
• used for public, pious, and charitable uses• property held by and for the benefit of college fraternities and societies1
• property owned and occupied by a Young Men’s or a Women’s Christian Association• land and buildings used for cemetery purposes• grounds and property owned by agricultural societies so long as the same are used annually for agricultural fairs
Towns should list the statutorily exempt properties in the grand list using a fair market value assessment. Determining the market value of exempt property is often difficult. Most exempt properties have a specific public use (independent of the land) which may result in relatively little marketable value if offered publicly for sale. Due to this difficulty, some towns have failed to provide any value for their exempt properties. To improve the reporting of information about exempt properties, the Vermont legislature adopted 32 V.S.A. § 3802(a)2 which requires the owners of exempt properties to report the insurance replacement cost of certain types of exempt properties. As a result of a collaborative effort by the Department, the Vermont League of Cities and Towns, the Vermont Assessors and Listers Association, and municipal assessing officials, the requirements of the statute were broadly distributed. These efforts have substantially increased the amount of information available on exempt properties.
Figure 1 shows the number of exempt properties reported in last year’s Annual Report and the number of exempt properties reported this year. In addition, Figure 1 indicates how many properties are valued at an appraised value, and how many are using the insurance replacement value. The last column indicates the aggregate value of the exempt properties.
1 The exemption for college fraternities and sororities was amended in in Act 200 Sec. 22(2) of the 2013-2014 Legislature to remove the exemption effective Jan. 1, 2017.2 (Added 2013, No. 73, § 29, eff. June 5, 2013.)

51
Figure 1. Statutory Exemptions by County, Town
2015 Statutory Exemptions
AddisonParcel Counts and Total Value
Parcel Counts by Tax Year
Town Name Total Value2014 2015Assessed
Value Insurance
Value
Counts by Valuation TypeUndeter-
mined
33 13,138,100Addison 33 033 0
20 4,713,300Bridport 20 019 1
121 48,024,700Bristol 122 5116 0
15 5,248,600Cornwall 16 69 0
50 23,903,200Ferrisburgh 45 940 1
5 916,700Goshen 5 05 0
11 1,802,200Granville 11 110 0
8 765,200Hancock 8 08 0
15 4,547,400Leicester 14 69 0
19 5,212,100Lincoln 18 019 0
199 446,844,600Middlebury 199 2167 30
27 1,401,800Monkton 28 126 0
26 6,262,800New Haven 26 521 0
34 7,501,210Orwell 34 034 0
15 3,894,700Panton 15 015 0
25 41,290,600Ripton 25 025 0
18 7,700,800Salisbury 18 018 0
38 7,059,300Shoreham 39 929 0
34 5,645,400Starksboro 33 034 0
44 59,227,717Vergennes 43 431 0
3 2,954,000Waltham 3 12 0
23 3,957,500Weybridge 22 023 0
13 3,225,400Whiting 13 85 0
County Totals 796 $705,237,327790 96668 32
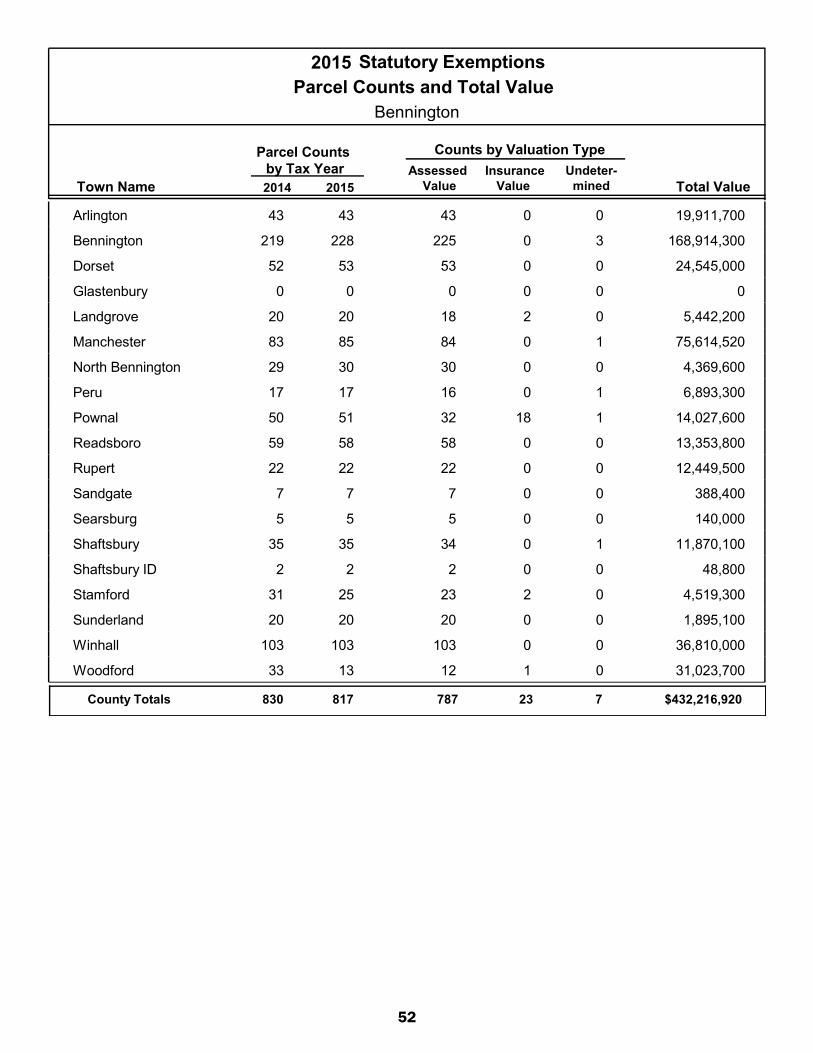
52
2015 Statutory Exemptions
BenningtonParcel Counts and Total Value
Parcel Counts by Tax Year
Town Name Total Value2014 2015Assessed
Value Insurance
Value
Counts by Valuation TypeUndeter-
mined
43 19,911,700Arlington 43 043 0
228 168,914,300Bennington 219 0225 3
53 24,545,000Dorset 52 053 0
0 0Glastenbury 0 00 0
20 5,442,200Landgrove 20 218 0
85 75,614,520Manchester 83 084 1
30 4,369,600North Bennington 29 030 0
17 6,893,300Peru 17 016 1
51 14,027,600Pownal 50 1832 1
58 13,353,800Readsboro 59 058 0
22 12,449,500Rupert 22 022 0
7 388,400Sandgate 7 07 0
5 140,000Searsburg 5 05 0
35 11,870,100Shaftsbury 35 034 1
2 48,800Shaftsbury ID 2 02 0
25 4,519,300Stamford 31 223 0
20 1,895,100Sunderland 20 020 0
103 36,810,000Winhall 103 0103 0
13 31,023,700Woodford 33 112 0
County Totals 817 $432,216,920830 23787 7

53
2015 Statutory Exemptions
CaledoniaParcel Counts and Total Value
Parcel Counts by Tax Year
Town Name Total Value2014 2015Assessed
Value Insurance
Value
Counts by Valuation TypeUndeter-
mined
46 11,779,000Barnet 45 044 2
29 15,422,100Burke 25 029 0
49 12,249,336Danville 50 046 3
47 11,574,500Groton 47 047 0
65 21,858,700Hardwick 67 065 0
6 395,900Kirby 6 06 0
116 141,307,953Lyndon 118 0116 0
13 5,307,400Newark 13 210 1
34 10,336,800Peacham 34 034 0
27 2,508,400Ryegate 27 522 0
12 8,492,100Sheffield 12 210 0
184 130,877,516St. Johnsbury 177 1181 2
8 3,101,200Stannard 1 08 0
18 7,758,700Sutton 18 018 0
13 8,997,200Walden 13 013 0
19 10,190,900Waterford 19 613 0
17 2,658,200Wheelock 12 017 0
County Totals 703 $404,815,905684 16679 8

54
2015 Statutory Exemptions
ChittendenParcel Counts and Total Value
Parcel Counts by Tax Year
Town Name Total Value2014 2015Assessed
Value Insurance
Value
Counts by Valuation TypeUndeter-
mined
17 16,673,600Bolton 16 017 0
0 0Buels Gore 0 00 0
411 1,675,489,300Burlington 410 0409 2
28 25,834,800Charlotte 29 028 0
164 192,955,200Colchester 157 0164 0
52 103,306,300Essex Jct. 54 052 0
88 76,460,500Essex Town 88 088 0
51 16,631,900Hinesburg 50 051 0
18 8,839,300Huntington 18 018 0
51 46,752,700Jericho 35 150 0
57 36,914,790Milton 58 354 0
33 27,689,000Richmond 33 330 0
72 115,560,700Shelburne 73 071 1
139 208,184,800South Burlington 132 30109 0
8 1,025,300St. George 6 26 0
38 21,737,900Underhill 31 1028 0
22 5,646,200Westford 22 022 0
109 82,764,788Williston 110 6103 0
40 43,292,600Winooski 41 2218 0
County Totals 1,398 $2,705,759,6781,363 771,318 3

55
2015 Statutory Exemptions
EssexParcel Counts and Total Value
Parcel Counts by Tax Year
Town Name Total Value2014 2015Assessed
Value Insurance
Value
Counts by Valuation TypeUndeter-
mined
0 0Averill 0 00 0
0 0Averys Gore 0 00 0
24 3,334,000Bloomfield 21 024 0
43 9,904,322Brighton 44 437 2
23 2,864,700Brunswick 23 023 0
43 13,866,400Canaan 42 043 0
31 4,494,700Concord 30 031 0
10 1,292,700East Haven 11 010 0
7 8,895,800Ferdinand 7 00 7
12 981,800Granby 12 012 0
16 1,862,100Guildhall 16 115 0
12 1,392,100Lemington 12 012 0
10 4,672,000Lewis 10 00 10
33 7,808,400Lunenburg 30 033 0
12 4,253,100Maidstone 12 012 0
12 4,675,800Norton 12 39 0
22 12,419,400Victory 21 022 0
0 0Warners Grant 0 00 0
0 0Warren Gore 0 00 0
County Totals 310 $82,717,322303 8283 19

56
2015 Statutory Exemptions
FranklinParcel Counts and Total Value
Parcel Counts by Tax Year
Town Name Total Value2014 2015Assessed
Value Insurance
Value
Counts by Valuation TypeUndeter-
mined
19 6,783,800Bakersfield 19 109 0
17 1,745,700Berkshire 18 98 0
64 39,932,245Enosburgh 64 2836 0
42 13,912,100Fairfax 42 141 0
31 7,071,574Fairfield 31 922 0
17 2,697,600Fletcher 16 611 0
19 8,531,600Franklin 19 811 0
35 11,672,200Georgia 35 00 35
47 41,307,900Highgate 49 1334 0
28 13,196,200Montgomery 28 1513 0
64 42,391,600Richford 61 061 3
27 7,261,000Sheldon 25 1512 0
59 226,806,500St. Albans City 52 3425 0
41 60,817,500St. Albans Town 38 2317 1
64 70,413,000Swanton 68 1252 0
County Totals 574 $554,540,519565 183352 39

57
2015 Statutory Exemptions
Grand IsleParcel Counts and Total Value
Parcel Counts by Tax Year
Town Name Total Value2014 2015Assessed
Value Insurance
Value
Counts by Valuation TypeUndeter-
mined
48 17,405,000Alburgh 48 1830 0
32 29,938,300Grand Isle 32 527 0
21 5,728,000Isle LaMotte 21 021 0
30 19,173,700North Hero 29 129 0
29 12,097,000South Hero 29 1019 0
County Totals 160 $84,342,000159 34126 0
2015 Statutory Exemptions
LamoilleParcel Counts and Total Value
Parcel Counts by Tax Year
Town Name Total Value2014 2015Assessed
Value Insurance
Value
Counts by Valuation TypeUndeter-
mined
14 5,030,500Belvidere 14 59 0
53 43,878,100Cambridge 54 1142 0
32 8,340,310Eden 31 032 0
12 5,355,600Elmore 11 012 0
40 71,066,300Hyde Park 39 931 0
59 83,577,800Johnson 59 256 1
100 53,138,000Morristown 97 199 0
66 56,654,300Stowe 66 065 1
11 5,668,900Waterville 11 110 0
36 5,845,300Wolcott 35 531 0
County Totals 423 $338,555,110417 44377 2

58
2015 Statutory Exemptions
OrangeParcel Counts and Total Value
Parcel Counts by Tax Year
Town Name Total Value2014 2015Assessed
Value Insurance
Value
Counts by Valuation TypeUndeter-
mined
53 18,217,500Bradford 53 053 0
18 4,658,800Braintree 17 414 0
24 6,464,600Brookfield 25 816 0
26 11,265,200Chelsea 25 1016 0
23 1,696,800Corinth 23 023 0
21 11,974,500Fairlee 23 021 0
56 6,509,400Newbury 57 056 0
22 7,738,500Orange 22 319 0
87 207,056,700Randolph 86 2757 3
24 8,980,800Strafford 24 222 0
58 48,128,303Thetford 58 2137 0
10 1,734,317,600Topsham 7 19 0
38 7,766,000Tunbridge 19 038 0
13 4,690,600Vershire 9 012 1
27 5,705,700Washington 27 225 0
26 2,713,300Wells River 26 026 0
23 2,915,300West Fairlee 23 419 0
36 31,639,500Williamstown 34 727 2
County Totals 585 $2,122,439,103558 89490 6
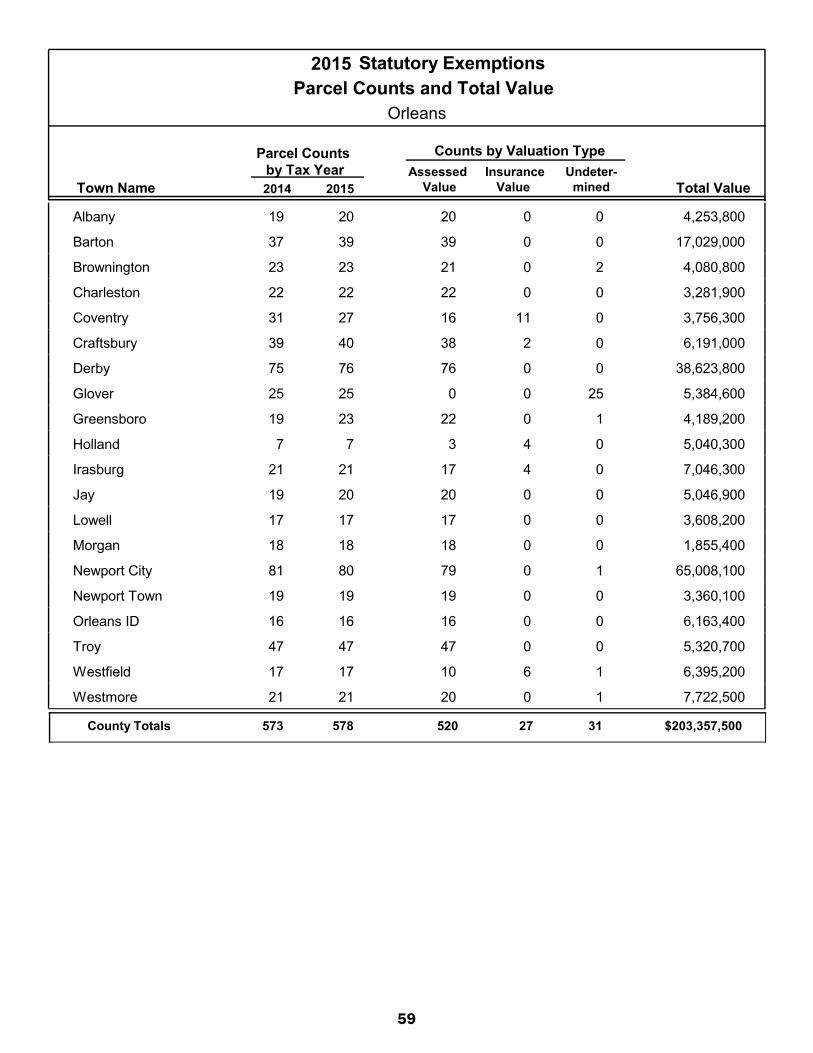
59
2015 Statutory Exemptions
OrleansParcel Counts and Total Value
Parcel Counts by Tax Year
Town Name Total Value2014 2015Assessed
Value Insurance
Value
Counts by Valuation TypeUndeter-
mined
20 4,253,800Albany 19 020 0
39 17,029,000Barton 37 039 0
23 4,080,800Brownington 23 021 2
22 3,281,900Charleston 22 022 0
27 3,756,300Coventry 31 1116 0
40 6,191,000Craftsbury 39 238 0
76 38,623,800Derby 75 076 0
25 5,384,600Glover 25 00 25
23 4,189,200Greensboro 19 022 1
7 5,040,300Holland 7 43 0
21 7,046,300Irasburg 21 417 0
20 5,046,900Jay 19 020 0
17 3,608,200Lowell 17 017 0
18 1,855,400Morgan 18 018 0
80 65,008,100Newport City 81 079 1
19 3,360,100Newport Town 19 019 0
16 6,163,400Orleans ID 16 016 0
47 5,320,700Troy 47 047 0
17 6,395,200Westfield 17 610 1
21 7,722,500Westmore 21 020 1
County Totals 578 $203,357,500573 27520 31

60
2015 Statutory Exemptions
RutlandParcel Counts and Total Value
Parcel Counts by Tax Year
Town Name Total Value2014 2015Assessed
Value Insurance
Value
Counts by Valuation TypeUndeter-
mined
24 7,230,700Benson 13 023 1
58 40,977,100Brandon 56 1444 0
90 117,585,300Castleton 89 090 0
32 30,910,500Chittenden 31 723 2
40 13,047,000Clarendon 40 040 0
27 2,238,300Danby 28 126 0
64 35,208,800Fair Haven 60 064 0
26 5,560,500Hubbardton 26 620 0
11 1,146,000Ira 12 011 0
53 16,159,760Killington 51 052 1
37 8,398,600Mendon 37 037 0
13 2,420,100Middletown Springs 13 013 0
25 4,742,001Mount Holly 24 025 0
9 25,867,500Mount Tabor 9 09 0
20 5,812,990Pawlet 20 020 0
13 1,393,500Pittsfield 13 013 0
45 20,261,200Pittsford 46 044 1
35 82,775,200Poultney 33 033 2
39 20,521,600Proctor 39 039 0
223 312,942,125Rutland City 220 0215 8
37 22,714,700Rutland Town 35 532 0
18 8,560,700Shrewsbury 18 018 0
14 2,982,372Sudbury 14 68 0
10 2,098,100Tinmouth 10 010 0
36 12,550,200Wallingford 36 135 0
17 2,422,400Wells 16 017 0
13 681,400West Haven 14 013 0
54 14,610,300West Rutland 52 054 0
County Totals 1,083 $821,818,9481,055 401,028 15
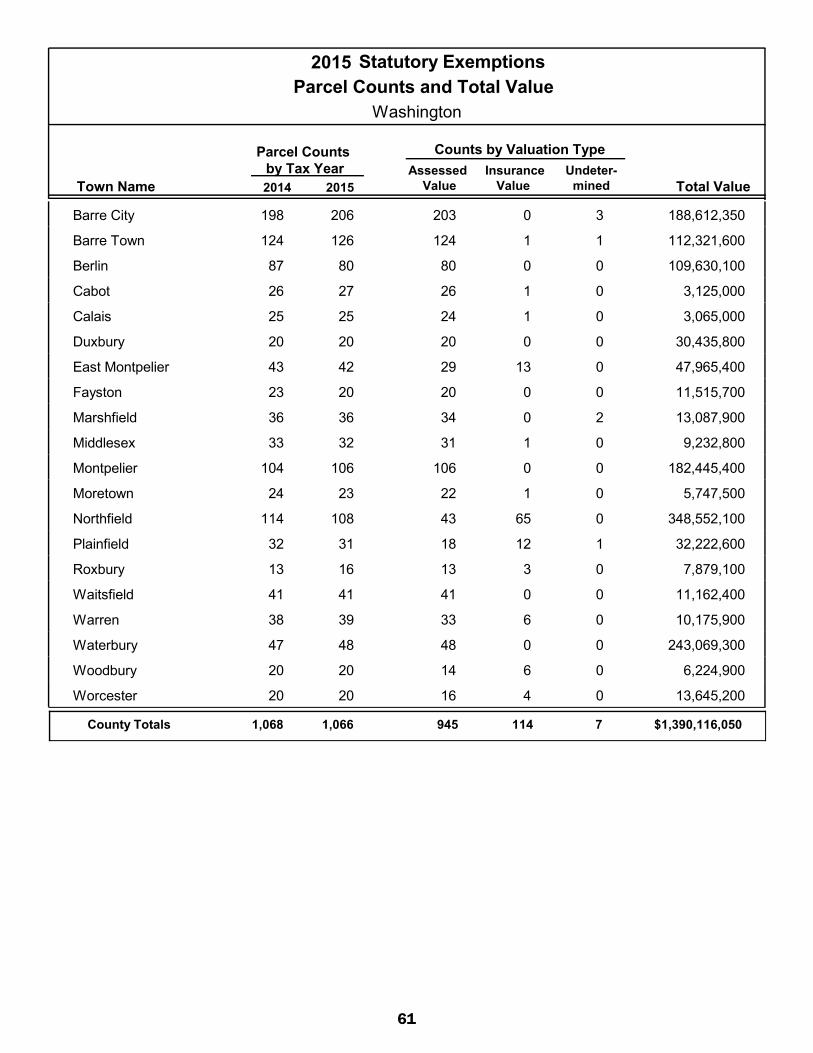
61
2015 Statutory Exemptions
WashingtonParcel Counts and Total Value
Parcel Counts by Tax Year
Town Name Total Value2014 2015Assessed
Value Insurance
Value
Counts by Valuation TypeUndeter-
mined
206 188,612,350Barre City 198 0203 3
126 112,321,600Barre Town 124 1124 1
80 109,630,100Berlin 87 080 0
27 3,125,000Cabot 26 126 0
25 3,065,000Calais 25 124 0
20 30,435,800Duxbury 20 020 0
42 47,965,400East Montpelier 43 1329 0
20 11,515,700Fayston 23 020 0
36 13,087,900Marshfield 36 034 2
32 9,232,800Middlesex 33 131 0
106 182,445,400Montpelier 104 0106 0
23 5,747,500Moretown 24 122 0
108 348,552,100Northfield 114 6543 0
31 32,222,600Plainfield 32 1218 1
16 7,879,100Roxbury 13 313 0
41 11,162,400Waitsfield 41 041 0
39 10,175,900Warren 38 633 0
48 243,069,300Waterbury 47 048 0
20 6,224,900Woodbury 20 614 0
20 13,645,200Worcester 20 416 0
County Totals 1,066 $1,390,116,0501,068 114945 7

62
2015 Statutory Exemptions
WindhamParcel Counts and Total Value
Parcel Counts by Tax Year
Town Name Total Value2014 2015Assessed
Value Insurance
Value
Counts by Valuation TypeUndeter-
mined
9 1,537,600Athens 11 09 0
224 198,145,812Brattleboro 227 0222 2
9 764,840Brookline 8 09 0
34 13,847,400Dover 31 034 0
30 10,000,300Dummerston 31 030 0
16 5,103,500Grafton 15 016 0
17 4,017,210Guilford 16 017 0
17 1,980,000Halifax 17 017 0
51 6,282,038Jamaica 51 050 1
36 6,957,400Londonderry 36 035 1
19 4,564,600Marlboro 19 017 2
44 8,678,500Newfane 42 044 0
50 121,829,000Putney 50 248 0
90 51,540,500Rockingham 91 089 1
0 0Somerset 0 00 0
16 25,214,000Stratton 16 016 0
37 23,348,300Townshend 38 136 0
34 21,431,600Vernon 37 430 0
28 4,446,000Wardsboro 27 424 0
35 66,299,200Westminster 33 1420 1
28 7,465,400Whitingham 26 028 0
82 30,975,110Wilmington 85 2557 0
11 1,456,600Windham 12 110 0
County Totals 917 $615,884,910919 51858 8

63
2015 Statutory Exemptions
WindsorParcel Counts and Total Value
Parcel Counts by Tax Year
Town Name Total Value2014 2015Assessed
Value Insurance
Value
Counts by Valuation TypeUndeter-
mined
22 4,111,300Andover 22 022 0
3 147,800Baltimore 3 21 0
42 6,919,376Barnard 43 042 0
62 12,722,600Bethel 63 062 0
25 4,406,700Bridgewater 25 025 0
35 10,963,875Cavendish 33 233 0
49 27,834,700Chester 50 049 0
197 114,613,600Hartford 176 0197 0
39 12,624,100Hartland 39 236 1
55 22,475,700Ludlow 54 055 0
55 34,474,700Norwich 56 055 0
44 16,659,760Plymouth 44 044 0
17 7,555,650Pomfret 17 017 0
35 12,382,096Reading 35 332 0
40 16,056,900Rochester 40 1228 0
59 15,653,200Royalton 55 058 1
30 11,928,444Sharon 30 129 0
136 135,230,849Springfield 132 13121 2
49 7,437,600Stockbridge 49 346 0
45 23,886,300Weathersfield 44 243 0
23 7,901,200West Windsor 22 023 0
19 7,093,490Weston 19 019 0
51 90,172,584Windsor 54 1932 0
72 56,506,700Woodstock 75 072 0
County Totals 1,204 $659,759,2241,180 591,141 4
STATE TOTALS: 10,614 $11,121,560,51610,464 8619,572 181

64
property tax Adjustment Credits
Many Vermont residents receive assistance with payment of the tax on their primary residence in the form of a property tax adjustment credit. Vermont towns and cities levied property taxes totaling $1.48 billion in FY2013 and $1.55 billion in FY2014. About 11% of that was paid in those two years by a payment made directly from the Department of Taxes to the municipality, not by the individual property owners.
Property tax relief is available to resident homeowners with certain household incomes who file a homestead declaration by April 15 of the year in which they are filing for relief. The homestead declaration is filed annually with the Department of Taxes, and the application for a property tax adjustment must be filed each year the property owner is eligible. Education Fund Tax Adjustments are credits towards the Homestead Education Tax portion of a homeowner’s property tax bill. For TY2015, 66% of all the homesteads in Vermont received this type or credit, totaling $150,629,373 of foregone revenue from the Education Fund.
Homeowners with household income of $47,000 or less are also eligible for a Circuit Breaker Adjustment that caps total property tax liability at 2%, 4.5%, or 5% of household income. The state reimburses municipalities for municipal property taxes forgone due to Circuit Breaker Adjustments. This money comes out of the Education Fund and the General Fund. In FY2016, 21% of households received a Circuit Breaker Adjustment, reducing their municipal taxes owed by the aggregate amount of $21,961,680.
Figure 1 lists the total cost of all property tax relief. Vermont recently began counting household income from a greater number of non-wage sources, which led to a reduction in the number of relief payments made.
Figure 1. Education Property Tax Adjustments by Year
Figure 2 on the following pages organizes property tax payments by municipality and county.
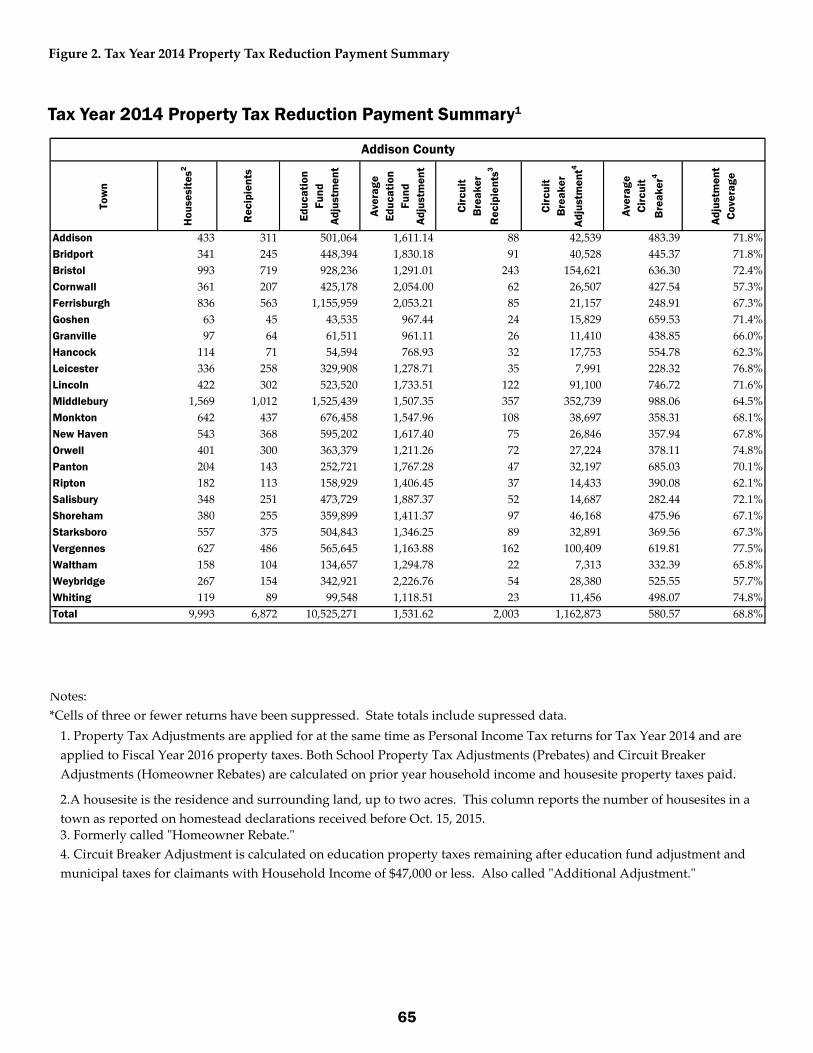
65
Figure 2. Tax Year 2014 Property Tax Reduction Payment Summary
Tow
n
Hou
sesi
tes2
Rec
ipie
nts
Educ
atio
n Fu
nd
Adju
stm
ent
Aver
age
Educ
atio
n Fu
nd
Adju
stm
ent
Circ
uit
Bre
aker
R
ecip
ient
s3
Circ
uit
Bre
aker
Ad
just
men
t4
Aver
age
Circ
uit
Bre
aker
4
Adju
stm
ent
Cove
rage
Addison 433 311 501,064 1,611.14 88 42,539 483.39 71.8%Bridport 341 245 448,394 1,830.18 91 40,528 445.37 71.8%Bristol 993 719 928,236 1,291.01 243 154,621 636.30 72.4%Cornwall 361 207 425,178 2,054.00 62 26,507 427.54 57.3%Ferrisburgh 836 563 1,155,959 2,053.21 85 21,157 248.91 67.3%Goshen 63 45 43,535 967.44 24 15,829 659.53 71.4%Granville 97 64 61,511 961.11 26 11,410 438.85 66.0%Hancock 114 71 54,594 768.93 32 17,753 554.78 62.3%Leicester 336 258 329,908 1,278.71 35 7,991 228.32 76.8%Lincoln 422 302 523,520 1,733.51 122 91,100 746.72 71.6%Middlebury 1,569 1,012 1,525,439 1,507.35 357 352,739 988.06 64.5%Monkton 642 437 676,458 1,547.96 108 38,697 358.31 68.1%New Haven 543 368 595,202 1,617.40 75 26,846 357.94 67.8%Orwell 401 300 363,379 1,211.26 72 27,224 378.11 74.8%Panton 204 143 252,721 1,767.28 47 32,197 685.03 70.1%Ripton 182 113 158,929 1,406.45 37 14,433 390.08 62.1%Salisbury 348 251 473,729 1,887.37 52 14,687 282.44 72.1%Shoreham 380 255 359,899 1,411.37 97 46,168 475.96 67.1%Starksboro 557 375 504,843 1,346.25 89 32,891 369.56 67.3%Vergennes 627 486 565,645 1,163.88 162 100,409 619.81 77.5%Waltham 158 104 134,657 1,294.78 22 7,313 332.39 65.8%Weybridge 267 154 342,921 2,226.76 54 28,380 525.55 57.7%Whiting 119 89 99,548 1,118.51 23 11,456 498.07 74.8%Total 9,993 6,872 10,525,271 1,531.62 2,003 1,162,873 580.57 68.8%
Addison County
Notes:
3. Formerly called "Homeowner Rebate." 4. Circuit Breaker Adjustment is calculated on education property taxes remaining after education fund adjustment and municipal taxes for claimants with Household Income of $47,000 or less. Also called "Additional Adjustment."
*Cells of three or fewer returns have been suppressed. State totals include supressed data.1. Property Tax Adjustments are applied for at the same time as Personal Income Tax returns for Tax Year 2014 and are applied to Fiscal Year 2016 property taxes. Both School Property Tax Adjustments (Prebates) and Circuit Breaker Adjustments (Homeowner Rebates) are calculated on prior year household income and housesite property taxes paid.
2.A housesite is the residence and surrounding land, up to two acres. This column reports the number of housesites in a town as reported on homestead declarations received before Oct. 15, 2015.
tax Year 2014 property tax Reduction payment Summary1
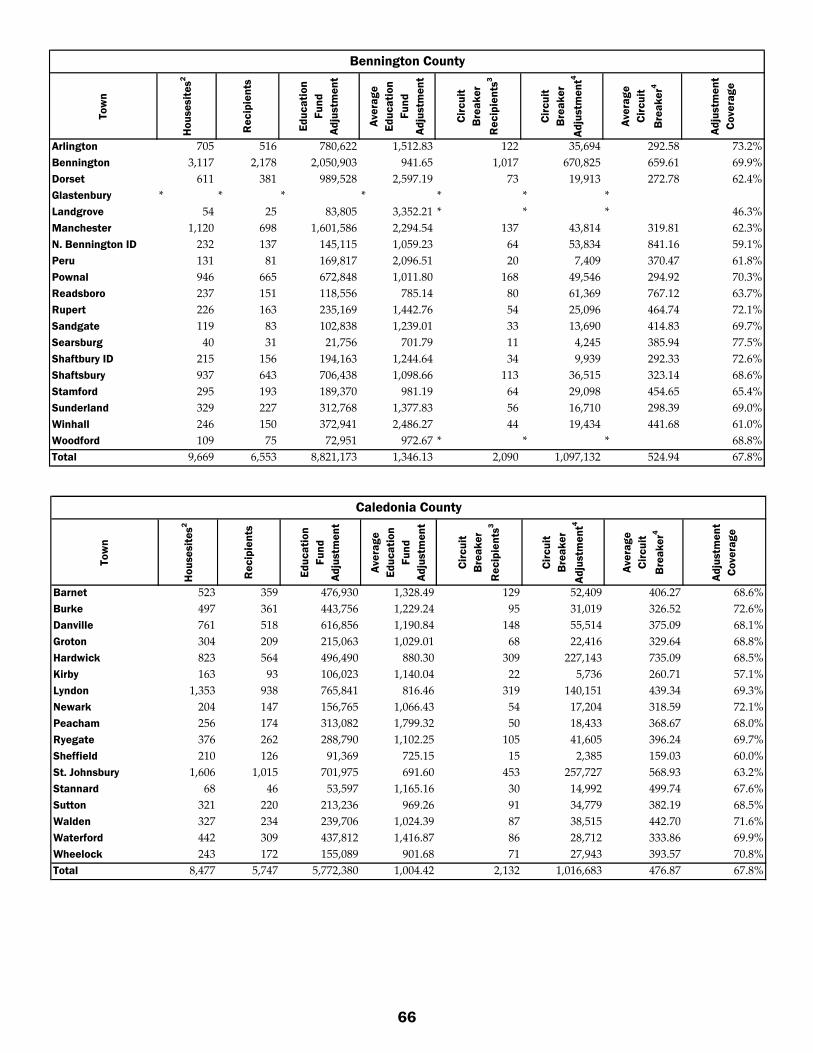
66
Tow
n
Hou
sesi
tes2
Rec
ipie
nts
Educ
atio
n Fu
nd
Adju
stm
ent
Aver
age
Educ
atio
n Fu
nd
Adju
stm
ent
Circ
uit
Bre
aker
R
ecip
ient
s3
Circ
uit
Bre
aker
Ad
just
men
t4
Aver
age
Circ
uit
Bre
aker
4
Adju
stm
ent
Cove
rage
Arlington 705 516 780,622 1,512.83 122 35,694 292.58 73.2%Bennington 3,117 2,178 2,050,903 941.65 1,017 670,825 659.61 69.9%Dorset 611 381 989,528 2,597.19 73 19,913 272.78 62.4%Glastenbury * * * * * * *Landgrove 54 25 83,805 3,352.21 * * * 46.3%Manchester 1,120 698 1,601,586 2,294.54 137 43,814 319.81 62.3%N. Bennington ID 232 137 145,115 1,059.23 64 53,834 841.16 59.1%Peru 131 81 169,817 2,096.51 20 7,409 370.47 61.8%Pownal 946 665 672,848 1,011.80 168 49,546 294.92 70.3%Readsboro 237 151 118,556 785.14 80 61,369 767.12 63.7%Rupert 226 163 235,169 1,442.76 54 25,096 464.74 72.1%Sandgate 119 83 102,838 1,239.01 33 13,690 414.83 69.7%Searsburg 40 31 21,756 701.79 11 4,245 385.94 77.5%Shaftbury ID 215 156 194,163 1,244.64 34 9,939 292.33 72.6%Shaftsbury 937 643 706,438 1,098.66 113 36,515 323.14 68.6%Stamford 295 193 189,370 981.19 64 29,098 454.65 65.4%Sunderland 329 227 312,768 1,377.83 56 16,710 298.39 69.0%Winhall 246 150 372,941 2,486.27 44 19,434 441.68 61.0%Woodford 109 75 72,951 972.67 * * * 68.8%Total 9,669 6,553 8,821,173 1,346.13 2,090 1,097,132 524.94 67.8%
Bennington County
Tow
n
Hou
sesi
tes2
Rec
ipie
nts
Educ
atio
n Fu
nd
Adju
stm
ent
Aver
age
Educ
atio
n Fu
nd
Adju
stm
ent
Circ
uit
Bre
aker
R
ecip
ient
s3
Circ
uit
Bre
aker
Ad
just
men
t4
Aver
age
Circ
uit
Bre
aker
4
Adju
stm
ent
Cove
rage
Barnet 523 359 476,930 1,328.49 129 52,409 406.27 68.6%Burke 497 361 443,756 1,229.24 95 31,019 326.52 72.6%Danville 761 518 616,856 1,190.84 148 55,514 375.09 68.1%Groton 304 209 215,063 1,029.01 68 22,416 329.64 68.8%Hardwick 823 564 496,490 880.30 309 227,143 735.09 68.5%Kirby 163 93 106,023 1,140.04 22 5,736 260.71 57.1%Lyndon 1,353 938 765,841 816.46 319 140,151 439.34 69.3%Newark 204 147 156,765 1,066.43 54 17,204 318.59 72.1%Peacham 256 174 313,082 1,799.32 50 18,433 368.67 68.0%Ryegate 376 262 288,790 1,102.25 105 41,605 396.24 69.7%Sheffield 210 126 91,369 725.15 15 2,385 159.03 60.0%St. Johnsbury 1,606 1,015 701,975 691.60 453 257,727 568.93 63.2%Stannard 68 46 53,597 1,165.16 30 14,992 499.74 67.6%Sutton 321 220 213,236 969.26 91 34,779 382.19 68.5%Walden 327 234 239,706 1,024.39 87 38,515 442.70 71.6%Waterford 442 309 437,812 1,416.87 86 28,712 333.86 69.9%Wheelock 243 172 155,089 901.68 71 27,943 393.57 70.8%Total 8,477 5,747 5,772,380 1,004.42 2,132 1,016,683 476.87 67.8%
Caledonia County

67
Tow
n
Hou
sesi
tes2
Rec
ipie
nts
Educ
atio
n Fu
nd
Adju
stm
ent
Aver
age
Educ
atio
n Fu
nd
Adju
stm
ent
Circ
uit
Bre
aker
R
ecip
ient
s3
Circ
uit
Bre
aker
Ad
just
men
t4
Aver
age
Circ
uit
Bre
aker
4
Adju
stm
ent
Cove
rage
Bolton 376 233 304,446 1,306.63 58 21,941 378.30 62.0%Buel's Gore * * * * * * *Burlington 5,945 3,841 7,032,793 1,830.98 1,317 1,180,952 896.70 64.6%Charlotte 1,147 505 1,494,879 2,960.16 59 15,536 263.33 44.0%Colchester 4,382 2,709 4,049,166 1,494.71 684 399,350 583.85 61.8%Essex Junction 2,568 1,745 2,810,071 1,610.36 450 400,198 889.33 68.0%Essex Town 3,168 1,883 3,241,957 1,721.70 422 201,356 477.15 59.4%Hinesburg 1,405 859 1,331,712 1,550.31 188 83,539 444.35 61.1%Huntington 633 435 646,950 1,487.24 130 74,870 575.92 68.7%Jericho 1,268 724 1,153,208 1,592.83 148 65,184 440.43 57.1%Jericho ID 350 187 314,990 1,684.44 43 19,991 464.91 53.4%Milton 3,150 2,299 3,043,999 1,324.05 486 200,602 412.76 73.0%Richmond 1,239 707 1,140,304 1,612.88 181 130,667 721.91 57.1%Shelburne 2,093 961 2,024,427 2,106.58 196 84,736 432.33 45.9%South Burlington 4,935 2,975 5,697,958 1,915.28 671 289,730 431.79 60.3%St. George 218 110 184,902 1,680.92 19 6,147 323.55 50.5%Underhill ID 188 120 203,231 1,693.59 24 16,067 669.44 63.8%Underhill Town 805 476 792,089 1,664.05 95 46,767 492.28 59.1%Westford 654 430 667,490 1,552.30 112 76,932 686.89 65.7%Williston 2,838 1,572 2,870,585 1,826.07 139 41,856 301.12 55.4%Winooski 1,080 859 1,107,324 1,289.08 327 379,970 1,161.99 79.5%Total 38,442 23,630 40,112,480 1,697.52 5,749 3,736,391 649.92 61.5%
Chittenden County
Tow
n
Hou
sesi
tes2
Rec
ipie
nts
Educ
atio
n Fu
nd
Adju
stm
ent
Aver
age
Educ
atio
n Fu
nd
Adju
stm
ent
Circ
uit
Bre
aker
R
ecip
ient
s3
Circ
uit
Bre
aker
Ad
just
men
t4
Aver
age
Circ
uit
Bre
aker
4
Adju
stm
ent
Cove
rage
Averill 10 * * * * * *Avery's Gore * * * * * * *Bloomfield 80 53 31,975 603.30 11 2,622 238.34 66.3%Brighton 320 226 181,338 802.38 88 37,316 424.05 70.6%Brunswick 34 26 16,541 636.18 * * * 76.5%Canaan 310 206 119,611 580.64 65 22,374 344.21 66.5%Concord 380 261 241,773 926.33 96 35,411 368.87 68.7%East Haven 99 66 26,786 405.85 21 7,072 336.75 66.7%Ferdinand 10 * * * * * *Granby 29 20 7,852 392.59 * * * 69.0%Guildhall 96 66 53,066 804.03 14 4,803 343.08 68.8%Lemington 41 31 20,431 659.08 * * * 75.6%Lewis * * * * * * *Lunenburg 385 266 150,407 565.44 104 33,030 317.59 69.1%Maidstone 65 51 59,961 1,175.71 * * * 78.5%Norton 60 48 40,173 836.94 * * * 80.0%Victory 36 31 34,075 1,099.18 * * * 86.1%Warner's Grant * * * * * * *Warren's Gore * * * * * * *Total 1,955 1,351 983,989 728.34 399 142,628 357.46 69.1%
Essex County

68
Tow
n
Hou
sesi
tes2
Rec
ipie
nts
Educ
atio
n Fu
nd
Adju
stm
ent
Aver
age
Educ
atio
n Fu
nd
Adju
stm
ent
Circ
uit
Bre
aker
R
ecip
ient
s3
Circ
uit
Bre
aker
Ad
just
men
t4
Aver
age
Circ
uit
Bre
aker
4
Adju
stm
ent
Cove
rage
Bakersfield 433 294 277,024 942.26 60 16,484 274.73 67.9%Berkshire 442 312 300,815 964.15 96 34,978 364.36 70.6%Enosburg 686 482 380,294 788.99 168 94,240 560.95 70.3%Fairfax 1,445 971 1,112,314 1,145.54 146 54,312 372.00 67.2%Fairfield 567 399 508,240 1,273.78 140 77,600 554.28 70.4%Fletcher 440 316 365,553 1,156.81 110 70,869 644.27 71.8%Franklin 440 298 244,116 819.18 52 14,307 275.13 67.7%Georgia 1,472 1,049 1,379,744 1,315.29 94 22,183 235.99 71.3%Highgate 1,023 765 777,201 1,015.95 71 11,291 159.03 74.8%Montgomery 367 268 266,585 994.72 58 18,506 319.07 73.0%Richford 565 381 221,448 581.23 134 55,605 414.96 67.4%Sheldon 610 457 493,040 1,078.86 78 23,578 302.28 74.9%St. Albans City 1,288 911 851,737 934.95 375 213,604 569.61 70.7%St. Albans Town 1,862 1,296 1,685,248 1,300.35 222 69,021 310.91 69.6%Swanton 1,885 1,368 1,437,037 1,050.47 251 119,403 475.71 72.6%Total 13,525 9,567 10,300,398 1,076.66 2,055 895,980 436.00 70.7%
Franklin County
Tow
n
Hou
sesi
tes2
Rec
ipie
nts
Educ
atio
n Fu
nd
Adju
stm
ent
Aver
age
Educ
atio
n Fu
nd
Adju
stm
ent
Circ
uit
Bre
aker
R
ecip
ient
s3
Circ
uit
Bre
aker
Ad
just
men
t4
Aver
age
Circ
uit
Bre
aker
4
Adju
stm
ent
Cove
rage
Alburg 608 427 534,502 1,251.76 78 18,674 239.41 70.2%Grand Isle 652 441 905,075 2,052.32 55 15,726 285.93 67.6%Isle La Motte 177 135 264,668 1,960.50 61 15,945 261.40 76.3%North Hero 330 213 463,559 2,176.33 31 12,209 393.85 64.5%South Hero 549 313 728,539 2,327.60 63 29,955 475.48 57.0%Total 2,316 1,529 2,896,343 1,894.27 288 92,510 321.21 66.0%
Grand Isle County
Tow
n
Hou
sesi
tes2
Rec
ipie
nts
Educ
atio
n Fu
nd
Adju
stm
ent
Aver
age
Educ
atio
n Fu
nd
Adju
stm
ent
Circ
uit
Bre
aker
R
ecip
ient
s3
Circ
uit
Bre
aker
Ad
just
men
t4
Aver
age
Circ
uit
Bre
aker
4
Adju
stm
ent
Cove
rage
Belvidere 111 77 74,939 973.23 31 12,350 398.37 69.4%Cambridge 990 676 864,622 1,279.03 113 38,160 337.70 68.3%Eden 389 277 246,219 888.88 75 21,706 289.42 71.2%Elmore 302 182 302,091 1,659.84 48 18,150 378.13 60.3%Hyde Park 923 663 747,181 1,126.97 270 146,331 541.97 71.8%Johnson 676 467 395,361 846.60 180 92,920 516.22 69.1%Morristown 1,372 967 1,264,498 1,307.65 416 303,142 728.71 70.5%Stowe 1,155 596 1,553,739 2,606.95 178 118,001 662.93 51.6%Waterville 216 160 182,005 1,137.53 32 10,623 331.97 74.1%Wolcott 499 381 460,488 1,208.63 163 88,860 545.15 76.4%Total 6,633 4,446 6,091,143 1,370.03 1,506 850,244 564.57 67.0%
Lamoille County

69
Tow
n
Hou
sesi
tes2
Rec
ipie
nts
Educ
atio
n Fu
nd
Adju
stm
ent
Aver
age
Educ
atio
n Fu
nd
Adju
stm
ent
Circ
uit
Bre
aker
R
ecip
ient
s3
Circ
uit
Bre
aker
Ad
just
men
t4
Aver
age
Circ
uit
Bre
aker
4
Adju
stm
ent
Cove
rage
Bradford 714 509 585,295 1,149.89 214 144,727 676.30 71.3%Braintree 394 262 233,145 889.87 119 60,638 509.56 66.5%Brookfield 409 269 263,447 979.36 85 29,830 350.95 65.8%Chelsea 377 275 253,415 921.51 98 36,636 373.83 72.9%Corinth 452 313 321,838 1,028.24 134 66,149 493.65 69.2%Fairlee 297 210 368,687 1,755.65 70 22,699 324.26 70.7%Newbury 566 398 405,844 1,019.71 110 44,953 408.66 70.3%Orange 381 292 297,304 1,018.16 73 23,935 327.87 76.6%Randolph 1,151 767 773,984 1,009.11 327 250,227 765.22 66.6%Strafford 376 242 439,337 1,815.44 95 89,640 943.58 64.4%Thetford 901 590 1,121,795 1,901.35 212 124,889 589.10 65.5%Topsham 385 279 248,436 890.45 118 50,394 427.07 72.5%Tunbridge 432 303 390,862 1,289.98 113 69,194 612.34 70.1%Vershire 222 157 204,590 1,303.12 89 66,553 747.79 70.7%Washington 351 258 264,329 1,024.53 55 17,286 314.29 73.5%Wells River 81 61 51,865 850.24 35 26,302 751.49 75.3%West Fairlee 203 137 197,420 1,441.02 69 50,593 733.23 67.5%Williamstown 1,036 705 622,582 883.10 148 51,451 347.64 68.1%Total 8,728 6,027 7,044,175 1,168.77 2,164 1,226,096 566.59 69.1%
Orange County
Tow
n
Hou
sesi
tes2
Rec
ipie
nts
Educ
atio
n Fu
nd
Adju
stm
ent
Aver
age
Educ
atio
n Fu
nd
Adju
stm
ent
Circ
uit
Bre
aker
R
ecip
ient
s3
Circ
uit
Bre
aker
Ad
just
men
t4
Aver
age
Circ
uit
Bre
aker
4
Adju
stm
ent
Cove
rage
Albany 310 241 297,517 1,234.51 100 38,339 383.39 77.7%Barton 555 408 295,332 723.85 149 83,457 560.12 73.5%Brownington 311 234 189,067 807.98 92 37,109 403.36 75.2%Charleston 348 248 188,008 758.10 87 35,872 412.32 71.3%Coventry 336 237 215,909 911.01 17 744 43.79 70.5%Craftsbury 363 261 343,438 1,315.85 127 55,838 439.67 71.9%Derby 1,470 1,029 1,120,238 1,088.67 212 65,281 307.93 70.0%Glover 370 260 274,984 1,057.63 87 34,690 398.73 70.3%Greensboro 251 164 242,346 1,477.72 79 40,541 513.18 65.3%Holland 221 155 94,101 607.10 71 35,592 501.29 70.1%Irasburg 382 274 193,106 704.77 58 14,170 244.31 71.7%Jay 158 117 179,741 1,536.25 25 6,384 255.38 74.1%Lowell 254 179 132,329 739.27 10 166 16.65 70.5%Morgan 242 170 276,910 1,628.88 28 5,664 202.29 70.2%Newport City 979 643 455,430 708.29 350 239,292 683.69 65.7%Newport Town 514 370 481,308 1,300.83 94 30,028 319.45 72.0%Orleans 230 136 70,864 521.06 81 48,591 599.88 59.1%Troy 490 360 295,971 822.14 125 47,144 377.15 73.5%Westfield 180 130 172,358 1,325.83 56 26,010 464.47 72.2%Westmore 151 121 197,012 1,628.19 38 14,811 389.75 80.1%Total 8,115 5,737 5,715,971 996.33 1,886 859,723 455.84 70.7%
Orleans County

70
Tow
n
Hou
sesi
tes2
Rec
ipie
nts
Educ
atio
n Fu
nd
Adju
stm
ent
Aver
age
Educ
atio
n Fu
nd
Adju
stm
ent
Circ
uit
Bre
aker
R
ecip
ient
s3
Circ
uit
Bre
aker
Ad
just
men
t4
Aver
age
Circ
uit
Bre
aker
4
Adju
stm
ent
Cove
rage
Benson 281 195 197,870 1,014.72 66 26,446 400.70 69.4%Brandon 1,128 767 746,873 973.76 305 217,804 714.11 68.0%Castleton 1,056 713 881,373 1,236.15 158 57,008 360.81 67.5%Chittenden 405 258 365,428 1,416.39 70 35,861 512.30 63.7%Clarendon 800 578 625,908 1,082.89 155 52,841 340.91 72.3%Danby 372 259 323,433 1,248.77 88 37,906 430.75 69.6%Fair Haven 685 422 300,523 712.14 231 137,346 594.57 61.6%Hubbardton 241 174 222,465 1,278.54 84 61,140 727.86 72.2%Ira 140 101 101,359 1,003.55 22 7,919 359.93 72.1%Killington 272 176 402,497 2,286.91 40 12,778 319.46 64.7%Mendon 356 203 253,085 1,246.72 50 29,944 598.88 57.0%Middletown Springs 264 186 296,619 1,594.73 77 36,188 469.98 70.5%Mt. Holly 407 287 447,256 1,558.38 86 29,650 344.77 70.5%Mt. Tabor 59 47 56,819 1,208.91 * * * 79.7%Pawlet 415 278 362,987 1,305.71 95 40,676 428.17 67.0%Pittsfield 156 107 180,663 1,688.44 46 30,467 662.33 68.6%Pittsford 891 601 688,018 1,144.79 168 65,834 391.87 67.5%Poultney 788 530 601,747 1,135.37 165 64,777 392.59 67.3%Proctor 501 298 233,245 782.70 139 83,917 603.72 59.5%Rutland City 3,496 2,097 1,578,361 752.68 1,143 1,330,522 1,164.06 60.0%Rutland Town 1,220 771 1,008,258 1,307.73 32 5,676 177.38 63.2%Shrewsbury 366 228 261,138 1,145.34 53 24,070 454.14 62.3%Sudbury 201 140 193,743 1,383.88 21 6,280 299.05 69.7%Tinmouth 183 137 214,740 1,567.45 65 33,254 511.61 74.9%Wallingford 681 452 581,480 1,286.46 103 27,051 262.63 66.4%Wells 381 260 271,084 1,042.63 68 19,553 287.54 68.2%West Haven 77 61 63,451 1,040.19 21 11,261 536.25 79.2%West Rutland 665 441 384,672 872.27 181 76,626 423.35 66.3%Total 16,487 10,767 11,845,097 1,100.13 3,732 2,562,796 686.71 65.3%
Rutland County
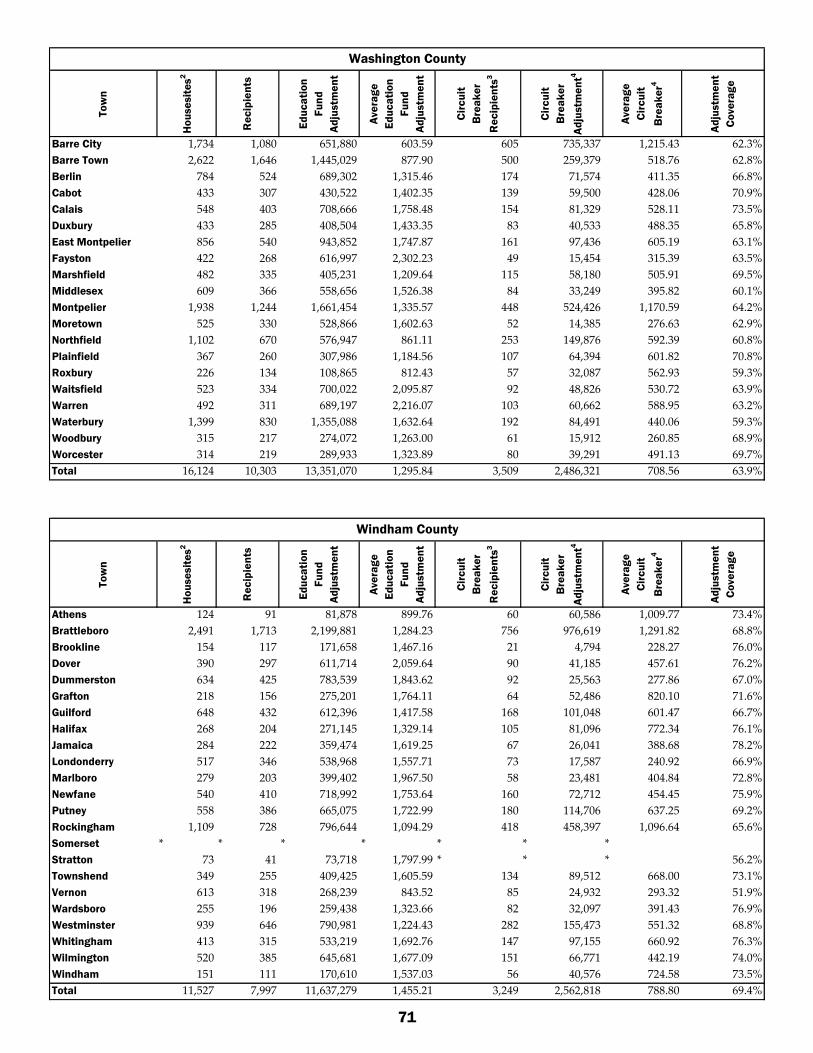
71
Tow
n
Hou
sesi
tes2
Rec
ipie
nts
Educ
atio
n Fu
nd
Adju
stm
ent
Aver
age
Educ
atio
n Fu
nd
Adju
stm
ent
Circ
uit
Bre
aker
R
ecip
ient
s3
Circ
uit
Bre
aker
Ad
just
men
t4
Aver
age
Circ
uit
Bre
aker
4
Adju
stm
ent
Cove
rage
Barre City 1,734 1,080 651,880 603.59 605 735,337 1,215.43 62.3%Barre Town 2,622 1,646 1,445,029 877.90 500 259,379 518.76 62.8%Berlin 784 524 689,302 1,315.46 174 71,574 411.35 66.8%Cabot 433 307 430,522 1,402.35 139 59,500 428.06 70.9%Calais 548 403 708,666 1,758.48 154 81,329 528.11 73.5%Duxbury 433 285 408,504 1,433.35 83 40,533 488.35 65.8%East Montpelier 856 540 943,852 1,747.87 161 97,436 605.19 63.1%Fayston 422 268 616,997 2,302.23 49 15,454 315.39 63.5%Marshfield 482 335 405,231 1,209.64 115 58,180 505.91 69.5%Middlesex 609 366 558,656 1,526.38 84 33,249 395.82 60.1%Montpelier 1,938 1,244 1,661,454 1,335.57 448 524,426 1,170.59 64.2%Moretown 525 330 528,866 1,602.63 52 14,385 276.63 62.9%Northfield 1,102 670 576,947 861.11 253 149,876 592.39 60.8%Plainfield 367 260 307,986 1,184.56 107 64,394 601.82 70.8%Roxbury 226 134 108,865 812.43 57 32,087 562.93 59.3%Waitsfield 523 334 700,022 2,095.87 92 48,826 530.72 63.9%Warren 492 311 689,197 2,216.07 103 60,662 588.95 63.2%Waterbury 1,399 830 1,355,088 1,632.64 192 84,491 440.06 59.3%Woodbury 315 217 274,072 1,263.00 61 15,912 260.85 68.9%Worcester 314 219 289,933 1,323.89 80 39,291 491.13 69.7%Total 16,124 10,303 13,351,070 1,295.84 3,509 2,486,321 708.56 63.9%
Washington County
Tow
n
Hou
sesi
tes2
Rec
ipie
nts
Educ
atio
n Fu
nd
Adju
stm
ent
Aver
age
Educ
atio
n Fu
nd
Adju
stm
ent
Circ
uit
Bre
aker
R
ecip
ient
s3
Circ
uit
Bre
aker
Ad
just
men
t4
Aver
age
Circ
uit
Bre
aker
4
Adju
stm
ent
Cove
rage
Athens 124 91 81,878 899.76 60 60,586 1,009.77 73.4%Brattleboro 2,491 1,713 2,199,881 1,284.23 756 976,619 1,291.82 68.8%Brookline 154 117 171,658 1,467.16 21 4,794 228.27 76.0%Dover 390 297 611,714 2,059.64 90 41,185 457.61 76.2%Dummerston 634 425 783,539 1,843.62 92 25,563 277.86 67.0%Grafton 218 156 275,201 1,764.11 64 52,486 820.10 71.6%Guilford 648 432 612,396 1,417.58 168 101,048 601.47 66.7%Halifax 268 204 271,145 1,329.14 105 81,096 772.34 76.1%Jamaica 284 222 359,474 1,619.25 67 26,041 388.68 78.2%Londonderry 517 346 538,968 1,557.71 73 17,587 240.92 66.9%Marlboro 279 203 399,402 1,967.50 58 23,481 404.84 72.8%Newfane 540 410 718,992 1,753.64 160 72,712 454.45 75.9%Putney 558 386 665,075 1,722.99 180 114,706 637.25 69.2%Rockingham 1,109 728 796,644 1,094.29 418 458,397 1,096.64 65.6%Somerset * * * * * * *Stratton 73 41 73,718 1,797.99 * * * 56.2%Townshend 349 255 409,425 1,605.59 134 89,512 668.00 73.1%Vernon 613 318 268,239 843.52 85 24,932 293.32 51.9%Wardsboro 255 196 259,438 1,323.66 82 32,097 391.43 76.9%Westminster 939 646 790,981 1,224.43 282 155,473 551.32 68.8%Whitingham 413 315 533,219 1,692.76 147 97,155 660.92 76.3%Wilmington 520 385 645,681 1,677.09 151 66,771 442.19 74.0%Windham 151 111 170,610 1,537.03 56 40,576 724.58 73.5%Total 11,527 7,997 11,637,279 1,455.21 3,249 2,562,818 788.80 69.4%
Windham County

72
Tow
n
Hou
sesi
tes2
Rec
ipie
nts
Educ
atio
n Fu
nd
Adju
stm
ent
Aver
age
Educ
atio
n Fu
nd
Adju
stm
ent
Circ
uit
Bre
aker
R
ecip
ient
s3
Circ
uit
Bre
aker
Ad
just
men
t4
Aver
age
Circ
uit
Bre
aker
4
Adju
stm
ent
Cove
rage
Andover 173 129 219,767 1,703.62 28 10,839 387.12 74.6%Baltimore 80 60 61,537 1,025.62 13 4,491 345.48 75.0%Barnard 312 204 500,096 2,451.45 60 22,902 381.70 65.4%Bethel 556 367 420,376 1,145.44 169 123,454 730.50 66.0%Bridgewater 283 188 279,847 1,488.55 59 19,034 322.61 66.4%Cavendish 417 297 397,107 1,337.06 92 31,898 346.71 71.2%Chester 884 684 1,017,908 1,488.17 295 189,520 642.44 77.4%Hartford 2,667 1,708 2,186,857 1,280.36 637 547,006 858.72 64.0%Hartland 1,045 677 1,082,479 1,598.93 213 89,104 418.33 64.8%Ludlow 551 384 777,758 2,025.41 113 41,545 367.65 69.7%Norwich 1,026 393 1,148,402 2,922.14 114 97,129 852.01 38.3%Plymouth 179 134 319,758 2,386.25 45 17,029 378.42 74.9%Pomfret 268 158 315,188 1,994.86 34 12,195 358.68 59.0%Reading 221 156 284,996 1,826.90 63 20,892 331.62 70.6%Rochester 345 235 256,886 1,093.13 74 32,475 438.85 68.1%Royalton 652 479 575,391 1,201.23 203 107,148 527.82 73.5%Sharon 418 281 352,918 1,255.94 106 62,789 592.35 67.2%Springfield 2,353 1,526 1,553,244 1,017.85 868 1,179,987 1,359.43 64.9%Stockbridge 240 153 200,034 1,307.41 53 25,587 482.77 63.8%Weathersfield 987 678 831,813 1,226.86 277 122,725 443.05 68.7%West Windsor 409 258 579,521 2,246.21 83 43,386 522.72 63.1%Weston 201 113 209,958 1,858.03 35 16,987 485.35 56.2%Windsor 853 581 580,112 998.47 279 332,256 1,190.88 68.1%Woodstock 861 519 1,356,577 2,613.83 164 105,245 641.74 60.3%Total 15,981 10,362 15,508,530 1,496.67 4,077 3,255,623 798.53 64.8%
Windsor County
Hou
sesi
tes2
Rec
ipie
nts
Educ
atio
n Fu
nd
Adju
stm
ent
Aver
age
Educ
atio
n Fu
nd
Adju
stm
ent
Circ
uit
Bre
aker
R
ecip
ient
s3
Circ
uit
Bre
aker
Ad
just
men
t4
Aver
age
Circ
uit
Bre
aker
4
Adju
stm
ent
Cove
rage
State Total 167,984 110,912 150,629,373 1,358.10 34,888 21,961,680 629.49 66.0%

73
taxes and tax Rates
The 2015 taxes and tax rates shown in Figure 2 are the rates for FY2016. These rates were levied on the April 1, 2015, grand lists. State education rates are set by the commissioner of taxes under 32 V.S.A. § 5402. Municipal rates are, for the most part, set by the municipal legislative body under 17 V.S.A. § 2664.
Some municipalities also set a local agreement rate under 32 V.S.A. § 5404a(d). This rate, which is generally relatively small, is levied on the municipal grand list to raise funds to pay the education tax obligation of the municipality resulting from local agreements, e.g., voted exemptions, stabilization agreements, etc. Those rates are included in the “Municipal/Local Agr (Agreement) Tax Rate” column in Figure 2.
Both the homestead and the nonresidential rates rose again this year. The FY2016 base rates were $0.99 and $1.535, respectively.
Figure 1. Education Base Rates for Homesteads and Nonresidential Properties

74
Figure 2. 2015 Taxes and Tax Rates
2015 Taxes and Tax Rates
Town Name
Education Homestead
Tax Rate
Municipal / Local Agr Tax Rate
Education Homestead
TaxesMunicipal
Taxes
Addison Education
NonResidential Taxes
Education Residential
Tax RateNon-Residential Non-Residential
0.38921.52591,852,073 788,213Addison 1,139,667 1.3943
0.53051.83691,497,973 739,193Bridport 922,920 1.5768
0.67381.67893,002,062 1,924,825Bristol 1,811,881 1.6419
0.301800 345,695Bristol Police Distr 0 0
0.46611.63372,053,154 925,401Cornwall 1,026,226 1.4067
0.26731.63274,131,743 1,387,684Ferrisburgh 3,962,449 1.4946
0.85451.1982137,600 210,193Goshen 185,298 1.4097
0.58171.2839201,732 238,534Granville 392,182 1.5466
0.91001.6896255,342 316,355Hancock 248,629 1.3908
0.26491.39641,011,325 459,652Leicester 1,435,670 1.4002
0.64381.53461,611,734 1,099,901Lincoln 993,446 1.4857
0.98201.84315,898,884 7,083,295Middlebury 6,769,099 1.6780
0.070000 33,736Middlebury Dtown 0 0
0.47071.90642,676,738 868,098Monkton 815,447 1.7926
0.37501.59862,274,021 984,904New Haven 1,758,418 1.5210
0.44191.34361,232,005 639,881Orwell 778,873 1.4778
0.55581.5518927,744 557,695Panton 611,599 1.4998
0.50581.8507669,576 311,273Ripton 413,264 1.5538
0.28761.78721,454,808 539,112Salisbury 1,650,222 1.5532
0.53551.71871,441,351 755,917Shoreham 849,334 1.4748
0.45581.71921,869,045 730,412Starksboro 847,739 1.6285
0.75341.50841,768,717 1,645,434Vergennes 1,502,192 1.4699
0.38001.6575579,779 168,270Waltham 144,947 1.6080
0.44452.05811,675,388 571,336Weybridge 742,179 1.5679
0.53221.4836355,619 179,350Whiting 144,057 1.5067
County Totals 38,578,414 23,504,35929,145,737
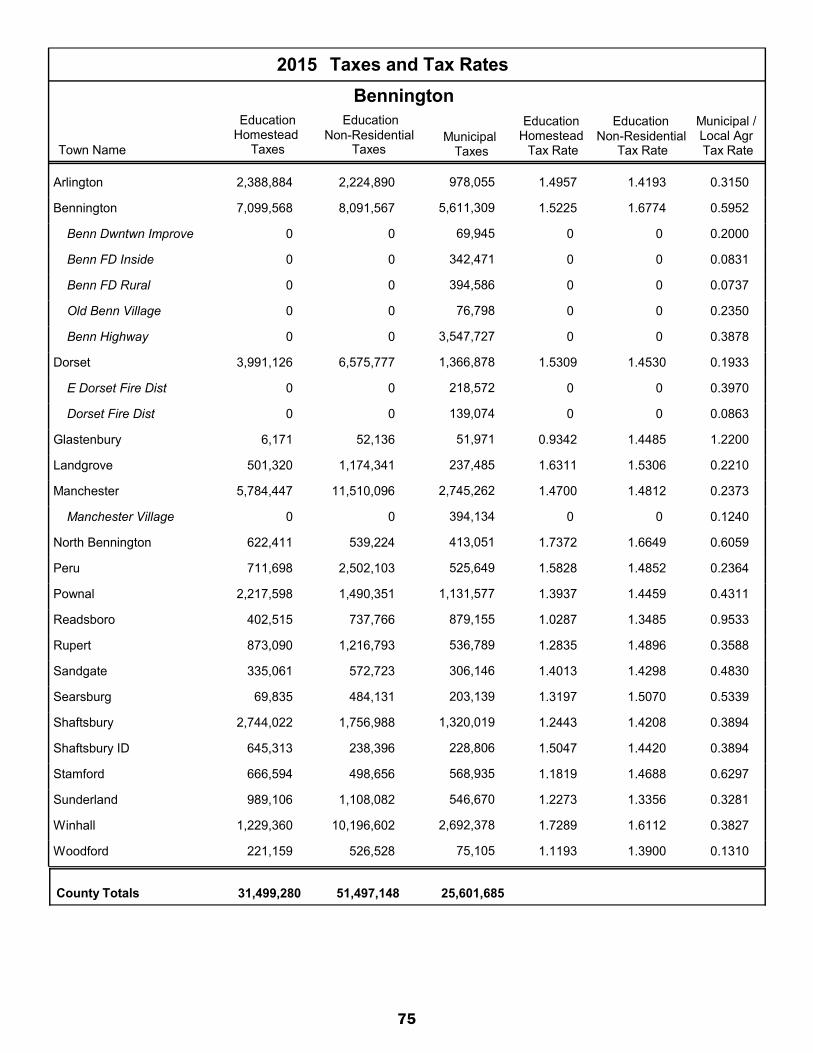
75
2015 Taxes and Tax Rates
Town Name
Education Homestead
Tax Rate
Municipal / Local Agr Tax Rate
Education Homestead
TaxesMunicipal
Taxes
Bennington Education
NonResidential Taxes
Education Residential
Tax RateNon-Residential Non-Residential
0.31501.49572,388,884 978,055Arlington 2,224,890 1.4193
0.59521.52257,099,568 5,611,309Bennington 8,091,567 1.6774
0.200000 69,945Benn Dwntwn Improve 0 0
0.083100 342,471Benn FD Inside 0 0
0.073700 394,586Benn FD Rural 0 0
0.235000 76,798Old Benn Village 0 0
0.387800 3,547,727Benn Highway 0 0
0.19331.53093,991,126 1,366,878Dorset 6,575,777 1.4530
0.397000 218,572E Dorset Fire Dist 0 0
0.086300 139,074Dorset Fire Dist 0 0
1.22000.93426,171 51,971Glastenbury 52,136 1.4485
0.22101.6311501,320 237,485Landgrove 1,174,341 1.5306
0.23731.47005,784,447 2,745,262Manchester 11,510,096 1.4812
0.124000 394,134Manchester Village 0 0
0.60591.7372622,411 413,051North Bennington 539,224 1.6649
0.23641.5828711,698 525,649Peru 2,502,103 1.4852
0.43111.39372,217,598 1,131,577Pownal 1,490,351 1.4459
0.95331.0287402,515 879,155Readsboro 737,766 1.3485
0.35881.2835873,090 536,789Rupert 1,216,793 1.4896
0.48301.4013335,061 306,146Sandgate 572,723 1.4298
0.53391.319769,835 203,139Searsburg 484,131 1.5070
0.38941.24432,744,022 1,320,019Shaftsbury 1,756,988 1.4208
0.38941.5047645,313 228,806Shaftsbury ID 238,396 1.4420
0.62971.1819666,594 568,935Stamford 498,656 1.4688
0.32811.2273989,106 546,670Sunderland 1,108,082 1.3356
0.38271.72891,229,360 2,692,378Winhall 10,196,602 1.6112
0.13101.1193221,159 75,105Woodford 526,528 1.3900
County Totals 31,499,280 25,601,68551,497,148
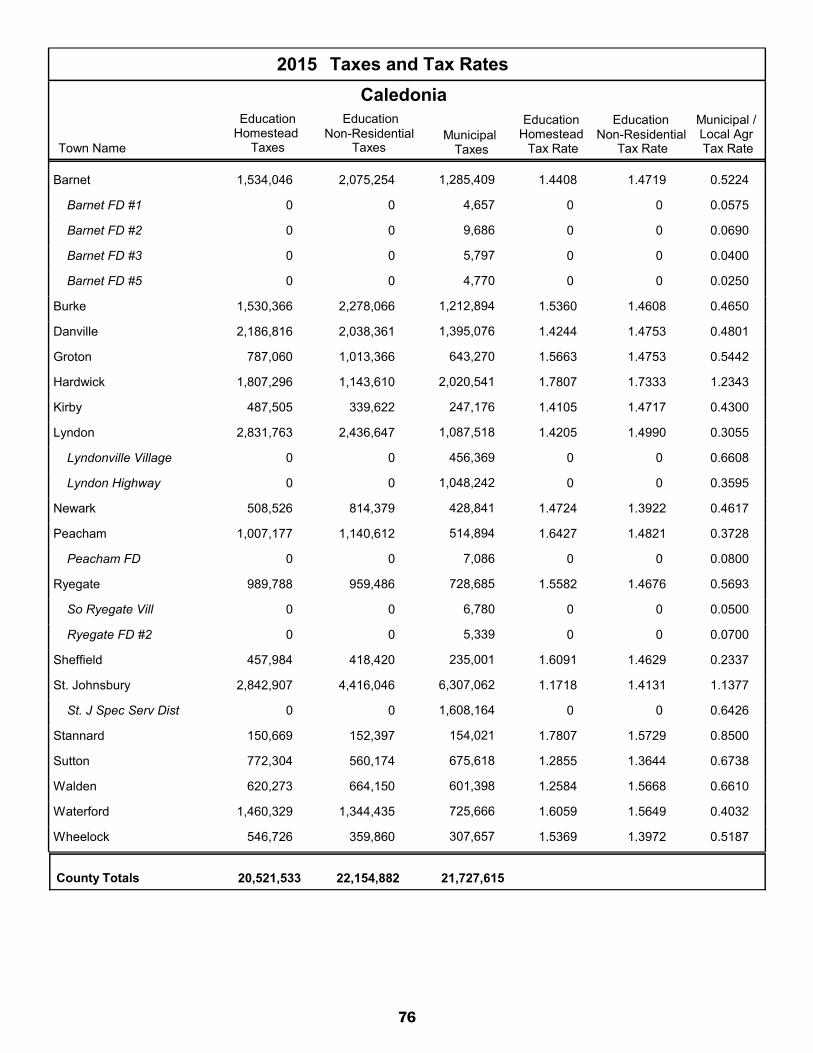
76
2015 Taxes and Tax Rates
Town Name
Education Homestead
Tax Rate
Municipal / Local Agr Tax Rate
Education Homestead
TaxesMunicipal
Taxes
Caledonia Education
NonResidential Taxes
Education Residential
Tax RateNon-Residential Non-Residential
0.52241.44081,534,046 1,285,409Barnet 2,075,254 1.4719
0.057500 4,657Barnet FD #1 0 0
0.069000 9,686Barnet FD #2 0 0
0.040000 5,797Barnet FD #3 0 0
0.025000 4,770Barnet FD #5 0 0
0.46501.53601,530,366 1,212,894Burke 2,278,066 1.4608
0.48011.42442,186,816 1,395,076Danville 2,038,361 1.4753
0.54421.5663787,060 643,270Groton 1,013,366 1.4753
1.23431.78071,807,296 2,020,541Hardwick 1,143,610 1.7333
0.43001.4105487,505 247,176Kirby 339,622 1.4717
0.30551.42052,831,763 1,087,518Lyndon 2,436,647 1.4990
0.660800 456,369Lyndonville Village 0 0
0.359500 1,048,242Lyndon Highway 0 0
0.46171.4724508,526 428,841Newark 814,379 1.3922
0.37281.64271,007,177 514,894Peacham 1,140,612 1.4821
0.080000 7,086Peacham FD 0 0
0.56931.5582989,788 728,685Ryegate 959,486 1.4676
0.050000 6,780So Ryegate Vill 0 0
0.070000 5,339Ryegate FD #2 0 0
0.23371.6091457,984 235,001Sheffield 418,420 1.4629
1.13771.17182,842,907 6,307,062St. Johnsbury 4,416,046 1.4131
0.642600 1,608,164St. J Spec Serv Dist 0 0
0.85001.7807150,669 154,021Stannard 152,397 1.5729
0.67381.2855772,304 675,618Sutton 560,174 1.3644
0.66101.2584620,273 601,398Walden 664,150 1.5668
0.40321.60591,460,329 725,666Waterford 1,344,435 1.5649
0.51871.5369546,726 307,657Wheelock 359,860 1.3972
County Totals 20,521,533 21,727,61522,154,882
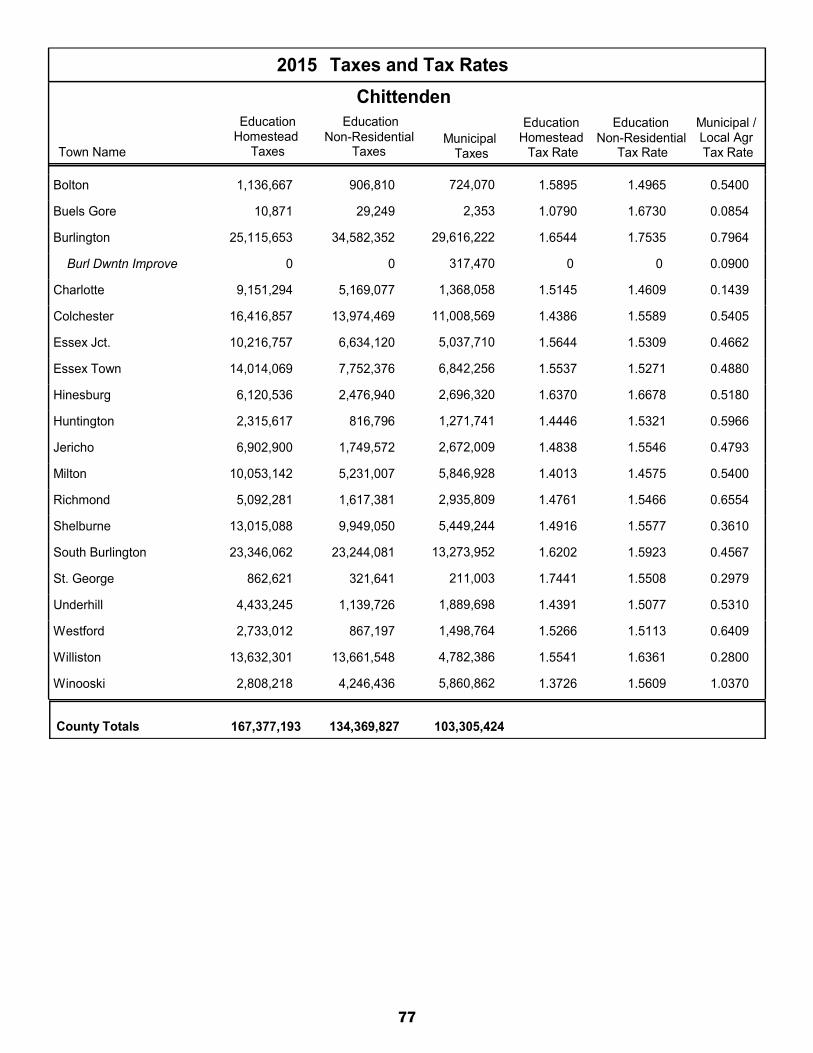
77
2015 Taxes and Tax Rates
Town Name
Education Homestead
Tax Rate
Municipal / Local Agr Tax Rate
Education Homestead
TaxesMunicipal
Taxes
Chittenden Education
NonResidential Taxes
Education Residential
Tax RateNon-Residential Non-Residential
0.54001.58951,136,667 724,070Bolton 906,810 1.4965
0.08541.079010,871 2,353Buels Gore 29,249 1.6730
0.79641.654425,115,653 29,616,222Burlington 34,582,352 1.7535
0.090000 317,470Burl Dwntn Improve 0 0
0.14391.51459,151,294 1,368,058Charlotte 5,169,077 1.4609
0.54051.438616,416,857 11,008,569Colchester 13,974,469 1.5589
0.46621.564410,216,757 5,037,710Essex Jct. 6,634,120 1.5309
0.48801.553714,014,069 6,842,256Essex Town 7,752,376 1.5271
0.51801.63706,120,536 2,696,320Hinesburg 2,476,940 1.6678
0.59661.44462,315,617 1,271,741Huntington 816,796 1.5321
0.47931.48386,902,900 2,672,009Jericho 1,749,572 1.5546
0.54001.401310,053,142 5,846,928Milton 5,231,007 1.4575
0.65541.47615,092,281 2,935,809Richmond 1,617,381 1.5466
0.36101.491613,015,088 5,449,244Shelburne 9,949,050 1.5577
0.45671.620223,346,062 13,273,952South Burlington 23,244,081 1.5923
0.29791.7441862,621 211,003St. George 321,641 1.5508
0.53101.43914,433,245 1,889,698Underhill 1,139,726 1.5077
0.64091.52662,733,012 1,498,764Westford 867,197 1.5113
0.28001.554113,632,301 4,782,386Williston 13,661,548 1.6361
1.03701.37262,808,218 5,860,862Winooski 4,246,436 1.5609
County Totals 167,377,193 103,305,424134,369,827
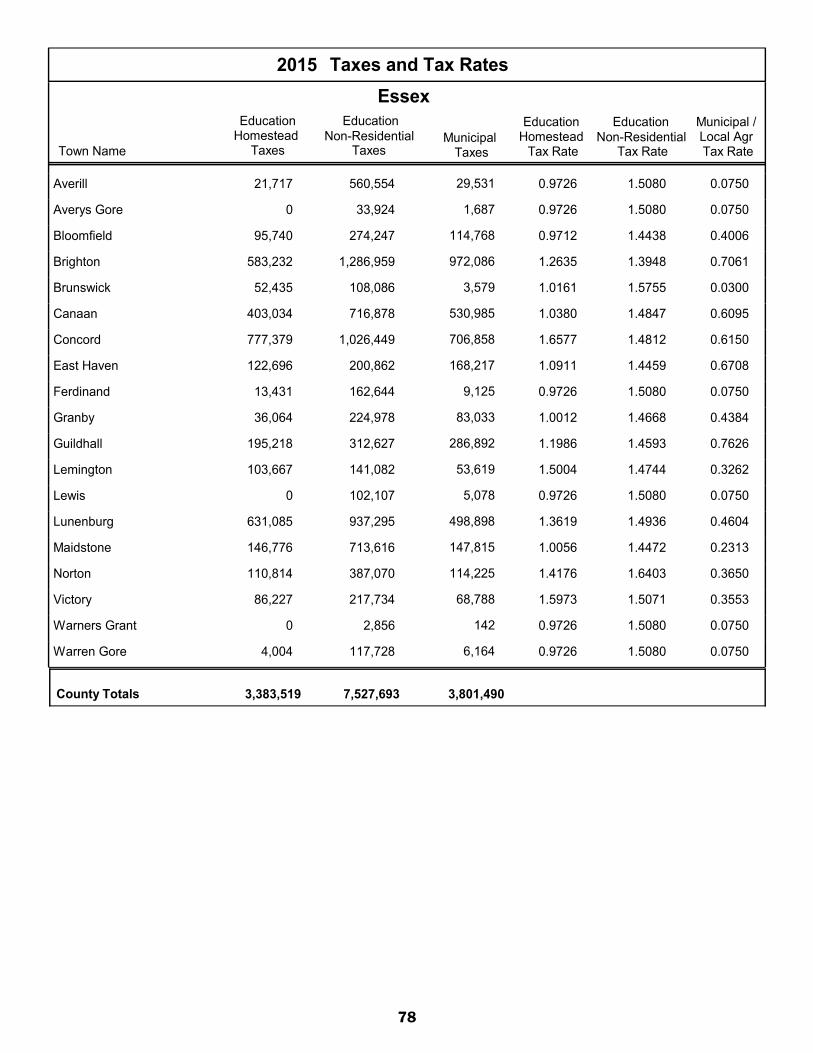
78
2015 Taxes and Tax Rates
Town Name
Education Homestead
Tax Rate
Municipal / Local Agr Tax Rate
Education Homestead
TaxesMunicipal
Taxes
Essex Education
NonResidential Taxes
Education Residential
Tax RateNon-Residential Non-Residential
0.07500.972621,717 29,531Averill 560,554 1.5080
0.07500.97260 1,687Averys Gore 33,924 1.5080
0.40060.971295,740 114,768Bloomfield 274,247 1.4438
0.70611.2635583,232 972,086Brighton 1,286,959 1.3948
0.03001.016152,435 3,579Brunswick 108,086 1.5755
0.60951.0380403,034 530,985Canaan 716,878 1.4847
0.61501.6577777,379 706,858Concord 1,026,449 1.4812
0.67081.0911122,696 168,217East Haven 200,862 1.4459
0.07500.972613,431 9,125Ferdinand 162,644 1.5080
0.43841.001236,064 83,033Granby 224,978 1.4668
0.76261.1986195,218 286,892Guildhall 312,627 1.4593
0.32621.5004103,667 53,619Lemington 141,082 1.4744
0.07500.97260 5,078Lewis 102,107 1.5080
0.46041.3619631,085 498,898Lunenburg 937,295 1.4936
0.23131.0056146,776 147,815Maidstone 713,616 1.4472
0.36501.4176110,814 114,225Norton 387,070 1.6403
0.35531.597386,227 68,788Victory 217,734 1.5071
0.07500.97260 142Warners Grant 2,856 1.5080
0.07500.97264,004 6,164Warren Gore 117,728 1.5080
County Totals 3,383,519 3,801,4907,527,693
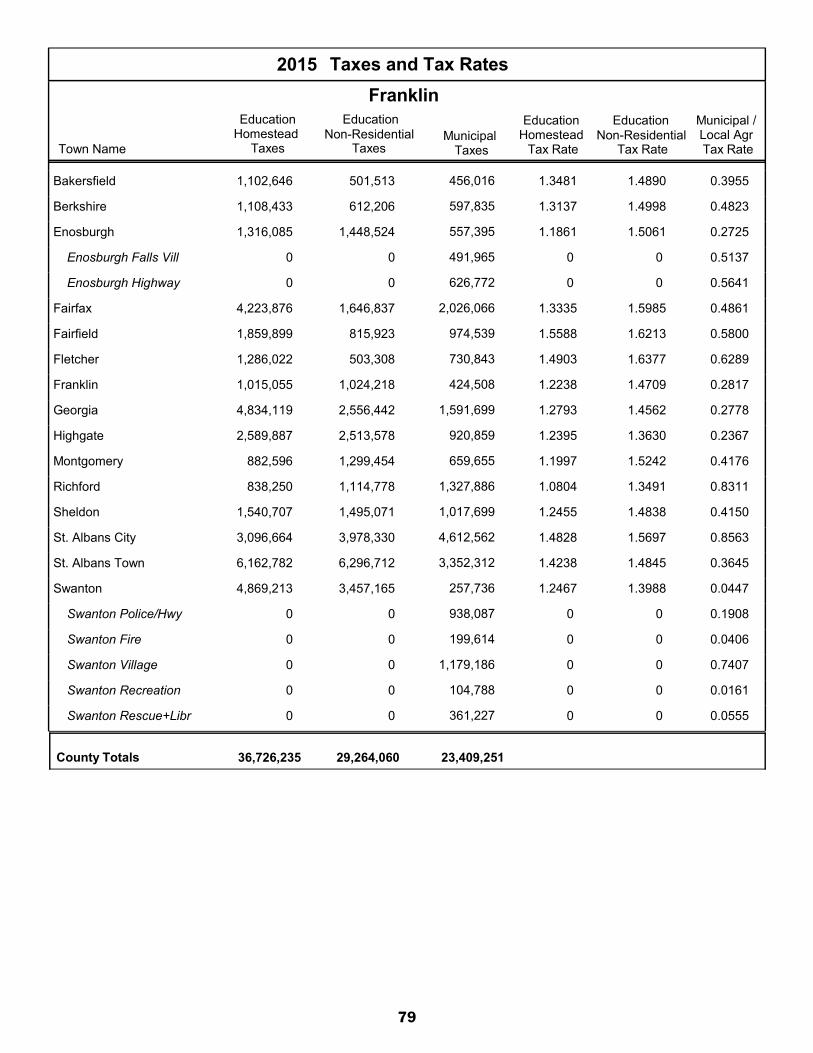
79
2015 Taxes and Tax Rates
Town Name
Education Homestead
Tax Rate
Municipal / Local Agr Tax Rate
Education Homestead
TaxesMunicipal
Taxes
Franklin Education
NonResidential Taxes
Education Residential
Tax RateNon-Residential Non-Residential
0.39551.34811,102,646 456,016Bakersfield 501,513 1.4890
0.48231.31371,108,433 597,835Berkshire 612,206 1.4998
0.27251.18611,316,085 557,395Enosburgh 1,448,524 1.5061
0.513700 491,965Enosburgh Falls Vill 0 0
0.564100 626,772Enosburgh Highway 0 0
0.48611.33354,223,876 2,026,066Fairfax 1,646,837 1.5985
0.58001.55881,859,899 974,539Fairfield 815,923 1.6213
0.62891.49031,286,022 730,843Fletcher 503,308 1.6377
0.28171.22381,015,055 424,508Franklin 1,024,218 1.4709
0.27781.27934,834,119 1,591,699Georgia 2,556,442 1.4562
0.23671.23952,589,887 920,859Highgate 2,513,578 1.3630
0.41761.1997882,596 659,655Montgomery 1,299,454 1.5242
0.83111.0804838,250 1,327,886Richford 1,114,778 1.3491
0.41501.24551,540,707 1,017,699Sheldon 1,495,071 1.4838
0.85631.48283,096,664 4,612,562St. Albans City 3,978,330 1.5697
0.36451.42386,162,782 3,352,312St. Albans Town 6,296,712 1.4845
0.04471.24674,869,213 257,736Swanton 3,457,165 1.3988
0.190800 938,087Swanton Police/Hwy 0 0
0.040600 199,614Swanton Fire 0 0
0.740700 1,179,186Swanton Village 0 0
0.016100 104,788Swanton Recreation 0 0
0.055500 361,227Swanton Rescue+Libr 0 0
County Totals 36,726,235 23,409,25129,264,060
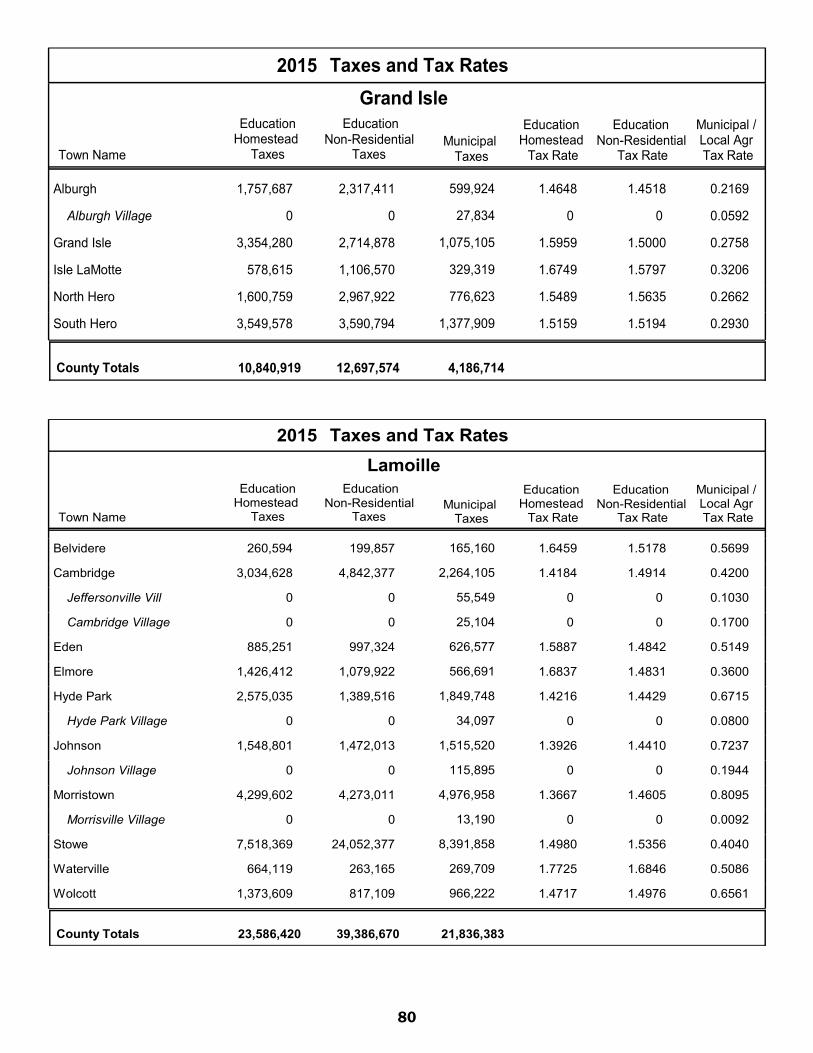
80
2015 Taxes and Tax Rates
Town Name
Education Homestead
Tax Rate
Municipal / Local Agr Tax Rate
Education Homestead
TaxesMunicipal
Taxes
Grand Isle Education
NonResidential Taxes
Education Residential
Tax RateNon-Residential Non-Residential
0.21691.46481,757,687 599,924Alburgh 2,317,411 1.4518
0.059200 27,834Alburgh Village 0 0
0.27581.59593,354,280 1,075,105Grand Isle 2,714,878 1.5000
0.32061.6749578,615 329,319Isle LaMotte 1,106,570 1.5797
0.26621.54891,600,759 776,623North Hero 2,967,922 1.5635
0.29301.51593,549,578 1,377,909South Hero 3,590,794 1.5194
County Totals 10,840,919 4,186,71412,697,574
2015 Taxes and Tax Rates
Town Name
Education Homestead
Tax Rate
Municipal / Local Agr Tax Rate
Education Homestead
TaxesMunicipal
Taxes
Lamoille Education
NonResidential Taxes
Education Residential
Tax RateNon-Residential Non-Residential
0.56991.6459260,594 165,160Belvidere 199,857 1.5178
0.42001.41843,034,628 2,264,105Cambridge 4,842,377 1.4914
0.103000 55,549Jeffersonville Vill 0 0
0.170000 25,104Cambridge Village 0 0
0.51491.5887885,251 626,577Eden 997,324 1.4842
0.36001.68371,426,412 566,691Elmore 1,079,922 1.4831
0.67151.42162,575,035 1,849,748Hyde Park 1,389,516 1.4429
0.080000 34,097Hyde Park Village 0 0
0.72371.39261,548,801 1,515,520Johnson 1,472,013 1.4410
0.194400 115,895Johnson Village 0 0
0.80951.36674,299,602 4,976,958Morristown 4,273,011 1.4605
0.009200 13,190Morrisville Village 0 0
0.40401.49807,518,369 8,391,858Stowe 24,052,377 1.5356
0.50861.7725664,119 269,709Waterville 263,165 1.6846
0.65611.47171,373,609 966,222Wolcott 817,109 1.4976
County Totals 23,586,420 21,836,38339,386,670

81
2015 Taxes and Tax Rates
Town Name
Education Homestead
Tax Rate
Municipal / Local Agr Tax Rate
Education Homestead
TaxesMunicipal
Taxes
Orange Education
NonResidential Taxes
Education Residential
Tax RateNon-Residential Non-Residential
0.74341.44091,943,410 1,773,169Bradford 1,550,427 1.4620
0.044600 20,611Bradford Village 0 0
0.85781.3730858,553 872,755Braintree 562,382 1.4342
0.42501.32821,259,940 678,489Brookfield 897,939 1.3756
0.54211.5825975,618 598,808Chelsea 786,741 1.5382
0.084100 94,182Chelsea FD 0 0
0.61681.28101,062,823 896,249Corinth 902,478 1.3960
0.48701.74781,266,327 996,796Fairlee 2,014,271 1.5212
0.22501.38771,393,405 451,991Newbury 1,431,354 1.4300
0.110000 37,529Newbury Village 0 0
0.310000 622,744Newbury Highway 0 0
0.230000 68,034Newbury (WR town) 0 0
0.103300 30,566Newbury (1/3 WR Hwy) 0 0
0.46171.2813885,161 447,604Orange 426,171 1.4692
0.73381.33033,079,044 3,191,586Randolph 2,925,778 1.4222
0.371700 538,973Randolph Police 0 0
0.040000 4,370Randolph FD (VTC) 0 0
0.68331.49471,654,905 1,199,000Strafford 930,367 1.4284
0.56731.91094,422,336 1,938,676Thetford 1,731,325 1.5387
0.69951.2909770,269 731,785Topsham 650,370 1.4067
0.67961.42251,338,136 1,108,774Tunbridge 955,314 1.3711
0.79441.7804628,818 533,028Vershire 501,429 1.5496
0.46431.2366813,022 476,362Washington 512,896 1.3420
0.75001.5478168,034 221,852Wells River 263,812 1.4579
0.206700 61,132W River Village 0 0
0.80821.7572646,834 575,214West Fairlee 509,249 1.5293
0.61661.55672,301,171 1,774,623Williamstown 2,388,433 1.7220
County Totals 25,467,805 19,944,90119,940,738
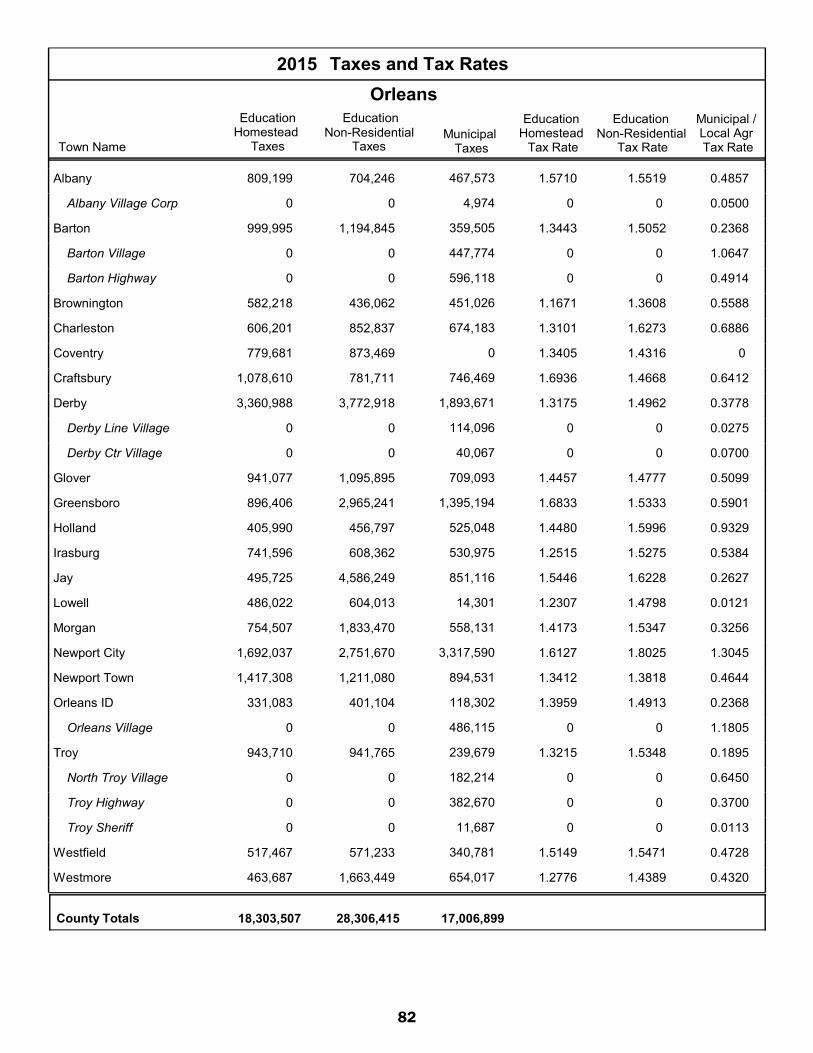
82
2015 Taxes and Tax Rates
Town Name
Education Homestead
Tax Rate
Municipal / Local Agr Tax Rate
Education Homestead
TaxesMunicipal
Taxes
Orleans Education
NonResidential Taxes
Education Residential
Tax RateNon-Residential Non-Residential
0.48571.5710809,199 467,573Albany 704,246 1.5519
0.050000 4,974Albany Village Corp 0 0
0.23681.3443999,995 359,505Barton 1,194,845 1.5052
1.064700 447,774Barton Village 0 0
0.491400 596,118Barton Highway 0 0
0.55881.1671582,218 451,026Brownington 436,062 1.3608
0.68861.3101606,201 674,183Charleston 852,837 1.6273
01.3405779,681 0Coventry 873,469 1.4316
0.64121.69361,078,610 746,469Craftsbury 781,711 1.4668
0.37781.31753,360,988 1,893,671Derby 3,772,918 1.4962
0.027500 114,096Derby Line Village 0 0
0.070000 40,067Derby Ctr Village 0 0
0.50991.4457941,077 709,093Glover 1,095,895 1.4777
0.59011.6833896,406 1,395,194Greensboro 2,965,241 1.5333
0.93291.4480405,990 525,048Holland 456,797 1.5996
0.53841.2515741,596 530,975Irasburg 608,362 1.5275
0.26271.5446495,725 851,116Jay 4,586,249 1.6228
0.01211.2307486,022 14,301Lowell 604,013 1.4798
0.32561.4173754,507 558,131Morgan 1,833,470 1.5347
1.30451.61271,692,037 3,317,590Newport City 2,751,670 1.8025
0.46441.34121,417,308 894,531Newport Town 1,211,080 1.3818
0.23681.3959331,083 118,302Orleans ID 401,104 1.4913
1.180500 486,115Orleans Village 0 0
0.18951.3215943,710 239,679Troy 941,765 1.5348
0.645000 182,214North Troy Village 0 0
0.370000 382,670Troy Highway 0 0
0.011300 11,687Troy Sheriff 0 0
0.47281.5149517,467 340,781Westfield 571,233 1.5471
0.43201.2776463,687 654,017Westmore 1,663,449 1.4389
County Totals 18,303,507 17,006,89928,306,415
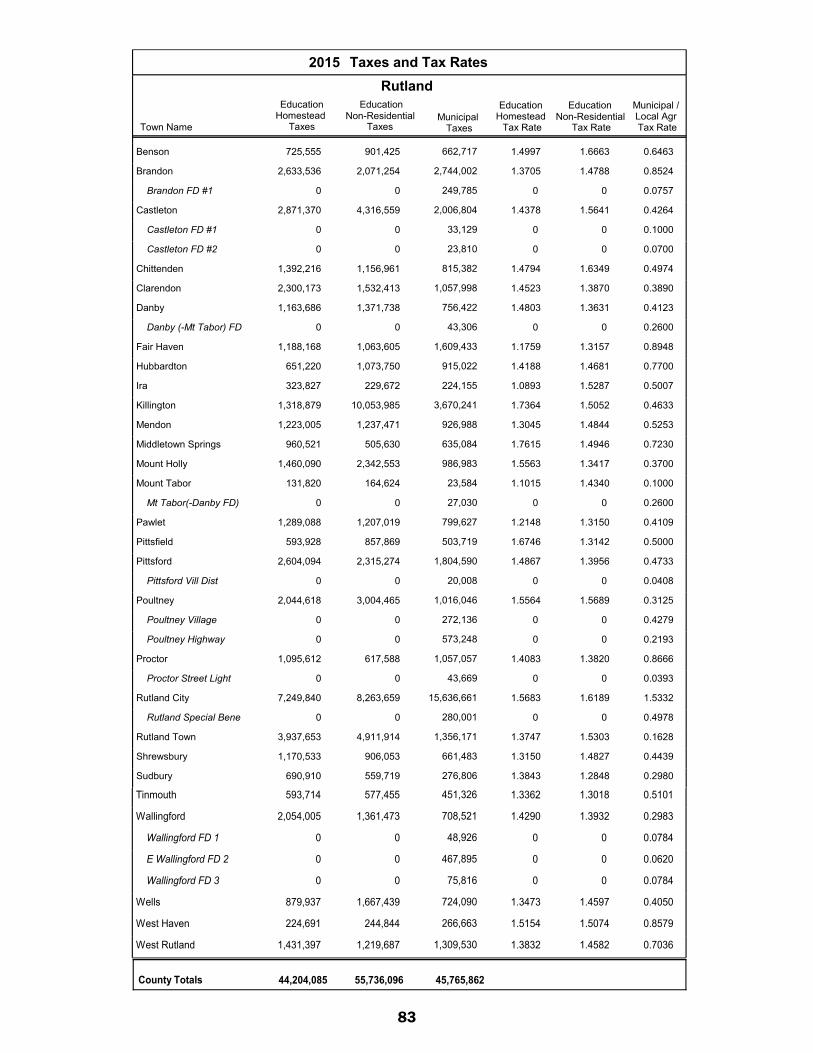
83
2015 Taxes and Tax Rates
Town Name
Education Homestead
Tax Rate
Municipal / Local Agr Tax Rate
Education Homestead
TaxesMunicipal
Taxes
Rutland Education
NonResidential Taxes
Education Residential
Tax RateNon-Residential Non-Residential
0.64631.4997725,555 662,717Benson 901,425 1.6663
0.85241.37052,633,536 2,744,002Brandon 2,071,254 1.4788
0.075700 249,785Brandon FD #1 0 0
0.42641.43782,871,370 2,006,804Castleton 4,316,559 1.5641
0.100000 33,129Castleton FD #1 0 0
0.070000 23,810Castleton FD #2 0 0
0.49741.47941,392,216 815,382Chittenden 1,156,961 1.6349
0.38901.45232,300,173 1,057,998Clarendon 1,532,413 1.3870
0.41231.48031,163,686 756,422Danby 1,371,738 1.3631
0.260000 43,306Danby (-Mt Tabor) FD 0 0
0.89481.17591,188,168 1,609,433Fair Haven 1,063,605 1.3157
0.77001.4188651,220 915,022Hubbardton 1,073,750 1.4681
0.50071.0893323,827 224,155Ira 229,672 1.5287
0.46331.73641,318,879 3,670,241Killington 10,053,985 1.5052
0.52531.30451,223,005 926,988Mendon 1,237,471 1.4844
0.72301.7615960,521 635,084Middletown Springs 505,630 1.4946
0.37001.55631,460,090 986,983Mount Holly 2,342,553 1.3417
0.10001.1015131,820 23,584Mount Tabor 164,624 1.4340
0.260000 27,030Mt Tabor(-Danby FD) 0 0
0.41091.21481,289,088 799,627Pawlet 1,207,019 1.3150
0.50001.6746593,928 503,719Pittsfield 857,869 1.3142
0.47331.48672,604,094 1,804,590Pittsford 2,315,274 1.3956
0.040800 20,008Pittsford Vill Dist 0 0
0.31251.55642,044,618 1,016,046Poultney 3,004,465 1.5689
0.427900 272,136Poultney Village 0 0
0.219300 573,248Poultney Highway 0 0
0.86661.40831,095,612 1,057,057Proctor 617,588 1.3820
0.039300 43,669Proctor Street Light 0 0
1.53321.56837,249,840 15,636,661Rutland City 8,263,659 1.6189
0.497800 280,001Rutland Special Bene 0 0
0.16281.37473,937,653 1,356,171Rutland Town 4,911,914 1.5303
0.44391.31501,170,533 661,483Shrewsbury 906,053 1.4827
0.29801.3843690,910 276,806Sudbury 559,719 1.28482015 Taxes and Tax Rates0.51011.3362593,714 451,326Tinmouth 577,455 1.3018
0.29831.42902,054,005 708,521Wallingford 1,361,473 1.3932
0.078400 48,926Wallingford FD 1 0 0
0.062000 467,895E Wallingford FD 2 0 0
0.078400 75,816Wallingford FD 3 0 0
0.40501.3473879,937 724,090Wells 1,667,439 1.4597
0.85791.5154224,691 266,663West Haven 244,844 1.5074
0.70361.38321,431,397 1,309,530West Rutland 1,219,687 1.4582
County Totals 44,204,085 45,765,86255,736,096

84
2015 Taxes and Tax Rates
Town Name
Education Homestead
Tax Rate
Municipal / Local Agr Tax Rate
Education Homestead
TaxesMunicipal
Taxes
Washington Education
NonResidential Taxes
Education Residential
Tax RateNon-Residential Non-Residential
1.73671.19432,737,709 8,271,274Barre City 3,851,885 1.4829
0.90981.40566,077,998 5,630,476Barre Town 3,070,299 1.7341
0.46381.59822,691,933 2,236,465Berlin 4,017,235 1.4727
0.51401.65111,355,545 857,470Cabot 1,100,550 1.5089
0.58631.75802,238,914 1,137,304Calais 1,149,539 1.6607
0.70331.66411,652,776 1,124,409Duxbury 932,427 1.5194
0.58221.97574,299,163 1,717,120East Montpelier 1,301,854 1.6312
0.24031.59712,367,846 891,967Fayston 3,222,884 1.4668
0.66231.71491,361,490 775,457Marshfield 660,497 1.6900
0.44031.75722,510,410 872,639Middlesex 897,213 1.5761
1.00371.60266,726,121 8,556,324Montpelier 6,344,497 1.5813
0.051500 41,293Montpelier Dwtn Impr 0 0
0.070000 573,277Montpel Swr Separat 0 0
0.020000 163,794Montpel Swr Benefit 0 0
0.37981.72812,287,588 840,157Moretown 1,324,834 1.4801
0.84921.45232,703,474 2,689,278Northfield 2,074,475 1.5313
0.67911.59771,209,718 776,596Plainfield 618,297 1.5745
0.86851.4416538,240 638,709Roxbury 534,402 1.4734
0.34721.54192,692,964 1,264,719Waitsfield 2,775,518 1.4292
0.42001.52402,345,340 2,974,028Warren 8,194,941 1.5040
0.40641.66416,628,059 2,882,998Waterbury 4,842,795 1.5416
0.38801.6954988,601 500,799Woodbury 1,076,547 1.5116
0.57251.54501,011,026 511,410Worcester 382,246 1.4851
County Totals 54,424,914 45,927,96448,372,935
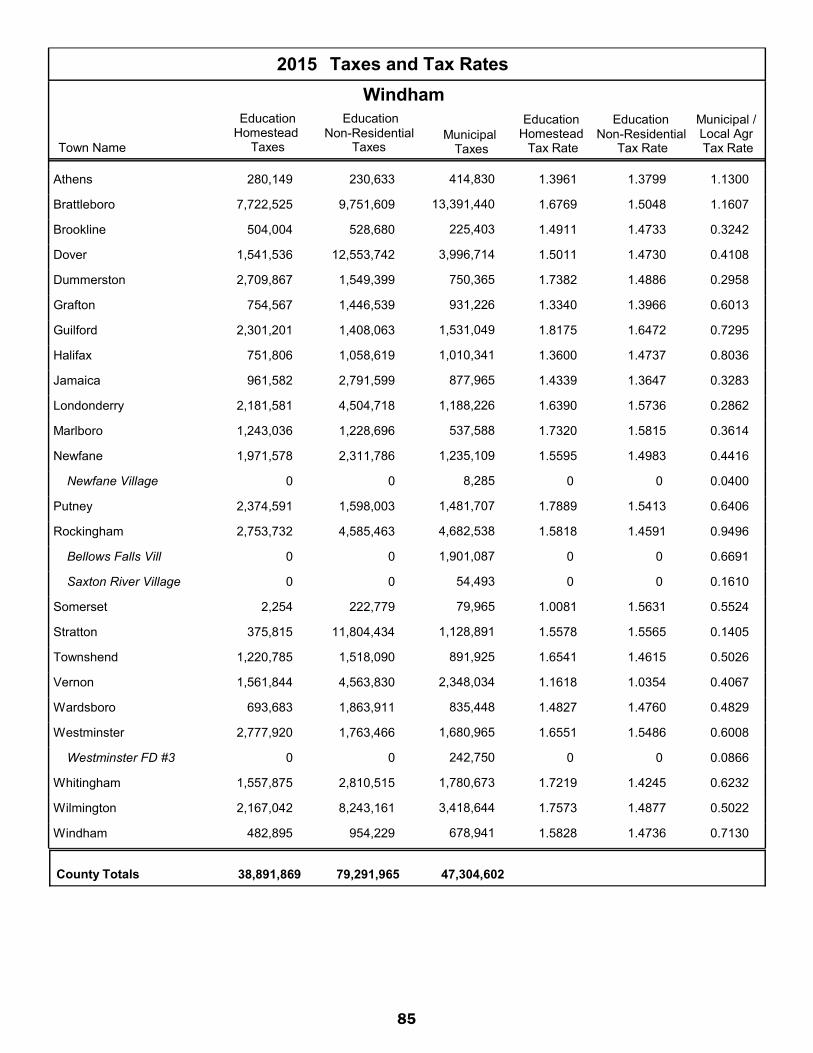
85
2015 Taxes and Tax Rates
Town Name
Education Homestead
Tax Rate
Municipal / Local Agr Tax Rate
Education Homestead
TaxesMunicipal
Taxes
Windham Education
NonResidential Taxes
Education Residential
Tax RateNon-Residential Non-Residential
1.13001.3961280,149 414,830Athens 230,633 1.3799
1.16071.67697,722,525 13,391,440Brattleboro 9,751,609 1.5048
0.32421.4911504,004 225,403Brookline 528,680 1.4733
0.41081.50111,541,536 3,996,714Dover 12,553,742 1.4730
0.29581.73822,709,867 750,365Dummerston 1,549,399 1.4886
0.60131.3340754,567 931,226Grafton 1,446,539 1.3966
0.72951.81752,301,201 1,531,049Guilford 1,408,063 1.6472
0.80361.3600751,806 1,010,341Halifax 1,058,619 1.4737
0.32831.4339961,582 877,965Jamaica 2,791,599 1.3647
0.28621.63902,181,581 1,188,226Londonderry 4,504,718 1.5736
0.36141.73201,243,036 537,588Marlboro 1,228,696 1.5815
0.44161.55951,971,578 1,235,109Newfane 2,311,786 1.4983
0.040000 8,285Newfane Village 0 0
0.64061.78892,374,591 1,481,707Putney 1,598,003 1.5413
0.94961.58182,753,732 4,682,538Rockingham 4,585,463 1.4591
0.669100 1,901,087Bellows Falls Vill 0 0
0.161000 54,493Saxton River Village 0 0
0.55241.00812,254 79,965Somerset 222,779 1.5631
0.14051.5578375,815 1,128,891Stratton 11,804,434 1.5565
0.50261.65411,220,785 891,925Townshend 1,518,090 1.4615
0.40671.16181,561,844 2,348,034Vernon 4,563,830 1.0354
0.48291.4827693,683 835,448Wardsboro 1,863,911 1.4760
0.60081.65512,777,920 1,680,965Westminster 1,763,466 1.5486
0.086600 242,750Westminster FD #3 0 0
0.62321.72191,557,875 1,780,673Whitingham 2,810,515 1.4245
0.50221.75732,167,042 3,418,644Wilmington 8,243,161 1.4877
0.71301.5828482,895 678,941Windham 954,229 1.4736
County Totals 38,891,869 47,304,60279,291,965

86
2015 Taxes and Tax Rates
Town Name
Education Homestead
Tax Rate
Municipal / Local Agr Tax Rate
Education Homestead
TaxesMunicipal
Taxes
Windsor Education
NonResidential Taxes
Education Residential
Tax RateNon-Residential Non-Residential
0.37001.2518733,605 614,082Andover 1,421,827 1.3238
0.47151.3455202,595 90,135Baltimore 68,214 1.4999
0.38801.65731,864,760 1,120,821Barnard 2,682,261 1.5207
0.83101.54991,622,559 1,632,302Bethel 1,266,559 1.3718
0.45501.5610999,313 802,405Bridgewater 1,750,104 1.5854
0.37161.41311,187,801 994,806Cavendish 2,649,749 1.4004
0.061100 94,280Cavendish FD #1 0 0
0.047100 60,910Cavendish FD #2 0 0
0.69001.32282,568,773 2,877,889Chester 3,095,707 1.3823
0.91221.50628,463,464 12,112,901Hartford 11,343,059 1.4842
0.44191.60244,144,664 1,852,499Hartland 2,353,819 1.4214
0.29171.73472,296,798 3,814,109Ludlow 18,266,924 1.5333
0.52831.84688,451,328 3,615,168Norwich 3,782,131 1.5692
0.069100 115,085Norwich Fire Dist 0 0
0.41001.7155858,467 1,099,712Plymouth 3,332,265 1.5286
0.37791.36421,352,715 930,451Pomfret 2,125,700 1.4427
0.45711.78141,050,428 625,053Reading 1,183,816 1.5387
0.51101.3475938,425 820,346Rochester 1,286,444 1.3958
0.64711.40081,721,748 1,634,802Royalton 1,860,862 1.4171
0.67671.41571,299,259 1,068,087Sharon 884,927 1.4184
1.41301.54955,672,149 9,134,496Springfield 3,716,310 1.3972
0.53771.5788685,205 584,322Stockbridge 1,012,223 1.5370
0.60251.63432,733,694 1,728,462Weathersfield 1,852,247 1.5316
0.035900 3,490Perkinsville Village 0 0
0.41001.64892,056,775 1,074,872West Windsor 2,035,401 1.4774
0.47931.6470998,181 941,681Weston 2,261,890 1.6502
1.25601.32351,853,760 3,073,745Windsor 1,501,892 1.4136
0.36141.72945,419,502 3,000,717Woodstock 8,644,902 1.5679
0.237500 647,287Woodstock Village 0 0
0.053200 311,560Woodstock Police Dis 0 0
County Totals 59,175,968 56,476,47680,379,235
STATE TOTALS 572,981,661 459,799,623638,070,975

87
effective tax Rates
The effective tax rates are the rates that would be in effect if all towns were appraised at 100% of market value with no equalization adjustment, also known as the equalized tax rate.
effective education tax rateThe effective education tax rate is determined by dividing the education tax assessed for each of the homestead and nonresidential classes by their respective estimated equalized education grand list values.
Municipal effective tax rateThe municipal effective tax rate is determined by dividing the municipal tax assessed by the equalized municipal grand list.
The following reports show the effective or equalized tax rate showing the estimated homestead effective rate and the estimated nonresidential effective rate for each school district.
Figure 1 reports the effective tax rates for each municipality, organized by county.
Figure 2 reports the effective homestead tax rate for each municipality, sorted in ascending order.
Figure 3 reports the effective non-residential tax rate for each municipality, sorted in ascending order.

88
Figure 1. 2015 Effective Tax Rates
2015 Effective Tax Rates
Addison
Town NameLocal
Agreement MunicipalSchool / Estimated
HomesteadSchool / Estimated
ResidentialNon-Residential
Addison 1.6723 0.0012 0.42531.5282
Bridport 1.7848 0.0023 0.51321.5324
Bristol 1.542 0.0051 0.61361.5082
Cornwall 1.7784 0.0002 0.50711.5312
Ferrisburgh 1.7096 0.0004 0.27941.5652
Goshen 1.2691 0 0.90511.4932
Granville 1.2773 0 0.57871.5388
Hancock 1.7727 0 0.95421.4591
Leicester 1.6179 0.0015 0.30561.6227
Lincoln 1.6002 0.0021 0.66931.5492
Middlebury 1.6971 0.0016 0.90261.5451
Monkton 1.6726 0.0013 0.41151.5728
New Haven 1.6042 0 0.37631.5265
Orwell 1.3521 0 0.44471.4871
Panton 1.693 0.001 0.60541.6363
Ripton 1.7297 0.0071 0.46571.4521
Salisbury 1.7874 0 0.28761.5534
Shoreham 1.761 0.0015 0.54721.5113
Starksboro 1.6057 0 0.42561.521
Vergennes 1.5589 0.0035 0.77511.5191
Waltham 1.559 0 0.35751.5125
Weybridge 2.0241 0.0005 0.43671.5419
Whiting 1.5079 0 0.5411.5317
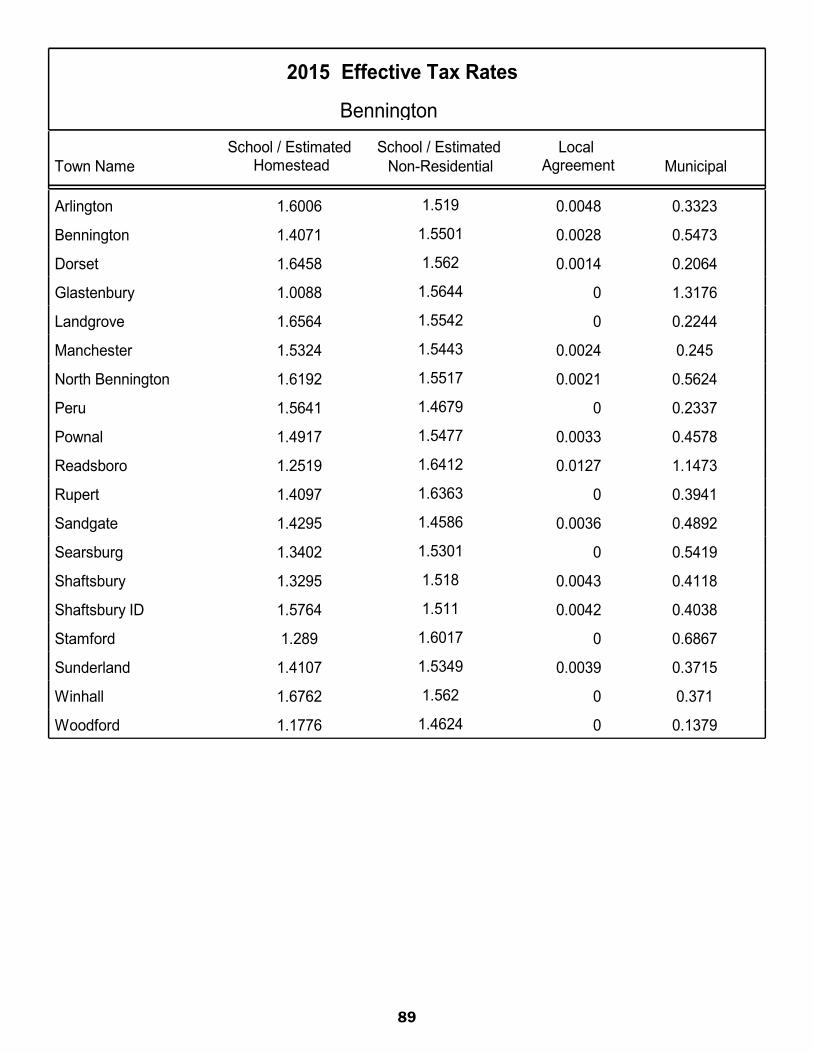
89
2015 Effective Tax Rates
Bennington
Town NameLocal
Agreement MunicipalSchool / Estimated
HomesteadSchool / Estimated
ResidentialNon-Residential
Arlington 1.6006 0.0048 0.33231.519
Bennington 1.4071 0.0028 0.54731.5501
Dorset 1.6458 0.0014 0.20641.562
Glastenbury 1.0088 0 1.31761.5644
Landgrove 1.6564 0 0.22441.5542
Manchester 1.5324 0.0024 0.2451.5443
North Bennington 1.6192 0.0021 0.56241.5517
Peru 1.5641 0 0.23371.4679
Pownal 1.4917 0.0033 0.45781.5477
Readsboro 1.2519 0.0127 1.14731.6412
Rupert 1.4097 0 0.39411.6363
Sandgate 1.4295 0.0036 0.48921.4586
Searsburg 1.3402 0 0.54191.5301
Shaftsbury 1.3295 0.0043 0.41181.518
Shaftsbury ID 1.5764 0.0042 0.40381.511
Stamford 1.289 0 0.68671.6017
Sunderland 1.4107 0.0039 0.37151.5349
Winhall 1.6762 0 0.3711.562
Woodford 1.1776 0 0.13791.4624

90
2015 Effective Tax Rates
Caledonia
Town NameLocal
Agreement MunicipalSchool / Estimated
HomesteadSchool / Estimated
ResidentialNon-Residential
Barnet 1.5202 0.0021 0.54911.5533
Burke 1.5533 0 0.47021.477
Danville 1.4655 0 0.4941.5177
Groton 1.7065 0.0035 0.58951.6075
Hardwick 1.5922 0.0109 1.09251.5496
Kirby 1.3896 0.0008 0.42281.4496
Lyndon 1.4388 0.0043 0.30511.518
Newark 1.5739 0 0.49351.4879
Peacham 1.8525 0 0.42041.6712
Ryegate 1.6244 0.003 0.59051.5299
Sheffield 1.6413 0 0.23631.4924
St. Johnsbury 1.2436 0.0014 1.20591.4994
Stannard 1.6879 0 0.80571.4911
Sutton 1.4372 0.0039 0.74931.5252
Walden 1.2185 0.0032 0.63681.5169
Waterford 1.6497 0.0025 0.41141.6076
Wheelock 1.6735 0.0167 0.54811.5211
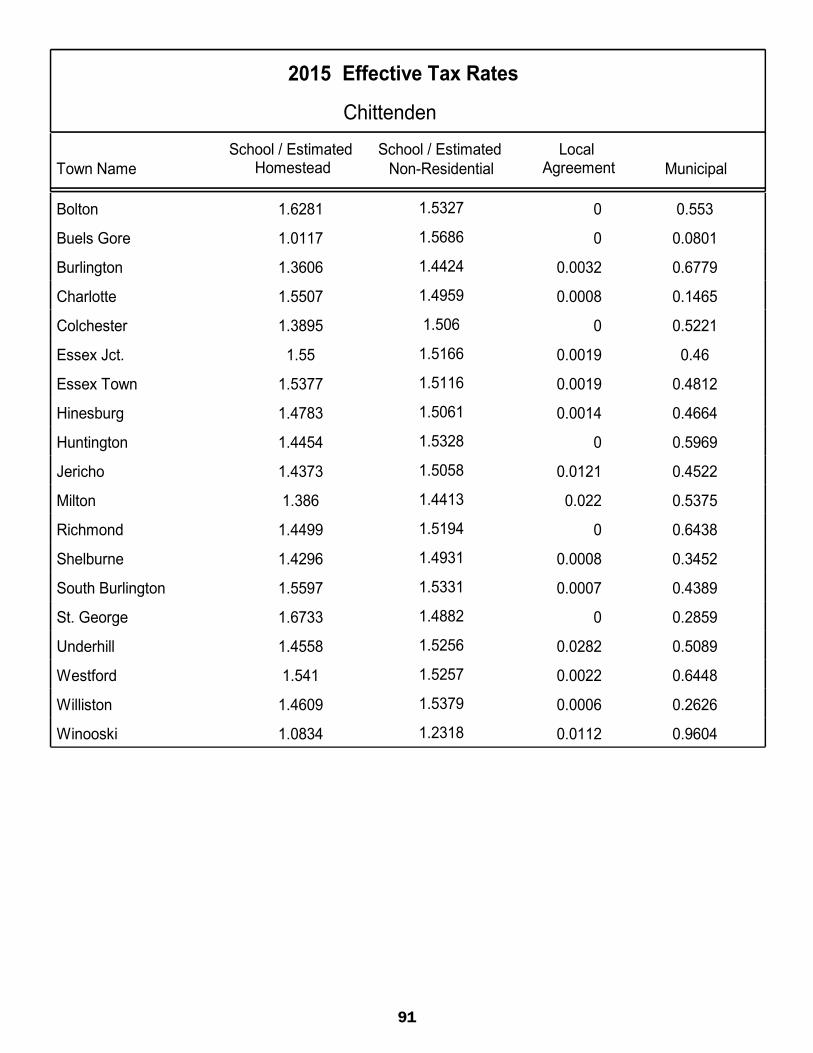
91
2015 Effective Tax Rates
Chittenden
Town NameLocal
Agreement MunicipalSchool / Estimated
HomesteadSchool / Estimated
ResidentialNon-Residential
Bolton 1.6281 0 0.5531.5327
Buels Gore 1.0117 0 0.08011.5686
Burlington 1.3606 0.0032 0.67791.4424
Charlotte 1.5507 0.0008 0.14651.4959
Colchester 1.3895 0 0.52211.506
Essex Jct. 1.55 0.0019 0.461.5166
Essex Town 1.5377 0.0019 0.48121.5116
Hinesburg 1.4783 0.0014 0.46641.5061
Huntington 1.4454 0 0.59691.5328
Jericho 1.4373 0.0121 0.45221.5058
Milton 1.386 0.022 0.53751.4413
Richmond 1.4499 0 0.64381.5194
Shelburne 1.4296 0.0008 0.34521.4931
South Burlington 1.5597 0.0007 0.43891.5331
St. George 1.6733 0 0.28591.4882
Underhill 1.4558 0.0282 0.50891.5256
Westford 1.541 0.0022 0.64481.5257
Williston 1.4609 0.0006 0.26261.5379
Winooski 1.0834 0.0112 0.96041.2318
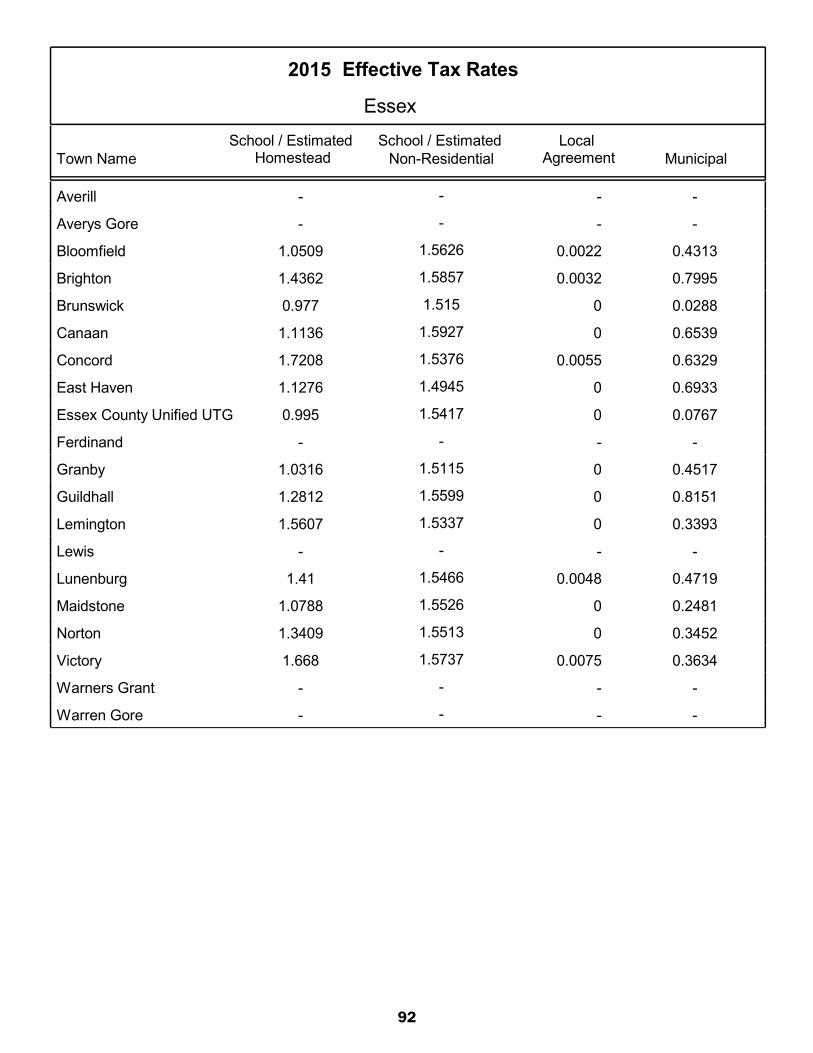
92
2015 Effective Tax Rates
Essex
Town NameLocal
Agreement MunicipalSchool / Estimated
HomesteadSchool / Estimated
ResidentialNon-Residential
Averill - - --
Averys Gore - - --
Bloomfield 1.0509 0.0022 0.43131.5626
Brighton 1.4362 0.0032 0.79951.5857
Brunswick 0.977 0 0.02881.515
Canaan 1.1136 0 0.65391.5927
Concord 1.7208 0.0055 0.63291.5376
East Haven 1.1276 0 0.69331.4945
Essex County Unified UTG 0.995 0 0.07671.5417
Ferdinand - - --
Granby 1.0316 0 0.45171.5115
Guildhall 1.2812 0 0.81511.5599
Lemington 1.5607 0 0.33931.5337
Lewis - - --
Lunenburg 1.41 0.0048 0.47191.5466
Maidstone 1.0788 0 0.24811.5526
Norton 1.3409 0 0.34521.5513
Victory 1.668 0.0075 0.36341.5737
Warners Grant - - --
Warren Gore - - --
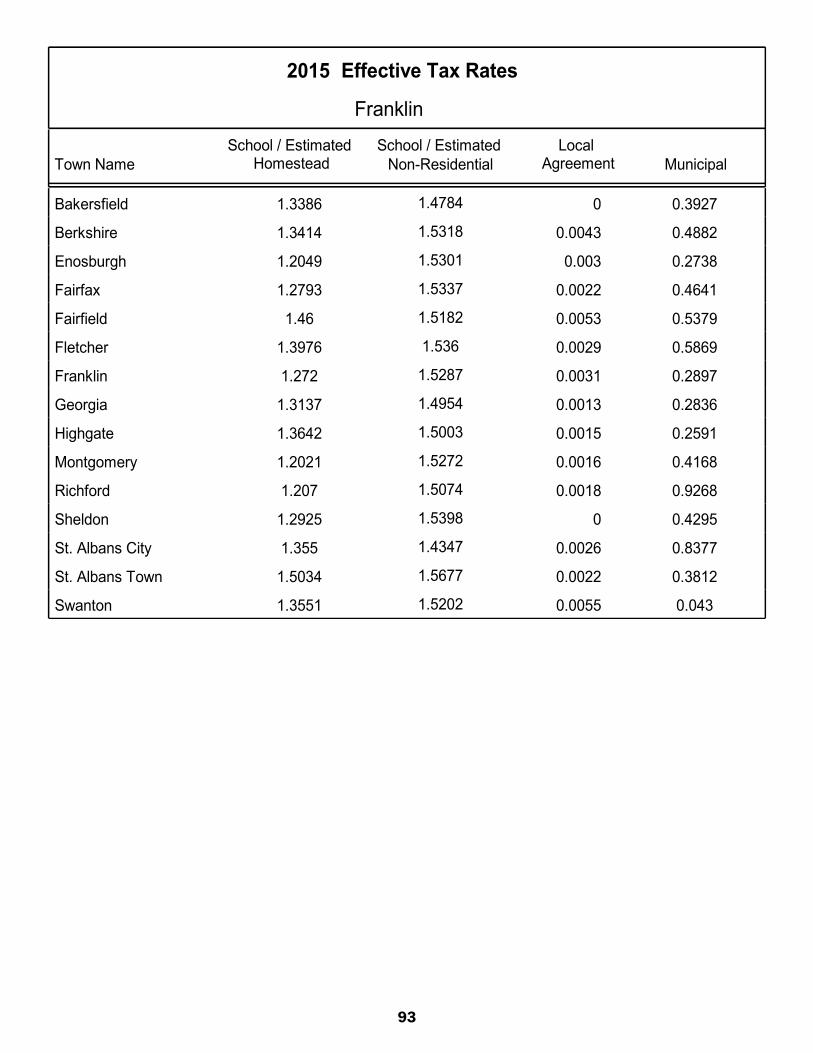
93
2015 Effective Tax Rates
Franklin
Town NameLocal
Agreement MunicipalSchool / Estimated
HomesteadSchool / Estimated
ResidentialNon-Residential
Bakersfield 1.3386 0 0.39271.4784
Berkshire 1.3414 0.0043 0.48821.5318
Enosburgh 1.2049 0.003 0.27381.5301
Fairfax 1.2793 0.0022 0.46411.5337
Fairfield 1.46 0.0053 0.53791.5182
Fletcher 1.3976 0.0029 0.58691.536
Franklin 1.272 0.0031 0.28971.5287
Georgia 1.3137 0.0013 0.28361.4954
Highgate 1.3642 0.0015 0.25911.5003
Montgomery 1.2021 0.0016 0.41681.5272
Richford 1.207 0.0018 0.92681.5074
Sheldon 1.2925 0 0.42951.5398
St. Albans City 1.355 0.0026 0.83771.4347
St. Albans Town 1.5034 0.0022 0.38121.5677
Swanton 1.3551 0.0055 0.0431.5202
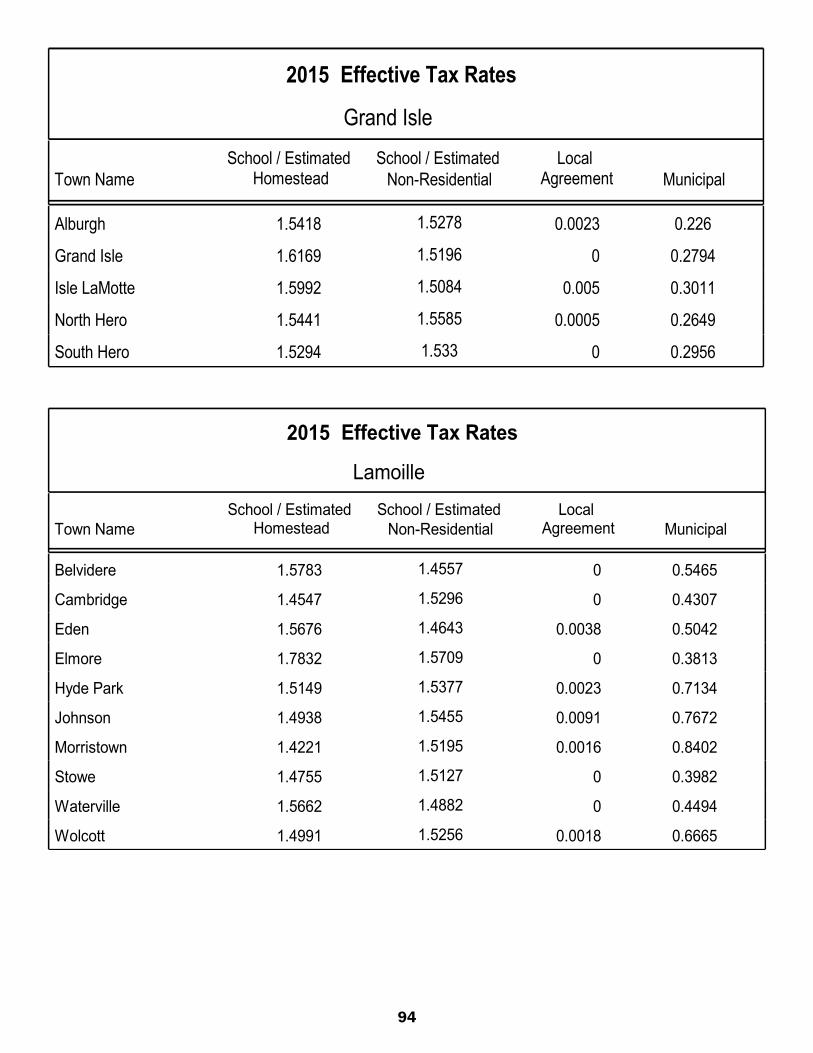
94
2015 Effective Tax Rates
Grand Isle
Town NameLocal
Agreement MunicipalSchool / Estimated
HomesteadSchool / Estimated
ResidentialNon-Residential
Alburgh 1.5418 0.0023 0.2261.5278
Grand Isle 1.6169 0 0.27941.5196
Isle LaMotte 1.5992 0.005 0.30111.5084
North Hero 1.5441 0.0005 0.26491.5585
South Hero 1.5294 0 0.29561.533
2015 Effective Tax Rates
Lamoille
Town NameLocal
Agreement MunicipalSchool / Estimated
HomesteadSchool / Estimated
ResidentialNon-Residential
Belvidere 1.5783 0 0.54651.4557
Cambridge 1.4547 0 0.43071.5296
Eden 1.5676 0.0038 0.50421.4643
Elmore 1.7832 0 0.38131.5709
Hyde Park 1.5149 0.0023 0.71341.5377
Johnson 1.4938 0.0091 0.76721.5455
Morristown 1.4221 0.0016 0.84021.5195
Stowe 1.4755 0 0.39821.5127
Waterville 1.5662 0 0.44941.4882
Wolcott 1.4991 0.0018 0.66651.5256

95
2015 Effective Tax Rates
Orange
Town NameLocal
Agreement MunicipalSchool / Estimated
HomesteadSchool / Estimated
ResidentialNon-Residential
Bradford 1.5802 0.0045 0.81081.6032
Braintree 1.4504 0 0.90621.5151
Brookfield 1.4775 0 0.47281.5304
Chelsea 1.6668 0.0082 0.56281.6204
Corinth 1.412 0.0072 0.67271.539
Fairlee 1.799 0.0004 0.50091.5661
Newbury 1.4741 0 0.2391.5191
Orange 1.3133 0.0038 0.46951.5061
Randolph 1.3797 0.0028 0.75831.4749
Strafford 1.543 0.001 0.70431.4744
Thetford 1.8884 0.0028 0.55791.5209
Topsham 1.4431 0.0063 0.77581.5724
Tunbridge 1.6348 0 0.78111.5758
Vershire 1.8078 0.0048 0.8021.5736
Washington 1.3815 0.0048 0.51391.4994
Wells River 1.61 0 0.77971.5166
West Fairlee 1.6626 0 0.76461.4468
Williamstown 1.3956 0.0039 0.54881.5437

96
2015 Effective Tax Rates
Orleans
Town NameLocal
Agreement MunicipalSchool / Estimated
HomesteadSchool / Estimated
ResidentialNon-Residential
Albany 1.5862 0 0.49031.5667
Barton 1.3724 0.0026 0.23921.5369
Brownington 1.2816 0.0049 0.60891.4944
Charleston 1.226 0 0.64421.5228
Coventry 1.3808 0 01.4743
Craftsbury 1.6357 0.0021 0.61711.4165
Derby 1.3352 0.0033 0.37961.5164
Glover 1.5264 0 0.53831.5599
Greensboro 1.6901 0.0244 0.5681.5393
Holland 1.2676 0.0028 0.81381.4002
Irasburg 1.2165 0 0.52331.4845
Jay 1.5181 0.0003 0.25791.5953
Lowell 1.2303 0.001 0.01111.479
Morgan 1.4072 0.0013 0.32191.5234
Newport City 1.3999 0.0156 1.12921.5644
Newport Town 1.4603 0 0.50571.5043
Orleans ID 1.446 0.0026 0.24271.5448
Troy 1.3494 0.0074 0.18621.5676
Westfield 1.5178 0 0.47361.5503
Westmore 1.3032 0.0011 0.43951.4675
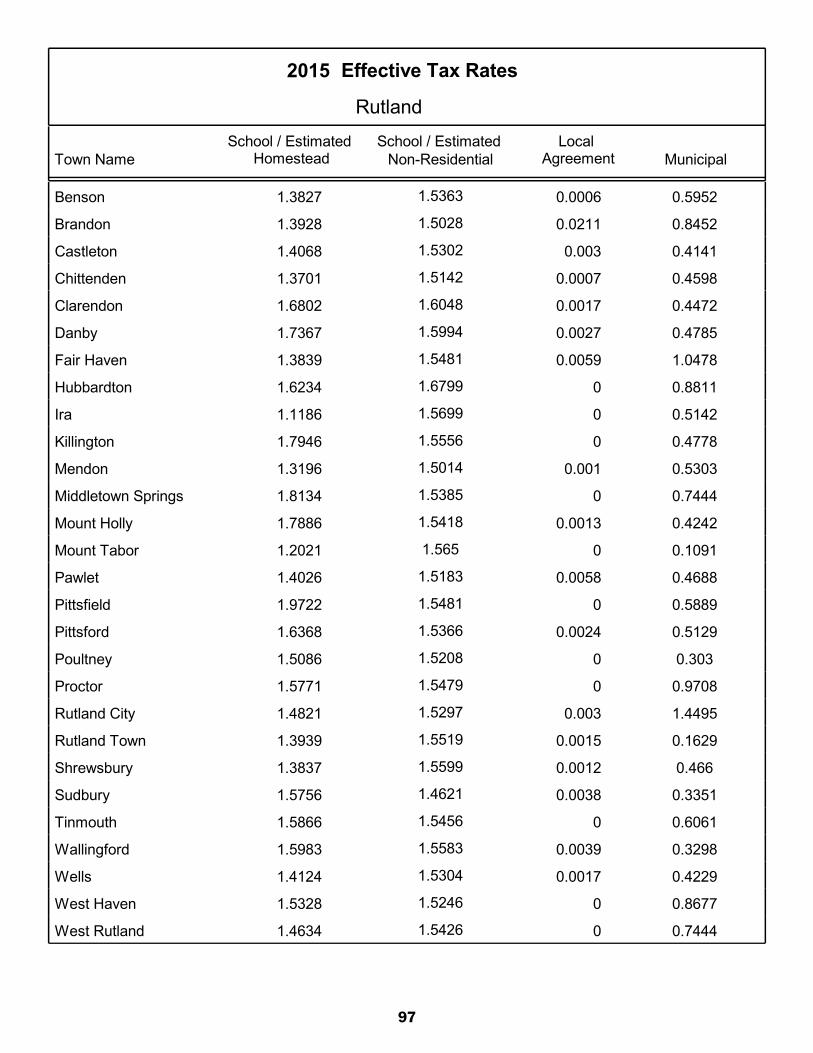
97
2015 Effective Tax Rates
Rutland
Town NameLocal
Agreement MunicipalSchool / Estimated
HomesteadSchool / Estimated
ResidentialNon-Residential
Benson 1.3827 0.0006 0.59521.5363
Brandon 1.3928 0.0211 0.84521.5028
Castleton 1.4068 0.003 0.41411.5302
Chittenden 1.3701 0.0007 0.45981.5142
Clarendon 1.6802 0.0017 0.44721.6048
Danby 1.7367 0.0027 0.47851.5994
Fair Haven 1.3839 0.0059 1.04781.5481
Hubbardton 1.6234 0 0.88111.6799
Ira 1.1186 0 0.51421.5699
Killington 1.7946 0 0.47781.5556
Mendon 1.3196 0.001 0.53031.5014
Middletown Springs 1.8134 0 0.74441.5385
Mount Holly 1.7886 0.0013 0.42421.5418
Mount Tabor 1.2021 0 0.10911.565
Pawlet 1.4026 0.0058 0.46881.5183
Pittsfield 1.9722 0 0.58891.5481
Pittsford 1.6368 0.0024 0.51291.5366
Poultney 1.5086 0 0.3031.5208
Proctor 1.5771 0 0.97081.5479
Rutland City 1.4821 0.003 1.44951.5297
Rutland Town 1.3939 0.0015 0.16291.5519
Shrewsbury 1.3837 0.0012 0.4661.5599
Sudbury 1.5756 0.0038 0.33511.4621
Tinmouth 1.5866 0 0.60611.5456
Wallingford 1.5983 0.0039 0.32981.5583
Wells 1.4124 0.0017 0.42291.5304
West Haven 1.5328 0 0.86771.5246
West Rutland 1.4634 0 0.74441.5426

98
2015 Effective Tax Rates
Washington
Town NameLocal
Agreement MunicipalSchool / Estimated
HomesteadSchool / Estimated
ResidentialNon-Residential
Barre City 1.219 0.0284 1.75811.5137
Barre Town 1.256 0.0035 0.81191.5496
Berlin 1.6642 0.0008 0.48041.5338
Cabot 1.6779 0.0041 0.51761.5331
Calais 1.7314 0.0051 0.57231.6358
Duxbury 1.6769 0.0022 0.70651.5311
East Montpelier 1.8688 0.0028 0.54791.5433
Fayston 1.6812 0.0003 0.25261.5441
Marshfield 1.6311 0.0053 0.62461.6073
Middlesex 1.6598 0.0023 0.41361.4889
Montpelier 1.5265 0.0009 0.95691.5065
Moretown 1.7857 0 0.39251.5295
Northfield 1.4594 0.0071 0.84631.5389
Plainfield 1.5505 0.0024 0.65661.5281
Roxbury 1.5465 0 0.93161.5804
Waitsfield 1.5954 0.0031 0.35621.4788
Warren 1.5293 0 0.42141.509
Waterbury 1.6528 0.0014 0.40231.5314
Woodbury 1.7348 0 0.39711.5469
Worcester 1.6131 0.0115 0.58631.5505
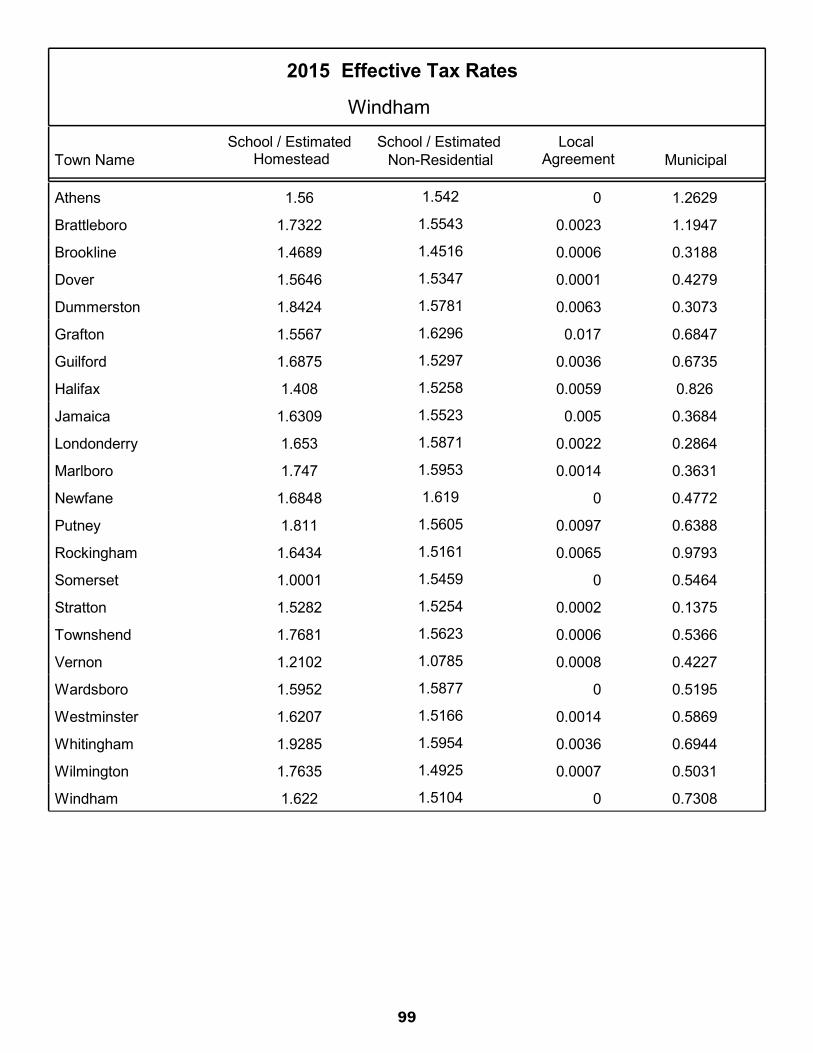
99
2015 Effective Tax Rates
Windham
Town NameLocal
Agreement MunicipalSchool / Estimated
HomesteadSchool / Estimated
ResidentialNon-Residential
Athens 1.56 0 1.26291.542
Brattleboro 1.7322 0.0023 1.19471.5543
Brookline 1.4689 0.0006 0.31881.4516
Dover 1.5646 0.0001 0.42791.5347
Dummerston 1.8424 0.0063 0.30731.5781
Grafton 1.5567 0.017 0.68471.6296
Guilford 1.6875 0.0036 0.67351.5297
Halifax 1.408 0.0059 0.8261.5258
Jamaica 1.6309 0.005 0.36841.5523
Londonderry 1.653 0.0022 0.28641.5871
Marlboro 1.747 0.0014 0.36311.5953
Newfane 1.6848 0 0.47721.619
Putney 1.811 0.0097 0.63881.5605
Rockingham 1.6434 0.0065 0.97931.5161
Somerset 1.0001 0 0.54641.5459
Stratton 1.5282 0.0002 0.13751.5254
Townshend 1.7681 0.0006 0.53661.5623
Vernon 1.2102 0.0008 0.42271.0785
Wardsboro 1.5952 0 0.51951.5877
Westminster 1.6207 0.0014 0.58691.5166
Whitingham 1.9285 0.0036 0.69441.5954
Wilmington 1.7635 0.0007 0.50311.4925
Windham 1.622 0 0.73081.5104

100
2015 Effective Tax Rates
Windsor
Town NameLocal
Agreement MunicipalSchool / Estimated
HomesteadSchool / Estimated
ResidentialNon-Residential
Andover 1.5096 0 0.44621.5963
Baltimore 1.3503 0.0082 0.46491.505
Barnard 1.6632 0 0.38941.5263
Bethel 1.6882 0 0.90531.4944
Bridgewater 1.4379 0.0018 0.41791.4607
Cavendish 1.5502 0.0082 0.39921.5363
Chester 1.5327 0.0061 0.79371.6016
Hartford 1.5387 0.0011 0.93291.5162
Hartland 1.6884 0.0031 0.46271.4979
Ludlow 1.7801 0.006 0.29361.573
Norwich 1.7609 0.0077 0.4961.4961
Plymouth 1.8109 0 0.43281.6136
Pomfret 1.4382 0.0013 0.39721.5212
Reading 1.7993 0 0.46171.5543
Rochester 1.5122 0 0.57361.5665
Royalton 1.4952 0.0033 0.68751.5128
Sharon 1.5027 0.001 0.71621.5055
Springfield 1.7117 0.0066 1.54981.5436
Stockbridge 1.5517 0.0023 0.52621.5104
Weathersfield 1.6287 0.0062 0.59411.5264
West Windsor 1.7155 0 0.42661.5372
Weston 1.5793 0.0012 0.45831.5824
Windsor 1.4636 0.0042 1.38521.5635
Woodstock 1.6664 0.0111 0.33721.5108
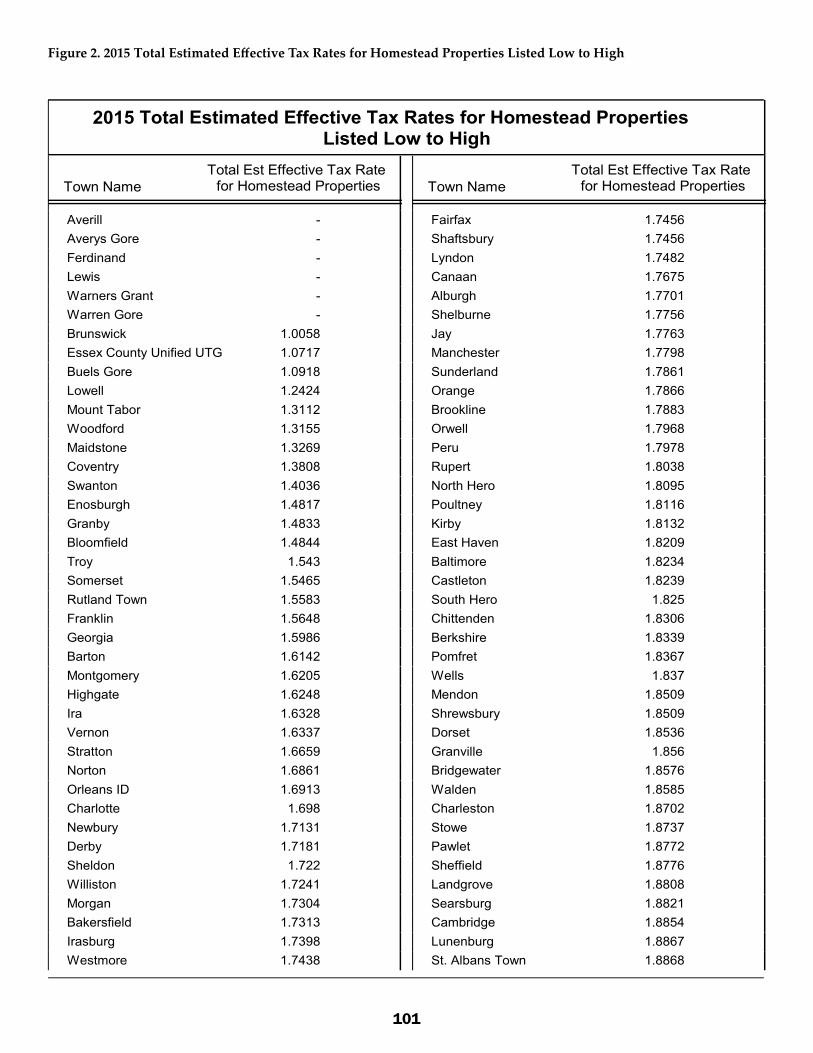
101
Figure 2. 2015 Total Estimated Effective Tax Rates for Homestead Properties Listed Low to High
2015 Total Estimated Effective Tax Rates for Homestead PropertiesListed Low to High
Town NameTotal Est Effective Tax Rate
for Homestead Properties
Averill -Averys Gore -Ferdinand -Lewis -Warners Grant -Warren Gore -Brunswick 1.0058Essex County Unified UTG 1.0717Buels Gore 1.0918Lowell 1.2424Mount Tabor 1.3112Woodford 1.3155Maidstone 1.3269Coventry 1.3808Swanton 1.4036Enosburgh 1.4817Granby 1.4833Bloomfield 1.4844Troy 1.543Somerset 1.5465Rutland Town 1.5583Franklin 1.5648Georgia 1.5986Barton 1.6142Montgomery 1.6205Highgate 1.6248Ira 1.6328Vernon 1.6337Stratton 1.6659Norton 1.6861Orleans ID 1.6913Charlotte 1.698Newbury 1.7131Derby 1.7181Sheldon 1.722Williston 1.7241Morgan 1.7304Bakersfield 1.7313Irasburg 1.7398Westmore 1.7438
Town NameTotal Est Effective Tax Rate
for Homestead Properties
Fairfax 1.7456Shaftsbury 1.7456Lyndon 1.7482Canaan 1.7675Alburgh 1.7701Shelburne 1.7756Jay 1.7763Manchester 1.7798Sunderland 1.7861Orange 1.7866Brookline 1.7883Orwell 1.7968Peru 1.7978Rupert 1.8038North Hero 1.8095Poultney 1.8116Kirby 1.8132East Haven 1.8209Baltimore 1.8234Castleton 1.8239South Hero 1.825Chittenden 1.8306Berkshire 1.8339Pomfret 1.8367Wells 1.837Mendon 1.8509Shrewsbury 1.8509Dorset 1.8536Granville 1.856Bridgewater 1.8576Walden 1.8585Charleston 1.8702Stowe 1.8737Pawlet 1.8772Sheffield 1.8776Landgrove 1.8808Searsburg 1.8821Cambridge 1.8854Lunenburg 1.8867St. Albans Town 1.8868
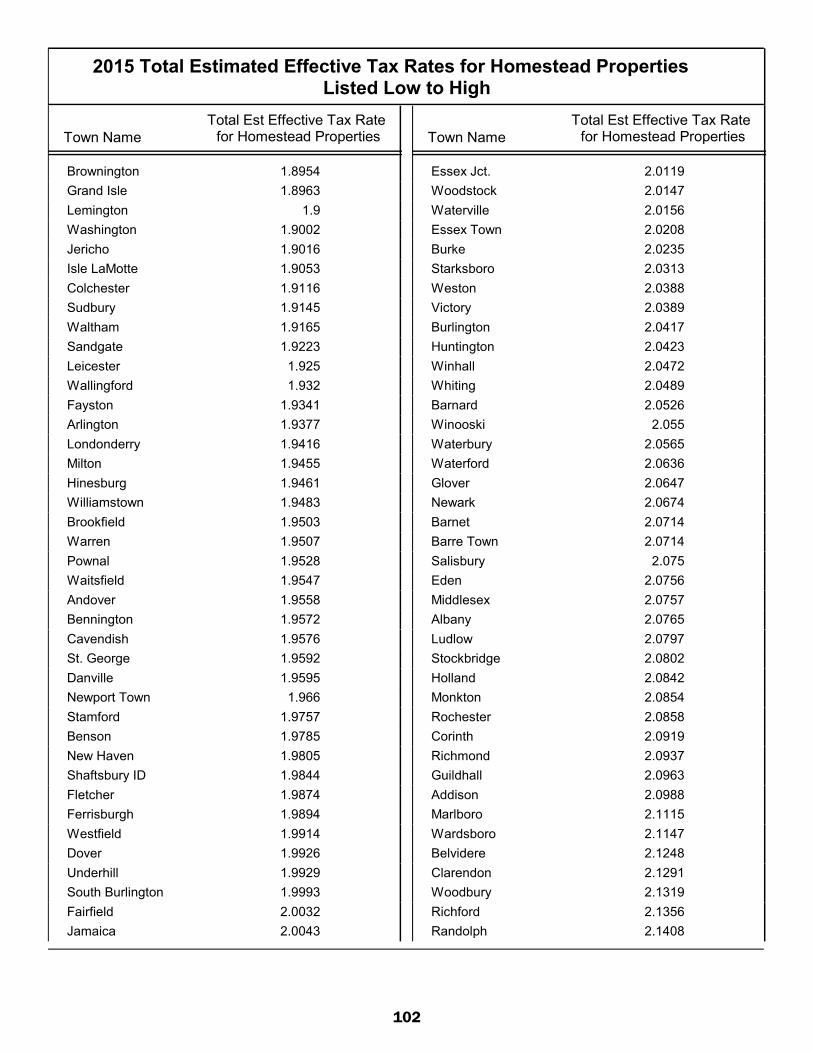
102
2015 Total Estimated Effective Tax Rates for Homestead PropertiesListed Low to High
Town NameTotal Est Effective Tax Rate
for Homestead Properties
Brownington 1.8954Grand Isle 1.8963Lemington 1.9Washington 1.9002Jericho 1.9016Isle LaMotte 1.9053Colchester 1.9116Sudbury 1.9145Waltham 1.9165Sandgate 1.9223Leicester 1.925Wallingford 1.932Fayston 1.9341Arlington 1.9377Londonderry 1.9416Milton 1.9455Hinesburg 1.9461Williamstown 1.9483Brookfield 1.9503Warren 1.9507Pownal 1.9528Waitsfield 1.9547Andover 1.9558Bennington 1.9572Cavendish 1.9576St. George 1.9592Danville 1.9595Newport Town 1.966Stamford 1.9757Benson 1.9785New Haven 1.9805Shaftsbury ID 1.9844Fletcher 1.9874Ferrisburgh 1.9894Westfield 1.9914Dover 1.9926Underhill 1.9929South Burlington 1.9993Fairfield 2.0032Jamaica 2.0043
Town NameTotal Est Effective Tax Rate
for Homestead Properties
Essex Jct. 2.0119Woodstock 2.0147Waterville 2.0156Essex Town 2.0208Burke 2.0235Starksboro 2.0313Weston 2.0388Victory 2.0389Burlington 2.0417Huntington 2.0423Winhall 2.0472Whiting 2.0489Barnard 2.0526Winooski 2.055Waterbury 2.0565Waterford 2.0636Glover 2.0647Newark 2.0674Barnet 2.0714Barre Town 2.0714Salisbury 2.075Eden 2.0756Middlesex 2.0757Albany 2.0765Ludlow 2.0797Stockbridge 2.0802Holland 2.0842Monkton 2.0854Rochester 2.0858Corinth 2.0919Richmond 2.0937Guildhall 2.0963Addison 2.0988Marlboro 2.1115Wardsboro 2.1147Belvidere 2.1248Clarendon 2.1291Woodbury 2.1319Richford 2.1356Randolph 2.1408

103
2015 Total Estimated Effective Tax Rates for Homestead PropertiesListed Low to High
Town NameTotal Est Effective Tax Rate
for Homestead Properties
West Windsor 2.1421Berlin 2.1454Pittsford 2.1521Hartland 2.1542Dummerston 2.156Bristol 2.1607Newfane 2.162Elmore 2.1645Wolcott 2.1674Goshen 2.1742Moretown 2.1782Bolton 2.1811North Bennington 2.1837Royalton 2.186Westford 2.188Sutton 2.1904Tinmouth 2.1927St. Albans City 2.1953Cabot 2.1996Ripton 2.2025West Rutland 2.2078Westminster 2.209Plainfield 2.2095Worcester 2.2109Mount Holly 2.2141Danby 2.2179Ryegate 2.2179Sharon 2.2199Topsham 2.2252Weathersfield 2.229Hyde Park 2.2306Chelsea 2.2378Wheelock 2.2383Brighton 2.2389Halifax 2.2399Plymouth 2.2437Strafford 2.2483Craftsbury 2.2549Grafton 2.2584Brandon 2.2591
Town NameTotal Est Effective Tax Rate
for Homestead Properties
Marshfield 2.261Reading 2.261Morristown 2.2639Norwich 2.2646Wilmington 2.2673Johnson 2.2701Lincoln 2.2716Killington 2.2724Peacham 2.2729Greensboro 2.2825Cornwall 2.2857Panton 2.2994Groton 2.2995Bridport 2.3003Fairlee 2.3003Townshend 2.3053Calais 2.3088Shoreham 2.3097Northfield 2.3128Glastenbury 2.3264Chester 2.3325Vergennes 2.3375Windham 2.3528Braintree 2.3566Concord 2.3592Guilford 2.3646Duxbury 2.3856Wells River 2.3897Bradford 2.3955West Haven 2.4005Readsboro 2.4119Tunbridge 2.4159East Montpelier 2.4195West Fairlee 2.4272Fair Haven 2.4376Thetford 2.4491St. Johnsbury 2.4509Putney 2.4595Weybridge 2.4613Hartford 2.4727
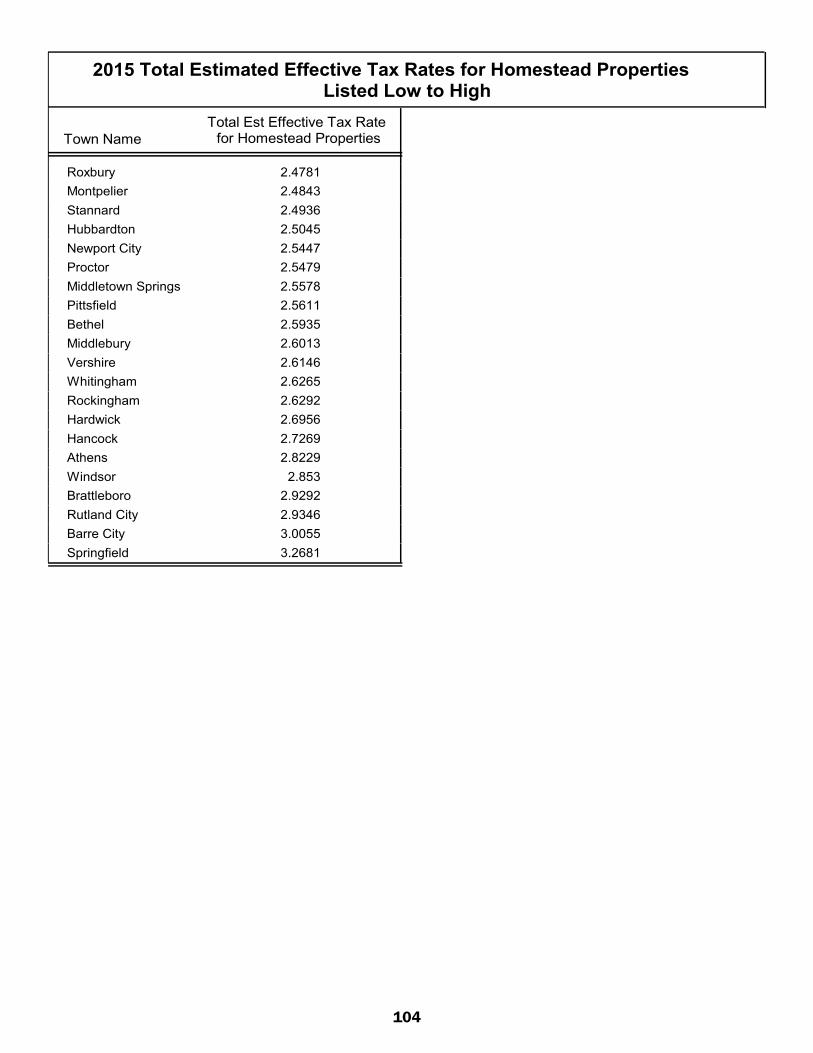
104
2015 Total Estimated Effective Tax Rates for Homestead PropertiesListed Low to High
Town NameTotal Est Effective Tax Rate
for Homestead Properties
Roxbury 2.4781Montpelier 2.4843Stannard 2.4936Hubbardton 2.5045Newport City 2.5447Proctor 2.5479Middletown Springs 2.5578Pittsfield 2.5611Bethel 2.5935Middlebury 2.6013Vershire 2.6146Whitingham 2.6265Rockingham 2.6292Hardwick 2.6956Hancock 2.7269Athens 2.8229Windsor 2.853Brattleboro 2.9292Rutland City 2.9346Barre City 3.0055Springfield 3.2681
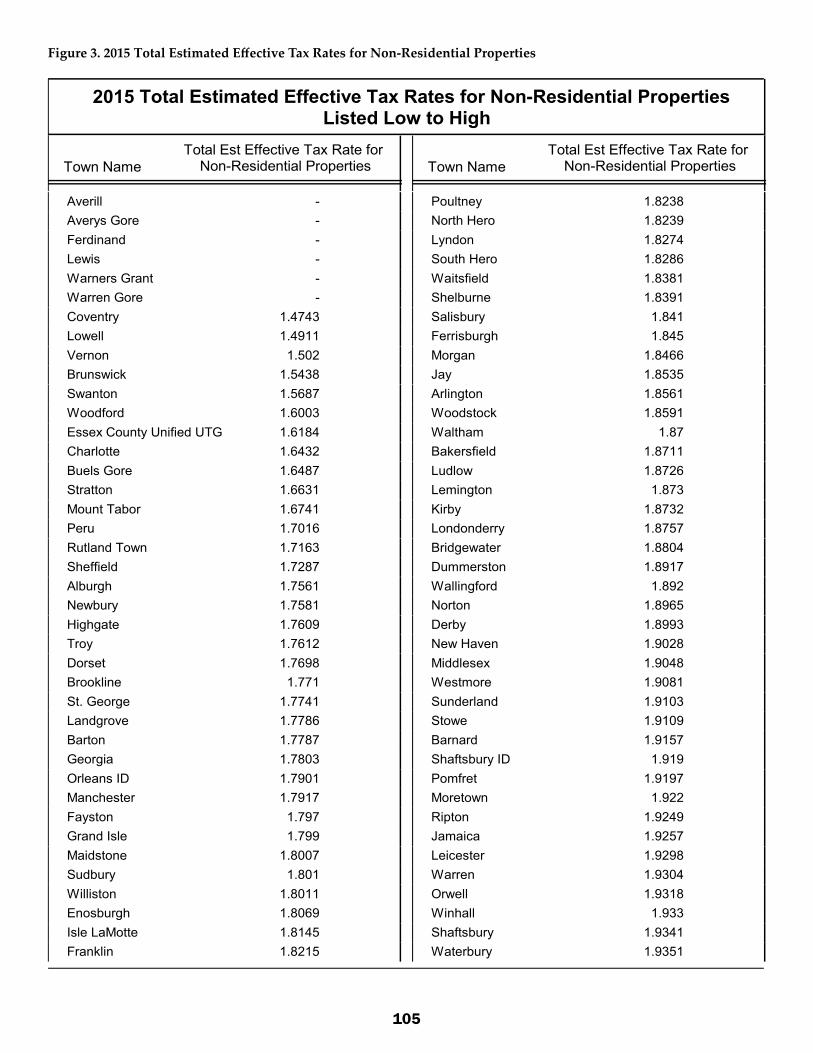
105
Figure 3. 2015 Total Estimated Effective Tax Rates for Non-Residential Properties
2015 Total Estimated Effective Tax Rates for Non-Residential PropertiesListed Low to High
Town NameTotal Est Effective Tax Rate for
Non-Residential Properties
Averill -Averys Gore -Ferdinand -Lewis -Warners Grant -Warren Gore -Coventry 1.4743Lowell 1.4911Vernon 1.502Brunswick 1.5438Swanton 1.5687Woodford 1.6003Essex County Unified UTG 1.6184Charlotte 1.6432Buels Gore 1.6487Stratton 1.6631Mount Tabor 1.6741Peru 1.7016Rutland Town 1.7163Sheffield 1.7287Alburgh 1.7561Newbury 1.7581Highgate 1.7609Troy 1.7612Dorset 1.7698Brookline 1.771St. George 1.7741Landgrove 1.7786Barton 1.7787Georgia 1.7803Orleans ID 1.7901Manchester 1.7917Fayston 1.797Grand Isle 1.799Maidstone 1.8007Sudbury 1.801Williston 1.8011Enosburgh 1.8069Isle LaMotte 1.8145Franklin 1.8215
Town NameTotal Est Effective Tax Rate for
Non-Residential Properties
Poultney 1.8238North Hero 1.8239Lyndon 1.8274South Hero 1.8286Waitsfield 1.8381Shelburne 1.8391Salisbury 1.841Ferrisburgh 1.845Morgan 1.8466Jay 1.8535Arlington 1.8561Woodstock 1.8591Waltham 1.87Bakersfield 1.8711Ludlow 1.8726Lemington 1.873Kirby 1.8732Londonderry 1.8757Bridgewater 1.8804Dummerston 1.8917Wallingford 1.892Norton 1.8965Derby 1.8993New Haven 1.9028Middlesex 1.9048Westmore 1.9081Sunderland 1.9103Stowe 1.9109Barnard 1.9157Shaftsbury ID 1.919Pomfret 1.9197Moretown 1.922Ripton 1.9249Jamaica 1.9257Leicester 1.9298Warren 1.9304Orwell 1.9318Winhall 1.933Shaftsbury 1.9341Waterbury 1.9351

106
2015 Total Estimated Effective Tax Rates for Non-Residential PropertiesListed Low to High
Town NameTotal Est Effective Tax Rate for
Non-Residential Properties
Waterville 1.9376Cavendish 1.9437Woodbury 1.944Victory 1.9446Montgomery 1.9456Starksboro 1.9466Burke 1.9472Castleton 1.9473St. Albans Town 1.9511Sandgate 1.9514Elmore 1.9522Addison 1.9547Wells 1.955Marlboro 1.9598Cambridge 1.9603Dover 1.9627Granby 1.9632Hartland 1.9637West Windsor 1.9638Mount Holly 1.9673Sheldon 1.9693Jericho 1.9701Eden 1.9723South Burlington 1.9727Hinesburg 1.9739Chittenden 1.9747Baltimore 1.9781Essex Jct. 1.9785Weybridge 1.9791Orange 1.9794Newark 1.9814Monkton 1.9856Pawlet 1.9929Essex Town 1.9947Bloomfield 1.9961Wilmington 1.9963Norwich 1.9998Fairfax 2Milton 2.0008Belvidere 2.0022
Town NameTotal Est Effective Tax Rate for
Non-Residential Properties
Brookfield 2.0032Irasburg 2.0078Pownal 2.0088Newport Town 2.01Danville 2.0117Berlin 2.015Reading 2.016Washington 2.0181Waterford 2.0215Lunenburg 2.0233Westfield 2.0239Berkshire 2.0243Shrewsbury 2.0271Colchester 2.0281Rupert 2.0304Mendon 2.0327Killington 2.0334Craftsbury 2.0357Cornwall 2.0385Stockbridge 2.0389Weston 2.0419Andover 2.0425Plymouth 2.0464Bridport 2.0479Pittsford 2.0519Clarendon 2.0537Cabot 2.0548Albany 2.057Shoreham 2.06Fairfield 2.0614Underhill 2.0627Fairlee 2.0674Searsburg 2.072Whiting 2.0727Danby 2.0806Thetford 2.0816Ira 2.0841Bolton 2.0857Wheelock 2.0859Peacham 2.0916

107
2015 Total Estimated Effective Tax Rates for Non-Residential PropertiesListed Low to High
Town NameTotal Est Effective Tax Rate for
Non-Residential Properties
Somerset 2.0923East Montpelier 2.094Newfane 2.0962Williamstown 2.0964Glover 2.0982Townshend 2.0995Bennington 2.1002Barnet 2.1045Westminster 2.1049Wardsboro 2.1072Brownington 2.1082North Bennington 2.1162Granville 2.1175Ryegate 2.1234Burlington 2.1235Fletcher 2.1258Weathersfield 2.1267Bristol 2.1269Huntington 2.1297Greensboro 2.1317Benson 2.1321Pittsfield 2.137Rochester 2.1401Worcester 2.1483Tinmouth 2.1517Walden 2.1569Richmond 2.1632Charleston 2.167Westford 2.1727Concord 2.176Strafford 2.1797Plainfield 2.1871East Haven 2.1878Chelsea 2.1914Wolcott 2.1939Groton 2.2005Winooski 2.2034Royalton 2.2036Guilford 2.2068Putney 2.209
Town NameTotal Est Effective Tax Rate for
Non-Residential Properties
West Fairlee 2.2114Calais 2.2132Holland 2.2168Corinth 2.2189Lincoln 2.2206Sharon 2.2227Randolph 2.236Marshfield 2.2372Duxbury 2.2398Windham 2.2412Panton 2.2427Canaan 2.2466Hyde Park 2.2534St. Albans City 2.275Sutton 2.2784Middletown Springs 2.2829West Rutland 2.287Stamford 2.2884Whitingham 2.2934Wells River 2.2963Stannard 2.2968Vergennes 2.2977Johnson 2.3218Grafton 2.3313Topsham 2.3545Tunbridge 2.3569Halifax 2.3577Morristown 2.3613Barre Town 2.365Brandon 2.3691Guildhall 2.375Vershire 2.3804Brighton 2.3884Northfield 2.3923West Haven 2.3923Goshen 2.3983Bethel 2.3997Chester 2.4014Hancock 2.4133Bradford 2.4185
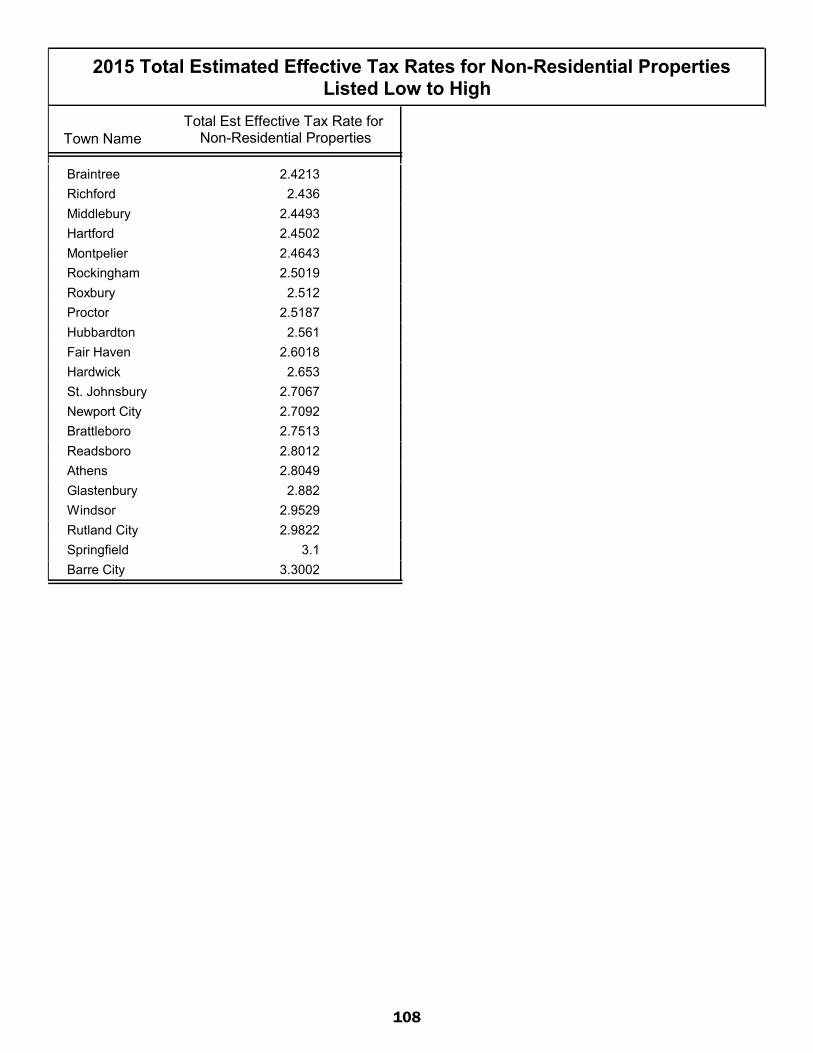
108
2015 Total Estimated Effective Tax Rates for Non-Residential PropertiesListed Low to High
Town NameTotal Est Effective Tax Rate for
Non-Residential Properties
Braintree 2.4213Richford 2.436Middlebury 2.4493Hartford 2.4502Montpelier 2.4643Rockingham 2.5019Roxbury 2.512Proctor 2.5187Hubbardton 2.561Fair Haven 2.6018Hardwick 2.653St. Johnsbury 2.7067Newport City 2.7092Brattleboro 2.7513Readsboro 2.8012Athens 2.8049Glastenbury 2.882Windsor 2.9529Rutland City 2.9822Springfield 3.1Barre City 3.3002
109
property Assessment Recommendations
As outlined in 32 V.S.A. § 3411(8), the Director of the Property Valuation and Review division of the Department of Taxes shall “from time to time to develop and recommend to the General Assembly improved methods for standardizing property assessment procedures…”
The education funding model established in Acts 60 and 68 relies heavily on the valuation of property, duties performed by local elected listers or assessors where municipalities have elected to abolish or supplement their Board of Listers. Valuation involves complex formulas with factors and rates which shift significantly from year to year. The local valuation model assigns a monetary value to each individual property in Vermont in order to create the Statewide and Municipal Grand Lists. These grand lists are then used to calculate payment of municipal and statewide education taxes. The responsibility of assessing and collecting nearly $2 billion of state and local funds from Vermont taxpayers requires the highest standard of fairness, equity, and transparency. For many Vermonters, whether they are property owners or renters, statewide education and municipal taxes represent their largest annual tax expense. Therefore, I offer the following considerations on improving and standardizing property assessment in Vermont.
Recommendation 1: Adjust How ClAs Are AppliedThe state should consider adjusting how the Common Level of Appraisal (CLA) is applied in the education tax rate calculation for the majority of Vermont municipalities. The CLA is calculated annually through a complex statistical process conducted by PVR known as the “equalization study” (described in this report) which determines a town-wide ratio of listed value to fair market value. However, many factors such as the type of property, involvement of realtors, deferred maintenance, closing cost agreements, and individual communication skills influence sales price, making fair market value a range of potential values rather than the absolute value as required by statute.
Alternative A: Five Year Rolling ReappraisalOne alternative would be to transition to a statewide rolling reappraisal on a five-year cycle administered by PVR. PVR could coordinate and contract with assessors in Vermont to perform the valuations while holding all contractors to the same standard. Administration of property reappraisal by a single organization would standardize methodology throughout Vermont and significantly improve equity. Under the current structure, the CLA evaluates how close the towns are to a calculated fair market value and also assesses how widely values are dispersed within a town through the Coefficient of Dispersion (see section on the “Equalization Study Based on 2015 Grand Lists”). However, it is still possible for listers and assessors to use different methodologies and produce different values for the same types of property. This can lead to situations where similar properties in different towns are assessed significantly different values between municipalities and the current tax rate calculation does not completely compensate for that discrepancy because it is based on the town-wide ratio between listed values and sale prices.
Towns would certainly need a mechanism to either appeal the values or sign off before publication to ensure that they are properly included. This approach could guarantee a consistent methodology, would vastly increase predictability, and would remove the need for the CLA to modify the tax rates. The equalization study could then be used as a monitoring tool to evaluate whether an area would need reappraisal ahead of the five-year cycle.
Alternative B: PVR Assumes Responsibility for High Value Commercial AppraisalsAlternatively, the state could consider whether PVR should assume of responsibility for high
110
value commercial appraisal properties. Valuation of high value commercial properties is a complex undertaking and has significant financial impact on not only the municipal revenues but also the statewide education tax rates. This makes it crucial that such properties are valued in a consistent, fair, and equitable manner throughout Vermont. An appeal mechanism, or inclusion during the finalization of values, for the municipalities to challenge the values derived by the State would need to be part of the structure as those values can have such a significant impact on municipal budgets and tax rates.
Alternative C: Change CLA limit requiring reappraisalShort of statewide reappraisal, the local appraisal process might be altered and strengthened in several ways. One alternative would be to treat CLAs calculated during the equalization study that fall between .95 and 1.05 be treated as 1 for the purposes of tax rate calculation. This would mean that a town which is assessing within a reasonable tolerance of fair market value, (10% which is universally accepted as a reasonable tolerance in the assessment world), would be taxed at fair market value. Towns which have a CLA outside of the range shown would apply the CLA in the tax rate calculation and be required to reappraise within a two-year period. The requirement to reappraise would not necessarily include all parcels within the town (unless that was clearly necessary) but could focus on the property classes or categories where the most significant deviation from the calculated fair market value is shown during the equalization study. Towns would need to submit a corrective action plan to PVR for approval, however, the significant difference from the current system would be that towns would not be required to plan for a complete reappraisal. This scenario could provide consistency for municipal financial planning, simplify the education tax rate calculation, and promote more active maintenance of property values, which should result in more accurate assessments and greater equity to Vermont taxpayers.
Recommendation 2: update property Card Data RegularlyThe state might also consider adding a requirement to update property card data in Vermont at least every 8 years. combined with the two-year re-appraisal period proposed in the first recommendation this would mean that no property in Vermont should go for more than 10 years without having the information updated. This would represent a significant improvement for equity in property assessment across Vermont.
Recommendation 3: Make VpA program MandatoryThe state could also consider whether the Vermont Property Assessor (VPA) certification program should be made mandatory for listers and assessors, whether the course work should include exams to demonstrate a level of proficiency, and whether PVR should publish Vermont property assessment best practices which would be developed in collaboration with the Vermont Assessors and Listers Association (VALA). In the current system, PVR provides guidance on assessment practices, relies heavily on International Association of Assessing Officers (IAAO) best practices, includes IAAO courses in the requirements for the VPA certification program, and sponsors IAAO courses on an annual basis. However, there is no requirement for listers or assessors to receive certification from PVR in order to perform maintenance of the grand list, nor is there a requirement (or demonstrated benefit) to follow PVR guidance on property valuation.
The goal would be to build professional level skill sets throughout the State of Vermont in order to ensure that property assessments are being created and adjusted in a fair and equitable manner. Adherence to those best practices could then be incentivized by providing municipalities with legal support and cost sharing of appeals losses provided the best practices were followed to the best of the assessing officer’s ability.
111
Recommendation 4: establish a Central Appeals Board Finally, the state could consider moving to a central appeals board, and removing the requirement for property inspection in order to allow appeals to be heard and resolved in a more expeditious manner. A mechanism could be created to allow for property inspection in the case where either party can demonstrate a need for the board members to be physically present at the property in question.
It is my intention in this report to identify potential options for improving the property assessment practices in Vermont and open a discussion. All of the recommendations listed above would require additional research, careful consideration, and planning to successfully implement. Statewide reappraisal in particular would require a great deal of research and analysis of funding changes, best practices in other states, mechanisms for ensuring local government is fully represented, and the overall fiscal impact to Vermont.
Respectfully,
Douglas R. Farnham
Director, Property Valuation & Review
Department of Taxes

112
Acronyms and terms
Average Circuit Breaker The Circuit Breaker Adjustment for a specific town divided by the number of Circuit Breaker Recipients
Average Educational Fund Adjustment The total Education Fund Tax Adjustments divided by the number of Recipients
CLA Common Level of Appraisal—The ratio of a school district’s total taxable unequalized education property tax value to the total taxable equalized education property value and is used to equalize education property tax rates throughout the State (p. 1); the ratio of a municipality’s total grand list value to its corresponding “equalized” value derived through PVR’s equalization study (p.2)
CAMA Computer Assisted Mass Appraisal system
Circuit Breaker Adjustment The additional adjustment provided to households with income under $47,000 per year that caps the total property tax liability at the specified percentage of income.
Circuit Breaker Recipients The number of Housesite Claimants qualifying for the Circuit Breaker Adjustment.
COD Coefficient of Dispersion—Measure of the equity across property assessments in a given category and the municipality’s grand list
CUAB Current Use Advisory Board—Charged with adopting rules, providing administrative oversight, and establishing use values for the Current Use
Education Fund Tax Adjustment The amount of revenue foregone by the Education Fund to pay for the property tax adjustment credits, excluding the Circuit Breaker
EEPV Equalized Education Property Value—The equalization study’s estimate of market value for a municipality
EFT Effective Tax Rate—Rates that would be in effect if all towns were appraised at 100 percent of market value with no equalization adjustment
ePTTR Electronic Property Transfer Tax Return—An online electronic filing system for Property Transfer Tax Returns

113
FY Fiscal Year—For example FY2016
Housesite A residence including supporting buildings and the surrounding land, up to two acres, comprise a housesite
IAAO International Association of Assessing Officers
LUCT Land Use Change Tax—A tax that is assessed to participants in the Current Use Program (also known as Use Value Appraisal Program) when any portion of enrolled land leaves the program
NEMRC New England Municipal Resource Center
PILOT Payment-In-Lieu-Of-Taxes—Annual payments made to municipalities to compensate them for lost municipal tax revenue due to the presence of state-owned buildings or land in a municipality
PVR Property Valuation and Review—A division of the Vermont Department of Taxes that oversees assessment and assessment practices
Recipient The number of Housesite Claimants qualifying for the School Tax Adjustment
R1 Residential property, under 6 acres—A property category code used in identifying categories of properties on the Grand List
S1 Seasonal property, under 6 acres—A property category code used in identifying categories of properties on the Grand List
TIF Tax Increment Financing districts—A special program through the Vermont Economic Progress Council that allows towns to hold back a portion of their town’s education payment obligation to pay for infrastructure
TY Tax year—For example, TY2015
UTG Unified Towns and Gores of Essex County