State of the U.S. Ocean and Coastal Economies 2009
62
Center for the Blue Economy Digital Commons @ Center for the Blue Economy Publications National Ocean Economics Program Summer 10-31-2009 State of the U.S. Ocean and Coastal Economies 2009 Judith T. Kildow NOEP Charles S. Colgan University of Southern Maine Jason D. Scorse Center for the Blue Economy Follow this and additional works at: hps://cbe.miis.edu/noep_publications Part of the Agricultural and Resource Economics Commons , Growth and Development Commons , Science and Technology Studies Commons , and the Urban Studies and Planning Commons is Article is brought to you for free and open access by the National Ocean Economics Program at Digital Commons @ Center for the Blue Economy. It has been accepted for inclusion in Publications by an authorized administrator of Digital Commons @ Center for the Blue Economy. For more information, please contact [email protected]. Recommended Citation Kildow, Judith T.; Colgan, Charles S.; and Scorse, Jason D., "State of the U.S. Ocean and Coastal Economies 2009" (2009). Publications. 4. hps://cbe.miis.edu/noep_publications/4
Transcript of State of the U.S. Ocean and Coastal Economies 2009
Center for the Blue EconomyDigital Commons @ Center for the Blue Economy
Publications National Ocean Economics Program
Summer 10-31-2009
State of the U.S. Ocean and Coastal Economies2009Judith T. KildowNOEP
Charles S. ColganUniversity of Southern Maine
Jason D. ScorseCenter for the Blue Economy
Follow this and additional works at: https://cbe.miis.edu/noep_publications
Part of the Agricultural and Resource Economics Commons, Growth and DevelopmentCommons, Science and Technology Studies Commons, and the Urban Studies and PlanningCommons
This Article is brought to you for free and open access by the National Ocean Economics Program at Digital Commons @ Center for the BlueEconomy. It has been accepted for inclusion in Publications by an authorized administrator of Digital Commons @ Center for the Blue Economy. Formore information, please contact [email protected].
Recommended CitationKildow, Judith T.; Colgan, Charles S.; and Scorse, Jason D., "State of the U.S. Ocean and Coastal Economies 2009" (2009). Publications.4.https://cbe.miis.edu/noep_publications/4

State of the U.S. Ocean and Coastal Economies 2009
AbstractThis nation’s coasts and oceans contribute much to the United States economy. For the past ten years, theNational Ocean Economics Program (NOEP) has compiled time-series data that track economicactivities,demographics, natural resource production, non-market values, and federal expenditures in the U.S.coastal zone both on land and in the water. On the website www.oceaneconomics.org, thepublic—government officials,academics, industry, and advocacy groups—have had interactive access to thisinformation and used it widely for many different purposes. This report features highlights from this collectionto heighten appreciation for the value of the ocean and this nation’s coasts among an even broader audience.Two economies were measured:
the ocean economy, which includes all ocean-dependent activities in coastal states, and the coastal economy,which includes all economic activity in coastal states, with geographies such as zip codes, counties, andwatersheds.
Non-market values for goods and services not traded in the market place are also included for purposes ofunderstanding the often underestimated values of America’s natural resources.
This article is available at Digital Commons @ Center for the Blue Economy: https://cbe.miis.edu/noep_publications/4
We Value the Oceanswww.oceaneconomics.org
State of the U.S. Ocean and Coastal Economies
Judith T. Kildow • Charles S. Colgan • Jason Scorse
2009The United States must ensure sustainable use of its marine resources to maintain its
place in the global economy.
The nation relies on ocean systems to produce food, energy, and pharmaceuticals.
Large sectors of the U.S. economy depend on the oceans to transport goods.
Energy needs, land use, and climate change will challenge management of our coasts
and oceans in the future.
The Economy Relies on a Healthy Ocean
AcknowledgementsThis report was prepared by three primary authors. Judith Kildow, Director and PI for the National Ocean Economics Program, orchestrated the report and authored the Executive Summary and Introduction. Charles Colgan, Professor of Public Policy and Management in the Muskie School of Public Service at the University of Southern Maine and Chair of the Muskie School’s Graduate Program in Community Planning and Development, wrote Chapters 2, 3, and 5. Jason Scorse, Professor and Program Coordinator for the International Environmental Policy Program at the Monterey Institute for International Studies, with research and editorial assistance from Shannon McDiarmid, authored Chapter 4. Bonnie Lockwood, Program Manager at the NOEP, conducted research, and facilitated and edited the draft report. Pat Johnston, Information Systems Manager for the NOEP, compiled data for most chapters and created some of the graphics used in the report.
The authors take full responsibility for the content and thank all of the reviewers for their suggestions and ideas. Reviewers were Jeff Adkins, Paul Sandifer, and Peter Wiley from National Oceanic and Atmospheric Administration (NOAA); Maureen Stancik Boyce, IBM; Lou Cafiero, National Marine Sanctuary Foundation; James Cato, University of Florida; Richard Carson, University of California, San Diego; Karen Garrison and colleagues at Natural Resources Defense Council; Hauke L. Kite-Powell, Woods Hole Oceanographic Institution; Linwood Pendleton, Coastal Ocean Values Center; Karen Polenske, Massachusetts Institute of Technology; Giulio Pontecorvo, Columbia University; Dave Talan, U.S. Bureau of Labor Statistics; and David Terkla, University of Massachusetts.
Thanks go to NOAA’s Coastal Services Center who provided the core funding for this report, and the National Marine Sanctuary Foundation for sponsoring the release of this report.
NOEP National Advisory Board Maureen Stancik Boyce, IBM; Michael Hanemann, University of California, Berkeley; Karen Garrison, Natural Resources Defense Council; Roger McManus, Conservation International; Michael Orbach, Duke University; Karen Polenske, Massachusetts Institute of Technology; Giulio Pontecorvo, Columbia University; and Robert Solow; Massachusetts Institute of Technology.
CreditsGraphic Design: WIRED IN design
This report is available on-line as a PDF file at: http://www.OceanEconomics.org/nationalreport
All rights reserved. No part of this publication may be reproduced without acknowledgement to The National Ocean Economics Program
Printed on recycled paper.

State of the U.S. Ocean and Coastal Economies 1
Table of Contents
List of Figures and Tables . . . . . . . . . . . . . . . . . . . . . . . . . . . . . . . . . . . . . . . . . . . . . . . . . . . . . . . . . . . . . . . . . .2Definitions and Terminology . . . . . . . . . . . . . . . . . . . . . . . . . . . . . . . . . . . . . . . . . . . . . . . . . . . . . . . . . . . . . . .4Executive Summary . . . . . . . . . . . . . . . . . . . . . . . . . . . . . . . . . . . . . . . . . . . . . . . . . . . . . . . . . . . . . . . . . . . . . . .6Chapter 1: Introduction. . . . . . . . . . . . . . . . . . . . . . . . . . . . . . . . . . . . . . . . . . . . . . . . . . . . . . . . . . . . . . . . . . . .8
1.1 The Ocean and Coastal Economies . . . . . . . . . . . . . . . . . . . . . . . . . . . . . . . . . . . . . . . . . . . . . . . . . 91.2 About the Data . . . . . . . . . . . . . . . . . . . . . . . . . . . . . . . . . . . . . . . . . . . . . . . . . . . . . . . . . . . . . . . 101.3 What is Covered and Not Covered in This Report?. . . . . . . . . . . . . . . . . . . . . . . . . . . . . . . . . . . . 101.4 Vulnerability from a Changing Environment . . . . . . . . . . . . . . . . . . . . . . . . . . . . . . . . . . . . . . . . 111.5 References . . . . . . . . . . . . . . . . . . . . . . . . . . . . . . . . . . . . . . . . . . . . . . . . . . . . . . . . . . . . . . . . . . . 12
Chapter 2: The Coastal Economy . . . . . . . . . . . . . . . . . . . . . . . . . . . . . . . . . . . . . . . . . . . . . . . . . . . . . . . . . . 132.1 Introduction . . . . . . . . . . . . . . . . . . . . . . . . . . . . . . . . . . . . . . . . . . . . . . . . . . . . . . . . . . . . . . . . . 132.2 The Size of the Coastal Economy in 2007. . . . . . . . . . . . . . . . . . . . . . . . . . . . . . . . . . . . . . . . . . . 142.3 Sprawl and the Coastal Economy . . . . . . . . . . . . . . . . . . . . . . . . . . . . . . . . . . . . . . . . . . . . . . . . . 162.4 Providing Services is the Major Economic Activity of Coastal Regions . . . . . . . . . . . . . . . . . . . . . 182.5 Conclusion . . . . . . . . . . . . . . . . . . . . . . . . . . . . . . . . . . . . . . . . . . . . . . . . . . . . . . . . . . . . . . . . . . 192.6 Reference. . . . . . . . . . . . . . . . . . . . . . . . . . . . . . . . . . . . . . . . . . . . . . . . . . . . . . . . . . . . . . . . . . . . 192.7 Chapter 2 Appendix . . . . . . . . . . . . . . . . . . . . . . . . . . . . . . . . . . . . . . . . . . . . . . . . . . . . . . . . . . . 19
Chapter 3: The Ocean Economy . . . . . . . . . . . . . . . . . . . . . . . . . . . . . . . . . . . . . . . . . . . . . . . . . . . . . . . . . . . 203.1 Defining and Measuring the Ocean Economy. . . . . . . . . . . . . . . . . . . . . . . . . . . . . . . . . . . . . . . . 203.2 The National Ocean Economy . . . . . . . . . . . . . . . . . . . . . . . . . . . . . . . . . . . . . . . . . . . . . . . . . . . 213.3 The Ocean Economy in the States. . . . . . . . . . . . . . . . . . . . . . . . . . . . . . . . . . . . . . . . . . . . . . . . . 253.4 The Ocean Economy Sectors. . . . . . . . . . . . . . . . . . . . . . . . . . . . . . . . . . . . . . . . . . . . . . . . . . . . . 273.5 Beyond the NOEP Ocean Economy . . . . . . . . . . . . . . . . . . . . . . . . . . . . . . . . . . . . . . . . . . . . . . . 363.6 Conclusion . . . . . . . . . . . . . . . . . . . . . . . . . . . . . . . . . . . . . . . . . . . . . . . . . . . . . . . . . . . . . . . . . . 373.7 References . . . . . . . . . . . . . . . . . . . . . . . . . . . . . . . . . . . . . . . . . . . . . . . . . . . . . . . . . . . . . . . . . . . 37
Chapter 4: Non-market Values Complete the Economic Picture. . . . . . . . . . . . . . . . . . . . . . . . . . . . . . . . . 384.1 The Non-market Economy is Critical for Policy Makers . . . . . . . . . . . . . . . . . . . . . . . . . . . . . . . . 384.2 U.S. Government Programs . . . . . . . . . . . . . . . . . . . . . . . . . . . . . . . . . . . . . . . . . . . . . . . . . . . . . 394.3 Non-market Values for Environmental Goods and Services . . . . . . . . . . . . . . . . . . . . . . . . . . . . . . 394.4 Non-market Recreational and Leisure Values. . . . . . . . . . . . . . . . . . . . . . . . . . . . . . . . . . . . . . . . . 404.5 Ecosystem and Environmental Services . . . . . . . . . . . . . . . . . . . . . . . . . . . . . . . . . . . . . . . . . . . . . 414.6 Other Sources of Non-market Values . . . . . . . . . . . . . . . . . . . . . . . . . . . . . . . . . . . . . . . . . . . . . . 414.7 Coastal and Ocean Recreation Participation Rates. . . . . . . . . . . . . . . . . . . . . . . . . . . . . . . . . . . . . 414.8 The Total Non-market Value of the Nation’s Ocean and Coastal Resources . . . . . . . . . . . . . . . . . 424.9 Current State of Knowledge . . . . . . . . . . . . . . . . . . . . . . . . . . . . . . . . . . . . . . . . . . . . . . . . . . . . . 434.10 Conclusion . . . . . . . . . . . . . . . . . . . . . . . . . . . . . . . . . . . . . . . . . . . . . . . . . . . . . . . . . . . . . . . . . . 444.11 References . . . . . . . . . . . . . . . . . . . . . . . . . . . . . . . . . . . . . . . . . . . . . . . . . . . . . . . . . . . . . . . . . . . 45
Chapter 5: The Future of the Ocean and Coastal Economies . . . . . . . . . . . . . . . . . . . . . . . . . . . . . . . . . . . . 475.1 Recession, Recovery, and the Ocean Economy . . . . . . . . . . . . . . . . . . . . . . . . . . . . . . . . . . . . . . . 475.2 Recession, Recovery, and the Coastal Economy. . . . . . . . . . . . . . . . . . . . . . . . . . . . . . . . . . . . . . . 505.3 Summary. . . . . . . . . . . . . . . . . . . . . . . . . . . . . . . . . . . . . . . . . . . . . . . . . . . . . . . . . . . . . . . . . . . . 515.4 Beyond Recession and Recovery: The Coastal and Ocean Economies to 2030. . . . . . . . . . . . . . . . 515.5 Conclusion . . . . . . . . . . . . . . . . . . . . . . . . . . . . . . . . . . . . . . . . . . . . . . . . . . . . . . . . . . . . . . . . . . 565.6 References . . . . . . . . . . . . . . . . . . . . . . . . . . . . . . . . . . . . . . . . . . . . . . . . . . . . . . . . . . . . . . . . . . . 56
Table of Contents
2 National Ocean Economics Program
List of Figures and Tables
List of Figures and TablesFigure 1.1 Coastal and ocean economies are not the same. . . . . . . . . . . . . . . . . . . . . . . . . . . . . . . . . . . . . . .9Figure 2.1 The coastal economy components in 2007 . . . . . . . . . . . . . . . . . . . . . . . . . . . . . . . . . . . . . . . .13Figure 2.2 Map of coastal states . . . . . . . . . . . . . . . . . . . . . . . . . . . . . . . . . . . . . . . . . . . . . . . . . . . . . . . . .14Figure 2.3 Size of shore-adjacent economy compared with percent of state
economy in shore-adjacent counties. . . . . . . . . . . . . . . . . . . . . . . . . . . . . . . . . . . . . . . . . . . . . .15Figure 2.4 Coastal economy share of national growth 1997-2007. . . . . . . . . . . . . . . . . . . . . . . . . . . . . . . .16Figure 2.5 Employment growth in shore-adjacent counties 1997-2007. . . . . . . . . . . . . . . . . . . . . . . . . . . .16Figure 2.6 Proportion of coastal economy in metropolitan areas, 2007 . . . . . . . . . . . . . . . . . . . . . . . . . . . .17Figure 2.7 Regional growth rates in coastal states 1997-2007 . . . . . . . . . . . . . . . . . . . . . . . . . . . . . . . . . . .17Figure 2.8 Specialization of coastal areas based on location quotient of employment, 2007 . . . . . . . . . . . .18Figure 2.9 Employment and population densities in the coastal economy, 2007 . . . . . . . . . . . . . . . . . . . . .18Figure 3.1 Ocean sector employment, 2004 . . . . . . . . . . . . . . . . . . . . . . . . . . . . . . . . . . . . . . . . . . . . . . . .22Figure 3.2 Ocean sector GDP, 2004 . . . . . . . . . . . . . . . . . . . . . . . . . . . . . . . . . . . . . . . . . . . . . . . . . . . . . .22Figure 3.3 Ocean economy growth by sector 1997-2004 . . . . . . . . . . . . . . . . . . . . . . . . . . . . . . . . . . . . . .23Figure 3.4 Employment growth in coastal and ocean economies 1997-2004. . . . . . . . . . . . . . . . . . . . . . . .23Figure 3.5 Ocean economy sector employment growth indexed 1998-2004 . . . . . . . . . . . . . . . . . . . . . . . .24Figure 3.6 Ocean economy real GDP change 1997-2004 . . . . . . . . . . . . . . . . . . . . . . . . . . . . . . . . . . . . . .24Figure 3.7 Ocean economy growth ranking by state 1997-2004 . . . . . . . . . . . . . . . . . . . . . . . . . . . . . . . . .26Figure 3.8 Marine construction economic change 1997-2004 . . . . . . . . . . . . . . . . . . . . . . . . . . . . . . . . . .26Figure 3.9 Source of funding for beach nourishment, cumulative 1960-2007. . . . . . . . . . . . . . . . . . . . . . .27Figure 3.10 Top-ten beach nourishment states by expenditure 1960-2007 . . . . . . . . . . . . . . . . . . . . . . . . . .28Figure 3.11 Top-ten beach nourishment states by volume 1960-2007 . . . . . . . . . . . . . . . . . . . . . . . . . . . . .28Figure 3.12 Economic change in the living resources sector 1997-2004 . . . . . . . . . . . . . . . . . . . . . . . . . . . .28Figure 3.13 Living resources industries economic growth 1997-2004 . . . . . . . . . . . . . . . . . . . . . . . . . . . . . .29Figure 3.14 U.S. fisheries landings and landed value 1990-2007. . . . . . . . . . . . . . . . . . . . . . . . . . . . . . . . . .29Figure 3.15 Change in landings by major region 1990-2007 . . . . . . . . . . . . . . . . . . . . . . . . . . . . . . . . . . . .30Figure 3.16 Comparison of U.S. domestic fish landings with foreign imported fish 1997-2007 . . . . . . . . . .30Figure 3.17 Ocean minerals industries economic growth 1997-2004 . . . . . . . . . . . . . . . . . . . . . . . . . . . . . .31Figure 3.18 Economic growth in minerals sector 1997-2004 . . . . . . . . . . . . . . . . . . . . . . . . . . . . . . . . . . . .31Figure 3.19 Offshore oil production in state and federal waters 1990-2004 . . . . . . . . . . . . . . . . . . . . . . . . .32Figure 3.20 Economic change in the ship & boat building sector 1997-2004. . . . . . . . . . . . . . . . . . . . . . . .32Figure 3.21 Economic growth in the ship & boat building industries 1997-2004. . . . . . . . . . . . . . . . . . . . .33Figure 3.22 Economic change in the ocean tourism & recreation sector 1997-2004 . . . . . . . . . . . . . . . . . . .33Figure 3.23 Economic change in tourism & recreation sector 1997-2004. . . . . . . . . . . . . . . . . . . . . . . . . . .34Figure 3.24 Economic change in the marine transportation sector 1997-2004 . . . . . . . . . . . . . . . . . . . . . . .34Figure 3.25 Economic growth in marine transportation industries 1997-2004 . . . . . . . . . . . . . . . . . . . . . . .35Figure 3.26 Marine transportation waterborne freight 1997-2007 . . . . . . . . . . . . . . . . . . . . . . . . . . . . . . . .35Figure 3.27 Cruise ship industry growth 2002-2006. . . . . . . . . . . . . . . . . . . . . . . . . . . . . . . . . . . . . . . . . . .36Figure 3.28 Cruise ship embarkations by state, 2006 . . . . . . . . . . . . . . . . . . . . . . . . . . . . . . . . . . . . . . . . . .36Figure 4.1 Regional distribution of U.S. non-market study sites . . . . . . . . . . . . . . . . . . . . . . . . . . . . . . . . .43Figure 4.2 Regional distribution of U.S. non-market study sites by category. . . . . . . . . . . . . . . . . . . . . . . .44Figure 5.1 State unemployment rates March 2009 (seasonally adjusted) . . . . . . . . . . . . . . . . . . . . . . . . . . .50Figure 5.2 Percent of mortgages in county 90-days or more delinquent 2007-2008 . . . . . . . . . . . . . . . . . .50Figure 5.3 Sea level rise map: New Jersey . . . . . . . . . . . . . . . . . . . . . . . . . . . . . . . . . . . . . . . . . . . . . . . . . .54Figure 5.4 Number of species listed as overfished, 2008 . . . . . . . . . . . . . . . . . . . . . . . . . . . . . . . . . . . . . . .55
List of Figures and Tables
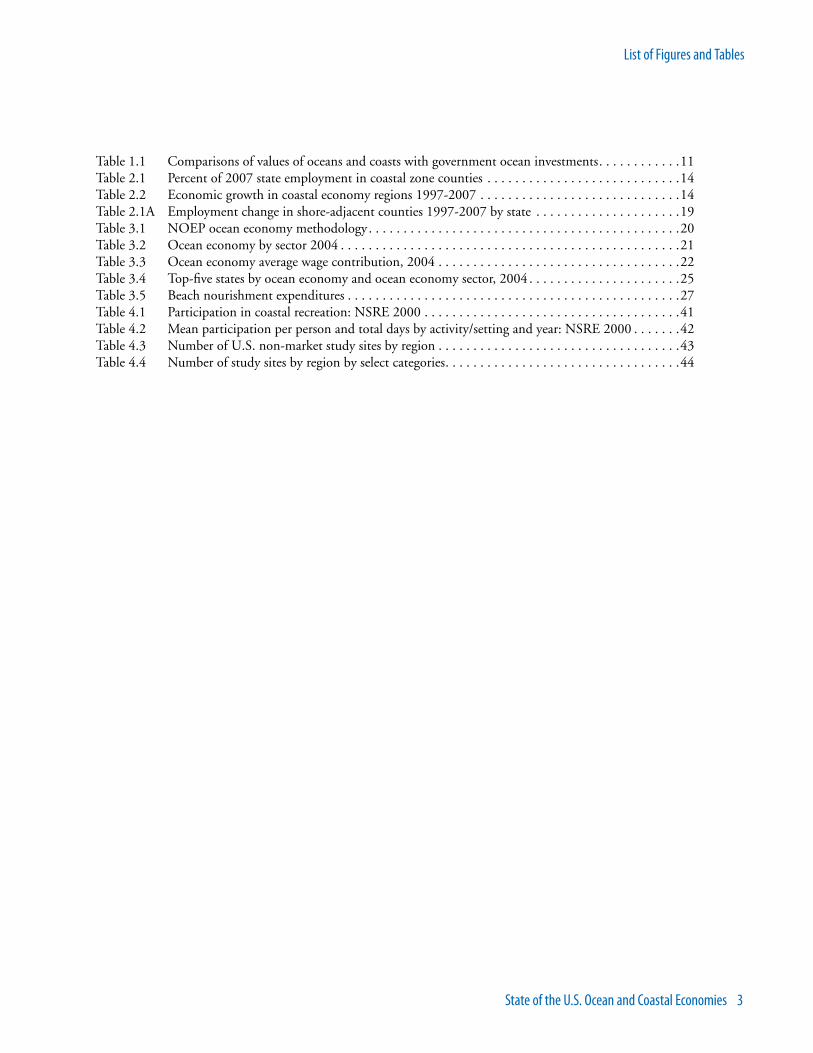
State of the U.S. Ocean and Coastal Economies 3
List of Figures and Tables
Table 1.1 Comparisons of values of oceans and coasts with government ocean investments. . . . . . . . . . . .11Table 2.1 Percent of 2007 state employment in coastal zone counties . . . . . . . . . . . . . . . . . . . . . . . . . . . .14Table 2.2 Economic growth in coastal economy regions 1997-2007 . . . . . . . . . . . . . . . . . . . . . . . . . . . . .14Table 2.1A Employment change in shore-adjacent counties 1997-2007 by state . . . . . . . . . . . . . . . . . . . . .19Table 3.1 NOEP ocean economy methodology. . . . . . . . . . . . . . . . . . . . . . . . . . . . . . . . . . . . . . . . . . . . .20Table 3.2 Ocean economy by sector 2004 . . . . . . . . . . . . . . . . . . . . . . . . . . . . . . . . . . . . . . . . . . . . . . . . .21Table 3.3 Ocean economy average wage contribution, 2004 . . . . . . . . . . . . . . . . . . . . . . . . . . . . . . . . . . .22Table 3.4 Top-five states by ocean economy and ocean economy sector, 2004 . . . . . . . . . . . . . . . . . . . . . .25Table 3.5 Beach nourishment expenditures . . . . . . . . . . . . . . . . . . . . . . . . . . . . . . . . . . . . . . . . . . . . . . . .27Table 4.1 Participation in coastal recreation: NSRE 2000 . . . . . . . . . . . . . . . . . . . . . . . . . . . . . . . . . . . . .41Table 4.2 Mean participation per person and total days by activity/setting and year: NSRE 2000 . . . . . . .42Table 4.3 Number of U.S. non-market study sites by region . . . . . . . . . . . . . . . . . . . . . . . . . . . . . . . . . . .43Table 4.4 Number of study sites by region by select categories. . . . . . . . . . . . . . . . . . . . . . . . . . . . . . . . . .44

4 National Ocean Economics Program
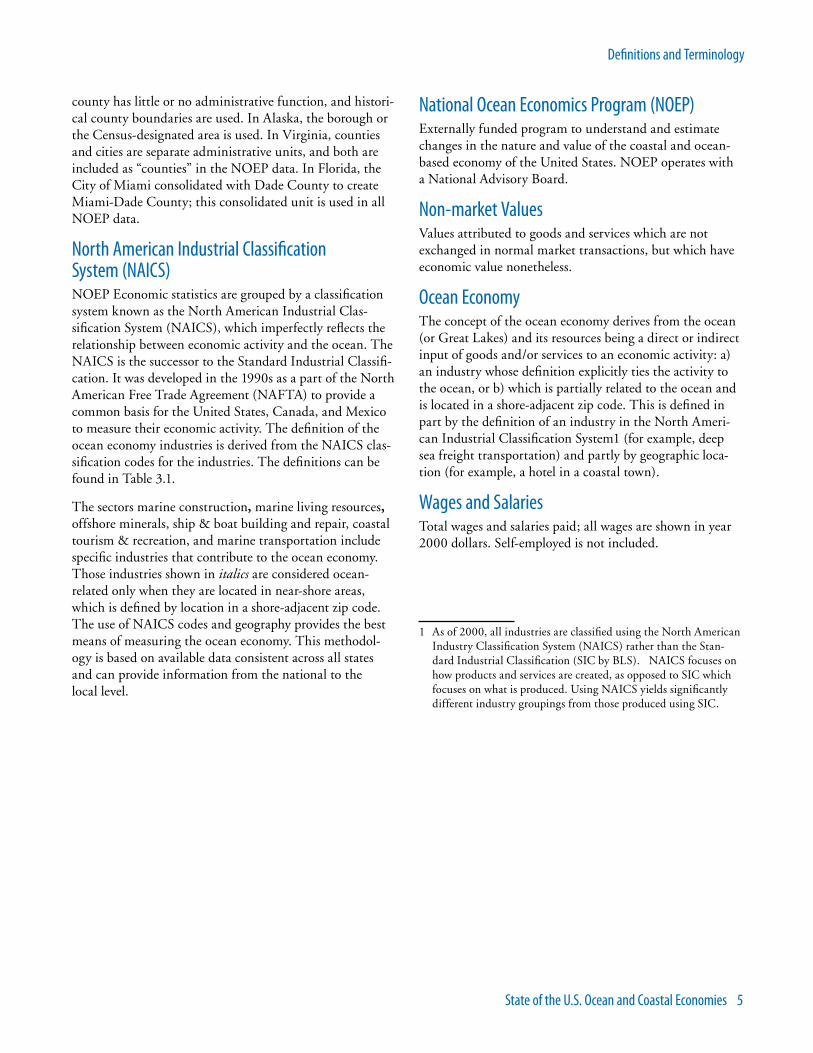
Definitions and Terminology
The following terms and definitions regarding economic indicators and valuation categories are presented in the beginning of this report to avoid repetition and for pur-poses of clarity so that the reader can understand fully the intent of the authors.
Coastal EconomyThe sum of all economic activity occurring in counties defined by states as part of their coastal zone manage-ment program or part of a coastal watershed as defined by the U.S. Geological Survey. For purposes of analyz-ing the Florida coastal economy, counties are divided between shore-adjacent and inland counties more clearly to illuminate the differences between the shoreline and inland regions.
Consumer Surplus Non-market values reflected in the difference between what consumers pay for a good and the maximum that they would be willing to pay for the same good.
Dead Zones“Dead zones” in this context are areas where the bottom water (the water at the sea floor) is anoxic—meaning that it has very low (or completely zero) concentrations of dis-solved oxygen. Because very few organisms can tolerate the lack of oxygen in these areas, they can destroy the habitat in which numerous organisms make their home (NASA 2009).
Dollar ValuesValues are expressed in constant dollars with 2000 as the base year unless otherwise stated. Wages are adjusted using the U.S. Consumer Price Index (CPI). The Gross State Product (GDP-S) is estimated using U.S. Bureau of Economic Analysis (BEA) estimates of real GDP (Landefeld 1997).
Direct values are those activities associated only with the designated ocean sectors such as recreation & tourism and living resources (examples include labor and capital costs associated with fish processing or ship building).
“Chain weighted dollars” are a method of computing the difference in value arising solely from changes in price. This is done by first estimating changes in the quantities of goods and services produced at different time periods
and then separating overall changes in value into price and quantity changes. The result is a more accurate method of estimating the effects of inflation on changes in output than using multipliers. (For more information, see Yuskav-age, Robert 1996 Improved Estimates of Gross Product by Industry 1959-1994. Survey of Current Business August 1996.)
Unless otherwise indicated, all measures are stated as direct values.
EmploymentAnnual average wage and salary employment (excluding self-employment) as reported in the Quarterly Census of Employment and Wages (formerly known as the ES-202 employment series). This definition covers about 90% of employment in the United States. It excludes farm employ-ment, the military, railroads, and self-employment. Wage and salary employment measures employment by place of work, not by place of residence. It also measures jobs, not people. It does not distinguish between full- and part-time work, or year-round and part-year jobs. The data in the NOEP database are annual average employment. Employ-ment in the fisheries harvesting sector is generally excluded from the unemployment insurance laws and thus is not included in the NOEP data.
Gross Domestic Product (GDP)GDP-S is a measure of the contribution of the sector to the value of goods and services in the economy. GDP is a measure of value-added, or sales, minus the cost of inputs. Using this measure eliminates “double counting,” among sectors. GDP data are published only at the state level and for industry aggregations greater than used in the ocean economy definition. In order to estimate a share of GDP in an ocean or coastal economy industry, the proportion of the GDP for a given sector is calculated based on the proportion of total wages paid in that sector by a given establishment. Since wages often account for as much as 60% of GDP, this method is a reasonable approximation of individual establishments’ contribution to GDP.
Geography“County” means a county or a county-equivalent area as defined by the Census. In most states, the county is an administrative unit of local government; this includes par-ishes in Louisiana. In Massachusetts and Connecticut the
Definitions and Terminology
State of the U.S. Ocean and Coastal Economies 5
Definitions and Terminology
county has little or no administrative function, and histori-cal county boundaries are used. In Alaska, the borough or the Census-designated area is used. In Virginia, counties and cities are separate administrative units, and both are included as “counties” in the NOEP data. In Florida, the City of Miami consolidated with Dade County to create Miami-Dade County; this consolidated unit is used in all NOEP data.
North American Industrial Classification System (NAICS)NOEP Economic statistics are grouped by a classification system known as the North American Industrial Clas-sification System (NAICS), which imperfectly reflects the relationship between economic activity and the ocean. The NAICS is the successor to the Standard Industrial Classifi-cation. It was developed in the 1990s as a part of the North American Free Trade Agreement (NAFTA) to provide a common basis for the United States, Canada, and Mexico to measure their economic activity. The definition of the ocean economy industries is derived from the NAICS clas-sification codes for the industries. The definitions can be found in Table 3.1.
The sectors marine construction, marine living resources, offshore minerals, ship & boat building and repair, coastal tourism & recreation, and marine transportation include specific industries that contribute to the ocean economy. Those industries shown in italics are considered ocean-related only when they are located in near-shore areas, which is defined by location in a shore-adjacent zip code. The use of NAICS codes and geography provides the best means of measuring the ocean economy. This methodol-ogy is based on available data consistent across all states and can provide information from the national to the local level.
National Ocean Economics Program (NOEP)Externally funded program to understand and estimate changes in the nature and value of the coastal and ocean-based economy of the United States. NOEP operates with a National Advisory Board.
Non-market ValuesValues attributed to goods and services which are not exchanged in normal market transactions, but which have economic value nonetheless.
Ocean EconomyThe concept of the ocean economy derives from the ocean (or Great Lakes) and its resources being a direct or indirect input of goods and/or services to an economic activity: a) an industry whose definition explicitly ties the activity to the ocean, or b) which is partially related to the ocean and is located in a shore-adjacent zip code. This is defined in part by the definition of an industry in the North Ameri-can Industrial Classification System1 (for example, deep sea freight transportation) and partly by geographic loca-tion (for example, a hotel in a coastal town).
Wages and SalariesTotal wages and salaries paid; all wages are shown in year 2000 dollars. Self-employed is not included.
1 As of 2000, all industries are classified using the North American Industry Classification System (NAICS) rather than the Stan-dard Industrial Classification (SIC by BLS). NAICS focuses on how products and services are created, as opposed to SIC which focuses on what is produced. Using NAICS yields significantly different industry groupings from those produced using SIC.
6 National Ocean Economics Program
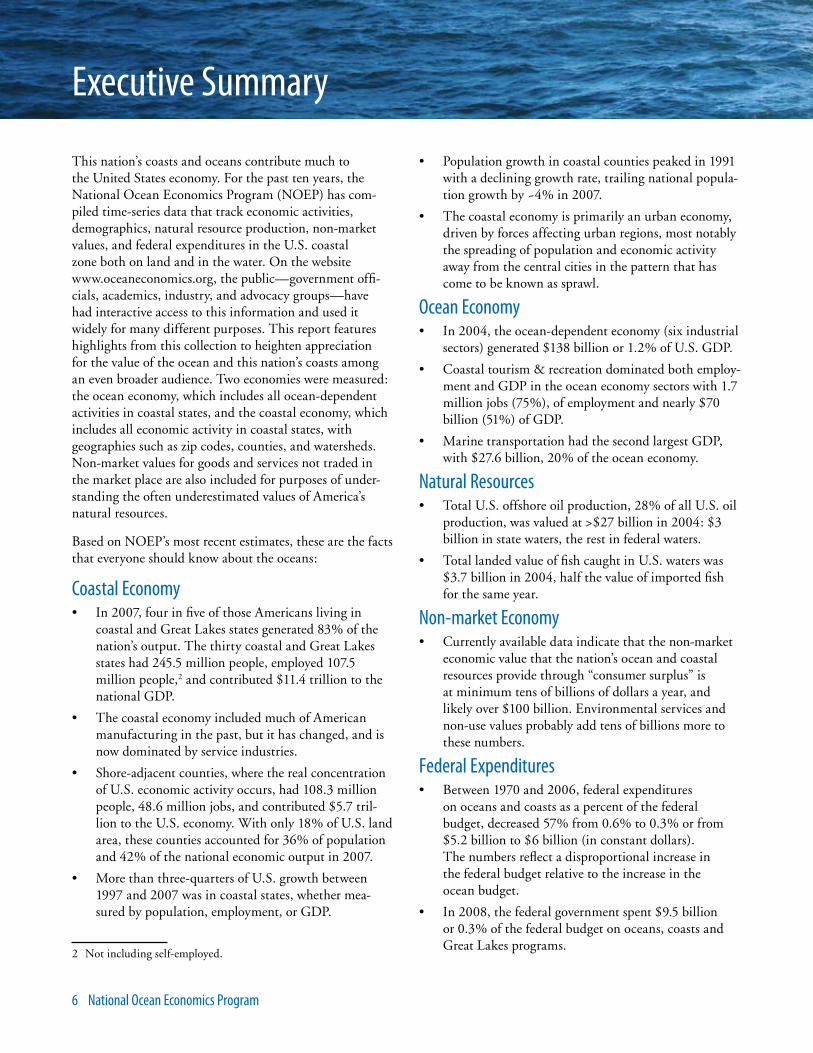
Executive Summary
This nation’s coasts and oceans contribute much to the United States economy. For the past ten years, the National Ocean Economics Program (NOEP) has com-piled time-series data that track economic activities, demographics, natural resource production, non-market values, and federal expenditures in the U.S. coastal zone both on land and in the water. On the website www.oceaneconomics.org, the public—government offi-cials, academics, industry, and advocacy groups—have had interactive access to this information and used it widely for many different purposes. This report features highlights from this collection to heighten appreciation for the value of the ocean and this nation’s coasts among an even broader audience. Two economies were measured: the ocean economy, which includes all ocean-dependent activities in coastal states, and the coastal economy, which includes all economic activity in coastal states, with geographies such as zip codes, counties, and watersheds. Non-market values for goods and services not traded in the market place are also included for purposes of under-standing the often underestimated values of America’s natural resources.
Based on NOEP’s most recent estimates, these are the facts that everyone should know about the oceans:
Coastal EconomyIn 2007, four in five of those Americans living in •coastal and Great Lakes states generated 83% of the nation’s output. The thirty coastal and Great Lakes states had 245.5 million people, employed 107.5 million people,2 and contributed $11.4 trillion to the national GDP.
The coastal economy included much of American •manufacturing in the past, but it has changed, and is now dominated by service industries.
Shore-adjacent counties, where the real concentration •of U.S. economic activity occurs, had 108.3 million people, 48.6 million jobs, and contributed $5.7 tril-lion to the U.S. economy. With only 18% of U.S. land area, these counties accounted for 36% of population and 42% of the national economic output in 2007.
More than three-quarters of U.S. growth between •1997 and 2007 was in coastal states, whether mea-sured by population, employment, or GDP.
2 Not including self-employed.
Population growth in coastal counties peaked in 1991 •with a declining growth rate, trailing national popula-tion growth by ~4% in 2007.
The coastal economy is primarily an urban economy, •driven by forces affecting urban regions, most notably the spreading of population and economic activity away from the central cities in the pattern that has come to be known as sprawl.
Ocean EconomyIn 2004, the ocean-dependent economy (six industrial •sectors) generated $138 billion or 1.2% of U.S. GDP.
Coastal tourism & recreation dominated both employ-•ment and GDP in the ocean economy sectors with 1.7 million jobs (75%), of employment and nearly $70 billion (51%) of GDP.
Marine transportation had the second largest GDP, •with $27.6 billion, 20% of the ocean economy.
Natural ResourcesTotal U.S. offshore oil production, 28% of all U.S. oil •production, was valued at >$27 billion in 2004: $3 billion in state waters, the rest in federal waters.
Total landed value of fish caught in U.S. waters was •$3.7 billion in 2004, half the value of imported fish for the same year.
Non-market EconomyCurrently available data indicate that the non-market •economic value that the nation’s ocean and coastal resources provide through “consumer surplus” is at minimum tens of billions of dollars a year, and likely over $100 billion. Environmental services and non-use values probably add tens of billions more to these numbers.
Federal ExpendituresBetween 1970 and 2006, federal expenditures •on oceans and coasts as a percent of the federal budget, decreased 57% from 0.6% to 0.3% or from $5.2 billion to $6 billion (in constant dollars). The numbers reflect a disproportional increase in the federal budget relative to the increase in the ocean budget.
In 2008, the federal government spent $9.5 billion •or 0.3% of the federal budget on oceans, coasts and Great Lakes programs.
Executive Summary

State of the U.S. Ocean and Coastal Economies 7
Executive Summary
The FutureThe real estate boom and subsequent real estate bust, •and the recession that has followed, will leave many parts of the coastal economy with large amounts of vacant property. In most states, this will probably not be shoreline properties, but Florida may prove an exception because so much development has taken place on and near the shoreline.
Ocean and coastal economies are being affected now •by the current economic recession, but the future will bring more significant environmental changes to the ocean and coasts, such as sea level rise, oxygen deple-tion, and ocean acidification, driven by greenhouse gas emissions.
Over the next thirty years the major challenge for •shoreline communities including the ocean economy sectors of tourism & recreation, marine transportation, and marine construction, will be how to adapt to an increasingly hostile environment for both built and natural structures (harbors, beaches, estuaries).
Offshore industrial expansion and environmental pro-•tection efforts from new energy and food demands, plus responses to environmental threats, will require creative management schemes in spatial planning and ocean zoning akin to what coastal zone management strategies meant on land over the past forty years.
Almost all ocean economy sectors will be negatively •affected in the next few years, but marine construc-tion, tourism & recreation, and perhaps marine minerals and the ship building industry will provide some stability, either as a result of their inherent cyclical characteristics or because they will be sup-ported by federal fiscal policy. At the same time, the non-market values of visits to coastal recreational and scenic amenities will likely grow as more people find the low cost of visiting the coasts and shorelines an attractive opportunity.
The next thirty years may bring the most significant •changes to the ocean and coastal economies since the arrival of industrialization and rapid urbanization in the late 19th century.
The oceans and coasts are bountiful areas, long taken for granted, and rarely recognized as a crucial part of the U.S. economy. Coastal states account for 83% of the U.S. economy, thus supporting inland populations that have little knowledge about how they are tied to the oceans and coasts of the nation. At this time of global economic crisis, when U.S. policy makers are also recognizing the enormous importance of the oceans and coastal areas, this report attempts to demonstrate the need to preserve the important natural resources that support the economic activities that depend on them.

8 National Ocean Economics Program
Chapter 1: Introduction
The United States has an abundant wealth of natural resources at its doorstep, with a shoreline of 95,471 statute miles and the largest exclusive economic zone (EEZ) in the world covering more than four million square miles. Adding this EEZ in 1983 more than doubled U.S. territory and increased the nation’s natural resources, which barely have been valued or managed. This band of coastal land and water, unbeknownst to most government leaders and the public, generates enormous social and economic value.
While large sections of the nation’s heartland are far removed geographically from the oceans and marine environment, their economies are tied to the important economic activities generated at the coastline. Nearly 80% of U.S. imports and export freight is transported through seaports (RITA, 2009); more than 80% of the nation’s economy is supported in coastal states; and more than 50% of the population and U.S. economic activity are found in coastal management counties.
More than a century ago United States leaders signaled that they understood the value of the nation’s natural resources by setting aside national parks, including lands along the coast, to preserve the heritage of these resources for generations. Today, the federal government has estab-lished the equivalent of ocean national parks through marine protected area programs, such as the National Marine Sanctuaries, National Estuarine Research Reserves, and Marine Protected Areas. The mission of these, and similar programs, is to preserve coastal and offshore lands, to restore threatened biodiversity and to monitor envi-ronmental changes underway in the oceans and along the coasts from climate change and other human impacts. While there has only been limited effort to attach eco-nomic values to these areas, the presence of these programs and preserved areas indicates the public and government representing it place value on them.
This is the first report of its kind about the United States. It has been prepared by academics at three institutions and reviewed by experts in government, academia, and non-governmental organizations. Similar reports have been issued by the governments of the United Kingdom, France, Canada, New Zealand, Australia, and the European Union (see references in Chapter 3). NOEP has developed the most detailed ocean valuation methodology, which has been used as a core template by some of the other nations that have published ocean accounts.
The National Ocean Economics Program (NOEP),3 now in its 10th year, was estab-lished to compile a time series collection of data documenting the economic value of the oceans and coasts of the United States. The program has been funded by the National Oceanic and Atmospheric Administration (NOAA) and by state and private sources. It was originally estab-lished to help NOAA with management deci-sions, but has become a tool for a much broader community today.
The purpose of the NOEP is to:
Compile a comprehensive collection of data 1. revealing the economic value of the ocean and coasts of the United States;
Define and describe the ocean and coastal 2. economies;
Reveal changes and trends in uses and 3. values of coastal and ocean resources.
The primary objective of the NOEP is to create and distribute to the public a spatially and tem-porally consistent data set that will support a wide range of economic, scientific, and resource management activities. A second objective is the development of selected products designed to dem-onstrate the utility of the primary data set. NOEP outputs comprise both market and non-market indicators of the value of ocean and coastal indus-tries, natural resource values and production levels, and key indicators of the human activities that depend upon and influence ocean and coastal resources.
3 See website www.oceaneconomics.org
Chapter 1Introduction

State of the U.S. Ocean and Coastal Economies 9
Chapter 1: Introduction
The coastal area includes more species, greater biodiversity, and more endangered species than non-coastal areas. It is endowed with:
Natural harbors that provide doors to global and coastal •trade and serve commercial and recreational boaters and the fishing industry.
Beaches that annually draw tens of millions of people.•
Natural resources that provide energy, food supplies, •and pharmaceuticals.
Estuaries that act as water filtration plants, nurseries •for critical fisheries, and buffers against the increas-ing frequency of intensive storms that threaten coastal communities.
Views that are highly valued by visitors and •residents alike.
All of these assets and services carry high value often over-looked when considering the nation’s economic health.
In addition, during this period when limited natural resources, population growth, and economic difficulties drive society in new directions, the oceans have become a focal point where solutions to these problems are being considered. Among other things, the nation’s coasts and coastal oceans are now asked to:
Provide additional energy assets utilizing wind, waves, •and tidal flows.
Serve as sources to replenish fresh water from desalini-•zation plants.
Provide supplemental food from aquaculture.•
Supply sources for pharmaceuticals and other products •and services.
New and better management strategies are needed to meet these new and increasing demands on oceans and coasts, already stressed and undergoing massive changes.
All of this comes at a time when scientists recognize that the ocean’s natural riches that have provided enormous value throughout history are being threatened by green-house gas-induced impacts of acidification, oxygen deple-tion, and rising water temperatures. Sea level rise will affect natural shoreline features through inundation and erosion; ocean acidification will affect marine life in ways not fully forecast yet. Harmful run-off from land pollutes the water and curtails the biodiversity that produces the many com-mercial and recreational fish species that Americans value.
More than any time in this nation’s history, America needs to know:
— What is valuable about its coasts and oceans?
— How valuable are these assets?
It is essential that these information needs be fulfilled so that reasonable and informed policy decisions can be made to stabilize a deteriorating situation and ultimately to sustain the economic legacy of this nation’s oceans and coasts. The two recent reports from the Pew Oceans Com-mission and the U.S. Commission on Ocean Policy warned that intense competition among human uses within the strip of land and water referred to in this study, and the consequences of failure to properly manage them, would put our future at risk. The information found in this report provides a solid foundation upon which to build.
The magnitude of the U.S. economy that derives its wealth from the coasts and ocean is significant. The importance of this wealth is magnified at this time of economic crisis because the strength of the ocean and coastal economies is closely tied to total U.S. economic health.
1.1 The Ocean and Coastal EconomiesNOEP produced this report to highlight its estimates of the values for two inter-related parts of the economy—the ocean and the coastal economies. These parts overlap, but provide different, varying perspectives on the economy (see Figure 1.1).
The Coastal and Ocean Economies Are Not the Same
Economic Activity Located Along the Coast
Coastal Economy Ocean Economy
Economic Activity Dependent on Using the Ocean and its Products
Figure 1.1 Coastal and ocean economies are not the same

10 National Ocean Economics Program
Chapter 1: Introduction
The NOEP measures and provides:
Coverage for “flows,” such as living marine and off-1. shore mineral resources, measured through production amounts and values, and through industrial expendi-tures for production, including wages, jobs, and GDP.
Estimated values for both market-based uses and non-2. market uses, such as recreational and environmental assets.
Time-series estimates of economic activities by 3. coastal geographies.
Consistent public datasets that allow comparabil-4. ity among different geographies such as states and counties.
All of these give the NOEP a unique position to track the status and trends of coastal and ocean-related economic activities, and determine their impact on the U.S. economy.
1.2 About the DataGovernment datasets have never been configured for the oceans. Therefore, the NOEP has created a unique meth-odology that uses accepted government data to classify key economic indicators of value for the oceans and coasts. The data cover a broad range of types of values from classic market values and natural resource production estimates to non-market recreation and environmental values. The objective is to provide a more accurate picture of the eco-nomic contribution of the oceans to the U.S. economy. The NOEP uses nationally consistent data to allow com-parability among geographies over time. Because data are gathered in different ways by different agencies, and access to data is uneven, the NOEP data for different parts of this report are presented for different time periods. Ocean and Coastal data are reported from 1997 forward, the earliest date for the implementation of the North American Indus-trial Classification System (NAICS).4
The coastal economy data reflect the latest available •dataset for all indicators, 2007.
The ocean economy data reflect the latest data the •NOEP team has had access to from BLS, 2004. County-level details require special access to BLS non-public records, which NOEP has not had access to for several years.
Natural resources data reflect the records of the various •agencies, going back as far as 1950 for fisheries from the National Marine Fisheries Service (NMFS), and 1970
4 Data for employment, establishments, and wages from 1990-1996 are available at www.oceaneconomics.org.
for marine minerals from the Department of Interior, for example.
Estimates for all data are reported as follows: a single •year is reported in nominal dollars (for that specific year); when two or more years are compared, they are reported in constant, inflation-adjusted dollars.
1.3 What is Covered and Not Covered in This Report? NOEP reports the coastal economy at multiple jurisdic-tional levels, but this report focuses mostly on national estimates citing state and county estimates when they stand out in some way. Chapter 2 presents this economy in detail. State and local data can be found on the NOEP website. The importance of coastal activities differs from rural to urban areas. Diversity of urban economies makes them less dependent on the ocean than rural areas where fishing, tourism, or offshore oil development dominate the economies.
With more than $138 billion generated in annual total GDP from the ocean economy in 2004 (the most recent date for which data are available), more than $5.6 trillion were generated that same year from the coastal county economy. The coastal and ocean contribution to and impact on the U.S. economy is impressive.
The NOEP reports on economic indicators for six private industrial sectors in the ocean economy dataset, but they represent only part of the ocean-dependent industries. These six sectors—coastal tourism & recreation (T&R), marine transportation, ship & boat building and repair, coastal construction, offshore minerals, and living marine resources—were selected because federal datasets for the most part, provide consistent information that permits an estimated separation of ocean-related industries from others. Chapter 3 describes these sectors with a detailed analysis for the ocean economy. Other industries, such as marine electronics, marine science and education, phar-maceuticals, coastal real estate, and a number of other activities are not included because information about these is not consistently compiled or the information is not publicly available.
Public expenditures are compiled from the federal govern-ment Office of Management and Budget (OMB). Other government expenditures are not included, although they would represent a large sum. Therefore, the govern-ment expenditures depicted in this report are greatly underestimated.

State of the U.S. Ocean and Coastal Economies 11
Chapter 1: Introduction
What does the federal government invest in the oceans and coasts?5 A glance at Table 1.1 shows the magnitude of the U.S. ocean and coastal economies in context of the national budget, and relative to the U.S. investment in them. Federal ocean expenditures slipped from 0.6 to 0.3 of one percent of the total federal budget between 1990 and 2006. This occurred because the federal budget increased without proportional increases in the ocean budget. On the other hand, the ocean economy generated over $138 billion in direct GDP in 2004, not including self-employment tax revenues and other values missed in GDP estimates.
Table 1.1 Comparisons of values of oceans and coasts with government ocean investments
Value Estimates Year Percent
Ocean Economy as a % of National Budget 2004 7.4
Ocean Economy as a % of U.S. GDP 2004 1.2
Federal Ocean Expenditures as a % of National Budget
FY 1990 0.6
Federal Ocean Expenditures as a % of National Budget
FY 2004 0.3
Federal Ocean Expenditures as a % of National Budget
FY 2006 0.3
Sources: NOEP, BLS, BEA, OMB
The ocean is undergoing poorly understood and unprec-edented environmental and economic changes that will significantly affect life in the sea as well as on land. These changes will affect local, national, and global economies. Until 30 years ago, no one understood the magnitude of what might be affected by changes in the oceans and along the coasts, because the ocean-dependent economy had rarely been scrutinized or estimated separately from the national economy. Today, economists analyze changes in the environment with relation to changes in the economy, and it is apparent they are inextricably connected. When the oceans are at risk, so is much of the economy and American lifestyles. The magnitude of the economy that derives its wealth from coasts and oceans is so large, and its connection to total U.S. economic health so close, that the ocean economy can provide a good barometer for trends in the overall U.S. economy.
5 Section 5 of the U.S. Ocean Act, 2000, mandated the executive branch to issue a report on civilian ocean and coastal expen-ditures every two years. In 2002, the OMB issued mandates to Federal U.S. agencies to begin requiring their submission of annual budgets for any and all ocean and coastal programs. These are referred to as the Federal Ocean and Coastal Account-ing Reports (FOCAR).
As decision makers turn their attention to managing change, it is essential that the way forward be informed by the best science — and best economics — available, and that decision makers are provided relevant and accurate information in a timely manner. This report is meant to meet the economic data needs of local, state, and particu-larly national policy makers. A major reason for this report, and for the very existence of the NOEP, is to demonstrate and emphasize the large contribution and impact of the ocean sector and coastal resources on the U.S. economy, so that government leaders will better understand how to invest U.S. financial and intellectual resources.
1.4 Vulnerability from a Changing EnvironmentShoreline development and increases in economic growth have continued, while the rate of population growth in coastal areas has slowed since the early 1990s. With shoreline development come effects on shoreline stability, coastal pollution, and the squeeze on natural resources that need space to recede as the seas rise and inundate precious beaches and estuaries. With predictions of more intense storms, and the consequent inundation and increased flooding from storm surges, there inevitably will be a loss of natural assets and services that provide protection from storms as well as other natural services such as spawning grounds and filtration systems, which are discussed in more detail in Chapter 4.
All sectors of the ocean economy are vulnerable to climate change impacts. Likewise, the coastal economy is vulner-able because of the increasing concentration of economic activities in tourism, a vulnerable and volatile industry to total economic activity. At the mercy of the economy and climate, tourism waxes and wanes dependent on the state of these. Florida sets a good example of efforts to offset the instability of the tourism industry by diversifying its economy. It is attracting research facilities and programs that are much less vulnerable to sea level rise to help counterbalance the variability of T&R. Compared to the other sectors, tourism has one of the largest footprints of economic activities along the coast. It also has some of the lowest salaries, lowest margins of profit, and highest turn-over of the other sectors, putting communities at risk that rely too heavily on this industry.
Looking ahead, larger forces from changing energy needs, land use, and the environment are already reshaping the coastal and ocean economies in profound ways. The next thirty years could bring the largest shift in the ocean and coastal economies since the arrival of industrialization and rapid urbanization in the late 19th century. It is imperative that we track and understand these changes, so that we can be the ones to shape the future, not events.
12 National Ocean Economics Program
Chapter 1: Introduction
The following chapters are a summary of data found on the NOEP website. The data represent a unique time series that reflects the value brought to this nation by its oceans. This report is an accounting that should be published regularly so that the public and government can monitor the health of the oceans, coasts, and the economy, and make decisions based on what is valued and what best serves society.
1.5 ReferencesLandefeld, J.S. and Robert Parker. 1997. Bee’s Chain Indexes, Time Series, and Measures of Long Term Economic Growth. Survey of Current Business, May 1997. http://www.bea.gov/bea/regional/gsp/help/OnlineHelp.htm.
National Ocean Economic Program. www.oceaneconomics.org.
NOAA Shoreline Website. A Guide to National Shoreline Data and Terms. http://shoreline.noaa.gov/faqs.html.
Pew Oceans Commission. 2003. America’s Living Oceans: Charting a Course for Sea Change.
Research and Innovative Technology Administration (RITA). 2009. Bureau of Transportation Statistics. http://www.bts.gov/programs/freight_transportation/html/water.html.
U.S. Bureau of Labor Statistics. www.bls.gov.
U.S. Bureau of Economic Analysis. www.bea.gov.
U.S. Commission on Ocean Policy. 2004. An Ocean Blueprint for the 21st Century. Washington. http//oceancommission.gov//documents/.
U.S. Office of Management and Budget. www.whitehouse.gov/omb/.
State of the U.S. Ocean and Coastal Economies 13
Chapter 2: The Coastal Economy
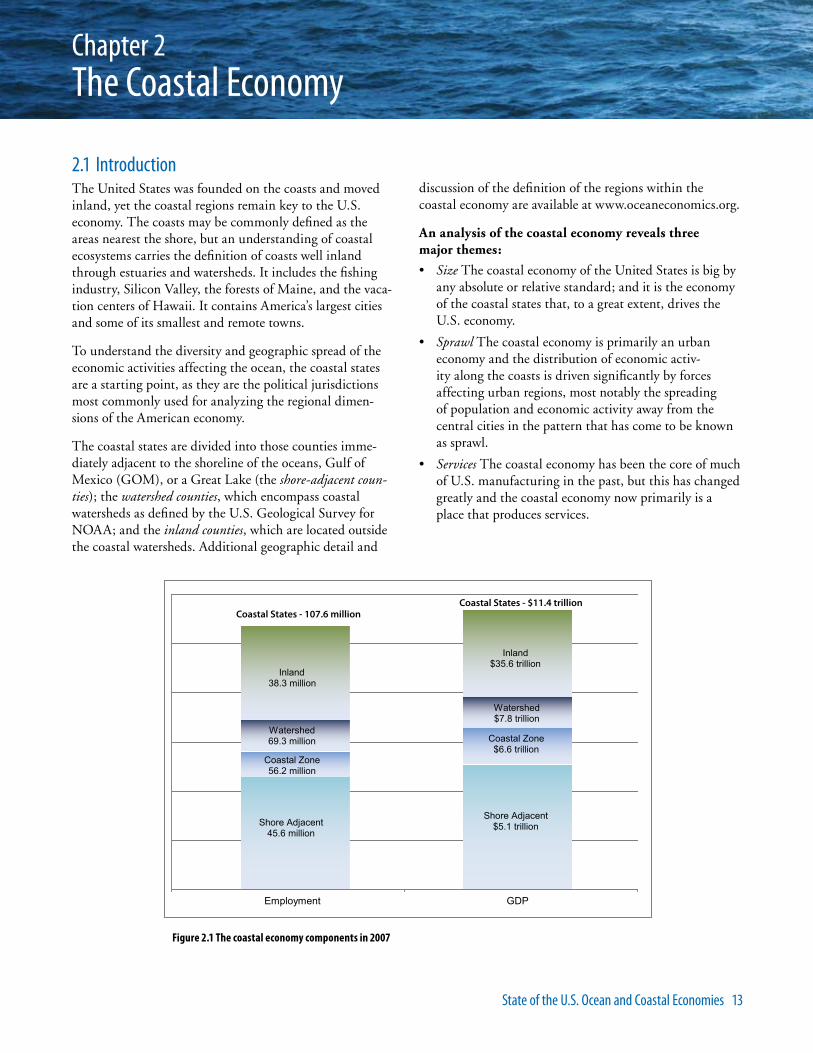
2.1 Introduction The United States was founded on the coasts and moved inland, yet the coastal regions remain key to the U.S. economy. The coasts may be commonly defined as the areas nearest the shore, but an understanding of coastal ecosystems carries the definition of coasts well inland through estuaries and watersheds. It includes the fishing industry, Silicon Valley, the forests of Maine, and the vaca-tion centers of Hawaii. It contains America’s largest cities and some of its smallest and remote towns.
To understand the diversity and geographic spread of the economic activities affecting the ocean, the coastal states are a starting point, as they are the political jurisdictions most commonly used for analyzing the regional dimen-sions of the American economy.
The coastal states are divided into those counties imme-diately adjacent to the shoreline of the oceans, Gulf of Mexico (GOM), or a Great Lake (the shore-adjacent coun-ties); the watershed counties, which encompass coastal watersheds as defined by the U.S. Geological Survey for NOAA; and the inland counties, which are located outside the coastal watersheds. Additional geographic detail and
Chapter 2The Coastal Economy
Employment GDP
Shore AdjacentShore Adjacent
Coastal Zone
Coastal ZoneWatershed
Watershed
Inland
Inland
45.6 million$5.1 trillion
56.2 million
$6.6 trillion69.3 million
$7.8 trillion
38.3 million
$35.6 trillion
Coastal States - 107.6 millionCoastal States - $11.4 trillion
Figure 2.1 The coastal economy components in 2007
discussion of the definition of the regions within the coastal economy are available at www.oceaneconomics.org.
An analysis of the coastal economy reveals three major themes:
Size• The coastal economy of the United States is big by any absolute or relative standard; and it is the economy of the coastal states that, to a great extent, drives the U.S. economy.
Sprawl• The coastal economy is primarily an urban economy and the distribution of economic activ-ity along the coasts is driven significantly by forces affecting urban regions, most notably the spreading of population and economic activity away from the central cities in the pattern that has come to be known as sprawl.
Services• The coastal economy has been the core of much of U.S. manufacturing in the past, but this has changed greatly and the coastal economy now primarily is a place that produces services.
14 National Ocean Economics Program
Chapter 2: The Coastal Economy
In 1972, Congress passed the Coastal Zone Management Act (CZMA), which put in place the basic framework for cooperative management of coastal resources among federal, state, and local governments. Under the Act, states participating in the Coastal Zone Management Program were given the freedom to define their coastal zones as they deemed appropriate for their individual management regimes, subject to federal approval.
The coastal zone thus defined varies significantly from shoreline areas to municipalities to counties to whole states. As such it is difficult to define a “coastal zone” economy. For this purpose, the NOEP data uses the 445 counties, which contain any geographic elements of the federally-approved coastal zone management programs as part of the “coastal zone economy.”
In 2007, the coastal zone counties comprised a little more than 50% of the employment in coastal states and 42% of national employment. Their total output in GDP made up 58% of coastal state GDP and 48% of national GDP. The Coastal Zone Management Program thus touches about half the national economy. The variety in coastal zone geographies means there is also variety in the portion of state economies found in the coastal zone.
Table 2.1 Percent of 2007 state employment in coastal zone counties
100% DE FL HI RI
70%-90% NK AK NY CA ME WA
40%-70% VA MD CT MA IL MI LA
20-40% WI OR NH SC TX OH PA
4%-20% MS AL IN NC GA MN
Taken together, the coastal zone counties have shown similar growth trends in employment and GDP to the watershed and shore-adjacent counties with employment growth averaging about 1% a year and real GDP growth averaging just over 3% a year from 1997-2007 (Table 2.2).
Table 2.2 Economic growth in coastal economy regions 1997-2007
Employment Change Real GDP Change (Millions)
Jobs Annual Average Percent Change
GDP Annual Average Percent Change
Shore-adjacent Counties
4,842,514 1.2% $1,057,754 3.3%
Coastal Zone Counties
5,322,124 1.0% $1,482,772 3.6%
Coastal Watershed Counties
6,488,118 1.0% $1,698,877 3.4%
Coastal States 10,496,002 1.1% $2,432,858 3.4%
But, as in other parts of the coastal economy, there is a great variety in growth trends among the states. In three states (GA, OR, and SC), the coastal zone growth over 1997-2007 was faster than shore-adjacent, watershed, or state employment growth. In three other states (CA, LA, and PA), the coastal zone county employment growth was slower than all other parts of the coastal economy in the same period. In the other 24 coastal states, the coastal zone economy was a mixture of faster and slower growth depending on which part of the coastal economy is used for comparison.
Figure 2.2 Map of coastal states
2.2 The Size of the Coastal Economy in 2007The population of the thirty • coastal states (Figure 2.2) was 245.5 million. More than 107.5 million people were employed in these states, contributing $11.4 trillion to the national economy. This was four in five Ameri-cans living in coastal states contributing 83% of the nation’s output.
Within the coastal states, the counties located in the •coastal watersheds were home to 156.6 million people and 69.2 million jobs, which contributed $7.9 trillion to the nation’s economy. The watershed counties account for less than one-third of the land area of the United States, but are home to more than half the population and employment, and 57% of economic output.
The Coastal Zone Economy
83% of nation’s economic output81.4% of U.S. population

State of the U.S. Ocean and Coastal Economies 15
Chapter 2: The Coastal Economy
The • shore-adjacent counties were home to 108.3 million people and 48.6 million jobs. These shoreline adjacent-counties contributed $5.7 trillion to the U.S. economy. This is where the real concentra-tion of economic activity occurs. With 18% of the land area, these counties account for 36% of popu-lation and 42% of the national economic output.
There is great variety in the size and configuration of counties in the United States. This is particularly the case with coastal counties, which may be small and extend only a few miles inland from the oceans, GOM, or Great Lakes, or may extend a signifi-cant distance inland. The distinction among shore-adjacent, watershed, and inland counties and their varying sizes of economies plays out in different ways across the varied geographies of America’s coasts. This can be illustrated by looking at the way in which the employment for each coastal state is distributed across the shore-adjacent counties (Figure 2.3). Depending on geography, the states tend to fall into several broad groups based on the size of their employment and economy.
Three states (Rhode Island, Delaware, and Hawaii) are •comprised entirely of shore-adjacent counties, but these states have relatively small economies.
A group of large economy states including California, •Florida, New Jersey, Washington, Massachusetts, and Illinois have between 50% and 90% of their employ-ment in shore-adjacent counties, while other large population states such as New York, Michigan, Texas, Wisconsin, and Ohio have between 25% and 50% of employment in shore-adjacent counties.
Of the other states with small economies and both •shore and inland counties, Alaska and Maine have the highest proportion of their economy on the shore, while most others with smaller economies have less than 30% of their economy in the shore-adjacent counties.
CA
FL
NJ
NY
IL
TX
WA
MI
MA
MD
OH
WI
CT
HI
LA
RI
SC
DE
ME
NCIN
OR
AK
AL
GA
NH
MS
PAMN
0%
10%
20%
30%
40%
50%
60%
70%
80%
90%
100%
110%
-5 0 5 10 15 20 25 30 35Pro
port
ion
of 2
007
Sta
te E
mpl
oym
ent i
n S
hore
-Adj
acen
t Cou
ntie
s
Note: For data, see Table 2.1A in Appendix http://www.OceanEconomics.org/NationalReport.Note: Bubble size = 2007 shore-adjacent county employment
Figure 2.3 Size of shore-adjacent economy compared with percent of state economy in shore-adjacent counties
To get a sense of how large the economy of the coastal states is, a comparison of the size of the GDP shows that:
The coastal states together produce a GDP that is bigger than that of any single country in the world except the United States.
The watershed counties of the coastal states produce a GDP that is larger than the econo-mies of Germany and Japan combined.
The shoreline adjacent counties alone would be the third largest economy in the world after the European Union and the United States on the basis of GDP. The shoreline counties are more than twice the size of the United Kingdom’s economy.6
6 International comparisons from the International Monetary Fund.
16 National Ocean Economics Program
Chapter 2: The Coastal Economy
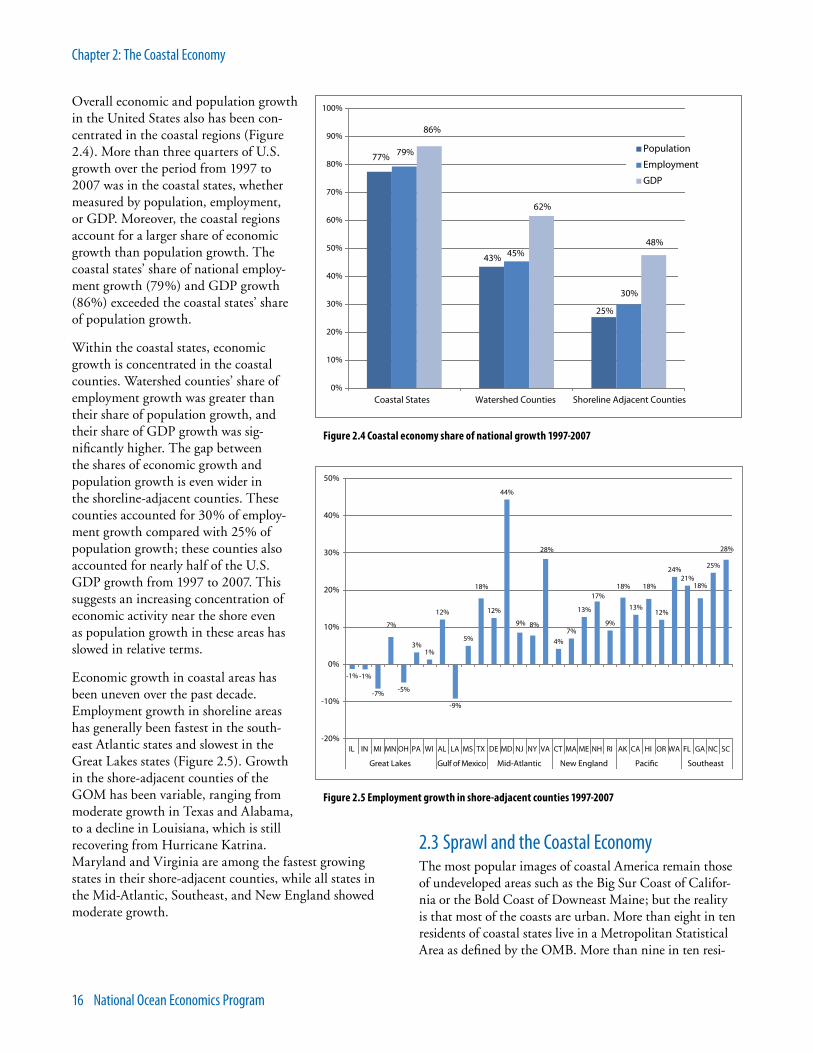
Overall economic and population growth in the United States also has been con-centrated in the coastal regions (Figure 2.4). More than three quarters of U.S. growth over the period from 1997 to 2007 was in the coastal states, whether measured by population, employment, or GDP. Moreover, the coastal regions account for a larger share of economic growth than population growth. The coastal states’ share of national employ-ment growth (79%) and GDP growth (86%) exceeded the coastal states’ share of population growth.
Within the coastal states, economic growth is concentrated in the coastal counties. Watershed counties’ share of employment growth was greater than their share of population growth, and their share of GDP growth was sig-nificantly higher. The gap between the shares of economic growth and population growth is even wider in the shoreline-adjacent counties. These counties accounted for 30% of employ-ment growth compared with 25% of population growth; these counties also accounted for nearly half of the U.S. GDP growth from 1997 to 2007. This suggests an increasing concentration of economic activity near the shore even as population growth in these areas has slowed in relative terms.
Economic growth in coastal areas has been uneven over the past decade. Employment growth in shoreline areas has generally been fastest in the south-east Atlantic states and slowest in the Great Lakes states (Figure 2.5). Growth in the shore-adjacent counties of the GOM has been variable, ranging from moderate growth in Texas and Alabama, to a decline in Louisiana, which is still recovering from Hurricane Katrina. Maryland and Virginia are among the fastest growing states in their shore-adjacent counties, while all states in the Mid-Atlantic, Southeast, and New England showed moderate growth.
2.3 Sprawl and the Coastal EconomyThe most popular images of coastal America remain those of undeveloped areas such as the Big Sur Coast of Califor-nia or the Bold Coast of Downeast Maine; but the reality is that most of the coasts are urban. More than eight in ten residents of coastal states live in a Metropolitan Statistical Area as defined by the OMB. More than nine in ten resi-
77%
43%
25%
79%
45%
30%
86%
62%
48%
0%
10%
20%
30%
40%
50%
60%
70%
80%
90%
100%
Coastal States Watershed Counties Shoreline Adjacent Counties
Population
Employment
GDP
Figure 2.4 Coastal economy share of national growth 1997-2007
-1% -1%
-5%
3%1%
12%
-9%
5%
12%
44%
4%7%
13%
9%
13%12%
24%21%
25%
-7%
17%
28%
18%
7% 9% 8%
28%
18%18%18%
-20%
-10%
0%
10%
20%
30%
40%
50%
IL IN MI MN OH PA WI AL LA MS TX DE MD NJ NY VA CT MA ME NH RI AK CA HI OR WA FL GA NC SC
Great Lakes Gulf of Mexico Mid-Atlantic New England Pacific Southeast
Figure 2.5 Employment growth in shore-adjacent counties 1997-2007

State of the U.S. Ocean and Coastal Economies 17
Chapter 2: The Coastal Economy
dents and jobs in watershed counties and shore-adjacent counties are in metropoli-tan areas, and almost all of the economic output of shore-adjacent counties occurs in metropolitan regions (Figure 2.6). The issues of America’s urban areas are the issues of America’s coasts.
This is particularly clear in the geo-graphic pattern of economic and popula-tion growth, which provides evidence of the overall “sprawling” pattern of the American population and employment growth in urban regions. Throughout most of the nation, the shore-adjacent regions of the coasts already are heavily built for residences, not only for year round, but also for seasonal residents. The core of the coastal urban areas is the shore-adjacent counties, where popula-tion and employment densities are more than twice the national average, and significantly higher than coastal states as a whole.
Within coastal states a distinctive pattern of economic and population growth has emerged. Population growth generally is faster away from the coast, and away from the shore, while economic growth generally is faster nearer the shore (Figure 2.7). From 1997-2007, inland coun-ties, outside the coastal region, showed population growth of 12.4% compared with 11.3% growth in employment. The inland counties showed faster popula-tion and employment growth than the watershed counties.
Among the coastal watershed counties, there is a distinctly higher rate of both population and employment growth in the nonshore-adjacent counties compared with the shore-adjacent counties. Popu-lation growth in the nonshore-adjacent counties is almost twice the population growth in the shore-adjacent counties. At the same time, there is signifi-cantly faster employment growth in the shore-adjacent counties than population growth.7
7 A smaller population base makes growth rates larger even though absolute changes are smaller.
This heavily developed nature of the areas near the shore means that growth, particularly for residential develop-ment, is pushed further and further inland. At the same time the size of the populations near the shore, and the attractiveness of shoreline locations, provide incentives for businesses to expand in those areas, even if their workforce must increasingly commute to their jobs from inland areas.
94.9%
92.3%
86.4%
95.8%
93.8%
88.9%
97.1%
95.8%
92.4%
80%
82%
84%
86%
88%
90%
92%
94%
96%
98%
Coastal States Coastal Counties Shore Adjacent Counties
Population
Employment
GDP
Figure 2.6 Proportion of coastal economy in metropolitan areas, 2007
12.4%
8.7%
13.5%
7.3%
11.3%10.4%
14.5%
9.7%
0.0%
2.0%
4.0%
6.0%
8.0%
10.0%
12.0%
14.0%
16.0%
Inland Counties Watershed Counties Non-Shore AdjacentCounties
Shore AdjacentCounties
Population
Employment
Figure 2.7 Regional growth rates in coastal states 1997-2007
18 National Ocean Economics Program
Chapter 2: The Coastal Economy
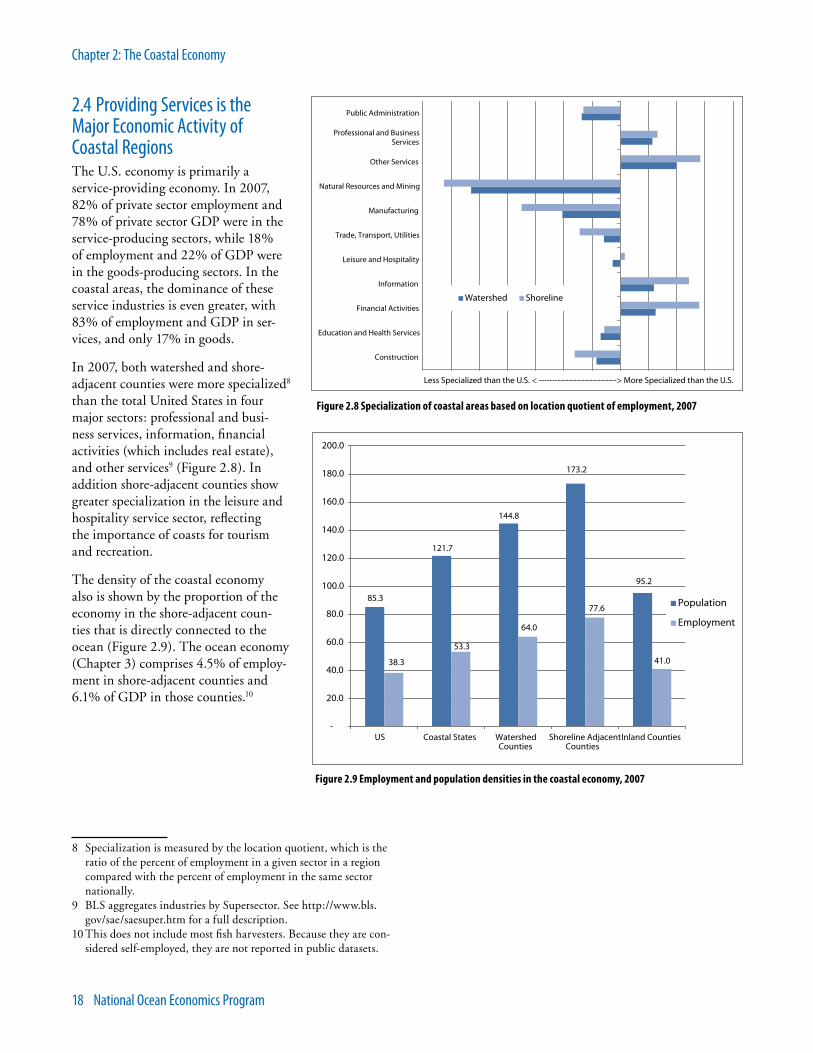
2.4 Providing Services is the Major Economic Activity of Coastal RegionsThe U.S. economy is primarily a service-providing economy. In 2007, 82% of private sector employment and 78% of private sector GDP were in the service-producing sectors, while 18% of employment and 22% of GDP were in the goods-producing sectors. In the coastal areas, the dominance of these service industries is even greater, with 83% of employment and GDP in ser-vices, and only 17% in goods.
In 2007, both watershed and shore-adjacent counties were more specialized8 than the total United States in four major sectors: professional and busi-ness services, information, financial activities (which includes real estate), and other services9 (Figure 2.8). In addition shore-adjacent counties show greater specialization in the leisure and hospitality service sector, reflecting the importance of coasts for tourism and recreation.
The density of the coastal economy also is shown by the proportion of the economy in the shore-adjacent coun-ties that is directly connected to the ocean (Figure 2.9). The ocean economy (Chapter 3) comprises 4.5% of employ-ment in shore-adjacent counties and 6.1% of GDP in those counties.10
8 Specialization is measured by the location quotient, which is the ratio of the percent of employment in a given sector in a region compared with the percent of employment in the same sector nationally.
9 BLS aggregates industries by Supersector. See http://www.bls.gov/sae/saesuper.htm for a full description.
10 This does not include most fish harvesters. Because they are con-sidered self-employed, they are not reported in public datasets.
95.2
173.2
144.8
121.7
85.3
41.0
77.6
64.0
53.3
38.3
-
20.0
40.0
60.0
80.0
100.0
120.0
140.0
160.0
180.0
200.0
US Coastal States WatershedCounties
Shoreline AdjacentCounties
Inland Counties
Population
Employment
Figure 2.9 Employment and population densities in the coastal economy, 2007
Construction
Education and Health Services
Financial Activities
Information
Leisure and Hospitality
Trade, Transport, Utilities
Manufacturing
Natural Resources and Mining
Other Services
Professional and BusinessServices
Public Administration
Watershed Shoreline
Less Specialized than the U.S. < -----------------------------> More Specialized than the U.S.
Figure 2.8 Specialization of coastal areas based on location quotient of employment, 2007
State of the U.S. Ocean and Coastal Economies 19
Chapter 2: The Coastal Economy
2.5 ConclusionGeographically, coastal regions are defined by the complex relationships among shorelines, estuaries, watersheds, and upland areas. The coastal economy is large, complex primarily urban, and very dynamic. Whether measured at the state, watershed, or shore-adjacent county level, the coastal economy makes up a disproportionately large share of the American economy. The spatial dimensions of the coastal economy have pushed popula-tion inland, but jobs more and more towards the shore. The coastal economy mirrors the national economy in the diversity of eco-nomic activity that takes place there, yet also contains industries unique to the oceans and coasts. These industries are discussed in Chapter 3.
2.6 ReferencesInternational Monetary Fund. Automating the Price Discovery Process - Some International Comparisons and Regulatory Implications. http://www.imf.org/external/pubs/cat/longres.cfm?sk=831.0.
National Ocean Economic Program. www.oceaneconomics.org.
U.S. Bureau of Labor Statistics, Quarterly Census of Employment and Wages (QCEW) Program. http://www.bls.gov/cew/.
U.S. Environmental Protection Agency. Coastal Watershed Factsheets. Oceans, Coasts, & Estuaries. http://www.epa.gov/owow/oceans/factsheets/.
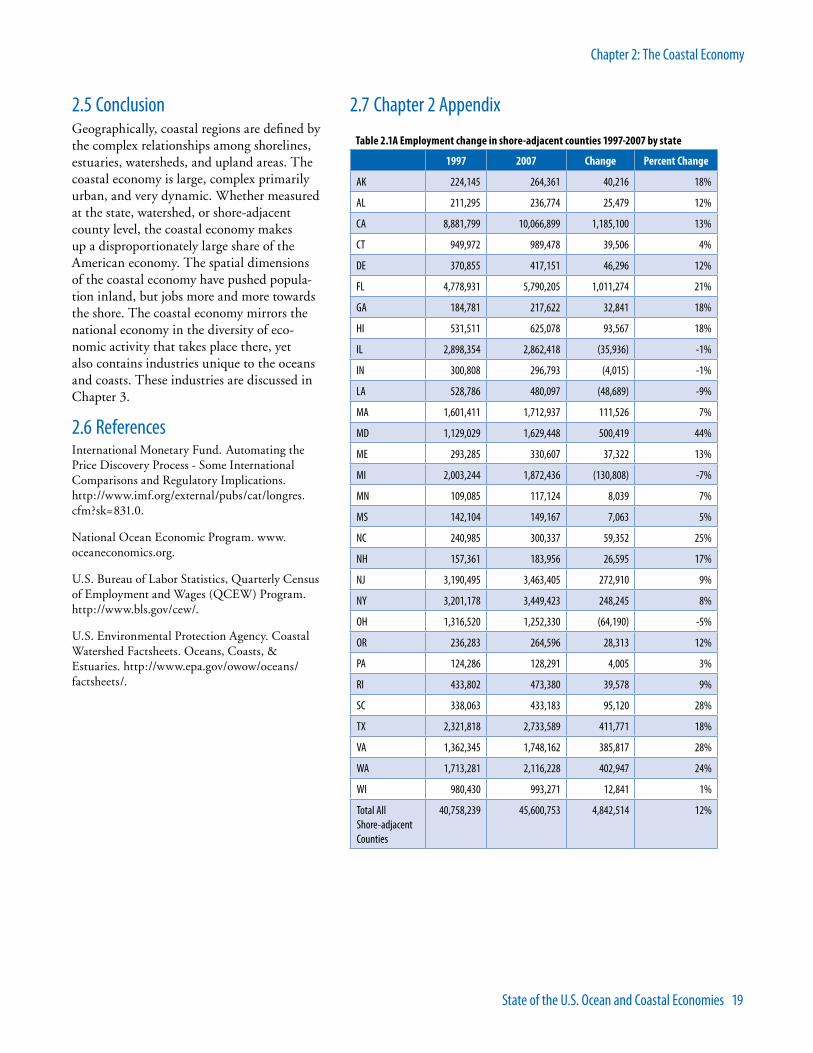
Table 2.1A Employment change in shore-adjacent counties 1997-2007 by state
1997 2007 Change Percent Change
AK 224,145 264,361 40,216 18%
AL 211,295 236,774 25,479 12%
CA 8,881,799 10,066,899 1,185,100 13%
CT 949,972 989,478 39,506 4%
DE 370,855 417,151 46,296 12%
FL 4,778,931 5,790,205 1,011,274 21%
GA 184,781 217,622 32,841 18%
HI 531,511 625,078 93,567 18%
IL 2,898,354 2,862,418 (35,936) -1%
IN 300,808 296,793 (4,015) -1%
LA 528,786 480,097 (48,689) -9%
MA 1,601,411 1,712,937 111,526 7%
MD 1,129,029 1,629,448 500,419 44%
ME 293,285 330,607 37,322 13%
MI 2,003,244 1,872,436 (130,808) -7%
MN 109,085 117,124 8,039 7%
MS 142,104 149,167 7,063 5%
NC 240,985 300,337 59,352 25%
NH 157,361 183,956 26,595 17%
NJ 3,190,495 3,463,405 272,910 9%
NY 3,201,178 3,449,423 248,245 8%
OH 1,316,520 1,252,330 (64,190) -5%
OR 236,283 264,596 28,313 12%
PA 124,286 128,291 4,005 3%
RI 433,802 473,380 39,578 9%
SC 338,063 433,183 95,120 28%
TX 2,321,818 2,733,589 411,771 18%
VA 1,362,345 1,748,162 385,817 28%
WA 1,713,281 2,116,228 402,947 24%
WI 980,430 993,271 12,841 1%
Total All Shore-adjacent Counties
40,758,239 45,600,753 4,842,514 12%
2.7 Chapter 2 Appendix
20 National Ocean Economics Program
Chapter 3: The Ocean Economy
3.1 Defining and Measuring the Ocean EconomyThe goal of measuring the ocean economy is to be able to answer such questions as “what do the oceans and Great Lakes contribute to the national economy?” and “what is the economic value of the oceans and Great Lakes as a resource?” The idea is simple, but difficult to put into practice.
To answer questions such as these requires thinking about the ocean as an input to the production of goods and ser-vices. But almost all economic data are defined by what is made (the final product), not how it is made or where it is made. There are some types of economic activity where the
two ways of thinking overlap in marine-related activities: deep-sea freight transportation and commercial fishing are examples where the industry alone defines the connection to the ocean. But other industries have no such inherent connection. A beachfront hotel in Florida is classified in the same industry classification as a hotel at a ski resort in Colorado, or even a hotel in Midtown Manhattan.
Thus, defining the ocean economy requires a combina-tion of industrial and geographic perspectives. Certain industries will be included by definition since they directly use the ocean. For other industries, the choice of which establishments in that industry are selected for inclusion in the ocean economy will depend on their location in
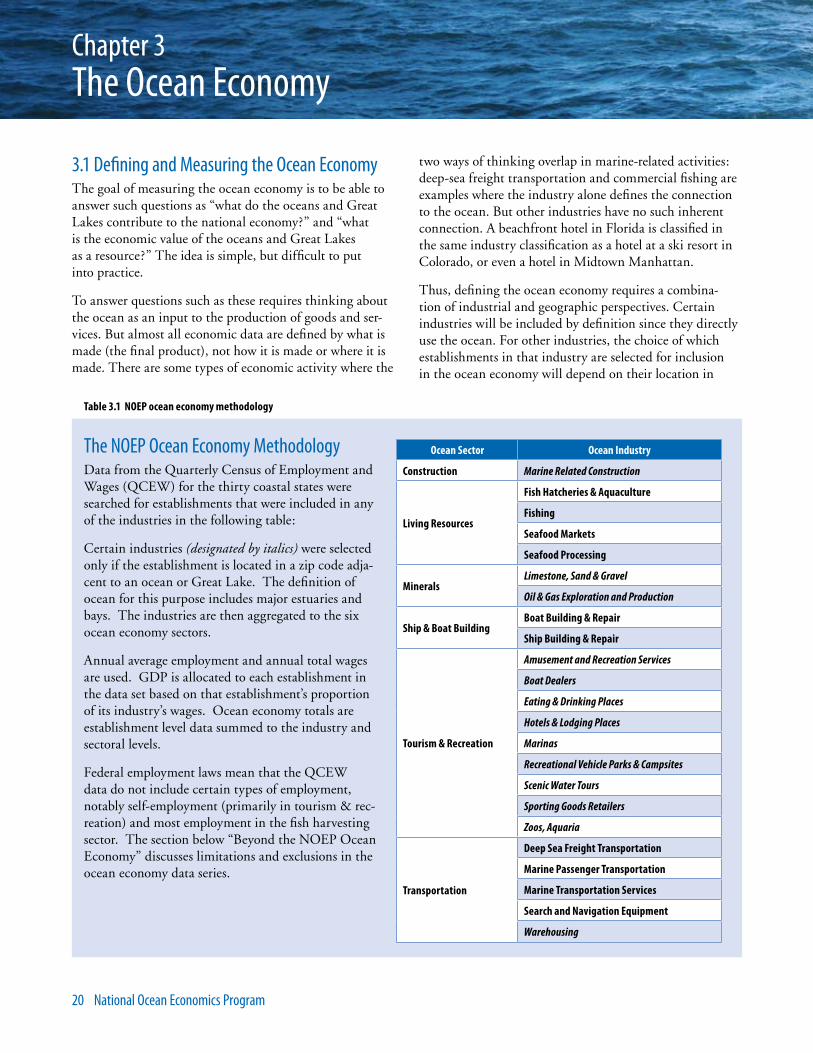
The NOEP Ocean Economy MethodologyData from the Quarterly Census of Employment and Wages (QCEW) for the thirty coastal states were searched for establishments that were included in any of the industries in the following table:
Certain industries (designated by italics) were selected only if the establishment is located in a zip code adja-cent to an ocean or Great Lake. The definition of ocean for this purpose includes major estuaries and bays. The industries are then aggregated to the six ocean economy sectors.
Annual average employment and annual total wages are used. GDP is allocated to each establishment in the data set based on that establishment’s proportion of its industry’s wages. Ocean economy totals are establishment level data summed to the industry and sectoral levels.
Federal employment laws mean that the QCEW data do not include certain types of employment, notably self-employment (primarily in tourism & rec-reation) and most employment in the fish harvesting sector. The section below “Beyond the NOEP Ocean Economy” discusses limitations and exclusions in the ocean economy data series.
Ocean Sector Ocean Industry
Construction Marine Related Construction
Living Resources
Fish Hatcheries & Aquaculture
Fishing
Seafood Markets
Seafood Processing
MineralsLimestone, Sand & Gravel
Oil & Gas Exploration and Production
Ship & Boat BuildingBoat Building & Repair
Ship Building & Repair
Tourism & Recreation
Amusement and Recreation Services
Boat Dealers
Eating & Drinking Places
Hotels & Lodging Places
Marinas
Recreational Vehicle Parks & Campsites
Scenic Water Tours
Sporting Goods Retailers
Zoos, Aquaria
Transportation
Deep Sea Freight Transportation
Marine Passenger Transportation
Marine Transportation Services
Search and Navigation Equipment
Warehousing
Table 3.1 NOEP ocean economy methodology
Chapter 3The Ocean Economy
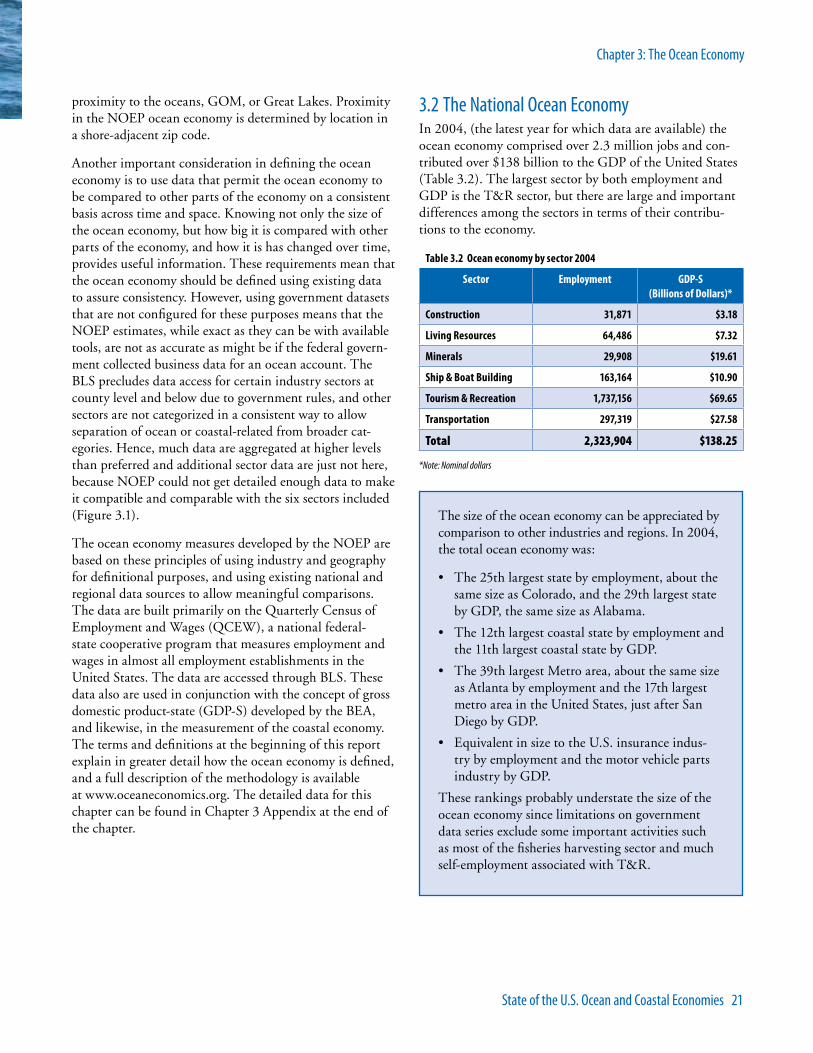
State of the U.S. Ocean and Coastal Economies 21
Chapter 3: The Ocean Economy
proximity to the oceans, GOM, or Great Lakes. Proximity in the NOEP ocean economy is determined by location in a shore-adjacent zip code.
Another important consideration in defining the ocean economy is to use data that permit the ocean economy to be compared to other parts of the economy on a consistent basis across time and space. Knowing not only the size of the ocean economy, but how big it is compared with other parts of the economy, and how it is has changed over time, provides useful information. These requirements mean that the ocean economy should be defined using existing data to assure consistency. However, using government datasets that are not configured for these purposes means that the NOEP estimates, while exact as they can be with available tools, are not as accurate as might be if the federal govern-ment collected business data for an ocean account. The BLS precludes data access for certain industry sectors at county level and below due to government rules, and other sectors are not categorized in a consistent way to allow separation of ocean or coastal-related from broader cat-egories. Hence, much data are aggregated at higher levels than preferred and additional sector data are just not here, because NOEP could not get detailed enough data to make it compatible and comparable with the six sectors included (Figure 3.1).
The ocean economy measures developed by the NOEP are based on these principles of using industry and geography for definitional purposes, and using existing national and regional data sources to allow meaningful comparisons. The data are built primarily on the Quarterly Census of Employment and Wages (QCEW), a national federal-state cooperative program that measures employment and wages in almost all employment establishments in the United States. The data are accessed through BLS. These data also are used in conjunction with the concept of gross domestic product-state (GDP-S) developed by the BEA, and likewise, in the measurement of the coastal economy. The terms and definitions at the beginning of this report explain in greater detail how the ocean economy is defined, and a full description of the methodology is available at www.oceaneconomics.org. The detailed data for this chapter can be found in Chapter 3 Appendix at the end of the chapter.
3.2 The National Ocean Economy In 2004, (the latest year for which data are available) the ocean economy comprised over 2.3 million jobs and con-tributed over $138 billion to the GDP of the United States (Table 3.2). The largest sector by both employment and GDP is the T&R sector, but there are large and important differences among the sectors in terms of their contribu-tions to the economy.
Table 3.2 Ocean economy by sector 2004
Sector Employment GDP-S (Billions of Dollars)*
Construction 31,871 $3.18
Living Resources 64,486 $7.32
Minerals 29,908 $19.61
Ship & Boat Building 163,164 $10.90
Tourism & Recreation 1,737,156 $69.65
Transportation 297,319 $27.58
Total 2,323,904 $138.25
*Note: Nominal dollars
The size of the ocean economy can be appreciated by comparison to other industries and regions. In 2004, the total ocean economy was:
The 25th largest state by employment, about the •same size as Colorado, and the 29th largest state by GDP, the same size as Alabama.
The 12th largest coastal state by employment and •the 11th largest coastal state by GDP.
The 39th largest Metro area, about the same size •as Atlanta by employment and the 17th largest metro area in the United States, just after San Diego by GDP.
Equivalent in size to the U.S. insurance indus-•try by employment and the motor vehicle parts industry by GDP.
These rankings probably understate the size of the ocean economy since limitations on government data series exclude some important activities such as most of the fisheries harvesting sector and much self-employment associated with T&R.
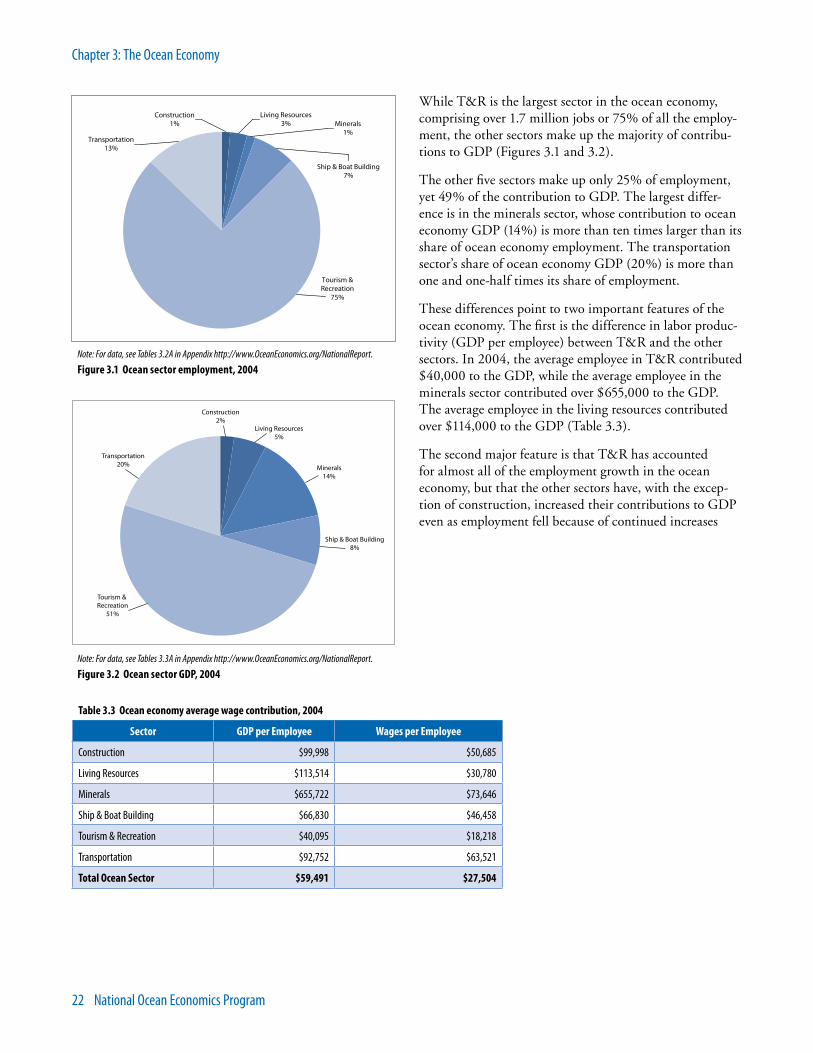
22 National Ocean Economics Program
Chapter 3: The Ocean Economy
While T&R is the largest sector in the ocean economy, comprising over 1.7 million jobs or 75% of all the employ-ment, the other sectors make up the majority of contribu-tions to GDP (Figures 3.1 and 3.2).
The other five sectors make up only 25% of employment, yet 49% of the contribution to GDP. The largest differ-ence is in the minerals sector, whose contribution to ocean economy GDP (14%) is more than ten times larger than its share of ocean economy employment. The transportation sector’s share of ocean economy GDP (20%) is more than one and one-half times its share of employment.
These differences point to two important features of the ocean economy. The first is the difference in labor produc-tivity (GDP per employee) between T&R and the other sectors. In 2004, the average employee in T&R contributed $40,000 to the GDP, while the average employee in the minerals sector contributed over $655,000 to the GDP. The average employee in the living resources contributed over $114,000 to the GDP (Table 3.3).
The second major feature is that T&R has accounted for almost all of the employment growth in the ocean economy, but that the other sectors have, with the excep-tion of construction, increased their contributions to GDP even as employment fell because of continued increases
Construction1%
Living Resources3% Minerals
1%Transportation
13%
Ship & Boat Building7%
Tourism & Recreation
75%
Note: For data, see Tables 3.2A in Appendix http://www.OceanEconomics.org/NationalReport.
Figure 3.1 Ocean sector employment, 2004
Transportation20%
Ship & Boat Building8%
Minerals14%
Living Resources5%
Construction2%
Tourism & Recreation
51%
Note: For data, see Tables 3.3A in Appendix http://www.OceanEconomics.org/NationalReport.
Figure 3.2 Ocean sector GDP, 2004
Table 3.3 Ocean economy average wage contribution, 2004
Sector GDP per Employee Wages per Employee
Construction $99,998 $50,685
Living Resources $113,514 $30,780
Minerals $655,722 $73,646
Ship & Boat Building $66,830 $46,458
Tourism & Recreation $40,095 $18,218
Transportation $92,752 $63,521
Total Ocean Sector $59,491 $27,504

State of the U.S. Ocean and Coastal Economies 23
Chapter 3: The Ocean Economy
in productivity (Figure 3.3). Over the period from 1990-2004, 658,000 jobs were added to the ocean economy, but these new jobs were offset by 132,000 jobs lost in the transportation, ship & boat building, and living resources sectors. Overall employment change over this period totaled 527,000, or 29% growth. The T&R sector accounted for more than nine in ten of the added jobs. However, it must be noted that many of these jobs are not full-time jobs in this sector, and therefore, represent an inflated number.
At the same time, the ocean economy as a whole grew by $26.5 billion (mea-sured on a constant 2000 dollar basis) or more than a quarter in terms of its contribution to GDP. Again, T&R accounted for most of this increase, with a growth of $24.4 billion. But all of the other sectors, except living resources, increased their contribution to national GDP.
Thanks to the rapid growth in T&R, the ocean economy grew almost twice as fast as the national economy in employment over the same period, but also because of the increasing con-centration of the ocean economy in T&R the ocean economy’s contribu-tion to GDP increased by only half the national rate.11
The rapid growth in T&R also greatly influences growth in the coastal economy. Employment growth in the ocean economy, which is by definition in the NOEP data series located in the coastal states and, to a great extent, in the shore-adjacent counties, has actu-ally occurred at a significantly faster rate than that of coastal states as a whole, or of shore-adjacent counties (Figure 3.4).
11 T&R employment and GDP growth is also inflated by the location of most of the nation’s large cities being located in coastal zip codes. It is unclear to what extent tourism in those cities is ocean-related.
8.5%
52.5%
21.9%18.1%
2.6%
29.4%
9.8%9.2%
-7.8%
10.7%
30.5%
79.9%
24.4%
20.6%
2.0%
-9.7%
-20%
-10%
0%
10%
20%
30%
40%
50%
60%
70%
80%
90%
Construction LivingResources
Minerals Ship & BoatBuilding
Tourism &Recreation
Transportation Total OceanEconomy
Total U.S.Economy
Employment GDP (2000 Chained Dollars)
Note: For data, see Tables 3.2A and 3.3A in Appendix http://www.OceanEconomics.org/NationalReport.
Figure 3.3 Ocean economy growth by sector 1997-2004
21.9%
5.7%
7.2%
14.7%
0%
5%
10%
15%
20%
25%
U.S. Coastal State Shore Adjacent Ocean
Note: For actual numbers, see Table 3.1A (ocean economy employment by region)
Figure 3.4 Employment growth in coastal and ocean economies 1997-2004
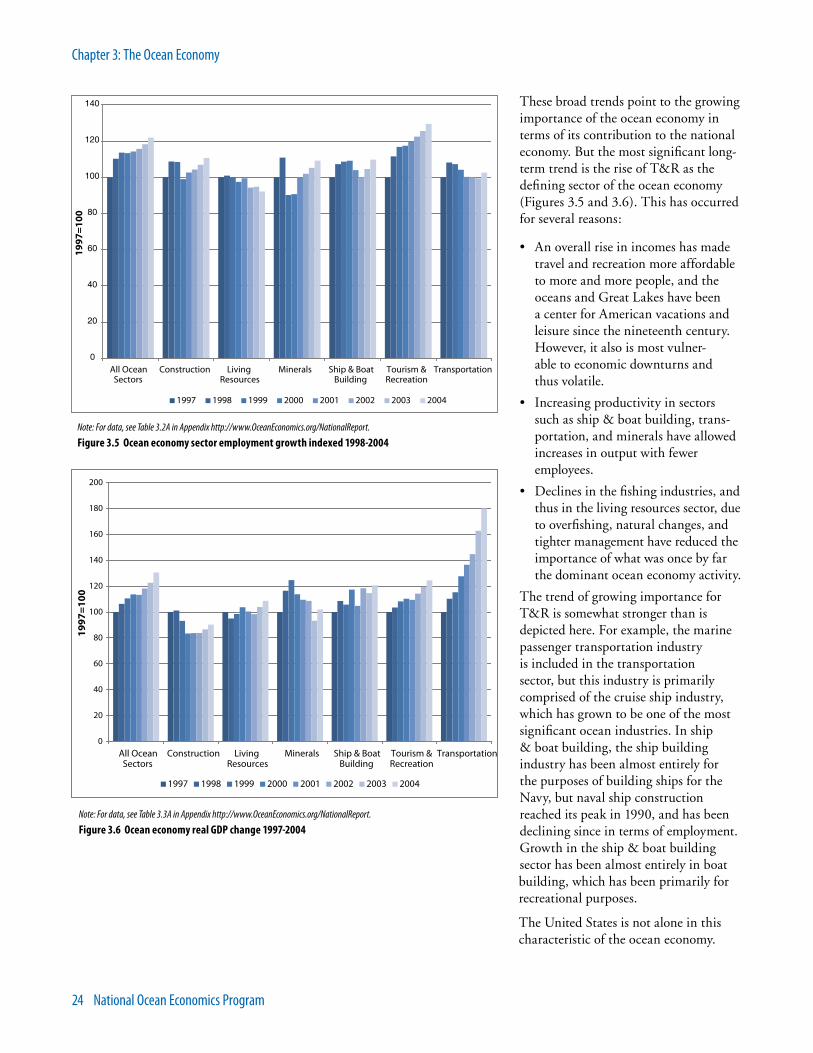
24 National Ocean Economics Program
Chapter 3: The Ocean Economy
These broad trends point to the growing importance of the ocean economy in terms of its contribution to the national economy. But the most significant long-term trend is the rise of T&R as the defining sector of the ocean economy (Figures 3.5 and 3.6). This has occurred for several reasons:
An overall rise in incomes has made •travel and recreation more affordable to more and more people, and the oceans and Great Lakes have been a center for American vacations and leisure since the nineteenth century. However, it also is most vulner-able to economic downturns and thus volatile.
Increasing productivity in sectors •such as ship & boat building, trans-portation, and minerals have allowed increases in output with fewer employees.
Declines in the fishing industries, and •thus in the living resources sector, due to overfishing, natural changes, and tighter management have reduced the importance of what was once by far the dominant ocean economy activity.
The trend of growing importance for T&R is somewhat stronger than is depicted here. For example, the marine passenger transportation industry is included in the transportation sector, but this industry is primarily comprised of the cruise ship industry, which has grown to be one of the most significant ocean industries. In ship & boat building, the ship building industry has been almost entirely for the purposes of building ships for the Navy, but naval ship construction reached its peak in 1990, and has been declining since in terms of employment. Growth in the ship & boat building sector has been almost entirely in boat building, which has been primarily for recreational purposes.
The United States is not alone in this characteristic of the ocean economy.
0
20
40
60
80
100
120
140
All OceanSectors
Construction LivingResources
Minerals Ship & BoatBuilding
Tourism &Recreation
Transportation
1997
=10
0
1997 1998 1999 2000 2001 2002 2003 2004
Note: For data, see Table 3.2A in Appendix http://www.OceanEconomics.org/NationalReport.
Figure 3.5 Ocean economy sector employment growth indexed 1998-2004
0
20
40
60
80
100
120
140
160
180
200
All OceanSectors
Construction LivingResources
Minerals Ship & BoatBuilding
Tourism &Recreation
Transportation
1997
=10
0
1997 1998 1999 2000 2001 2002 2003 2004
Note: For data, see Table 3.3A in Appendix http://www.OceanEconomics.org/NationalReport.
Figure 3.6 Ocean economy real GDP change 1997-2004
State of the U.S. Ocean and Coastal Economies 25
Chapter 3: The Ocean Economy
Studies in other countries have found that T&R activities and support industries have been the dominant part of the ocean economy. In France, tourism is “by far the largest sector in of the marine and coastal economy in terms of turnover and employment” (Kalaydijan, et al. 2005). The cruise ship industry in France is not only a major part of French ocean recreation, it is also a significant part of its ship building industry; a quarter of the large cruise ships were built in France in 2005. In Australia, its marine tourism contributed 43% of output and 75% of employ-ment to the ocean economy in 2002-2003 (Allen 2003).
At the same time the growth in T&R in the ocean economy reflects a number of characteristics of the United States that are relatively unique. Most of the nation’s major cities are in coastal locations, giving the T&R industries an important role in America’s cities that is not found in countries such as Canada or the United Kingdom, where major urban areas are not located so as to contribute to the marine recreation economy. As a result, sectors such as living resources and minerals play larger roles in these countries’ ocean econo-mies (Gislason and Associates 2007; Pugh and Skinner 2002). Outside the cities, the United States has unmatched resources in beaches, coastal rivers and wetlands, and areas of preserved park and recreational lands.
The overall changes in the ocean discussed so far reflect long-term trends, which can be seen by looking at two end points between 1997 and 2004, but actual changes over the period show considerably different paths for the various ocean economy sectors. All of the sectors were severely affected by the 1990-1991 recession, and all of the sectors took several years to return to 1990 levels of employ-ment and output. T&R recovered the quickest in terms of employment followed by construction, and only these two sectors, and minerals, ended the period significantly above their 1990 level of employment. In terms of GDP growth, both minerals and transportation exhibited significant volatility throughout the period, while marine construction slowed its output growth considerably from 2001 on. The implications of these trends will be discussed in Chapter 5 on the future.
3.3 The Ocean Economy in the StatesThe national ocean economy is distributed across the coastal states in ways that are both consistent with the distribution of the national economy as a whole, and also, unique to the features of the ocean economy. For example, four of the five largest ocean economy states, in terms of employment, are also the four largest states in terms of total employment: California, Florida, Texas, and New York (Table 3.4). California, not surprisingly, is the only state ranked in the top-five states by employment for five of the six sectors, and overall. Washington State ranks fourth among states in the ocean economy because of the size and economic diversity in and around Puget Sound.
Washington State also is the largest state in terms of the living resources sector; this is partly the result of a statisti-cal anomaly. Much of the fisheries harvesting industry employment in Washington is included in QCEW, while the harvesting industry in most other states is not mea-sured in these data. If it were, states such as Louisiana and Texas would rank higher. But Washington State is home also to a substantial fishing industry that operates off of Alaska; when combined with Alaska’s living resources sector (ranked at number two among the states) the impor-tance of the Northwest Pacific fisheries is apparent.
California and Florida are, not surprisingly, the two leading states in T&R employment, but New York and Washington are third and fourth reflecting T&R in the urban areas. Hawaii, where T&R is by far the dominant industry, is fifth.
Larger population states are, also not surprisingly, the dominant states in terms of the marine construction and marine transportation. The offshore oil and gas industry is concentrated almost entirely in the states of Louisiana, Texas, Alaska, and California. Michigan’s limestone, sand & gravel industry place it in the top-five.
The top-five states for ship & boat building are somewhat misleading. While Virginia is clearly the leading state with the Newport News ship yards and related facilities, there
Table 3.4 Top-five states by ocean economy and ocean economy sector, 2004
Ocean Economy Tourism & Recreation Marine Construction Living Resources Minerals Ship & Boat Building Marine Transportation
California California Texas Washington Louisiana Virginia California
Florida Florida Louisiana Alaska Texas Washington Florida
New York New York California California Alaska Louisiana New Jersey
Washington Washington Florida Mississippi California Florida Texas
Texas Hawaii New York Florida Michigan Maine Louisiana
Source: NOEP
26 National Ocean Economics Program
Chapter 3: The Ocean Economy
are two states, Connecticut and Missis-sippi that should be on the list, probably in the third and fourth positions. These states are not included because each has one major ship yard, the Electric Boat Division in Groton, Connecticut and the Ingalls Shipyard in Pascagoula, Mis-sissippi. Both are very large ship yards, but confidentiality rules prevent disclos-ing their employment in any data series. While their employment is included in the national totals, they are not visible at the state level.
Another perspective on the states is provided by examining the ocean economy’s share of each state’s economy. Not surprisingly, Hawaii leads all states with 15% of its employment in ocean economy sectors, followed by Alaska with 11%. These are the only two states in which the ocean economy comprises more than 10% of employment. Maine is third with 7%, followed by Rhode Island, Louisiana, and Washington, each with 5-6% of their total 2004 employment in the ocean economy. Florida and Delaware have 3-4% in the ocean economy, while ten states have 2-3%, seven states have 1-2% and five states have less than 1%. Of these, three (Ohio, Indiana, and Minnesota) are Great Lakes States.
Change in the ocean economy among the states has also been highly variable. These changes can be measured as the total growth in employment or as the growth rate (percent change). Each measure produces a different perspective on growth: changes in total employment tend to favor the largest states, while growth rates (percent changes) can favor smaller states. By combining the rank-ings on both into a single measure these biases are somewhat offset (Figure 3.7). The results divide the states into three groups when the states are rank-ordered by a composite ranking on the two measures:
Similar rankings in both growth and growth rates. New York, Florida, and Hawaii ranked high on both measures and
near the top of the list. These states, along with Illinois, reflect much of the growth in the ocean economy that has been taking place in urban areas. At the other end, states such as Maine, New Hampshire, Oregon, and Indiana had
Ranking of States by 1997-2004 Ocean Economy Employment Growth and Employment Growth Rate
0 10 20 30 40 50 60 70
OregonNew
IndianaMaine
AlabamaWisconsin
VirginiaMichigan
MississippiLouisiana
GeorgiaWashington
MassachusettsConnecticut
MinnesotaOhio
TexasPennsylvania
AlaskaDelawareMaryland
New JerseyCalifornia
North CarolinaRhode Island
IllinoisHawaiiSouth
FloridaNew York
Rank in Total Employment Change Rank in Employment Growth
Note: Highest growth = 1; Lowest growth = 30
Figure 3.7 Ocean economy growth ranking by state 1997-2004
8.7%
3.6%
1.6%
-7.9%
-10.5%
3.4%
-0.3%
3.5%2.5%
-8.7%
1.1%
4.2%
0.2%0.3%
-15%
-10%
-5%
0%
5%
10%
1998 1999 2000 2001 2002 2003 2004
Employment
GDP ($2000)
Note: For data, see Tables 3.2A and 3.3A in Appendix http://www.OceanEconomics.org/NationalReport.
Figure 3.8 Marine construction economic change 1997-2004
State of the U.S. Ocean and Coastal Economies 27
Chapter 3: The Ocean Economy
similar low rankings in both total ocean economy employment growth and the growth rate.
States ranked high on one measure, but low on the other. South Carolina, Rhode Island, and Delaware have relatively small ocean economies and so growth rates tend to be high relative to larger states. Texas, Washington, Pennsylvania, California, and New Jersey are states that ranked highly in total employment growth, but lower in growth rates.
Mixed ranking states in which neither measure predominates.
This analysis suggests that ocean economy employment growth has exhib-ited no strong regional patterns. States from the northeast, southeast, Pacific, and Great Lakes are ranked near the top, while states from the Pacific, New England, Gulf of Mexico, and Great Lakes are ranked near the bottom. Change in the ocean economy has been driven by a combination of geographic and economic factors that vary greatly across the coastal regions.
3.4 The Ocean Economy SectorsMarine Construction
The marine construction sector includes firms in heavy construction, which pri-marily are engaged in activities such as the construction of piers, harbor dredging, and the building of marine structures, such as offshore oil platforms.
Like most construction activity, this industry is highly •volatile over time (Figure 3.8). Growth rates are affected by overall economic activity and by government spend-ing on projects such as beach nourishment and harbor dredging. There is also a close connection to offshore oil and gas operations.
Marine construction activity tends to be centered where •the oil and gas industries are located. In 2004, states with the largest employment in marine construction were Texas (8,500) and Louisiana (4,500). Together with Florida, New York, and Washington, these five states comprised 74% of employment in the nineteen
states for which data on marine construction employ-ment was available in 2004.
One of the major activities in marine construction is •the nourishment of beaches with sand to counteract the effects of erosion. Beach nourishment has been occur-ring for more than fifty years, with average national expenditures increasing from $226.5 thousand in the 1960s (in $2000) to over $1.26 million a year in this decade (Table 3.5). The volume of sand moved has risen in the past two decades, and the cost of each cubic yard of sand used for beach nourishment has increased by more than 600% in real dollars since the sixties.
Over three-quarters of beach nourishment activity and •four-fifths of funding comes from the federal govern-ment, with state, local, and private funding picking up the balance (Figure 3.9).
Table 3.5 Beach nourishment expenditures
Average Annual Expenditures ($2000)
Average Annual Cubic Yards Beach Nourish-
ment
Average Cost ($2000) per yard)
1960s $226.51 168.74 $1.34
1970s $413.47 160.14 $2.58
1980s $719.94 182.37 $3.95
1990s $1,272.44 241.75 $5.26
2000-06 $1,260.45 178.84 $7.05
Note: For data, see Tables 3.6A in Appendix http://www.OceanEconomics.org/NationalReport. Source: Western Carolina University
Funding Sources for Beach Nourishment 1960-2007
76.1%82.2%
17.3%13.3%
6.6% 4.5%
0%
10%
20%
30%
40%
50%
60%
70%
80%
90%
100%
Volume Expenditures
Local/Private
State/Local*
Federal**
Source: Western Carolina University
Figure 3.9 Source of funding for beach nourishment, cumulative 1960-2007

28 National Ocean Economics Program
Chapter 3: The Ocean Economy
Over the past 50+ years, more money •has been spent on Florida than any other state. More than four of every ten dollars spent on beach nourishment has gone to Florida (Figure 3.10). New Jersey, New York, and North Carolina together have accounted for about the same as Florida in expenditures.
In contrast, more sand is moved •in California than any other state (Figure 3.11). Over half the sand deployed for beach nourishment has been in California with Florida a distant second at 18%. The differences reflect the differing relative unit costs of nourishment.
Living Resources
The living resources sector has been highly volatile over time due to weather, changes in fish stocks, and regulations (Figure 3.12).
California55.4%
Florida18.6%
New Jersey12.4%
New York8.8%
Virginia1.9%
Louisiana1.4%
Georgia0.7%
Alabama0.3%
Massachusetts0.3%
New Hampshire0.2%
Source: Western Carolina UniversityNote: For data, see Table 3.5A in Appendix http://www.OceanEconomics.org/NationalReport.
Figure 3.11 Top-ten beach nourishment states by volume 1960-2007
0.9%
-0.9%
-2.5%
2.1%
-5.2%
0.5%
-2.7%
-5.0%
3.7%
5.2%
-3.1%
-2.0%
5.6%
4.5%
-6%
-4%
-2%
0%
2%
4%
6%
8%
1998 1999 2000 2001 2002 2003 2004
Employment GDP ($2000)
Note: For data, see Tables 3.2A and 3.3 in Appendix http://www.OceanEconomics.org/NationalReport.
Figure 3.12 Economic change in the living resources sector 1997-2004
Florida41.7%
New Jersey21.6%
New York9.0%
North Carolina7.8%
Virginia5.9%
South Carolina4.7%
Maryland3.5%
California2.8%
Louisiana2.0% Georgia
1.0%
Source: Western Carolina UniversityNote: For data, see Table 3.6A in Appendix http://www.OceanEconomics.org/NationalReport.
Figure 3.10 Top-ten beach nourishment states by expenditure 1960-2007
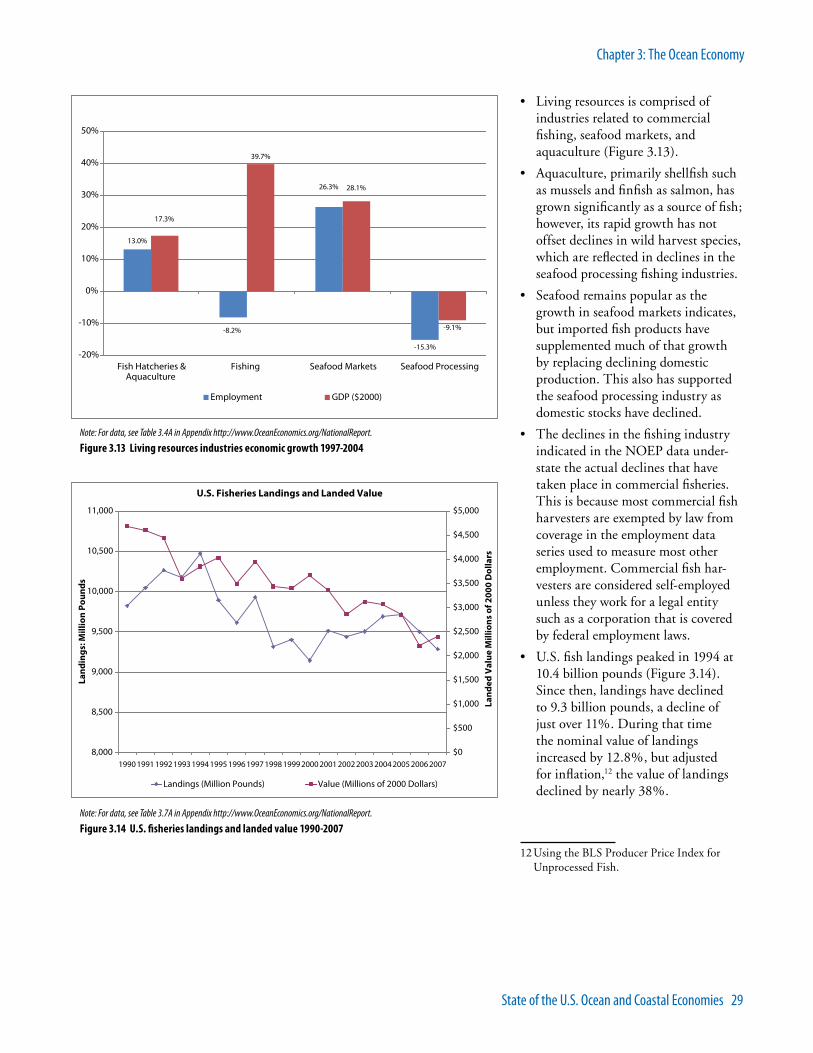
State of the U.S. Ocean and Coastal Economies 29
Chapter 3: The Ocean Economy
Living resources is comprised of •industries related to commercial fishing, seafood markets, and aquaculture (Figure 3.13).
Aquaculture, primarily shellfish such •as mussels and finfish as salmon, has grown significantly as a source of fish; however, its rapid growth has not offset declines in wild harvest species, which are reflected in declines in the seafood processing fishing industries.
Seafood remains popular as the •growth in seafood markets indicates, but imported fish products have supplemented much of that growth by replacing declining domestic production. This also has supported the seafood processing industry as domestic stocks have declined.
The declines in the fishing industry •indicated in the NOEP data under-state the actual declines that have taken place in commercial fisheries. This is because most commercial fish harvesters are exempted by law from coverage in the employment data series used to measure most other employment. Commercial fish har-vesters are considered self-employed unless they work for a legal entity such as a corporation that is covered by federal employment laws.
U.S. fish landings peaked in 1994 at •10.4 billion pounds (Figure 3.14). Since then, landings have declined to 9.3 billion pounds, a decline of just over 11%. During that time the nominal value of landings increased by 12.8%, but adjusted for inflation,12 the value of landings declined by nearly 38%.
12 Using the BLS Producer Price Index for Unprocessed Fish.
-15.3%
39.7%
-9.1%-8.2%
13.0%
26.3% 28.1%
17.3%
-20%
-10%
0%
10%
20%
30%
40%
50%
Fish Hatcheries &Aquaculture
Fishing Seafood Markets Seafood Processing
Employment GDP ($2000)
U.S. Fisheries Landings and Landed Value
8,000
8,500
9,000
9,500
10,000
10,500
11,000
1990 1991 1992 1993 1994 1995 1996 1997 1998 1999 2000 2001 2002 2003 2004 2005 2006 2007
Lan
din
gs:
Mill
ion
Po
un
ds
$0
$500
$1,000
$1,500
$2,000
$2,500
$3,000
$3,500
$4,000
$4,500
$5,000
Lan
ded
Val
ue
Mill
ion
s o
f 200
0 D
olla
rs
Landings (Million Pounds) Value (Millions of 2000 Dollars)
Note: For data, see Table 3.4A in Appendix http://www.OceanEconomics.org/NationalReport.
Figure 3.13 Living resources industries economic growth 1997-2004
Note: For data, see Table 3.7A in Appendix http://www.OceanEconomics.org/NationalReport.
Figure 3.14 U.S. fisheries landings and landed value 1990-2007

30 National Ocean Economics Program
Chapter 3: The Ocean Economy
The Pacific fisheries, particularly •the Northwest Pacific fisheries off Alaska, increased landings; as a result, the Pacific region’s share of national fisheries landings increased from 68% to 72% between 1990 and 2007 (Figure 3.15).
After the Pacific, the two most •important fisheries regions are the Gulf of Mexico and New England, both of which experienced more than 10% declines in landings and associated drops in their share of the national fishing industry.
All other regions saw declines in their •landings, led by the South Atlantic and the Great Lakes, which had very large decline rates, but these are relatively small fisheries regions. The result of this decline in landings is that all but four states had a decline in living resources employment over 1990-2004, particularly in seafood processing. The only four states to see growth were Texas, Hawaii, Alabama, and North Carolina.
Despite increases in landings, both •Alaska (-12%) and Washington (-24%) declined in employment in the living resources sector. Not sur-prisingly, the largest decline has been in states on the Great Lakes and in the South Atlantic, such as Georgia and South Carolina. California also had a sharp drop in employment in this sector.
Another side to the living resources sector sometimes is overlooked. A decade sample of U.S. landings and values compared with foreign imports indicates much higher values for imported than for domestic fish relative to weight (Figure 3.16).
-54.4%
-61.3%
-4.8%
-12.6%-15.7%
5.7%0.5%
3.0%2.3%
68.2%
18.6%
7.5%
0.2%2.2%6.7%
73.7%
16.0%
1.2%
-80%
-60%
-40%
-20%
0%
20%
40%
60%
80%
100%
Pacific Gulf of Mexico New England Mid-Atlantic South Atlantic Great Lakes
Percent Change 1990-2007 Share of 1990 Landings Share of 2007 Landings
Figure 3.15 Change in landings by major region 1990-2007
0
2
4
6
8
10
12
1997 1998 1999 2000 2001 2002 2003 2004 2005 2006 2007
Bil
lio
n P
ou
nd
s
$0
$1
$2
$3
$4
$5
$6
$7
$8
$9
$10
$Bil
lio
ns
(200
0)
Import Weight Landed Weight Import Value Landed Value
Source: Department of Commerce, NOAA National Marine Fisheries ServiceNote: For data, see Table 3.9A in Appendix http://www.OceanEconomics.org/NationalReport.
Figure 3.16 Comparison of U.S. domestic fish landings with foreign imported fish 1997-2007
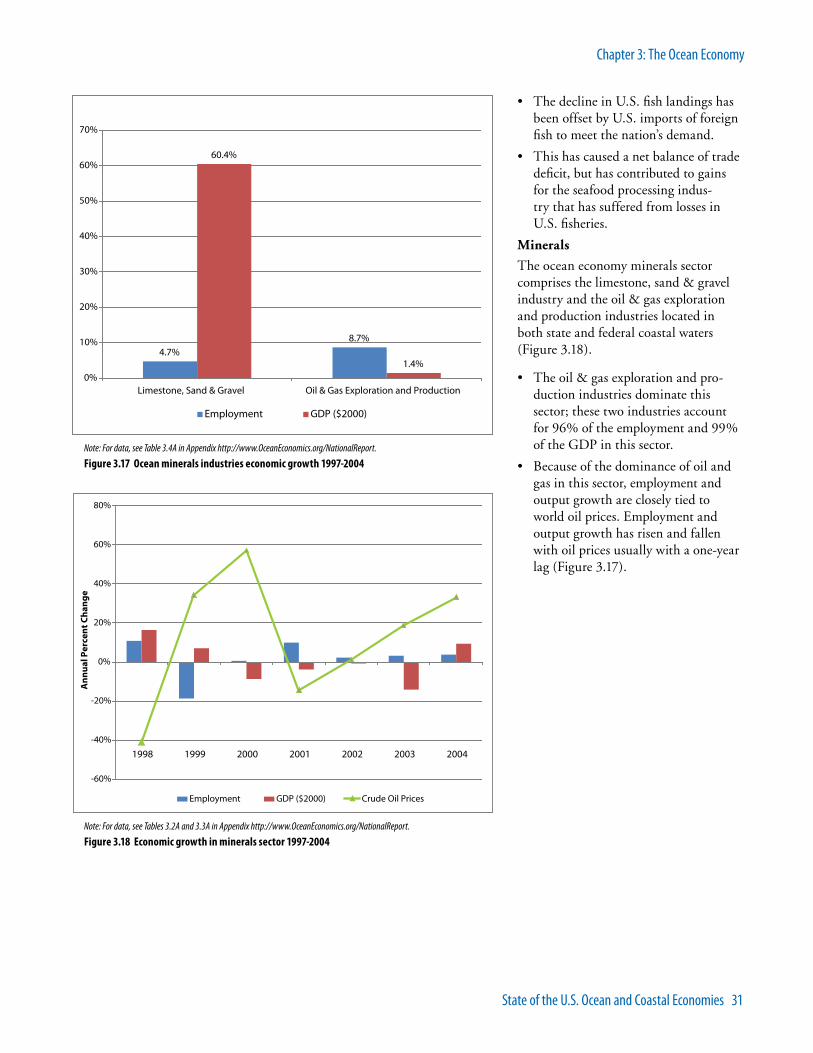
State of the U.S. Ocean and Coastal Economies 31
Chapter 3: The Ocean Economy
The decline in U.S. fish landings has •been offset by U.S. imports of foreign fish to meet the nation’s demand.
This has caused a net balance of trade •deficit, but has contributed to gains for the seafood processing indus-try that has suffered from losses in U.S. fisheries.
Minerals
The ocean economy minerals sector comprises the limestone, sand & gravel industry and the oil & gas exploration and production industries located in both state and federal coastal waters (Figure 3.18).
The oil & gas exploration and pro-•duction industries dominate this sector; these two industries account for 96% of the employment and 99% of the GDP in this sector.
Because of the dominance of oil and •gas in this sector, employment and output growth are closely tied to world oil prices. Employment and output growth has risen and fallen with oil prices usually with a one-year lag (Figure 3.17).
-60%
-40%
-20%
0%
20%
40%
60%
80%
1998 1999 2000 2001 2002 2003 2004
An
nu
al P
erce
nt C
han
ge
Employment GDP ($2000) Crude Oil Prices
Note: For data, see Tables 3.2A and 3.3A in Appendix http://www.OceanEconomics.org/NationalReport.
Figure 3.18 Economic growth in minerals sector 1997-2004
4.7%8.7%
60.4%
1.4%0%
10%
20%
30%
40%
50%
60%
70%
Limestone, Sand & Gravel Oil & Gas Exploration and Production
Employment GDP ($2000)
Note: For data, see Table 3.4A in Appendix http://www.OceanEconomics.org/NationalReport.
Figure 3.17 Ocean minerals industries economic growth 1997-2004

32 National Ocean Economics Program
Chapter 3: The Ocean Economy
The offshore oil & gas industry is •dominated by the GOM, which accounted for 73% of U.S. offshore production in 1990 and 85% in 2004 (Figure 3.19). Only growth in the Central GOM permitted the industry and sector to show modest growth in employment and output over the period.
The primary region in the Gulf of •Mexico is the Central Gulf, roughly the state and federal waters that lie offshore Louisiana. This region alone accounted for 63% of produc-tion in 1990 and 75% in 2004.
The only other two producing •regions outside the GOM are in Alaska and California. Both of these regions peaked in output in 1996, and both have seen declining output since as reservoirs have been depleted. Alaskan output declined 40% between 1996 and 2004, while California output dropped by half, primarily in state waters. These declines, particularly in state waters, also reflect declines in state revenues as a result.
Louisiana, Texas, Alaska, and •California account for 90% of the employment in this sector, and 95% of the output.
Ship & Boat Building & Repair
Ship building in the United States is primarily oriented towards build-ing, maintaining, and repairing ships for the U.S. Navy. A relatively small number of companies located in Vir-ginia, Connecticut, Maine, Mississippi, Louisiana, and California undertake most of this work.
Ship building activity declined sig-•nificantly between 1990 (the peak of the Reagan era defense buildup) and the late 1990s, but showed modest increases in employment in 1997 and 2004, and somewhat greater growth in the value of output as the complexity of navy ships continued to increase (Figure 3.20).
0
100,000,000
200,000,000
300,000,000
400,000,000
500,000,000
600,000,000
1990 1991 1992 1993 1994 1995 1996 1997 1998 1999 2000 2001 2002 2003 2004
Bar
rels
of O
il
Alaska
California
Western Gulf of Mexico
Central Gulf of Mexico
Note: For data, see Table 3.10A in Appendix http://www.OceanEconomics.org/NationalReport.
Figure 3.19 Offshore oil production in state and federal waters 1990-2004
1.3%
4.5% 5.0%
-2.6%
11.0%
-10.6%
12.9%
-3.1%
-4.7%
7.2%
0.5%
-3.7%
5.3%
8.5%
-15%
-10%
-5%
0%
5%
10%
15%
1998 1999 2000 2001 2002 2003 2004
An
nu
al P
erce
nt C
han
ge
Employment GDP ($2000)
Note: For data, see Tables 3.2A and 3.3A in Appendix http://www.OceanEconomics.org/NationalReport.
Figure 3.20 Economic change in the ship & boat building sector 1997-2004
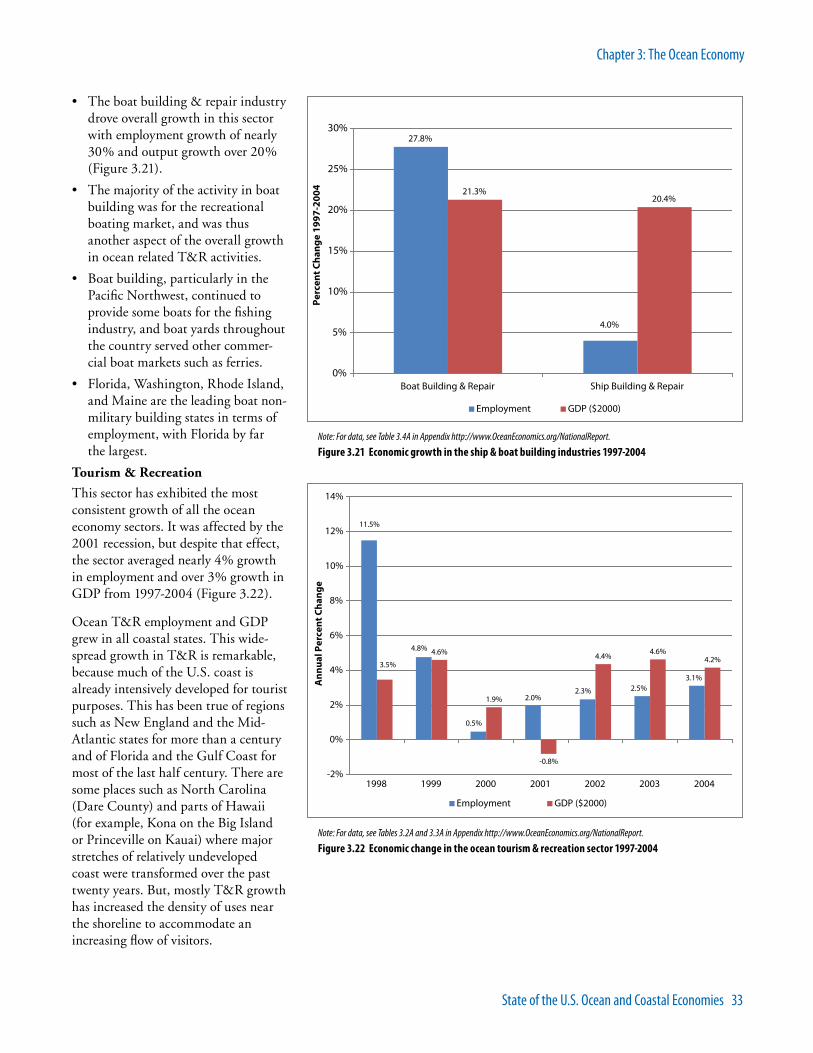
State of the U.S. Ocean and Coastal Economies 33
Chapter 3: The Ocean Economy
The boat building & repair industry •drove overall growth in this sector with employment growth of nearly 30% and output growth over 20% (Figure 3.21).
The majority of the activity in boat •building was for the recreational boating market, and was thus another aspect of the overall growth in ocean related T&R activities.
Boat building, particularly in the •Pacific Northwest, continued to provide some boats for the fishing industry, and boat yards throughout the country served other commer-cial boat markets such as ferries.
Florida, Washington, Rhode Island, •and Maine are the leading boat non-military building states in terms of employment, with Florida by far the largest.
Tourism & Recreation
This sector has exhibited the most consistent growth of all the ocean economy sectors. It was affected by the 2001 recession, but despite that effect, the sector averaged nearly 4% growth in employment and over 3% growth in GDP from 1997-2004 (Figure 3.22).
Ocean T&R employment and GDP grew in all coastal states. This wide-spread growth in T&R is remarkable, because much of the U.S. coast is already intensively developed for tourist purposes. This has been true of regions such as New England and the Mid-Atlantic states for more than a century and of Florida and the Gulf Coast for most of the last half century. There are some places such as North Carolina (Dare County) and parts of Hawaii (for example, Kona on the Big Island or Princeville on Kauai) where major stretches of relatively undeveloped coast were transformed over the past twenty years. But, mostly T&R growth has increased the density of uses near the shoreline to accommodate an increasing flow of visitors.
27.8%
4.0%
21.3%20.4%
0%
5%
10%
15%
20%
25%
30%
Boat Building & Repair Ship Building & Repair
Per
cen
t Ch
ang
e 19
97-2
004
Employment GDP ($2000)
2.0%
4.6%
1.9%
-0.8%
4.4%4.6%
4.2%
3.1%2.5%2.3%
0.5%
4.8%
11.5%
3.5%
-2%
0%
2%
4%
6%
8%
10%
12%
14%
1998 1999 2000 2001 2002 2003 2004
An
nu
al P
erce
nt C
han
ge
Employment GDP ($2000)
Note: For data, see Table 3.4A in Appendix http://www.OceanEconomics.org/NationalReport.
Figure 3.21 Economic growth in the ship & boat building industries 1997-2004
Note: For data, see Tables 3.2A and 3.3A in Appendix http://www.OceanEconomics.org/NationalReport.
Figure 3.22 Economic change in the ocean tourism & recreation sector 1997-2004

34 National Ocean Economics Program
Chapter 3: The Ocean Economy
The T&R sector has nine industries, •with eating & drinking places and hotels & lodging places by far the largest, accounting for 92% of 2004 sector employment and 85% of the GDP (Figure 3.23).
Of the other industries, amusement •& recreation services not elsewhere classified (NEC) and boat dealers are the next largest, accounting together for 4% of employment and 9% of GDP.
Hotels and restaurants grew rapidly •on both measures, but there was also rapid growth in other industries, notably boat dealers (reflecting the growth in boat building discussed under ship building & repair), zoos and aquaria, and RV parks.
This discussion of T&R activities has focused on the economic activity measured by employment and output associated with this sector. The mea-surement of the actual activities that people engage in is another key part of understanding ocean T&R. There has been only one major national study of this subject (though states collect data to varying degrees), the 2000 National Survey on Recreation and the Environ-ment. The results of this study are dis-cussed in Chapter 4.
Marine Transportation
The marine transportation sector is made up of five industries: 1) freight transportation, 2) passenger transporta-tion, 3) marine transportation services, 4) warehousing (when located in a shore-adjacent zip code), 5) electronics industry search and navigation equip-ment that reflects the increasing appli-cation of information technologies to transportation.
Overall this sector tends to follow the national economy in terms of its contribution to GDP, but it has shown prolonged periods of negative employment growth due primarily to continuing improvements in productivity through such technologies as containerized cargo shipping and handling (Figure 3.24).
Output and employment in freight transportation has •been declining in both employment and contribution to GDP, which reflects long-term improvements in produc-tivity in the marine freight industry. Containerization and port operations that handle even larger container ships with more mechanization account for most of this change in the freight industry.
Percent Change 1997-2004
21.1%
33.5%
26.1%
24.7%
41.4%
1.1%
-17.6%
3.7%
3.4%
69.0%
30.4%
36.9%
68.3%
27.2%
19.0%
17.8%
30.2%
14.4%
-30% -20% -10% 0% 10% 20% 30% 40% 50% 60% 70% 80%
Amusement andRecreation Services NEC
Boat Dealers
Eating & Drinking Places
Hotels & Lodging Places
Marinas
Recreational VehicleParks & Campsites
Scenic Water Tours
Sporting Goods Retailers
Zoos, Aquaria
GDP ($2000)
Employment
Note: For data, see Table 3.4A in Appendix http://www.OceanEconomics.org/NationalReport.
Figure 3.23 Economic change in tourism & recreation sector 1997-2004
8.1%
-0.8%
-2.9%
-3.8%
-0.3% -0.6%
10.3%
4.5%
10.8%
7.0%
6.0%
12.5%
10.6%
3.2%
-6%
-4%
-2%
0%
2%
4%
6%
8%
10%
12%
14%
1998 1999 2000 2001 2002 2003 2004
Ann
ual P
erce
nt C
hang
e
Employment GDP ($2000)
Note: For data, see Tables 3.2A and 3.3A in Appendix http://www.OceanEconomics.org/NationalReport.
Figure 3.24 Economic change in the marine transportation sector 1997-2004
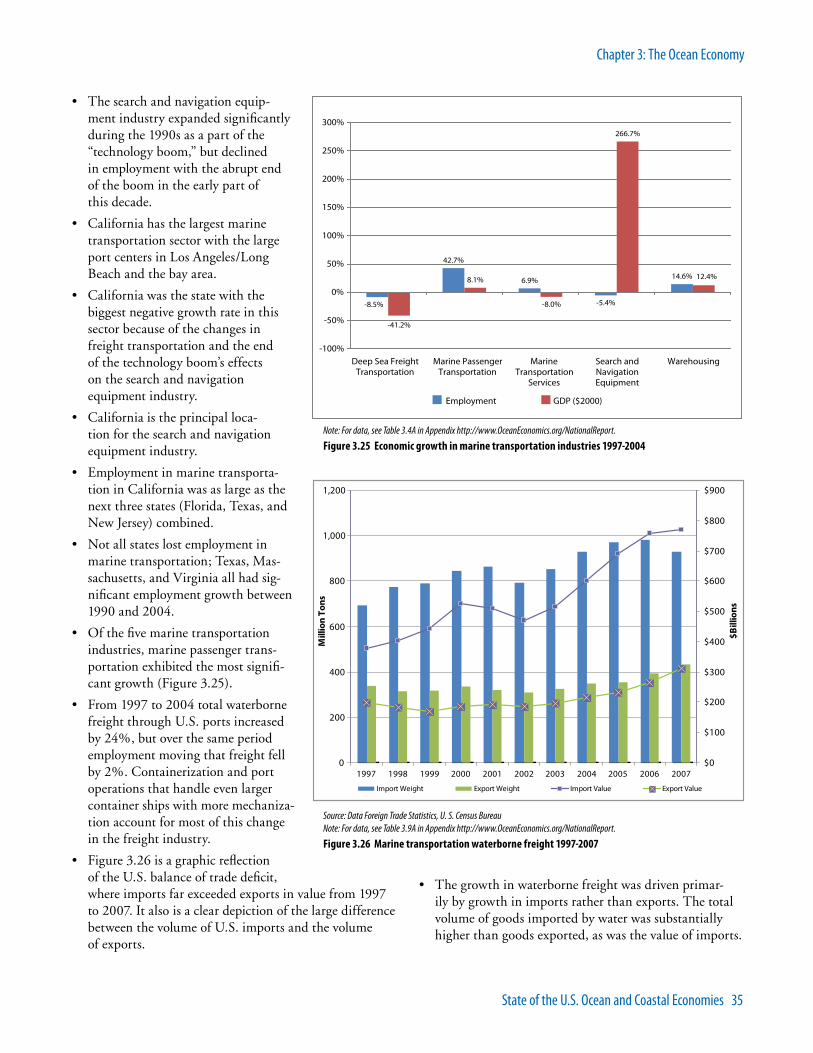
State of the U.S. Ocean and Coastal Economies 35
Chapter 3: The Ocean Economy
The search and navigation equip-•ment industry expanded significantly during the 1990s as a part of the “technology boom,” but declined in employment with the abrupt end of the boom in the early part of this decade.
California has the largest marine •transportation sector with the large port centers in Los Angeles/Long Beach and the bay area.
California was the state with the •biggest negative growth rate in this sector because of the changes in freight transportation and the end of the technology boom’s effects on the search and navigation equipment industry.
California is the principal loca-•tion for the search and navigation equipment industry.
Employment in marine transporta-•tion in California was as large as the next three states (Florida, Texas, and New Jersey) combined.
Not all states lost employment in •marine transportation; Texas, Mas-sachusetts, and Virginia all had sig-nificant employment growth between 1990 and 2004.
Of the five marine transportation •industries, marine passenger trans-portation exhibited the most signifi-cant growth (Figure 3.25).
From 1997 to 2004 total waterborne •freight through U.S. ports increased by 24%, but over the same period employment moving that freight fell by 2%. Containerization and port operations that handle even larger container ships with more mechaniza-tion account for most of this change in the freight industry.
Figure 3.26 is a graphic reflection •of the U.S. balance of trade deficit, where imports far exceeded exports in value from 1997 to 2007. It also is a clear depiction of the large difference between the volume of U.S. imports and the volume of exports.
The growth in waterborne freight was driven primar-•ily by growth in imports rather than exports. The total volume of goods imported by water was substantially higher than goods exported, as was the value of imports.
42.7%
6.9%
-5.4%
14.6%8.1%
-8.0%
266.7%
-8.5%
-41.2%
12.4%
-100%
-50%
0%
50%
100%
150%
200%
250%
300%
Deep Sea FreightTransportation
Marine PassengerTransportation
MarineTransportation
Services
Search andNavigationEquipment
Warehousing
Employment GDP ($2000)
Note: For data, see Table 3.4A in Appendix http://www.OceanEconomics.org/NationalReport.
Figure 3.25 Economic growth in marine transportation industries 1997-2004
0
200
400
600
800
1,000
1,200
1997 1998 1999 2000 2001 2002 2003 2004 2005 2006 2007
Mill
ion
Tons
$0
$100
$200
$300
$400
$500
$600
$700
$800
$900
$Bill
ions
Import Weight Export Weight Import Value Export Value
Source: Data Foreign Trade Statistics, U. S. Census BureauNote: For data, see Table 3.9A in Appendix http://www.OceanEconomics.org/NationalReport.
Figure 3.26 Marine transportation waterborne freight 1997-2007
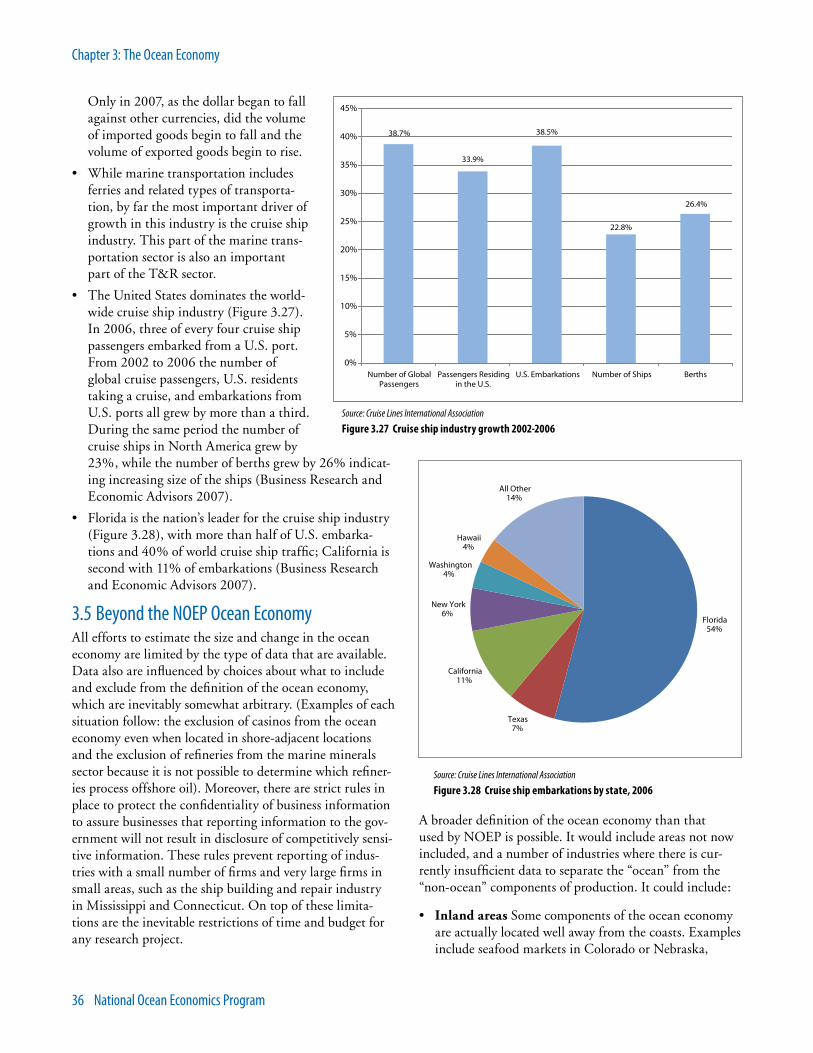
36 National Ocean Economics Program
Chapter 3: The Ocean Economy
Only in 2007, as the dollar began to fall against other currencies, did the volume of imported goods begin to fall and the volume of exported goods begin to rise.
While marine transportation includes •ferries and related types of transporta-tion, by far the most important driver of growth in this industry is the cruise ship industry. This part of the marine trans-portation sector is also an important part of the T&R sector.
The United States dominates the world-•wide cruise ship industry (Figure 3.27). In 2006, three of every four cruise ship passengers embarked from a U.S. port. From 2002 to 2006 the number of global cruise passengers, U.S. residents taking a cruise, and embarkations from U.S. ports all grew by more than a third. During the same period the number of cruise ships in North America grew by 23%, while the number of berths grew by 26% indicat-ing increasing size of the ships (Business Research and Economic Advisors 2007).
Florida is the nation’s leader for the cruise ship industry •(Figure 3.28), with more than half of U.S. embarka-tions and 40% of world cruise ship traffic; California is second with 11% of embarkations (Business Research and Economic Advisors 2007).
3.5 Beyond the NOEP Ocean EconomyAll efforts to estimate the size and change in the ocean economy are limited by the type of data that are available. Data also are influenced by choices about what to include and exclude from the definition of the ocean economy, which are inevitably somewhat arbitrary. (Examples of each situation follow: the exclusion of casinos from the ocean economy even when located in shore-adjacent locations and the exclusion of refineries from the marine minerals sector because it is not possible to determine which refiner-ies process offshore oil). Moreover, there are strict rules in place to protect the confidentiality of business information to assure businesses that reporting information to the gov-ernment will not result in disclosure of competitively sensi-tive information. These rules prevent reporting of indus-tries with a small number of firms and very large firms in small areas, such as the ship building and repair industry in Mississippi and Connecticut. On top of these limita-tions are the inevitable restrictions of time and budget for any research project.
A broader definition of the ocean economy than that used by NOEP is possible. It would include areas not now included, and a number of industries where there is cur-rently insufficient data to separate the “ocean” from the “non-ocean” components of production. It could include:
Inland areas• Some components of the ocean economy are actually located well away from the coasts. Examples include seafood markets in Colorado or Nebraska,
38.7%
33.9%
38.5%
22.8%
26.4%
0%
5%
10%
15%
20%
25%
30%
35%
40%
45%
Number of GlobalPassengers
Passengers Residingin the U.S.
U.S. Embarkations Number of Ships Berths
Source: Cruise Lines International Association
Figure 3.27 Cruise ship industry growth 2002-2006
Florida54%
Texas7%
California11%
New York6%
Washington4%
Hawaii4%
All Other14%
Source: Cruise Lines International Association
Figure 3.28 Cruise ship embarkations by state, 2006

State of the U.S. Ocean and Coastal Economies 37
Chapter 3: The Ocean Economy
or boats and other recreational equipment inland but sold to recreationists for use at the coast. Much of the warehousing for the Port of Los Angeles/Long Beach is located more than 20 miles inland in various parts of Los Angeles County. Better methods for measuring the geographic spread of the ocean economy throughout the country would show both a larger amount of economic activity and the ties between the oceans, GOM, and Great Lakes and the rest of the nation.
Industries not included• A number of economic activi-ties associated with the ocean are not included in the NOEP ocean economy because it is not possible to develop consistent estimates across all states. Individual studies of specific states cover some of these areas, but consistent national estimates have been beyond the scope of what NOEP could collect. Industries which can, and should, be incorporated into future estimates include:
- Marine Research and Education.
- Ocean-related activities of state and local governments.
- Financial industries, such as marine insurance.
- Marine engineering and design.
- Energy production, such as power plants in shoreline locations, to take advantage of transportation and water cooling, (and new alternative offshore energy facilities).
- Highly specialized industries related to the ocean, which are too small to be easily measured in standard economic data, such as the Hawaiian tropical fish col-lection industry.
- Real estate. The development and building of proper-ties for seasonal housing in shoreline and near-shore areas has clearly been a major economic activity in coastal areas, but property records across the differ-ent state and local jurisdictions are highly variable in quality.
- Fisheries harvesting: Reporting of employment in the commercial fishing industry is sporadic at best when using standard employment data. NMFS and state fish-eries agencies are moving towards better measurement of employment in fish harvesting, which may allow this industry to be much better reflected in estimates of the ocean economy.
- Refineries are not included in the minerals sector because records do not distinguish between offshore and land-based sources of oil and gas.
3.6 ConclusionThe ocean economy, like its counterparts in agriculture, forestry, and mining, for example, has major importance to the U.S. economy and should be considered as an impor-tant slice of the economy to receive careful attention. To date, this has not been the case. As increasing numbers of nations realize the importance of the oceans to their econo-mies, many foreign governments are creating accounts to track the activities that depend on the oceans in order to better inform investment practices and policy initiatives. The United States needs to do this as well in order to better understand the role of the oceans in the national economy, to make informed judgments about the infrastructure needed to support these activities, and to understand what is at risk from ecological changes such as sea level rise. At the same time, the measurement of the activity of the ocean economy still provides only part of the economic picture of the oceans, for there are large and very important eco-nomic values that analysis of market activity does not fully capture. Those values are discussed in Chapter 4.
3.7 ReferencesAllen Consulting Group. 2003. The Economic Contribution of Australia’s Marine Industries. Canberra: The National Oceans Office.
Business Research and Economic Advisors. 2007. The Contribution of the North American Cruise Line Industry to the U.S. Economy. Fort Lauderdale, FL. Cruise Lines International Association.
Gislason, G.S. and Associates. 2007. A National Marine Report Card for Canada. Ottawa: Fisheries and Oceans Canada.
Kalaydijan, Régis et al. 2005. French Marine-Related Economic Data 2005. Issy Les Moulineaux, France: Institute Français de recherché pour l’exploitation de la mer.
Pugh, David and L. Skinner. 2002. A New Analysis of Marine Related Economic Activities in the UK Economy with Supporting Science and Technology. London: The Inter-agency Committee on Marine Science and Technology.
U. S. Bureau of Labor Statistics, Quarterly Census of Employ-ment and Wages (QCEW) Program. http://www.bls.gov/cew/.
U.S. Bureau of Economic Analysis. http://www.bea.gov/.
U.S. Census Bureau. Foreign Trade Statistics, Your Key to Trade. 1997-2007 Port Imports; 1997-2007 State Exports, State/Region, State of Origin. www.census.gov/foreign-trade/www/.

38 National Ocean Economics Program
Chapter 4: Non-market Values Complete the Economic Picture
One of the silver linings of economic crises is the oppor-tunity to reflect on what truly is most valuable in life. The thousands of miles of coastline in America, with their majestic beaches and diverse marine wildlife, are some of the nation’s most enduring treasures that have provided both wonder and tremendous economic value to genera-tions of Americans.
4.1 The Non-market Economy is Critical for Policy MakersWhen debating the merits of protecting unique terrestrial resources, the market value of development or resource extraction (i.e. for agriculture, timber, or minerals) is often weighed against the harder to quantify values linked to recreation, wildlife protection, tourism, aesthetics, and eco-system services that are not priced directly in the market; there is widespread recognition that exploiting natural habitats imposes real costs on society that must be taken into account in policy decisions.
With respect to marine resources, the policy process has been slower to adopt this same logic. At present, with America’s vast oceans and coastal resources (which include the Great Lakes) under significant pressure from a variety of competing interests, it is critical that policy-makers take into account the full range of values that the ocean economy provides.
As previous chapters have outlined, much of this informa-tion can be found by examining current market activities for ocean resources, such as fisheries or ocean tourism and recreation. But there are many economic values that are not directly observable in the market:
— The ecosystem and biodiversity benefits of a larger sea otter population off the coast of California
Loomis (2005) found that allowing the sea otter popula-tion to expand could provide over $20 million in non-market economic benefits to Californians, mainly due to the role sea otters play in maintaining healthy kelp forests and the benefits Californians would gain from an increased presence of sea otters.
— The value of abundant wildlife in the Florida Keys
Bhat (2003) found that conservation programs for the Florida Keys could provide returns to society of 50:1 when the recreational values of improved snorkeling and scuba diving were considered.
— The value of water quality for nearby communities
Braden et al. (2004) found that the water quality in the Great Lakes could account for up to 15% of the surround-ing property values, demonstrating the huge economic impact of clean-up efforts.
— The value of ocean views
Major and Luscht (2004) found that homes with unob-structed ocean and bay views could fetch premiums of between 70% and 200%.
The sum total of the non-market values for ocean and coastal resources in the United States is tremendous: at minimum tens of billions of dollars per year and likely much more; in Florida alone the non-market value of seven selected activities ranged from approximately $16.5 to $53 billion per year (NOEP 2006, Pendleton 2007).
Non-market values are simply too big to ignore; they may rival or even surpass the
market value of the nation’s ocean and coastal resources.
While non-market values are often hard to quantify, overlooking them will lead to inefficient and sub-optimal policy decisions. Because these values are so large and the resources so important, it is imperative that non-market values for ocean and coastal resources be taken into account in a variety of policy arenas in the coming years:
— Climate change policy
Scientists increasingly are discovering that climate change will radically impact the world’s oceans: bleaching coral reefs, increasing acidification, and destroying coastal com-munities through sea level rise and increased occurrence and severity of storm surge and hurricanes. Any overall assess-ment of the costs and benefits of climate change legislation must incorporate the many direct and indirect impacts on America’s coastal and ocean resources. In addition, a careful examination of the data may confirm that restoring the coastal mangroves and wetlands could be one of the best defenses against the looming impacts of global warming.
Chapter 4Non-market Values Complete the Economic Picture

State of the U.S. Ocean and Coastal Economies 39
Chapter 4: Non-market Values Complete the Economic Picture
— Fisheries policy
As the nation continues the process of establishing a system of national marine protected areas, it is imperative that policy-makers have a full accounting of the ocean’s values. The interests of commercial fisheries must be weighed against those of recreational fishing interests and other environmental goals that society deems valuable, such as preserving marine biodiversity.
— Agricultural policy
Many agricultural chemicals end up in the nation’s water-ways and eventually make their way to the coasts, often polluting the marine environment. In the United States, more than 70 coastal areas are affected (Diaz and Rosen-berg 2008); the most extreme example is the “Dead Zone” off the Gulf Coast caused by nitrogen runoff primarily from the Plains States. The benefits to agribusiness from their continued use of these inputs must be weighed against their impacts on marine life and habitats, even if they are hundreds or thousands of miles away.
4.2 U.S. Government ProgramsThe value of non-market assets, whether recreational or for environmental services, has been recognized by the federal government for more than a century. On land, the creation of national parks, preserves, and wildlife areas along the shore and inland was evidence that the public and their elected officials placed value on these assets and wanted to set them aside. Since the 1970s, the United States has set aside similar types of offshore areas. Economists have esti-mated the value of some of these areas, as they have for other non-market assets (Johns et.al 2001). Values can also be inferred by tracking government investments and assuming the public places have at least as much value as the resources that are being protected by those government funds.
Coastal and ocean resource values are recognized through the establishment of offshore and onshore protected areas and the Coral Reef Conservation Program. Familiar examples of U.S. protected areas include national marine sanctuaries, marine monuments, estuaries, coastal and underwater parks and wildlife refuges, and other conserva-tion areas. The National Marine Sanctuaries System, for example, includes thirteen marine sanctuaries and one national monument, totaling more than 158,000 square miles. The sanctuaries were established with the objec-tive of protecting the natural and cultural features of the ocean ecosystem while still allowing for people to enjoy the resource sustainably. The budget for the sanctuary program totaled $56 million in fiscal year 2007 and $62.5 million in 2008 (NOAA 2008).
4.3 Non-market Values for Environmental Goods and ServicesEconomists make a fundamental distinction between market and non-market goods and services.13 Some envi-ronmental goods and services, such as fish and seaweed, are traded in markets, so their values are reflected directly in their price. However, some goods and services are not bought or sold directly, and therefore, do not have a directly observable monetary value. Examples of this include beach visits, wildlife viewing, or snorkeling at a coral reef (NOAA Coastal Services Center 2009). These are referred to as “non-market” goods and service because their economic value is not reflected in market transactions.
Although the prices for these goods and services are not as obvious, their values are no less real than those attrib-uted to traditional market goods such as fish or boats. For example, people are willing to pay significant sums of money to conserve biodiversity (U.S. Forest Service 2005) or to live close to the oceans (Kildow 2007), even if precise monetary amounts for these goods and services are difficult to quantify.
It is possible to make reasonable and defensible estimates of these non-market values using various economic and statistical methods that have been developed over decades. Very often these non-market values are linked to recre-ational benefits of ocean and coastal environments, or the ecosystem and environmental services they supply. These values are created by direct use of the resources. Values also extend beyond any benefits that arise only from using a resource; some values are created by simply knowing that a species is healthy and protected.
Non-market values frequently represent consumer surplus, which is the difference between what consumers pay for a good and the maximum that they would be willing to pay for it. For example, visitors to California beaches do not pay admission, but most would certainly be willing to pay some amount of money for the opportunity to recreate on the beach if asked to do so. Currently, these beach users receive a consumer surplus equal to their maximum will-ingness to pay each time they visit the beach for free.
There are many instances where citizens receive recre-ational benefits from coastal and ocean resources at lower costs than they truly value them, resulting in consumer surplus. The total value of this surplus can be signifi-cant, especially in areas frequented by large numbers of people or for environmental resources that people put at a high premium.
13 Market-based ocean and coastal economies are discussed in other chapters.

40 National Ocean Economics Program
Chapter 4: Non-market Values Complete the Economic Picture
If citizens experience a diminishment in the quality of coastal and ocean resources, they will experience a loss in consumer surplus directly related to a diminishment in their quality of life; the magnitude of this loss can be esti-mated in dollars. Conversely, improvements in coastal and ocean resources will increase consumer surplus and lead to measurable economic value for the citizenry.
Unlike market values of the type discussed in Chapters 2 and 3, non-market values are not estimated by any standard methodology nor are they kept in any government data series. Rather, non-market values have been estimated in a wide variety of studies by different researchers on different resources. The result is a highly diverse array of estimates, which are derived by four primary methods. The methodol-ogy for each is explained in detail at http://OceanEconomics.org/nonmarket/methodologies.asp
Travel-Cost Method—estimating non-market values 1. based on people’s willingness to travel to enjoy them.
Hedonic Valuation—estimating the value of environ-2. mental resources that may be contained within market values such as real estate values.
Cost-Based Method—estimating the value of envi-3. ronmental services by comparing them to the costs of other ways of providing similar services.
Contingent Valuation Method4. 14—using surveys to ask people what they are willing to pay for improvements in environmental resources using hypothetical scenarios.
The ways in which these various methods are utilized to estimate the value of ocean and coastal resources are discussed in the following sections. A complete guide to the non-market valuation studies of ocean and coastal resources can be found in the NOEP Non-market Valua-tion Database and Value Estimates Tables at http://Ocean-Economics.org/nonmarket/valEstim.asp.
14 The federal courts and NOAA have explicitly stated that it is appropriate to use contingent valuation to estimate natural resource damages. For the full NOAA recommendations see Arrow et al. (1993). The most famous use of contingent valuation for this purpose was undertaken after the Exxon Valdez oil spill; the study estimated lost non-use values (referred to as “passive use” values in the study) of $2.8 billion, above and beyond the costs of containing the oil spill and paying compensation to its immediate victims. For a detailed description of the Exxon Valdez contingent valuation study see Carson et al. (2003). As a side note, in 2008, after almost 20 years, the case against Exxon made its way to the Supreme Court, where the Justices decided on the extent of Exxon’s liability to the Alaskan community. In addition, it is possible that contingent valuation will be used to help estimate society’s loss from the 2007 oil spill in the San Francisco Bay.
4.4 Non-market Recreational and Leisure ValuesTens of millions of U.S. citizens participate in outdoor coastal recreation every year (Pendleton et al. 2007). From going to the beach to fishing to snorkeling and wildlife viewing, many billions of dollars are spent each year on these various forms of leisure. This leaves no doubt that Americans highly value the coastal and marine environ-ments and are willing to pay significant sums of money to enjoy them including money above and beyond what they currently pay (the consumer surplus).
Since beaches are extremely popular recreational destina-tions for millions of Americans, they have been relatively well-studied by economists trying to estimate consumer surplus, at least in states like California and Florida. Lew and Larson (2005) estimated the average daily consumer surplus for visiting select California beaches at $11.13 per trip; Bin et al. (2005) estimated surplus of $11.98 to $84.49 per trip to North Carolina beaches; while Leewor-thy and Bowker (1997) found a very high surplus of $95.85 to $120.74 for visits to Florida beaches.15
Saltwater recreational fishing is another popular leisure activity undertaken in the coastal environment,16 and it too provides a significant amount of consumer surplus to the millions of Americans who partake in this sport annu-ally. It is important to remember that while the amount of money spent on fishing gear, tourism, and boating can be observed, it does not capture the total value of the fishing resources, because people are not charged for their maximum willingness to pay for fishing access, again resulting in consumer surplus.
Hamel et al. (2000) estimated average consumer surplus from $99.39 to $146.14 per fishing trip day in Alaska; and Kling and Herriges (1995) estimate average consumer surplus per fishing trip from 10.84 to $44.45 per person day in California.
Wildlife viewing (including bird watching, whale watch-ing, and sea otter viewing), surfing, snorkeling, and scuba
15 These values vary greatly primarily for two reasons: 1) non-mar-ket valuation techniques provide only rough estimates of hidden environmental values, and they are subject to imprecise measure-ment and 2) environmental resources vary widely by region, as do alternative forms of recreation and average incomes. Kolstad and Deacon (2000) critique the Leeworthy and Bell estimates, drawing into question their accuracy.
16 Fishing in the freshwater of the Great Lakes also is a very popular and highly valued activity. Additional data from the 2000 NSRE report indicates that freshwater recreation in coastal states is comparable to saltwater recreation in total participation days, including fishing; therefore it is likely that total participa-tion days for fishing in the Great Lakes is large as well.
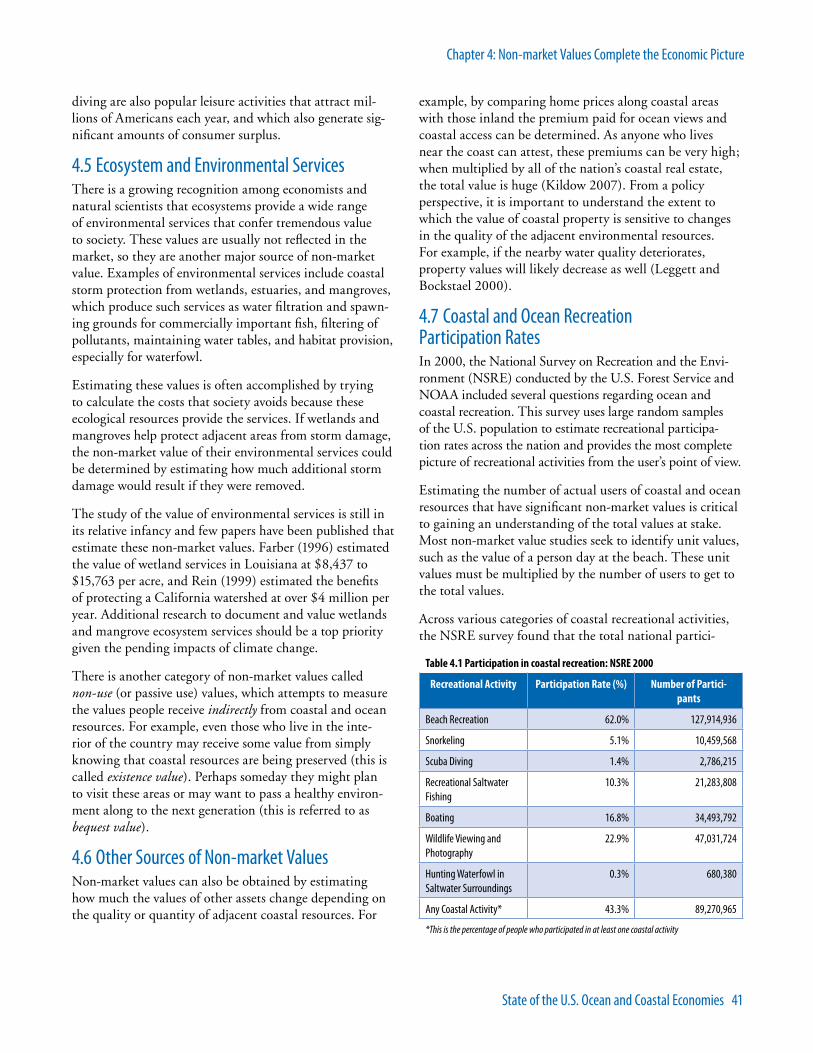
State of the U.S. Ocean and Coastal Economies 41
Chapter 4: Non-market Values Complete the Economic Picture
diving are also popular leisure activities that attract mil-lions of Americans each year, and which also generate sig-nificant amounts of consumer surplus.
4.5 Ecosystem and Environmental ServicesThere is a growing recognition among economists and natural scientists that ecosystems provide a wide range of environmental services that confer tremendous value to society. These values are usually not reflected in the market, so they are another major source of non-market value. Examples of environmental services include coastal storm protection from wetlands, estuaries, and mangroves, which produce such services as water filtration and spawn-ing grounds for commercially important fish, filtering of pollutants, maintaining water tables, and habitat provision, especially for waterfowl.
Estimating these values is often accomplished by trying to calculate the costs that society avoids because these ecological resources provide the services. If wetlands and mangroves help protect adjacent areas from storm damage, the non-market value of their environmental services could be determined by estimating how much additional storm damage would result if they were removed.
The study of the value of environmental services is still in its relative infancy and few papers have been published that estimate these non-market values. Farber (1996) estimated the value of wetland services in Louisiana at $8,437 to $15,763 per acre, and Rein (1999) estimated the benefits of protecting a California watershed at over $4 million per year. Additional research to document and value wetlands and mangrove ecosystem services should be a top priority given the pending impacts of climate change.
There is another category of non-market values called non-use (or passive use) values, which attempts to measure the values people receive indirectly from coastal and ocean resources. For example, even those who live in the inte-rior of the country may receive some value from simply knowing that coastal resources are being preserved (this is called existence value). Perhaps someday they might plan to visit these areas or may want to pass a healthy environ-ment along to the next generation (this is referred to as bequest value).
4.6 Other Sources of Non-market ValuesNon-market values can also be obtained by estimating how much the values of other assets change depending on the quality or quantity of adjacent coastal resources. For
example, by comparing home prices along coastal areas with those inland the premium paid for ocean views and coastal access can be determined. As anyone who lives near the coast can attest, these premiums can be very high; when multiplied by all of the nation’s coastal real estate, the total value is huge (Kildow 2007). From a policy perspective, it is important to understand the extent to which the value of coastal property is sensitive to changes in the quality of the adjacent environmental resources. For example, if the nearby water quality deteriorates, property values will likely decrease as well (Leggett and Bockstael 2000).
4.7 Coastal and Ocean Recreation Participation RatesIn 2000, the National Survey on Recreation and the Envi-ronment (NSRE) conducted by the U.S. Forest Service and NOAA included several questions regarding ocean and coastal recreation. This survey uses large random samples of the U.S. population to estimate recreational participa-tion rates across the nation and provides the most complete picture of recreational activities from the user’s point of view.
Estimating the number of actual users of coastal and ocean resources that have significant non-market values is critical to gaining an understanding of the total values at stake. Most non-market value studies seek to identify unit values, such as the value of a person day at the beach. These unit values must be multiplied by the number of users to get to the total values.
Across various categories of coastal recreational activities, the NSRE survey found that the total national partici-
Table 4.1 Participation in coastal recreation: NSRE 2000
Recreational Activity Participation Rate (%) Number of Partici-pants
Beach Recreation 62.0% 127,914,936
Snorkeling 5.1% 10,459,568
Scuba Diving 1.4% 2,786,215
Recreational Saltwater Fishing
10.3% 21,283,808
Boating 16.8% 34,493,792
Wildlife Viewing and Photography
22.9% 47,031,724
Hunting Waterfowl in Saltwater Surroundings
0.3% 680,380
Any Coastal Activity* 43.3% 89,270,965
*This is the percentage of people who participated in at least one coastal activity
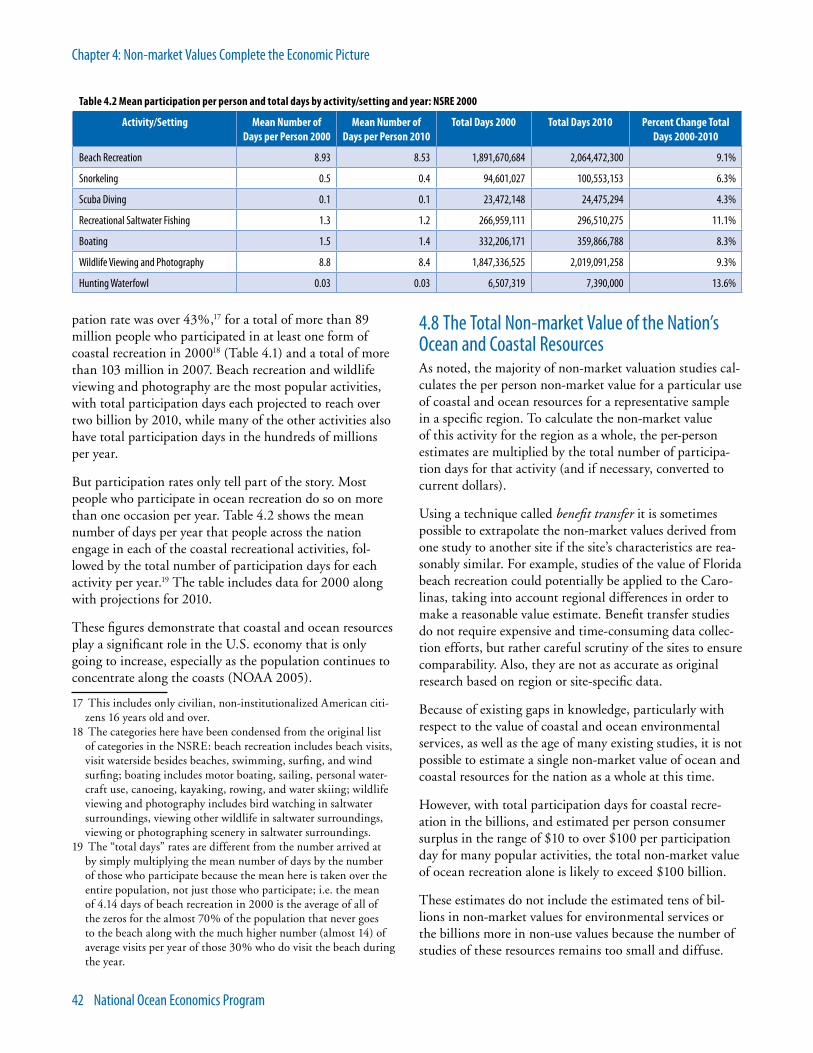
42 National Ocean Economics Program
Chapter 4: Non-market Values Complete the Economic Picture
pation rate was over 43%,17 for a total of more than 89 million people who participated in at least one form of coastal recreation in 200018 (Table 4.1) and a total of more than 103 million in 2007. Beach recreation and wildlife viewing and photography are the most popular activities, with total participation days each projected to reach over two billion by 2010, while many of the other activities also have total participation days in the hundreds of millions per year.
But participation rates only tell part of the story. Most people who participate in ocean recreation do so on more than one occasion per year. Table 4.2 shows the mean number of days per year that people across the nation engage in each of the coastal recreational activities, fol-lowed by the total number of participation days for each activity per year.19 The table includes data for 2000 along with projections for 2010.
These figures demonstrate that coastal and ocean resources play a significant role in the U.S. economy that is only going to increase, especially as the population continues to concentrate along the coasts (NOAA 2005).
17 This includes only civilian, non-institutionalized American citi-zens 16 years old and over.
18 The categories here have been condensed from the original list of categories in the NSRE: beach recreation includes beach visits, visit waterside besides beaches, swimming, surfing, and wind surfing; boating includes motor boating, sailing, personal water-craft use, canoeing, kayaking, rowing, and water skiing; wildlife viewing and photography includes bird watching in saltwater surroundings, viewing other wildlife in saltwater surroundings, viewing or photographing scenery in saltwater surroundings.
19 The “total days” rates are different from the number arrived at by simply multiplying the mean number of days by the number of those who participate because the mean here is taken over the entire population, not just those who participate; i.e. the mean of 4.14 days of beach recreation in 2000 is the average of all of the zeros for the almost 70% of the population that never goes to the beach along with the much higher number (almost 14) of average visits per year of those 30% who do visit the beach during the year.
4.8 The Total Non-market Value of the Nation’s Ocean and Coastal ResourcesAs noted, the majority of non-market valuation studies cal-culates the per person non-market value for a particular use of coastal and ocean resources for a representative sample in a specific region. To calculate the non-market value of this activity for the region as a whole, the per-person estimates are multiplied by the total number of participa-tion days for that activity (and if necessary, converted to current dollars).
Using a technique called benefit transfer it is sometimes possible to extrapolate the non-market values derived from one study to another site if the site’s characteristics are rea-sonably similar. For example, studies of the value of Florida beach recreation could potentially be applied to the Caro-linas, taking into account regional differences in order to make a reasonable value estimate. Benefit transfer studies do not require expensive and time-consuming data collec-tion efforts, but rather careful scrutiny of the sites to ensure comparability. Also, they are not as accurate as original research based on region or site-specific data.
Because of existing gaps in knowledge, particularly with respect to the value of coastal and ocean environmental services, as well as the age of many existing studies, it is not possible to estimate a single non-market value of ocean and coastal resources for the nation as a whole at this time.
However, with total participation days for coastal recre-ation in the billions, and estimated per person consumer surplus in the range of $10 to over $100 per participation day for many popular activities, the total non-market value of ocean recreation alone is likely to exceed $100 billion.
These estimates do not include the estimated tens of bil-lions in non-market values for environmental services or the billions more in non-use values because the number of studies of these resources remains too small and diffuse.
Table 4.2 Mean participation per person and total days by activity/setting and year: NSRE 2000
Activity/Setting Mean Number of Days per Person 2000
Mean Number of Days per Person 2010
Total Days 2000 Total Days 2010 Percent Change Total Days 2000-2010
Beach Recreation 8.93 8.53 1,891,670,684 2,064,472,300 9.1%
Snorkeling 0.5 0.4 94,601,027 100,553,153 6.3%
Scuba Diving 0.1 0.1 23,472,148 24,475,294 4.3%
Recreational Saltwater Fishing 1.3 1.2 266,959,111 296,510,275 11.1%
Boating 1.5 1.4 332,206,171 359,866,788 8.3%
Wildlife Viewing and Photography 8.8 8.4 1,847,336,525 2,019,091,258 9.3%
Hunting Waterfowl 0.03 0.03 6,507,319 7,390,000 13.6%
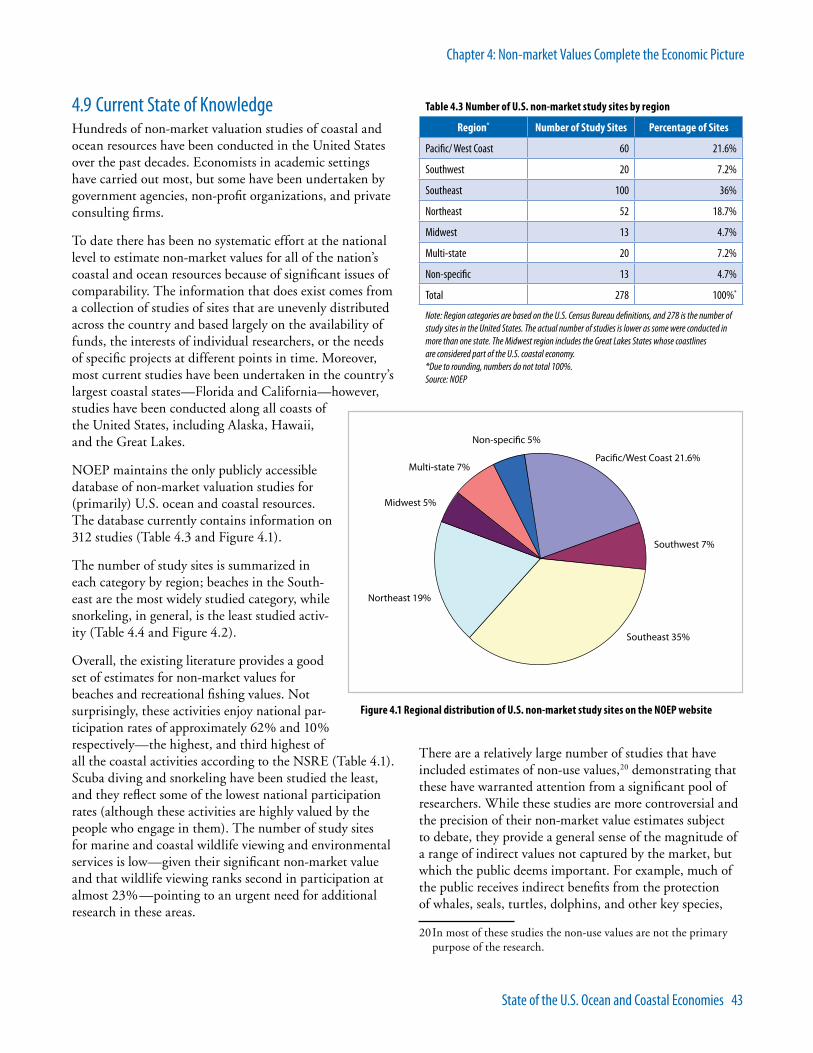
State of the U.S. Ocean and Coastal Economies 43
Chapter 4: Non-market Values Complete the Economic Picture
4.9 Current State of KnowledgeHundreds of non-market valuation studies of coastal and ocean resources have been conducted in the United States over the past decades. Economists in academic settings have carried out most, but some have been undertaken by government agencies, non-profit organizations, and private consulting firms.
To date there has been no systematic effort at the national level to estimate non-market values for all of the nation’s coastal and ocean resources because of significant issues of comparability. The information that does exist comes from a collection of studies of sites that are unevenly distributed across the country and based largely on the availability of funds, the interests of individual researchers, or the needs of specific projects at different points in time. Moreover, most current studies have been undertaken in the country’s largest coastal states—Florida and California—however, studies have been conducted along all coasts of the United States, including Alaska, Hawaii, and the Great Lakes.
NOEP maintains the only publicly accessible database of non-market valuation studies for (primarily) U.S. ocean and coastal resources. The database currently contains information on 312 studies (Table 4.3 and Figure 4.1).
The number of study sites is summarized in each category by region; beaches in the South-east are the most widely studied category, while snorkeling, in general, is the least studied activ-ity (Table 4.4 and Figure 4.2).
Overall, the existing literature provides a good set of estimates for non-market values for beaches and recreational fishing values. Not surprisingly, these activities enjoy national par-ticipation rates of approximately 62% and 10% respectively—the highest, and third highest of all the coastal activities according to the NSRE (Table 4.1). Scuba diving and snorkeling have been studied the least, and they reflect some of the lowest national participation rates (although these activities are highly valued by the people who engage in them). The number of study sites for marine and coastal wildlife viewing and environmental services is low—given their significant non-market value and that wildlife viewing ranks second in participation at almost 23%—pointing to an urgent need for additional research in these areas.
There are a relatively large number of studies that have included estimates of non-use values,20 demonstrating that these have warranted attention from a significant pool of researchers. While these studies are more controversial and the precision of their non-market value estimates subject to debate, they provide a general sense of the magnitude of a range of indirect values not captured by the market, but which the public deems important. For example, much of the public receives indirect benefits from the protection of whales, seals, turtles, dolphins, and other key species,
20 In most of these studies the non-use values are not the primary purpose of the research.
Figure 4.1 Regional distribution of U.S. non-market study sites on the NOEP website
Northeast 19%
Southeast 35%
Non-specific 5%
Multi-state 7%
Midwest 5%
Southwest 7%
Pacific/West Coast 21.6%
Table 4.3 Number of U.S. non-market study sites by region
Region* Number of Study Sites Percentage of Sites
Pacific/ West Coast 60 21.6%
Southwest 20 7.2%
Southeast 100 36%
Northeast 52 18.7%
Midwest 13 4.7%
Multi-state 20 7.2%
Non-specific 13 4.7%
Total 278 100%*
Note: Region categories are based on the U.S. Census Bureau definitions, and 278 is the number of study sites in the United States. The actual number of studies is lower as some were conducted in more than one state. The Midwest region includes the Great Lakes States whose coastlinesare considered part of the U.S. coastal economy.*Due to rounding, numbers do not total 100%.Source: NOEP
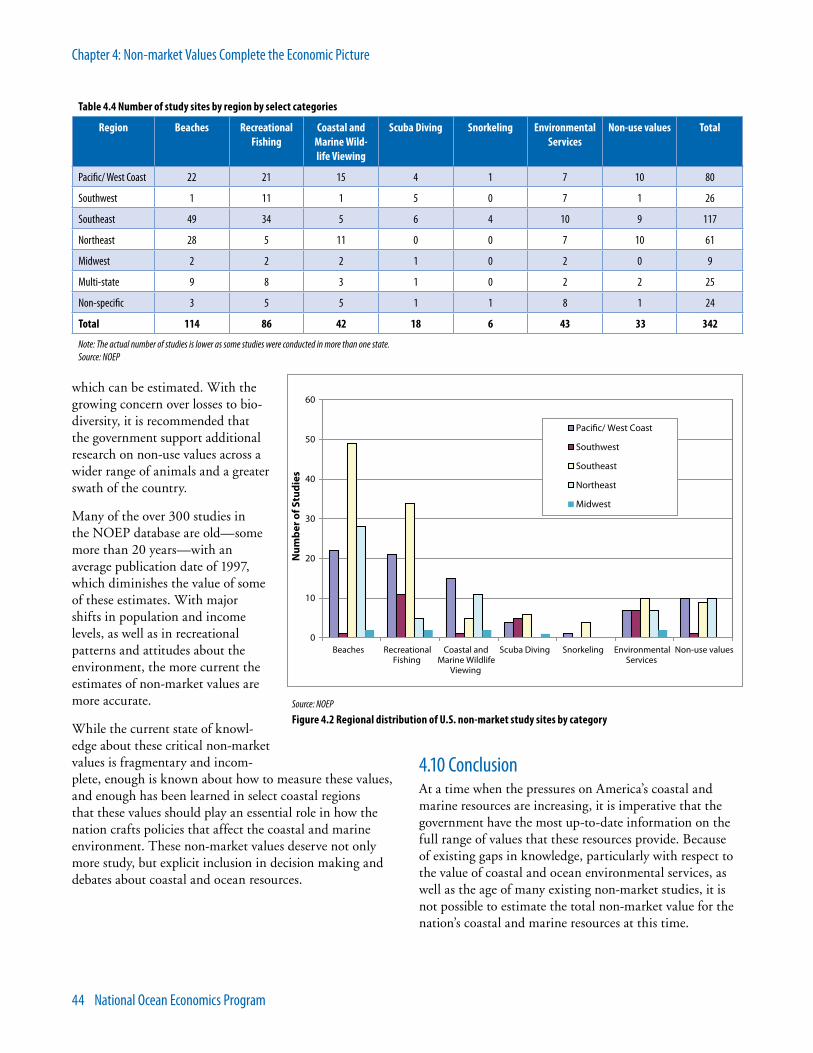
44 National Ocean Economics Program
Chapter 4: Non-market Values Complete the Economic Picture
which can be estimated. With the growing concern over losses to bio-diversity, it is recommended that the government support additional research on non-use values across a wider range of animals and a greater swath of the country.
Many of the over 300 studies in the NOEP database are old—some more than 20 years—with an average publication date of 1997, which diminishes the value of some of these estimates. With major shifts in population and income levels, as well as in recreational patterns and attitudes about the environment, the more current the estimates of non-market values are more accurate.
While the current state of knowl-edge about these critical non-market values is fragmentary and incom-plete, enough is known about how to measure these values, and enough has been learned in select coastal regions that these values should play an essential role in how the nation crafts policies that affect the coastal and marine environment. These non-market values deserve not only more study, but explicit inclusion in decision making and debates about coastal and ocean resources.
4.10 ConclusionAt a time when the pressures on America’s coastal and marine resources are increasing, it is imperative that the government have the most up-to-date information on the full range of values that these resources provide. Because of existing gaps in knowledge, particularly with respect to the value of coastal and ocean environmental services, as well as the age of many existing non-market studies, it is not possible to estimate the total non-market value for the nation’s coastal and marine resources at this time.
Table 4.4 Number of study sites by region by select categories
Region Beaches Recreational Fishing
Coastal and Marine Wild-life Viewing
Scuba Diving Snorkeling Environmental Services
Non-use values Total
Pacific/ West Coast 22 21 15 4 1 7 10 80
Southwest 1 11 1 5 0 7 1 26
Southeast 49 34 5 6 4 10 9 117
Northeast 28 5 11 0 0 7 10 61
Midwest 2 2 2 1 0 2 0 9
Multi-state 9 8 3 1 0 2 2 25
Non-specific 3 5 5 1 1 8 1 24
Total 114 86 42 18 6 43 33 342
Note: The actual number of studies is lower as some studies were conducted in more than one state.Source: NOEP
Source: NOEP
Figure 4.2 Regional distribution of U.S. non-market study sites by category
0
10
20
30
40
50
60
Beaches RecreationalFishing
Coastal andMarine Wildlife
Viewing
Scuba Diving Snorkeling EnvironmentalServices
Non-use values
Nu
mb
er o
f Stu
die
s
Pacific/ West Coast
Southwest
Southeast
Northeast
Midwest

State of the U.S. Ocean and Coastal Economies 45
Chapter 4: Non-market Values Complete the Economic Picture
To understand more fully the value of these resources, it is recommended that the government undertake a compre-hensive assessment of the non-market values of the coastal and ocean economy every ten years, starting in 2010. A team of researchers from around the country should be assembled in the current year to assess the current knowledge and gaps, and plot a course for a thorough accounting of coastal non-market values. Attention should be paid especially to estimating the value of marine envi-ronmental services and the value of coastal and marine wildlife viewing.
Equipped with this knowledge, policy-makers will have up-to-date data and scientific evidence to make much more informed decisions about the fate of the nation’s coastal resources, and better balance the demands of extractive industries, agriculture, industrial emitters, and the tens of millions of citizens who recreate at the coasts every year.
Even with the currently available data, it is possible to get a snapshot of the tremendous non-market economic value that the nation’s ocean and coastal resources provide, con-ferring consumer surplus of at minimum tens of billions of dollars a year and likely over $100 billion; these values will only grow as the nation’s population grows and continues to concentrate along the coasts in the coming decades.
4.11 ReferencesArrow, K., Solow, R., Portney, P. R., Leamer, E. E., Radner, R. and H. Schuman. 1993. Report of the NOAA Panel on Contingent Valuation, NOAA Working Paper.
Bell, F.W. 1997. The Economic Valuation of Saltwater Marsh Supporting Marine Recreational Fishing in the Southeastern United States, Ecological Economics, 21(3):243-254.
Bhat, M.G. 2003. Application of non-market valuation to the Florida Keys marine reserve management. Journal of Environmental Management, 67:315-325.
Bin, O., Landry, C. E. and H. Vogelsong. 2005. Some consumer surplus estimates for North Carolina beaches. Working Paper, Department of Economics, East Carolina University.
Braden, J, Patunru, A.A., Chattopadhyay, S. and N. Mays. 2004. Contaminant Cleanup in the Waukegan Harbor Area of Concern: Homeowner Attitudes and Economic Benefits. Journal of Great Lakes Resources, 30(4): 474-491.
Carson. R.T., Mitchell, R.C., Hanemann, M., Kopp, R.J., Presser, S. and P.A. Rudd. 2003. Contingent Valuation and Lost Passive Use: Damages from the Exxon Valdez Oil Spill. Environmental and Resource Economics, 25:257-286.
Deacon, R.T. and C.D. Kolstad. 2000. Valuing Beach Recreation Lost in Environmental Accidents. Journal of Water Resources Planning and Management, 126(6):374-381.
Diaz, R.J., and R. Rosenberg. 2008. Spreading Dead Zones and Consequences for Marine Ecosystems. Science, 321(5891):926-929.
Farber, S. 1996. Welfare Loss of Wetlands Disintegration: A Louisiana Study. Contemporary Economic Policy, 14:92-106.
Hamel, C., Herrmann, M., Lee, T.S. and K.R. Criddle. 2000. An Economic Discussion of the Marine Sport Fisheries in Lower Cook Inlet. Presented at the tenth meeting of the International Institute of Fisheries Economics and Trade, Corvallis, Oregon. 10-24 July 2000.
Johns, G.M.., V. R. Leeworthy, F. W. Bell, and M A. Bonn. 2003. Socioeconomic Study of Reefs in Southeast Florida. Final Report, October 19, 2001 as revised April 18, 2003. 2003. Silver Spring, MD: Special Projects, NOS, 255 pp.
Kling, C.L., and J.A. Herriges. 1995. An Empirical Investigation of the Consistency of NestedLogit Models with Utility Maximization. American Journal of Agricultural Economics. 77(4):875-884.
Kildow, J. 2007. The Influence of Coastal Preservation and Restoration on Coastal Real Estate Values in The Economic and Market Value of Coasts and Estuaries: What’s At Stake, Restore America’s Estuaries. L. Pendleton, editor.
Leeworthy, V.R. and J.M., Bowker. 1997. Non-market economic user values of the Florida Keys/Key West. Linking the Economy and the Environment of Florida Keys/Florida Bay. NOAA, SEA Division, National Ocean Service, 41.
Leggett, C. and N. Bockstael. 2000. Evidence of Effects of Water Quality on Residential Land Prices. Journal of Environmental Economics and Management, 39(2): 131-144.
Leeworthy, V.R. and P.C. Wiley. 2001. National Survey on Recreation and the Environment (NSRE) 2000. Prepared for the U.S. Department of Commerce and the National Oceanic and Atmospheric Administration.
Loomis, J. 2005. Economic Benefits of Expanding California’s Southern Sea Otter Population. Prepared for Defenders of Wildlife.
Major, C. and K. M. Lusht. 2004. Beach Proximity and the Distribution of Property Values in Shore Communities. The Appraisal Journal, Fall: 4433-4438.
National Aeronautics and Space Administration (NASA). 2009. Creeping Dead Zones. http://disc.gsfc.nasa.gov/oceancolor/scifocus/oceanColor/dead_zones.shtml.

46 National Ocean Economics Program
Chapter 4: Non-market Values Complete the Economic Picture
National Marine Protected Areas Center. 2006. A Functional Classification System for Marine Protected Areas in the United States. http://mpa.gov/pdf/helpful-resources/factsheets/final_class_system_1206.pdf.
National Oceanic and Atmospheric Administration (NOAA). 2008. National Marine Sanctuary Program Protects Certain Resources, But Further Actions Could Increase Protection. http://www.oig.doc.gov/oig/reports/2008/IPE-18591.pdf.
National Oceanic and Atmospheric Administration (NOAA). 2005. Population Trends Along the Coastal United States: 1960-2008 http://oceanservice.noaa.gov/programs/mb/supp_cstl_population.html
National Oceanic and Atmospheric Administration (NOAA). 2009. Coastal Services Center: What is Non-market Valuation? http://www.csc.noaa.gov/mpass/tools_nonmarket.html.
National Ocean Economics Program (NOEP). 2006. “Florida’s Ocean and Coastal Economies Report.” http://OceanEconomics.org/Download/.
Park, T., Bowker, J.M. and V. R. Leeworthy. 2002. Valuing snorkeling visits to the Florida Keys with stated and revealed preference models. Journal of Environmental Management, 65:301-312.
Pendleton, L., P. Atiyah, and A. Moorthy. 2007. Is the non-market Literature Adequate to Support Coastal and Marine Management? Ocean and Coastal Management, 50(5):363-378.
Pendleton, L. 2007. The Economic Value of Coastal and Estuary Recreation in The Economics of Estuary and Coastal Restoration: What’s at Stake, Restore America’s Estuaries. L. Pendleton, editor.
Rein, F.A. 1999. An Economic Analysis of Vegetative Buffer Strip Implementation- Cast Study: Elkhorn Slough, Monterey Bay, California. Coastal Management, 27(4):377-390.
U.S. Department of Commerce. 2008. National Marine Sanctuary Program Protects Certain Resources, But Further Actions Could Increase Protection. Final Inspection Report, No. IPE-18591/February 2008. http://www.oig.doc.gov/oig/reports/2008/IPE-18591.pdf.
U.S. Forest Service. 2005. What’s It Worth to You? Estimating the Public’s Willingness to Pay for Biodiversity Conservation. Science Findings, 70:1-4.
State of the U.S. Ocean and Coastal Economies 47
Chapter 5: The Future of the Ocean and Coastal Economies
This assessment of the ocean and coastal economies of the United States shows the large economic values, whether measured as contributions to the U.S. GDP as jobs, or as the value of a day at the beach for millions of beach goers, that are at stake in all decisions about the nation’s oceans and coasts. The changes over the past decades have, for the most part, only increased the economic contributions of the oceans and coasts. But this assessment is also under-taken at a time when major changes are underway affecting the ocean and coastal economy, and even more profound changes loom around the corner.
Over the next several years, the ocean and coastal econo-mies will shrink as a result of the economic recession. In many places there will be a sense that intense pressures on the lands and waters of coastal regions have abated, and hence, there is less need to address critical resource management and conservation questions. This would be a serious mistake, for the economy will recover from the current downturn and historic pressures will resume. Moreover, new pressures arising from energy issues, changes in the way in which coastal regions’ landscapes are used, and global forces such as climate change will both increase historic pressures and create new ones. To begin to understand these changes, first consider what is likely to happen in the ocean and coastal economies over the next five years, and then look beyond the current economic crisis to the long-term forces that will shape the ocean and coastal economies over the next several decades.
The implication of these short- and long-term changes is that a focus on issues of marine resource management and conservation is becoming more, not less, imperative. Better understanding the tightly coupled socio-ecological systems of marine coastal areas must lead to better decisions about what will take place and where, what areas to develop, and what areas to conserve.
5.1 Recession, Recovery, and the Ocean EconomyNone of the ocean economy sectors has shown itself to be immune from recessions based on the experience in the 1990-91 and 2001 recessions. While data are not yet avail-able to track the effects of the recession in detail, trends already apparent indicate the following likely effects on the ocean economy sectors.
Marine Construction Activity related to publicly funded projects such as dredging will likely continue, and there is funding in the American Recovery and Reinvestment Act (ARRA) for estuary restoration projects, which could produce projects that would be undertaken by the marine construction industry. It is possible that some of the “shovel ready” projects that will be funded by the ARRA and undertaken by state and local governments would generate activity in the marine construction industry, for example some beach nourishment projects, but this will probably not be known for some time. It is notable that ARRA does contain significant funds for estuary restoration, and activities in this area may to be a source of stimulus activ-ity in many coastal states. Overall, this sector is likely to be severely affected by the recession as private investment, particularly related to real estate development dries up. This sector also will likely see some drop in activity related to oil and gas exploration and production (see below).
Living Resources Though facing long-term challenges, this sector has not been as severely affected by past reces-sions as other ocean economy sectors. However, the sharp fall in consumer spending, which began towards the end of 2008, may have more severe effects on America’s fisheries than in the past. Even before the most severe drops in con-sumption were occurring at the end of the year, the Maine lobster industry (one of the highest valued shell fish indus-tries) saw a calamitous fall in prices as the traditional peak harvest in early fall collided with a sharp drop in demand for what was perceived as a “luxury” food. The result was sharply falling prices, which have driven some harvesters out of the business despite the return of some stability in the market.
The experience of the Maine lobster industry indicates the difficulties that potentially lie ahead for the seafood business. For species that are sold fresh and sold as “high quality” product, particularly in restaurants, the drop in consumer spending will probably result in a fall off in demand and lower prices for processors and distributors. The extent to which these “downstream” prices affect the prices paid to harvesters is unclear, but falling downstream prices make their way upstream faster than rising prices. On the other hand, fish sold at outlets such as McDonald’s may see an increase in demand and prices as consumers shift their consumption patterns down market. McDon-ald’s is one of the few businesses to see its sales growing during the recession (Canfield 2009).
Chapter 5The Future of the Ocean and Coastal Economies

48 National Ocean Economics Program
Chapter 5: The Future of the Ocean and Coastal Economies
The net effect of these trends on the overall national living resources sector may be to keep the sector as a whole only modestly affected by the recession, with some areas such as the North Pacific fishery continuing to do reasonably well (this fishery supplies most of the fast food products). Other more specialized and fresh fish markets may see a drop in demand at least through 2009.
Minerals The two industries comprising the ocean miner-als sector, limestone, sand & gravel, and oil & gas explora-tion and production will likely take somewhat different paths in the recession. The limestone, sand & gravel indus-try is primarily an input to the construction sector, which overall is one of the most negatively affected by economic cycles. On the other hand, the ARRA clearly envisions that spending on construction of public infrastructure and related facilities will be a major factor in reducing the severity of the recession and enabling the recovery to begin as soon as possible. For that reason, it is likely that lime-stone, sand & gravel will experience a significant downturn in output in the period from 2008 to 2009, but that this industry will stabilize and even show some growth in 2010 as the effects of the ARRA fully commence.
Economic activity in oil & gas exploration and production is tied more closely to the price of crude oil. After rising to record heights in early 2008, which encouraged plans for a significant expansion of activity, the equally steep fall in oil prices in the fall of 2008 essentially put the brakes on all major plans for expansion of exploratory activity. A national debate about expanding exploration for oil and gas offshore resulted in some changes in federal policies, which had been highly restrictive concerning oil and gas operations in federal waters outside the western and central GOM. However, the overall world market for oil and world prices offered little in the way of immediate incen-tives to expand activity soon.
It is likely that oil prices will stabilize as worldwide produc-tion is cut, and then begin to rise with hopes for recovery in 2010 and 2011. An extended period of low oil prices and consequent reduction in exploration and production could result in a shortage of oil when demand picks up again, potentially resulting in another price spike several years ahead. Those higher prices would coincide with plans to significantly expand offshore leasing. The Department of Interior has issued a new draft five-year leasing program, which is required by the Outer Continental Shelf Lands Act Amendments of 1978. The draft plan calls for lease sales in the federal waters of the Atlantic basins (North,
Mid, and South) and offshore southern California. Thus it is likely that rising oil prices will coincide with federal poli-cies to expand offshore oil & gas activity in the GOM, the Atlantic, the Pacific, and offshore Alaska in locations such as the Beaufort and Chukchi seas. However, offshore oil & gas exploration and production remain highly controver-sial in many parts of the country. How the combination of world oil prices, federal policy, and local politics will combine to affect the pace of exploration and production in the future is unknown.
Ship & Boat Building The two different industries that make up this sector will continue to be affected by very different forces. The boat building industry, which is dom-inated by the recreational boating market, will clearly be negatively affected. As early as the latter part of 2007 there were signs of stagnation in the recreational boating indus-try. The collapse in the stock market and of housing values, the severe tightening of credits by banks and other finan-cial institutions, and the collapse in consumer confidence will all combine to make for several difficult years for boat building, at both the lower and higher ends of the market.
The boat building industry lost over 8% of employment (about 5,000 jobs) over a six-month period between the end of 2007 and the middle of 2008 (BLS). Job losses will likely have accelerated in late 2008 and into 2009. Recov-ery of boat building is unlikely until consumer confidence and the credit markets are both restored to more normal conditions. Even then, growth will most likely be slow compared with recent experience.
The ship building industry primarily serves the Navy, so there are unlikely to be any major short-term downturns in activity. Contracts for construction are normally let several years in advance, and it is probable that most of the major yards have work to carry them through 2009 and 2010 at approximately current levels.
However, the outlook beyond the next two years is con-siderably cloudier. Severe strains on the Department of Defense budget are already forcing reconsideration of a variety of procurement programs, and naval ships are among the most expensive procurement items. Already the Navy has effectively cancelled the DD (X) advanced destroyer program, which would have been built in Pas-cagoula, Mississippi and Bath, Maine. It will continue to purchase versions of the DD (G) destroyers, which have been built since 1985, but at a slower pace. Long-range plans for submarine and aircraft carrier procurement are
State of the U.S. Ocean and Coastal Economies 49
Chapter 5: The Future of the Ocean and Coastal Economies
likely to be affected by reconsideration of overall Defense Department needs and budgets. The wear-and-tear on equipment resulting from the Iraq and Afghanistan wars will likely result in a procurement shift towards land-based forces and away from naval forces for the next several years.
Marine Transportation The collapse in consumption growth in the United States and in other countries is one of the defining characteristics of the current recession to an extent that was not the case in more recent recessions. A major effect of this collapse is to severely depress global trade in goods. Japan’s exports, including exports of elec-tronics and cars, have fallen by half (Clenfield 2009), and exports from China and the rest of Asia have also fallen sharply. Exports from the United States to the rest of the world have also fallen. The result of this has been signifi-cant drops in marine freight transportation activity.
The Port of Los Angeles, the largest of America’s ports, has seen declines of nearly a third in inbound containers and a quarter in outbound containers through the first two months of 2009 compared with the same period in 2008 (Port of Los Angeles 2009). The Port of Seattle is facing a similar drop in traffic. Things may not be quite as serious in the Atlantic ports. The Port of Virginia saw container traffic in January 2009 drop only 19% compared with January 2008 (Port of Virginia 2009). The recession will thus significantly accelerate the decline in employment in marine freight transportation, although it can be expected that a part of the employment will return when consump-tion and trade start growing as inventories are depleted and must be replenished.
The effects on the cruise ship industry, which has driven growth in the marine passenger transportation industry, are unlikely to be as severe as on marine freight transporta-tion, but there is likely to be some downward pressure on cruise traffic. Aggressive price-cutting by the cruise compa-nies will offset some of the drop in demand that will result from over drops in consumption, at least through 2009. Unemployment will continue to rise through 2009 and into 2010 and put further pressure on the industry in 2010. However, economic recovery should return cruise pas-senger volumes to 2008 levels by 2012. Whether the rapid growth that was observed in this decade will continue once passenger traffic returns to pre-recession levels is uncertain.
Tourism & Recreation Travel overall tends to fall in recessions, and this will mean some drop in ocean T&R. However, the effects probably will not be as severe as in other ocean industries. Ocean T&R tends to be made up of several different markets: day trippers, overnight visitors from within a day’s drive, those who visit friends and relatives, those who own seasonal properties, and long-distance travelers.
Only the last of these is likely to be severely affected by the recession since this group tends to have the highest travel costs. Other categories of ocean tourists and recreationists may stay relatively stable or even increase somewhat if trav-elers choose to substitute nearby opportunities for distant travel. One factor that will encourage some continuation of ocean T&R is low oil prices, which should hold for at least a year. It is also likely that some travelers will choose shorter vacations. As with the cruise ship industry, rising unemployment through 2009 and into 2010 will continue to put pressure on T&R.
The discussion above about issues facing the recreational boating industry will also apply to two industries in the T&R sector: boat dealers and marinas. The decline in boat building will manifest itself in direct proportion to the retail boat dealer industry. Marinas will see some reduc-tion in sales and probably vacant berths, but will not be as severely affected as boat dealers.
At the same time one economic aspect of the coasts, the non-market value that individuals’ gain from access to the scenic and recreational assets of America’s coasts, are likely to increase. The value of a day at the beach will rise as more people seek to enjoy high amenity values that are close to home and available at little cost. People do not seek recreation in recessions; they do seek lower costs of ways of accessing recreational opportunities. The coasts close to home will take on added value for the more than 108 million people who live in shore-adjacent counties, or the four Americans in five who live in coastal states, or the additional 40 million people in the non-shore-adjacent parts of coastal watershed counties.

50 National Ocean Economics Program
Chapter 5: The Future of the Ocean and Coastal Economies
5.2 Recession, Recovery, and the Coastal EconomyWhile the national recession is hitting all states, coastal states are among the hardest hit. In January 2009, the states with the highest unemployment rates were Califor-nia, Michigan, and South Carolina (Figure 5.1). Fourteen other coastal states had unemployment rates between 7% and 10%. Only Louisiana and New Hampshire, among coastal states, had unemployment rates significantly below the national level of 7.6%.
Within the coastal states, the recession’s effects can best be seen in the property markets, which were the leading factor in causing the recession. A map of the change in 90-day or more mortgage delinquencies between 2007 and 2008 shows several key features of the coastal economy (Figure 5.2).
Four areas of the country stand out with high growth rates in mortgage delin-quencies: the southeast, the Midwest, the southwest, and the lower Mississippi valley. California and Florida have the highest proportion of their states with high growth rates in delinquencies. In both states a majority of shore-adjacent counties show high rates. In California this is true from Mendocino County south; in Florida it is true of shore-adja-cent counties throughout the Atlantic and Gulf coasts. In both states, counties one or two tiers inland from the shore-adjacent counties also show very high growth rates in delinquencies. Almost all Florida counties except for Glades County are in the highest category of increasing delinquencies.
The same pattern of a high delinquency growth rate in counties near, but not at, the shore also is apparent in North and South Carolina. This pattern reflects the trend noted in the discussion of the coastal economy of increasing movement of population into the upland counties near the coast. It is now clear that in many states this population movement was substantially abetted by the low
interest rates and low credit standards that characterized the real estate boom of this decade. These conditions in monetary policy and in the evolution of the financial system underlay the real estate marketing maxim that in looking for a house “you drive until you qualify” and thus, helped shape the way the coastal economy has evolved.
Source: BLS
Figure 5.1 State unemployment rates March 2009 (seasonally adjusted)
Note: Darker Colors=Higher Percentages Lightest Color indicates insufficient dataSource: Federal Reserve Bank of New York
Figure 5.2 Percent of mortgages in county 90-days or more delinquent 2007-08

State of the U.S. Ocean and Coastal Economies 51
Chapter 5: The Future of the Ocean and Coastal Economies
The real estate boom and subsequent real estate bust, and the recession that has followed, will leave many parts of the coastal economy with large amounts of vacant property. In most states, this will probably not be shoreline proper-ties, but Florida may prove an exception because so much development has taken place on and near the shoreline. The large amount of housing stock that will be vacant and seized for foreclosure in the aftermath of the financial crisis and recession will likely keep housing prices low for some years in many parts of the coast, though recovery in housing markets may occur more quickly depending on overall speed of recovery. Much of this housing stock will likely ultimately become the property of the federal government under the proposed reorganization of finan-cial assets. In Florida and elsewhere the decisions of the federal government and, according to current plans, private investors will shape to a great extent the next evolution of housing and population in the coastal economy.
A similar set of issues will arise with what is likely to be a substantial amount of retail space that will become vacant throughout the United States. Growth in retail and related consumer service industries has been an important feature of the coastal economy. The same monetary and financial forces that drove the housing market also affected retail growth as households sustained high rates of consumption by borrowing against their increasing home equity. With the loss of that spur, retail will likely be one of the most severely affected industries in the recession. Not only will a substantial number of jobs be lost, but also a significant amount of retail space will be left vacant.
This vacant retail space will also be a major factor shaping the future of the coastal economy. The vacant space will reduce pressure for additional expansion of retail, and create pressure to find reuses for vacant properties, in many cases not in retail. This is likely to be the case with many strip malls, and even some fully enclosed malls. Many of these properties will become the basis for a new pattern of infill development that will pull growth back from the inland edges to which it has extended (Dunham-Jones and Williamson 2009). One exception may be retail space that serves T&R markets at, or close to, the shore. These high natural amenity locations will still provide a very attractive location for retail and consumer services, and these areas may see the least loss of retail capacity.
5.3 SummaryIt is already apparent that the United States has entered what will probably be the worst recessionary period since World War II, and much will change as a result. Within five years the recovery period from the recession (which lasts to the point where employment and output return to pre-recession levels) should be complete for most regions of the country. Almost all ocean economy sectors will be negatively affected, but marine construction, T&R, and perhaps marine minerals and ship building will provide some stability, either due to their inherent cyclical charac-teristics or because they will be supported by federal fiscal policy. At the same time, the non-market values of visits to coastal recreational and scenic amenities will likely grow as more people find the low cost of visiting the coasts and shorelines an attractive opportunity.
The economies of many coastal states will continue to lag, most notably in the Great Lakes region. National recovery will depend heavily on key coastal states like California, New York, Texas, and Florida returning to growth. As in the past, coastal states, particularly the major metropolitan areas, will have to play a major role.
5.4 Beyond Recession and Recovery: The Coastal and Ocean Economies to 2030 2009 marks the fortieth anniversary of the first compre-hensive national assessment of the oceans, GOM, Great Lakes, and coastal areas. The Commission on Marine Science, Engineering and Resources, better known as the Stratton Commission, was created in 1966 and filed its report in January of 1969. Both NOAA and the CZMA were the direct results of the recommendations of that report. The Stratton Commission identified issues that remain at the center of debates about uses of the sea:
“The most intensive uses of the coastal zone occur at the water’s edge…. Patterns of shoreline develop-ment vary widely from area to area depending upon local topography and economic interests. Across the Nation and throughout the developed countries of the world, the pressures on shoreline space have mounted dramatically over the past 20 years and are certain to increase. The reasons are clear: the shift of the popula-tion from rural areas to the cities (the Nation’s seven largest metropolitan areas are on the Great Lakes or the sea coast), the spread of suburban development into coastal areas, and the increased affluence and leisure time of a large part of our population.”

52 National Ocean Economics Program
Chapter 5: The Future of the Ocean and Coastal Economies
In 2003, the Pew Oceans Commission would pick up the same theme and focus on some of the specific consequences of how change in the ocean and coastal economies was affecting the health of key natural resources:
“Coastal development and associated sprawl destroy and endanger coastal wetlands and estuaries that serve as nurseries for many valuable fishery species. More than 20,000 acres of these sensitive habitats disappear each year. Paved surfaces have created expressways for oil, grease, and toxic pollutants into coastal waters.”
A year later, the U.S. Commission on Ocean Policy made similar observations and drew conclusions remarkably similar to the Stratton Commission thirty-five years earlier:
“Our failure to properly manage the human activities that affect the nation’s oceans, coasts, and Great Lakes is compromising their ecological integrity, diminishing our ability to fully realize their potential, costing us jobs and revenue, threatening human health, and putting our future at risk.”
A theme that runs through all three of these reports is the intense competition among human uses for the narrow strip of land and sea that comprises the coasts and the coastal ocean, and the adverse consequences resulting from failures to prevent that competition from doing lasting damage to the resources on which all else depends. The nature of this competition has ebbed and flowed. Where the Stratton Commission saw the competition being alle-viated by extending the coasts seawards through floating cities, the actual course of development has been landward, driven by high prices of land near the shore and the avail-ability of capital to develop further and further from the centers of urban areas. The Stratton Commission also saw heavy industry as a key part of the coastal and ocean econ-omies. While industry remains, services, including tourism and recreation, have come to dominate.
It appears that economic circumstances are about to shift the patterns of competition once again, placing new demands on how Americans think about using ocean and coastal spaces and resources. Three factors are already apparent that will affect the future ocean and coastal econ-omies in profound ways.
Using the oceans for renewable as well as traditional •energy resources.
A shift of population and economic activity back •towards the shore.
A change in the nature and location of the shore itself •from climate change and sea level rise.
The net result of these three forces, plus others not yet visible, will be to greatly increase the imperative to better understand and focus efforts at both development and con-servation of marine and coastal resources.
Energy Consumption and Production The next three decades will be a transition period in which fossil fuels will play a decreasing role in supplying energy needs, partly because improvements in energy efficiency will reduce the total amount of energy needed per unit of GDP and partly because other sources of energy will come from substitutes for fossil fuels. In this period, the oceans will play a critical role as a supplier of renewable energy, particularly wind, wave, and tidal power. But it may also continue to be a major supplier of petroleum and natural gas.
Plans for building large-scale wind generating facilities in onshore coastal locations or offshore are already being developed for regions such as the North Atlantic and areas of the Pacific, where the meteorological conditions are highly favorable. Such facilities could cluster up to 1,000 turbines in an area producing the equivalent of several conventional power plants. Tidal power has traditionally been conceived of as only being feasible in certain high tidal regime locations like Alaska and Maine. This concept also required the construction of huge barrages (or dams) that would be extremely expensive and environmentally destructive. But recent developments in tidal power use “in-stream” technologies, which are essentially wind tur-bines placed to capture the water’s movement rather than the air’s. Tests for this type of technology are already underway in places like the East River in New York. Cur-rently announced or contemplated plans for these renew-able energy resources could mean significant amounts of United States electricity would come from these sources within twenty years. Offshore energy demands alone will create a major challenge in spatial planning for states and the federal government as they compete with tourism and recreational demands as well as conservation needs in marine protected areas.
At the same time, it is likely that the ocean may play a larger role as a source of oil and gas. The transition away from fossil fuels will be neither quick nor easy, and there will still be a need for petroleum products. As many onshore sources become depleted, the oceans will remain a key potential new source. The increasing costs of explor-ing, producing, and transporting oil and gas from marine environments will have to be covered by rising prices for oil and gas, driven partly by market conditions and partly
State of the U.S. Ocean and Coastal Economies 53
Chapter 5: The Future of the Ocean and Coastal Economies
by climate change policies such as carbon taxes or cap-and-trade systems.
The ocean economy also will be affected by the drive towards energy efficiency. Already a new generation of hybrid container ships is in use, particularly in U.S.-Asian trade. These ships “plug in” to shore-side power when in port, allowing them to shut down their diesel engines, which were traditionally left on to provide power while at the dock.
Energy costs and energy-efficiency concerns will also reshape ocean tourism. Ocean T&R was opened to the general public by the coming of the steamship and the train that brought large numbers of people from the cities to the rural coasts of California, Washington, Maine or Florida. Today ocean tourism is supplied almost entirely by the automobile. Plans are already forming for a return to earlier days. Maine has reintroduced passenger train service to coastal communities and is using local bus services in places like Mt. Desert Island to permit “car free” vacations. California is planning a network of light rail systems from San Francisco to Los Angeles. Ideas for high-speed ferry services linking coastal communities in New England or the Pacific Northwest could become realities within a decade. The result would be a return to more compact, but higher density, tourism and recreation communities in coastal areas.
In sum, it is likely that future iterations of the ocean economy will likely see what is now called the minerals sector being transformed into an “energy” sector measuring both the changes in energy production technologies that will be associated with the oceans.
Peak Sprawl The pattern of land-extensive growth that has characterized most of urban America (and other parts of the world) and so shaped the coastal regions of the United States may be coming to an end. The mortgage delinquency map makes clear the financial risks of this pattern of development (Figure 5.2). This is a radical discovery, for while the social and environmental conse-quences of sprawl have long been understood, it was always assumed that this was the only pattern of development that the financial system would support. While there has been much discussion of “peak oil” there has been much less discussion of the idea that Americans may have hit “peak sprawl.” If so, then significant changes are in store for the coastal economy.
Like “peak oil,” Americans will never know if the peak of sprawl has actually been hit until long after the point has passed. But the signs that this nation may have hit
at least a point where sprawling patterns of growth must abate, perhaps for several decades, are already clear. The real estate and financial crises that have brought about the recession are certainly one of those signs. Overdevelop-ment of housing and the collapse in housing markets has been heavily concentrated at the exurban fringes of cities like Los Angeles, San Diego, and Miami. Others include the prospect of rising energy costs and an aging society that will want greater housing densities and closer access to services. All of these forces may lead to an increase in both population and economic activity in denser urban areas.
To the extent this process occurs it will occur at different rates in different parts of the coastal region. Shorefront property will remain valuable everywhere, but many coastal states, particularly in the Sunbelt, will take many years to work off their surplus housing and commercial property inventories from the last decade. This will have mixed effects on the environment of coastal regions. On the one hand, the environmental consequences of sprawl including lost habitat, degraded hydrologic systems, and nonpoint pollution may be reduced. On the other hand, higher densities will require significantly upgraded water, sewer, and pollution control technologies. Higher densities may also expose more people to the risks of sea level rise.
Climate Change and Sea level Rise Most of the public debate about climate change today is about taking steps that could reduce the emissions of greenhouse gases and mitigate climate change. But the consequences of climate change, particularly sea level rise, are already occurring and will continue to occur through this century regardless of what steps are taken currently to mitigate further change. Over the next century the coastal and ocean economies will be located in a different geography from how they are known today.
A warming climate will bring changes in both the tempera-ture and chemical composition of the oceans. Already there are concerns that increasing carbon in the atmosphere is being absorbed by the oceans and making the oceans much more acidic. The result would be a severe threat to such marine environments as coral reefs and all marine shell-bearing creatures. Warming waters will shift the location of species relative to historic fisheries, and some fisheries dependent on cold waters could see significant popula-tion declines. Regions such as Alaska and New England may see the largest species shifts resulting from changes in ocean temperatures. Some current examples are 1) the large portion of the rich Pollock fishery off of Alaska that moved north this year into colder Russian waters; and 2) the shift north of the giant Humboldt squid into Central California waters from southern, warmer waters.
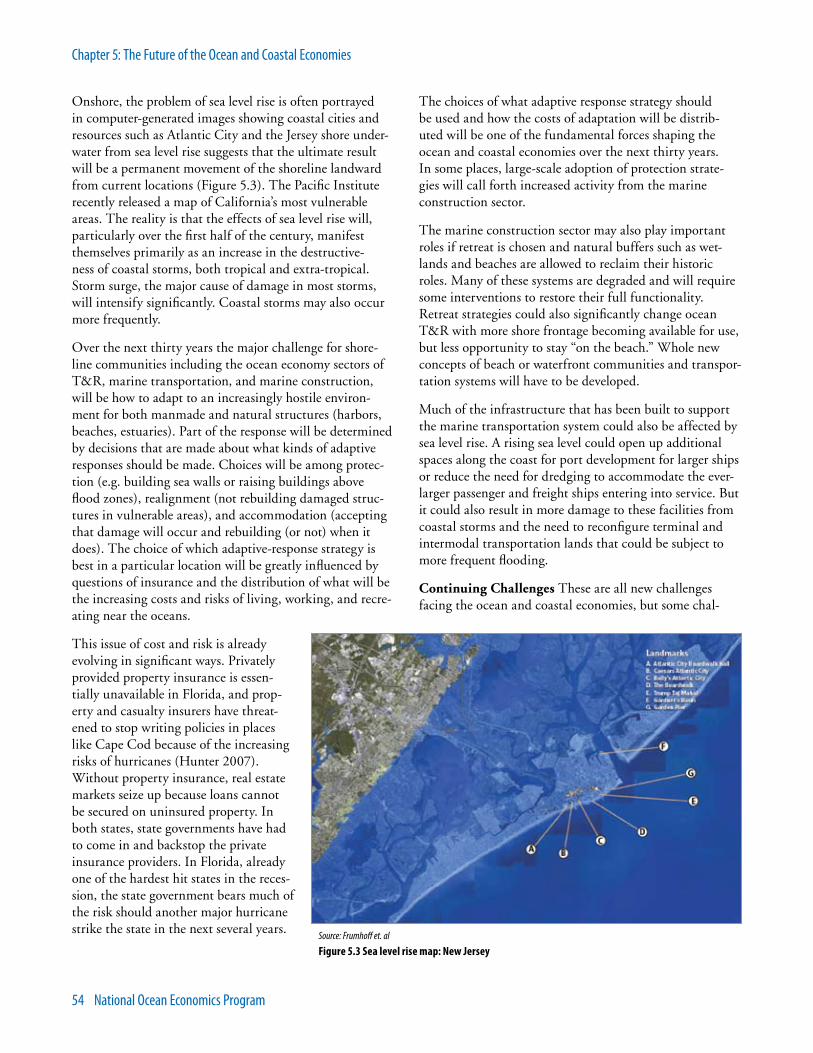
54 National Ocean Economics Program
Chapter 5: The Future of the Ocean and Coastal Economies
Onshore, the problem of sea level rise is often portrayed in computer-generated images showing coastal cities and resources such as Atlantic City and the Jersey shore under-water from sea level rise suggests that the ultimate result will be a permanent movement of the shoreline landward from current locations (Figure 5.3). The Pacific Institute recently released a map of California’s most vulnerable areas. The reality is that the effects of sea level rise will, particularly over the first half of the century, manifest themselves primarily as an increase in the destructive-ness of coastal storms, both tropical and extra-tropical. Storm surge, the major cause of damage in most storms, will intensify significantly. Coastal storms may also occur more frequently.
Over the next thirty years the major challenge for shore-line communities including the ocean economy sectors of T&R, marine transportation, and marine construction, will be how to adapt to an increasingly hostile environ-ment for both manmade and natural structures (harbors, beaches, estuaries). Part of the response will be determined by decisions that are made about what kinds of adaptive responses should be made. Choices will be among protec-tion (e.g. building sea walls or raising buildings above flood zones), realignment (not rebuilding damaged struc-tures in vulnerable areas), and accommodation (accepting that damage will occur and rebuilding (or not) when it does). The choice of which adaptive-response strategy is best in a particular location will be greatly influenced by questions of insurance and the distribution of what will be the increasing costs and risks of living, working, and recre-ating near the oceans.
This issue of cost and risk is already evolving in significant ways. Privately provided property insurance is essen-tially unavailable in Florida, and prop-erty and casualty insurers have threat-ened to stop writing policies in places like Cape Cod because of the increasing risks of hurricanes (Hunter 2007). Without property insurance, real estate markets seize up because loans cannot be secured on uninsured property. In both states, state governments have had to come in and backstop the private insurance providers. In Florida, already one of the hardest hit states in the reces-sion, the state government bears much of the risk should another major hurricane strike the state in the next several years.
The choices of what adaptive response strategy should be used and how the costs of adaptation will be distrib-uted will be one of the fundamental forces shaping the ocean and coastal economies over the next thirty years. In some places, large-scale adoption of protection strate-gies will call forth increased activity from the marine construction sector.
The marine construction sector may also play important roles if retreat is chosen and natural buffers such as wet-lands and beaches are allowed to reclaim their historic roles. Many of these systems are degraded and will require some interventions to restore their full functionality. Retreat strategies could also significantly change ocean T&R with more shore frontage becoming available for use, but less opportunity to stay “on the beach.” Whole new concepts of beach or waterfront communities and transpor-tation systems will have to be developed.
Much of the infrastructure that has been built to support the marine transportation system could also be affected by sea level rise. A rising sea level could open up additional spaces along the coast for port development for larger ships or reduce the need for dredging to accommodate the ever-larger passenger and freight ships entering into service. But it could also result in more damage to these facilities from coastal storms and the need to reconfigure terminal and intermodal transportation lands that could be subject to more frequent flooding.
Continuing Challenges These are all new challenges facing the ocean and coastal economies, but some chal-
Source: Frumhoff et. al
Figure 5.3 Sea level rise map: New Jersey
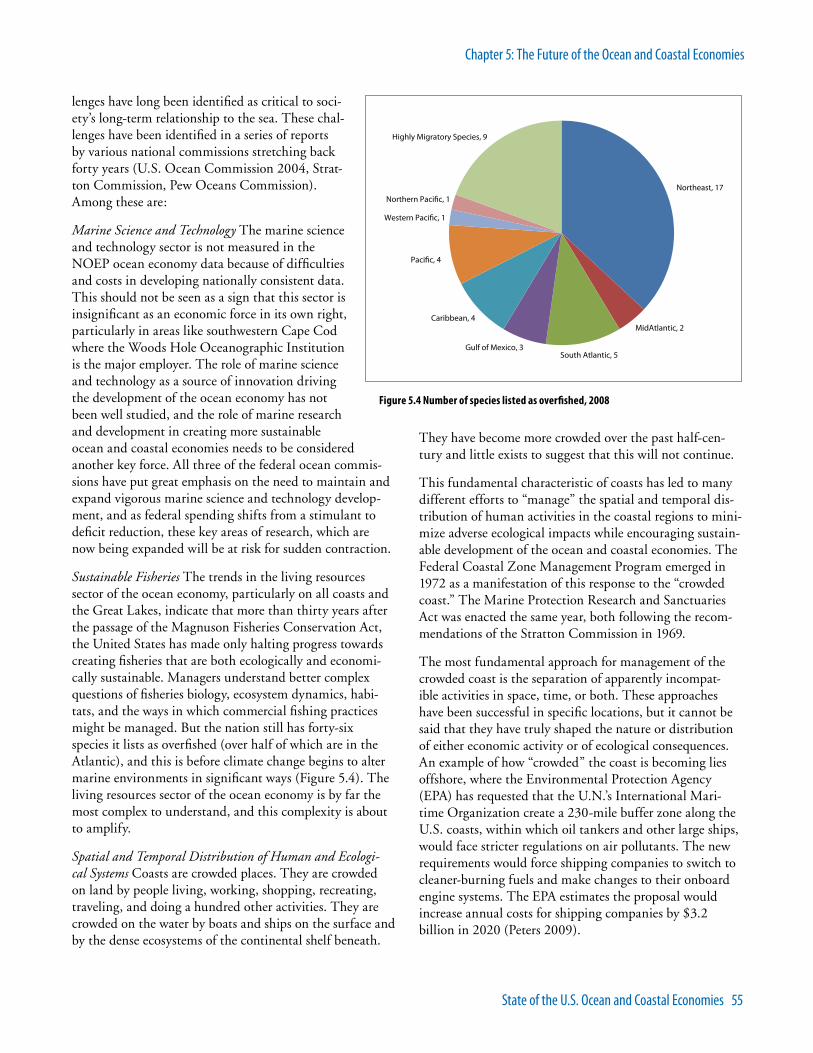
State of the U.S. Ocean and Coastal Economies 55
Chapter 5: The Future of the Ocean and Coastal Economies
lenges have long been identified as critical to soci-ety’s long-term relationship to the sea. These chal-lenges have been identified in a series of reports by various national commissions stretching back forty years (U.S. Ocean Commission 2004, Strat-ton Commission, Pew Oceans Commission). Among these are:
Marine Science and Technology The marine science and technology sector is not measured in the NOEP ocean economy data because of difficulties and costs in developing nationally consistent data. This should not be seen as a sign that this sector is insignificant as an economic force in its own right, particularly in areas like southwestern Cape Cod where the Woods Hole Oceanographic Institution is the major employer. The role of marine science and technology as a source of innovation driving the development of the ocean economy has not been well studied, and the role of marine research and development in creating more sustainable ocean and coastal economies needs to be considered another key force. All three of the federal ocean commis-sions have put great emphasis on the need to maintain and expand vigorous marine science and technology develop-ment, and as federal spending shifts from a stimulant to deficit reduction, these key areas of research, which are now being expanded will be at risk for sudden contraction.
Sustainable Fisheries The trends in the living resources sector of the ocean economy, particularly on all coasts and the Great Lakes, indicate that more than thirty years after the passage of the Magnuson Fisheries Conservation Act, the United States has made only halting progress towards creating fisheries that are both ecologically and economi-cally sustainable. Managers understand better complex questions of fisheries biology, ecosystem dynamics, habi-tats, and the ways in which commercial fishing practices might be managed. But the nation still has forty-six species it lists as overfished (over half of which are in the Atlantic), and this is before climate change begins to alter marine environments in significant ways (Figure 5.4). The living resources sector of the ocean economy is by far the most complex to understand, and this complexity is about to amplify.
Spatial and Temporal Distribution of Human and Ecologi-cal Systems Coasts are crowded places. They are crowded on land by people living, working, shopping, recreating, traveling, and doing a hundred other activities. They are crowded on the water by boats and ships on the surface and by the dense ecosystems of the continental shelf beneath.
They have become more crowded over the past half-cen-tury and little exists to suggest that this will not continue.
This fundamental characteristic of coasts has led to many different efforts to “manage” the spatial and temporal dis-tribution of human activities in the coastal regions to mini-mize adverse ecological impacts while encouraging sustain-able development of the ocean and coastal economies. The Federal Coastal Zone Management Program emerged in 1972 as a manifestation of this response to the “crowded coast.” The Marine Protection Research and Sanctuaries Act was enacted the same year, both following the recom-mendations of the Stratton Commission in 1969.
The most fundamental approach for management of the crowded coast is the separation of apparently incompat-ible activities in space, time, or both. These approaches have been successful in specific locations, but it cannot be said that they have truly shaped the nature or distribution of either economic activity or of ecological consequences. An example of how “crowded” the coast is becoming lies offshore, where the Environmental Protection Agency (EPA) has requested that the U.N.’s International Mari-time Organization create a 230-mile buffer zone along the U.S. coasts, within which oil tankers and other large ships, would face stricter regulations on air pollutants. The new requirements would force shipping companies to switch to cleaner-burning fuels and make changes to their onboard engine systems. The EPA estimates the proposal would increase annual costs for shipping companies by $3.2 billion in 2020 (Peters 2009).
Figure 5.4 Number of species listed as overfished, 2008
Northeast, 17
MidAtlantic, 2
South Atlantic, 5Gulf of Mexico, 3
Caribbean, 4
Pacific, 4
Western Pacific, 1
Northern Pacific, 1
Highly Migratory Species, 9
56 National Ocean Economics Program
Chapter 5: The Future of the Ocean and Coastal Economies
5.5 ConclusionThese three factors—energy, land use, and climate change— together point to a future in which greatly expanded uses of the oceans for energy production com-petes with long-term trends for growing uses of the adja-cent shore lands for residences and a variety of economic activity. These trends will be intensified as both people and jobs move back towards the shore, which will itself be shrinking as a physical location due to sea level rise. Managing spatial and user conflicts will be the focus of policy to an extent that has not been seen. Changes in public policy to support the expansion of marine protected areas and sanctuaries have been one manifestation of this change. New efforts to identify the areas most suitable for development and those most critical for conservation will be needed both offshore, and onshore.
The ocean and coastal economies were the original founda-tion for the United States in the 17th and 18th centuries. They have remained a vital part of the national economy, even as the nation expanded from thirteen colonies, where the vast majority of people lived within fifty miles of the Atlantic Ocean to a continental nation stretching well out into the Pacific. Over the past twenty years, these econo-mies have undergone a number of significant changes, which first intensified the economic competition for coastal and ocean resources, and then, as the economy fell into recession, abated.
However, larger forces in energy, land use, and the environ-ment are already at work that will reshape the ocean and coastal economies in even more profound ways over the next decades. It is not too early to speculate that the next thirty years will bring the most significant changes to the ocean and coastal economies since the arrival of industri-alization and rapid urbanization in the late 19th century. Tracking, understanding, and shaping those changes will shape the next generation of competition over the coasts, oceans, and Great Lakes.
For one thing is very unlikely to change: people’s desire to be at, near, or on the oceans and Great Lakes. Like the poet John Masefield, we must go down to the sea again.
5.6 ReferencesAdamy, Janet. 2009. “McDonald’s Seeks Way to Keep Sizzling.” Wall Street Journal, March 10, 2009.
Clenfield, Jason. 2009. “Japan Exports Drop Record 49% as Global Slump Deepens.” Bloomberg News, March 25, 2009.
Commission on Marine Science, Engineering and Resources. (Stratton Commission) 1969. Our Nation and the Sea: A National Plan for Action. Washington: Government Printing Office. http://www.lib.noaa.gov/noaainfo/heritage/stratton/title.html.
Dunham-Jones, Ellen and June Williamson. 2009. Retrofitting Suburbia: Urban Design Solutions for Redesigning Suburbs. New York: John Wiley.
Federal Reserve Bank of New York. 2008. Dynamic Maps of Bank Card and Mortgage Delinquencies in the United States. http://www.data.newyorkfed.org/creditconditionsmap.
Feely, R.A., C. L. Sabine, J. M. Hernandez-Ayon, D. Ianson, B. Hales. 2008. Evidence for Upwelling of Corrosive “Acidified” Water onto the Continental Shelf. Science Vol. 320. no. 5882, pp. 1490 – 1492. June 13, 2008.
Frumhoff, P.C., J.J. McCarthy, J.M. Melillio, S.C. Moser, & D.J. Wuebbles. 2007. Confronting Climate Change in the U.S. Northeast: Science, Impacts, and Solutions. Cambridge, MA: Union of Concerned Scientists.
Hunter, J. Robert. 2007. Property/Casualty Insurance in 2007: Overpriced Insurance, Underpaid Claims, Declining Losses and Unjustified Profits. January 8, 2007. http://www.consumerfed.org/pdfs/2007Insurance_White_Paper.pdf.
Peters, Mark. 2009. “EPA Proposes New Rules to Cut Pollution from Ships.” Dow Jones Newswires. March 30, 2009. http://www.firstenercastfinancial.com/e_news.php?cont=30304.
Pew Oceans Commission. 2003. America’s Living Oceans: Charting a Course for Sea Change. http://www.pewtrusts.org/uploadedFiles/wwwpewtrustsorg/Reports/Protecting_ocean_life/env_pew_oceans_final_report.pdf.
Port of Los Angeles. 2009. TEU Statistics (Container Counts). http://www.portoflosangeles.org/maritime/stats.asp.
Port of Virginia. 2009. Port Stats. http://www.portofvirginia.com/development/port-stats.aspx.
U.S. Bureau of Labor Statistics, Local Area Unemployment Statistics (LAUS) Program. http://www.bls.gov/lau.
U.S. Commission on Ocean Policy. 2004. An Ocean Blueprint for the 21st Century. Washington: U.S. Commission on Ocean Policy. http://oceancommission.gov/documents/full_color_rpt/000_ocean_full_report.pdf.

AcknowledgementsThis report was prepared by three primary authors. Judith Kildow, Director and PI for the National Ocean Economics Program, orchestrated the report and authored the Executive Summary and Introduction. Charles Colgan, Professor of Public Policy and Management in the Muskie School of Public Service at the University of Southern Maine and Chair of the Muskie School’s Graduate Program in Community Planning and Development, wrote Chapters 2, 3, and 5. Jason Scorse, Professor and Program Coordinator for the International Environmental Policy Program at the Monterey Institute for International Studies, with research and editorial assistance from Shannon McDiarmid, authored Chapter 4. Bonnie Lockwood, Program Manager at the NOEP, conducted research, and facilitated and edited the draft report. Pat Johnston, Information Systems Manager for the NOEP, compiled data for most chapters and created some of the graphics used in the report.
The authors take full responsibility for the content and thank all of the reviewers for their suggestions and ideas. Reviewers were Jeff Adkins, Paul Sandifer, and Peter Wiley from National Oceanic and Atmospheric Administration (NOAA); Maureen Stancik Boyce, IBM; Lou Cafiero, National Marine Sanctuary Foundation; James Cato, University of Florida; Richard Carson, University of California, San Diego; Karen Garrison and colleagues at Natural Resources Defense Council; Hauke L. Kite-Powell, Woods Hole Oceanographic Institution; Linwood Pendleton, Coastal Ocean Values Center; Karen Polenske, Massachusetts Institute of Technology; Giulio Pontecorvo, Columbia University; Dave Talan, U.S. Bureau of Labor Statistics; and David Terkla, University of Massachusetts.
Thanks go to NOAA’s Coastal Services Center who provided the core funding for this report, and the National Marine Sanctuary Foundation for sponsoring the release of this report.
NOEP National Advisory Board Maureen Stancik Boyce, IBM; Michael Hanemann, University of California, Berkeley; Karen Garrison, Natural Resources Defense Council; Roger McManus, Conservation International; Michael Orbach, Duke University; Karen Polenske, Massachusetts Institute of Technology; Giulio Pontecorvo, Columbia University; and Robert Solow; Massachusetts Institute of Technology.
CreditsGraphic Design: WIRED IN design
This report is available on-line as a PDF file at: http://www.OceanEconomics.org/nationalreport
All rights reserved. No part of this publication may be reproduced without acknowledgement to The National Ocean Economics Program
Printed on recycled paper.
We Value the Oceanswww.oceaneconomics.org
State of the U.S. Ocean and Coastal Economies
Judith T. Kildow • Charles S. Colgan • Jason Scorse
2009The United States must ensure sustainable use of its marine resources to maintain its
place in the global economy.
The nation relies on ocean systems to produce food, energy, and pharmaceuticals.
Large sectors of the U.S. economy depend on the oceans to transport goods.
Energy needs, land use, and climate change will challenge management of our coasts
and oceans in the future.
The Economy Relies on a Healthy Ocean