
Moody's Mega Math Challenge Team 218 - Moody's Math Challenge

page 1
State of the U.S. Multifamily Market
2015 Review and Forecast

page 2
• Economic Overview
• Apartment Leasing Fundamentals
• Apartment Rent Trends
• Capital Markets
Agenda

page 3
Economic Backdrop

page 4
Contributions To GDP Growth
3/31/2007
6/30/2007
9/30/2007
12/31/2007
3/31/2008
6/30/2008
9/30/2008
12/31/2008
3/31/2009
Sources: BEA; CoStar Portfolio Strategy As of 15Q4
(10%)
(8%)
(6%)
(4%)
(2%)
0%
2%
4%
6%
8%
08 09 10 11 12 13 14 15
Consumption Business Investment Residential Investment
Government Net Exports Change in Inventories
Total GDP
Contribution to GDP Growth

page 5
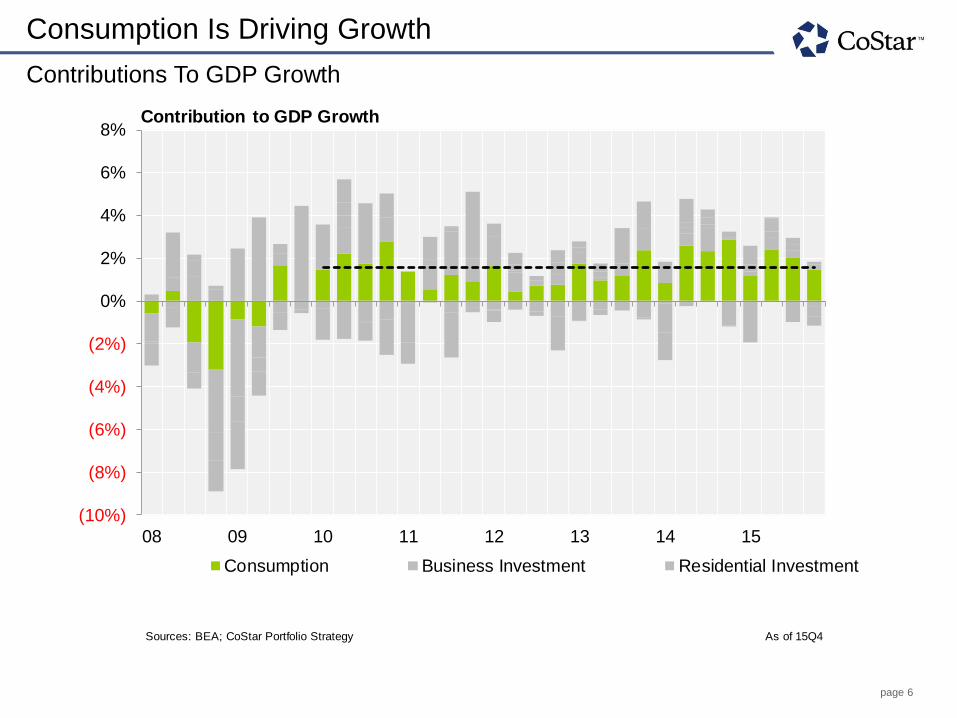
Consumption Is Driving Growth
Contributions To GDP Growth
3/31/2007
6/30/2007
9/30/2007
12/31/2007
3/31/2008
6/30/2008
9/30/2008
12/31/2008
3/31/2009
Sources: BEA; CoStar Portfolio Strategy As of 15Q4
(10%)
(8%)
(6%)
(4%)
(2%)
0%
2%
4%
6%
8%
08 09 10 11 12 13 14 15
Consumption Business Investment Residential Investment
Government Net Exports Change in Inventories
Contribution to GDP Growth
page 6
Consumption Is Driving Growth
Contributions To GDP Growth
3/31/2007
6/30/2007
9/30/2007
12/31/2007
3/31/2008
6/30/2008
9/30/2008
12/31/2008
3/31/2009
Sources: BEA; CoStar Portfolio Strategy As of 15Q4
(10%)
(8%)
(6%)
(4%)
(2%)
0%
2%
4%
6%
8%
08 09 10 11 12 13 14 15
Consumption Business Investment Residential Investment
Contribution to GDP Growth

page 7
Weak Global Economy and Strong Dollar Hurt Exports
3/31/2007
6/30/2007
9/30/2007
12/31/2007
3/31/2008
6/30/2008
9/30/2008
12/31/2008
3/31/2009
Sources: BEA; CoStar Portfolio Strategy As of 15Q4
(10%)
(8%)
(6%)
(4%)
(2%)
0%
2%
4%
6%
8%
08 09 10 11 12 13 14 15
Consumption Business Investment Residential Investment
Government Net Exports Change in Inventories
Contribution to GDP Growth

page 8
Global Capital Flows Have Favored U.S.
Net Change in U.S. International Investment Position
1
2
3
4
5
6
7
8
9
10
11
12
13
14
15
16
17
18
Source: Bureau of Economic Analysis As of 15Q3
($1.0T)
$0.0T
$1.0T
$2.0T
$3.0T
$4.0T
$5.0T
10 11 12 13 14 15
Cumulative Net Capital Flows to US since 2009Q4

page 9
Residential Investment Steady If Unspectacular
3/31/2007
6/30/2007
9/30/2007
12/31/2007
3/31/2008
6/30/2008
9/30/2008
12/31/2008
3/31/2009
Sources: BEA; CoStar Portfolio Strategy As of 15Q4
(10%)
(8%)
(6%)
(4%)
(2%)
0%
2%
4%
6%
8%
08 09 10 11 12 13 14 15
Consumption Business Investment Residential Investment
Government Net Exports Change in Inventories
Contribution to GDP Growth

page 10
Volatile Quarterly Growth = Steady Annual Growth
3/31/2007
6/30/2007
9/30/2007
12/31/2007
3/31/2008
6/30/2008
9/30/2008
12/31/2008
3/31/2009
Sources: BEA; CoStar Portfolio Strategy As of 15Q4
(10%)
(8%)
(6%)
(4%)
(2%)
0%
2%
4%
6%
8%
08 09 10 11 12 13 14 15
Consumption Business Investment Residential Investment
Government Net Exports Change in Inventories
Total GDP
Contribution to GDP Growth

page 11
72 Months of Job Gains
31-Jan-39
28-Feb-39
31-Mar-39
30-Apr-39
########
30-Jun-39
31-Jul-39
31-Aug-39
30-Sep-39
31-Oct-39
30-Nov-39
31-Dec-39
31-Jan-40
29-Feb-40
31-Mar-40
30-Apr-40
########
30-Jun-40
31-Jul-40
31-Aug-40
30-Sep-40
31-Oct-40
30-Nov-40
31-Dec-40
31-Jan-41
28-Feb-41
31-Mar-41
Source: Bureau of Labor Statistics; CoStar As of Jan 2016
(1,000)
(800)
(600)
(400)
(200)
0
200
400
600
800
1,000
60 65 70 75 80 85 90 95 00 05 10 15
Monthly Job Change
Monthly Job Change

page 12
72 Months of Job Gains
31-Jan-39
28-Feb-39
31-Mar-39
30-Apr-39
########
30-Jun-39
31-Jul-39
31-Aug-39
30-Sep-39
31-Oct-39
30-Nov-39
31-Dec-39
31-Jan-40
29-Feb-40
31-Mar-40
30-Apr-40
########
30-Jun-40
31-Jul-40
31-Aug-40
30-Sep-40
31-Oct-40
30-Nov-40
31-Dec-40
31-Jan-41
28-Feb-41
31-Mar-41
Source: Bureau of Labor Statistics; CoStar As of Jan 2016
0
5,000
10,000
15,000
20,000
(1,000)
(800)
(600)
(400)
(200)
0
200
400
600
800
1,000
60 65 70 75 80 85 90 95 00 05 10 15Monthly Job Change
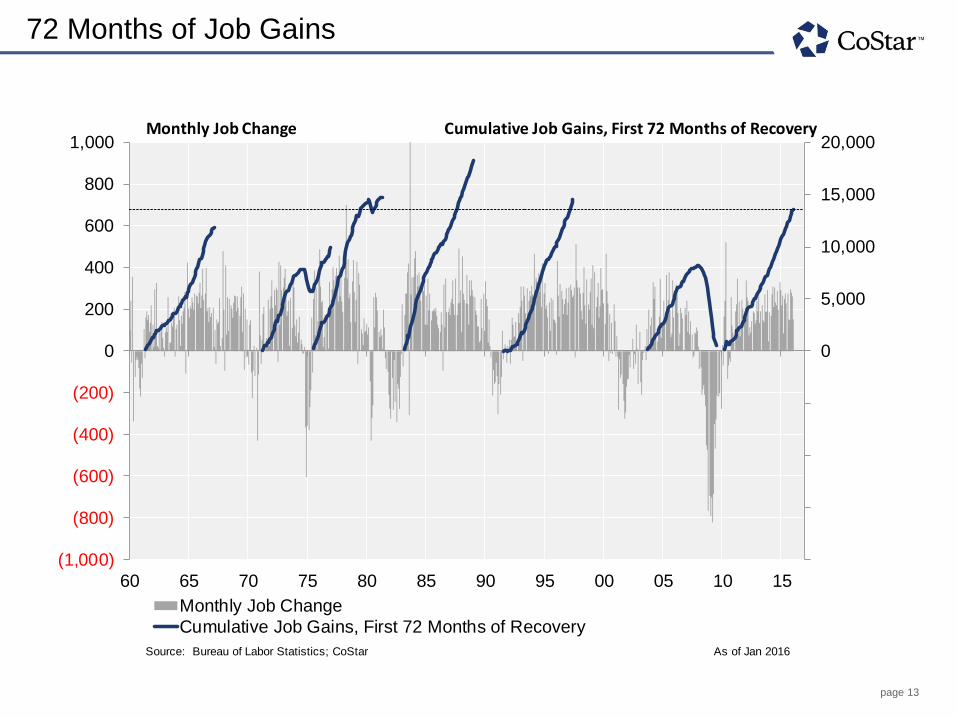
Cumulative Job Gains, First 72 Months of Recovery
Monthly Job Change Cumulative Job Gains, First 72 Months of Recovery
page 13
72 Months of Job Gains
31-Jan-39
28-Feb-39
31-Mar-39
30-Apr-39
########
30-Jun-39
31-Jul-39
31-Aug-39
30-Sep-39
31-Oct-39
30-Nov-39
31-Dec-39
31-Jan-40
29-Feb-40
31-Mar-40
30-Apr-40
########
30-Jun-40
31-Jul-40
31-Aug-40
30-Sep-40
31-Oct-40
30-Nov-40
31-Dec-40
31-Jan-41
28-Feb-41
31-Mar-41
Source: Bureau of Labor Statistics; CoStar As of Jan 2016
0
5,000
10,000
15,000
20,000
(1,000)
(800)
(600)
(400)
(200)
0
200
400
600
800
1,000
60 65 70 75 80 85 90 95 00 05 10 15
Monthly Job Change
Cumulative Job Gains, First 72 Months of Recovery
Monthly Job Change Cumulative Job Gains, First 72 Months of Recovery

page 14
West And South Are Fastest Growing
Projected Household Growth
Live Data
1
2
3
4
5
6
7
8
9
10
11
12
13
14
15
16
17
18
19
20
Pasted Data
1
2
3
4
Sources: Moody's Analytics; CoStar Portfolio Strategy As of 15Q4
0
50
100
150
200
250
300
350
400
0.0%
0.5%
1.0%
1.5%
2.0%
2.5%
3.0%
3.5%
4.0%
4.5%
5.0%O
rlando
Ra
leig
h
Palm
Be
ach
Pho
enix
Austin
Las V
egas
Ch
arlotte
Atlan
ta
Da
llas -
FW
Jacksonvill
e
Ho
usto
n
Fort
Laud
erd
ale
Tam
pa
Inla
nd E
mpire
San
An
tonio
De
nve
r
Mia
mi
Port
land,
OR
Sea
ttle
Na
shvill
e
Metro Average (15Q4-20Q4) National Index (15Q4-20Q4) Cumulative Growth
New Households (000s)
South East Midwest West
Average Annual Household Growth (15Q4-20Q4)

page 15
South And West Enjoying Strong Growth
Metro Wage And Salary Growth
1
2
3
4
5
6
7
8
9
10
11
12
13
14
15
16
17
18
19
20
Rank
1
2
3
4
5
Sources: Moody's Analytics; CoStar Portfolio Strategy As of 15Q4
20%
25%
30%
35%
40%
45%
50%
55%O
rlando
Jacksonvill
e
Palm
Be
ach
Tam
pa
San
Fra
ncis
co
India
na
polis
Sea
ttle
Fort
Laud
erd
ale
Pho
enix
Port
land
Austin
Da
llas -
FW
Sta
mfo
rd
Ra
leig
h
San
Jose
Mia
mi
Ch
arlotte
Salt L
ake C
ity
Na
shvill
e
De
troit
Metro Wage and Salary Growth (15Q4-20Q4)
National Index Wage and Salary Growth (15Q4-20Q4)
Wage and Salary Growth (15Q4-20Q4)
South East Midwest West

page 16
Where the High-Earners Go
Relative Share and Gains of High-Income/High-Growth Jobs, 2010-
2014
New YorkLos AngelesChicagoHoustonAtlantaWashingtonDallasPhiladelphiaPhoenixMinneapolisBostonSeattleOrange CountyDenverSan DiegoSt. LouisBaltimoreInland EmpireTampaPittsburghSan FranciscoOrlandoPortlandMiamiOaklandClevelandCincinnatiKansas CityEdisonSan Jose
Source: Bureau of Labor Statistics Occupational Employment Statistics As of 2014Note: Bubble size denotes total employment. Color coding denotes average income as of 2014; blue is higher and red is lower.Note: "High Income/High Growth" jobs refer to occupations with incomes and growth rates in the top third.
New York
Los AngelesChicago
Houston
Washington
Philadelphia
Minneapolis
BostonSeattle
Denver
San Diego
Inland Empire
Pittsburgh
San Francisco
Orlando
Miami
Oakland
Cincinnati
Edison
San Jose
San Antonio
Las Vegas
Fort LauderdaleNorfolk
(60%)
(40%)
(20%)
0%
20%
40%
60%
80%
100%
(80%) (60%) (40%) (20%) 0% 20% 40% 60% 80% 100% 120%
Relative Share of High Income/High Growth Jobs, 2010
Relative Gain in High Income/High Growth Jobs, 2010-2014
More than fair share of high income / high growth jobs, and gaining share
Less than fair share of high income / high growth jobs, but gaining share
Less than fair share of high income / high growth jobs, and losing share
More than fair share of high income / high growth jobs, but losing share

page 17
Demographic Tailwinds Remain
U.S. Population By Age
Year
1910
1911
1912
1913
1914
1915
1916
1917
1918
1919
1920
1921
1922
1923
1924
1925
1926
1927
1928
1929
1930
1931
1932
1933
1934
1935
1936
1937
1938
1939
1940
Sources: Center for Health Statistics; Moody's Analytics; CoStar Portfolio Strategy As of 13Q4
0.0
0.5
1.0
1.5
2.0
2.5
3.0
3.5
4.0
4.5
5.0
98 93 88 83 78 73 68 63 58 53 48 43 38 33 28 23 18 13 8 3
Current AgeRenters Owners
MillenialsBaby Boom Generation X
U.S. Population (Millions)
Generation Z

page 18
Leasing Fundamentals

page 19
Who Are Today’s Renters?

page 20
Two Quarters Do Not Make A Trend, But…….
Homeownership Rate And Renter Occupied Households
65
65
65
66
66
66
66
67
67
67
67
68
68
68
68
69
69
69
69
70
70
70
70
71
71
Sources: Moody's Analytics; U.S. Census Bureau; CoStar Portfolio Strategy As of 15Q4
30
32
34
36
38
40
42
44
60
61
62
63
64
65
66
67
68
69
70
94 96 98 00 02 04 06 08 10 12 14
Renter Households U.S. HO Rate
Homeownership Rate (%) Renter Occupied Households (Millions)

page 21
Drop In Homeownership = More Renter Households
Homeownership Rate And Renter Household Growth By Age Cohort
12/31/2014
3/31/2006
8.76
330.78
(2,520.24)
Households
Sources: U.S. Census Bureau; Moody's Analytics; JCHS; CoStar Portfolio Strategy As of 15Q4
55%
60%
65%
70%
75%
80%
85%
35-44 Years 45-54 Years 55-64 Years 65 Years AndOlder
Average HO Rate (1982-06) 2006Q1 Current HO Rate
0
500
1,000
1,500
2,000
2,500
Less Than 35Years
35-44 Years 45-54 Years 55-64 Years 65 Years AndOlder
Renter Household Growth (2006-14)
Homeownership Rate
Renter Household Growth (000s)
30%
32%
34%
36%
38%
40%
42%
44%
Less Than 35 Years
page 22
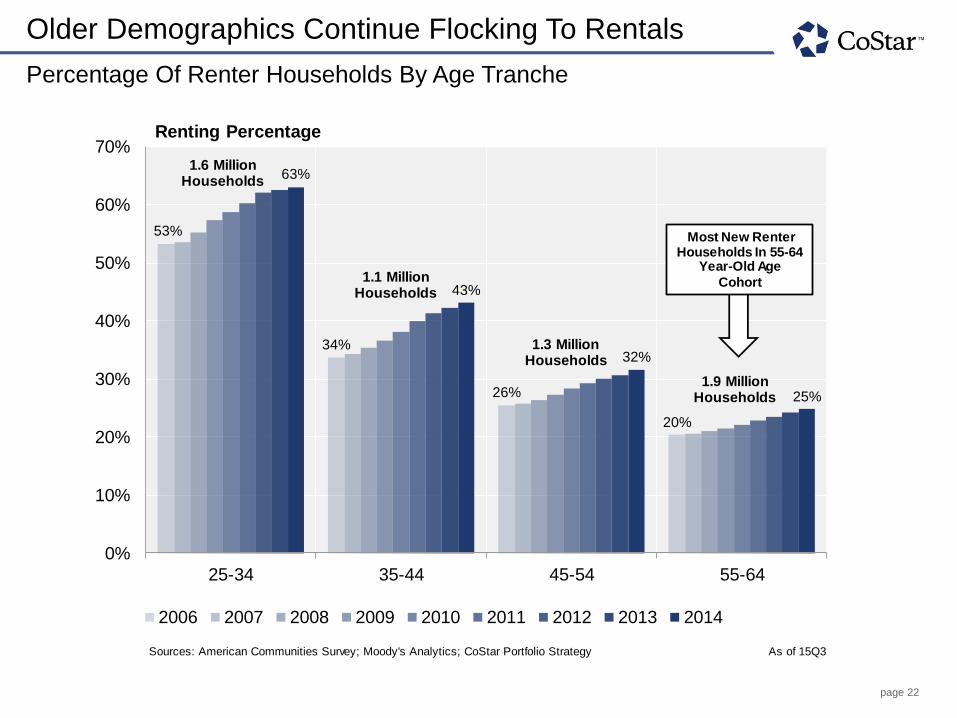
Older Demographics Continue Flocking To Rentals
Percentage Of Renter Households By Age Tranche
2006
2007
2008
2009
2010
2011
2012
2013
2014
Sources: American Communities Survey; Moody's Analytics; CoStar Portfolio Strategy As of 15Q3
53%
34%
26%
20%
63%
43%
32%
25%
0%
10%
20%
30%
40%
50%
60%
70%
25-34 35-44 45-54 55-64
2006 2007 2008 2009 2010 2011 2012 2013 2014
Renting Percentage
1.6 Million Households
1.1 Million Households
1.3 Million Households
1.9 Million Households
Most New RenterHouseholds In 55-64
Year-Old Age
Cohort
page 23
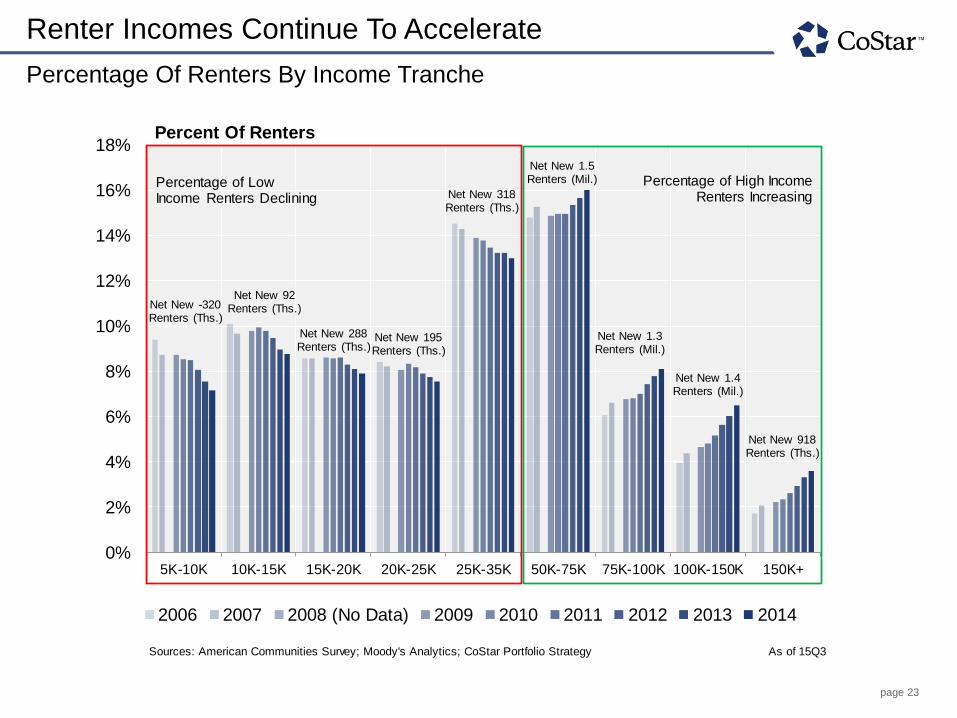
Renter Incomes Continue To Accelerate
Percentage Of Renters By Income Tranche
From: file:///\\ppr3\common\Work%20in%20Progress\Tom%20Conville\Sam\Income%20Demographics\Income%20by%20Owner%20and%20Renter.xlsxOwner Income
0-5000
150000+
Renter Income
5K-10K10K-15K15K-20K20K-25K25K-35K50K-75K
150K+
2006-2014
Sources: American Communities Survey; Moody's Analytics; CoStar Portfolio Strategy As of 15Q3
Net New -320 Renters (Ths.)
Net New 92 Renters (Ths.)
Net New 288 Renters (Ths.)
Net New 195 Renters (Ths.)
Net New 318 Renters (Ths.)
Net New 1.5 Renters (Mil.)
Net New 1.3 Renters (Mil.)
Net New 1.4 Renters (Mil.)
Net New 918 Renters (Ths.)
0%
2%
4%
6%
8%
10%
12%
14%
16%
18%
5K-10K 10K-15K 15K-20K 20K-25K 25K-35K 50K-75K 75K-100K 100K-150K 150K+
2006 2007 2008 (No Data) 2009 2010 2011 2012 2013 2014
Percentage of Low Income Renters Declining
Percentage of High Income Renters Increasing
Percent Of Renters

page 24
Folks Are Getting Married Later In Life
Median Age At First Marriage, United States
Table MS-2. Estimated Median Age at First Marriage: 1890 to present
20142013201220112010
20092008200720062005200420032002200120001999199819971996199519941993199219911990198919881987
Sources: U.S. Census Bureau; CoStar Portfolio Strategy As of 15Q3
20
22
24
26
28
30
70 72 74 76 78 80 82 84 86 88 90 92 94 96 98 00 02 04 06 08 10 12 14
Men Women
Median Age At First Marriage

page 25
More People Are Living Alone
Single Person Households, United States
r
r
Sources: U.S. Census Bureau; Current Population Survey, Annual Social and Economic Supplement; As of 15Q3
CoStar Portfolio Strategy
10%
15%
20%
25%
30%
0
5
10
15
20
25
30
35
40
60 64 68 72 76 80 84 88 92 96 00 04 08 12
Single Person Households Single Person Households as % of Total Households
Single Person Households (Millions) % Single Person Households

page 26
Living With Friends/Partners Helps Pay The Rent
2005200620072008200920102011201220132014
Sources: U.S. Census, CoStar Portfolio Strategy As of 15Q3
0%
10%
20%
30%
40%
50%
60%
70%
80%
90%
100%
05 06 07 08 09 10 11 12 13 14
Non Family Households With Annual Earnings Over 150K Total U.S. Households
Cumulative Growth Since 2005
# of Non Family Households With
Earnings Over 150K
2005: 800,000 2014: 1.5 Million
Growth In High Earning Non-Family Households

page 27
Good Luck Getting A Mortgage If You're Young
Mortgage Origination By Riskscore And Average Credit Rating By Age
Sources: New York Fed Consumer Credit Panel/Equifax; Credit Karma; CoStar Portfolio Strategy As of 15Q2
$0
$200
$400
$600
$800
$1,000
$1,200
03 04 05 06 07 08 09 10 11 12 13 14 15
<620 620-659 660-719 720-779 780+
Mortgage Origination By Riskscore (Billions)
630 628 630647
697
580
600
620
640
660
680
700
720
18-24 25-34 35-44 45-54 55+
Average Credit Rating
Credit Score 2007 2015
<659 19% 8%
780+ 32% 50%

page 28
Apartment Market Fundamentals

page 29
Some Of The Heaviest Supply Levels For The Cycle
National Apartment Supply, Demand, and Vacancy
90
90
90
90
91
91
91
91
92
92
92
92
93
93
93
93
94
94
94
94
95
95
95
95
96
96
96
96
Source: CoStar Portfolio Strategy As of 15Q4
3%
4%
5%
6%
7%
8%
(20)
(10)
0
10
20
30
40
50
60
70
80
90
100
00 01 02 03 04 05 06 07 08 09 10 11 12 13 14 15
Demand Change (Q/Q) Supply Change (Q/Q)
Vacancy Historical Avg Vacancy (2000-2014)
Demand & Supply (000s Units) Vacancy

page 30
Developers Building Smaller Units
Single Person Households And Small Unit Construction
s
r
r
Sources: U.S. Census Bureau; Current Population Survey, Annual Social and Economic Supplement; As of 15Q4
CoStar Portfolio Strategy
35%
40%
45%
50%
55%
60%
65%
10%
15%
20%
25%
30%
70 75 80 85 90 95 00 05 10 15
Single Person Households as % of Total Households
Studios or 1 BRs as % of New Construction
% Single Person Households Studios or 1 BRs as % of New Construction

page 31
Developers Focused On CBDS
Units Under Construction As A % Of Inventory In Top U.S. Markets
2012
2012
2012
2012
2013
2013
2013
2013
2014
2014
2014
2014
2015
2015
2015
2015
Source: CoStar Portfolio Strategy As of 15Q4
0%
2%
4%
6%
8%
10%
12%
14%
16%
0
50
100
150
200
250
2012 2013 2014 2015
CBD % Inventory Underway Premier Suburban % Inventory Underway
Suburban % Inventory Underway CBD Units Underway
Premier Suburban Units Underway Suburban Units Underway
Units Under Construction (000s) Under Construction As A % Of Inventory

page 32
Pockets Of Heavy Building
Growth In Inventory By Metro Through 2016 (14Q4-16Q4)
Rank
1
2
3
4
5
6
7
8
9
10
11
12
13
14
15
16
17
18
19
20
21
22
23
24
25
Source: CoStar Portfolio Strategy As of 15Q4
0%
2%
4%
6%
8%
10%
12%
0
5,000
10,000
15,000
20,000
25,000
30,000
35,000
40,000H
ousto
n
Ne
w Y
ork
Da
llas
Washin
gto
n, D
C
Sea
ttle
Los A
ngele
s
Austin
Atlan
ta
De
nver
Bosto
n
Pho
enix
Ch
icago
Na
sh
vill
e
San
An
tonio
Ch
arlotte
Orlando
Mia
mi
San
Jose
Port
land,
OR
Phila
delp
hia
Kan
sa
s C
ity
Ora
ng
e C
ounty
San
Fra
ncis
co
Min
nea
polis
San
Die
go
Completions As A % Of InventorySouth East Midwest West
New Supply (As % of Inventory)New Supply (Units)

page 33
Pockets Of Heavy Building
Growth In Inventory By Metro Through 2016 (14Q4-16Q4)
Rank
1
2
3
4
5
6
7
8
9
10
11
12
13
14
15
16
17
18
19
20
21
22
23
24
25
Source: CoStar Portfolio Strategy As of 15Q4
0
5,000
10,000
15,000
20,000
25,000
30,000
35,000
40,000H
ousto
n
Ne
w Y
ork
Da
llas
Wash
ingto
n, D
C
Sea
ttle
Los A
ngele
s
Austin
Atlan
ta
De
nver
Bosto
n
Pho
enix
Ch
ica
go
Na
shvill
e
San
An
tonio
Ch
arlotte
Orlando
Mia
mi
San
Jose
Port
land,
OR
Phila
delp
hia
Kan
sas C
ity
Ora
ng
e C
ounty
San
Fra
ncis
co
Min
nea
polis
San
Die
go
South East Midwest West
New Supply (As % of Inventory)New Supply (Units)
2015 Deliveries 2016 Deliveries

page 34
And Supply Hits Unevenly Within Markets
Denver Submarkets Y/Y Supply Growth As A Percentage Of Metro Y/Y Supply Growth
1234567
Other 8 Submarkets
47
121515151515151311
310
21515
Source: CoStar Portfolio Strategy As of 15Q4
36.3%
14.7%
8.6%
8.2%
6.4%
5.3%4.3%
16.1% Downtown/Cherry Creek
West Denver
Southeast Corridor
Highlands Ranch/LoneTree
Aurora
DTC/Hampden
Lakewood/West Corridor
Other 8 Submarkets
% Submarket Stock Growth Of Metro Stock Growth

page 35
Starts Continue To Climb
U.S. Multifamily Starts And Permits
Sources: U.S. Census; Moody's Analytics; CoStar Portfolio Strategy As of 15Q4
0
50
100
150
200
250
83 85 87 89 91 93 95 97 99 01 03 05 07 09 11 13 15
Multifamily StartsMultifamily PermitsMultifamily Starts Historical Average (83-Present)
Starts and Permits (000s)

page 36
Breaking Ground: Construction Starts By Submarket
Construction Starts In 2015
151413121110
987654321
Source: CoStar Portfolio Strategy As of 15Q4
2,080
2,093
2,138
2,143
2,328
2,374
2,390
2,449
2,519
2,580
2,814
2,903
3,099
3,214
8,871
1,000 2,000 3,000 4,000 5,000 6,000 7,000 8,000 9,000 10,000
NEWY -Midtown West
MIAM -Brickell/Downtown Miami
DALL - Oak lawn/Park Cities
NEWY -Williamsburg/Greenpoint/Navy…
DALL - Allen/McKinney
CHAR -Uptown
CHIC -North Lakefront
HOUS -Neartown/River Oaks
ATLA -Downtown/Midtown
DALL - Frisco/Prosper
LOSA -Downtown Los Angeles
NASH -West End/CBD
CHIC -Downtown Chicago
DENV -Downtown/Cherry Creek
NEWY -Long Island City/Hunters Point
Units
Highest Construction Starts In 2015

page 37
New Construction Lease Up A Bit Slower in ‘15
Quarterly Deliveries And Lease Up Trend By Year Of Delivery
Vacant Units
3/31/2013
6/30/2013
9/30/2013
3/31/2014
6/30/2014
9/30/2014
3/31/2015
6/30/2015
9/30/2015
Total Units
3/31/2013
6/30/2013
9/30/2013
3/31/2014
6/30/2014
9/30/2014
3/31/2015
6/30/2015
9/30/2015
Source: CoStar Portfolio Strategy As of 15Q4
0
10
20
30
40
50
60
70
0%
10%
20%
30%
40%
50%
60%
13Q1 13Q2 13Q3 13Q4 14Q1 14Q2 14Q3 14Q4 15Q1 15Q2 15Q3 15Q4 16Q1 16Q2
Quarterly Deliveries 2013 Vintage 2014 Vintage 2015 Vintage
Vacancy Rate Units Delivered (000s)

page 38
Apartment New Construction Leasing Is Slowing
2015 Delivery Lease Up Trends By Region
Vacant Units
East
3/31/2015
6/30/2015
9/30/2015
South
3/31/2015
6/30/2015
9/30/2015
Midwest
3/31/2015
6/30/2015
9/30/2015
West
3/31/2015
6/30/2015
9/30/2015
15Q1
15Q2
Source: CoStar Portfolio Strategy As of 15Q4
20%
25%
30%
35%
40%
45%
50%
55%
60%
15Q1 15Q2 15Q3 15Q4
East South Midwest West
Vacancy Rate

page 39
Vacancies Show The Effect Of Construction
Unstabilized Vacancies By Star Rating Since 2007
4 & 5 Star3 StarSpread
9/30/200212/31/2002
3/31/20036/30/20039/30/2003
12/31/20033/31/20046/30/20049/30/2004
12/31/20043/31/20056/30/20059/30/2005
12/31/20053/31/20066/30/2006
Source: CoStar Portfolio Strategy As of 15Q4
3%
4%
5%
6%
7%
8%
9%
10%
07 08 09 10 11 12 13 14 15
4 & 5 Star Vacancy 3 Star Vacancy 1 & 2 Star Vacancy
Vacancy Rate

page 40
Higher Vacancies In The Core
Vacancy By Submarket District Type
Stock
Vacancy
ATLA
ATLA
ATLA
ATLA
ATLA
ATLA
ATLA
ATLA
ATLA
ATLA
ATLA
ATLA
ATLA
ATLA
ATLA
ATLA
Source: CoStar Portfolio Strategy As of 15Q4
0%
2%
4%
6%
8%
10%
12%
14%
3.0%
3.5%
4.0%
4.5%
5.0%
5.5%
CBD SecondaryCore
Urban PrimeSuburban
Suburban Rural
Vacancy % % UC of Inventory
Vacancy % UC of Inventory

page 41
Late Recovery Markets Showed Improved Fundamentals
Vacancy Change Past 12 Months
1
2
3
4
5
6
7
8
9
10
11
12
13
14
15
16
17
18
19
20
21
22
23
24
25
26
27
Source: CoStar Portfolio Strategy As of 15Q4
(150)
(100)
(50)
0
50
100
150T
am
pa
Las V
egas
Ho
nolu
luN
orf
olk
India
na
polis
Washin
gto
n, D
CS
an
An
tonio
Jacksonvill
eC
incin
nati
Austin
Sain
t Louis
Pho
enix
Ra
leig
hR
ich
mond
Mem
phis
De
troit
Inla
nd E
mpire
Da
llas -
FW
Atlan
taS
tam
ford
Sacra
mento
Ch
icago
Phila
delp
hia
Ch
arlotte
Cle
ve
land
Fort
Laud
erd
ale
Co
lum
bus O
HN
ort
hern
NJ
Baltim
ore
Los A
ngele
sS
an
Die
go
Ora
ng
e C
ounty
Sea
ttle
Orlando
San
Fra
ncis
co
Ne
w O
rlean
sP
ort
land,
OR
Ho
usto
nE
ast
Bay
Min
nea
polis
Okla
hom
a C
ity
Long I
sla
nd
Pitts
burg
hS
alt L
ake C
ity
Ne
w Y
ork
Kan
sas C
ity
Na
sh
vill
eD
enver
Milw
aukee
San
Jose
Mia
mi
Bosto
nH
art
ford
Palm
Be
ach
South East Midwest West
One Year Vacancy Change (BPS)
page 42
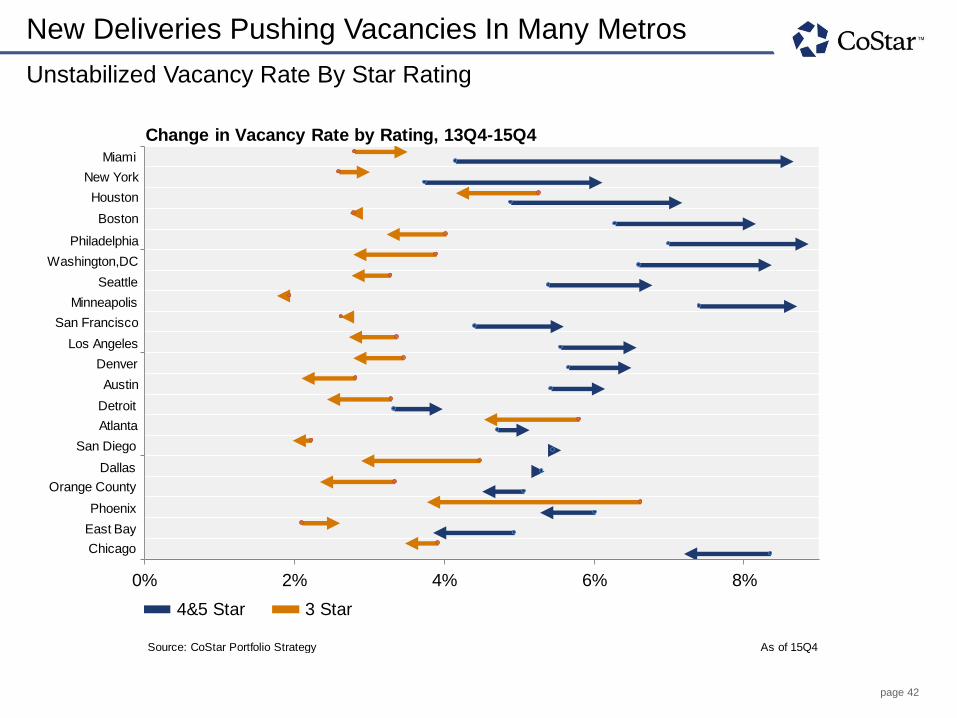
New Deliveries Pushing Vacancies In Many Metros
Unstabilized Vacancy Rate By Star Rating
14
15
16
17
18
19
20
Source: CoStar Portfolio Strategy As of 15Q4
0% 2% 4% 6% 8%
4&5 Star 3 Star
San Diego
Miami
East Bay
Chicago
Phoenix
Detroit
Orange County
Dallas
Change in Vacancy Rate by Rating, 13Q4-15Q4
New York
Houston
Boston
Philadelphia
Washington,DC
Seattle
Minneapolis
San Francisco
Los Angeles
Denver
Austin
Atlanta

page 43
Y/Y Vacancy Change Winners & Losers
Nominal Change In Vacancy By Submarket
151413121110
987654321
Source: CoStar Portfolio Strategy As of 15Q4
*Minimum 5,000 Units
3.0%
3.0%
3.0%
3.0%
3.3%
3.4%
3.7%
3.7%
3.7%
3.9%
4.2%
5.4%
5.5%
6.5%
9.1%
0% 2% 4% 6% 8% 10%
LASV -Enterprise/South Paradise
WASH - Capitol Heights/Largo
WASH - Downtown
WASH - Reston/Herndon Corridor
RICH -Chesterfield County
HOUS -Outlying Montgomery County
ATLA -Clayton County
INDI -Fishers/Noblesville
SANJ -Cupertino
NORT -Southeast Morris County
WASH - Old Town/Potomac Yards
WASH - Silver Spring
WASH - Southwest/Navy Yard
WASH - H Street/NoMa
WASH - Ballston
Change In Vacancy Y/Y
3.5%
3.6%
3.6%
3.8%
3.9%
4.0%
4.0%
4.1%
4.1%
4.1%
4.1%
4.9%
5.8%
8.0%
10.8%
0% 3% 6% 9% 12%15%
CHIC -Near North Suburban Cook
NEWY -Jersey City Waterfront
BOST -Fenway/Mission Hill
OKLA -Moore
HOUS -Cinco Ranch
MINN -Downtown Minneapolis
BALT -Harford County
SANF -Sunset/Lakeshore
HOUS -Heights
NASH -Williamson County
BOST -Everett/Malden/Medford/Melrose
PORT -Downtown Portland
BOST -Harvard/Central/Kendall/Cambridge
CHAR -South End
PHIL -University City
Best Vacancy Decrease Worst Vacancy Increase

page 44
Apartment Rent Trends

page 45
CoStar Apartment Rents in Buckhead
PropertyID
4803472
4803472
4803472
4803472
4803472
4803472
4803472
9409478
9409478
9409478
9409478
9409478
9409478
4803472
4803472
4803472
9409478
9409478
9409478
9409478
9409478
9409478
4803472
4803472
4803472
9409478
9409478
9409478
4803472
As of Jan 2016
$500
$1,000
$1,500
$2,000
$2,500
$3,000
$3,500
2011 2012 2013 2014 2015 2016
CoStar Reseach (n=3,768)
Asking Rent

page 46
CoStar Apartment Rents in Buckhead
PropertyID
4803472
4803472
4803472
4803472
4803472
4803472
4803472
9409478
9409478
9409478
9409478
9409478
9409478
4803472
4803472
4803472
9409478
9409478
9409478
9409478
9409478
9409478
4803472
4803472
4803472
9409478
9409478
9409478
4803472
As of Jan 2016
$500
$1,000
$1,500
$2,000
$2,500
$3,000
$3,500
2011 2012 2013 2014 2015 2016
CoStar Reseach (n=3,768) Community Caller (n=561)
Asking Rent

page 47
CoStar Apartment Rents in Buckhead
PropertyID
4803472
4803472
4803472
4803472
4803472
4803472
4803472
9409478
9409478
9409478
9409478
9409478
9409478
4803472
4803472
4803472
9409478
9409478
9409478
9409478
9409478
9409478
4803472
4803472
4803472
9409478
9409478
9409478
4803472
As of Jan 2016
$500
$1,000
$1,500
$2,000
$2,500
$3,000
$3,500
2011 2012 2013 2014 2015 2016
CoStar Reseach (n=3,768) Community Caller (n=561)
Automated Data Collection (n=7,542)
Asking Rent

page 48
CoStar Apartment Rents in Buckhead
PropertyID
4803472
4803472
4803472
4803472
4803472
4803472
4803472
9409478
9409478
9409478
9409478
9409478
9409478
4803472
4803472
4803472
9409478
9409478
9409478
9409478
9409478
9409478
4803472
4803472
4803472
9409478
9409478
9409478
4803472
As of Jan 2016
$500
$1,000
$1,500
$2,000
$2,500
$3,000
$3,500
2011 2012 2013 2014 2015 2016
CoStar Reseach (n=3,768) Community Caller (n=561)
Automated Data Collection (n=7,542) Apartments.com Feed (n=51,872)
Observed Asking Rent

page 49
7,375 1-BR Rent Observations for a Single Building
Asset in Greater Atlanta
PropertyID
8422582
8422582
8422582
8422582
8422582
8422582
8422582
8422582
8422582
8422582
8422582
8422582
8422582
8422582
8422582
8422582
8422582
8422582
8422582
8422582
8422582
8422582
8422582
8422582
8422582
8422582
8422582
8422582
8422582
8422582
Source: CoStar As of January 2016
$500
$1,000
$1,500
$2,000
$2,500
$3,000
$3,500
Jan-15 Feb-15 Mar-15 Apr-15 May-15 Jun-15 Jul-15 Aug-15 Sep-15 Oct-15 Nov-15 Dec-15 Jan-16
Asking Rent: 1-BR Units for Asset in Greater Atlanta

page 50
A Volatile Year for Apartment Rents
CoStar Same-Store Chain-Linked Apartment Rents
1/31/2011
2/28/2011
3/31/2011
4/30/2011
5/31/2011
6/30/2011
7/31/2011
8/31/2011
9/30/2011
10/31/2011
11/30/2011
12/31/2011
1/31/2012
2/29/2012
3/31/2012
4/30/2012
5/31/2012
6/30/2012
7/31/2012
8/31/2012
9/30/2012
10/31/2012
11/30/2012
12/31/2012
1/31/2013
2/28/2013
3/31/2013
4/30/2013
5/31/2013
6/30/2013
7/31/2013
Source: CoStar As of Jan. 2016
$0.95
$1.00
$1.05
$1.10
$1.15
$1.20
$1.25
(10%)
(5%)
0%
5%
10%
15%
2011 2012 2013 2014 2015 2016
Annualized Monthly Rent Change National 1-BR, 1-BA Rent Equivalent
Monthly Rent Change (Annualized) National 1-BR, 1-BA Equivalent Rent/SF

page 51
Strongest Rent Growth in 2015
Weighted
By Market
31
51
43
33
19
27
1
39
5
36
32
29
12
44
2
37
26
14
58
42
50
6
35
38
15
Source: CoStar As of Jan. 2016
15.1%
11.7%11.0% 10.6% 10.2% 9.9%
9.4% 9.3% 9.0% 8.8% 8.7% 8.6% 8.4% 8.4%7.6% 7.5%
0%
2%
4%
6%
8%
10%
12%
14%
16%
18%
20%P
ort
land
East
Bay/O
akla
nd
Na
shvill
e
Sacra
mento
Long I
sla
nd (
New
York
)
Orlando
Atlan
ta
Tam
pa/S
t P
ete
rsburg
Ch
arlotte
Sea
ttle
/Puge
t S
ound
Ra
leig
h/D
urh
am
Pho
enix
De
nver
Las V
egas
Austin
Sou
th F
lorida
2015 Rent Growth

page 52
Strongest Rent Growth in 2015
Weighted
By Market
31
51
43
33
19
27
1
39
5
36
32
29
12
44
2
37
26
14
58
42
50
6
35
38
15
Source: CoStar As of Jan. 2016
15.1%
11.7%11.0% 10.6% 10.2% 9.9%
9.4% 9.3% 9.0% 8.8% 8.7% 8.6% 8.4% 8.4%7.6% 7.5%
0%
2%
4%
6%
8%
10%
12%
14%
16%
18%
20%P
ort
land
East
Bay/O
akla
nd
Na
shvill
e
Sacra
mento
Long I
sla
nd (
New
York
)
Orlando
Atlan
ta
Tam
pa/S
t P
ete
rsburg
Ch
arlotte
Sea
ttle
/Puge
t S
ound
Ra
leig
h/D
urh
am
Pho
enix
De
nver
Las V
egas
Austin
Sou
th F
lorida
2015 Rent Growth

page 53
Strongest Rent Growth in 2015
Weighted
By Market
31
51
43
33
19
27
1
39
5
36
32
29
12
44
2
37
26
14
58
42
50
6
35
38
15
Source: CoStar As of Jan. 2016
15.1%
11.7%11.0% 10.6% 10.2% 9.9%
9.4% 9.3% 9.0% 8.8% 8.7% 8.6% 8.4% 8.4%7.6% 7.5%
0%
2%
4%
6%
8%
10%
12%
14%
16%
18%
20%P
ort
land
East
Bay/O
akla
nd
Na
shvill
e
Sacra
mento
Long I
sla
nd (
New
York
)
Orlando
Atlan
ta
Tam
pa/S
t P
ete
rsburg
Ch
arlotte
Sea
ttle
/Puge
t S
ound
Ra
leig
h/D
urh
am
Pho
enix
De
nver
Las V
egas
Austin
Sou
th F
lorida
2015 Rent Growth

page 54
Weakest Rent Growth in 2015
Weighted
By Market
31
51
43
33
19
27
1
39
5
36
32
29
12
44
2
37
26
14
58
42
50
6
35
38
15
Source: CoStar As of Jan. 2016
5.9% 5.9% 5.8% 5.7% 5.6% 5.4% 5.4% 5.4% 5.2% 5.2% 4.9% 4.5% 4.5% 4.0%3.3%
2.4%
0%
2%
4%
6%
8%
10%
12%
14%
16%
18%
20%O
rang
e C
ounty
(C
alif
orn
ia)
Ho
usto
n
Salt L
ake C
ity
Mem
phis
San
An
tonio
Ch
icago
San
Fra
ncis
co
St. L
ouis
India
na
polis
Baltim
ore
Phila
delp
hia
Washin
gto
n, D
C
No
rthern
New
Jers
ey
Westc
heste
r/S
o C
onn
ecticut
Ha
rtfo
rd
Pitts
burg
h
2015 Rent Growth

page 55
Weakest Rent Growth in 2015
Weighted
By Market
31
51
43
33
19
27
1
39
5
36
32
29
12
44
2
37
26
14
58
42
50
6
35
38
15
Source: CoStar As of Jan. 2016
5.9% 5.9% 5.8% 5.7% 5.6% 5.4% 5.4% 5.4% 5.2% 5.2% 4.9% 4.5% 4.5% 4.0%3.3%
2.4%
0%
2%
4%
6%
8%
10%
12%
14%
16%
18%
20%O
rang
e C
ounty
(C
alif
orn
ia)
Ho
usto
n
Salt L
ake C
ity
Mem
phis
San
An
tonio
Ch
icago
San
Fra
ncis
co
St. L
ouis
India
na
polis
Baltim
ore
Phila
delp
hia
Washin
gto
n, D
C
No
rthern
New
Jers
ey
Westc
heste
r/S
o C
onn
ecticut
Ha
rtfo
rd
Pitts
burg
h
2015 Rent Growth

page 56
Weakest Rent Growth in 2015
Weighted
By Market
31
51
43
33
19
27
1
39
5
36
32
29
12
44
2
37
26
14
58
42
50
6
35
38
15
Source: CoStar As of Jan. 2016
5.9% 5.9% 5.8% 5.7% 5.6% 5.4% 5.4% 5.4% 5.2% 5.2% 4.9% 4.5% 4.5% 4.0%3.3%
2.4%
0%
2%
4%
6%
8%
10%
12%
14%
16%
18%
20%O
rang
e C
ounty
(C
alif
orn
ia)
Ho
usto
n
Salt L
ake C
ity
Mem
phis
San
An
tonio
Ch
icago
San
Fra
ncis
co
St. L
ouis
India
na
polis
Baltim
ore
Phila
delp
hia
Washin
gto
n, D
C
No
rthern
New
Jers
ey
Westc
heste
r/S
o C
onn
ecticut
Ha
rtfo
rd
Pitts
burg
h
2015 Rent Growth

page 57
Weakest Rent Growth in 2015
Weighted
By Market
31
51
43
33
19
27
1
39
5
36
32
29
12
44
2
37
26
14
58
42
50
6
35
38
15
Source: CoStar As of Jan. 2016
5.9% 5.9% 5.8% 5.7% 5.6% 5.4% 5.4% 5.4% 5.2% 5.2% 4.9% 4.5% 4.5% 4.0%3.3%
2.4%
0%
2%
4%
6%
8%
10%
12%
14%
16%
18%
20%O
rang
e C
ounty
(C
alif
orn
ia)
Ho
usto
n
Salt L
ake C
ity
Mem
phis
San
An
tonio
Ch
icago
San
Fra
ncis
co
St. L
ouis
India
na
polis
Baltim
ore
Phila
delp
hia
Washin
gto
n, D
C
No
rthern
New
Jers
ey
Westc
heste
r/S
o C
onn
ecticut
Ha
rtfo
rd
Pitts
burg
h
2015 Rent Growth

page 58
Capital Markets

page 59
Property Sales Up 20%
Sales Volume By Property Type
1
21345
12345
Source: CoStar Portfolio Strategy As of 15Q4
18% 18%
7%
37%
45%
0%
5%
10%
15%
20%
25%
30%
35%
40%
45%
50%
$0
$20
$40
$60
$80
$100
$120
$140
$160
Multi-Family Office Retail Industrial Hospitality
2015 U.S. Sales Volume (Billions) 2015 vs 2014 %Change

page 60
Volume Remains High, But Will Rate Of Growth Moderate?
Top 210 Markets Annual Apartment Sales Volume
2004
2005
2006
2007
2008
2009
2010
2011
2012
2013
2014
2015
2016
Source: Costar Portfolio Strategy As of 15Q4
0%
10%
20%
30%
40%
50%
60%
70%
80%
90%
$0
$20
$40
$60
$80
$100
$120
$140
2005 2006 2007 2008 2009 2010 2011 2012 2013 2014 2015
Sales Volume Annual Change In Volume
Total Sales (Billions) Y/Y Change In Volume
page 61
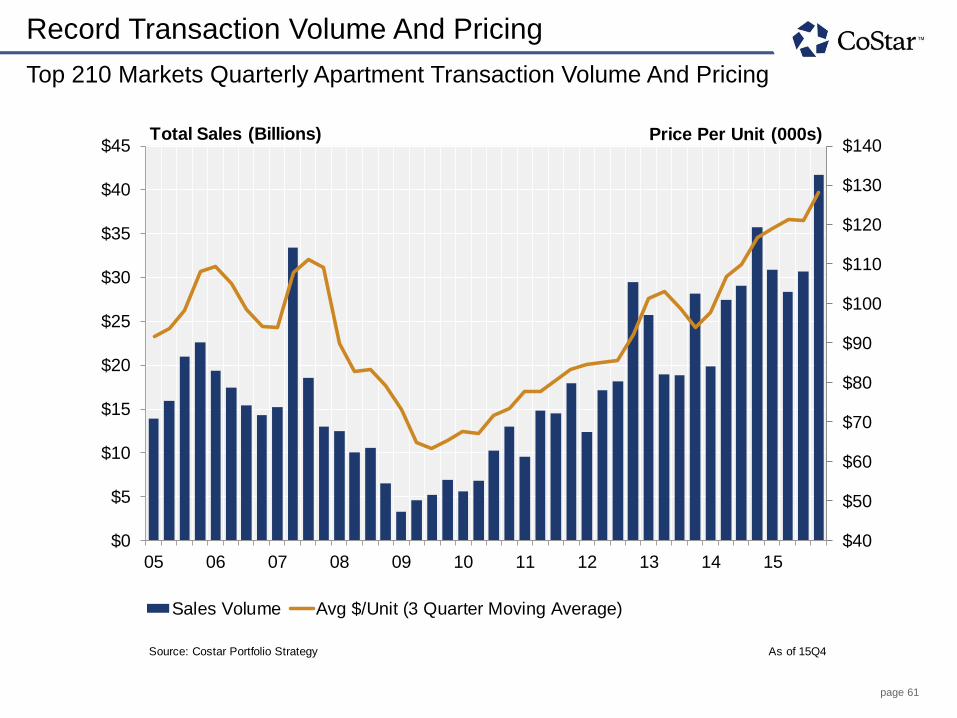
Record Transaction Volume And Pricing
Top 210 Markets Quarterly Apartment Transaction Volume And Pricing
04
04
04
05
05
05
05
06
06
06
06
07
07
07
07
08
08
08
08
09
09
09
09
10
10
10
10
11
Source: Costar Portfolio Strategy As of 15Q4
$40
$50
$60
$70
$80
$90
$100
$110
$120
$130
$140
$0
$5
$10
$15
$20
$25
$30
$35
$40
$45
05 06 07 08 09 10 11 12 13 14 15
Sales Volume Avg $/Unit (3 Quarter Moving Average)
Total Sales (Billions) Price Per Unit (000s)
page 62
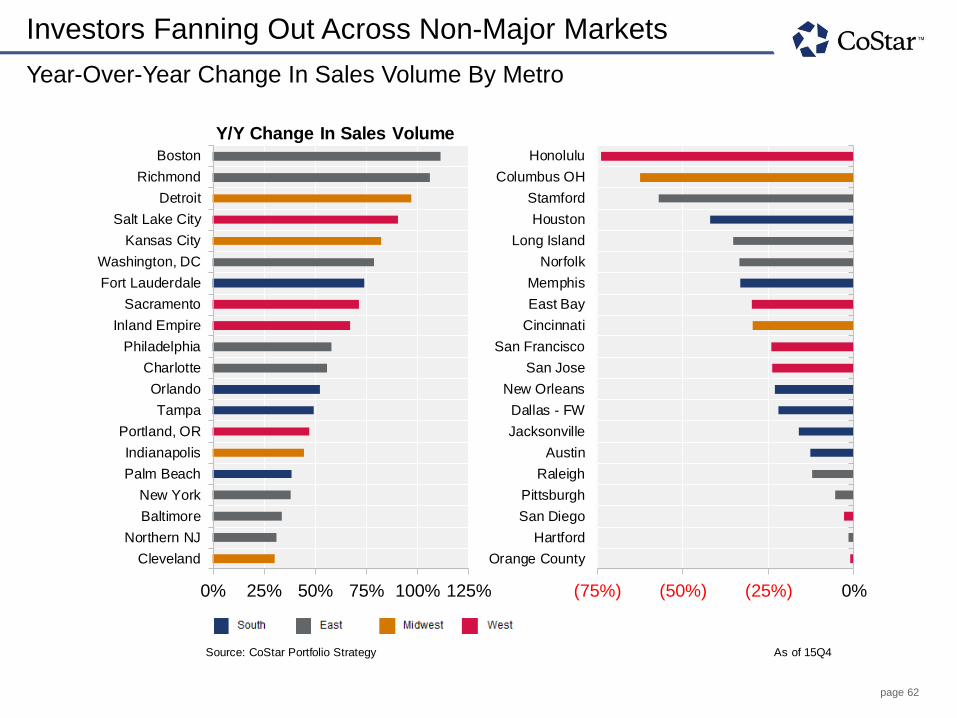
Investors Fanning Out Across Non-Major Markets
Year-Over-Year Change In Sales Volume By Metro
20
19
18
17
16
15
14
13
12
11
10
9
8
7
6
5
4
3
2
1
Source: CoStar Portfolio Strategy As of 15Q4
0% 25% 50% 75% 100% 125%
Cleveland
Northern NJ
Baltimore
New York
Palm Beach
Indianapolis
Portland, OR
Tampa
Orlando
Charlotte
Philadelphia
Inland Empire
Sacramento
Fort Lauderdale
Washington, DC
Kansas City
Salt Lake City
Detroit
Richmond
Boston
(75%) (50%) (25%) 0%
Orange County
Hartford
San Diego
Pittsburgh
Raleigh
Austin
Jacksonville
Dallas - FW
New Orleans
San Jose
San Francisco
Cincinnati
East Bay
Memphis
Norfolk
Long Island
Houston
Stamford
Columbus OH
Honolulu
Y/Y Change In Sales Volume

page 63
Cap Rates, After Jackson Pollack
Institutional Grade Transaction Cap Rates
36526.00
42369.00
Source: CoStar Portfolio Strategy. Cap rates are shaded by distance from trailing average to identify trend.
Includes 2+ star-rated apartment assets selling for at least $5 million.
2%
3%
4%
5%
6%
7%
8%
9%
10%
11%
12%
00 01 02 03 04 05 06 07 08 09 10 11 12 13 14 15
Transaction Cap Rate
Apartment Transaction Cap Rate
page 64
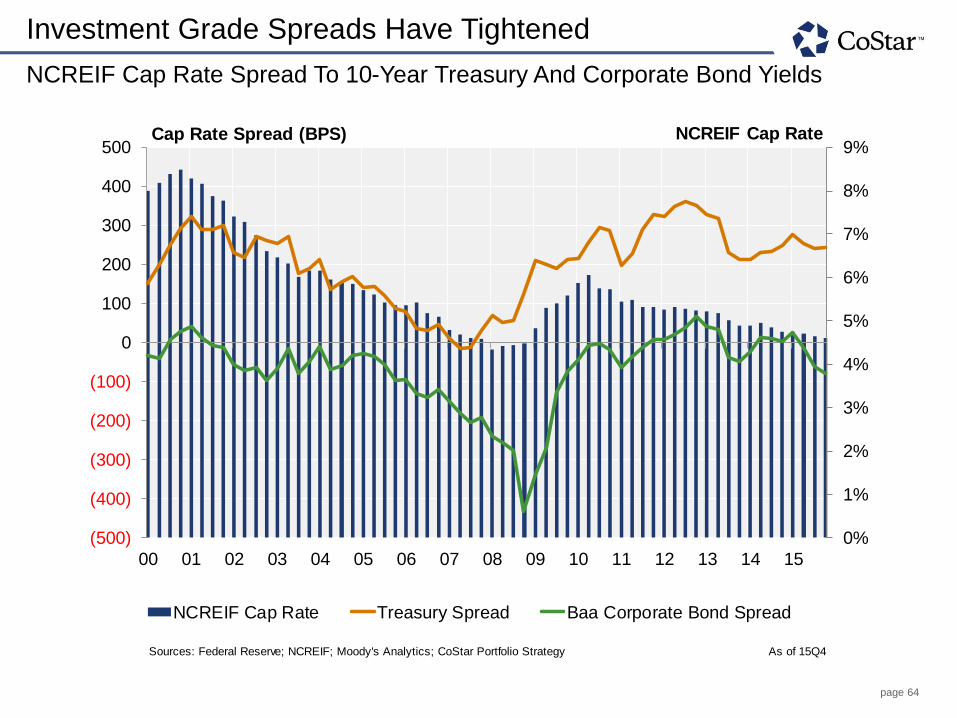
Investment Grade Spreads Have Tightened
NCREIF Cap Rate Spread To 10-Year Treasury And Corporate Bond Yields
Sources: Federal Reserve; NCREIF; Moody's Analytics; CoStar Portfolio Strategy As of 15Q4
0%
1%
2%
3%
4%
5%
6%
7%
8%
9%
(500)
(400)
(300)
(200)
(100)
0
100
200
300
400
500
00 01 02 03 04 05 06 07 08 09 10 11 12 13 14 15
NCREIF Cap Rate Treasury Spread Baa Corporate Bond Spread
Cap Rate Spread (BPS) NCREIF Cap Rate

page 65
California Cap Rates Among The Country’s Lowest
Average Cap Rates By Metro
1
2
3
4
5
6
7
8
9
10
11
12
13
14
15
16
17
18
19
20
21
22
23
24
25
26
Source: CoStar Portfolio Strategy As of 15Q4
Average Cap Rate
4%
5%
6%
7%
8%
9%
10%
11%
12%
13%
14%S
an
Fra
ncis
co
San
Jose
Ho
nolu
luO
rang
e C
ounty
Los A
ngele
sS
an
Die
go
East
Bay
Ne
w Y
ork
Sea
ttle
Ra
leig
hP
ort
land,
OR
Austin
Inla
nd E
mpire
Washin
gto
n, D
CLong I
sla
nd
De
nver
Sacra
mento
Mia
mi
Atlan
taJacksonvill
eN
ashvill
eC
harlotte
Orlando
Baltim
ore
Da
llas-
FW
San
An
tonio
Fort
Laud
erd
ale
Bosto
nS
alt L
ake C
ity
Pho
enix
Tam
pa
Palm
Be
ach
Phila
delp
hia
Las V
egas
Min
nea
polis
No
rthern
NJ\
Sta
mfo
rdM
ilwaukee
Co
lum
bus O
HN
orf
olk
Kan
sas C
ity
Ch
icago
Ho
usto
nR
ichm
ond
De
troit
Sain
t Louis
India
na
polis
Ha
rtfo
rdN
ew
Orlean
sO
kla
hom
a C
ity
Mem
phis
Pitts
burg
hC
incin
nati
Cle
vela
nd
Recession High Prerecession Low 2015 Average
page 66
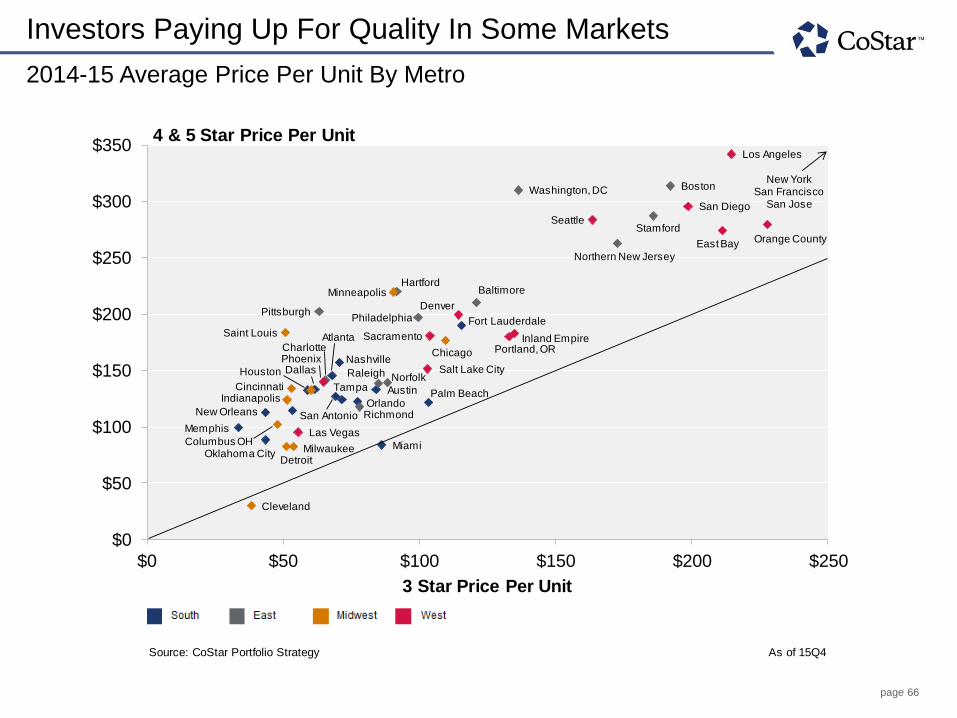
Investors Paying Up For Quality In Some Markets
2014-15 Average Price Per Unit By Metro
Atlanta
Austin
Baltimore
Boston
Charlotte
Chicago
Cincinnati
Cleveland
Denver
Detroit
East Bay
Hartford
Honolulu
Houston
Memphis
Miami
Milwaukee
Nashville
Source: CoStar Portfolio Strategy As of 15Q4
Atlanta
Austin
Baltimore
Boston
CharlotteChicago
Cincinnati
Cleveland
Columbus OH
Dallas
Denver
Detroit
East Bay
Fort Lauderdale
Hartford
Houston
Indianapolis
Inland Empire
Las Vegas
Los Angeles
Memphis
MiamiMilwaukee
Minneapolis
Nashville
New Orleans
Norfolk
Northern New Jersey
Oklahoma City
Orange County
OrlandoPalm Beach
Philadelphia
Phoenix
Pittsburgh
Portland, OR
Raleigh
Richmond
SacramentoSaint Louis
Salt Lake City
San Antonio
San Diego
SeattleStamford
Tampa
Washington, DC
$0
$50
$100
$150
$200
$250
$300
$350
$0 $50 $100 $150 $200 $250
3 Star Price Per Unit
4 & 5 Star Price Per Unit
New YorkSan Francisco
San Jose

page 67
Foreign Buyers Becoming More Active
Foreign Sales Volume As A Share Of Total, 2005-15
2000
2001
2002
2003
2004
2005
2006
2007
2008
2009
2010
2011
2012
2013
2014
2015
Source: CoStar Portfolio Strategy As of 15Q4
0%
1%
2%
3%
4%
5%
6%
7%
$0
$20
$40
$60
$80
$100
$120
$140
$160
2005 2006 2007 2008 2009 2010 2011 2012 2013 2014 2015
Non Foreign Foreign Foreign Sales As A % Of Total
Sales Volume (Billions) Percent Foreign Sales Volume

page 68
Foreign Buyers Have An Empire State Of Mind
Foreign Sales Volume By Metro, 2014-15
1
2
3
4
5
6
7
8
9
10
11
12
13
14
15
16
17
18
19
20
Source: CoStar Portfolio Strategy As of 15Q4
0%
2%
4%
6%
8%
10%
12%
14%
16%
$0.0
$0.5
$1.0
$1.5
$2.0
$2.5
$3.0
$3.5
Ne
w Y
ork
Washin
gto
n, D
C
Da
llas -
FW
Atlan
ta
San
Fra
ncis
co
Pho
enix
Ho
usto
n
Orlando
Sou
th F
lorida
Los A
ngele
s
Tam
pa
Bosto
n
Sea
ttle
De
nver
Austin
2014-15 Foreign Sales Volume Foreign Sales As A % Of Total
Sales Volume (Billions) Percent Foreign Sales Volume

page 69
Our Neighbors To The North Have Been Very Active
Foreign Investment By Region And Country, 2014-15
Region
South America
Oceania
Europe
Europe
Middle East
South America
North America
North America
North America
Asia
Europe
Europe
Europe
Europe
Asia
Asia
Asia
Europe
Middle East
Europe
Asia
Asia
Asia
Middle East
Europe
Asia
North America
Europe
Oceania
Europe
Asia
Source: CoStar As of 15Q4
Oceania (0.9%)
Middle East
(14.0%)
North America (54.3%)
Asia, (7.7%)
Europe (23.1%)
Canada (45.5%)
Israel (8.5%)
Switzerland (7.5%)
Germany (6.0%)
China (5.5%)
United Kingdom
(5.2%)
Sweden (5.2%)
Bahrain (4.7%)
Kuwait (3.3%)
France (2.3%)Other (6.3%)
By Region By Country

page 70
2015 Quarterly Volume Declines In High Supply Areas
Sales Volume And Price Per Unit In 25 Most Supply-Heavy Submarkets*
10
10
10
10
11
11
11
11
12
12
12
12
13
13
13
13
14
14
14
14
15
15
15
15
Source: CoStar Portfolio Strategy As of 15Q4
*Includes submarkets with the most units delivered (2012-15)
$0
$50
$100
$150
$200
$250
$0.0
$0.5
$1.0
$1.5
$2.0
$2.5
$3.0
$3.5
10 11 12 13 14 15
Sales Volume Price Per Unit
Sales Volume (Billions) Price Per Unit (000s)

page 71
Average Price Per Unit In 25 Submarkets Most Supply-Heavy Submarkets*
Source: CoStar Portfolio Strategy As of 15Q4
*Includes submarkets with the most units delivered (2012-15)
(60%)
(40%)
(20%)
0%
20%
40%
60%
80%
100%
120%
140%
$0
$100
$200
$300
$400
$500
$600
$700H
ou
sto
n -
Ne
art
ow
n/R
ive
r O
aks
Chic
ag
o -
Do
wn
tow
n C
hic
ag
o
Den
ve
r -
Dw
tn/C
he
rry C
ree
k
Sa
n J
ose
- N
ort
h S
an
Jo
se
Dallas -
Oa
k L
aw
n/P
ark
Citie
s
Ora
nge
Co
un
ty -
Irv
ine
Dallas -
Fa
rme
rs B
ranch
/Add
iso
n
Atla
nta
- B
uckh
ea
d
Hou
sto
n -
No
rth
west
Ho
usto
n
Sa
n A
nto
nio
- N
ort
hw
est
Sid
e
Au
stin -
So
uth
Atla
nta
- D
ow
nto
wn
/Mid
tow
n
Dallas -
Ea
st
Da
llas
Nash
vill
e -
We
st
En
d/C
BD
Lo
s A
ng
ele
s -
Do
wn
tow
n L
A
Se
att
le -
CB
D
New
Yo
rk -
LI
City/H
un
ters
Poin
t
Hou
sto
n -
Wo
od
lan
ds
Sa
n A
nto
nio
- F
ar
We
st
Se
att
le -
La
ke
Un
ion
Wa
sh
ing
ton
, D
C -
H S
t/N
oM
a
Sa
n A
nto
nio
- F
ar
No
rth
Ce
ntr
al
New
Yo
rk -
W'b
urg
/Gre
en
poin
t
Dallas -
Fri
sco
/Pro
spe
r
Ka
nsa
s C
ity -
Joh
nso
n C
nty
KS
2012-14 Average $/Unit 2015 Average $/Unit % Change In Pricing
Price Per Unit (000s) Change In Pricing

page 72
Not Enough Buyers To Go Around?
Buildings Aged Two Years Or Less, Price Per Unit And Total Volume
Source: CoStar Portfolio Strategy As of 15Q4
$0
$50
$100
$150
$200
$250
$0
$2
$4
$6
$8
$10
$12
$14
2005 2006 2007 2008 2009 2010 2011 2012 2013 2014 2015
Sales Volume Average Price Per Unit
Total Sales ($ Billions) Price Per Unit (000s)

page 73
Select Top Multifamily Deals – 4Q 2015
Home Properties Merger with Lone Star Various States Home Properties Inc. sold the 116 community, 39,465 unit apartment portfolio to Lone Star Funds for $7.6 Billion or roughly $192K/unit. (price included all operations and debt assumption).
Peter Cooper Village/Stuyvesant Town New York, NY CW Capital LLC sold the 2 community, 11,243-unit portfolio to The Blackstone Group and Ivanhoe Cambridge for $$5.4 Billion or $485K/unit. This portfolio was sold at a 4% cap rate.
Greystar Portfolio Various States Greystar Investment Group, LLC sold this 32 community, 10,399 unit portfolio to The Blackstone Group LP for $2 Billion or $192K/unit. Greystar will continue to manage these properties.
350 Sharon Park Menlo Park, CA Essex Property Trust, Inc. sold this 296 unit complex for $245 million or $827K/Unit The cap was 5.2%.
Blackstone Portfolio FL, CA Phoenix Realty Group sold the 16 community 3800 unit portfolio to The Blackstone Group LP for $570 million or $150K/Unit. This was a recapitalization of a portfolio controlled mostly by Phoenix Realty Group.
Starwood Portfolio Tampa Bay, FL The Wilson Company sold 23 communities totaling 7,870 units to Starwood Capital Group for $351 million..

page 74
© Copyright 2016 CoStar Realty Information, Inc. No reproduction or distribution without permission. The following information includes projections and analyses that are based on various assumptions by CoStar
concerning future events and circumstances, as well as historical and current data maintained in CoStar’s database, obtained from public sources or provided by proprietary sources. Actual results may vary
materially from the projections presented. The information in this presentation speaks only as of the date(s) referenced and is provided ‘as is’. CoStar expressly disclaims any guarantees, representations or
warranties of any kind, including those of merchantability and fitness for a particular purpose. You should not construe any of the information herein as investment, tax, accounting or legal advice.