State of the State - media.lasvegassun.com · The American Gaming Association ... This year’s...
46
Transcript of State of the State - media.lasvegassun.com · The American Gaming Association ... This year’s...

III2009 AGA Survey of CASIno entertAInment
State of the StateSPreSIdent’S meSSAGe
The American Gaming Association (AGA) is proud to present the 2009 State of the States: The AGA Survey of Casino Entertainment.
As it has in recent years, State of the States gives a comprehensive report of the contributions the U.S. commercial casino industry makes to the communities where it operates. The report includes national and state-by-state information on employment, wages, tax contributions and gaming revenues in the 12 commercial casino states and similar data for the still-expanding racetrack casino sector.
This year’s report reflects the impact of the recession and the accompanying drop in consumer spending on the commercial casino industry. As our nation grapples with these challenging economic times, the industry’s ongoing contributions are more important than ever. The commercial casino industry continues to be an important provider of jobs and direct gaming taxes, helping states, communities and families weather the storm.
This year’s State of the States report includes a number of new features to give you a more in-depth look at the commercial casino industry. For the first time, this year’s report features information about the economic impacts of the gaming equipment manufacturing sector, which continues to exhibit growth despite the challenging economic environment. Through a partnership with the Association of Gaming Equipment Manufacturers (AGEM), State of the States will annually present economic output, employment and wage data for this important, but all too often overlooked, part of the gaming industry.
The commercial casino industry always has been an important part of the overall U.S. travel and tourism industry, and many experts agree that promotion of the travel industry can go a long way toward helping the national economy rebound. This year’s featured survey data reveal just how important both the general public and top-level travel and tourism professionals — those who know the industry best — think gaming is to U.S. tourism. This year’s polling also addresses the effect that recent attacks on business travel by politicians and the media have had on the travel and casino industries.
In addition to travel and tourism topics, this year’s public opinion polling details the continued importance of non-gaming amenities, attitudes about responsible gaming and public perceptions about the gaming entertainment industry. This year’s survey also includes information on poker, a detailed chart of various forms of gaming across the country and a pocket guide of key facts.
With the State of the States report, it is always our aim to produce a comprehensive information resource detailing the value of the commercial casino industry to the states and communities where we operate and the national economy as a whole. We hope the report achieves that goal again this year and that it will serve as a valuable reference tool for you throughout the year.
Frank J. Fahrenkopf, Jr.President and CEO American Gaming Association

Iv 2009 AGA Survey of CASIno entertAInment
State of the StateS State of the StateSnoteSStatistical NotesBecause the American Gaming Association (AGA) represents the commercial casino industry, this survey strives to give the reader a detailed picture of that particular segment of the gaming industry. For the purposes of this survey, we have defined “commercial casinos” to include private sector (i.e., nongovernmental) land-based, riverboat and dockside casinos as well as racetrack casinos in Indiana, Iowa, Louisiana and Pennsylvania.
As in 2008, Native American casinos are noted only under the “Casino Locations by Category” section. The map includes Class III locations, which are compacted (state-negotiated), Las Vegas-style casinos, as well as Class II locations, which are noncompacted casinos offering bingo and/or electronic bingo devices.
Information on racetrack casinos’ operations, which are hybrids of either casinos or lotteries and pari-mutuel facilities, are documented separately in the “Spotlight on Racetrack Casinos” and “State-by-State Economic Impact: Racetrack Casinos” sections in order to provide a more complete picture of the overall economic contributions of this important industry sector. For Indiana, Iowa, Louisiana and Pennsylvania, where gaming operations include both commercial casinos and racetrack casinos, statistics from both types of facility are included in overall commercial casino figures for the state.
In the “State-by-State Economic Impact: Racetrack Casinos” section, it should be noted that, in most cases, effective tax rates are higher at pari-mutuel facilities where gaming machines are operated by the state lottery versus the more traditional regulatory structure in which gaming licensees are the owners and operators of gaming machines. In the case of the former, the gaming machines are called video lottery terminals (VLTs), and the lottery commission takes in all revenues before making distributions to stakeholders such as track owners, breeders and others. States that operate in this manner include Delaware, New York, Rhode Island and West Virginia. Eight other states — Florida, Indiana, Iowa, Louisiana, Maine, New Mexico, Oklahoma and Pennsylvania — operate and tax their gaming machines at pari-mutuel facilities more similarly to traditional casino states.
That is, regulations allow operators to earn gross revenues before requiring those operators to pay out taxes and supplements to purses at the tracks, among other things. One exception is Maine, where the state levies a 1 percent tax on handle, the industry term for total amount wagered, before taxing net revenue as well. In the case of either regulatory environment, the data provided detailing the percentage of revenues retained by operators should in no way be interpreted as profit margin. These are revenues earned before paying other, non-gaming taxes, employee salaries as well as a host of other operating expenses.
With respect to findings reported from the survey conducted with travel industry professionals, it should be noted that a few states that do have gaming were not classified as such for the purposes of the study. For example, Texas, which technically has Class II tribal gaming, was classified as a non-gaming state because the “footprint” of the gaming industry there is very small relative to the state’s population. There were a handful of other tribal gaming states that were treated similarly after consultation with Indian gaming experts. Additionally, for the purposes of the study with travel industry professionals, readers should note that gaming is far from widespread in many of the states in which casinos are located. Maine, for example, has a single racetrack casino located in the city of Bangor and was considered a gaming state for the purposes of our research. The same holds true for states such as Rhode Island and Delaware, which have only two and three gaming facilities, respectively.
State visitation figures reported in the “Economic Impact” section will not equal the total visitor figure reported in the “Casino Visitation” section because most riverboat states have controlled access and, therefore, count individual visits (each time a patron enters a casino), while land-based casinos count total visitors (who may enter casinos multiple times during a single visit).
Unless otherwise noted, all statistics in this survey are for calendar year 2008.
Polling NotesFigures reported in the polling data may not add up to 100 percent because of rounding.

�2009 AGA Survey of CASIno entertAInment
State of the StateSContentSExEcutivE Summary ........................................................................................................................................... 2
NatioNal EcoNomic imPact of caSiNo ENtErtaiNmENt ......................................................................... 4 Spotlight on Racetrack Casinos ......................................................................................................................... 9
aGEm SPotliGht oN GamiNG EquiPmENt maNufacturErS .................................................................. 11
StatE-By-StatE EcoNomic imPact ................................................................................................................ 13 Commercial Casinos ......................................................................................................................................... 13 Colorado ..................................................................................................................................................... 14 Illinois .......................................................................................................................................................... 14 Indiana ........................................................................................................................................................ 15 Iowa ............................................................................................................................................................ 15 Louisiana .................................................................................................................................................... 16 Michigan ..................................................................................................................................................... 16 Mississippi .................................................................................................................................................. 17 Missouri ...................................................................................................................................................... 17 Nevada ....................................................................................................................................................... 18 New Jersey ................................................................................................................................................. 18 Pennsylvania .............................................................................................................................................. 19 South Dakota .............................................................................................................................................. 19 Racetrack Casinos ............................................................................................................................................ 20 Delaware .................................................................................................................................................... 20 Florida ......................................................................................................................................................... 20 Indiana ........................................................................................................................................................ 21 Iowa ............................................................................................................................................................ 21 Louisiana .................................................................................................................................................... 21 Maine .......................................................................................................................................................... 22 New Mexico ................................................................................................................................................ 22 New York..................................................................................................................................................... 22 Oklahoma ................................................................................................................................................... 23 Pennsylvania .............................................................................................................................................. 23 Rhode Island .............................................................................................................................................. 24 West Virginia ............................................................................................................................................... 24
SPEcial SEctioN: caSiNoS aNd thEir rolE iN u.S. touriSm ................................................................. 25
caSiNo viSitatioN .............................................................................................................................................. 33
SPotliGht oN PokEr ........................................................................................................................................ 34
caSiNoS aS ENtErtaiNmENt ........................................................................................................................... 35
cuStomErS’ attitudES aBout rESPoNSiBlE GamiNG ............................................................................ 36
amEricaN PErcEPtioNS of caSiNo ENtErtaiNmENt .............................................................................. 37
aPPENdix .............................................................................................................................................................. 39 Glossary of Gaming Terms ............................................................................................................................... 39 Index of Charts ................................................................................................................................................. 40 Methodology ..................................................................................................................................................... 41 Acknowledgements .......................................................................................................................................... 42
�2009 AGA Survey of CASIno entertAInment

2 2009 AGA Survey of CASIno entertAInment
State of the StateSexeCutIve SummAryNational Economic impact of casino EntertainmentWith its reduction in consumer spending and freezing credit markets, the recession that began in late 2007 made 2008 a challenging year for the commercial casino industry. While nationwide gross gaming revenues were still the second-highest they have ever been at $32.54 billion, they were 4.7 percent below 2007’s record level.
Results of a 2009 public opinion poll conducted by VP Communications, Inc. and national pollster Peter D. Hart bear out the fact that consumers are cutting back on their casino gaming during these recessionary times, but not any more than they are cutting back on other activities. Of those survey respondents who participate in casino gambling, 60 percent say they have cut back on the activity, which is similar to the proportions who have cut back on going out to restaurants and taking weekend trips.
Despite these tough times, however, the gaming industry continued to be a major contributor to communities where it operates by returning nearly $5.7 billion to states and local communities through direct gaming taxes. Those tax contributions help fund vital public services, such as transportation and infrastructure, education and public safety programs. The industry also continued to be a major employer in the U.S. economy, as commercial casinos employed 357,314 people during 2008 who earned a total of $14.1 billion in wages, including benefits and tips.
State-by-state data reveal that the industry is far from monolithic. The recession hit some markets and regions harder than others, and each was affected by different circumstances. For example, Nevada saw decreases in gaming (-9.7 percent) and tax revenue (-10.6 percent) due to a reduction in consumer spend-ing on overnight travel as well as belt-tightening among local gamblers. New Jersey, hit by a decrease in consumer spending, a partial smoking ban and increased regional competition, saw its gaming rev-enues decline 8.5 percent, while Colorado and Illinois saw the largest percentage drops in gaming revenue (-12.3 percent and -20.9 percent, respectively) in part because of statewide smoking bans that went into effect at the beginning of 2008.
Despite the recession, some markets witnessed in-creases in gross gaming revenue in 2008. New prop-
erties in Pennsylvania, Missouri and Indiana resulted in subsequent boosts to gaming revenues in those states, with Pennsylvania experiencing the largest percentage increase (+48.3 percent).
racetrack casinosEven as the commercial casino industry as a whole faced declining revenues, the racetrack casino sector continued to grow in 2008, with three new properties opening and one state, Indiana, becoming the newest “racino state.” Racetrack casinos experienced a 17.2 percent increase in gross gaming revenues compared to 2007, growing to $6.19 billion. As with the overall commercial casino industry, the racetrack casino sector across the country provided sorely needed tax revenues and jobs. Contributions through direct gaming taxes to the states and communities where racetrack casinos operate grew to $2.59 billion, a 16.6 percent increase from 2007’s record levels. Employment figures at racetrack casinos also steadily increased, with 29,051 individuals employed during 2008, a 6.6 percent increase over 2007 figures.
Most of the increases in revenue, employment and tax payments last year were driven by expansion in Pennsylvania and Indiana. Pennsylvania saw the largest percentage increase in both gaming revenue (+50.3 percent) and tax contributions (+63.2 percent), and Indiana added the largest number of jobs (+1,412) to the racetrack casino sector.
Gaming Equipment manufacturingDuring 2008, the gaming equipment manufacturing sector of the U.S. gaming industry made significant contributions to the overall economy, proving to be a growth area during these challenging economic times. According to research conducted by Applied Analysis for the Association of Gaming Equipment Manufactur-ers (AGEM), the gaming equipment manufacturing sector produced a record $12.7 billion in economic output, a 6.7 percent increase over 2007 numbers. The sector also directly employed 29,600 people and paid salaries and wages of an estimated $2.0 billion.
AGEM’s research data also show that members of the gaming equipment manufacturing sector create ripple effects in the communities where they operate and provide substantial benefits to their employees. More

�2009 AGA Survey of CASIno entertAInment
than four out of five (84.6 percent) gaming equipment manufacturers sponsor health care plans that cover more than three-quarters of their employees, and more than three-quarters (76 percent) cover more than half of their workers with employer-sponsored retirement plans. Additionally, almost nine out of 10 (89.4 per-cent) gaming equipment manufacturers make at least some purchases from local vendors.
casinos and their role in u.S. tourismTravel and tourism are essential to the health of the U.S. economy, and casinos play a key role in the $740 billion U.S. travel and tourism industry, accord-ing to results of a recent national public opinion poll and a new survey of tourism industry professionals conducted by VP Communications in conjunction with national pollster Peter D. Hart. In fact, according to na-tional survey results, nearly nine out of 10 (87 percent) Americans think promoting domestic tourism can help the economy in these challenging economic times.
Survey results also bear out the fact that casinos are an important part of the broader tourism economy, with nearly two-thirds (65 percent) of Americans and a whopping 84 percent of travel professionals — those who know the industry best — agreeing on that fact. In fact, more than four out of five (82 percent) travel professionals in gaming states say casinos have helped encourage leisure travel in their regions. They also think that casinos are an important component of their state’s travel and tourism industry and create a positive, ripple effect from casino customers.
Among travel industry professionals from states without casinos, attitudes are similarly upbeat about casinos’ potential impact on their area, with 90 percent saying their state would be able to attract more leisure travelers from out-of-state if casinos were added to the entertainment mix, and more than three-quarters (77 percent) agreeing their state would be able to attract more meeting and convention business with casinos.
Survey results also show that, despite being attacked recently by politicians and the media, business meet-ings and event travel are an important component of the overall U.S. travel and tourism industry. Nearly two-thirds (62 percent) of Americans have attended a meeting or convention out of town, and a significant majority — 87 percent — of those travelers think meet-
ings and conventions are important to running a good business. According to more than three-quarters (79 percent) of surveyed travel professionals, however, the recent criticisms of meetings and events have hurt business travel in the U.S. Casinos in particular have been labeled by some as inappropriate venues for business meetings, but 76 percent of travel profes-sionals disagree with that notion. In fact, three-quarters (75 percent) say casinos are a vital component of the business travel market.
casino visitation, Poker and EntertainmentAccording to public opinion research, a quarter of the U.S. adult population visited a casino during 2008, equaling approximately 54.6 million people who vis-ited casinos last year. Casino gambling continued to be the second-most popular form of gambling in the U.S., trailing only the lottery.
According to revenue data and public opinion poll-ing, the “poker boom” that began in 2003 appears to be waning. Poker revenues in the two largest casino states declined for the first time since 2002. Addition-ally, 11 percent of Americans report having played poker in the past year, which is the lowest level of par-ticipation since the AGA began tracking this number in 2002.
The wide variety of non-gaming amenities that are increasingly available at casino properties continue to be an important part of many guests’ gaming enter-tainment experience. This year’s polling data reveal that more than three-quarters (77 percent) of casino visitors ate at a fine dining restaurant and more than half (51 percent) saw a show, concert or other live entertainment during their visit.
american Perceptions of casino EntertainmentWhen asked about their personal views of casino gambling, 81 percent of survey respondents say it is acceptable for themselves or others. They equate going to a casino with enjoying other entertainment options, like going to concerts, sporting events or plays, and see that there are myriad benefits that casi-nos can bring to communities, including job creation, tax contributions, increased tourism and economic development.
executive Summary Continued

� 2009 AGA Survey of CASIno entertAInment
2009nAtIonAl eConomIC ImPACt of CASIno entertAInment
Casino locations by Category
1 In Rhode Island, there are video lottery terminals operating at a closed jai alai fronton, not considered a racetrack casino, but a pari-mutuel facility.
2 The states with racetrack casinos operate Class III gaming machines. There are two racinos in Alabama — not indicated on this map — that have Class II machines only, which are legal only in the counties where they operate.
3 Native American casinos noted here include both Class II and Class III facilities. States with Class II gaming only are Alabama, Alaska, Florida, Nebraska and Texas.
4 The states with card rooms indicated here do not include states that have commercial casinos with poker facilities.
5 The card rooms in Washington operate blackjack and other house- or player-banked card games in addition to poker.
6 The electronic gaming devices operating in the states indicated on this map are recognized as legal operations. There are some states with similar facilities, but the machines may not be autho-rized.
Sources: American Gaming Association, National Indian Gaming Commission, State Gaming Regulatory Agencies
Casinos per State
Alabama 3* Alaska 3* Arizona 24 California 66 91 Colorado 40 2 Connecticut 2 Delaware 3n Florida 3 8* 22 Idaho 7 Illinois 9 Indiana 11 2 Iowa 14 3 1 Kansas 5 Louisiana 14 4 3 2,293 Maine 1 Michigan 3 18 Minnesota 31 2 Mississippi 29 2 Missouri 12 2 Montana 16 4682 1,6032
Nebraska 6* Nevada 266 3 2,1233
NewJersey 11 NewMexico 5 21 NewYork 8n 8 NorthCarolina 2 NorthDakota 9 Oklahoma 3 96 Oregon 10 2,382n
Pennsylvania 1 6 RhodeIsland 2n SouthDakota 35º 11 1,478 Texas 1* Washington 31 1112 WestVirginia 4n 1,616n
Wisconsin 29 Wyoming 3 total ��5 �� �2� 69� ��,�95 number of States �2 �2 29 5 6 *Class II games onlyºLimited-stakes gamingnVideo lottery terminals
1Refers to number of non-casino locations in state where electronic gaming devices are present
2Number during FY 2008 3Locations having 15 or fewer machines
Sources: American Gaming Association, National Indian Gaming Commission, State Gaming Regulatory Agencies
Tribal Casino3Land-based or Riverboat Casino
Racetrack Casino Card Room
Electronic Gaming Device
1,2 4,5
6
STATE
In 2008, U.S. commercial casinos:
• Employed 357,314 people
• Paid wages of $14.1 billion
• Contributed $5.66 billion in direct gaming taxes
• Earned $32.54 billion in gross gaming revenue
1
52009 AGA Survey of CASIno entertAInment
National economic Impact of Casino entertainment Continued
0
10
20
30
40
50
60
70
80
60%
2 3 4 5 61
54%
60%62%
68%
52%
1. Casino gambling 2. Concerts, plays, sporting events and evenings on the town 3. Going away for a long weekend 4. Going to restaurants 5. Going to the movies 6. Annual vacations
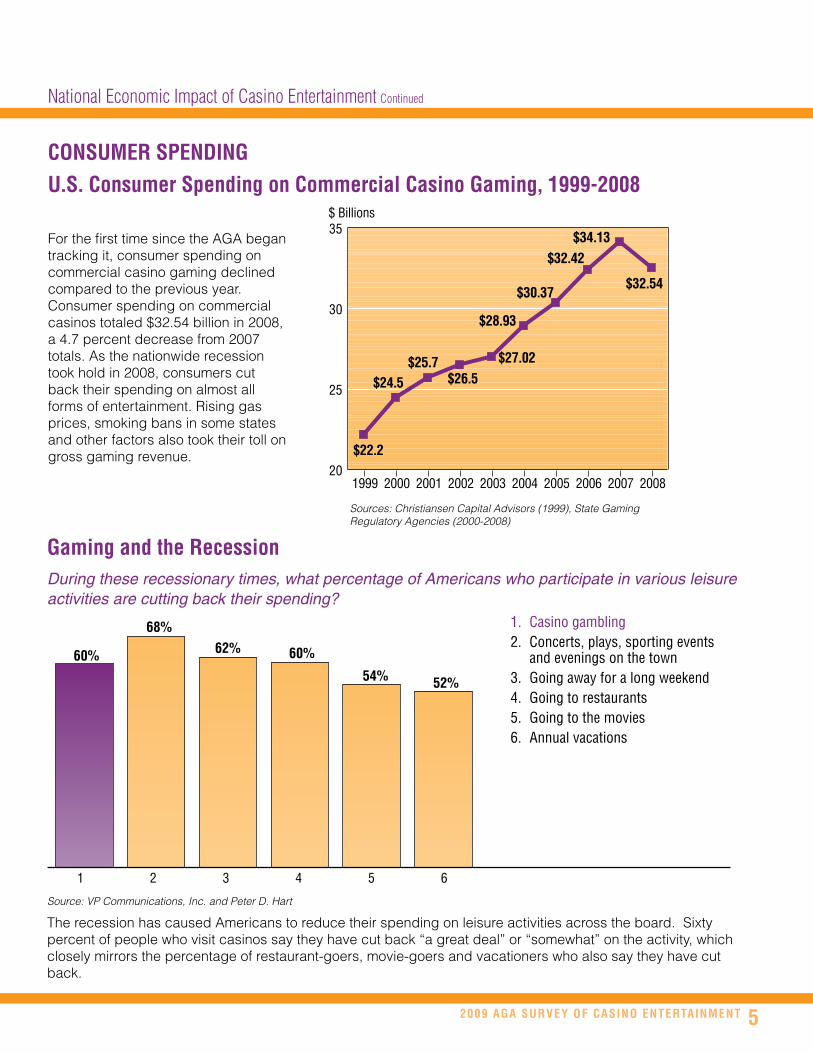
Gaming and the recessionDuring these recessionary times, what percentage of Americans who participate in various leisure activities are cutting back their spending?
Source: VP Communications, Inc. and Peter D. Hart
The recession has caused Americans to reduce their spending on leisure activities across the board. Sixty percent of people who visit casinos say they have cut back “a great deal” or “somewhat” on the activity, which closely mirrors the percentage of restaurant-goers, movie-goers and vacationers who also say they have cut back.
ConSumer SPendInG
u.S. Consumer Spending on Commercial Casino Gaming, �999-2008
200720022001 2003 2004 2005 200620001999
$22.2
$26.5$24.5
$28.93
$27.02
$30.37
$32.42$34.13
$25.7
$ Billions
20
25
30
35
$32.54
$22.2
$26.5$24.5
$28.93
$27.02
$30.37
$32.42
$34.13
$25.7
$ Billions
20
25
30
35
$32.54
2008
Sources: Christiansen Capital Advisors (1999), State Gaming Regulatory Agencies (2000-2008)
For the first time since the AGA began tracking it, consumer spending on commercial casino gaming declined compared to the previous year. Consumer spending on commercial casinos totaled $32.54 billion in 2008, a 4.7 percent decrease from 2007 totals. As the nationwide recession took hold in 2008, consumers cut back their spending on almost all forms of entertainment. Rising gas prices, smoking bans in some states and other factors also took their toll on gross gaming revenue.

6 2009 AGA Survey of CASIno entertAInment
National economic Impact of Casino entertainment Continued
2007 2008 ChAnGeColorado $816.130million $715.880million -12.3%Illinois $1.983billion $1.569billion -20.9%Indiana $2.625billion $2.668billion +1.6%Iowa $1.363billion $1.420billion +4.2%Louisiana $2.566billion $2.584billion +0.7%Michigan $1.335billion $1.360billion +1.9%Mississippi $2.891billion $2.721billion -5.9%Missouri $1.592billion $1.682billion +5.7%Nevada $12.849billion $11.599billion -9.7%NewJersey $4.921billion $4.503billion -8.5%Pennsylvania $1.090billion $1.616billion +48.3%SouthDakota $98.223million $102.264million +4.1%Source: State Gaming Regulatory Agencies
Five out of the 12 commercial casino states saw revenues decline in 2008. Colorado and Illinois experienced the largest decreases in revenue (-12.3 percent and -20.9 percent, respectively), in part because of statewide smoking bans that went into effect on Jan. 1, 2008. Nevada was hit hard by a reduction in consumer spending on overnight travel, as was New Jersey, which also has been hurt by an increase in regional competition and a partial smoking ban on the casino floor. The largest percentage increases were found in Pennsylvania and Missouri, which each saw new casinos open in late 2007 or during 2008.
State-by-State Consumer Spending on Commercial Casino Gaming, 2007 vs. 2008
Commercial Casino tax revenue by State, 2007 vs. 2008
0
200
400
600
800
1000
1200
_
2007 $ Millions
2008 $ Millions
CO IL IN IA LA MI MS MO NV NJ SD-23.4% -32.0% -0.5% +2.9% +3.2% -12.0% -6.7% +6.1% -10.6% -10.1% +3.4%
PA+62.1
115.4 88.4
566.8
833.9 842.0 838.2
321.6365.6
626.3607.21
324.0314.8
924.5
1033.9
442.8417.3
350.4326.9
426.8474.7 472.8
14.9 15.4
766.6
1Louisiana tax revenue figures for 2007 have increased compared to last year’s reported figures due to a calculation error in the 2008 State of the States report.
Source: State Gaming Regulatory Agencies
State gaming tax contributions largely mirrored gaming revenue trends in 2008. In all, U.S. commercial casinos contributed $5.66 billion to state and local governments during 2008, a decrease of 2.2 percent compared with 2007 figures. Seven of the 12 commercial casinos states saw tax revenues drop, with the states exhibiting the largest percentage decreases in gross gaming revenue also experiencing large drops in tax revenue. Two of the three casinos in Detroit opened permanent facilities in late 2007 or 2008, earning a tax break and thus causing the state’s overall gaming tax receipts to decline. Pennsylvania had the largest increase in tax revenue due to new casinos that opened there in late 2007 and 2008.
72009 AGA Survey of CASIno entertAInment
National economic Impact of Casino entertainment Continued
Commercial Casino Spending vs. other Spending Choices, 2008
0
50
100
150
200
250
300
$32.54
2 3 4 5 6 71 8
$22.0$28.0
$66.3$79.1
$290.5
$5.2$9.6
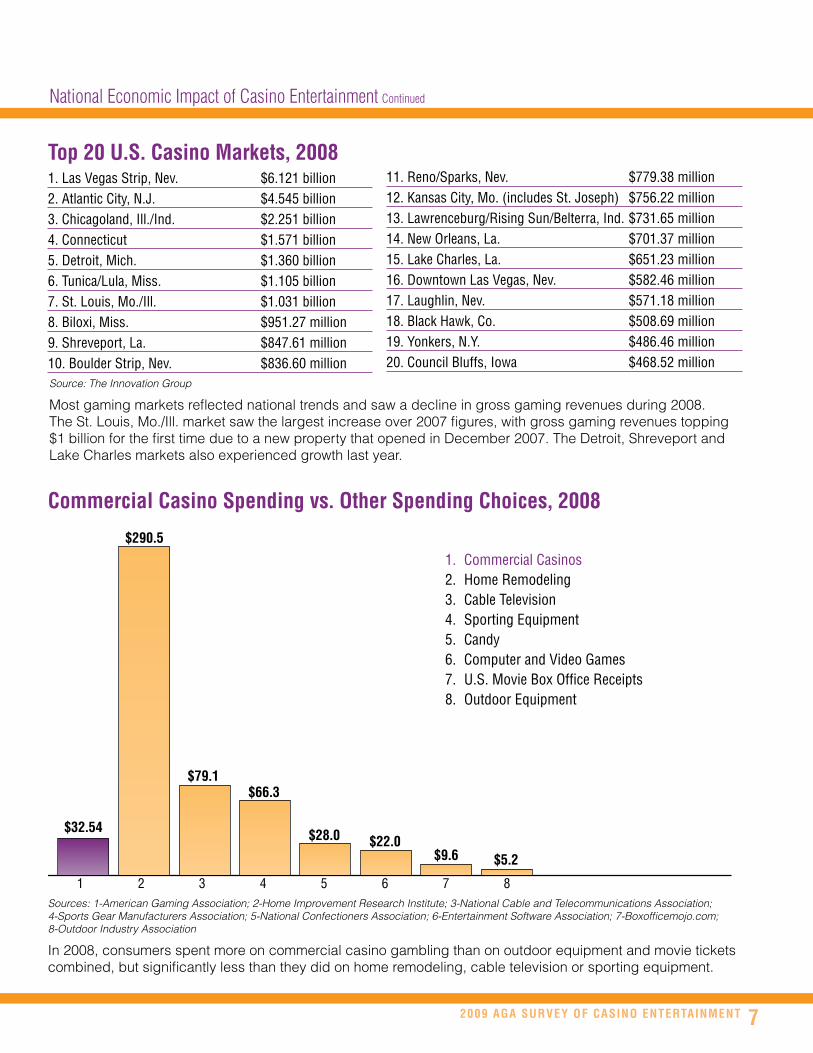
1. Commercial Casinos 2. Home Remodeling 3. Cable Television 4. Sporting Equipment 5. Candy 6. Computer and Video Games 7. U.S. Movie Box Office Receipts 8. Outdoor Equipment
Sources: 1-American Gaming Association; 2-Home Improvement Research Institute; 3-National Cable and Telecommunications Association; 4-Sports Gear Manufacturers Association; 5-National Confectioners Association; 6-Entertainment Software Association; 7-Boxofficemojo.com; 8-Outdoor Industry Association
In 2008, consumers spent more on commercial casino gambling than on outdoor equipment and movie tickets combined, but significantly less than they did on home remodeling, cable television or sporting equipment.
1.LasVegasStrip,Nev. $6.121billion2.AtlanticCity,N.J. $4.545billion3.Chicagoland,Ill./Ind. $2.251billion4.Connecticut $1.571billion5.Detroit,Mich. $1.360billion6.Tunica/Lula,Miss. $1.105billion7.St.Louis,Mo./Ill. $1.031billion8.Biloxi,Miss. $951.27million9.Shreveport,La. $847.61million10.BoulderStrip,Nev. $836.60millionSource: The Innovation Group
Most gaming markets reflected national trends and saw a decline in gross gaming revenues during 2008. The St. Louis, Mo./Ill. market saw the largest increase over 2007 figures, with gross gaming revenues topping $1 billion for the first time due to a new property that opened in December 2007. The Detroit, Shreveport and Lake Charles markets also experienced growth last year.
11.Reno/Sparks,Nev. $779.38million12.KansasCity,Mo.(includesSt.Joseph) $756.22million13.Lawrenceburg/RisingSun/Belterra,Ind.$731.65million14.NewOrleans,La. $701.37million15.LakeCharles,La. $651.23million16.DowntownLasVegas,Nev. $582.46million17.Laughlin,Nev. $571.18million18.BlackHawk,Co. $508.69million19.Yonkers,N.Y. $486.46million20.CouncilBluffs,Iowa $468.52million
top 20 u.S. Casino markets, 2008

8 2009 AGA Survey of CASIno entertAInment
National economic Impact of Casino entertainment Continued
emPloyment
Commercial Casino Jobs by State, 2007 vs. 2008 StAte 2007 2008 ChAnGeNevada 201,953 202,216 +0.1%NewJersey 40,788 38,585 -5.4%Mississippi 30,572 28,740 -6.0%Louisiana 18,009 17,268 -4.1%Indiana 15,671 16,040 +2.4%Missouri 12,160 11,658 -4.1%Iowa 10,434 9,946 -4.7%Colorado 7,925 9,073 +14.5%Michigan 7,650 8,568 +12.0%Illinois 8,337 7,711 -7.5%Pennsylvania 4,877 5,869 +20.3%SouthDakota 1,558 1,640 +5.3% total �59,9�� �57,��� -.07%
0
1-10,000
10,001-20,000
20,001-30,000
30,001-40,000
40,001-50,000
150,000+
Commercial Casino Wages, 2000-2008
9
12
15
$10.9
$11.8
$11
2000 20022001 2003 2004 2005
$12.2
$ Billions
$12.6
2006
$13.3
9
12
15
2007 2008
$13.8
$11.5
Employees at U.S. commercial casinos earned a total of $14.1 billion, including benefits and tips, in 2008, a 2.2 percent increase over 2007 totals.
Sources: State Gaming Regulatory Agencies, Individual Properties
1Figure for locations with gross gaming revenue in excess of $1 million for FY 2007.2Figure for locations with gross gaming revenue in excess of $1 million for FY 2008.3FY 20084The increase in employment was due to a change in reporting requirements in 2008. 5CY 20066CY 2007
Sources: State Gaming Regulatory Agencies, State Gaming Associations, Individual Properties
The recession and other factors forced properties to lay off workers in some states in 2008, but an equal number of states saw employment gains. Overall, national employment numbers remained relatively stable. Pennsylvania saw the largest increase (+20.3 percent) due to the opening of new properties, and Michigan also experienced a significant rise (+12.0 percent) in employment as a result of permanent facilities that opened last year.
1
5
2
3
4
6

92009 AGA Survey of CASIno entertAInment
National economic Impact of Casino entertainment Continued
SPotlIGht on rACetrACK CASInoS
racetrack Casino tax distributions to State and local Governments, 2007 vs. 2008
1 2007 data is not available because the first racinos in Indiana opened in 2008.2 Maine tax revenue figures for 2007 have increased compared to last year’s reported figures due to a calculation error in the 2008 State of the States report.
3 Due to changes in reporting, FY 2008 data was used.
Source: State Gaming Regulatory Agencies
In 2008, racetrack casinos alone contributed $2.59 billion to state and local governments in the communities where they operated, a 16.6 percent increase over 2007 figures. Racetrack casino tax contributions increased in seven out of 11 states with racinos open in both 2007 and 2008. Pennsylvania experienced the largest increase (89.3 percent) due to the continued opening of new properties during 2008 and late 2007.
racetrack Casino Jobs by State, 2007 vs. 2008
12007 data is not available because the first racinos in Indiana opened in 2008.
Source: State Gaming Regulatory Agencies, individual properties
In all, racetrack casinos employed 29,051 people during the past year, a 6.6 percent increase over 2007 figures. Most of the increase was driven by the two new properties that opened in Indiana and the opening and expansion of new and existing properties in Pennsylvania, which saw a 33.9 percent increase in racetrack casino employment. New jobs in Indiana and Pennsylvania helped to offset employment declines in a number of other states due to the faltering economy. Racetrack Casino State
StAte 2007 2008 ChAnGeDelaware 2,891 2,582 -10.7%Florida 2,270 2,201 -3.0%Indiana --1 1,412 N/AIowa 2,802 2,668 -4.8%Louisiana 2,377 2,268 -4.6%Maine 167 324 +94.0%NewMexico 1,660 1,605 -3.3%NewYork 3,741 3,413 -8.8%Oklahoma 822 1,050 +27.7%Pennsylvania 3,753 4,948 +31.8%RhodeIsland 1,500 1,310 -12.7%WestVirginia 5,275 5,270 -0.1% total 27,258 29,05� +6.6%
�0 2009 AGA Survey of CASIno entertAInment
Consumer Spending on racetrack Casinos, 2002-2008
2
3
4
5
6
7
8
2
3
4
5
6
$3.12
2002 2003 200720052004
$ Billions
$2.2$2.0
$5.28
2006
$3.62
$2.86
2008
$6.19
National economic Impact of Casino entertainment Continued
top �0 u.S. racetrack Casino markets, 2008
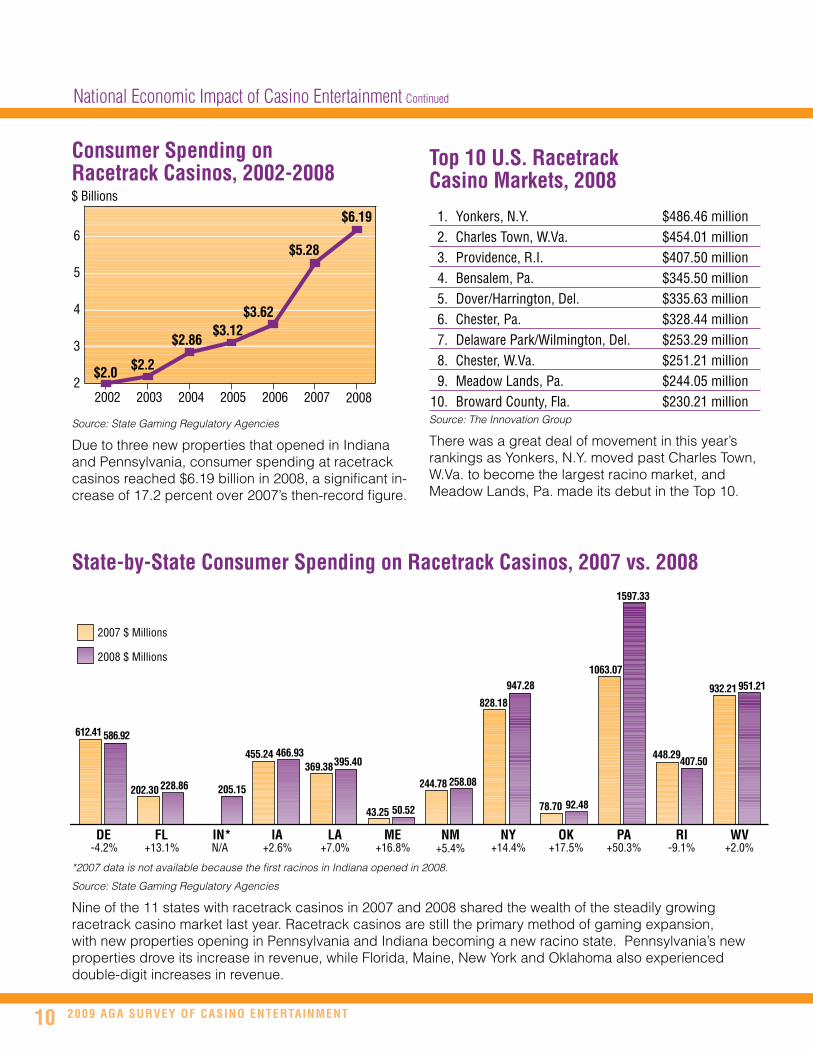
1. Yonkers,N.Y. $486.46million 2. CharlesTown,W.Va. $454.01million 3. Providence,R.I. $407.50million 4. Bensalem,Pa. $345.50million 5. Dover/Harrington,Del. $335.63million 6. Chester,Pa. $328.44million 7. DelawarePark/Wilmington,Del. $253.29million 8. Chester,W.Va. $251.21million 9. MeadowLands,Pa. $244.05million10. BrowardCounty,Fla. $230.21millionSource: The Innovation Group
There was a great deal of movement in this year’s rankings as Yonkers, N.Y. moved past Charles Town, W.Va. to become the largest racino market, and Meadow Lands, Pa. made its debut in the Top 10.
State-by-State Consumer Spending on racetrack Casinos, 2007 vs. 2008
0
200
400
600
800
1000
12000
500
1000
1500
2000
612.41
455.24
43.25
369.38
828.18
244.78
78.70
1063.07
932.21
DE IN* LA NM NY OK WV-4.2% N/A +7.0% +5.4% +14.4% +17.5% +2.0%
ME+16.8%
RI-9.1%
FL+13.1%
PA+50.3%
202.30
448.29
2007 $ Millions
2008 $ Millions
IA+2.6%
586.92
228.86 205.15
466.93395.40
50.52
258.08
947.28
92.48
1597.33
407.50
951.21
*2007 data is not available because the first racinos in Indiana opened in 2008.
Source: State Gaming Regulatory Agencies
Nine of the 11 states with racetrack casinos in 2007 and 2008 shared the wealth of the steadily growing racetrack casino market last year. Racetrack casinos are still the primary method of gaming expansion, with new properties opening in Pennsylvania and Indiana becoming a new racino state. Pennsylvania’s new properties drove its increase in revenue, while Florida, Maine, New York and Oklahoma also experienced double-digit increases in revenue.
Source: State Gaming Regulatory Agencies
Due to three new properties that opened in Indiana and Pennsylvania, consumer spending at racetrack casinos reached $6.19 billion in 2008, a significant in-crease of 17.2 percent over 2007’s then-record figure.
SPotLIGht oN
��
GAmInG eQuIPment mAnufACturerS
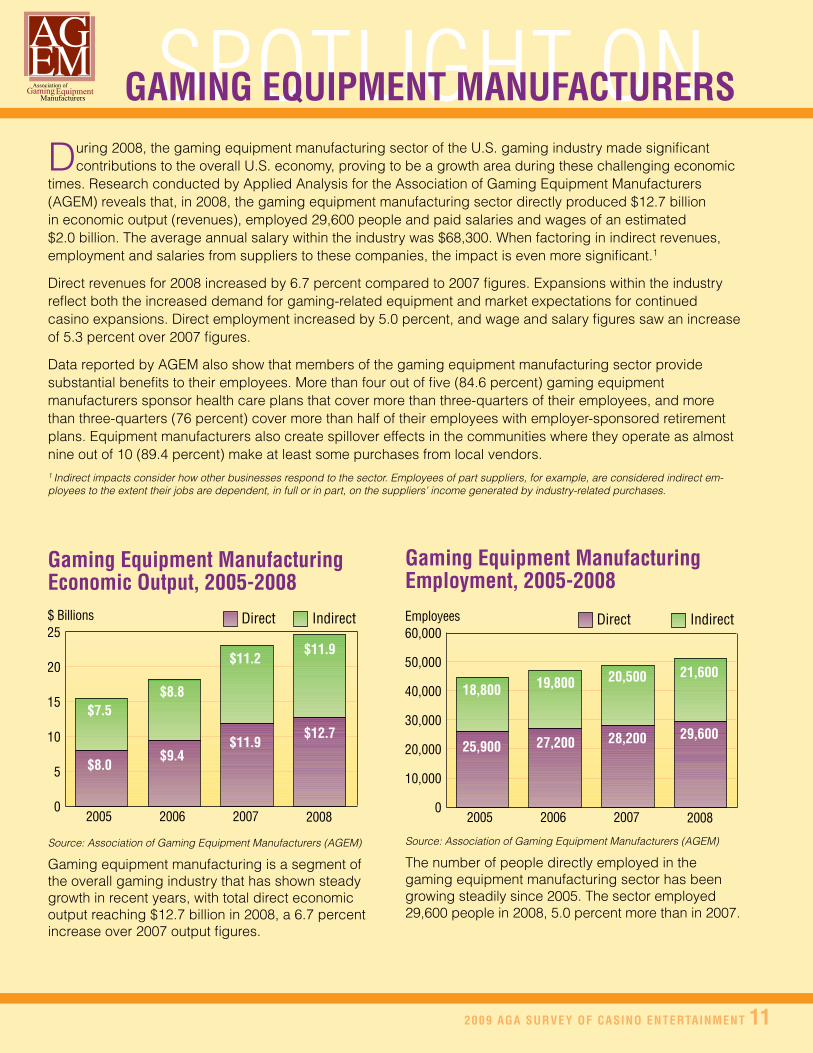
During 2008, the gaming equipment manufacturing sector of the U.S. gaming industry made significant contributions to the overall U.S. economy, proving to be a growth area during these challenging economic
times. Research conducted by Applied Analysis for the Association of Gaming Equipment Manufacturers (AGEM) reveals that, in 2008, the gaming equipment manufacturing sector directly produced $12.7 billion in economic output (revenues), employed 29,600 people and paid salaries and wages of an estimated $2.0 billion. The average annual salary within the industry was $68,300. When factoring in indirect revenues, employment and salaries from suppliers to these companies, the impact is even more significant.1
Direct revenues for 2008 increased by 6.7 percent compared to 2007 figures. Expansions within the industry reflect both the increased demand for gaming-related equipment and market expectations for continued casino expansions. Direct employment increased by 5.0 percent, and wage and salary figures saw an increase of 5.3 percent over 2007 figures.
Data reported by AGEM also show that members of the gaming equipment manufacturing sector provide substantial benefits to their employees. More than four out of five (84.6 percent) gaming equipment manufacturers sponsor health care plans that cover more than three-quarters of their employees, and more than three-quarters (76 percent) cover more than half of their employees with employer-sponsored retirement plans. Equipment manufacturers also create spillover effects in the communities where they operate as almost nine out of 10 (89.4 percent) make at least some purchases from local vendors.1 Indirect impacts consider how other businesses respond to the sector. Employees of part suppliers, for example, are considered indirect em-ployees to the extent their jobs are dependent, in full or in part, on the suppliers’ income generated by industry-related purchases.
2009 AGA Survey of CASIno entertAInment
Gaming equipment manufacturing economic output, 2005-2008
$6.17
0
10
20
30
40
50
20072005
$ Billions
2006 20080
5
10
15
20
25 Direct
Indirect
$8.0$9.4
$11.9$12.7
$7.5$8.8
$11.2$11.9
20072005
$ Billions
2006 20080
5
10
15
20
25Direct
Indirect
$8.0$9.4
$11.9$12.7
$7.5$8.8
$11.2$11.9
Source: Association of Gaming Equipment Manufacturers (AGEM)
Gaming equipment manufacturing is a segment of the overall gaming industry that has shown steady growth in recent years, with total direct economic output reaching $12.7 billion in 2008, a 6.7 percent increase over 2007 output figures.
Gaming equipment manufacturing employment, 2005-2008
$6.17
0
10
20
30
40
50
20072005
$ Billions
2006 20080
10000
20000
30000
40000
50000
60000 Direct
Indirect
$8.0$9.4
$11.9$12.7
$7.5$8.8
$11.2$11.9
20072005
Employees
2006 20080
10,000
20,000
30,000
40,000
50,000
60,000Direct
25,900
19,800 20,500
29,600
18,800
27,200 28,200
21,600
Indirect
Source: Association of Gaming Equipment Manufacturers (AGEM)
The number of people directly employed in the gaming equipment manufacturing sector has been growing steadily since 2005. The sector employed 29,600 people in 2008, 5.0 percent more than in 2007.
ManufacturersGamingEquipment
Association of

State by StateGaming equipment manufacturing Salaries and Wages, 2005-2008
$6.17
0
10
20
30
40
50
20072005 2006 20080.0
0.5
1.0
1.5
2.0
2.5
3.0
3.5 Direct
Indirect
$8.0$9.4
$11.9$12.7
$7.5$8.8
$11.2$11.9
0.0
0.5
1.0
1.5
2.0
2.5
3.0
3.5
$1.6$1.8 $1.9 $2.0
$1.1$1.2
$1.3$1.4
Source: Association of Gaming Equipment Manufacturers (AGEM)
Members of the gaming equipment manufacturing sector paid $2.0 billion to their employees in the form of wages and salaries during 2008, a 5.3 per-cent increase over 2007 totals.
Gaming equipment manufacturers with employees Covered by employer-sponsored health Care Plans
$6.17
20072005 2006 2008
$12.7
$11.9
0.0
0.5
1.0
1.5
2.0
2.5
3.0
3.5
$1.6$1.8 $1.9 $2.0
$1.2$1.3
$1.4
0
20
40
60
80
100
84.6% More than 75% of employees 50% to 75% of employees 25% to 50% of employees Less than 25% of employees
7.7% 3.8% 3.8%
Source: Association of Gaming Equipment Manufacturers (AGEM)
More than four out of five (84.6 percent) gaming equipment manufacturers sponsor health care plans that cover more than three-quarters of their employees.
Gaming equipment manufacturers with employees Covered by employer-sponsored retirement Plans
$6.17
$12.7
$11.9
0
10
20
30
40
50
60
60.0% More than 75% of employees50% to 75% of employees25% to 50% of employeesLess than 25% of employees
16.0%
4.0%
20.0%
Source: Association of Gaming Equipment Manufacturers (AGEM)
More than three-quarters (76 percent) of gaming equipment manufacturers cover more than half of their employees with employer-sponsored retirement plans, and three out of five (60 percent) cover more than 75 percent of employees.
Purchases made from local vendors by Gaming equipment manufacturers
$6.17
$12.7
$11.9
0
10
20
30
40
50
10.7%
17.9% 17.9%
42.9%
More than 50% of purchases26% to 50% of purchases11% to 25% of purchases1% to 10% of purchases0% of purchases
0
10
20
30
40
50
10.7%
Source: Association of Gaming Equipment Manufacturers (AGEM)
Almost nine out of 10 (89.4 percent) gaming equipment manufacturers make at least some purchases from local vendors, while more than a quarter (28.6 percent) make more than 25 percent of their purchases from local suppliers.
�2 2009 AGA Survey of CASIno entertAInment
aGeM Spotlight on Gaming equipment Manufacturers Continued

State by State
��
eConomIC ImPACt: CommerCIAl CASInoS
The recession that began to take hold in the United States at the end of 2007 was in full effect during 2008, and national economic impact statistics for commercial casinos reflect
the drop in consumer spending last year. Gross gaming revenues fell 4.7 percent nationwide to $32.54 billion in 2008. A total of $5.66 billion of those revenues were distributed to states and communities in the form of direct gaming taxes. While this number is down 2.2 percent from 2007 figures, it shows the industry continues to be a major contributor to the communities where it operates even in difficult economic times. The industry also continued its role as a major employer in the U.S. economy, as commercial casinos employed 357,314 people during 2008 who earned a total of $14.1 billion in wages, including benefits and tips.
Despite nationwide figures showing 2008 as a challenging year for the commercial casino industry, state-by-state data reveal that the industry is far from monolithic. The recession hit some markets and regions harder than others, and each was affected by different circumstances. For example, Nevada saw decreases in gaming and tax revenue due to a reduction in consumer spending on overnight travel as well as belt-tightening among local gamblers. New Jersey was hit by a decrease in consumer spending, a partial smoking ban and increased regional competition, while Colorado and Illinois saw their revenues drop, in part, because of statewide smoking bans that went into effect at the beginning of 2008.
Despite the recession, some markets witnessed increases in gross gaming revenue in 2008. New properties in Pennsylvania and Indiana resulted in subsequent boosts to gaming revenues in those states. Missouri saw its gaming revenues increase partially because of a new property that opened in December 2007, and Michigan experienced an uptick in revenues thanks to the opening of two permanent casino facilities in late 2007.
1
2009 AGA Survey of CASIno entertAInment
�� 2009 AGA Survey of CASIno entertAInment
State-by-State economic Impact: Commercial Casinos Continued
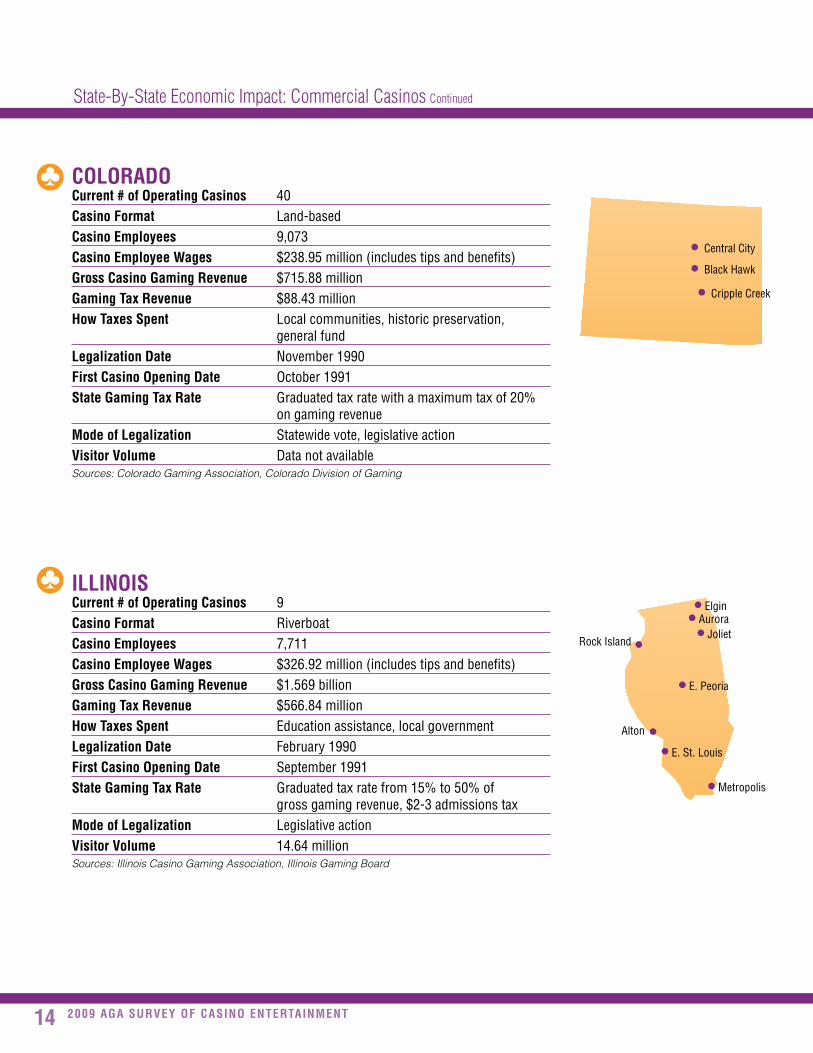
IllInoISCurrent # of operating Casinos 9Casino format RiverboatCasino employees 7,711Casino employee Wages $326.92million(includestipsandbenefits)Gross Casino Gaming revenue $1.569billionGaming tax revenue $566.84millionhow taxes Spent Educationassistance,localgovernmentlegalization date February1990first Casino opening date September1991State Gaming tax rate Graduatedtaxratefrom15%to50%of grossgamingrevenue,$2-3admissionstaxmode of legalization Legislativeactionvisitor volume 14.64millionSources: Illinois Casino Gaming Association, Illinois Gaming Board
ColorAdoCurrent # of operating Casinos 40Casino format Land-basedCasino employees 9,073Casino employee Wages $238.95million(includestipsandbenefits)Gross Casino Gaming revenue $715.88millionGaming tax revenue $88.43millionhow taxes Spent Localcommunities,historicpreservation, generalfundlegalization date November1990first Casino opening date October1991State Gaming tax rate Graduatedtaxratewithamaximumtaxof20% ongamingrevenuemode of legalization Statewidevote,legislativeactionvisitor volume DatanotavailableSources: Colorado Gaming Association, Colorado Division of Gaming
CentralCity
BlackHawk
CrippleCreek
JolietAurora
Elgin
RockIsland
E.Peoria
E.St.Louis
Alton
Metropolis
�52009 AGA Survey of CASIno entertAInment
State-by-State economic Impact: Commercial Casinos Continued
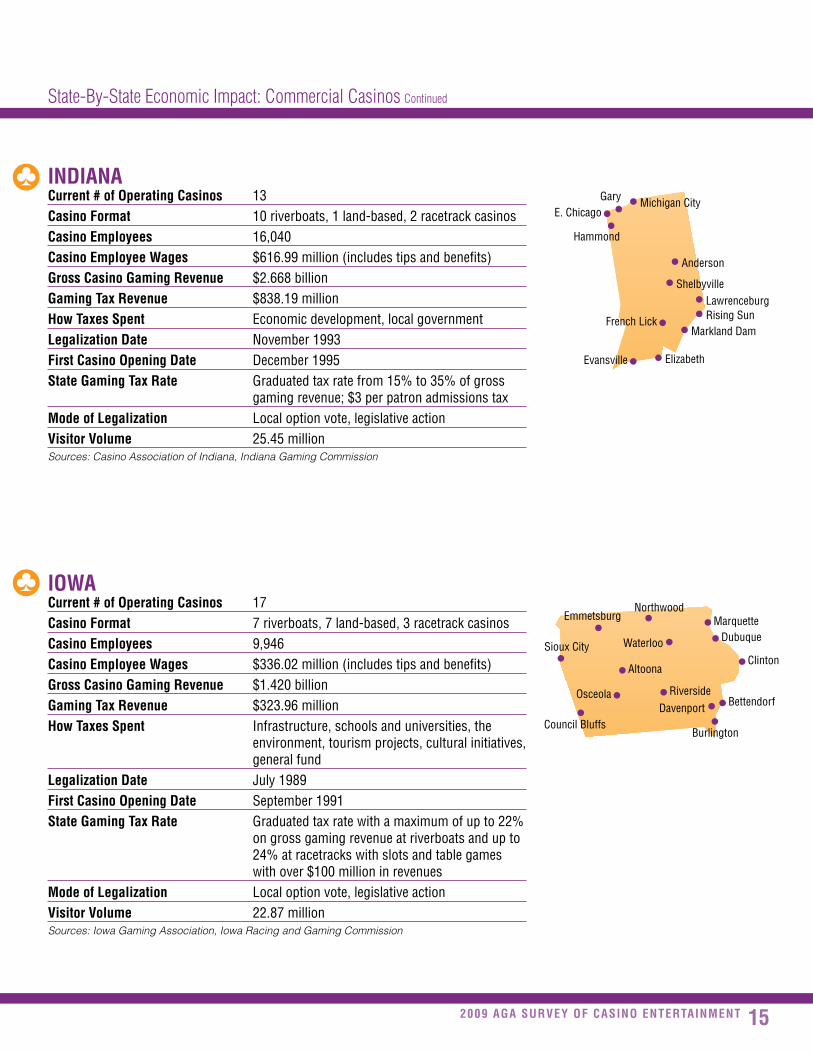
IndIAnACurrent # of operating Casinos 13Casino format 10riverboats,1land-based,2racetrackcasinosCasino employees 16,040Casino employee Wages $616.99million(includestipsandbenefits)Gross Casino Gaming revenue $2.668billionGaming tax revenue $838.19millionhow taxes Spent Economicdevelopment,localgovernmentlegalization date November1993first Casino opening date December1995State Gaming tax rate Graduatedtaxratefrom15%to35%ofgross gamingrevenue;$3perpatronadmissionstaxmode of legalization Localoptionvote,legislativeactionvisitor volume 25.45millionSources: Casino Association of Indiana, Indiana Gaming Commission
IoWACurrent # of operating Casinos 17Casino format 7riverboats,7land-based,3racetrackcasinosCasino employees 9,946Casino employee Wages $336.02million(includestipsandbenefits)Gross Casino Gaming revenue $1.420billionGaming tax revenue $323.96millionhow taxes Spent Infrastructure,schoolsanduniversities,the environment,tourismprojects,culturalinitiatives, generalfundlegalization date July1989first Casino opening date September1991State Gaming tax rate Graduatedtaxratewithamaximumofupto22% ongrossgamingrevenueatriverboatsandupto 24%atracetrackswithslotsandtablegames withover$100millioninrevenuesmode of legalization Localoptionvote,legislativeactionvisitor volume 22.87millionSources: Iowa Gaming Association, Iowa Racing and Gaming Commission
MichiganCityGaryE.Chicago
Hammond
FrenchLick
Evansville Elizabeth
MarklandDamRisingSunLawrenceburg
Emmetsburg
SiouxCity
CouncilBluffs
Osceola
Burlington
Davenport
Altoona
RiversideBettendorf
Clinton
DubuqueMarquette
Northwood
Waterloo
Shelbyville
Anderson

�6 2009 AGA Survey of CASIno entertAInment
State-by-State economic Impact: Commercial Casinos Continued
mIChIGAnCurrent # of operating Casinos 3Casino format Land-basedCasino employees 8,568Casino employee Wages $481.11million(includestipsandbenefits)Gross Casino Gaming revenue $1.360billionGaming tax revenue $321.63millionhow taxes Spent Publicsafety,capitalimprovements,youth programs,taxrelief,neighborhooddevelopment andimprovement,infrastructurerepairand improvementlegalization date December1996first Casino opening date July1999State Gaming tax rate Forpermanentfacilities:19%taxongross gamingrevenue(10.9%tocityofDetroit,8.1%to stateofMichigan);Fortemporaryfacilities:24% taxongrossgamingrevenue(11.9%tocityof Detroit,12.1%tostateofMichigan)mode of legalization Localadvisoryvote,statewidevoterreferendum, legislativeactionvisitor volume DatanotavailableSources: Michigan Gaming Control Board, individual properties
louISIAnACurrent # of operating Casinos 18Casino format 13riverboat,1land-based,4racetrackcasinosCasino employees 17,268Casino employee Wages $643.09million(includestipsandbenefits)Gross Casino Gaming revenue $2.584billionGaming tax revenue $626.25millionhow taxes Spent Generalfund,cityofNewOrleans,public retirementsystems,statecapitalimprovements, rainydayfundlegalization date July1991first Casino opening date October1993State Gaming tax rate Riverboatcasinos:21.5%1;Land-basedcasino: $60millionannualtaxor21.5%ofgrossgaming revenue,whicheverisgreater;Racinos:18.5%tax ongrossgamingrevenue,18%ofnetpaidto horsemen,4%oftheabovenetthenpaidto localparishmode of legalization Localoptionvote,legislativeactionvisitor volume 35.32million1 Riverboat casinos pay an additional 4 percent to 6 percent to local governing authorities under the terms of “local boarding fee” agreements
Sources: Louisiana Casino Association, Louisiana Gaming Control Board
BossierCity
Shreveport
BatonRougeNewOrleans
KennerAmelia
OpelousasVinton
LakeCharles
Detroit

�72009 AGA Survey of CASIno entertAInment
State-by-State economic Impact: Commercial Casinos Continued
mISSISSIPPICurrent # of operating Casinos 29Casino format Dockside,land-basedCasino employees 28,740Casino employee Wages $954.71million(includestipsandbenefits)Gross Casino Gaming revenue $2.721billionGaming tax revenue $326.89millionhow taxes Spent Housing,education,transportation,healthcare services,youthcounselingprograms,localpublic safetyprogramslegalization date June1990first Casino opening date August1992State Gaming tax rate Graduatedtaxof8%ongamingrevenues; upto4%additionaltaxongamingrevenuesmay beimposedbylocalgovernmentsmode of legalization Legislativeaction,localoptionvotesvisitor volume 36.49millionSources: Mississippi Casino Operators Association, Mississippi Gaming Commission
mISSourICurrent # of operating Casinos 12Casino format RiverboatCasino employees 11,6581
Casino employee Wages $360.30million(includestipsandbenefits)1
Gross Casino Gaming revenue $1.682billionGaming tax revenue $442.79millionhow taxes Spent Education,localpublicsafetyprograms, compulsivegamblingtreatment,veterans’ programs,earlychildhoodprogramslegalization date August1993first Casino opening date May1994State Gaming tax rate 21%taxongrossgamingrevenue;$2perpatron admissionfee,perexcursion,splitbetweenhome dockcommunityandthestatemode of legalization Statewidevote,localoptionvote,legislativeactionvisitor volume 51.93million1FY 2008
Sources: Missouri Gaming Association, Missouri Gaming Commission
Caruthersville
St.Louis
LaGrangeSt.JosephRiverside
KansasCity
NorthKansasCity
Detroit
St.Charles
MarylandHeights
Tunica/Robinsonville
Lula
Vicksburg
Greenville
BaySt.Louis
Natchez
Gulfport
Biloxi

�8 2009 AGA Survey of CASIno entertAInment
State-by-State economic Impact: Commercial Casinos Continued
neW JerSeyCurrent # of operating Casinos 11Casino format Land-basedCasino employees 38,585Casino employee Wages $1.163billion(includestips)Gross Casino Gaming revenue $4.503billionGaming tax revenue $426.82million1
how taxes Spent Seniorcitizens,disabled,economicrevitalization programslegalization date 1976first Casino opening date 1978State Gaming tax rate 8%taxongrossgamingrevenue,plusa communityinvestmentalternativeobligationof 1.25%ofgrossgamingrevenue(oraninvestment alternativeof2.5%ongrossgamingrevenue), 4.25%taxoncasinocomplimentaries1
mode of legalization Statewidevote,legislativeactionvisitor volume 34.53million1 New Jersey’s tax on complimentary rooms, food, beverage and entertainment is in the process of being phased out. It will be fully phased out on June 30, 2009.
Sources: New Jersey Casino Control Commission, South Jersey Transportation Authority
nevAdACurrent # of operating Casinos 266Casino format Land-basedCasino employees 202,2161
Casino employee Wages $8.687billion(includestipsandbenefits)1
Gross Casino Gaming revenue $11.599billionGaming tax revenue $924.49billionhow taxes Spent Education,localgovernments,generalfund, problemgamblingprogramslegalization date 1931first Casino opening date 1931State Gaming tax rate Graduatedtaxratewithamaximumtaxof6.75% ongrossgamingrevenue;additionalfeesand leviesmaybeimposedbycounties,municipalities andthestate,addingapproximately1%tothetax burdenmode of legalization Legislativeactionvisitor volume 51.59million1FY 2008
Sources: Nevada Gaming Control Board, Nevada Commission on Tourism
McDermitt Jackpot
WellsElkoWinnemucca
BattleMtn.Reno
CarsonCityGardnerville
LakeTahoe
LovelockFallon
HawthorneBeatty Tonopah
WestWendover
Ely
MesquiteN.LasVegasLasVegasHenderson
LaughlinSearchlightPrimm
PahrumpIndianSpgs.
AmargosaValley
AtlanticCity
�92009 AGA Survey of CASIno entertAInment
State-by-State economic Impact: Commercial Casinos Continued
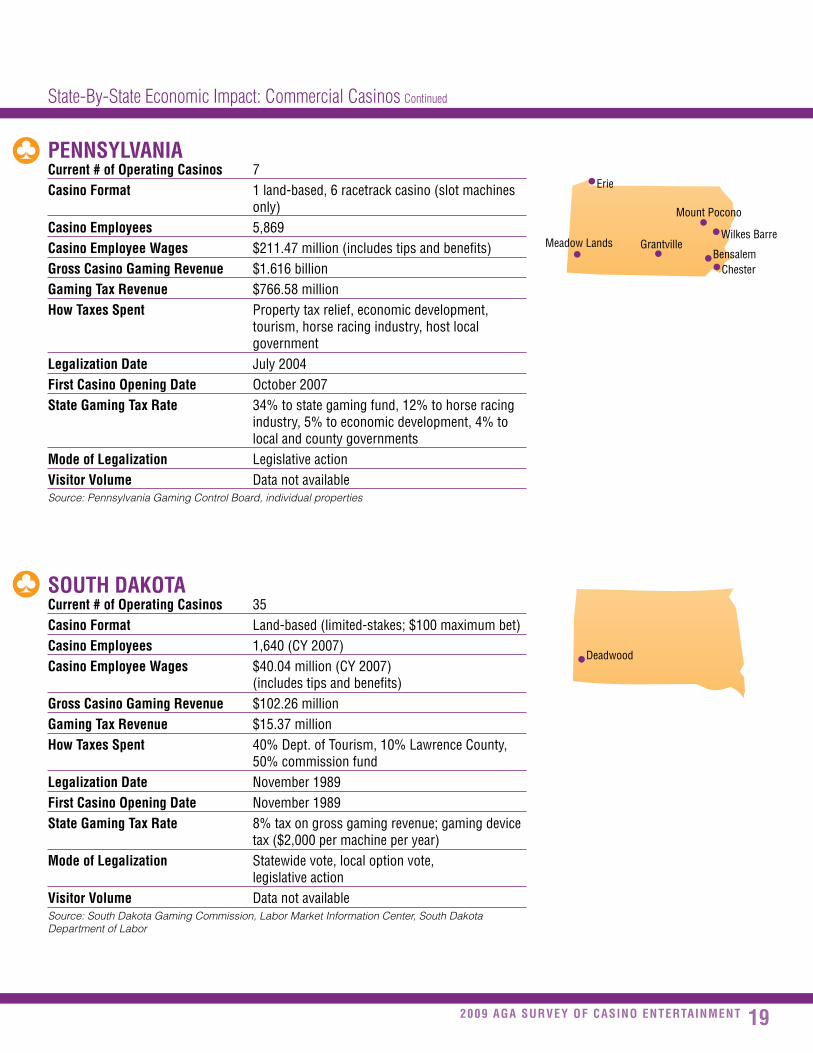
PennSylvAnIACurrent # of operating Casinos 7Casino format 1land-based,6racetrackcasino(slotmachines only)Casino employees 5,869Casino employee Wages $211.47million(includestipsandbenefits)Gross Casino Gaming revenue $1.616billionGaming tax revenue $766.58millionhow taxes Spent Propertytaxrelief,economicdevelopment, tourism,horseracingindustry,hostlocal governmentlegalization date July2004first Casino opening date October2007State Gaming tax rate 34%tostategamingfund,12%tohorseracing industry,5%toeconomicdevelopment,4%to localandcountygovernmentsmode of legalization Legislativeactionvisitor volume DatanotavailableSource: Pennsylvania Gaming Control Board, individual properties
South dAKotACurrent # of operating Casinos 35Casino format Land-based(limited-stakes;$100maximumbet)Casino employees 1,640(CY2007)Casino employee Wages $40.04million(CY2007) (includestipsandbenefits)Gross Casino Gaming revenue $102.26millionGaming tax revenue $15.37millionhow taxes Spent 40%Dept.ofTourism,10%LawrenceCounty, 50%commissionfundlegalization date November1989first Casino opening date November1989State Gaming tax rate 8%taxongrossgamingrevenue;gamingdevice tax($2,000permachineperyear)mode of legalization Statewidevote,localoptionvote, legislativeactionvisitor volume DatanotavailableSource: South Dakota Gaming Commission, Labor Market Information Center, South Dakota Department of Labor
Erie
WilkesBarre
MountPocono
MeadowLandsBensalem
Chester
Deadwood
Grantville
20 2009 AGA Survey of CASIno entertAInment
State-by-State economic Impact: Racetrack Casinos ContinuedState by StateIn the face of declining revenues and tax contributions in the commercial casino industry as a whole,
the racetrack casino sector continued to grow in 2008, with three new properties opening and one state, Indiana, adding its name to the roster of “racino states.” Gross gaming revenues at racetrack casinos rose to $6.19 billion last year, a 17.2 percent increase over 2007, and properties across the country provided sorely needed tax revenues and jobs. Contributions through direct gaming taxes to the states and cities where racetrack casinos operate grew to $2.59 billion, a 16.6 percent increase from 2007’s record levels. Employment figures at racetrack casinos also steadily increased, with 29,051 individuals employed during 2008, a 6.6 percent increase over 2007 figures.
Most of the increases in revenue, employment and tax payments last year were driven by expansion in Pennsylvania and Indiana. Pennsylvania opened one and Indiana premiered two new racetrack casinos during 2008.
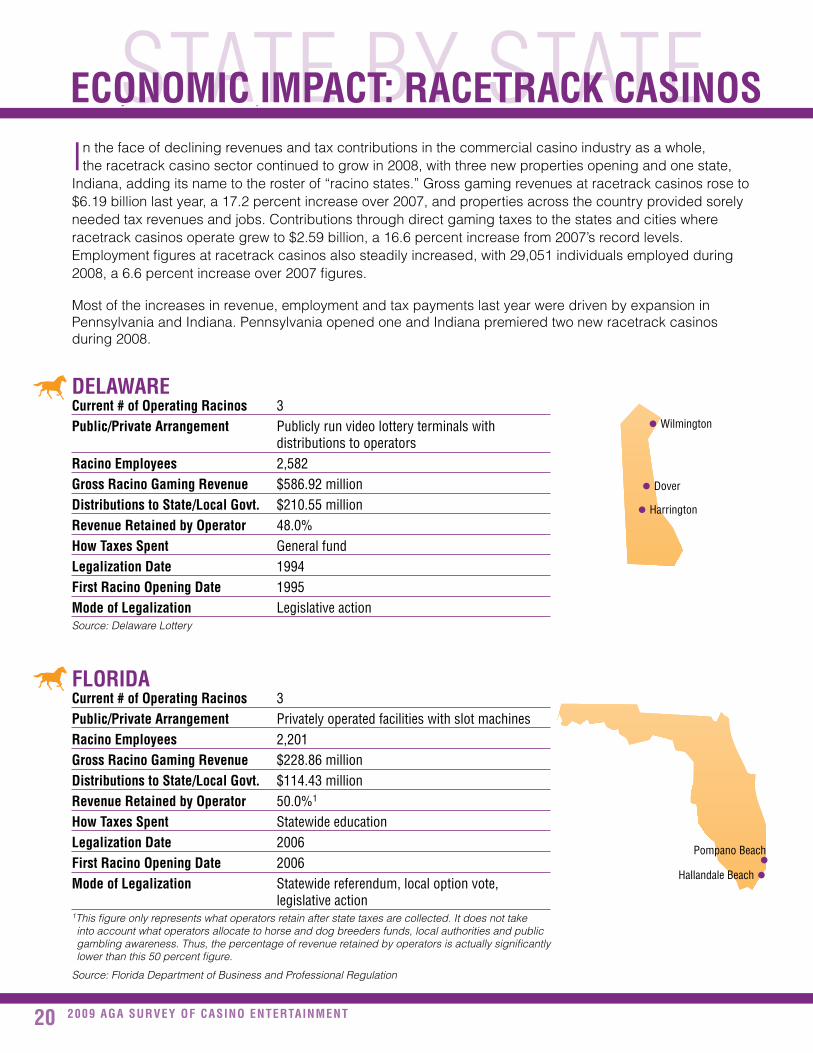
delAWAreCurrent # of operating racinos 3Public/Private Arrangement Publiclyrunvideolotteryterminalswith distributionstooperatorsracino employees 2,582Gross racino Gaming revenue $586.92milliondistributions to State/local Govt. $210.55millionrevenue retained by operator 48.0%how taxes Spent Generalfundlegalization date 1994first racino opening date 1995mode of legalization LegislativeactionSource: Delaware Lottery
florIdACurrent # of operating racinos 3Public/Private Arrangement Privatelyoperatedfacilitieswithslotmachinesracino employees 2,201Gross racino Gaming revenue $228.86milliondistributions to State/local Govt. $114.43millionrevenue retained by operator 50.0%1
how taxes Spent Statewideeducationlegalization date 2006first racino opening date 2006mode of legalization Statewidereferendum,localoptionvote, legislativeaction1This figure only represents what operators retain after state taxes are collected. It does not take into account what operators allocate to horse and dog breeders funds, local authorities and public gambling awareness. Thus, the percentage of revenue retained by operators is actually significantly lower than this 50 percent figure.
Source: Florida Department of Business and Professional Regulation
Dover
Wilmington
Harrington
PompanoBeach
HallandaleBeach
eConomIC ImPACt: rACetrACK CASInoS

2�2009 AGA Survey of CASIno entertAInment
State-by-State economic Impact: Racetrack Casinos ContinuedState by StateIndIAnACurrent # of operating racinos 2Public/Private Arrangement Privatelyoperatedfacilitieswithslotmachinesracino employees 1,412Gross racino Gaming revenue $205.15milliondistributions to State/local Govt. $51.21millionrevenue retained by operator 56.0%how taxes Spent Propertytaxfund,horseracingindustry,local governmentandFrenchLickResortlegalization date 2007first racino opening date 2008mode of legalization LegislativeactionSource: Casino Association of Indiana, Indiana Gaming Commission
IoWACurrent # of operating racinos 3Public/Private Arrangement Privatelyoperatedfacilitieswithslotmachines andtablegamesracino employees 2,668Gross racino Gaming revenue $466.93milliondistributions to State/local Govt. $108.47millionrevenue retained by operator 76.8%how taxes Spent Infrastructureimprovements,localgovernment, generalfund,schoolsanduniversities, theenvironment,tourismlegalization date 1994first racino opening date 1995mode of legalization Localcountyoptionvote,legislativeactionSource: Iowa Racing and Gaming Commission
Shelbyville
Anderson
CouncilBluffs
Altoona
Dubuque
louISIAnACurrent # of operating racinos 4Public/Private Arrangement Privatelyoperatedfacilitieswithslotmachinesracino employees 2,268Gross racino Gaming revenue $395.40milliondistributions to State/local Govt. $72.95millionrevenue retained by operator 63.6%how taxes Spent Generalfund,localparisheslegalization date 1994first racino opening date 1994mode of legalization Localoptionvote,legislativeactionSources: Louisiana Gaming Control Board, individual properties
BossierCity
NewOrleans
Opelousas
Vinton

22 2009 AGA Survey of CASIno entertAInment
State-by-State economic Impact: Racetrack Casinos Continued
mAIneCurrent # of operating racinos 1Public/Private Arrangement Privatelyoperatedfacilitywithslotmachinesracino employees 324Gross racino Gaming revenue $50.52milliondistributions to State/local Govt. $25.04millionrevenue retained by operator 50.4%how taxes Spent Education,healthcare,agriculture,gambling controlboardadministrationandCityofBangorlegalization date 2004first racino opening date 2005mode of legalization Localoptionvote,legislativeactionSources: Maine Gambling Control Board, Penn National Gaming, Inc.
neW mexICoCurrent # of operating racinos 5Public/Private Arrangement Privatelyoperatedfacilitieswithslotmachinesracino employees 1,605Gross racino Gaming revenue $258.08milliondistributions to State/local Govt. $67.10millionrevenue retained by operator 54.0%how taxes Spent Generalfund,problemgamblingtreatmentlegalization date 1997first racino opening date 1999mode of legalization LegislativeactionSource: New Mexico Gaming Control Board
neW yorKCurrent # of operating racinos 8Public/Private Arrangement Publiclyrunvideolotteryterminalswith distributionstooperatorsracino employees 3,413Gross racino Gaming revenue $947.28milliondistributions to State/local Govt. $446.28millionrevenue retained by operator 42.9%how taxes Spent Educationlegalization date 2001first racino opening date 2004mode of legalization LegislativeactionSource: New York Racing and Wagering Board
Bangor
Farmington
Albuquerque
Ruidoso
SunlandPark
Hobbs
SaratogaSpringsVernon
Farmington
Batavia
Hamburg
Nichols Monticello
Yonkers
2�2009 AGA Survey of CASIno entertAInment
State-by-State economic Impact: Racetrack Casinos Continued
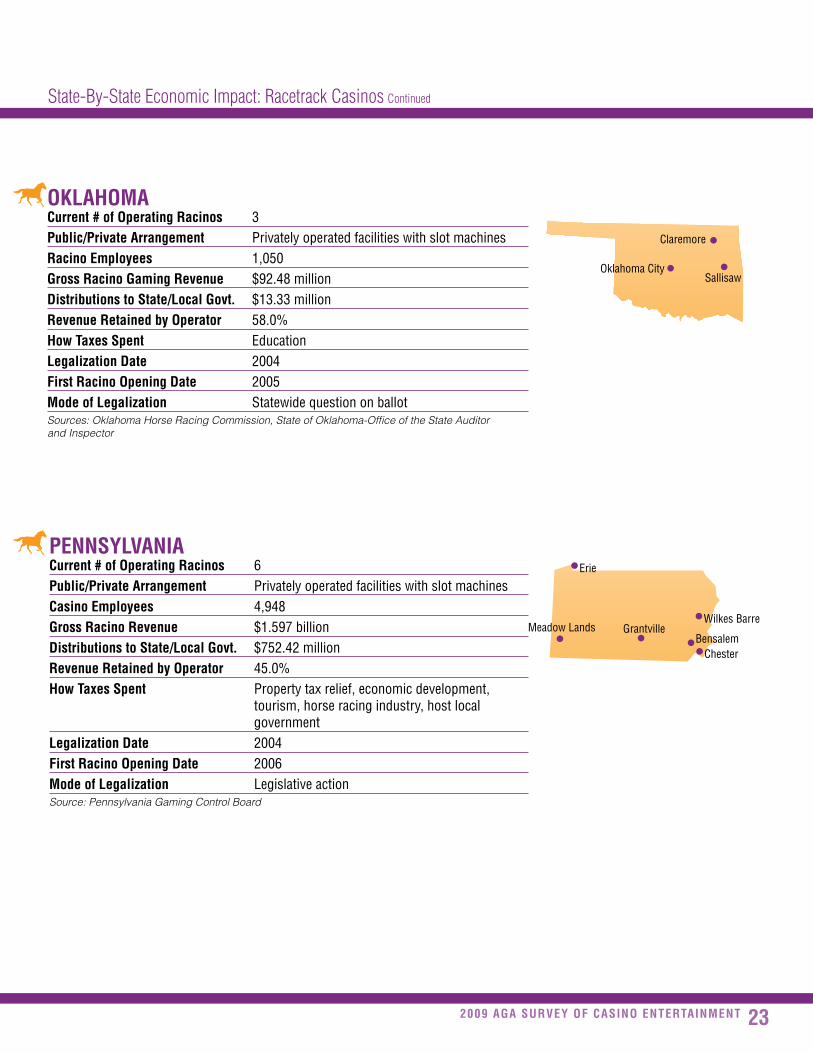
oKlAhomACurrent # of operating racinos 3Public/Private Arrangement Privatelyoperatedfacilitieswithslotmachinesracino employees 1,050Gross racino Gaming revenue $92.48milliondistributions to State/local Govt. $13.33millionrevenue retained by operator 58.0%how taxes Spent Educationlegalization date 2004first racino opening date 2005mode of legalization StatewidequestiononballotSources: Oklahoma Horse Racing Commission, State of Oklahoma-Office of the State Auditor and Inspector
PennSylvAnIACurrent # of operating racinos 6Public/Private Arrangement PrivatelyoperatedfacilitieswithslotmachinesCasino employees 4,948Gross racino revenue $1.597billiondistributions to State/local Govt. $752.42millionrevenue retained by operator 45.0%how taxes Spent Propertytaxrelief,economicdevelopment, tourism,horseracingindustry,hostlocal governmentlegalization date 2004first racino opening date 2006mode of legalization LegislativeactionSource: Pennsylvania Gaming Control Board
OklahomaCity
Claremore
Sallisaw
Erie
WilkesBarreMeadowLands
BensalemChester
Grantville

2� 2009 AGA Survey of CASIno entertAInment
State-by-State economic Impact: Racetrack Casinos Continued
rhode ISlAndCurrent # of operating racinos 2Public/Private Arrangement Publiclyrunvideolotteryterminalswith distributionstooperatorsracino employees 1,310Gross racino Gaming revenue $407.50milliondistributions to State/local Govt. $302.70million1
revenue retained by operator 27.3%2
how taxes Spent Generalfundlegalization date 1992first racino opening date 1992mode of legalization Legislativeaction1FY 2008 2FY 2008 data was used to calculate revenue retained by operator.
Source: Rhode Island Lottery
WeSt vIrGInIACurrent # of operating racinos 4Public/Private Arrangement Publiclyrunvideolotteryterminalswith distributionstooperators;tablegamesin twolocationsracino employees 5,270Gross racino Gaming revenue $951.21milliondistributions to State/local Govt. $430.24millionrevenue retained by operator 44.6%how taxes Spent Education,seniorcitizensandtourismlegalization date 1994first racino opening date 1994mode of legalization Localoptionvote,legislativeactionSource: West Virginia Lottery
Lincoln
Newport
Chester
WheelingCharlesTown
CrossLanes

252009 AGA Survey of CASIno entertAInment
Special Section: Casinos and their Role in U.S. tourism ContinuedSPeCIaL SeCtIoNCASInoS And theIr role In u.S. tourISm
Travel and tourism are essential to the health of the U.S. economy, and casinos play a key role
in the $740 billion U.S. travel and tourism industry, according to results of a recent national public opinion poll and a new survey of tourism industry professionals.
Both surveys were conducted by VP Communications, Inc. in conjunction with national pollster Peter D. Hart. The national survey polled 804 adult Americans from across the U.S., while the travel-specific survey polled 200 executive-level officials at convention and visitors bureaus, destination marketing organizations, city and state tourism offices, and city and state economic development offices, among others. More than half of the respondents have been working in travel and tourism for 16 years or more.
According to the results, nearly nine out of 10 (87 percent) Americans think promoting domestic tourism can help the economy, and travel professionals say the government has a major role to play in promoting the industry. Fully 88 percent think state and local governments should fund tourism marketing efforts, and more than three-quarters (77 percent) say the federal government also should get involved in promoting travel as a means to stimulate the overall economy.
There is broad understanding among Americans and travel professionals that casinos are vital components of the overall travel and tourism industry in the U.S. Nearly two-thirds (65 percent) of Americans and 84 percent of travel professionals — those who know the industry best — say casinos are an important part of the broader tourism economy.
In fact, more than two-thirds (67 percent) of travel professionals in gaming states say casinos are an important component of their states’ travel and tourism industries. More than four out of five (82 percent) say their local casinos encourage leisure travel to the region, and 76 percent agree there is a
positive, ripple effect from casino customers visiting other attractions in the area. More than three-quarters (78 percent) think casinos and the visitors they attract have benefited other businesses as well as the overall economic well-being of their states.
Among travel industry professionals from states without casinos, attitudes are similarly sanguine about casinos’ potential impact on their area. An overwhelming 90 percent say their states would be able to attract more leisure travelers from out-of-state if casinos were added to the entertainment mix, and more than three-quarters (77 percent) agree their states would be able to attract more meeting and convention business if it had casinos.
In fact, business meetings and event travel are an important component of the overall U.S. travel and tourism industry. Nearly two-thirds (62 percent) of Americans have attended a meeting or convention out of town, and a significant majority — 87 percent — of those travelers think meetings and conventions are important to running a good business.
According to travel professionals, however, recent activity in Washington is threatening this vital segment of the industry. More than three-quarters (79 percent) say the recent criticisms of meetings and events by elected officials and the media have hurt business travel in the U.S.
Casinos in particular have been labeled by some as inappropriate venues for business meetings, but fully 76 percent of travel professionals disagree with that notion. In fact, three-quarters (75 percent) say casinos are a vital component of the business travel market.
The following section outlines the results of these and other data highlighting the value of business and leisure travel to local communities across the country and the vital role casinos play in helping this industry strengthen and grow the overall national economy.
26 2009 AGA Survey of CASIno entertAInment
Special Section: Casinos and their Role in U.S. tourism Continued
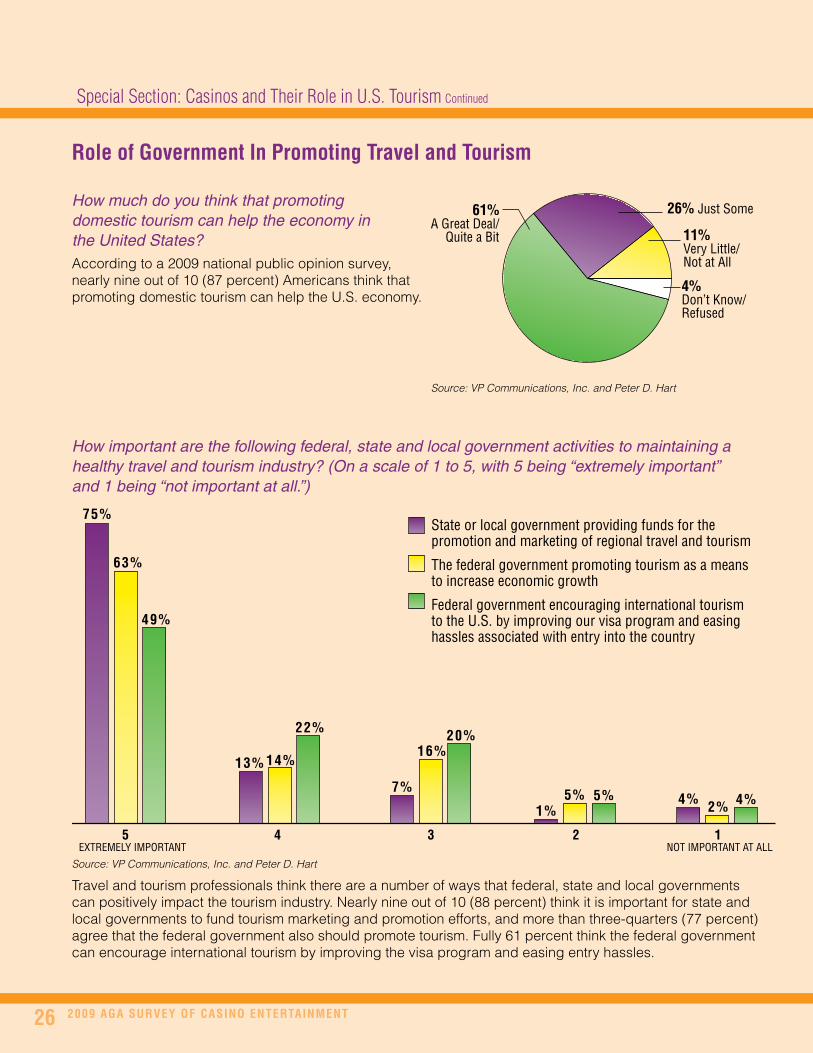
How much do you think that promoting domestic tourism can help the economy in the United States?According to a 2009 national public opinion survey, nearly nine out of 10 (87 percent) Americans think that promoting domestic tourism can help the U.S. economy.
How important are the following federal, state and local government activities to maintaining a healthy travel and tourism industry? (On a scale of 1 to 5, with 5 being “extremely important” and 1 being “not important at all.”)
Source: VP Communications, Inc. and Peter D. Hart
Travel and tourism professionals think there are a number of ways that federal, state and local governments can positively impact the tourism industry. Nearly nine out of 10 (88 percent) think it is important for state and local governments to fund tourism marketing and promotion efforts, and more than three-quarters (77 percent) agree that the federal government also should promote tourism. Fully 61 percent think the federal government can encourage international tourism by improving the visa program and easing entry hassles.
Source: VP Communications, Inc. and Peter D. Hart
26% Just Some
4% Don’t Know/Refused
61%A Great Deal/
Quite a Bit 11% Very Little/Not at All
0
10
20
30
40
50
60
70
80
75%
4 3 2 15
14%13%
49%
63%
22%
State or local government providing funds for the promotion and marketing of regional travel and tourism
The federal government promoting tourism as a meansto increase economic growth
Federal government encouraging international tourism to the U.S. by improving our visa program and easing hassles associated with entry into the country
16%
7%
20%
5%1%
5%2%4% 4%
EXTREMELY IMPORTANT NOT IMPORTANT AT ALL
role of Government In Promoting travel and tourism

272009 AGA Survey of CASIno entertAInment
Special Section: Casinos and their Role in U.S. tourism Continued
How important do you think the casino industry is in terms of the overall travel and tourism industry in the U.S.?
value of Casinos
How important do you think the casino industry is in terms of the overall travel and tourism industry in your state? More than two-thirds (67 percent) of travel professionals in gaming states see the casino entertainment industry as a “very important” or “somewhat important” part of their states’ overall tourism industries.
Source: VP Communications, Inc. and Peter D. Hart
Large majorities of Americans and travel and tourism professionals think the casino industry is important to the overall travel and tourism industry. Nearly two-thirds (65 percent) of the American public and a whopping 84 percent of travel professionals recognize the value of casinos to the broader industry.
0
20
40
60
80
100
65%
National Survey Respondents
15%
84%
3%
32%
1%
Very Important/Somewhat Important
Only a Little Important/Not Important at All
Don’t Know/Refused
Travel and Tourism ProfessionalsSource: VP Communications, Inc. and Peter D. Hart
30% Only a Little Important/Not Important at All
2% Don’t Know/Refused
67%Very Important/
Somewhat Important

28 2009 AGA Survey of CASIno entertAInment
Special Section: Casinos and their Role in U.S. tourism Continued
Have casinos in your state done more to encourage or discourage leisure travel in your region? More than four out of five (82 percent) gaming state tourism professionals think that casinos have helped to encourage leisure travel in their region.
How much have casinos and the visitors they attract helped businesses and the overall economic environment in your state? A vast majority (78 percent) of travel and tourism professionals in gaming states think that the overall economic environment in their states benefit from the existence of casinos and the tourism they generate.
Do you agree or disagree with the following: “Casino destinations attract tourists, and many of these people also visit other major sites in the surrounding areas, thereby helping the overall economy in the region.”
Source: VP Communications, Inc. and Peter D. Hart
7% Discourage
11% Don’t Know/Refused
82%Encourage
Source: VP Communications, Inc. and Peter D. Hart
14% Very Little/Not at All
8% Don’t Know/Refused
37%Just Some
41%A Great Deal/
Quite a Bit
Source: VP Communications, Inc. and Peter D. Hart
Fully 76 percent of Americans and travel professionals think that casinos bring in tourists that then visit other attractions in the area, thereby helping to improve the economy of the entire region.
0
10
20
30
40
50
60
70
80
76%
National Survey Respondents
22%
76%
1%
19%
2%
Very Much Agree/Somewhat Agree
Somewhat Disagree/Very Much Disagree
Neither Agree Nor Disagree
Don’t Know/Refused
Travel and Tourism Professionals
3% 0%

292009 AGA Survey of CASIno entertAInment
Special Section: Casinos and their Role in U.S. tourism Continued
If introduced in your state, how much do you think casino resorts would increase tourism and economic development? A majority (57 percent) of travel and tourism professionals from non-casino states thinks tourism would increase a “great deal” or “quite a bit” with the addition of casinos, and more than four out of five (83 percent) say casinos would have at least some positive impact in this area.
Do you agree or disagree with the following: “If casinos were introduced, my state would be able to attract more leisure travelers from out-of-state.” Nine out of 10 (90 percent) travel and tourism professionals from non-casino states agree that the introduction of casinos in their state would better equip their states to attract more out-of-state leisure travelers.
Source: VP Communications, Inc. and Peter D. Hart
14% Very Little/Not at All
4% Don’t Know/Refused
26%Just Some
57%A Great Deal/
Quite a Bit
Source: VP Communications, Inc. and Peter D. Hart
10% Somewhat Disagree/Strongly Disagree
90% Strongly Agree/
Somewhat Agree

�0 2009 AGA Survey of CASIno entertAInment
Special Section: Casinos and their Role in U.S. tourism Continued
value of meetings
Have you ever attended a meeting or convention for work that took you out of town for at least one night?
And, based upon your experience, how important do you think meetings and conventions are to running a strong business?
Sixty-two percent of Americans have attended an out-of-town meeting or convention, and an overwhelming majority of them (87 percent) think such functions are “very important” or “somewhat important” to running a successful business.
Source: VP Communications, Inc. and Peter D. HartSource: VP Communications, Inc. and Peter D. Hart
Do you agree or disagree with the following statement: “Elected officials and the media have hurt business travel in the U.S., particu-larly conventions and meetings, by criticizing these events as not involving real business.” More than three-quarters (79 percent) of travel and tourism professionals think the recent rhetoric has damaged business travel in the U.S.
37%No62%
Yes 1% Depends on the Type of Business
12%Only a Little Important/Not Important at All87%
Very Important/Somewhat Important
Source: VP Communications, Inc. and Peter D. Hart
4% Don’t Know/Refused
18%Somewhat Disagree/Very Much Disagree
79%Very Much Agree/Somewhat Agree

��2009 AGA Survey of CASIno entertAInment
Special Section: Casinos and their Role in U.S. tourism Continued
Casinos and meetings
Do you agree or disagree with the following: “Casino resorts are not appropriate locations for holding meetings or conventions. Serious business just can’t get done there.”
More than three-quarters (76 percent) of travel and tourism professionals think casino resorts are appropriate places for business meetings and conventions.
Do you agree or disagree with the following: “Casinos are a vital part of the business travel market because they host a large number of meetings and conventions every year.”
Source: VP Communications, Inc. and Peter D. Hart
2% Don’t Know/
Refused
76%Somewhat Disagree/Very Much Disagree
22%Very Much Agree/Somewhat Agree
Source: VP Communications, Inc. and Peter D. Hart
Three-quarters (75 percent) of travel and tourism professionals and almost two-thirds (66 percent) of Americans think casino resorts are a vital part of the business travel industry due to the significant number of meetings and conventions they host.
0
10
20
30
40
50
60
70
80
66%
National Survey Respondents
21%
75%
1%
26%
5%
Very Much Agree/Somewhat Agree
Somewhat Disagree/ Very Much Disagree
Neither Agree Nor Disagree
Don’t Know/Refused
Travel and Tourism Professionals
6% 0%

�2 2009 AGA Survey of CASIno entertAInment
Special Section: Casinos and their Role in U.S. tourism Continued
How successful are the casino meeting and convention facilities in your state in terms of attracting meeting business…?
Source: VP Communications, Inc. and Peter D. Hart
A substantial majority of travel and tourism professionals from gaming states familiar with casinos’ efforts to attract meetings and conventions think that casino facilities have been either “very successful” or “somewhat successful” at attracting business travelers. Specifically, 76 percent say casinos had success bringing in business from out of state, and 84 percent say they have been successful at attracting meeting business from within the state.
0
20
40
60
80
100
76%
From outside the state
17%
84%
22%
Very Successful/ Somewhat Successful
Only a Little Successful/Not Successful at All
From within the state
Source: VP Communications, Inc. and Peter D. Hart
5% Don’t Know/Refused
18%Somewhat Disagree/Strongly Disagree
77%Strongly Agree/
Somewhat Agree
Do you agree or disagree with the following: “If casinos were introduced, my state would be able to attract more meeting and convention business.” More than three-quarters (77 percent) of travel and tourism professionals in non-casino states think their states would be able to bring in more meeting and convention business if casinos were introduced.
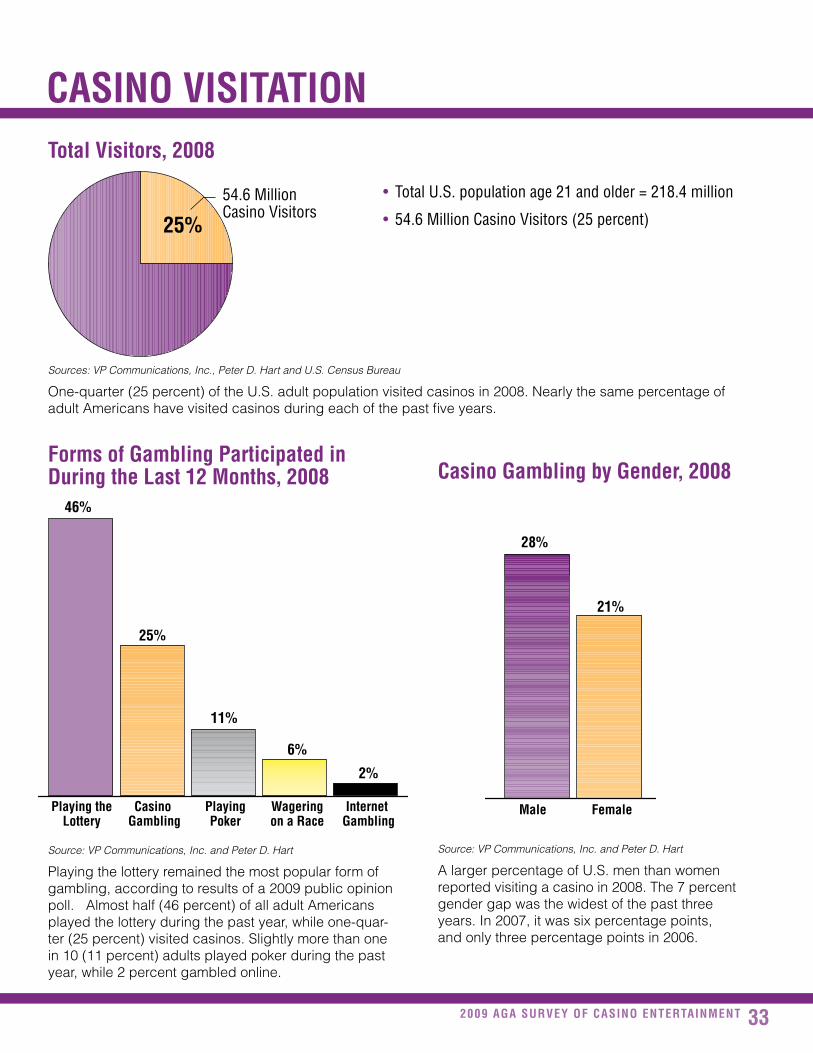
��2009 AGA Survey of CASIno entertAInment
0
5
10
15
20
25
30
21%
28%
Male Female
CASIno vISItAtIon total visitors, 2008
• TotalU.S.populationage21andolder=218.4million
• 54.6MillionCasinoVisitors(25percent)
forms of Gambling Participated in during the last �2 months, 2008
Source: VP Communications, Inc. and Peter D. Hart
Playing the lottery remained the most popular form of gambling, according to results of a 2009 public opinion poll. Almost half (46 percent) of all adult Americans played the lottery during the past year, while one-quar-ter (25 percent) visited casinos. Slightly more than one in 10 (11 percent) adults played poker during the past year, while 2 percent gambled online.
Casino Gambling by Gender, 2008
Source: VP Communications, Inc. and Peter D. Hart
A larger percentage of U.S. men than women reported visiting a casino in 2008. The 7 percent gender gap was the widest of the past three years. In 2007, it was six percentage points, and only three percentage points in 2006.
25%
54.6 Million Casino Visitors
0
10
20
30
40
50
6%
11%
46%
25%
Playing theLottery
PlayingPoker
Wageringon a Race
Casino Gambling
Internet Gambling
2%
Sources: VP Communications, Inc., Peter D. Hart and U.S. Census Bureau
One-quarter (25 percent) of the U.S. adult population visited casinos in 2008. Nearly the same percentage of adult Americans have visited casinos during each of the past five years.

�� 2009 AGA Survey of CASIno entertAInment
SPotlIGht on PoKer
Consumer Spending on Poker in nevada and new Jersey
In keeping with the trend established by overall gaming revenues, consumer spending on poker decreased in Nevada and New Jersey — the two largest commercial gaming states — during 2008. It should be noted, however, that poker revenues declined at a more gradual rate than overall gaming revenues in those same states. Poker spending in Nevada dropped 7.3 percent, while gaming revenues decreased by 9.7 percent. In New Jersey, spending on poker decreased by only 2.1 percent, compared to an 8.5 percent drop in gaming revenues overall.
Poker Participation: Six-year trend
$ Billions
2003 2004 2005 2006 2007
12%
14%
18% 18%
13%
11%
2008
0
50
100
150
200
Nevada Poker Revenue
New Jersey Poker Revenue
20062005
$ Millions
1998 1999 2000 2001 2002 2003 2004
$58.4 $62.7 $57.5$68.0
$36.2 $35.6 $34.4 $32.5 $37.1
$67.0$62.6
$52.9
$140.2
$160.8
$77.3
2007 2008
$168.0
$84.2
0
50
100
150
200
$82.4
$98.8
$59.3
$155.7
10
15
20
$32.42$34.13
20
25
30
35
$32.540
2003 2004 2005 2006 2007
12%
14%
18% 18%
13%
10
15
20
11%
2008
Poker is still a popular game, as 11 percent of Americans report playing poker either in person or over the Internet in 2008. However, participation rates have been falling steadily since 2005, the year that seems to represent the high-water mark of the poker boom.
Source: VP Communications, Inc. and Peter D. Hart
Poker is a popular game played in locations from commercial and tribal casinos to card rooms to living rooms across the country. While the popularity of the game has ebbed slightly from the height of the poker boom a few years ago, it still is a staple game for casinos, and poker tournaments continue to be found on a variety of television channels throughout the year.
Sources: State Gaming Regulatory Agencies

�52009 AGA Survey of CASIno entertAInment
Slot machines
Blackjack RouletteCrapsPoker
0
10
20
30
40
50
60
70
80
Visited a bar or club
Ate at a fine dining restaurant
Went shopping
Saw a show, concert orother live entertainment
48%
40%
77%
51%
34%
Used recreational facilities, suchas a spa, pool or fitness area
CASInoS AS entertAInment
top five favorite Casino GamesSlot machines continued to be the most popular casino game, with almost two-thirds (62 percent) of respondents in a 2009 survey saying slots are their preferred form of casino gambling. More than one in five (21 percent) said blackjack is their favorite. Poker, craps and roulette were the only other games to receive significant support.
Source: VP Communications, Inc. and Peter D. Hart
When you visited a casino this past year, in what other activities did you participate?
Today’s commercial casinos provide top-notch en-tertainment experiences that go far beyond gaming, and 2009 survey results show that visitors are taking full advantage of casino resorts’ non-gaming ameni-ties. During their casino visits during the past year, more than three-quarters (77 percent) ate at a fine dining restaurant, more than half (51 percent) saw a show, concert or other live entertainment, and almost half (48 percent) visited a bar or night club.
0
10
20
30
40
50
60
70
80
Playing theLottery
PlayingPoker
Wageringon a Race
Casino Gambling
Internet Gambling
PlayingPoker
Wageringon a Race
Internet Gambling
2%
Slot machines
Blackjack RouletteCrapsPoker
3%7%
62%
21%
3%
Source: VP Communications, Inc. and Peter D. Hart
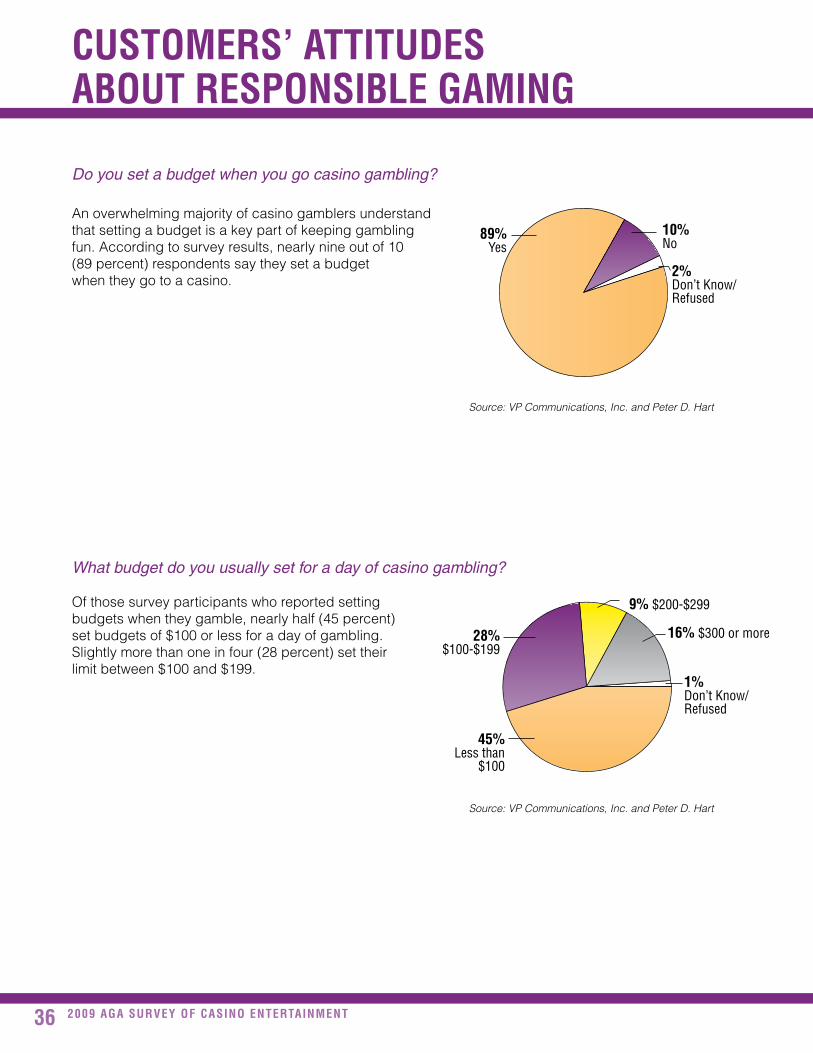
�6 2009 AGA Survey of CASIno entertAInment
CuStomerS’ AttItudeS ABout reSPonSIBle GAmInG
Do you set a budget when you go casino gambling?
Source: VP Communications, Inc. and Peter D. Hart
An overwhelming majority of casino gamblers understand that setting a budget is a key part of keeping gambling fun. According to survey results, nearly nine out of 10 (89 percent) respondents say they set a budget when they go to a casino.
What budget do you usually set for a day of casino gambling?
Source: VP Communications, Inc. and Peter D. Hart
Of those survey participants who reported setting budgets when they gamble, nearly half (45 percent) set budgets of $100 or less for a day of gambling. Slightly more than one in four (28 percent) set their limit between $100 and $199.
28%$100-$199
16% $300 or more
9% $200-$299
1% Don’t Know/Refused
45%Less than
$100
89%Yes
2% Don’t Know/Refused
10%No

�72009 AGA Survey of CASIno entertAInment
0
10
20
30
40
50
60
0
10
20
30
40
50
60
4% 3%3%0%
20072006200520042003
30%
35%
29%
49%
57%
50%
18%
27% 27%
16% 16%16%14%
2%
15%
3%
52%
28%
Acceptable for Others but Not You Personally
Perfectly Acceptable for Anyone
Don’t Know/Refused
Not Acceptable for Anyone
200220012000 20092008
51%
54%54%
28%28%26%
16%16%17%
5%2%3%
43%
38%
1%
17%
54% 54%
AmerICAn PerCePtIonS of CASIno entertAInment
u.S. Casino Gaming Acceptability, 2000-2009
Source: VP Communications, Inc. and Peter D. Hart
Overall acceptability remained high, with 81 percent of respondents deeming casino gambling acceptable for themselves or others. This percentage is consistent with the acceptability figures from the past decade.
A 2009 national public opinion poll conducted by VP Communications, Inc. and national pollster Peter D. Hart found that 81 percent of Americans think casino gaming is acceptable for themselves or others. Poll results also show that Americans view casino gaming as a form of recreation on par with concerts, plays and sporting events, in which participants pay for an entertainment experience. The poll also indicates that Americans see many ways that casinos benefit communities, such as job creation, tax revenues, economic development and tourism.
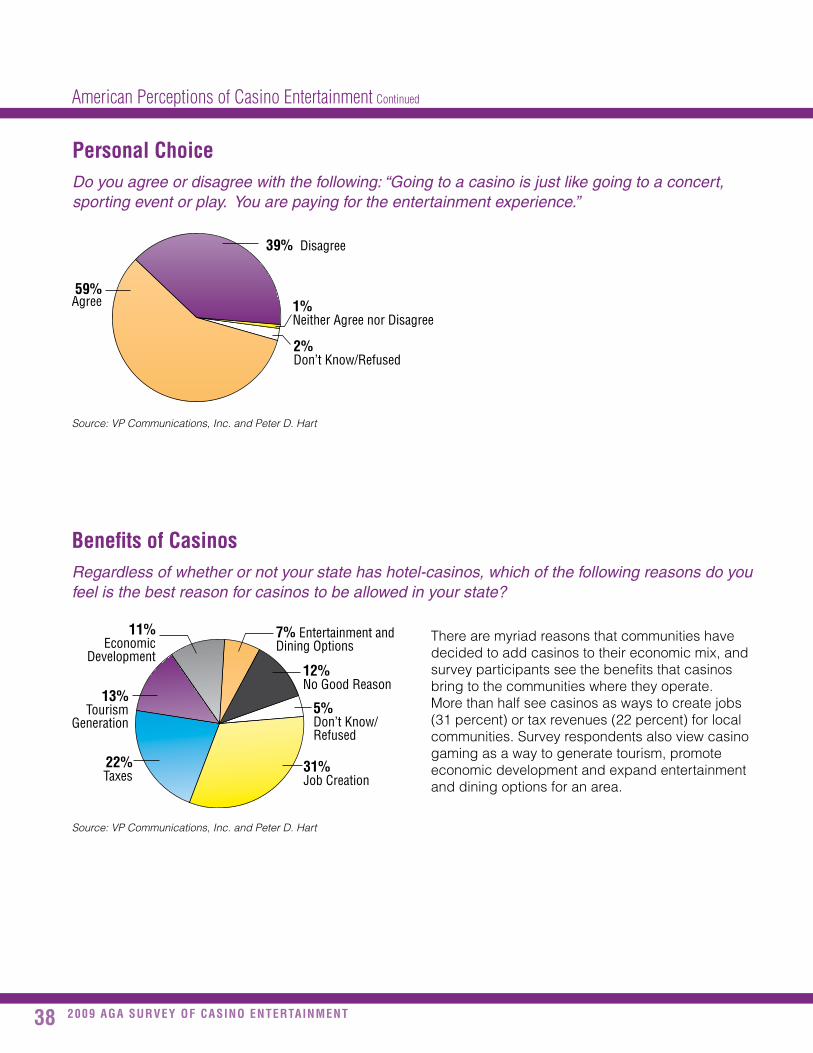
�8 2009 AGA Survey of CASIno entertAInment
Personal ChoiceDo you agree or disagree with the following: “Going to a casino is just like going to a concert, sporting event or play. You are paying for the entertainment experience.”
Benefits of CasinosRegardless of whether or not your state has hotel-casinos, which of the following reasons do you feel is the best reason for casinos to be allowed in your state?
1% Neither Agree nor Disagree
2% Don’t Know/Refused
59%Agree
39% Disagree
Source: VP Communications, Inc. and Peter D. Hart
Source: VP Communications, Inc. and Peter D. Hart
13%Tourism
Generation
7% Entertainment and Dining Options
11%Economic
Development
5% Don’t Know/Refused
22%Taxes
31% Job Creation
12% No Good Reason
There are myriad reasons that communities have decided to add casinos to their economic mix, and survey participants see the benefits that casinos bring to the communities where they operate. More than half see casinos as ways to create jobs (31 percent) or tax revenues (22 percent) for local communities. Survey respondents also view casino gaming as a way to generate tourism, promote economic development and expand entertainment and dining options for an area.
american Perceptions of Casino entertainment Continued

�92009 AGA Survey of CASIno entertAInment
Bingo: A game of chance in which each player has one or more cards printed with differently numbered squares on which to place markers when the respective numbers are drawn and announced by a caller. The first player to mark a complete pattern of numbers (e.g., a row) wins.
class i Game*: A social game that is not considered a game of chance, played solely for prizes of minimal value; or a traditional form of Indian gaming engaged in by individuals as a part of or in connection with tribal ceremonies or celebrations.
class ii Game*: A game of chance including (if played in the same location) bingo, pull-tabs, lotteries, punchboard and other games similar to bingo, whether live or electronic, in which players bet against other players; an electronic game played on a “linked” video gaming device that is connected to a central computer system.
class iii Game*: Any form of gaming besides a Class I and Class II game, including electronic gaming devices with random-number generators and house-banked table games.
commercial casino: A private-sector establishment (i.e., nongovernmental) — whether land-based, riverboat, dockside, limited-stakes or racetrack casino — that offers games of chance and is regulated and taxed by the state where it is located.
dockside casino: A casino on a body of water that is not required to cruise or is a permanently moored barge.
Effective tax rate: The total percentage a casino pays in taxes, including taxes on direct gross gaming revenue and admissions as well as corporate, payroll, real estate and other taxes similar to those paid by other businesses.
Electronic Gaming device, or EGd: Any mechanical or electronic game of chance, including slot machines, video lottery terminals (VLTs) and video bingo, video pull-tabs and video poker machines.
Gross Gaming revenue: The amount a gaming operation earns before taxes, salaries and other expenses are paid — the equivalent of “sales,” not “profit.”
handle: The estimated total amount wagered, including the winnings returned to players.
house advantage: A measure of how much a casino expects to win, expressed as a percentage of the player’s wager.
house-banked Game: A game in which the player bets against the house; Class III games (e.g., blackjack and other table games).
land-based casino: A casino that is built on an earth foundation, not on a waterway.
limited-stakes casino: A casino in which the allowable bet on a single hand is limited to a maximum wager.
odds: 1) the probability of winning; 2) the payout in relation to amount wagered, e.g., winning odds.
Pari-mutuel: A system of betting on races whereby the winners divide the total amount bet, after deducting management expenses, in proportion to the sums they have wagered individually.
Player-banked Game: A game in which the player bets against other players; Class II games (e.g., bingo and pull-tabs).
Pull-tabs: A game of chance in which a player opens perforated windows on a paper card, matching symbols on the card to win. Each group, referred to as a set, of pull-tabs has a unique prize structure; winners collect the prize that correlates to the specific pull-tab set.
racetrack casino, or racino: A hybrid of a pari-mutuel venue — horse track, dog track or jai alai court — and a casino. Typically, the “casino” at a racino offers only slot machine games.
random-number Generator: A mechanism inside the computer of a Class III game that ensures that each pull has an equal chance of hitting the jackpot.
Slot machine: Any mechanical or electronic device in which outcomes are determined by a random-number generator located inside the terminal.
video Bingo: An electronic version of traditional bingo.
video lottery terminal, or vlt: An electronic game of chance played on a video terminal that is networked and can be monitored, controlled and audited by a central computer system. These games are authorized through the state lottery and considered by law to be lotteries, not commercial gaming.
video Pull-tabs: An electronic version of paper pull-tabs.
Glossary of Gaming terms
APPendIx
*Class I, Class II and Class III are legal terms in the context of the Indian Gaming Regulatory Act (IGRA), but for the purposes of this survey help define the type of gaming operating in different states.
Sources: American Gaming Association; The American Heritage® Dictionary of the English Language, Fourth Edition; Christiansen Capital Advisors; Indian Gaming Regulatory Act (IGRA); National Gambling Impact Study Commission Report; National Indian Gaming Commission; Nevada Gaming Control Board Regulation 29

�0 2009 AGA Survey of CASIno entertAInment
appendix Continued
Index of ChartsNational Economic impact of casino Entertainment
Casino Locations by Category (Map) .....................................................4
Casinos Per State (Data Table) ...............................................................4
U.S. Consumer Spending on Commercial Casino Gaming, 1999-2008 ...............................................5
Gaming and the Recession: What Percentage of Americans Who Participate in Various Leisure Activities Are Cutting Back on Their Participation? ............................................................................5
State-by-State Consumer Spending on Commercial Casino Gaming, 2007 vs. 2008 ..........................................6
Commercial Casino Tax Revenue by State, 2007 vs. 2008 ....................6
Top 20 U.S. Casino Markets, 2008 .........................................................7
Commercial Casino Spending vs. Other Spending Choices, 2008 .......7
Commercial Casino Jobs by State, 2007 vs. 2008 .................................8
Commercial Casino Wages, 2000-2008 .................................................8
Spotlight on racetrack casinosRacetrack Casino Tax Distributions to State and Local Governments, 2007 vs. 2008 .................................................9
Racetrack Casino Jobs by State, 2007 vs. 2008 ....................................9
Consumer Spending on Racetrack Casinos, 2002-2008 .....................10
Top 10 U.S. Racetrack Casino Markets, 2008 ......................................10
State-by-State Consumer Spending on Racetrack Casinos, 2007 vs. 2008 .......................................................10
aGEm Spotlight on Gaming Equipment manufacturersGaming Equipment Manufacturing Economic Output, 2005-2008 ......11
Gaming Equipment Manufacturing Employment, 2005-2008 ..............11
Gaming Equipment Manufacturing Salaries and Wages, 2005-2008 .............................................................................................12
Gaming Equipment Manufacturers with Employees Covered by Employer-sponsored Health Care Plans ...........................12
Gaming Equipment Manufacturers with Employees Covered by Employer-sponsored Retirement Plans .............................12
Purchases Made from Local Vendors by Gaming Equipment Manufacturers ..................................................12
Special Section: casinos and their role in u.S. tourismrole of Government in Promoting travel and tourism
How Much Do You Think That Promoting Domestic Tourism Can Help the Economy in the United States? .........................26
How Important Are Federal, State and Local Government Activities to Maintaining a Healthy Travel and Tourism Industry? ................................................................26
value of casinos
How Important Do You Think the Casino Industry is in Terms of the Overall Travel and Tourism Industry in the U.S.? .......................27
How Important Do You Think the Casino Industry is in Terms of the Overall Travel and Tourism Industry in Your State? .....................27
Have Casinos in Your State Done More to Encourage or Discourage Leisure Travel in Your Region? ......................................28
How Much Have Casinos and the Visitors They Attract Helped Businesses and the Overall Economic Environment in Your State? ........................................................................................28
Agree or Disagree: Casino Destinations Attract Tourists, and Many of These People Also Visit Other Major Sites in the Surrounding Areas, Thereby Helping the Overall Economy in the Region .........................................................................28
If Introduced in Your State, How Much Do You Think Casino Resorts Would Increase Tourism and Economic Development? .................................................29
Agree or Disagree: If Casinos Were Introduced, My State Would Be Able to Attract More Leisure Travelers from Out-of-State ...................................................................................29
value of meetings
Have You Ever Attended a Meeting or Convention for Work that Took You Out of Town for at Least One Night? ...............30
Based Upon Your Experience, How Important Do You Think Meetings and Conventions are to Running a Strong Business? .............................................................30
Agree or Disagree: Elected Officials and the Media Have Hurt Business Travel in the U.S., Particularly Conventions and Meetings, by Criticizing These Events as Not Involving Real Business.............................................................30
casinos and meetings
Agree or Disagree: Casino Resorts are Not Appropriate Locations for Holding Meetings or Conventions. Serious Business Just Can’t Get Done There .......................................31
Agree or Disagree: Casinos Are a Vital Part of the Business Travel Market Because They Host a Large Number of Meetings and Conventions Every Year ...............................31
How Successful Are the Casino Meeting and Convention Facilities in Your State in Terms of Attracting Meeting Business? ...............................................................32
Agree or Disagree: If Casinos Were Introduced, My State Would Be Able to Attract More Meeting and Convention Business .....................................................................32
casino visitationTotal Visitors, 2008 ................................................................................33
Forms of Gambling Participated in During the Last 12 Months, 2008 ..........................................................33
Casino Gambling by Gender, 2008 ......................................................33
Spotlight on PokerConsumer Spending on Poker in Nevada and New Jersey .................34
Poker Participation: Six-Year Trend .......................................................34
casinos as EntertainmentTop Five Favorite Casino Games ..........................................................35
When You Visited a Casino This Past Year, In What Other Activities Did You Participate? .......................................35
customers’ attitudes about responsible GamingDo You Set a Budget When You Go Casino Gambling? .......................36
What Budget Do You Usually Set for a Day of Casino Gambling? .....................................................................36
american Perceptions of casino EntertainmentU.S. Casino Gaming Acceptability, 2000-2009 ....................................37
Agree or Disagree: Going to a Casino Is Just Like Going to a Concert, Sporting Event or Play...........................................................................38
What Are the Best Reasons for Allowing Casinos in Your State? ............................................................38
��2009 AGA Survey of CASIno entertAInment
appendix Continued
methodologyvP communications, inc. and Peter d. hartVP Communications, Inc and Peter D. Hart jointly produced the national public opinion survey and the study of tourism professionals for the 2009 States of the States report.
Peter Hart has collaborated on the survey research associated with the AGA State of the States report for more than a decade. He is chairman of Peter D. Hart Research Associates and co-director of the NBC/Wall Street Journal poll.
For the national survey, VP Communications interviewed a base sample of 804 adult Americans from Feb. 19-24, 2009. The margin of error for the total sample was +/- 3.5 percent. Interviews were conducted by telephone using Random Digit Dial sampling.
VP Communications also conducted the survey of 200 tourism industry professionals from March 10-18, 2009. Respondents were invited to complete the survey online or via phone interview. The margin of error for the total sample was +/- 6.9%.
Founded in 1999 and based in Alexandria, Va., VP Communications conducts strategic public opinion research for corporate, political and trade association clients. The company specializes in quantitative, survey-based research as well as qualitative, focus group and dial testing studies.
contact: vP communications andrew Smith 703-535-6553
contact: Peter d. hart research associates Peter hart 202-234-5570
association of Gaming Equipment manufacturers (aGEm)/applied analysisIn 2009, the Association of Gaming Equipment Manufac-turers (AGEM) retained Applied Analysis (AA) to prepare an update to an economic impact analysis for the global gaming supplier segment of the gaming industry that was prepared in 2008.
Economic impact measures were segmented into direct impacts and indirect impacts. Direct impacts measure the effects of the specific force being considered. In this case, gaming equipment manufacturing jobs are considered direct jobs and the wages and salaries they are paid are considered direct personal income. Indirect impacts consider how other businesses respond to the impacting condition. Employees at part suppliers, for ex-ample, are considered indirect employees to the extent their jobs are dependent, in full or in part, on the suppli-ers’ income generated by industry-related purchases.
To identify and model the interrelationships in the economy, IMPLAN (Impact Analysis for Planning) software and databases were used. IMPLAN is an input-output model (or econometric system) that utilizes complex economic equations to explain how the “outputs” of one industry become the “inputs” of others, and vice versa. This relationship is sometimes referred to as the “multiplier effect,” illustrating how changes in one sector of the economy can affect other sectors.
AGEM is an international trade association representing manufacturers and suppliers of electronic gaming devices, systems, table games, key components and support products and services for the gaming industry. AGEM works to further the interests of gaming equipment suppliers throughout the world. Through political action, trade show partnerships, information dissemination and good corporate citizenship, the members of AGEM work together to create benefits for every company within the organization. AGEM has assisted regulatory commissions and participated in the legislative process to solve problems and create a business environment where AGEM members can prosper while providing a strong level of support to education and responsible gaming initiatives.
Applied Analysis (AA) is a Nevada-based economic analysis and gaming consulting firm with extensive experience in preparing economic and fiscal impact analyses. AA also maintains a broad range of gaming experience and has performed work for some of the largest gaming companies in the world. AA was retained by several organizations to review and analyze the economic, fiscal and social impacts of community investments and operations. This includes impacts on employment, wages and output as well as impacts on tax collection and public service demands.
contact: marcus Prater 702-812-6932
christiansen capital advisorsChristiansen Capital Advisors (CCA) assisted in this study by compiling and analyzing data relating to the direct economic impacts of casino gaming in each jurisdiction, as well as providing historical data on consumer spending at commercial casinos.
CCA provides unparalleled professional gambling and entertainment industry analysis and management services.
contact: Sebastian Sinclair 207-688-4500
�2 2009 AGA Survey of CASIno entertAInment
appendix Continued
AcknowledgmentsThe American Gaming Association would like to thank the following individuals and organizations for their assistance with the survey: the Association of Gaming Equipment Manufacturers (AGEM), Christiansen Capital Advisors, Derris Newman of the Innovation Group, Terry Wade and TheWadeGroup, Inc., and the industry’s state associations and regulatory agencies.
frank J. fahrenkopf, Jr.President and CEO202-552-2675
Judy PattersonSenior Vice President and Executive Director202-552-2675
d. Brett haleVice President202-552-2682
dorothy r. JacksonVice President202-552-2672
holly thomsenDirector of Communications202-552-2686
andrew SmithDirector of Research202-552-2679
keli WallaceDirector of Special Projects202-552-2685
Brian lehmanCommunications Manager202-552-2680
melanie rothrockExecutive Assistant and Office Manager202-552-2670
anne EvansAssistant to the Senior Vice President and Project Coordinator202-552-2688
crissy masAdministrative Assistant202-552-2674
*For specific questions about the 2009 State of the States survey, please contact Andrew Smith or Holly Thomsen.
InduStry ASSoCIAtIonSassociation of Gaming Equipment manufacturers (aGEm)marcus Prater702-812-6932 casino association of indianamike Smith317-231-7030
casino association of New JerseyJoe corbo609-317-7007
colorado Gaming associationlois rice303-237-5480
deadwood (S.d.) Gaming associationvicki Johnson605-578-1876 illinois casino Gaming associationtom Swoik217-546-0945
iowa Gaming associationWes Ehrecke515-267-9200
louisiana casino associationWade duty225-344-0037
michigan Gaming associationrob russell517-507-3858
mississippi casino operators associationBeverly martin228-388-0087
missouri Gaming associationmike Winter573-634-4001
National indian Gaming associationmark van Norman202-546-7711
Nevada resort associationBill Bible702-735-4888
AGA ContACtS*