STATE OF THE SEWERS 2016 - New York · PDF fileBill de Blasio Mayor Vincent Sapienza, P.E....
14
Bill de Blasio Mayor Vincent Sapienza, P.E. Acting Commissioner STATE OF THE SEWERS 2016 Performance Metrics Fiscal Year 2016 (July 1, 2015 through June 30, 2016) Catch Basin Cleaning
Transcript of STATE OF THE SEWERS 2016 - New York · PDF fileBill de Blasio Mayor Vincent Sapienza, P.E....
Bill de BlasioMayor
Vincent Sapienza, P.E. Acting Commissioner
STATE OF THE SEWERS 2016Performance MetricsFiscal Year 2016 (July 1, 2015 through June 30, 2016)
Catch Basin Cleaning

STATE OF THE SEWERS • 2016
New York City Department of Environmental Protection
TABLE OF CONTENTS
INTRODUCTION .........................................................................................................................................................................................................................................................................3
THE SEWER SYSTEM ..............................................................................................................................................................................................................................................................4
CEASE THE GREASE ................................................................................................................................................................................................................................................................5
PERFORMANCE METRICS .................................................................................................................................................................................................................................................6
Citywide .............................................................................................................................................................................................................................................................................................7
Sewer Backup and Catch Basin Resolution Time ..................................................................................................................................................................................................8
Bronx .....................................................................................................................................................................................................................................................................................................9
Brooklyn .......................................................................................................................................................................................................................................................................................... 10
Manhattan ..................................................................................................................................................................................................................................................................................... 11
Queens ............................................................................................................................................................................................................................................................................................. 12
Staten Island ................................................................................................................................................................................................................................................................................. 13

3
STATE OF THE SEWERS • 2016
New York City Department of Environmental Protection
INTRODUCTIONThe New York City Department of Environmental Protection (DEP) protects public health and the environment by supplying clean drinking water, collecting and treating wastewater, and reduc-ing air, noise, and hazardous materials pollution. To achieve this mission, DEP operates and main-tains 7,500 miles of sewers that convey an aver-age of 1.3 billion gallons of wastewater per day to 14 in-city wastewater treatment plants.
Over the last decade, DEP has embraced a data-driven, proactive approach to operating and maintaining the sewer system. By using a range of digital tools and innovative practices, DEP develops targeted programs to provide a high level of service to our customers while focusing on investments that will prioritize our resources.
Staten Island Bluebelt

4
STATE OF THE SEWERS • 2016
New York City Department of Environmental Protection
DRAINAGE TYPE
SEPARATE
COMBINED
OTHER
BLUEBELT
THE SEWER SYSTEMApproximately 60% of New York City’s sewer sys-tem is combined, handling sanitary waste from both homes and businesses as well as storm water. The other 40% of the sewer system is separated – sanitary sewers carry sewage to the treatment plant, while storm sewers carry storm water runoff in a separate pipe directly to a local waterway.
In wet weather, wastewater treatment plants that receive combined flow can treat up to twice the designed dry weather flow. However, to eliminate flooding from roadways, the capacity of the city’s sewer system is greater than that of the plants. When the plants reach their capacity at twice dry weather flow, regulators release the excess flow from the sewers into the harbor as combined sewer overflow to protect against sewage back-ing up into homes and businesses.
Sewers vary in size; however, all sewers are de-signed to convey wastewater through the system at a speed fast enough to minimize the deposi-tion of debris and sediment in the pipes but slow enough to minimize scouring and erosion. DEP targets its programs and resources to ensure the system continues to operate as designed and to maintain the system in a state of good repair.
To learn more about how DEP’s sewer system functions, click here.

5
STATE OF THE SEWERS • 2016
New York City Department of Environmental Protection
Door-to-Door Outreach Campaign to Visit 50,000 Homes in Southeast Queens to Encourage Residents to Properly Dispose of Grease and Help Reduce Sewer Backups
CEASE THE GREASENew York City needs the help of all of its residents to keep our sewer system running properly. Cooking oil and grease are wastes that the City’s sewer system cannot handle and should not be discarded down the drain. Grease can cling to the insides of pipes and the sewer system, building up and even-tually blocking pipes completely. If wastewater can’t move freely through pipes and out into the sewer system, it can back up into your home and can cause unsanitary conditions and damages that can be expensive to repair. To learn how to properly dispose of grease, click here.
6
STATE OF THE SEWERS • 2016
New York City Department of Environmental Protection
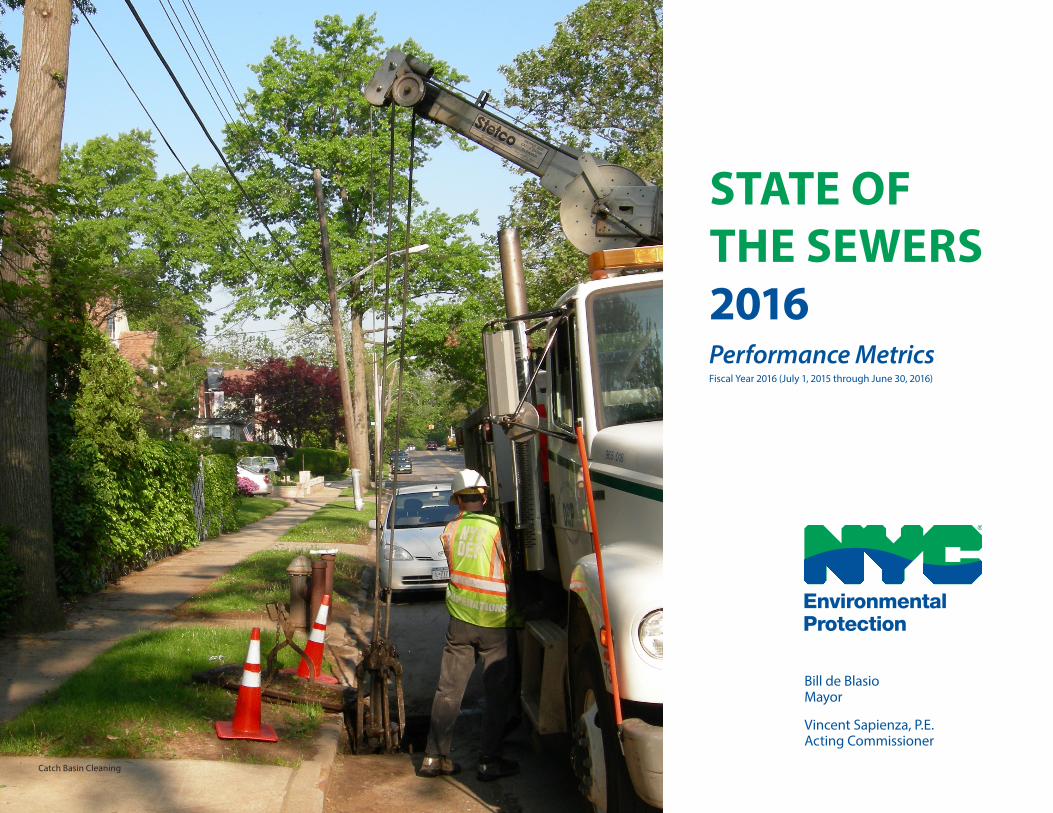
PERFORMANCE METRICSDEP uses a variety of metrics to evaluate our operations across the agency, from frontline supervisors to senior management. This data-driven approach allows us to focus our resources, develop targeted programs, and provide the highest level of ser-vice to our customers. All annual performance metrics in this report correspond to fiscal years. For example, Fiscal Year 2016 began July 1, 2015 and ended June 30, 2016.
Sewer Backup ComplaintsWhen our field crews respond to a customer call about a potential sewer backup, they first open manholes around the area where the backup or blockage is reported. If the sewer segment has higher than expected wastewater levels, the crew will note this as a “confirmed sewer backup” whether or not any backups occur. If a crew does not detect higher wastewater levels than expected, it is noted as an “unconfirmed sewer backup.”
Recurring Confirmed Backup ComplaintsThe sewer system is divided into 160,000 “sewer segments” that run between two adjacent manholes. In order to identify systemic issues, DEP tracks street segments with recurring confirmed sewer back- ups (multiple backups on the same segment in the same year) during both dry and wet weather.
Sewer CleaningProactive sewer cleaning includes miles of sewers cleaned as part of the inspection and analysis programs, regular sewer maintenance program, and the Department of Design and Construction inspection and cleaning. Sewer cleaning activities in re-sponse to a 311 complaint are categorized as “Reactive” cleaning
Confirmed Sewer Backup CausesAfter visually inspecting affected sewer segments, crews identify and record the po-tential cause of a confirmed sewer backup.
• “Grease” refers to the buildup of fats, oils, and grease in a sewer.
• “Debris” refers to sand, silt, and roadbed aggregate that accumulate along the bot-tom of the sewer.
• “Heavy Rain” refers to microbursts and other brief, heavy rainstorms that can tem-porarily overtax the sewer.
• “Other” includes backups where conditions warranted further investigation.Sewer Flushing

7
STATE OF THE SEWERS • 2016
New York City Department of Environmental Protection
DEP’s extensive and robust sewer inspec-tion, analysis and cleaning program contin-ues to net significant improvements across all key performance indicators citywide.
Total sewer backup complaints have fallen 25% since FY2012, and confirmed sewer backup complaints have fallen 49% over the same period.
The number of street segments with re-curring confirmed sewer backups has de-creased by 50% since FY2012. The number of street segments with recurring confirmed dry weather sewer backups also decreased by 47% since FY2012.
In FY2016, 71% of backups were related to grease; 16% attributed to debris; 8% attrib-uted to heavy rains and 5% due to other causes.
Systematic, proactive sewer cleaning has in-creased by 133%, while reactive sewer clean-ing has decreased by 67% from FY2012.
CITYWIDE
0
300
600
900
1,200
2012 2013 2014 2015 2016
Segm
ents
Fiscal Year
Recurring Confirmed Backup Segments
0
300
600
900
2012 2013 2014 2015 2016
Segm
ents
Fiscal Year
Recurring Confirmed Dry Weather Backup
Segments with Recurring Dry Weather SBUs
02,0004,0006,0008,000
10,00012,00014,00016,000
2012 2013 2014 2015 2016
spukcaB reweS
Fiscal Year
UnconfirmedConfirmed
Sewer Backup Complaints
Sewer Backup Complaints
Other5%
HeavyRain 8%
Debris16%
Grease71%
FY16 Confirmed Sewer Backup Causes
Citywide Sewer Backup Causes
0100200300400500600700
2012 2013 2014 2015 2016M
iles
Reactive Proactive
Sewer Cleaning Miles
Fiscal Year
Sewer Cleaning
Segments with Recurring SBUs

8
STATE OF THE SEWERS • 2016
New York City Department of Environmental Protection
New York City has more than 148,000 catch basins to col-lect storm water runoff from streets and sidewalks. DEP’s rigorous sewer and catch basin inspection, analysis, and cleaning program has produced improvements in the level of sewer service citywide.
Over the past five years, the time to resolve sewer-related issues has fallen significantly.
Sewer backup resolution times have fallen from a 2012 high of 5.59 hours to 3.7 hours in 2016 – a 33% total reduction.
Similarly, catch basin-related complaint resolution times have fallen from 5.05 days in 2012 to 3.75 days in 2016, a 26% total reduction.
SEWER BACKUP AND CATCH BASIN RESOLUTION TIME
0
2
4
6
8
2012 2013 2014 2015 2016
Hour
s
Fiscal Year
Sewer Backup Resolution Time
Avg Res Time Target (7 hours)
0
2
4
6
8
10
2012 2013 2014 2015 2016
Days
Fiscal Year
Catch Basin Complaint Resolution Time
Avg Res Time Target (9 days)
Sewer Backup Resolution Time
Catch Basin Complaint Resolution Time

9
STATE OF THE SEWERS • 2016
New York City Department of Environmental Protection
BRONXOver the past five years, total sewer back-up complaints have increased 8%, but confirmed sewer backup complaints have fallen 53%.
Since FY2012, the number of street seg-ments with recurring confirmed sewer backups has decreased by 50% and the number of street segments with recurring confirmed dry weather sewer backups de-creased by 63%.
In FY2016, 89% of backups were attributed to grease; 5% to debris; and 6% attributed to heavy rains and other factors.
Reactive sewer cleaning has decreased by 44% from FY2012. The drop in reactive cleaning is due to the continued decline in the number of confirmed sewer backups.
0200400600800
1,0001,2001,400
2012 2013 2014 2015 2016
spukcaB reweS
Fiscal Year
Unconfirmed
Confirmed
Sewer Backup Complaints
Other6% Debris
5%
Grease89%
FY16 Confirmed Sewer Backup Causes
Sewer Backup Complaints
Sewer Backup Causes
05
101520253035
2012 2013 2014 2015 2016
Segm
ents
Fiscal Year
Recurring Confirmed Backup SegmentsRecurring Backup Segments
0
5
10
15
20
25
30
2012 2013 2014 2015 2016
Segm
ents
Fiscal Year
Recurring Confirmed Dry Weather Backup SegmentsRecurring Dry Weather Backup Segments
05
1015202530354045
2012 2013 2014 2015 2016M
iles
Reactive Proactive
Sewer Cleaning Miles
Fiscal Year
Sewer Cleaning
10
STATE OF THE SEWERS • 2016
New York City Department of Environmental Protection
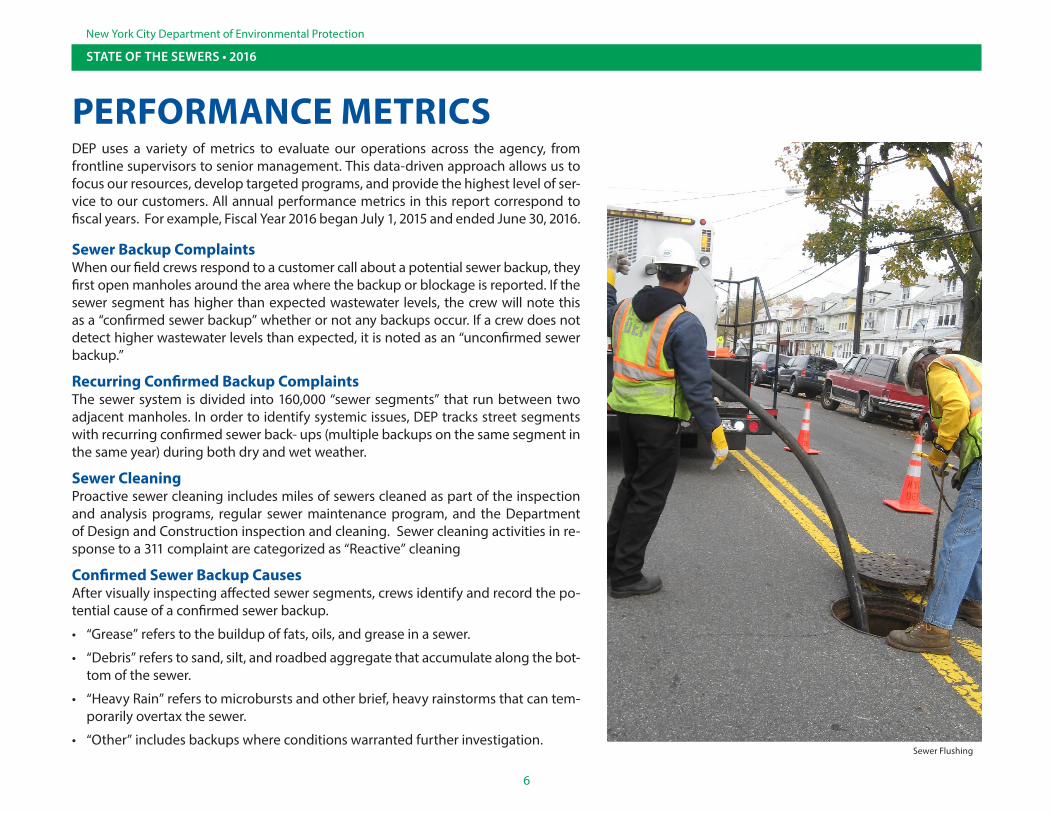
BROOKLYNSince FY2012, total sewer backup com-plaints have fallen 29% and confirmed sew-er backup complaints have fallen 52%.
Over the past five years, the number of street segments with recurring confirmed sewer backups has decreased by 57% and the number of street segments with recur-ring confirmed dry weather sewer backups decreased by 56%.
In FY2016, 50% of backups were attributed to grease; 28% attributed to debris; and 22% attributed to heavy rains and other factors.
Systematic, proactive sewer cleaning has in-creased by 153% while reactive sewer clean-ing has decreased by 69% from FY2012. The drop in reactive cleaning is due to the con-tinued decline in the number of confirmed sewer backups.
0
1,000
2,000
3,000
4,000
5,000
6,000
2012 2013 2014 2015 2016
spukcaB reweS
Fiscal Year
Unconfirmed
Confirmed
Sewer Backup Complaints
0
50
100
150
200
250
300
350
2012 2013 2014 2015 2016
Segm
ents
Fiscal Year
Recurring Confirmed Backup Segments
020406080
100120140160
2012 2013 2014 2015 2016M
iles
Reactive Proactive
Sewer Cleaning Miles
Fiscal Year
Other 5%
Heavy Rain 17%
Debris28%
Grease50%
Confirmed Sewer Backup CausesFY16 Confirmed Sewer Backup Causes
020406080
100120140160180200
2012 2013 2014 2015 2016
Segm
ents
Fiscal Year
Recurring Confirmed Dry Weather Backup Segments
Sewer Backup Complaints
Sewer Backup Causes
Recurring Backup Segments
Recurring Dry Weather Backup Segments
Sewer Cleaning
11
STATE OF THE SEWERS • 2016
New York City Department of Environmental Protection
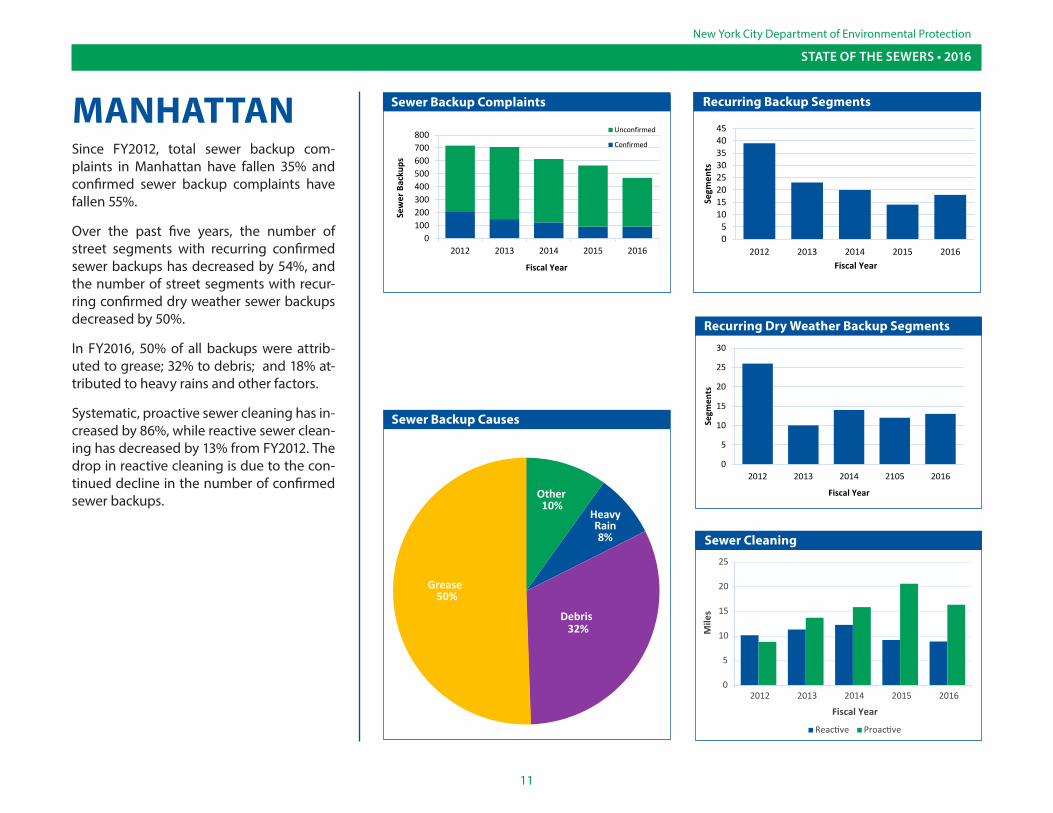
MANHATTANSince FY2012, total sewer backup com-plaints in Manhattan have fallen 35% and confirmed sewer backup complaints have fallen 55%.
Over the past five years, the number of street segments with recurring confirmed sewer backups has decreased by 54%, and the number of street segments with recur-ring confirmed dry weather sewer backups decreased by 50%.
In FY2016, 50% of all backups were attrib-uted to grease; 32% to debris; and 18% at-tributed to heavy rains and other factors.
Systematic, proactive sewer cleaning has in-creased by 86%, while reactive sewer clean-ing has decreased by 13% from FY2012. The drop in reactive cleaning is due to the con-tinued decline in the number of confirmed sewer backups.
0100200300400500600700800
2012 2013 2014 2015 2016
Sew
er B
acku
ps
Fiscal Year
Unconfirmed
Confirmed
Sewer Backup Complaints
05
1015202530354045
2012 2013 2014 2015 2016
Segm
ents
Fiscal Year
Recurring Confirmed Backup Segments
0
5
10
15
20
25
2012 2013 2014 2015 2016M
iles
Reactive Proactive
Sewer Cleaning Miles
Fiscal Year
HeavyRain8%
Debris32%
Grease50%
Confirmed Sewer Backup CausesFY16 Confirmed Sewer Backup Causes
Other10%
0
5
10
15
20
25
30
2012 2013 2014 2105 2016
Segm
ents
Fiscal Year
Recurring Confirmed Dry Weather Backup Segments
Sewer Backup Complaints
Sewer Backup Causes
Recurring Backup Segments
Recurring Dry Weather Backup Segments
Sewer Cleaning

12
STATE OF THE SEWERS • 2016
New York City Department of Environmental Protection
QUEENSIn Queens, total sewer backup complaints have fallen 18% and unconfirmed sewer backup complaints have fallen 40% since FY2012.
Over the past five years, the number of street segments with recurring confirmed sewer backups has decreased by 37%. The number of street segments with recurring confirmed dry weather sewer backups de-creased by 34%.
In FY2016, 88% of backups were attributed to grease; 6% attributed to debris; and 6% attributed to heavy rains and other factors.
Systematic, proactive sewer cleaning has in-creased by 614% while reactive sewer clean-ing has decreased by 64% from FY2012. The drop in reactive cleaning is due to the con-tinued decline in the number of confirmed sewer backups.
0
1,000
2,000
3,000
4,000
5,000
6,000
7,000
2012 2013 2014 2015 2016Fiscal Year
Unconfirmed Confirmed
Sewer Backup Complaints
Sew
er B
acku
ps
050
100150200250300350400450500
2012 2013 2014 2015 2016
Segm
ents
Fiscal Year
Recurring Confirmed Backup Segements
0
50
100
150
200
250
300
350
2012 2013 2014 2015 2016M
iles
Reactive Proactive
Sewer Cleaning Miles
Fiscal Year
Other 5%
Heavy Rain1%
Debris6%
Grease88%
FY16 Confirmed Sewer Backup Causes
0
50
100
150
200
250
300
2012 2013 2014 2015 2016
Segm
ents
Fiscal Year
Recurring Confirmed Dry Weather Backup Segments
Sewer Backup Complaints
Sewer Backup Causes
Recurring Backup Segments
Recurring Dry Weather Backup Segments
Sewer Cleaning
13
STATE OF THE SEWERS • 2016
New York City Department of Environmental Protection
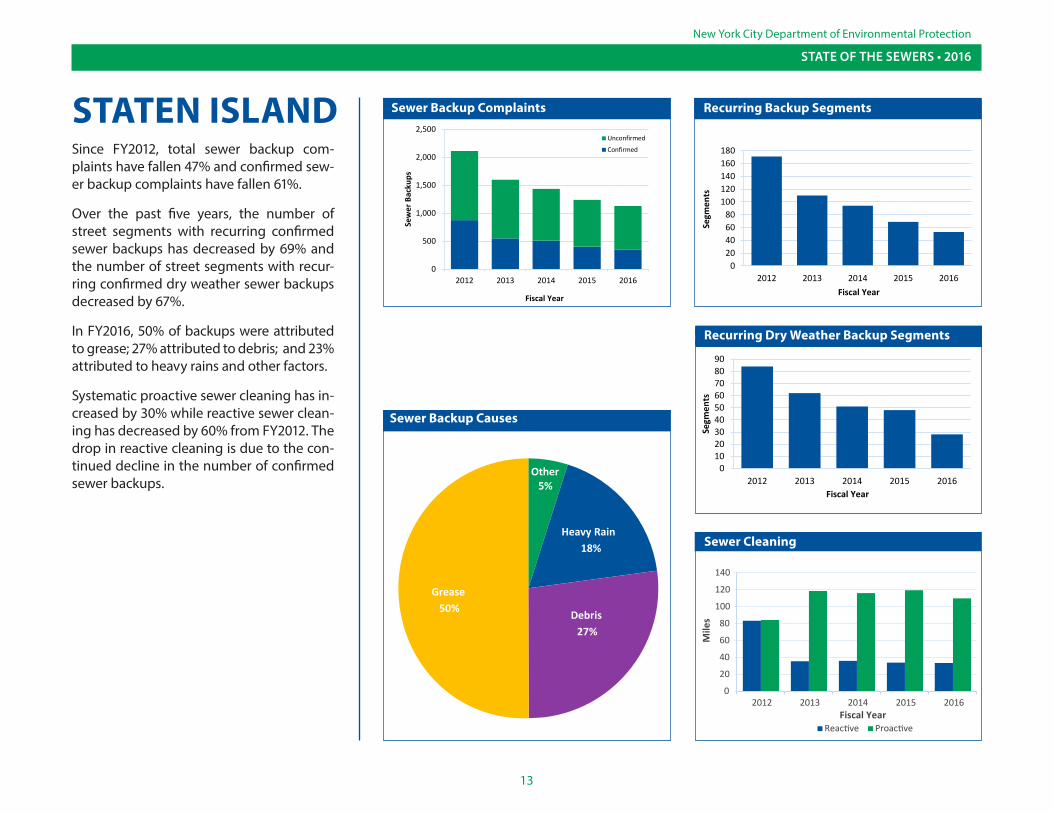
STATEN ISLANDSince FY2012, total sewer backup com-plaints have fallen 47% and confirmed sew-er backup complaints have fallen 61%.
Over the past five years, the number of street segments with recurring confirmed sewer backups has decreased by 69% and the number of street segments with recur-ring confirmed dry weather sewer backups decreased by 67%.
In FY2016, 50% of backups were attributed to grease; 27% attributed to debris; and 23% attributed to heavy rains and other factors.
Systematic proactive sewer cleaning has in-creased by 30% while reactive sewer clean-ing has decreased by 60% from FY2012. The drop in reactive cleaning is due to the con-tinued decline in the number of confirmed sewer backups.
0
500
1,000
1,500
2,000
2,500
2012 2013 2014 2015 2016
Sew
er B
acku
ps
Fiscal Year
Unconfirmed
Confirmed
Sewer Backup Complaints
020406080
100120140160180
2012 2013 2014 2015 2016
Segm
ents
Fiscal Year
Recurring Confirmed Backup Segments
0
20
40
60
80
100
120
140
2012 2013 2014 2015 2016M
iles
Reactive ProactiveFiscal Year
Other5%
Debris27%
Grease50%
Confirmed Sewer Backup CausesFY16 Confirmed Sewer Backup Causes
Heavy Rain18%
0102030405060708090
2012 2013 2014 2015 2016
Segm
ents
Fiscal Year
Recurring Confirmed Dry Weather Backup Segments
Sewer Backup Complaints
Sewer Backup Causes
Recurring Backup Segments
Recurring Dry Weather Backup Segments
Sewer Cleaning
Bill de BlasioMayor
Vincent Sapienza, P.E. Acting Commissioner