State of the Regions Report 2008-09 · cycle cost-effective units and local government should ......
32
State of the Regions Report – 2008-09 Presented by Graham Armstrong, Ian Manning and Peter Brain National Economics 416 Queens Parade, Clifton Hill, Victoria, 3068 Phone: (03) 9488 8444; Fax: (03) 9482 3262; Email: [email protected]
Transcript of State of the Regions Report 2008-09 · cycle cost-effective units and local government should ......
State of the Regions
Report – 2008-09
Presented by Graham Armstrong, Ian Manning
and Peter Brain
National Economics
416 Queens Parade, Clifton Hill, Victoria, 3068
Phone: (03) 9488 8444; Fax: (03) 9482 3262; Email: [email protected]
State of the Regions report, 2008-09
A report prepared for the Australian Local
Government Association by National Economics.
1. CPRS impacts on electricity and gas prices
Graham Armstrong
2. Overview of SOR 2008-09
Peter Brain and Ian Manning

The impacts of carbon (CO2e) pricing under CPRS on
gas and electricity prices
Carbon (CO2e) pricing will raise electricity and gas prices;
levels depending on CPRS design.
Increased prices will make energy efficiency improvement
(EEI) more attractive.
For example, a 5 year payback EEI investment may
become a 4 year payback.
Electricity prices, retail, have increased by about 20%
over the last 3 years and there has not been an observable
price response to EEIs.
So why would carbon pricing, of a similar magnitude,
have a greater impact?

The impacts of carbon (CO2e) pricing under CPRS on
gas and electricity prices (continued)
With underlying ($0/t CO2e) price increases AND price
increase due to an ETS, retail electricity and gas prices
will rise significantly over the next 10 years.
‘Likely’ national average residential and commercial
sector percentage price increases to 2020 from 2008:
BAU CPRS-5/Garnaut-10
($0/t CO2e) ($50/t CO2e in 2020)
Electricity 15 40
Gas 15 25
(includes BAU)
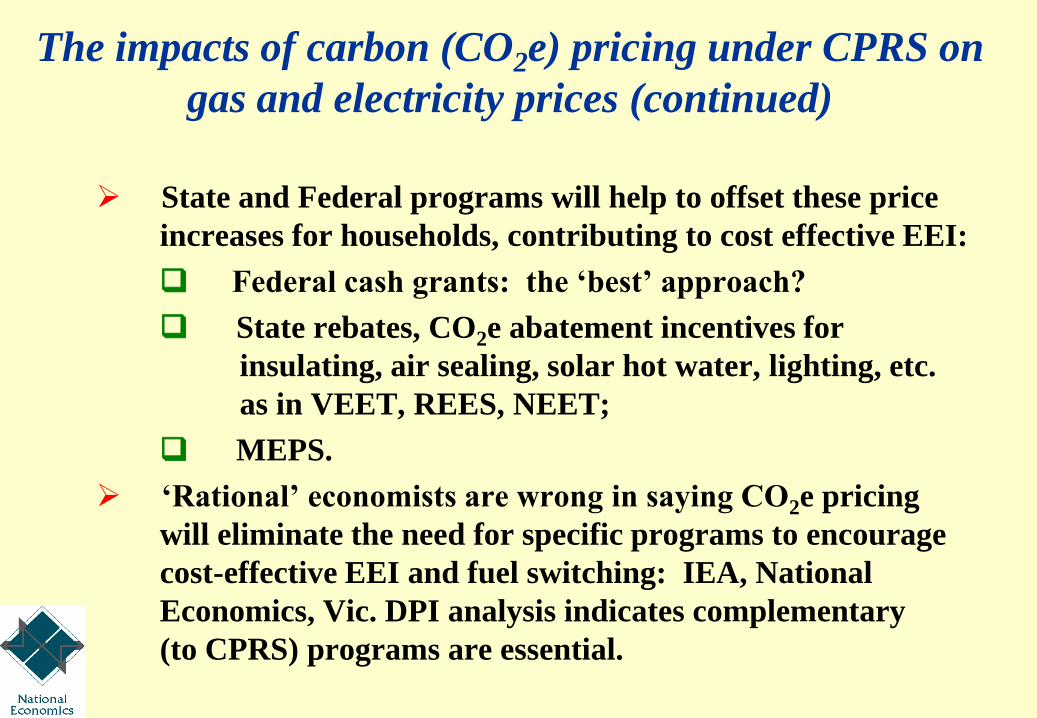
The impacts of carbon (CO2e) pricing under CPRS on
gas and electricity prices (continued)
State and Federal programs will help to offset these price
increases for households, contributing to cost effective EEI:
Federal cash grants: the ‘best’ approach?
State rebates, CO2e abatement incentives for
insulating, air sealing, solar hot water, lighting, etc.
as in VEET, REES, NEET;
MEPS.
‘Rational’ economists are wrong in saying CO2e pricing
will eliminate the need for specific programs to encourage
cost-effective EEI and fuel switching: IEA, National
Economics, Vic. DPI analysis indicates complementary
(to CPRS) programs are essential.
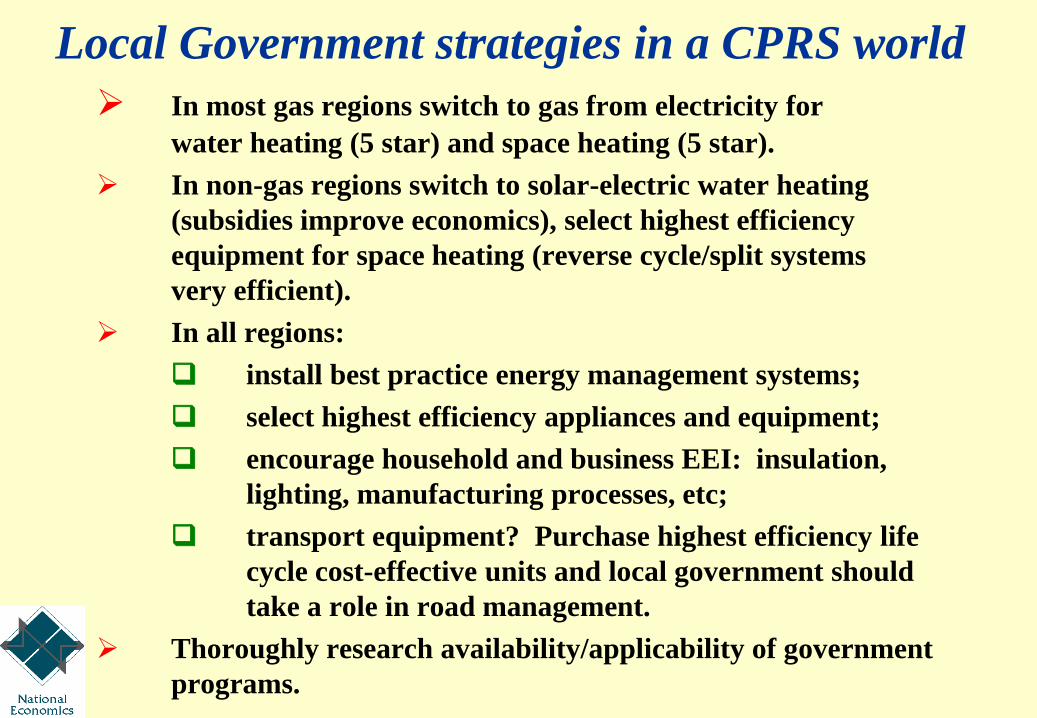
Local Government strategies in a CPRS world
In most gas regions switch to gas from electricity for
water heating (5 star) and space heating (5 star).
In non-gas regions switch to solar-electric water heating
(subsidies improve economics), select highest efficiency
equipment for space heating (reverse cycle/split systems
very efficient).
In all regions:
install best practice energy management systems;
select highest efficiency appliances and equipment;
encourage household and business EEI: insulation,
lighting, manufacturing processes, etc;
transport equipment? Purchase highest efficiency life
cycle cost-effective units and local government should
take a role in road management.
Thoroughly research availability/applicability of government
programs.

Overview of SOR 2008-09
Presented by Dr Ian Manning
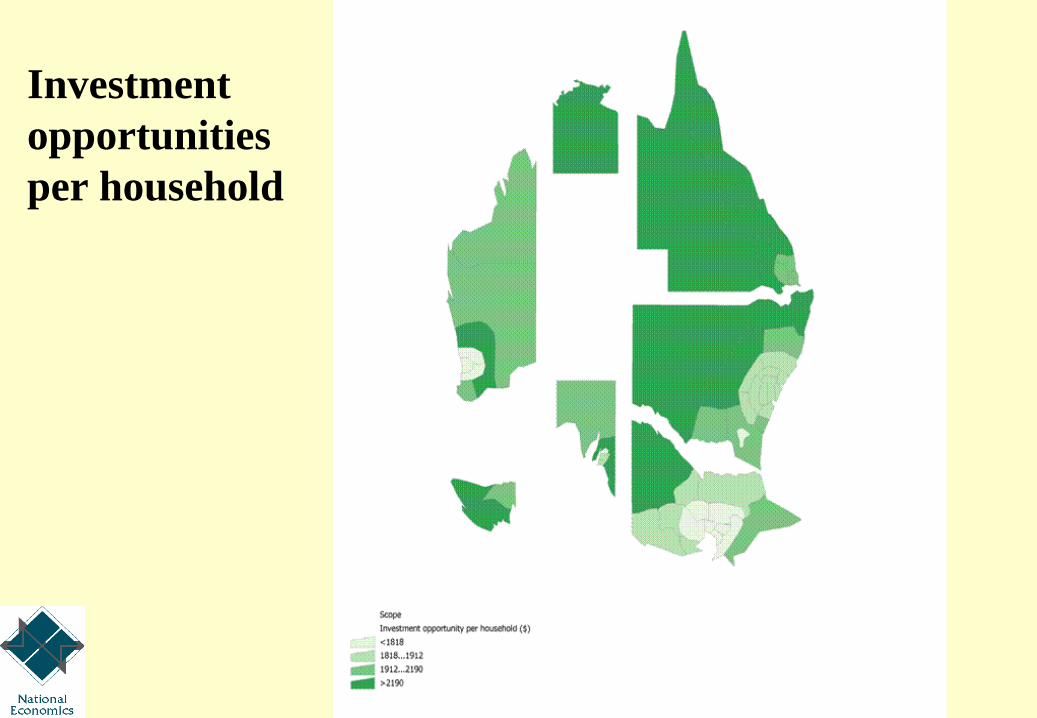
Investment
opportunities
per household
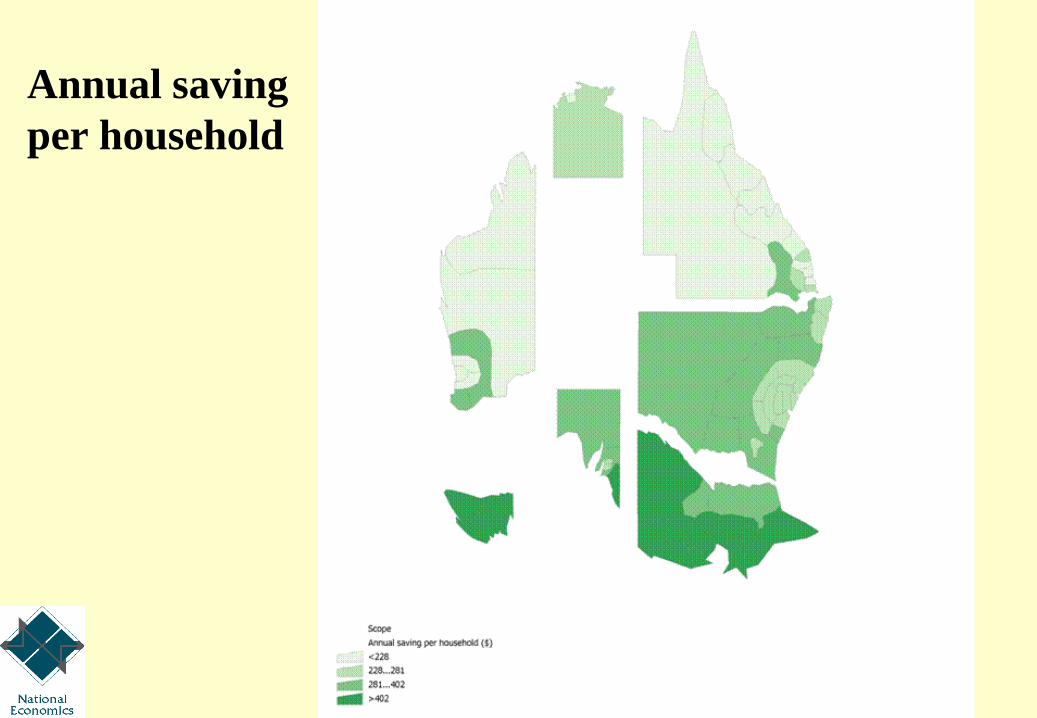
Annual saving
per household
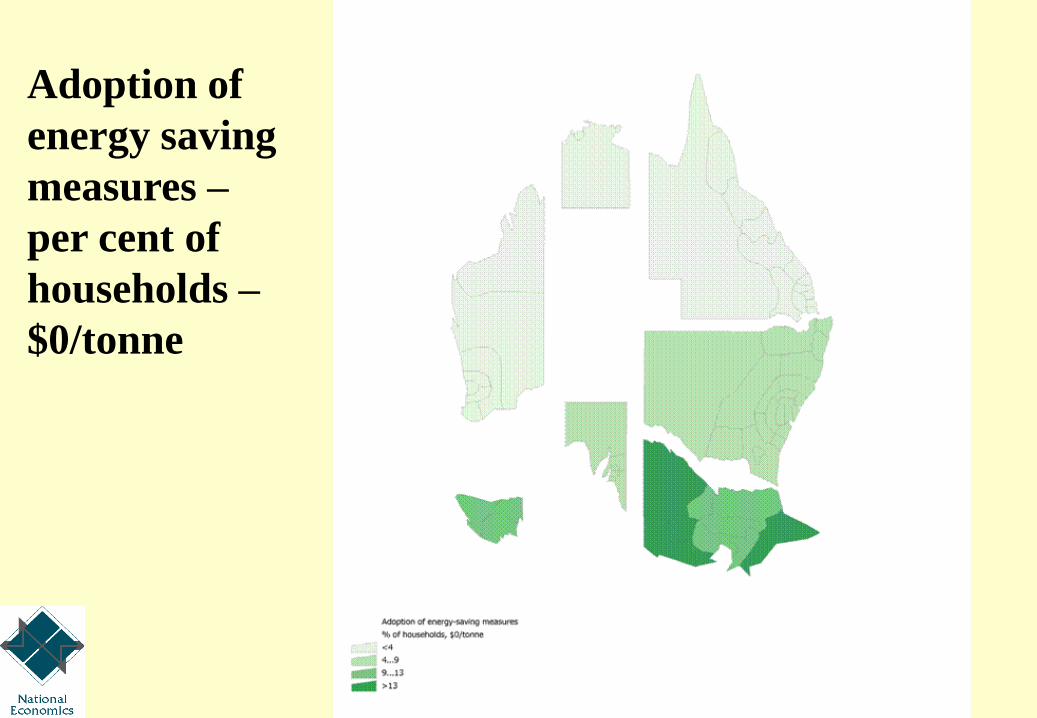
Adoption of
energy saving
measures –
per cent of
households –
$0/tonne
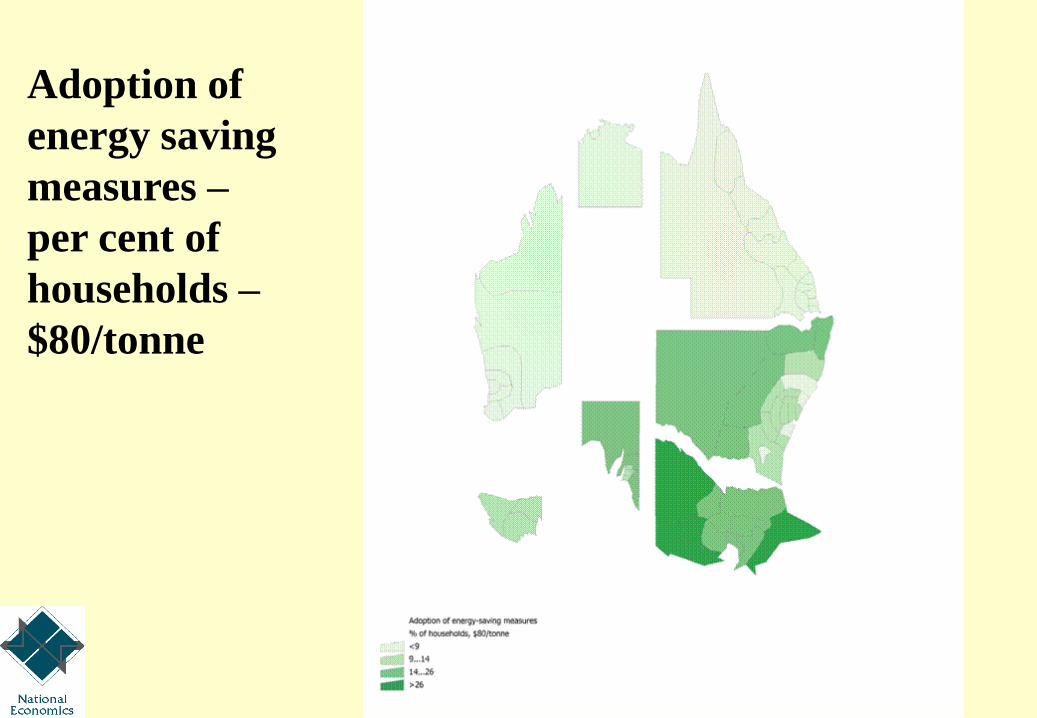
Adoption of
energy saving
measures –
per cent of
households –
$80/tonne

Average
household
CO2
emissions –
tonnes
(excluding
motor fuels)

Overview of SOR 2008-09
Presented by Dr Peter Brain

Australian perennial two core problems:
(i) ever increasing household debt; and
(ii) ever increasing international debt.
Have now become binding because:
(i) household debt saturation; and
(ii) finance sector debt saturation.
And are complemented by the binding problem:
(i) climate change.
Implications:
Urgent steps required to prevent exchange rate-banking
crisis (Iceland, Argentina, etc.).
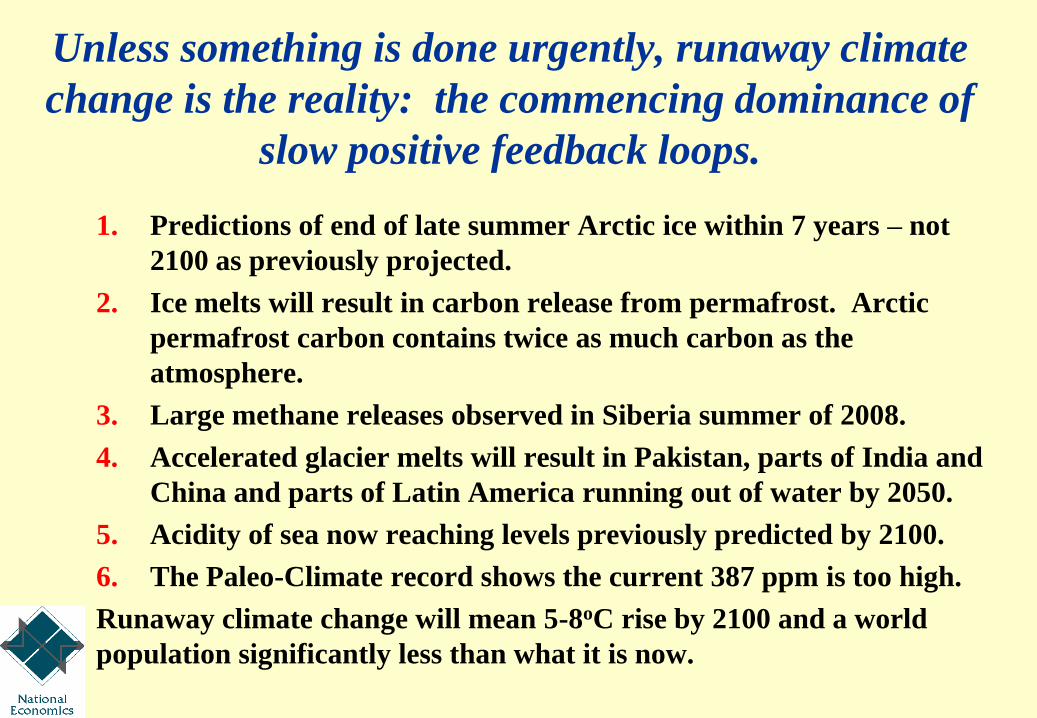
Unless something is done urgently, runaway climate
change is the reality: the commencing dominance of
slow positive feedback loops.
1. Predictions of end of late summer Arctic ice within 7 years – not
2100 as previously projected.
2. Ice melts will result in carbon release from permafrost. Arctic
permafrost carbon contains twice as much carbon as the
atmosphere.
3. Large methane releases observed in Siberia summer of 2008.
4. Accelerated glacier melts will result in Pakistan, parts of India and
China and parts of Latin America running out of water by 2050.
5. Acidity of sea now reaching levels previously predicted by 2100.
6. The Paleo-Climate record shows the current 387 ppm is too high.
Runaway climate change will mean 5-8oC rise by 2100 and a world
population significantly less than what it is now.

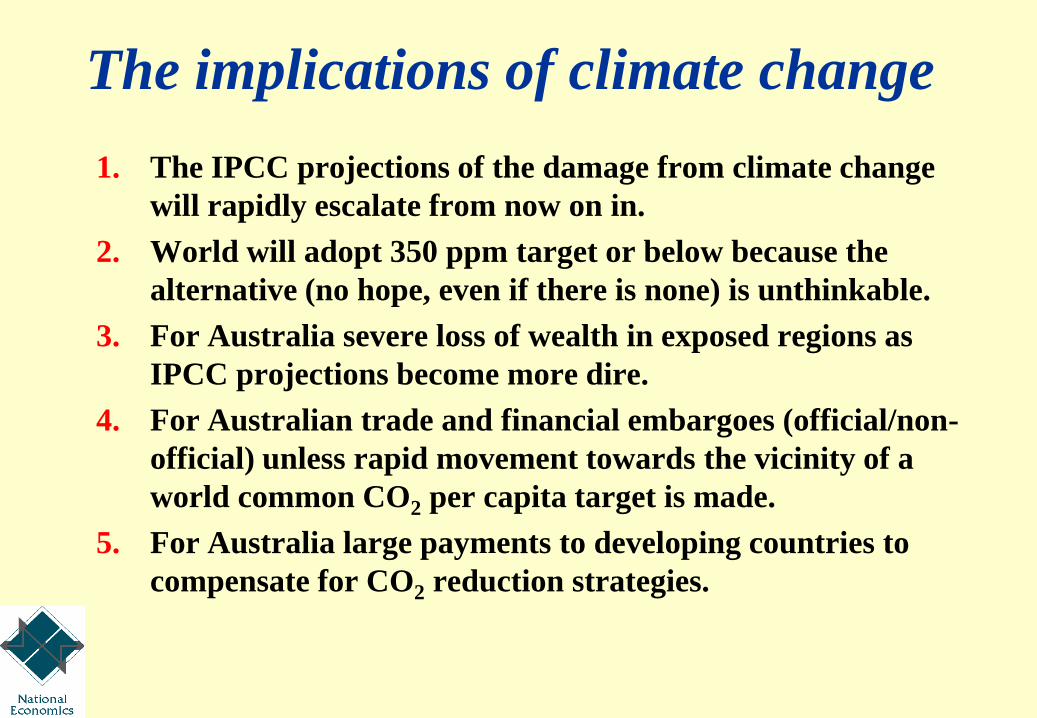
The implications of climate change
1. The IPCC projections of the damage from climate change
will rapidly escalate from now on in.
2. World will adopt 350 ppm target or below because the
alternative (no hope, even if there is none) is unthinkable.
3. For Australia severe loss of wealth in exposed regions as
IPCC projections become more dire.
4. For Australian trade and financial embargoes (official/non-
official) unless rapid movement towards the vicinity of a
world common CO2 per capita target is made.
5. For Australia large payments to developing countries to
compensate for CO2 reduction strategies.

Average
industry CO2
emissions per
employed
person –
direct and
indirect
domestic
emissions
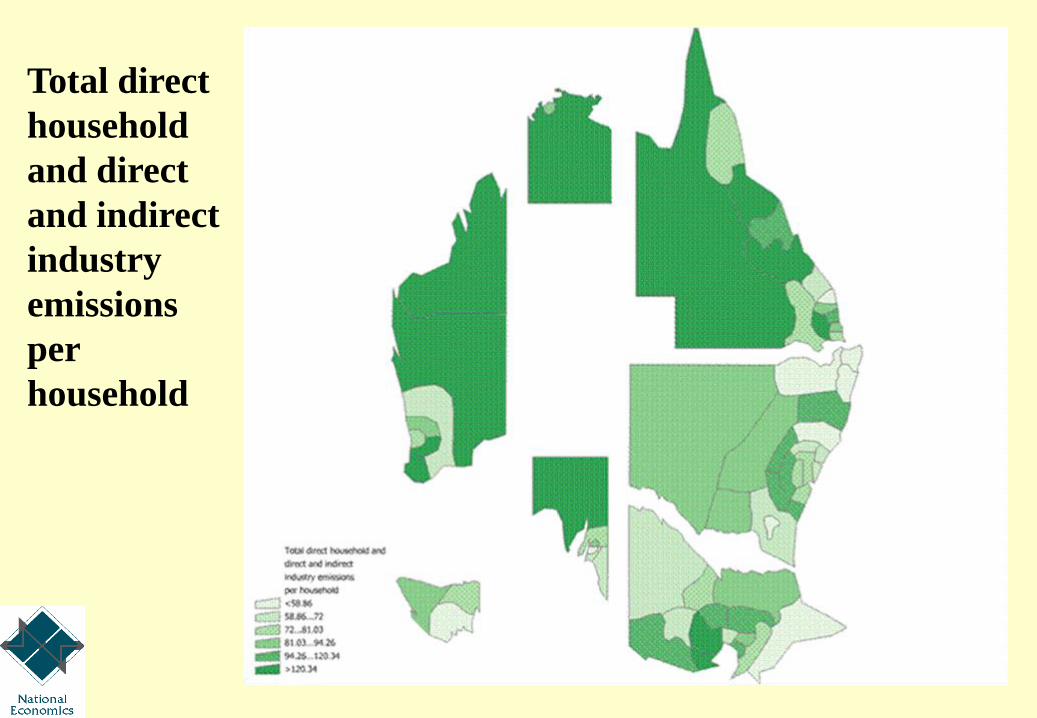
Total direct
household
and direct
and indirect
industry
emissions
per
household


Current
account
deficit
1990-
2007

Exchange
rate
AUD/US
1990-2007

If a major economic crisis is to be avoided,
the following will have to be achieved
1. A quick reduction in the current account deficit.
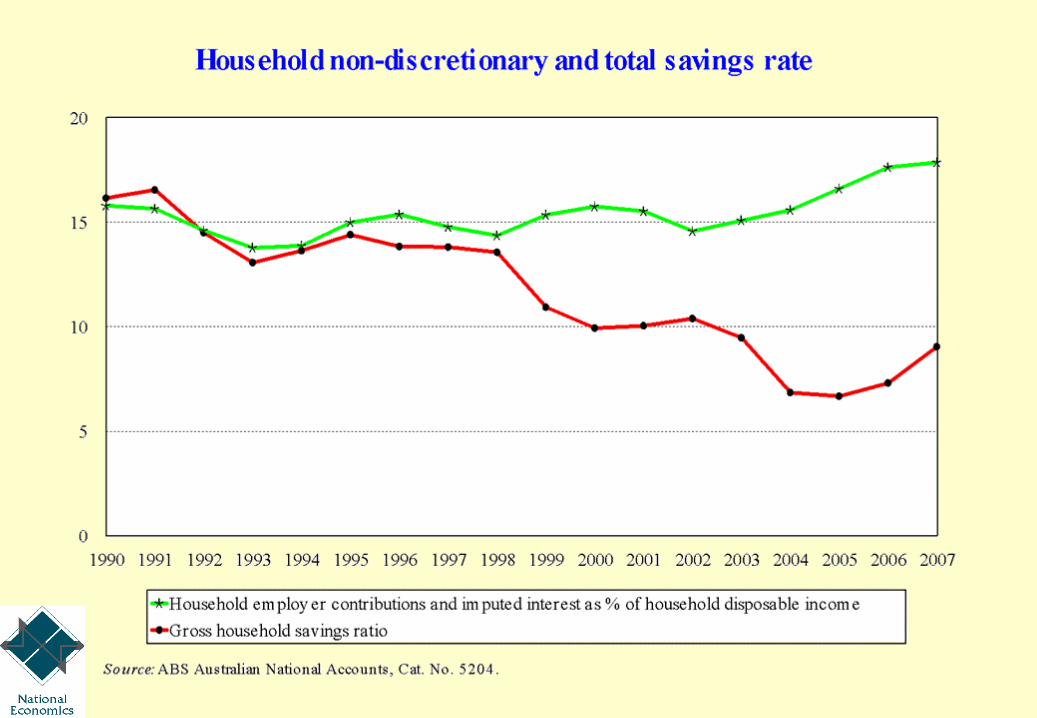
2. A substantial increase in the household savings ratio, to
stabilise the household debt to income ratio.
3. An increase in public sector net borrowing, to offset the
increase in household saving and finance the continuing
through reduced current account deficit.
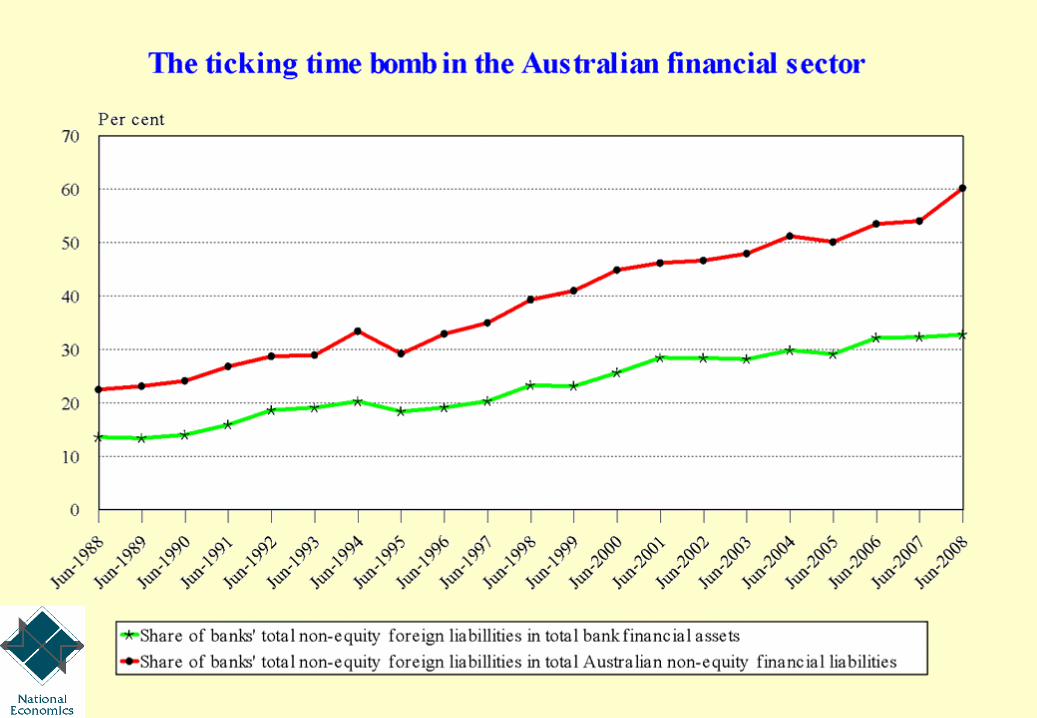
4. Reduction of the share of the banks’ foreign liabilities as a
share of total liabilities.
5. Implementation of a robust greenhouse emissions
abatement plan credible to overseas investors.
6. An increase in both public and private investment in
emissions abatement, in exporting industries and in import
competing industries.
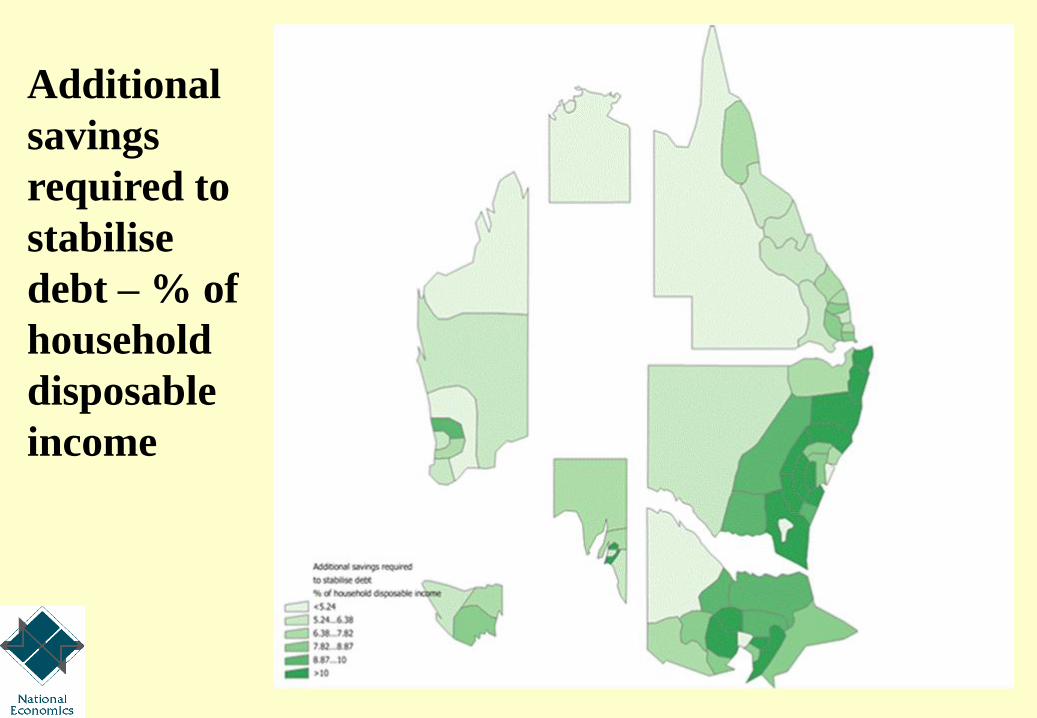
Additional
savings
required to
stabilise
debt – % of
household
disposable
income
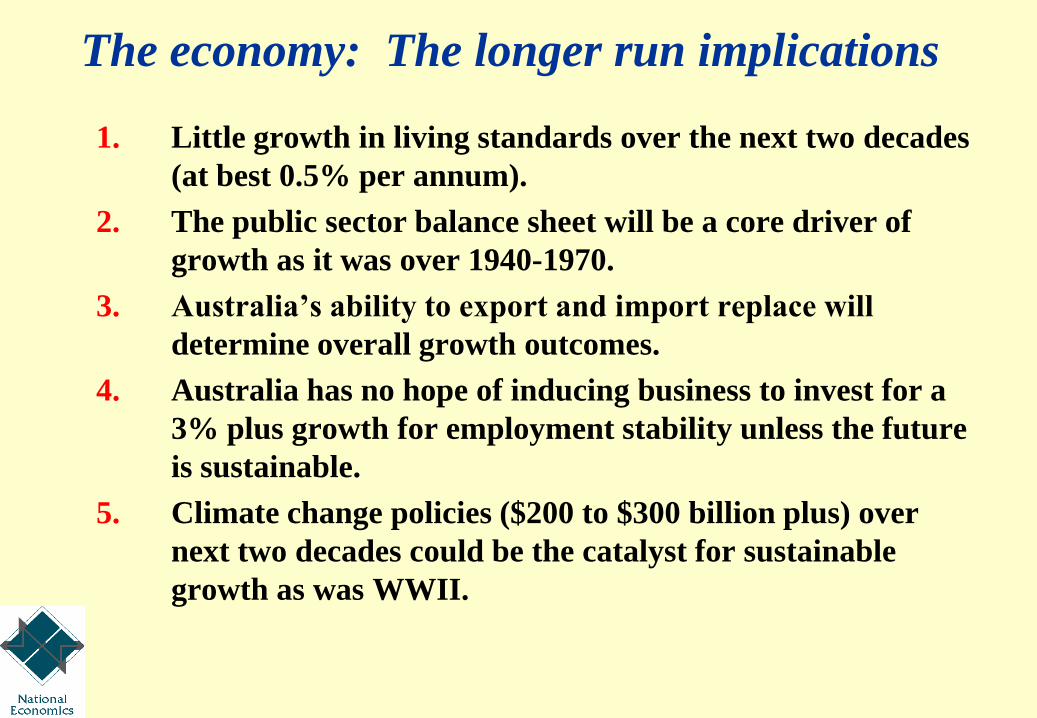
The economy: The longer run implications
1. Little growth in living standards over the next two decades
(at best 0.5% per annum).
2. The public sector balance sheet will be a core driver of
growth as it was over 1940-1970.
3. Australia’s ability to export and import replace will
determine overall growth outcomes.
4. Australia has no hope of inducing business to invest for a
3% plus growth for employment stability unless the future
is sustainable.
5. Climate change policies ($200 to $300 billion plus) over
next two decades could be the catalyst for sustainable
growth as was WWII.

Migration
Presented by Dr Ian Manning
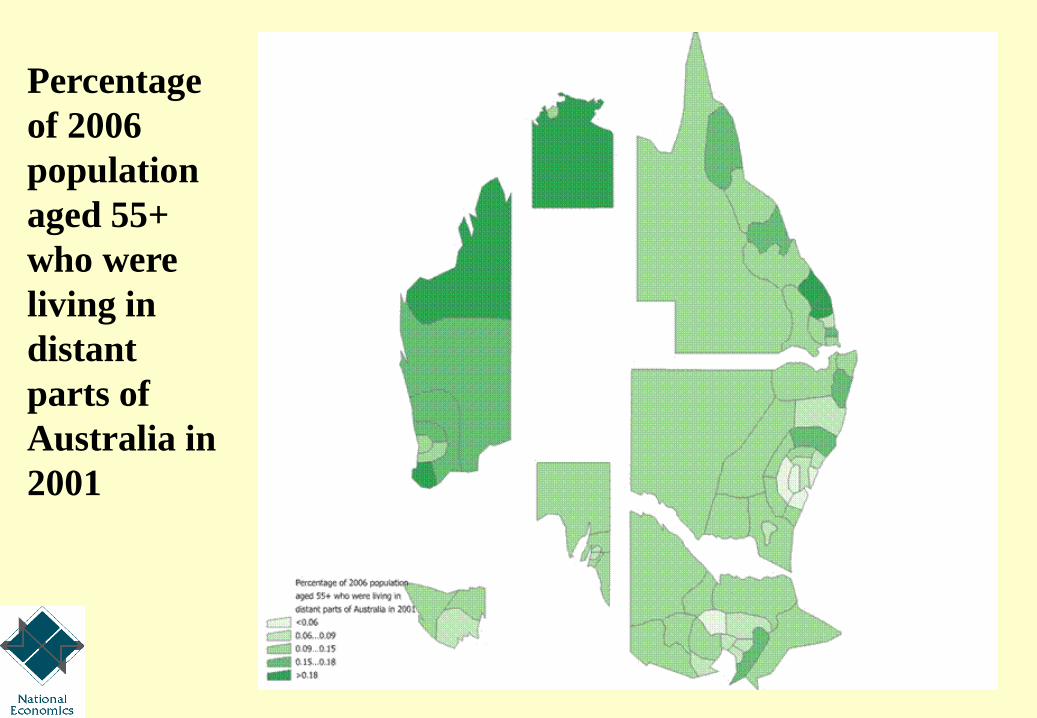
Percentage
of 2006
population
aged 55+
who were
living in
distant
parts of
Australia in
2001

Percentage
of 2006
population
aged 20-29
who were
living in
distant parts
of Australia
in 2001
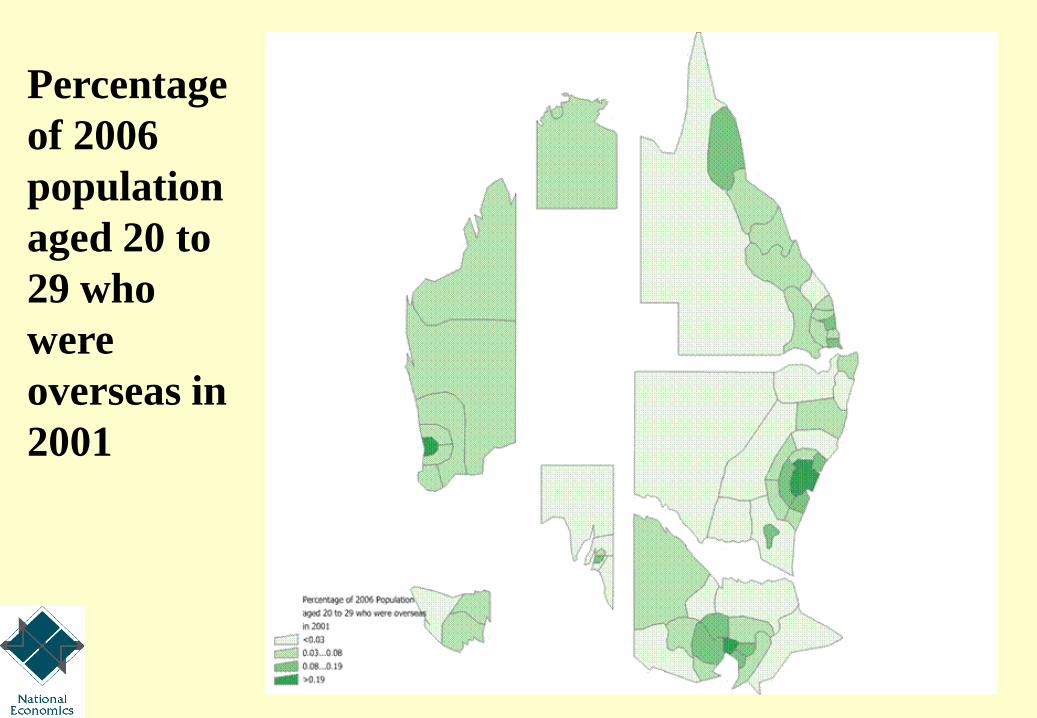
Percentage
of 2006
population
aged 20 to
29 who
were
overseas in
2001


![Welcome [] · Zülküf Küçüközer TriangleCanvas.java import javax.microedition.lcdui.Graphics; import javax.microedition.lcdui.game.*; import javax.microedition.m3g.*;](https://static.fdocuments.us/doc/165x107/5d31f91d88c9937a3b8ccf67/welcome-zuelkuef-kuecuekoezer-trianglecanvasjava-import-javaxmicroeditionlcduigraphics.jpg)