
State of the Nation 2010: Imagination to Innovation, Building Canadian Paths to Prosperity
86
-
Upload
cbcpolitics -
Category
Documents
-
view
221 -
download
0
Transcript of State of the Nation 2010: Imagination to Innovation, Building Canadian Paths to Prosperity

8/6/2019 State of the Nation 2010: Imagination to Innovation, Building Canadian Paths to Prosperity
http://slidepdf.com/reader/full/state-of-the-nation-2010-imagination-to-innovation-building-canadian-paths 1/86

8/6/2019 State of the Nation 2010: Imagination to Innovation, Building Canadian Paths to Prosperity
http://slidepdf.com/reader/full/state-of-the-nation-2010-imagination-to-innovation-building-canadian-paths 2/86
Permission to Reproduce
Except as otherwise specically noted, the inormation in this publication may be reproduced, in part or in wholeand by any means, without charge or urther permission rom the Science, Technology and Innovation Council,provided that due diligence is exercised in ensuring the accuracy o the inormation reproduced, that the Science,Technology and Innovation Council (STIC) is identied as the source institution, and that the reproduction is notrepresented as an ocial version o the inormation reproduced, nor as having been made in aliation with, orwith the endorsement o, STIC.
© 2011, Government o Canada (Science, Technology and Innovation Council).
State o the Nation 2010 — Canada’s Science, Technology and Innovation System:
Imagination to Innovation — Building Canadian Paths to Prosperity
All rights reserved.
Aussi oert en rançais sous le titre L’état des lieux en 2010 — Le système des sciences, de la technologie et de
l’innovation au Canada : De l’imagination à l’innovation — Le parcours du Canada vers la prospérité
This publication is also available online at www.stic-csti.ca.
This publication is available upon request in accessible ormats. Contact the Science, Technology and InnovationCouncil Secretariat at the number listed below.
For additional copies o this publication, please contact:
Science, Technology and Innovation Council Secretariat235 Queen Street9th FloorOttawa ON K1A 0H5
Telephone: 613-952-0998Fax: 613-952-0459Website: www.stic-csti.ca Email: [email protected]
Cat. No. Iu4-142/2010EISBN 978-1-100-17972-860872

8/6/2019 State of the Nation 2010: Imagination to Innovation, Building Canadian Paths to Prosperity
http://slidepdf.com/reader/full/state-of-the-nation-2010-imagination-to-innovation-building-canadian-paths 3/86
Imagination to InnovationBuilding Canadian Paths to Prosperity
State o the Nation 2010Canada’s Science, Technologyand Innovation System
Science, Technologyand Innovation Council

8/6/2019 State of the Nation 2010: Imagination to Innovation, Building Canadian Paths to Prosperity
http://slidepdf.com/reader/full/state-of-the-nation-2010-imagination-to-innovation-building-canadian-paths 4/86

8/6/2019 State of the Nation 2010: Imagination to Innovation, Building Canadian Paths to Prosperity
http://slidepdf.com/reader/full/state-of-the-nation-2010-imagination-to-innovation-building-canadian-paths 5/86
ContentsExecutive Summary ........................................................................................................... 1
1 Introduction .................................................................................................................. 3
2 Tracking Progress in Canada’s Innovative Perormance — 2010 vs. 2008 .................. 4
3 Going Forward — A Core Set of Indicators to Measure Innovation ....................................... 8
4 Recent Developments in Measuring Innovation ..................................................... 10
5 Resources or Research and Development ............................................................. 12
6 Digest o Indicators ................................................................................................... 19
7 Conclusion ................................................................................................................... 74
Appendix A: Research and Development Sub-Priorities .............................................. 75
Appendix B: State of the Nation 2008 Areas or Attention ......................................... 76

8/6/2019 State of the Nation 2010: Imagination to Innovation, Building Canadian Paths to Prosperity
http://slidepdf.com/reader/full/state-of-the-nation-2010-imagination-to-innovation-building-canadian-paths 6/86
State of the nation 2010
ii
Digest o Indicators (Section 6)
6.1 Busss iv idcrs ........................................................................................19
6.1.1 Going Beyond R&D Indicators to Measure Innovation ............................................................. 19
6.1.2 Productivity Growth or Improved Standards o Living ............................................................ 19
6.1.3 Innovation Focus in Business Strategy ...................................................................................... 236.1.4 Innovation through Research and Development ....................................................................... 27
6.1.5 Innovation through Investments in Machinery and Equipment .............................................. 33
6.1.6 Innovation and the Rise o Service Industries .......................................................................... 36
6.1.7 Financing Innovation through Venture Capital ......................................................................... 41
6.2 Kwldg Dvlpm d trsr idcrs .........................................................45
6.2.1 Advancing the Frontiers o Knowledge through Science and Technology ............................. 45
6.2.2 Transerring Knowledge into Innovation ................................................................................... 50
6.3 tl idcrs ...............................................................................................................56
6.3.1 Science, Math, Reading Skills o 15 Year-Olds ........................................................................... 566.3.2 Pursuing Formal Education (15 to 19 Year-Olds) ........................................................................ 58
6.3.3 Share o the Population with Post-Secondary Education ......................................................... 58
6.3.4 College and University Graduation Rates .................................................................................. 59
6.3.5 Science and Engineering Education or Growth and Prosperity .............................................. 59
6.3.6 Inormation and Communication Technology Skills; Access and Use o ICT............................ 59
6.3.7 Education or Entrepreneurial Success ....................................................................................... 62
6.3.8 PhDs — Country Comparisons .................................................................................................... 62
6.3.9 Enrolment and Graduation in Science-Based Doctoral Programs by Canadian Students ....... 64
6.3.10 Unemployment Rates o Doctorate Holders .............................................................................. 646.3.11 Internships and Co-ops or Enhanced Opportunities ................................................................ 64
6.3.12 Returns on Obtaining Post-Secondary Education ...................................................................... 65
6.3.13 Attracting Great Talent to Canada .............................................................................................. 65
6.3.14 Education: A Lielong Pursuit ..................................................................................................... 69
6.3.15 Human Resources in Science and Technology ........................................................................... 69
6.3.16 Business Researchers.................................................................................................................... 70
6.3.17 Making Use o Highly Skilled People to Improve Productivity Growth ................................... 70
8/6/2019 State of the Nation 2010: Imagination to Innovation, Building Canadian Paths to Prosperity
http://slidepdf.com/reader/full/state-of-the-nation-2010-imagination-to-innovation-building-canadian-paths 7/86
Role o the Report
The Science, Technology and Innovation Council’s State o the Nation 2008 report on Canada’s science, technologyand innovation system set out a baseline rom which Canada’s innovation perormance could be measured. This2010 report allows us to track progress and continue eorts to understand how innovation happens in Canada.
Benchmarking builds an evidence base or action, puncturing complacency and prompting greater refection. TheState o the Nation 2010 report puts a greater ocus on business innovation and the ways in which other par-ticipants in the innovation system work in partnership with companies. The report delves deeper to benchmarkindustry sector research and development on an international basis. It looks at product, process, and organiza-tional innovation as well as investments in inormation and communications technologies goods and services.Canadians ace choices in innovation that will create wealth in our country and improve the quality o lie or indi-viduals. Where should we ocus to make innovation gains? How can Canada’s science, technology and innovationsystem support these eorts? How can individual actions be leveraged to strengthen our ability to innovate andcompete? This report aims to inorm these considerations and decisions.
2010 STIC CouncilDr. hwrd alpr Chair, Science, Technology and Innovation Council
Dr. frcsc Bll Chairman, Picchio International Inc.
Mr. erc Brgr President and CEO, Optosecurity Inc.
Mr. Rcrd Dcr Deputy Minister, Industry Canada
Mr. Dvd fssl President and CEO, ASL Environmental Sciences Inc.
Dr. Pr McK President and Vice-Chancellor, University o Saskatchewan
Dr. trc Mws Chair, Mitel / Chair, Wesley Clover Corporation
Dr. hr Mur-Blum Principal and Vice-Chancellor, McGill University
Mr. Dvd o’Br Chair, Encana Corporation and Chair, Royal Bank o Canada
Mr. J. Rbr S. Prcrd Vice Chair, Science, Technology and Innovation Council; Chair, Torys LLP andChair, Board o Directors, Metrolinx
Dr. Guy Rulu MD, PhD; Canada Research Chair in Genetics o the Nervous System andProessor, Department o Medicine, Université de Montréal; Director, ResearchCentre, Sainte-Justine University Hospital Centre
Dr. W.a. (Sm) Sw President and CEO, Northern Alberta Institute o Technology (to October 2010)
Dr. Mlly Sc Canada Research Chair in Tissue Engineering and Proessor, Universityo Toronto
Dr. Ml Ulru Canada Research Chair, Adaptive Inormation Inrastructures or the eSociety;Director, Adaptive Risk Management Lab and Proessor, Faculty o ComputerScience, University o New Brunswick
Dr. hrvy P. Wgr President and CEO, Higher Education Quality Council o Ontario;President Emeritus, University o Calgary
Mr. Rb Wldbr Executive Chairman, Martinrea International Inc.

8/6/2019 State of the Nation 2010: Imagination to Innovation, Building Canadian Paths to Prosperity
http://slidepdf.com/reader/full/state-of-the-nation-2010-imagination-to-innovation-building-canadian-paths 8/86
Research ( discoveries and inventions)Basic and
applied research
Dr. Andre Marziali and Dr. Lorne Whitehead o theUniversity o British Columbia (UBC) discover a new way to extract DNA molecules rom small or heavily contaminated samples by exploiting a unique property o DNA molecules. They develop a technology called SCODA or Synchronous Coefcient o Drag Alteration.
Go vernmen t
labora tories
S tuden tsResea
r cher s
En trepreneurs
Talent(science and
business)
Universities
Business
Colleges
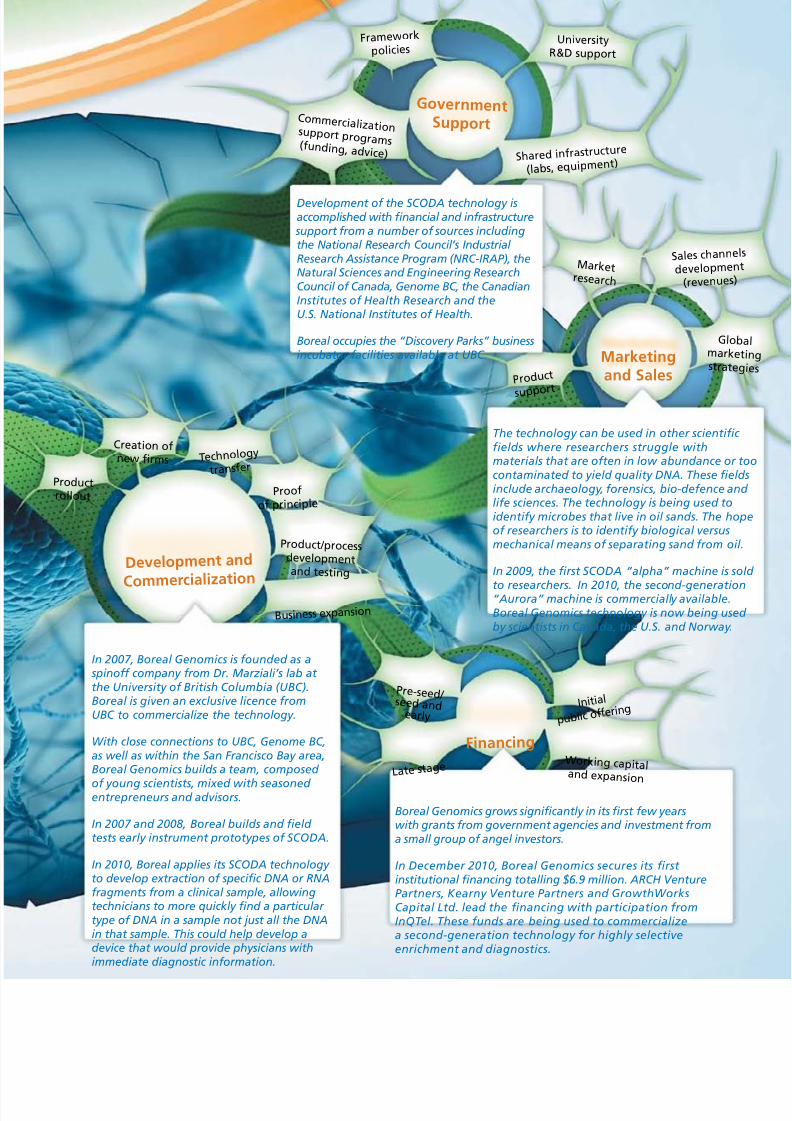
Innovation PathwaysBasic research and value creation
Where people, knowledge and
entrepreneurship connect,innovation happens.Like synapses between nerve cells in the brain,connections are complex, not linear.
This image shows how Boreal Genomics made connections totake research to the market.
Boreal Genomics, based in Vancouver, B.C., is a small growing company that develops and commercializes methods and instruments or DNA molecule purifcation, enrichment
and detection.
8/6/2019 State of the Nation 2010: Imagination to Innovation, Building Canadian Paths to Prosperity
http://slidepdf.com/reader/full/state-of-the-nation-2010-imagination-to-innovation-building-canadian-paths 9/86
Financing
Marketingand Sales
The technology can be used in other scientifcields where researchers struggle withmaterials that are oten in low abundance or tcontaminated to yield quality DNA. These feldinclude archaeology, orensics, bio-deence anlie sciences. The technology is being used toidentiy microbes that live in oil sands. The hoo researchers is to identiy biological versusmechanical means o separating sand rom oil
In 2009, the frst SCODA “alpha” machine is so
to researchers. In 2010, the second-generation“Aurora” machine is commercially available.Boreal Genomics technology is now being useby scientists in Canada, the U.S. and Norway.
Boreal Genomics grows signifcantly in its frst ew yearswith grants rom government agencies and investment roma small group o angel investors.
In December 2010, Boreal Genomics secures its frst institutional fnancing totalling $6.9 million. ARCH VenturePartners, Kearny Venture Partners and GrowthWorksCapital Ltd. lead the fnancing with participation romInQTel. These unds are being used to commercializea second-generation technology or highly selectiveenrichment and diagnostics.
Government Support
Frame work
policiesUniversity
R&D support
C ommer c ializat ion suppor t pr ogr ams ( f unding, adv ic e) Shared in fras truc ture
(labs, equipmen t )
De velopment and
Commercialization
In 2007, Boreal Genomics is ounded as a spino company rom Dr. Marziali’s lab at the University o British Columbia (UBC).Boreal is given an exclusive licence romUBC to commercialize the technology.
With close connections to UBC, Genome BC,as well as within the San Francisco Bay area,Boreal Genomics builds a team, composed
o young scientists, mixed with seasoned entrepreneurs and advisors.
In 2007 and 2008, Boreal builds and feld tests early instrument prototypes o SCODA.
In 2010, Boreal applies its SCODA technology to develop extraction o specifc DNA or RNAragments rom a clinical sample, allowingtechnicians to more quickly fnd a particular type o DNA in a sample not just all the DNAin that sample. This could help develop adevice that would provide physicians withimmediate diagnostic inormation.
Technolog y
trans fer
Creation o new frms
Proof
of principle
Product / process development and testing
Product rollout
Business expansion
Mar ket r esear c h
Produc t
suppor t
Globmarkestrateg
Sales channel
de velopmen t
(re venues )
P r e-seed / seed and ear ly
La te s tage
I n i t ia l
p u b l i c o f fe r i ng
W or king capital and expansion
Development o the SCODA technology isaccomplished with fnancial and inrastructure
support rom a number o sources includingthe National Research Council’s Industrial Research Assistance Program (NRC-IRAP), theNatural Sciences and Engineering ResearchCouncil o Canada, Genome BC, the CanadianInstitutes o Health Research and theU.S. National Institutes o Health.
Boreal occupies the “Discovery Parks” businessincubator acilities available at UBC.

8/6/2019 State of the Nation 2010: Imagination to Innovation, Building Canadian Paths to Prosperity
http://slidepdf.com/reader/full/state-of-the-nation-2010-imagination-to-innovation-building-canadian-paths 10/86
State of the nation 2010
Defnitions:Research and DevelopmentInnovation
The Frascati Manual (2002) is the basis or the Organisation or Economic Co-operation andDevelopment (OECD) defnition o research and development, which is said to encompassthree activities: “‘Basic research’ is experimental or theoretical work undertaken primarily toacquire new knowledge o the underlying oundation o phenomena and observable acts,without any particular application or use in view. ‘Applied research’ is also original investiga-tion undertaken in order to acquire new knowledge. It is, however, directed primarily towardsa specifc practical aim or objective. ‘Experimental development’ is systematic work, drawingon existing knowledge gained rom research and/or practical experience, which is directedto producing new materials, products or devices, to installing new processes, systems andservices, or to improving substantially those already produced or installed.”
The Oslo Manual (2005) is the basis or the OECD defnition o innovation: “the implementa-tion o a new or signifcantly improved product (good or service), or process, a new market-ing method, or a new organizational method in business practices, workplace organizationor external relations.”
The Science, Technology and Innovation Council defned innovation in the State o the
Nation 2008 report as “the process by which individuals, companies and organizationsdevelop, master and use new products, designs, processes and business methods. Thesecan be new to them, i not to their sector, their nation or to the world. The components oinnovation include research and development, invention, capital investment and training
and development.”
vi

8/6/2019 State of the Nation 2010: Imagination to Innovation, Building Canadian Paths to Prosperity
http://slidepdf.com/reader/full/state-of-the-nation-2010-imagination-to-innovation-building-canadian-paths 11/86
Executive Summary
Canada aims to be among the world’s innovation leaders. To do so we must understand the components andconnections in the science, technology and innovation (STI) system. A well-unctioning STI system is built on theoundation o a strong talent pool, excellent research, public and private sector institutions that create value romresearch and development, strong systemic mechanisms or knowledge transer and application, and successulcommercialization o innovation within the private sector. It takes a well-unctioning integrated system to moveideas rom imagination to innovation to markets.
Innovation is more than research and development (R&D) — it is transorming knowledge into products andservices that Canadians and others in today’s global marketplace need, want and will pay or. To leverage know-ledge into robust outcomes o better health, and strong and sustainable growth and jobs, we need to build andreinorce the paths to prosperity.
How good is Canada’s science, technology and innovation system at delivering the outcomes we want?
Our talent pool is holding its own and the number o Canadian university graduates is rising, with especiallyrapid growth in doctoral degrees in science. Graduation rates in master’s and doctoral science and engineering
degree programs have risen substantially more than in other advanced economies and aster than the growtho advanced degrees in all elds o study. Fiteen-year-old Canadians continue to outperorm most countries inreading, math and science. Canada remains in rst place in the G7 in the proportion o citizens with an educationbeyond high school.
Broader outcome-based indicators o excellence in universities and colleges have yet to be dened and applied onan international basis. Canadian business has markedly increased the R&D it unds in universities, although this isstill small — less than one tenth o overall R&D spending by business. Transerring knowledge rom research insti-tutions in universities and government to the marketplace and building a culture o innovation in business remainpaths requiring attention. Generating wealth rom commercialization is a valuable outcome o our commitment toscience, technology and innovation (STI) — an outcome that benets society both in economic and social terms.I we are underperorming in delivering the ull value o our STI progress, we must seek to understand why and
address these shortcomings.
Research and development perormed by business in Canada is low by international standards. In addition, rom2007 to 2009 Canadian industry R&D declined urther in both current and real dollar terms. Examinations oR&D intensity by industry, and in comparison with the same industries in other countries, indicate that in 2005,8 out o 16 industries examined had lower R&D intensity than the OECD average. There were, however, somenotable exceptions to Canadian levels o R&D perormance. Business R&D intensity higher than the Organisationor Economic Co-operation and Development (OECD) average was perormed in the paper, lumber and relatedindustry; inormation and communications technologies (ICT) manuacturing industry; wholesale and retail tradeas well as nance and communications service industries; transportation and storage industries; utilities; realestate and business services (including R&D and inormation technology (IT) services) industry.
Broadening the measure o innovation to include two important drivers o productivity growth — investments inmachinery and equipment (M&E), and investments in inormation and communications technologies — revealedmore challenging themes. In comparison with the United States (U.S.), over the period 2000 to 2007, M&E invest-ment intensity in Canada has been less than three quarters o U.S. levels and ICT investment intensity was lessthan hal o U.S. levels. However, the Canadian oil and gas extraction industry and nance, insurance, real estateand management o companies industry have registered higher M&E intensities than their U.S. counterparts. Datapresented in State o the Nation 2010: Imagination to Innovation also suggest that it is worth considering trendsin Canadian expenditures on IT services rather than only IT purchases, given their potential contribution to improv-ing innovation and productivity.

8/6/2019 State of the Nation 2010: Imagination to Innovation, Building Canadian Paths to Prosperity
http://slidepdf.com/reader/full/state-of-the-nation-2010-imagination-to-innovation-building-canadian-paths 12/862
State of the nation 2010
Not all innovation is the result o R&D. Process innovation and incremental innovation can be strong contributorsto productivity. Innovation success ultimately results rom the ambition and attention o management teams.
Beyond benchmarking, what principles should guide eorts to strengthen Canada’sinnovation perormance?
We must guard against complacency and continue to nurture talent at all levels. While 15-year-old Canadians’
scores remained airly stable, they ell in terms o rank in reading, science and math because others are improvingaster. We must work to support students to better learn and apply their knowledge.
Research and development sub-priorities identied by the Science, Technology and Innovation Council (STIC) in2008 can assist all innovation sectors to play rom Canada’s research and economic strengths. Even i one thirdo our resources are ocused in these areas, it will help to reinorce Canadian excellence on a global scale.
Competition and peer review have led to improved Canadian R&D at international levels o excellence. Themost recent example o this has been the quality and breadth o the Canada Excellence Research Chairs whoseresearch spans basic to more applied research. The competition demonstrated that not only large but also smallerCanadian universities can carve out niches o expertise and build alliances to establish a global reputation.
Collaboration should be considered in a clusters context, among universities and colleges, and small and large
companies. Support or clusters is one way to build critical mass in both short-term and long-term research areaso joint interest to companies and research organizations. Such collaborations also improve companies’ ability torecruit Canada’s highly qualied graduates. The participation o innovation intensive companies in such clustersand the active collaboration o the research and business communities will help ensure that Canada’s world-classresearch can be successully commercialized or the benet o this country.
The Research and Development Review Expert Panel, due to report in autumn 2011, will address how we canbetter leverage public unds to improve innovation commercialization outcomes in industry. Its recommendationswill be important or the uture o Canada’s STI system, and can reshape government programs to better incentprivate sector spending and to support entrepreneurship through simplied and better targeted assistance.
Between the 2008 and 2010 State o the Nation reports, Canadian industry has been bueted by a severe nan-cial crisis. As Canada emerges rom the crisis, opportunities remain to work together to achieve the innovationgoals we set or ourselves and to build paths to prosperity.
The State o the Nation 2010 report gets us closer to understanding how Canadian companies innovate. Datashow that some Canadian industries are global leaders. We are also ortunate to have a strong talent pool thatcould deliver on high ambitions. The challenge is to deploy talent well, invest in advanced technology, integrateinnovation into corporate and country strategies and leverage our eorts to deliver prosperity or all Canadians.This alignment will improve our lagging productivity growth. 2010 began with Canada’s athletes inspiring thenation with their resolve and high ambition. STIC’s State o the Nation reports are a starting point or bench-marking eorts in companies, universities and colleges, and governments across the country. Refecting onthe data in this report can help set ambitious goals that will put more Canadians and Canadian companieson global podiums.

8/6/2019 State of the Nation 2010: Imagination to Innovation, Building Canadian Paths to Prosperity
http://slidepdf.com/reader/full/state-of-the-nation-2010-imagination-to-innovation-building-canadian-paths 13/86
put orward two options. The rst option was a listo three indicators o innovation: patent applicationsweighted by Gross Domestic Product (GDP); percent-age o employment in knowledge intensive activities;and percentage o the value o medium- and high-techgoods as a share o both exports and imports. Thesecond option was the share o ast growing innovativerms in the economy.
The Science, Technology and Innovation Council’s(STIC) State o the Nation 2010 report opens withcommentary on progress since the State o the Nation
2008 report, and a summary o progress on key indi-cators noted in the report. Section 3 proposes a listo 20 indicators to measure innovation perormancegoing orward. These measures would serve to gaugeinnovation inputs including talent and research and
development (R&D), as well as proxies or innovationoutputs such as trademarks and licensing. Ideally theseindicators would also capture the degree o collabora-tion between dierent elements in the innovationsystem. An indicator or uture benchmarking couldbe based on components o Canada’s technologyintensive balance o payments. This would includeinternational transactions or the use o patents,licences, trademarks, designs, technical services andindustrial R&D carried out abroad. Together this shortlist o indicators could provide a common reerence
point or dierent parts o the innovation system.Section 4 reviews progress on measuring innova-tion and Section 5 shows the fow o unds betweensources and perormers o R&D. Section 6 providesmore detailed inormation on a longer list o indicatorso business innovation, knowledge developmentand transer, as well as talent.
Canada has come through the nancial crisis relativelywell. But beore breathing a sigh o relie, Canadiansmust prepare to tackle longer-term structural challengesto the economy. Our relatively strong Canadian dollarpresents challenges to exporters but reduces the cost orCanadian companies to import newer advanced capital.Productivity growth is essential or an aging and smallerworkorce to succeed in a highly integrated and com-petitive global economy. Innovation continues to matterbecause it can help meet these challenges.
Annual growth in Canada’s labour productivity (outputper hour worked) has been slowing and has been lessthan 1 percent or most o the last decade. In termso growth in labour productivity, the Institut européend’administration des aaires (INSEAD) ranked Canada95th o 132 countries. The International Institute orManagement Development (IMD) in Lausanne,Switzerland ranked Canada 45th o 58 countries. Parto Canada’s low international standings in productivity
growth is attributable to the act that developing coun-tries have a much greater potential or rapid productivitygrowth through technological convergence or catch-up rom low productivity levels. Among 33 advancedeconomies in the IMD standings, Canada’s productivitygrowth ranks 24th. As Canada’s productivity continuesto lag despite macro-economic reorms intended toimprove economic perormance, economists are increas-ingly ocusing on a lack o innovation in Canada as acontributor to poor productivity perormance.
Countries have made progress in eorts to understand
how innovation occurs. In Canada, analysis is currentlyunder way on the ndings o its pilot 2009 Survey o
Innovation and Business Strategy , some o the resultso which are published in this report. The rst com-prehensive United States (U.S.) ocial statistics oninnovation appeared in late 2010. The High-Level Panelon the Measurement o Innovation convened by theEuropean Commissioner or Research, Innovation andScience issued a report in September 2010. The panel
Introduction1

8/6/2019 State of the Nation 2010: Imagination to Innovation, Building Canadian Paths to Prosperity
http://slidepdf.com/reader/full/state-of-the-nation-2010-imagination-to-innovation-building-canadian-paths 14/864
There have been some signicant developments in keyareas noted in the Science, Technology and InnovationCouncil’s State o the Nation 2008 report,which include:
Talent — developing a highly qualifed workorce
attuned to innovation opportunities
Young Canadians continue to perorm well in inter-national rankings o reading, math and science skills.The latest results rom the Organisation or EconomicCo-operation and Development’s (OECD) Programme
or International Student Assessment (PISA) showeither sustaining or slightly declining raw scores,but Canada remains in the top tier o perormers(Section 6.3.1). More Canadian students are enrol-ling in undergraduate science, engineering and
The State o the Nation 2008 report underlined that all participants in the innovation system have a role to play in strengthening the system. In the last two years the pro-
le o productivity and innovation issues has risen signicantly in public discourse. Themedia have given innovation issues sustained attention. Major industry organizationslike the Canadian Chamber o Commerce,1 the Canadian Manuacturers & Exporters,2 and the Canadian Council o Chie Executives and initiatives such as the Coalition or
Action on Innovation in Canada3 have deepened consideration o innovation by busi-ness. Organizations such as the Public Policy Forum, the Conerence Board o Canada,the Canadian Science Policy Centre, the Institute or Competitiveness and Prosperity, and the Federal Partners in Technology Transer have engaged other players in the innovation
system. Participants in the innovation system are mobilizing, building new paths toinnovation and prosperity.
1 Canadian Chamber o Commerce, Canadian Businesses Go Global or Growth, August 2010.
2 Canadian Manuacturers & Exporters, Invest to Grow: Technology, Innovation and Canada’s Productivity Challenge, October 2010.
3 Coalition or Action on Innovation in Canada, An Action Plan or Prosperity , October 2010.
mathematics programs (Section 6.3.5). More Canadiansare enrolling and graduating rom science-based doc-toral programs, but other countries remain higher interms o doctoral-level graduates per million population(Section 6.3.8). Canada also has higher unemploymentlevels or science-based doctoral-level graduates thanother OECD countries. (Section 6.3.10).
Knowledge Development and Transer
Since 2008, more was done to ocus on researchpriorities and conduct research at international levels
o excellence. The rst recipients o the CanadaExcellence Research Chairs were announced. The chairsrefect the STIC research and development sub-priority
Tracking Progress in Canada’sInnovative Perormance —
2010 vs. 2008
2

8/6/2019 State of the Nation 2010: Imagination to Innovation, Building Canadian Paths to Prosperity
http://slidepdf.com/reader/full/state-of-the-nation-2010-imagination-to-innovation-building-canadian-paths 15/86
Measuring Innovation Perormance
Canada’s 2009 Survey o Innovation and Business
Strategy (SIBS) was released in November 2010. Careneeds to be taken in the uture to ensure that questionsin this survey align with international data on businesscollaboration with universities and companies obtainedthrough the U.S. and European Union (EU) surveys.
Many industry-specic actors will have an impacton how industries in Canada innovate, and howwell this innovation is measured. Research on innova-tion, including research by the National Endowmentor Science, Technology and the Arts (NESTA) in theUnited Kingdom (U.K.), suggests that there is likely tobe substantial hidden innovation and that the extento hidden innovation may dier in dierent industries.Innovation, as dened by the OECD’s Oslo Manual
(2005), can be new to a company even i it is not new
to the industry or to the world. Some innovation isuser-driven and involves large scale eld testing thatis not dened or tracked as R&D. Other innovationinvolves copying best practices applied elsewhere.Until these investments are tracked separately they willremain unquantiable and accounted or on an anec-dotal basis. Data presented in this report enable betterbenchmarking by illuminating industry dierences.Data points are, however, only tools or improving ourunderstanding o innovation rather than the nal wordon Canadian industry practices.
I companies apply their own reality check to data presented and refect onthe relevant practices o countries and companies who are global leaders intheir sectors, Canada will move ahead.
Since 2008, both incremental and transormative actionshave taken place. These have yet to raise our perorm-ance on key indicators o R&D in Canada. The ollowingtable itemizes changes in a short list o indicatorstracked since the State o the Nation 2008 report.
areas disseminated in 2008. The rst Vanier (CanadaGraduate) Scholarships Program doctoral students werenamed and the new Banting Postdoctoral FellowshipsProgram was launched (Section 6.3.13). Canada’sgranting councils — Canadian Institutes o HealthResearch, Natural Sciences and Engineering Research
Council o Canada, Social Sciences and HumanitiesResearch Council o Canada — have used the sub-priorities to inorm a number o their own programs.Competitions or Networks o Centres o Excellencehave utilized the sub-priorities as a key requirement.
Knowledge transer to business was improvedsince 2008 by strengthening internship programs(Section 6.2.2.1). The launch o the Government oCanada’s Research and Development Review ExpertPanel in October 2010 marked a commitment to exam-ine knowledge transer issues in a more comprehensive
way. The panel is to report in autumn 2011.
Business Innovation
Total nancial resources or research and development(R&D) in Canada as a percentage o GDP decreasedrom 2006 to 2008. Most o the world’s innovatingnations increased resources or R&D. A more detailedlook at the perormers o R&D shows that expenditureson R&D by government and the higher education sec-tor increased rom 2006 to 2009. R&D expendituresby business have decreased over the same timeperiod (Section 5).
State o the Nation 2008 stated that low overall busi-ness R&D in Canada had been a constant eature or40 years. Canada’s business R&D intensity remainslower than the OECD average and is lower than thato China. R&D expenditure has diered by industrysectors over the years. The State o the Nation 2010
report provides a baseline or examining R&D on anindustry sector basis (Section 6.1.4.4).
Governments are pooling public unds with private undsto expand available venture capital. The Government
o Canada improved the ability o Canadian businessesto attract oreign venture capital by narrowing the de-inition o taxable Canadian property, thereby reeingmany oreign investors rom the tax reporting require-ments under section 116 o the Income Tax Act .

8/6/2019 State of the Nation 2010: Imagination to Innovation, Building Canadian Paths to Prosperity
http://slidepdf.com/reader/full/state-of-the-nation-2010-imagination-to-innovation-building-canadian-paths 16/86
State o the Nation: Summary Comparison oSelected Indicators, 2008 and 2010 Reports
Section o Report / Indicator2008
Report
2010
Report
Change on Final Year
o Data rom 2008
to 2010*
Resources or Research and Development (R&D)
1. Gross domestic expenditure onR&D (GERD) as a percentage o GrossDomestic Product (GDP)
2006 1.97%
2008 1.84%
2006 to 2008
2. GERD by perorming sector(constant 2002 dollars)
2007 $0.28 billion$14.19 billion$8.53 billion
$2.21 billion
2008 $0.30 billion$13.22 billion$8.53 billion
$2.15 billion
2007 to 2008
by provincial governments
by business
by higher education
by ederal government
Business Innovation Indicators
3. Business expenditure on R&D (BERD)intensity, as a percentage o GDP
2006 1.10%15th place
20081.00%18th place
2006 to 2008
as a percentage o GDP
ranking in availableOECD countries
4. Direct and indirect government und-ing o business R&D, as a percentageo GDP
2005 0.21%0.023%
20080.22%0.022%
2005 to 2008
indirect governmentunding
direct governmentunding
5. Investment in machinery andequipment as a share o GDP
2004 6.2%
20076.3%
2004 to 2007
6. Venture capital relative to GDP 2007
0.12%
2008
0.08%
2007 to 2008
6
8/6/2019 State of the Nation 2010: Imagination to Innovation, Building Canadian Paths to Prosperity
http://slidepdf.com/reader/full/state-of-the-nation-2010-imagination-to-innovation-building-canadian-paths 17/86
State o the Nation: Summary Comparison oSelected Indicators, 2008 and 2010 Reports
Section o Report / Indicator2008
Report
2010
Report
Change on Final Year
o Data rom 2008
to 2010*
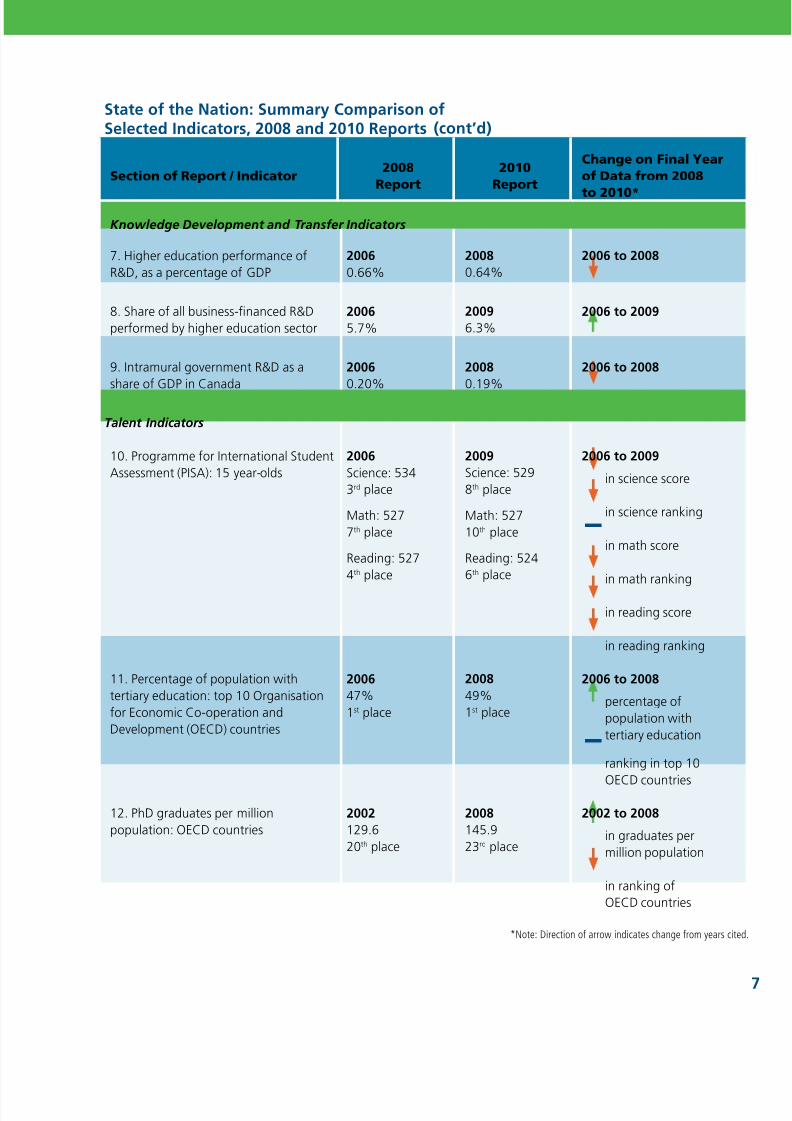
Knowledge Development and Transer Indicators
7. Higher education perormance oR&D, as a percentage o GDP
2006 0.66%
20080.64%
2006 to 2008
8. Share o all business-nanced R&Dperormed by higher education sector
2006 5.7%
20096.3%
2006 to 2009
9. Intramural government R&D as ashare o GDP in Canada
2006 0.20%
20080.19%
2006 to 2008
Talent Indicators
10. Programme or International StudentAssessment (PISA): 15 year-olds
2006 Science: 5343rd place
Math: 5277th place
Reading: 5274th place
2009Science: 5298th place
Math: 52710th place
Reading: 5246th place
2006 to 2009
in science score
in science ranking
in math score
in math ranking
in reading score
in reading ranking
11. Percentage o population withtertiary education: top 10 Organisationor Economic Co-operation andDevelopment (OECD) countries
2006 47%1st place
200849%1st place
2006 to 2008
percentage opopulation withtertiary education
ranking in top 10
OECD countries
12. PhD graduates per millionpopulation: OECD countries
2002 129.620th place
2008 145.923rd place
2002 to 2008
in graduates permillion population
in ranking oOECD countries
(cont’d)
*Note: Direction o arrow indicates change rom years cite

8/6/2019 State of the Nation 2010: Imagination to Innovation, Building Canadian Paths to Prosperity
http://slidepdf.com/reader/full/state-of-the-nation-2010-imagination-to-innovation-building-canadian-paths 18/868
between countries, oten do not provide the level odetail that helps countries compare or benchmark theinnovative perormance by industry or industry sector.
Research or the State o the Nation 2010 report,progress in developing metrics or innovation andconsultations with participants in the innovation sys-tem over the last three years, have led STIC to recom-mend a short list o indicators going orward. To betteraccount or innovation that is more than R&D andto enable better benchmarking by participants in theinnovation system, the ollowing set o indicators isidentied or ongoing monitoring.
Measuring innovation is a worldwide work in progress.It has evolved rom measures o research and develop-ment and talent to encompass measures o machineryand equipment, intangibles such as sotware and data-bases, and in-rm specic human and organizational
capital. Section 4 describes recent developments inmeasuring innovation. In Section 3 we propose a set oindicators that place a premium on allowing or inter-national comparison on a standardized basis. Someo the indicators are available or Canada only. Theindicators are useul because they are more recent, andoten provide signicant industry-level detail and allowor analysis across time. Other innovation measures arecompiled by international organizations such as theOECD, the World Economic Forum, INSEAD and others.International sources, while allowing or comparisons
Perormance Indicators or Canada’s Innovation System
IndicatorYearo
DataRationale
Talent
1. Organisation or EconomicCo-operation and Development’s(OECD) Programme orInternational Student Assessment(PISA): 15 year-olds
2009 Measures Canada against international sample, benchmarking talent atthe secondary school level. Assesses reading, mathematics and science.
2. Percentage o populationwith tertiary education 2008 Measures supply o advanced skills, which can contribute toproductivity gains.
3. Numbers o bachelor-degreegraduates in science andengineering-related disciplinesrom university
2008Measures graduates with a package o skills and knowledgethat is valued in the labour market and can contribute toeconomic growth.
4. Number o PhDs inscience, math andengineering (graduates)
2008 Measures talent pool at technology rontier.
5. Research and development(R&D) personnel in business 2007 Measures industry use o highly qualied researchers.
Going Forward —A Core Set of Indicators
to Measure Innovation
3

8/6/2019 State of the Nation 2010: Imagination to Innovation, Building Canadian Paths to Prosperity
http://slidepdf.com/reader/full/state-of-the-nation-2010-imagination-to-innovation-building-canadian-paths 19/86
Perormance Indicators or Canada’s Innovation System
IndicatorYearo
DataRationale
Research and Development
6. Gross domestic expenditure
on R&D (GERD) as a share oGross Domestic Product (GDP) 2008Benchmarks Canadian resources allocated to R&D againstother countries.
7. GERD by perorming sector inconstant dollars
2008 Illustrates the state o R&D spending by business, government and highereducation and highlights the trends in each.
8. Major fows o R&D undingin Canada 2009 Illustrates the links between sources o unding and R&D perormers.
9. Business expenditure on R&D(BERD) intensity by country 2008
Benchmarks R&D perormed in business in Canada vs. R&D perormed in busi-ness in other countries. Data can be presented on an industry sector basis.
10. Direct and indirect govern-ment support to businessor R&D
2008Tracks the type o mechanisms used by government to encourage privatesector investment in R&D. Benchmarking with other countries aids analy-sis on the ecacy o policy instruments.
11. Higher education perorm-
ance o R&D, as a share o GDP 2008
Benchmarks R&D perormed in universities in Canada vs. R&D perormed
in universities in other countries.12. Share o all business-nancedR&D perormed by higher educa-tion sector and others
2009 Illustrates trends in business strategies and propensity to perorm R&Din-house or through outsourcing.
13. Intramural government R&D:share o GDP in Canadaand the G7
2008Benchmarks R&D in government labs and institutes vs. R&D perormed ingovernment in other countries. Measures R&D important to achieving societalgoals that would not be conducted by other parts o the innovation system.
Innovation (other than R&D)
14. Investment in machinery andequipment, including inorma-tion and communications tech-nologies (ICT), as a share o GDP
2007Measures inputs to innovation other than R&D. New ideas are embedded inleading-edge technologies and enable workers to produce more and higher-quality goods and services through more ecient business processes.
15. Utilization o inormationtechnology (IT) services
2005Measures input to innovation other than R&D. Technological change isprompting changes in business processes, which result in inrastructure, intan-gibles such as sotware, and customer service being bundled as a service.
16. Venture capitalrelative to GDP 2008
Measures the pool o capital important or start-ups in the knowledgeintensive ICT and lie sciences industries. Tracks the capacity orundertaking high-risk investments.
17. Firms collaborating in innova-tive activities with public or privatepartners, government, and highereducation institutions by size
2002–2004,
noupdates
orCanada
Collaboration has become an important source o competitive advantage.Innovations are increasingly brought to the market by networks o busi-ness, academic and government partners. Regional associations can bepartners in tracking collaboration within geographic clusters.
18. Number o licences romuniversities to businesses
2008 Measures technology transer and potentially commercially-valuableknowledge transer to the private sector. Indicates leveraging o publicinvestments in higher education.
19. Trademarks 2008Trademarks can be applied to innovation in goods and services and encom-pass marketing innovation. The OECD has ound that trademark applicationsare highly correlated with other innovation indicators.
20. Technology intensivetrade fows (services and goods)
2010
Measures the ability o Canadian enterprises to export goods and servicesand trends in the use o goods and services by Canadian companies.Measures Canadian success on a global scale (i.e., global demand orCanadian ideas and expertise). Payments refect Canadian demand andawareness o global opportunities.
(cont’d)
8/6/2019 State of the Nation 2010: Imagination to Innovation, Building Canadian Paths to Prosperity
http://slidepdf.com/reader/full/state-of-the-nation-2010-imagination-to-innovation-building-canadian-paths 20/8610
4.2 Ud Ss —
Busss R&D d iovo Survy
Ater years o absence rom the measurement o innov-ation, the U.S. National Science Foundation’s Divisiono Science Resources Statistics, in collaboration withthe Economic Directorate o the Bureau o the Census,has conducted a new Business R&D and Innovation
Survey (BRDIS). The stratied sample o 40,000 rms,with ve or more employees, includes a census olarge R&D perormers, the 50 largest rms, basedon payroll, in each state, and a sample o other rmsdrawn rom the U.S. Census Bureau’s Business Register.It went into the eld as a pilot survey in January 2009and R&D estimates were released in 2010.
The survey included the propensity or rms to innov-ate, and related variables, broken down by industry.It also reerred to the number o rms that do anddo not perorm R&D, providing an understanding othe place o R&D in the business strategies o small,medium and large companies. Results rom the newsurvey can be used to track the impact o new pro-grams on the industrial distribution o innovation.
Europe’s Community Innovation Survey (CIS) has beenrunning at regular intervals since 1992 and provided amodel or the 2005 innovation survey in Canada andor the innovation questions used in the U.S. BRDIS.CIS data are available rom Eurostat, the statisticaloce o the European Commission. Aggregate dataor the 27 European Union (EU) member states, andsome other countries, are presented in the EuropeanInnovation Scoreboard, which has recently beenrevised to become the Innovation Union Scoreboard.
This section highlights progressmade in the measurement o innovation that is not researchand development.
New surveys are in development and in the eld.A number o countries and international organiza-tions are also working on measuring innovation thatoccurs as a result o changes in business processes,organization or marketing or through investments inintangible assets. Canada’s 2009 Survey o Innovation
and Business Strategy (SIBS) and the United States’2009 Business R&D and Innovation Survey (BRDIS) arenew surveys that made data available or analysis in2010. Future analysis can draw on data to enable com-parisons with Europe’s Community Innovation Survey (CIS). The United Kingdom’s National Endowment or
Science, Technology and the Arts (NESTA) Innovation
Index and the Organisation or Economic Co-operationand Development’s (OECD) Measuring Innovation: A
New Perspective (2010) explore possible uture indica-tors. However, producing comparative analysis is sometime away, as protocols have yet to be developed orstandardization o data.
4.1 Cd — Survy of
iovo d Busss Srgy
The 2009 Survey o Innovation and Business Strategy (SIBS) sampled over 6,000 companies. Survey ques-tions address the motivation or innovation, spendingon innovation activities, collaboration and the resultsexpected rom innovation. This survey is discussed ingreater detail in Section 6.1.3.
Recent Developments inMeasuring Innovation
4

8/6/2019 State of the Nation 2010: Imagination to Innovation, Building Canadian Paths to Prosperity
http://slidepdf.com/reader/full/state-of-the-nation-2010-imagination-to-innovation-building-canadian-paths 21/86
Using data rom 21 countries, the report concludedthat rms receiving public support or innovationinvested 40 percent to 70 percent more than thosewho did not. It is also suggested that higher levelso company investment in innovation lead toelevated sales o new-to-market products and
higher productivity.4
New work was undertaken to capture investments inintangible assets. The OECD divided these into com-
puterized inormation, which includes sotware anddatabases; innovative property , which includes scien-tic R&D, mineral exploration, copyright and licencecosts, and product development, design and research;and economic competencies, which include brandequity, rm-specic human capital and organizationalcapital. Work in this area does not yet include stan-dardized methods and denitions. It does show that
investments in intangibles are larger than investmentsin machinery and equipment in the U.S. and Sweden.Estimates o the contribution o intangible assets tolabour productivity growth show that these explaina good portion o multiactor productivity growth insome OECD countries.
Another highlight is the measure o “new-to-market”product innovators with and without R&D as a percent-age o innovators. This indicator shows that a largeshare o rms develop their innovation without per-orming any R&D.
New work was undertaken to captureinvestments in intangible assets:computerized inormation, innovative
property and economic competencies.
4.3 Ud Kgdm — Plnol edowm for Scc, tchology d
h ars iovo idx
The National Endowment or Science, Technology
and the Arts (NESTA) Innovation Index seeks to betterunderstand innovation at the rm level through captur-ing ‘hidden innovation’ and investigating the dierentways that innovation occurs in nine industries. NESTAdeveloped a rm-level innovation survey that wastailored to the dominant modes o innovation in eachindustry. Industries covered included energy production,accountancy services, specialist design, consultancy ser-vices, construction, architectural services, sotware andinormation technology (IT) services, legal services and
automotive. Results were published in November 2009.The survey asked rms about how they: obtained newideas rom elsewhere; turned ideas into products; andcommercialized innovation (i.e., used innovative goodsand services to make money).
The survey uncovered signicant levels o hiddeninnovation in several industries where levels o trad-itional R&D investment are low, and ound that hiddeninnovation was also important or high R&D industries.For every sector surveyed, except the energy produc-tion sector, where the eect was noted as small,
innovative rms showed higher sales growth thannon-innovators. This methodology is experimental andhas not been used in national data-gathering eorts.
4.4 orgs recmc C-pr dDvlpm — Msurg
iovo: a nw Prspcv
In its 2010 Measuring Innovation: A New Perspective report, the OECD presented new indicators along withnovel ways o looking at traditional ones. It includedmeasures o expenditure on “innovation” as opposedto “R&D” by rm size. Expenditure on innovationincludes: total expenditure by rms on R&D that theyperorm in-house or externally; acquisition o otherexternal knowledge (e.g., patents, licences and trade-marks); and acquisition o machinery, equipment andsotware. Canadian data or this indicator were 2005data and only or manuacturing.
4 OECD (2010), Measuring Innovation: A New Perspective, p. 78.

8/6/2019 State of the Nation 2010: Imagination to Innovation, Building Canadian Paths to Prosperity
http://slidepdf.com/reader/full/state-of-the-nation-2010-imagination-to-innovation-building-canadian-paths 22/8612
Resources or Researchand Development
5
As a share o GDP, R&D expenditures in Canada lagbehind the G7 average (Figure 1). From 2006 to 2008,GERD/GDP in Canada dropped rom 2.0 percent to justover 1.8 percent. This change was partly due to rapid
GDP growth; however, growth in Canadian GERD alsolagged that in the G7 over this period.
Gross domestic expenditure on research and develop-ment (GERD) is total expenditure on research anddevelopment perormed in the country during a givenperiod. Domestic perormers o research and develop-ment include government (ederal, provincial and prov-incial research organizations), business enterprise, privatenon-prot, and higher education. Funding or GERD
comes rom domestic and oreign sources.
The share o GERD relative to the size o a country’sGross Domestic Product (GDP) is a commonly used indi-cator o innovation perormance. This has been a useulinternational benchmark and guides many science, tech-nology and innovation strategies around the world.
Source: OECD, Main Science and Technology Indicators, 2010.
Figure 1 Gross Domestic Expenditure on R&D (GERD) as a Percentage Shareo GDP (2006 and 2008)

8/6/2019 State of the Nation 2010: Imagination to Innovation, Building Canadian Paths to Prosperity
http://slidepdf.com/reader/full/state-of-the-nation-2010-imagination-to-innovation-building-canadian-paths 23/86
5 Federal Funding o Business R&D includes direct grants and contracts rom the ederal government or R&D perormed in the busi-ness enterprise sector in Canada. This gure does not include SR&ED tax credits, or repayable loans that may be made under certainederal programs. Foreign unding o R&D includes all unding o R&D perormed in Canada, which is unded by a oreign source,i the nancing o the R&D involves an international transer o unds rom a oreign country into Canada. This includes transers ounds between, or example, oreign parent companies and their Canadian aliates or R&D projects carried out in Canada.
6 OECD (2010), Main Science and Technology Indicators.
Figure 2 Gross Domestic Expenditure on R&D as a Percentage Share oGross Domestic Product, or Selected Countries, 1981–2008
Source: OECD, Main Science and Technology Indicators, 2
Figure 2 shows that among some o the top R&D-perorming countries, including Canada, total GERD/ GDP ratios over the past 10 years show mixed trends.Over this period, ratios substantially increased inJapan, China and South Korea. Canada showeda modest increase.
From 2006 to 2009, government,higher education, oreign sources and
private non-prot sectors all increased their unding or R&D.
Increasing Canada’s research intensity and osteringinnovation requires concerted and coordinated eortsby the three principal Canadian R&D-perorming sec-tors: the private sector, the higher education sector andgovernment. Figure 3 shows the R&D undingand perormance that are undertaken by these threeprincipal perorming sectors and other supportingagents such as private non-prot organizations.5
In the period rom 2006 to 2009, government, highereducation, oreign sources and private non-prot sectorsall increased their unding or R&D. Interestingly, the
private non-prot sector increased its overall undingo R&D by just over 16 percent (in current dollars), themost over the period o 2006 to 2009 compared tothe other sectors. During the same period, Canadianbusiness expenditure on R&D declined in infation-adjusted terms. The Government o Canada directly
unded just under $6 billion o R&D perormed inCanada in 2009 (in current dollars), an increase rom2006 o just under $500 million or 8.6 percent. Almosthal o this $6 billion was carried out in Government oCanada institutions and labs. The remainder o about$3 billion or R&D (in current dollars) was perormed bythe higher education, business and private non-protsectors. In-house government R&D as a share o GDPell slightly to 0.188 percent in 2008 rom 0.195 percentin 2006 (as reported in State o the Nation 2008) andthe gap between Canada and the G7 (minus Japan, orwhich data are not provided) continued to widen.6
Canadian business expenditureon R&D declined in infation-adjusted terms.

8/6/2019 State of the Nation 2010: Imagination to Innovation, Building Canadian Paths to Prosperity
http://slidepdf.com/reader/full/state-of-the-nation-2010-imagination-to-innovation-building-canadian-paths 24/86
State of the nation 2010
14
* Includes only ows and perormers > $100M.
Source: Statistics Canada, CANSIM Table 358-0001, August 2010.
Figure 3 Major Flows o R&D Funding in Canada, 2009*
Source: Statistics Canada, CANSIM Table 358-0001, July 15, 2010.

8/6/2019 State of the Nation 2010: Imagination to Innovation, Building Canadian Paths to Prosperity
http://slidepdf.com/reader/full/state-of-the-nation-2010-imagination-to-innovation-building-canadian-paths 25/86
Figure 6 shows that Canada is near the top o theOECD, and ranks number one in the G7, in terms ohigher education research and development (HERD) asa percentage o GDP. In 2008, higher education R&Dwas 0.644 percent o GDP, down slightly rom 0.664percent in 2006.7 HERD includes all research perormed
in higher education organizations such as universi-ties and aliated teaching hospitals. Canada’s leadincreased rom 1997 to 2001 because o its invest-ments in research inrastructure (such as laboratories),and rom 2001 to 2007 because o investments inresearch. The spending rate and the balance o und-ing between inrastructure and research have remainedstable over the last decade. Figure 7 shows that ederalHERD expenditure consistently increased rom 1997–98to 2008–09. The level o expenditure in inrastruc-ture increased rom 1997–98 to 2001–02, and thenremained relatively stable rom 2001–02 to 2008–09.Announced on January 27, 2009, as part o theGovernment o Canada’s Economic Action Plan, theKnowledge Inrastructure Program provided $2 billionto support enhancement at universities and collegesover two years.
Canada ranks number one in the G7, interms o higher education research and development (HERD) as a percentageo GDP.
Figure 4 shows the trend o R&D perormed by ederaland provincial governments, business and higher edu-cation sectors rom 1998 to 2008 in constant dollars.According to this gure, in Canada, growth in highereducation R&D perormance was responsible or justover hal o the growth in total R&D over the period o
1998 to 2008: higher education perormance o R&Dgrew rom just under $5 billion in 1998 to just over$8.5 billion in 2008 (infation-adjusted dollars).
Figure 5 shows that business-nanced R&D perormedby universities has grown substantially in Canada,especially since the early 1990s. In 2009, university-perormed R&D was 6.3 percent o total businessunded R&D (which includes R&D nanced and under-taken by businesses and R&D nanced by business butundertaken by other sectors). This share was down romthe peak o 6.6 percent in 1992, but was above the
more recent peak o 2000 (preceding the tech collapseo 2001). While the growth in the share has slowed inrecent years, the secular trend over the past two dec-ades is upwards.
Business-nanced R&D perormed by universities has grown substantially in Canada.
7 OECD (2010), Main Science and Technology Indicators .
Source: Statistics Canada, CANSIM Table 358-0001, September 2010.

8/6/2019 State of the Nation 2010: Imagination to Innovation, Building Canadian Paths to Prosperity
http://slidepdf.com/reader/full/state-of-the-nation-2010-imagination-to-innovation-building-canadian-paths 26/86
State of the nation 2010
16
Figure 7 Federal Expenditures onHigher Education R&D(Constant 2002 Dollars)8
Source: Industry Canada calculation based on data rom Statistics Canada(Catalogue 88-204) and the Granting Councils’ Funding Decision Databases.
8 Federal Expenditures on Higher Education R&D are dened as the three Granting Councils and the Canada Foundation orInnovation’s (CFI) expenditures on R&D in the Higher Education Sector. Inrastructure includes expenditures or all CFI programsexcept or the Inrastructure Operating Fund (IOF), and equipment and tools programs rom NSERC and CIHR. Research includesall other research grants rom the granting councils and the IOF portion o CFI.
9 OECD (2010), “Firms investing in R&D,” OECD Measuring Innovation: A New Perspective. (http://www.oecd.org/dataoecd/29/33/45188105.pd)
10 Johan Hauknes and Lennart Nordgren, Economic Rationales o Government Involvement in Innovation and the Supply o
Innovation-Related Services, The STEP Group, 1999.
Direct and Indirect Government Funding
o Business R&D
Governments use various tools to encourage privatesector investment in R&D. These tools can be classiedinto direct support and indirect support. Direct support
encompasses grants, loans and procurement. Indirectsupport includes R&D tax credits, R&D allowances andreductions in R&D workers’ wage taxes. The best bal-ance o tools to use varies rom country to country andis determined by the market or system ailure beingaddressed and the type o R&D that the governmentwants to stimulate.9 System ailure has been described asthe lack o coherence among institutions in an innova-tion system and in incentive structures.10
Source: OECD, Main Science and Technology Indicators , 2010.
Figure 6 Higher Education Perormance o R&D
8/6/2019 State of the Nation 2010: Imagination to Innovation, Building Canadian Paths to Prosperity
http://slidepdf.com/reader/full/state-of-the-nation-2010-imagination-to-innovation-building-canadian-paths 27/86
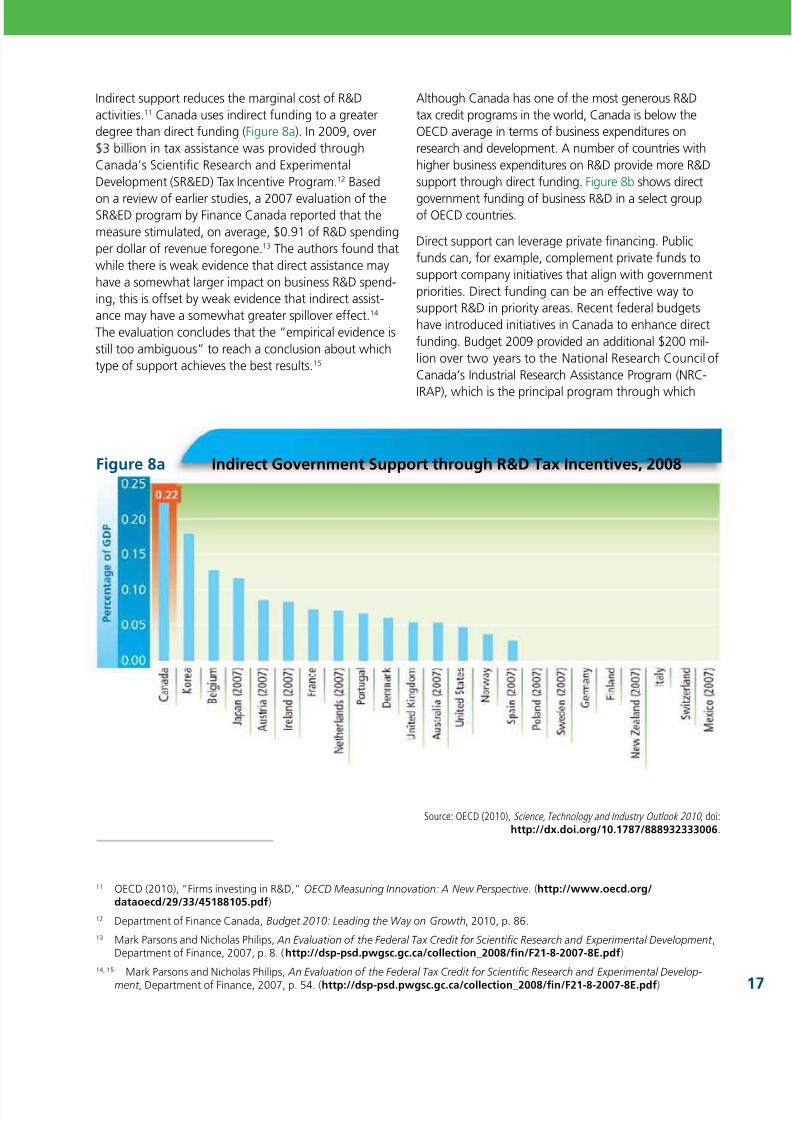
Indirect support reduces the marginal cost o R&Dactivities.11 Canada uses indirect unding to a greaterdegree than direct unding (Figure 8a). In 2009, over$3 billion in tax assistance was provided throughCanada’s Scientic Research and ExperimentalDevelopment (SR&ED) Tax Incentive Program.12 Based
on a review o earlier studies, a 2007 evaluation o theSR&ED program by Finance Canada reported that themeasure stimulated, on average, $0.91 o R&D spendingper dollar o revenue oregone.13 The authors ound thatwhile there is weak evidence that direct assistance mayhave a somewhat larger impact on business R&D spend-ing, this is oset by weak evidence that indirect assist-ance may have a somewhat greater spillover eect.14 The evaluation concludes that the “empirical evidence isstill too ambiguous” to reach a conclusion about whichtype o support achieves the best results.15
11 OECD (2010), “Firms investing in R&D,” OECD Measuring Innovation: A New Perspective. (http://www.oecd.org/dataoecd/29/33/45188105.pd)
12 Department o Finance Canada, Budget 2010: Leading the Way on Growth, 2010, p. 86.
13 Mark Parsons and Nicholas Philips, An Evaluation o the Federal Tax Credit or Scientic Research and Experimental Development ,Department o Finance, 2007, p. 8. (http://dsp-psd.pwgsc.gc.ca/collection_2008/fn/F21-8-2007-8E.pd )
14, 15 Mark Parsons and Nicholas Philips, An Evaluation o the Federal Tax Credit or Scientic Research and Experimental Develop-
ment , Department o Finance, 2007, p. 54. (http://dsp-psd.pwgsc.gc.ca/collection_2008/fn/F21-8-2007-8E.pd )
Figure 8a Indirect Government Support through R&D Tax Incentives, 2008
Source: OECD (2010), Science, Technology and Industry Outlook 2010 , doi:http://dx.doi.org/10.1787/888932333006.
Although Canada has one o the most generous R&Dtax credit programs in the world, Canada is below theOECD average in terms o business expenditures onresearch and development. A number o countries withhigher business expenditures on R&D provide more R&Dsupport through direct unding. Figure 8b shows direct
government unding o business R&D in a select groupo OECD countries.
Direct support can leverage private nancing. Publicunds can, or example, complement private unds tosupport company initiatives that align with governmentpriorities. Direct unding can be an eective way tosupport R&D in priority areas. Recent ederal budgetshave introduced initiatives in Canada to enhance directunding. Budget 2009 provided an additional $200 mil-lion over two years to the National Research Council oCanada’s Industrial Research Assistance Program (NRC-
IRAP), which is the principal program through which

8/6/2019 State of the Nation 2010: Imagination to Innovation, Building Canadian Paths to Prosperity
http://slidepdf.com/reader/full/state-of-the-nation-2010-imagination-to-innovation-building-canadian-paths 28/86
State of the nation 2010
18
State of the nation 2010
16 National Research Council o Canada’s Industrial Research Assistance Program (NRC-IRAP).
17 OECD (2010), Science, Technology and Industry Outlook 2010, p.103.
18 Anne Palkamo, Finland Plans Tax Incentives or Companies’ R&D Activities, Tekes, 2009. (http://www.tekes.f/en/community/
News/482/News/1344?name=Finland+plans+tax+incentives+or+companies+R%26D+activities)
Figure 8b Direct Government Funding o Business R&D, 2008
Source: OECD (2010), Science, Technology and Industry Outlook 2010 , doi:http://dx.doi.org/10.1787/888932333006.
direct support is delivered to small and medium-sizedenterprises (SMEs). For scal year 2009–10, IRAP’sbudget included about $187 million in direct supportto rms.16 The Canadian Innovation Commercialization
Program (CICP) or small and medium-sized enterpriseswas launched in September 2010. The CICP is a twoyear, $40 million pilot initiative that will support up to20 innovative demonstration projects.
Although Canada has one o the most generous R&D tax credit programs in theworld, Canada is below the OECD averagein terms o business expenditures onresearch and development.
Direct unding through grants, subsidies and loans isthe most common orm o support or business R&D inOECD countries.17 Finland recently reviewed its undingmodel, recognizing that tax incentives can complementa system traditionally dependent on direct supportalone.18 In conducting its review, Finland identiedNorway as a country with a well-unctioning modelthat employs both direct and indirect support. In 2008,the ratio o direct to indirect support in Norway wasapproximately two to one.

8/6/2019 State of the Nation 2010: Imagination to Innovation, Building Canadian Paths to Prosperity
http://slidepdf.com/reader/full/state-of-the-nation-2010-imagination-to-innovation-building-canadian-paths 29/86
growth in Canada by industry and by sector, and thencompares labour productivity levels, and their deter-minants, with the United States. The our determinants
examined include: multiactor productivity, investmentsin machinery and equipment (M&E), inormation andcommunications technologies (ICT) (equipmentand services), and research and development.
This report also includes new innovation survey nd-ings on how Canadian-based enterprises innovate,the place o innovation in their corporate strategies,and their expenditures on product and process innova-tions. The growth o technology intensive commercialservices trade is also described and analyzed. Finally,the report points out sectoral dierences in how muchlarge, medium and small companies are investing inR&D and developments in the availability o venturecapital or Canadian businesses.
6.1.2 Productivity Growth or ImprovedStandards o Living“There are, o course, other actors besides produc-
tivity growth that aect our standard o living, such
as changes in Canada’s terms o trade (the prices we
receive or what we sell abroad relative to the prices
we pay or imports) and changes in employment
rates (the proportion o the population that is actually employed). However, productivity growth is the major
source o improvement in our economic well-being in
the long run. Gains in productivity allow businesses to
pay higher real (infation-adjusted) wages and still keep
costs down and stay protable and competitive. So,
rising productivity is vital to sustained improvements in
real incomes and living standards over time.”– Bank o Canada19
6.1 Busssiv idcrs
Private sector innovation is an engine o wealth cre-ation. For individual rms, developing new or improvedproducts can help preserve and capture market share,
increasing revenues and prots. I these innovationsmerely shit market share rom one company to another,consumers may benet rom added choice but overallwealth creation has not occurred. However, i innova-tion prompts other rms to improve their products tocompete, the result can be an improvement in the qual-ity o goods available to consumers — an improvementin consumers’ net wealth. Firms may also introduceprocess innovation to reduce costs, which can have theeect o increasing prot margins, lowering prices orconsumers, or both.
6.1.1 Going Beyond R&D Indicators toMeasure InnovationThe State o the Nation 2008 report reerred to thelinks between innovation, productivity and our stan-dard o living. It noted that Canadian industries investless in R&D and machinery and equipment than com-parable industries around the world. R&D expendituresare only one indicator o innovation, but an importantindicator that is well correlated with other contribu-tions to innovation.
Highly aggregated, national data can provide a useulbenchmark or the innovative perormance o an econ-omy, but it can mask signicant dierences in industrialcomposition and the perormance o individual indus-tries and rms. Some industries are inherently moreR&D- or ICT-intensive than others, and the relationshipbetween these variables and productivity (as is the casewith any metric o innovation) also varies by industry.
STIC’s State o the Nation 2010 explores businessinnovation on an industry and sector basis. This sectionbegins by presenting data on productivity levels and
Digest o Indicators6
19 Bank o Canada, Backgrounder on Productivity , 2010. (http://www.bankocanada.ca/en/backgrounders/bg-p4.html)

8/6/2019 State of the Nation 2010: Imagination to Innovation, Building Canadian Paths to Prosperity
http://slidepdf.com/reader/full/state-of-the-nation-2010-imagination-to-innovation-building-canadian-paths 30/8620
State of the nation 2010
R&D in Oil Sands and Heavy Oil
Dr. Josephine Hill, Zandmer/Canada Research Chair inHydrogen and Catalysis, at the University o Calgary,and recipient o the 2008 Minerva Mentoring Awardor encouraging women in engineering, scienceand inormation technology.
R&D Sub-Priority: Energy Production in the Oil Sands
Steam-assisted gravity drainage (SAGD) technology isan example o innovation in the oil and gas industrythat developed through extensive eld testing. Twohorizontal wells are drilled in oil sands ormations toproduce bitumen — which is a mixture o sand, clay,water, and a dense and viscous orm o petroleum.The upper well injects steam into the ormation, andthe lower well collects the heated crude oil or bitu-
men that fows out o the ormation, along with anywater rom the condensation o injected steam. The heatrom the steam reduces the viscosity o the heavy crude
oil or bitumen. This enhanced oil recovery technologyis considered twice as ecient as the older cyclicsteam stimulation process.
SAGD has gone through several transormations sinceit was rst conceived by Roger Butler in the late 1960s.Alberta Innovates Technology Futures (AITF) is sup-porting the development o alternative SAGD produced
water treatment technologies (e.g., ceramic mem-branes). Nexen’s Long Lake Project in the Athabascaoil sands is the rst to combine SAGD with an upgraderprocess that yields premium synthetic crude through acomparatively more ecient use o natural gas.
Research in Catalysis
Research and development sub-priorities span basic toapplied research. For example, research by JosephineHill, Zandmer/Canada Research Chair in Hydrogenand Catalysis, at the University o Calgary, examines andimproves eciencies in chemical and electrochemicalprocesses that can have application in energy produc-tion. The work in the catalysis eld has implicationsor: environmental impact; the development o uelcells; hydrotreating o heavy oil; and gasication.Implications also impact the conversion o solid wastematerials, such as petroleum coke and biomass intoactivated carbon, which can be used to clean up gasand liquid exhaust streams. The spent activated carboncan then be gasied to produce gaseous products,such as methane and syngas.
Productivity measures the total amount o goodsand services produced in a country or each input toproduction, such as labour, capital or land. The mostcommon measure o productivity is labour productiv-ity, which measures the amount o goods and servicesproduced by one hour o labour.
In Canada, labour productivity levels and their growthvary tremendously between industries. For example,Figure 9 reveals that private sector labour productivitylevels in service industries were only 89 percent o theaverage or the entire economy. The sectors o miningand oil and gas extraction and utilities were sectorswith at least three times the private sector labourproductivity levels o the overall economy. Productivity
in these sectors has been decreasing to an average o-4.5 percent and -1.7 percent respectively in the 2003to 2008 period. A decrease o -2.3 percent in labourproductivity was also registered in the constructionsector. In contrast, above average labour productivitygrowth was experienced in most service industries aswell as in the sector o agriculture, orestry, shing andhunting and the manuacturing sector over the 2003to 2008 period. Signicant labour productivity growthwas also experienced in the wholesale and retail tradesectors, both o which increased by 3.4 percent peryear in the 2003 to 2008 period.

8/6/2019 State of the Nation 2010: Imagination to Innovation, Building Canadian Paths to Prosperity
http://slidepdf.com/reader/full/state-of-the-nation-2010-imagination-to-innovation-building-canadian-paths 31/86
The sources o the strong labour productivity growth inthe U.S. service industries are attributable to high levelso ICT capital spending and rapid multiactor produc-tivity (MFP) growth. Multiactor productivity measures
joint infuences on economic growth, such as techno-logical change, eciency improvements, and returns
to scale.21
Economic research on the United States’ productiv-ity growth “miracle” suggests that service industries’labour productivity growth rate increased rom 1.0 per-cent per year beore 1995 to 2.3 percent per year insubsequent years.20 Much o the amed revival o U.S.productivity growth is attributable to services produc-
tivity. U.S. labour productivity growth is actually notmiraculous, but rather the result o corporate action.
20 Barry P. Bosworth and Jack E. Triplett, Is the 21 st Century Productivity Expansion Still in Services? And What Should Be Done About It?, Brookings Institution, Washington, D.C., January 2007.
21 Bank o Canada, The Virtue o Productivity in a Wicked World , remarks delivered by Mark Carney at the Ottawa Economics
Association, Ottawa, Ontario, March 24, 2010.
Figure 9 Private Sector Labour Productivity (2008) and Private Sector LabourProductivity Growth (2003–2008), by Industry
*Private sector labour productivity is calculated as real private sector Gross Domestic Product (in CAD) divided by total hours workedNote: Sectors are comprised o many industr ies
Source: Compilation by STIC Secretariat based on data rom Statistics Canada
SECTOR or IndustryLabour
Productivity,*2008
LabourProductivity
Growth(Average Annual
Growth (%)),2003–2008
GOODS SECTOR
AGRICULTURE, FORESTRY, FISHING AND HUNTING 35.2 4.7
MINING AND OIL AND GAS EXTRACTION 117.7 -4.5
UTILITIES 135.5 -1.7
CONSTRUCTION 28.7 -2.3
MANUFACTURING 48.7 0.8
AVERAGE FOR GOODS SECTOR 47.3 -0.6
SERVICES SECTOR
Wholesale Trade Industries 41.1 3.4
Retail Trade Industries 24.1 3.4
Transportation and Warehousing Industries 33.9 0.5
Inormation and Cultural Industries 64.1 2.9
Finance, Insurance, Real Estate and Leasing Industries 72.4 0.8
Proessional, Scientic and Technical Services Industries 30.9 0.1
Administrative and Support, Waste Management andRemediation Services Industries 22.1 0.6
Educational Services Industries 24.2 3.2
Health Care and Social Assistance Industries 31.7 0.7
Arts, Entertainment and Recreation Industries 20.0 1.0
Accommodation and Food Services Industries 15.5 1.7
Other Services (except Public Administration) Industries 17.4 1.1
AVERAGE FOR SERVICES SECTOR 33.6 1.7
Average or all Sectors and Industries 37.8 0.7

8/6/2019 State of the Nation 2010: Imagination to Innovation, Building Canadian Paths to Prosperity
http://slidepdf.com/reader/full/state-of-the-nation-2010-imagination-to-innovation-building-canadian-paths 32/86
State of the nation 2010
22
According to the System o National Accounts,22 products are goods and services (includingknowledge-capturing products) that result rom a process o production.
Goods are physical, produced objects or which a demand exists, over which ownershiprights can be established and whose ownership can be transerred rom one institutional
unit to another by engaging in transactions on markets.
Services are the result o a production activity that changes the conditions o the consumingunits, or acilitates the exchange o products or fnancial assets.
22 European Commission, International Monetary Fund, Organisation or Economic Co-operation and Development, United Nations,World Bank, System o National Accounts 2008, New York, 2009.
23 Peter Nicholson, Innovation and Business Strategy: Why Canada Falls Short , International Productivity Monitor , Centre or the
Study o Living Standards, Number 18, Spring 2009.
While comparisons across industries within Canadaare important to obtain an understanding o whereproductivity levels are improving, comparison withother countries’ industries provides an indication oCanada’s international competitiveness. Like Canada,U.S. services productivity levels lag in the manuac-turing sector, but are catching up rapidly. Growth inlabour productivity is essential or rising wages andincreased protability or employees and investors.
Figure 10 compares the relative perormance oCanadian industries compared to the same U.S. indus-tries or labour productivity levels, and its main deter-minants: multiactor productivity and capital intensitiesor machinery and equipment investments and ICTinvestments. The gure shows that there was a wid-ening Canadian labour productivity gap with the U.S.rom 2002 to 2007. Canadian productivity levels over
this time period ell rom 77.3 percent to 72.1 percento U.S. labour productivity levels. While Canadian min-ing, oil and gas, utilities and manuacturing sectors allsaw declines in labour productivity relative to the U.S.,9 out o 11 service industries also saw declines in rela-tive productivity to the U.S. over this period. Only agri-culture, orestry, shing and hunting, construction anda ew service industries (i.e., wholesale trade; nance,insurance and real estate and the management ocompanies industries) witnessed improvements in theirproductivity vis-à-vis their U.S. counterparts.
Analyzing the drivers o labour productivity is animportant part o understanding Canada’s relativeproductivity growth. Multiactor productivity (MFP)and investments in machinery and equipment (M&E),especially ICT capital, are important drivers o labourproductivity growth. Investments in M&E and ICT cap-ital oten infuence labour productivity through MFP. The Council o Canadian Academies’ Expert Panel on
Business Innovation concluded that “…the rate o MFPgrowth over suitably long periods o time is primar-ily due to business innovation — interpreted broadlyto include better organization o work, improvedbusiness models, the ecient incorporation o newtechnology, the payo rom R&D and the insightso entrepreneurs.”23
MFP declined relative to the U.S. in all industry sec-tors and industries o the Canadian economy with theexception o agriculture, orestry, shing and hunting;oil and gas extraction; construction and wholesaletrade. The net eect brought Canada’s relative MFPperormance down to 68.5 percent o U.S. MFP levels.In spite o this decline, Canadian construction, oiland gas extraction, wholesale trade, administrative andwaste management, and other service industries(except public administration) retained higher MFP
levels than their U.S. counterpart.
MFP declined relative to the U.S. in all sectors and industries o the Canadianeconomy with the exception o agriculture, orestry, shing and hunting; oil and gas extraction;construction and wholesale trade.
Investments in machinery and equipment (M&E) andits ICT component were similarly lower than overall
U.S. levels rom 2000–07. Relative investment intensityin ICT was less than one hal the U.S. levels, whereasinvestments in M&E were slightly under three quarterso the U.S. levels. Canadian machinery and equip-ment investment intensity was higher than U.S. levelsin the oil and gas extraction industry and the nance,insurance and real estate (FIRE) and managemento companies industry. For ICT capital, Canada’s

8/6/2019 State of the Nation 2010: Imagination to Innovation, Building Canadian Paths to Prosperity
http://slidepdf.com/reader/full/state-of-the-nation-2010-imagination-to-innovation-building-canadian-paths 33/86
Figure 10 Canada–U.S. Labour Productivity, Multiactor Productivity, andCapital Intensity Comparisons (U.S. = 100)
*Machinery and Equipment includes ICT** FIRE stands or Finance, Insurance, Real Estate and Leasing
Note: Sectors are comprised o many industriesSource: Tang, Jianmin, Someshwar Rao, and Min Li, Sensitivity of Capital Stock and Multifactor Productivity Estimates to Depreciation Assumptions: A Canada–U.
Comparison, International Productivity Monitor , Number 20, Fall 2010, Ottawa, Centre or the Study o Living Standards
investment intensity was higher than U.S. levelsduring the 2000–07 period in the arts, entertain-ment and recreation and other services (except publicadministration) industries. Gross xed capital orma-tion in machinery and equipment was 6.3 percent oCanada’s GDP in 2007, up slightly rom 6.2 percent in
2004 (as reported in State o the Nation 2008).24
6.1.3 Innovation Focus in Business StrategyThe 2009 Survey o Innovation and Business Strategy (SIBS) was a joint pilot project by Industry Canada,Foreign Aairs and International Trade Canada andStatistics Canada. A total o 6,233 enterprises inCanada spanning 67 industries were surveyed. Thesample was limited to rms with 20 or more employees
24 OECD (2009). OECD Factbook 2009: Economic, Environmental and Social Statistics.
SECTOR or Industry
LabourProductivity
MultiactorProductivity
Machineryand
Equipment*ICT
2002 2007 2002 20072000–07Average
2000–07Average
GOODS SECTORAGRICULTURE, FORESTRY,FISHING AND HUNTING
85.5 86.4 82.8 86.2 70.5 79.1
MINING 88.9 88.0 79.3 72.5 80.0 31.2
Mining, except oil and gas industry 58.1 47.3 52.2 39.4 57.0 35.1
Oil and gas extraction industry 87.9 81.6 94.9 100.3 100.5 25.6
UTILITIES 76.5 62.7 53.9 49.0 51.0 73.6
CONSTRUCTION 149.5 192.5 151.8 196.9 79.2 14.7
MANUFACTURING 84.4 73.2 91.1 77.2 91.1 36.6
SERVICES SECTOR
Wholesale Trade Industries 73.7 90.0 97.8 120.3 29.9 45.6Retail Trade Industries 81.3 75.6 95.3 85.5 70.4 72.1
Transportation and Warehousing Industries 123.8 108.1 112.5 96.7 86.8 19.7
Inormation and Cultural Industries 64.5 46.6 69.9 52.3 82.8 98.5
FIRE** and Management oCompanies Industries
70.0 72.1 75.7 74.9 105.4 72.2
Proessional, Scientic andTechnical Services Industries
45.4 38.6 54.0 47.6 45.7 42.3
Administrative and WasteManagement Industries
113.5 107.6 144.1 126.2 39.9 49.9
Education, Health Care and
Social Assistance Industries
99.4 95.9 102.0 98.0 34.2 17.8
Arts, Entertainment and Recreation Industries 39.6 39.0 49.4 47.9 39.3 128.7
Accommodation and Food Services Industries 74.1 72.2 85.2 78.8 28.3 47.1
Other Services (except PublicAdministration) Industries
145.3 143.8 181.6 178.3 61.1 102.1
Average or all Sectors and Industries 77.3 72.1 75.4 68.5 74.5 47.9

8/6/2019 State of the Nation 2010: Imagination to Innovation, Building Canadian Paths to Prosperity
http://slidepdf.com/reader/full/state-of-the-nation-2010-imagination-to-innovation-building-canadian-paths 34/86
State of the nation 2010
24
Thirty-one percent o enterprises’ long-term stra-tegic ocus was to introduce signicantly improvedmarketing practices or methods, while 33 percent oenterprises’ long-term ocus was to introduce newor signicantly improved management practices orchange to their organizational structure.
Monitoring the outcomes o innovative activities isessential to ensuring that long-term innovation strat-egies are successully adopted. The survey inquiredabout the monitoring practices o Canadian-basedenterprises to achieve their objectives. Financialobjectives gured most prominently in all enterprises’measurement o long-term strategic objectives, rangingrom 65 percent o enterprises monitoring gross oroperating margin growth to 76 percent monitoringsales or income growth. Customer orientation indica-tors were the next most cited set o measures. This
includes process and organization-related objectivessuch as improved customer satisaction (50 percento enterprises). Increased sales o new products andprocess innovation placed third in importanceas to what is measured in the long-term objectiveso enterprises.
6.1.3.1 Expenditures on Innovation Activities
Amongst all Canadian-based enterprises reportinginnovative activities, utility enterprises have a greaterincidence o spending large amounts on both product
and process innovation, as shown in Figures 11 and 12.For good or service innovations, 41 percent o innova-tive enterprises in this industry spent more than$1 million, 26.4 percent spent the next largest amount(i.e., $200,000 to less than $1 million), 25.6 percentspent between $50,000 and $200,000, and 7.4 percentspent $1 to $50,000. There were no instances o a utilityenterprise not spending anything on product innovation.In contrast, approximately 20.7 percent o innovativeenterprises in transportation and warehousing indus-tries did not spend anything on product innovation.Manuacturing ollowed by proessional, scientic and
technical services have a high incidence o spendinglarge amounts on product innovation.
Figure 12 shows a high incidence o high expenditurelevels (i.e., $500,000 or more) on process innovationwas ound in utilities (54.3 percent o innovative enter-prises), ollowed by nance and insurance (44.6 per-cent o innovative enterprises), and mining, quarryingand oil and gas extraction (at 24.8 percent o innova-tive enterprises).
and revenue o $250,000 or more. Industry-by-industrycomparisons o the results rom SIBS with the U.S.should be adjusted to account or the dierent sizecut-o used in the U.S. Business R&D and Innovation
Survey . As innovation is dependent on the size o rm,all other things being equal, Canadian results or the
propensity to innovate would be expected to be higherthan those o the U.S. Questionnaires integrating ea-tures rom other countries’ business surveys were sentto the Chie Executive Ocers or senior managers oenterprises. The survey response rate was 70 percent.SIBS data provide insights into long-term strategicobjectives o Canadian-based enterprises when theyinvest in innovation, their business innovation strategy,as well as business innovation activities and outcomes.
The survey tracks our types o innovation at the rmlevel, as identied in the Oslo Manual , or measuring
innovation: product innovation, process innovation,marketing innovation and organizational innovation.
Product Innovation involves a good or service that isnew or signicantly improved. This includes signicantimprovements in technical specications, componentsand materials, incorporated sotware, user-riendlinessor other unctional characteristics.
Process Innovation involves a new or signicantlyimproved production or delivery method. Thisincludes signicant changes in techniques,equipment and/or sotware.
Marketing Innovation involves a new marketingmethod with signicant changes in product design orpackaging, product placement, product promotionor pricing.
Organizational Innovation involves introducing anew organizational method in the rm’s business prac-tices, workplace organization or external relations.
These innovations can be new to the rm, new to themarket/sector or new to the world.
SIBS data revealed that the large majority o Canadian-based enterprises relies on existing products, processes,marketing and organizational practices. Only 19 per-cent o enterprises in all surveyed industries stated thattheir strategic ocus was to regularly introduce newor signicantly improved goods or services, and only34 percent o rms’ long-term strategic ocuswas to introduce new or signicantly improvedbusiness activities or processes to their operations.

8/6/2019 State of the Nation 2010: Imagination to Innovation, Building Canadian Paths to Prosperity
http://slidepdf.com/reader/full/state-of-the-nation-2010-imagination-to-innovation-building-canadian-paths 35/86
Source: Survey of Innovation and Business Strategy, 2009.
Figure 11 Total Expenditures on Good or Service Innovations, 2009
Source: Survey of Innovation and Business Strategy, 2009.
Figure 12 Total Expenditures on Process Innovations, 2009

8/6/2019 State of the Nation 2010: Imagination to Innovation, Building Canadian Paths to Prosperity
http://slidepdf.com/reader/full/state-of-the-nation-2010-imagination-to-innovation-building-canadian-paths 36/86
State of the nation 2010
26
A Focus on Service Industries
Services encompass a wide range o industries oten serving other parts o the economy. In2008, services accounted or 61.5 percent o private sector GDP and 72.6 percent o privatesector employment in the Canadian economy. The top three service industries by employ-
ment are retail trade; fnance, insurance, real estate and rental and leasing; and accommo-dation and ood services.
Many o Canada’s largest corporations in 2009, as identifed in the Financial Post listo top 500 Canadian companies, were either service frms or manuacturing frms withlarge service activities. O the 30 largest frms in Canada, by 2008 revenue size, 16 hadsubstantial service activities, such as: Royal Bank o Canada, Power Corporation o Canada,Manulie Financial, George Weston, Scotiabank, Toronto-Dominion Bank, Bank o Montreal,Bell Canada Enterprises, Walmart Canada, Alimentation Couche-Tard, Sun Lie Financial,Empire Company, Brookfeld Asset Management, Canadian Imperial Bank o Commerce,Thomson Reuters, and Research In Motion.
Branham Group’s 2010 list o top 250 Canadian technology companies was also heavily
occupied by frms with sizeable service activities.
Examples of Service Enterprises
Thomson Reuters uses innovative technology to deliver inormation to decision makersin the fnancial, legal, tax and accounting, scientifc, health-care and media markets. In 2008,the company received an R&D 100 Award rom R&D Magazine or its intellectual propertyresearch and analysis platorm.25 The company has also earned six Technology InnovationAwards rom The CPA Technology Advisor , including a 2010 award or its stamanagement tool.26
CGI Group oers IT management and business process services in areas such as systemsintegration and consulting, application management and technology management. CGIGroup is one o the most R&D-intensive ICT companies in Canada, spending $76 million in2009.27 The company has collaborated with Bell Canada to create a centre or innovationand technology excellence,28 and it has been recognized or important innovation ine-procurement29 and electronic health inormation management.30
25 R&D Magazine, “Thomson Reuters: IP at your ngertips,” R&D 100 Awards, 2008. (http://www.rdmag.com/Awards/RD-100-Awards/2008/09/IP-At-Your-Fingertips/)
26 CPA Technology Advisor, Honoring Innovation: Maximizing Workfow Eciency is Latest Quest , 2008.(http://www.cpatechnologyadvisor.com/print/The-CPA-Technology-Advisor/Honoring-Innovation/1$2030)
27 RE$EARCH Inosource, Canada’s Top 100 Corporate R&D Spenders 2010. (http://www.researchinosource.com/2010Top100List.pd)
28 CGI, CGI and Bell use close cooperation to create an innovative center and accelerate the development o leading-edge solutions,Case Studies. (http://www.cgi.com/en/case-study/electronic-customer-service-oracle-bell)
29 Virginia Commonwealth University, “Innovation in Government Award,” L. Douglas Wilder School o Government and Public Aairs, 2007. (http://wrc2003-test.vcu.edu/gov/newsandevents/deault.asp?ID=169)
30 Canadian Healthcare Technology, “St. Michael’s to integrate paper records with HER,” News, 2007.
(http://www.canhealth.com/News609.html)

8/6/2019 State of the Nation 2010: Imagination to Innovation, Building Canadian Paths to Prosperity
http://slidepdf.com/reader/full/state-of-the-nation-2010-imagination-to-innovation-building-canadian-paths 37/86
selection o countries in 1998, 2003 and 2008. Mostcountries show an increase in BERD intensity over theseyears, while the intensity in Canada has declined. Thisis not just the result o aster GDP growth in Canada,but also declining aggregate business perormance oR&D (Figure 14).
6.1.4 Innovation throughResearch and Development
Source: Statistics Canada, CANSIM Table 358-0001, January 2011.
Figure 14 BERD in Canada, 1991 to 2010
Source: OECD, Main Science and Technology Indicators, 2010.
Figure 13 BERD Intensity by Country, 1998, 2003 and 2008 (as a Percentage o GDP)
6.1.4.1 Business Perormance o R&D
Business expenditure on R&D (BERD) intensity isthe ratio o business R&D to a measure o output.
Figure 13 compares the ratio o BERD to GDP or a

8/6/2019 State of the Nation 2010: Imagination to Innovation, Building Canadian Paths to Prosperity
http://slidepdf.com/reader/full/state-of-the-nation-2010-imagination-to-innovation-building-canadian-paths 38/86
State of the nation 2010
28
Econometric estimates o the link between R&D andproductivity vary widely. Firm-level studies generallysuggest a rather robust link between R&D and pro-ductivity while more aggregated industry-level datasometimes show a weaker link. Broadly speaking, how-ever, the economic literature suggests a positive link
between R&D and productivity, making R&D perormedby Canadian industry an indicator o business sectorinnovation worth noting.32
6.1.4.2 Canada’s Industry Structure and BusinessPerormance o R&D
Some argue that Canada’s overall low businessexpenditure on R&D is a refection o Canada’s indus-try structure. Does Canada’s industry structure explainhistorically low business expenditure on R&D (BERD)in comparison to leading innovating countries?
Overall low business R&D can in part be explainedby the relative size in Canada o industries thatglobally tend to invest less in R&D. For example,Canada has a relatively large energy extraction sector.Investments in product and process innovation in this
From 2006 to 2009, unding or R&D rom ederal andprovincial governments, higher education, private non-prot groups and oreign sources increased. While notosetting the decline in business perormance o R&D,the private sector also directed more resources to highereducation to perorm R&D.
Business sector value-added, which is composed mainlyo prots and wages, is essentially the business contri-bution to GDP. The metric o business expenditureon R&D (BERD) as a share o business value-addedis a measure o how much o a business’ resources isdedicated to R&D. By international standards, Canada’sbusiness R&D expenditures’ share o business sec-tor value-added was quite low in 2008 (Figure 15).The top 25 companies in Canada accounted or anestimated 33 percent o total intramural businessR&D perormed in 2009. This share has been airly
stable in recent years, but is down considerably romnearly 50 percent in the late 1980s. The share o thetop 100 companies has similarly decreased, romnearly 70 percent o the total in the late 1980s to anestimated 53 percent in 2009. While R&D perorm-ance is still heavily concentrated in a ew score oleading R&D perormers, business R&D is becomingmore distributed.31
31 Statistics Canada, Industrial Research and Development: Intentions 2009, Catalogue no. 88-202-X, 2010.
32 Congressional Budget Oce, R&D and Productivity Growth: A Background Paper , The Congress o the United States, June 2005, p.1, p. 32.
*Value-added by industry is based on gross value-added net o ‘real estate activities,’ ‘fnancial intermediation servicesindirectly measured’ and the public sector; i.e., it is a measure o private sector productive value-added.
Source: OECD, Main Science and Technology Indicators, 2010.
Figure 15 BERD Share o Value-Added in Industry,* 2008

8/6/2019 State of the Nation 2010: Imagination to Innovation, Building Canadian Paths to Prosperity
http://slidepdf.com/reader/full/state-of-the-nation-2010-imagination-to-innovation-building-canadian-paths 39/86
the OECD Structural Analysis (STAN) database, illustratesthe industry sector composition o the Canadian econ-omy and the economies o the United States, Sweden,Germany, Finland and Australia.
sector have historically involved more capital expenditurethan R&D and are not always separately accounted oras R&D. Canada also has a relatively small ICT manuac-turing sector in comparison to high R&D nations suchas Sweden, Finland and Germany. Figure 16, based on
Figure 16 Composition/Comparison o Canadian, U.S., Swedish, German,Finnish and Australian Economies (Share o GDP), 2005
Source: OECD STAN Database or Structural Analysis, November 2010.

8/6/2019 State of the Nation 2010: Imagination to Innovation, Building Canadian Paths to Prosperity
http://slidepdf.com/reader/full/state-of-the-nation-2010-imagination-to-innovation-building-canadian-paths 40/86
State of the nation 2010
30
Low business R&D can in part beexplained by the relative size inCanada o industries that globally tend to invest less in R&D.
6.1.4.3 Changes in Research andDevelopment Perormed byIndustries in Canada
In 2007, R&D in Canada was perormed primarily bythe ollowing industries, as shown in Figure 17: ICTmanuacturing (18 percent); R&D services (8 percent);computer services (8 percent); pharmaceutical manu-acturing (7 percent); aerospace products and partsmanuacturing (6 percent); sotware (5 percent); tele-communication services (4 percent); motor vehicle andparts (3 percent); oil and gas extraction (3 percent)
and nance and insurance (2 percent). The remaining36 percent was spread over other industries.
There has been signicant change in industries per-orming R&D in Canada. Declining ICT manuactur-ing R&D has been in part oset by growing R&D incomputer services, sotware and telecom services. Atthe same time, the R&D service industry (comprisingrms whose primary activity in Canada is undertakingresearch activities) continues to grow in importancein the Canadian R&D landscape. R&D expenditureshave also increased notably or Canada’s banking
and nancial sector and or the oil and gas industries.
6.1.4.4 International Comparison o Researchand Development Intensity by Industry Sector
Benchmarking R&D expenditures by industry onan international basis poses challenges. Comparableinternational data are less current and there are di-erences in the way statistics are collected. Canadaassigns R&D gures according to the main busi-
ness activity o the company being surveyed. Othercountries assign R&D gures according to the type
o research being conducted ( product eld ). Producteld countries include Finland, Sweden, France andthe U.K. This dierence in methodology has theeect o some similar R&D activities being assignedto dierent industries in dierent countries. Forexample, a rm that designed radio broadcast anten-nas but outsourced all manuacturing to a rm inanother country would be classied as a telecom-munications equipment rm according to the producteld data collection method, but would be classi-ed as an R&D services rm according to the main
Figure 17 Business Expenditureon R&D Contributionby Industry, 2000and 2007
Sources: Statistics Canada tabulations or STIC;Statistics Canada, CANSIM Table 358-0024.
Note: STIC analysis is based on disaggregated data at thethree- and our-digit NAICS level as o July 2010. Data re-
visions or a number o years were released on December 8,2010, and are not reected in the analysis presented.

8/6/2019 State of the Nation 2010: Imagination to Innovation, Building Canadian Paths to Prosperity
http://slidepdf.com/reader/full/state-of-the-nation-2010-imagination-to-innovation-building-canadian-paths 41/86
industries that employ large numbers o people, such asconstruction and ood product manuacturing. Canada’sR&D intensity is also lower in some industries thatglobally tend to have high R&D ratios, such as motorvehicle manuacturing and chemical manuacturing.
Business R&D as a share o value-added was higher inCanada versus comparators in industries such as ICTmanuacturing; wholesale and retail; 33 transportation,
activity. This dierence in methodologies should betaken into consideration or international comparisonso private sector R&D activities.
Figure 18 shows Canada’s business R&D intensity ascompared to the average business R&D intensity o a
selected group o OECD countries as well as the aver-age o the top ve BERD-intensive counterparts byindustry. By international standards, Canada tends tohave a lower business R&D investment as a share ovalue-added in a number o industries. These include
At the same time, growers must maintain high yield, adiverse product range and superior quality. Innovationin this industry can come rom research into geneticimprovement, disease resistance and nutritional andtherapeutic benets, as well as management and agro-nomic practices or quality control and sustainability.
Representing over 18,000 pulse crop producers inSaskatchewan, the Saskatchewan Pulse Growers’expenditures in R&D as a percentage o the total otheir investments have increased to 60 percent in the2009–10 scal year. These investments in innovationhave ensured the competitiveness o Saskatchewan pro-ducers and protability o the pulse industry as a whole.
The biggest successes have been the Pulse BreedingProgram and the Variety Release Program, resulting romcollaboration between Saskatchewan Pulse Growersand the Crop Development Centre at the Universityo Saskatchewan. Under these programs, theSaskatchewan Pulse Growers provide access to newpulse varieties developed by the Crop DevelopmentCentre by oering breeder seed without royalties toselect-status seed growers in Saskatchewan and Alberta.In exchange or a nancial commitment to researchin Saskatchewan, the Saskatchewan Pulse Growersreceived the distribution rights to all pulse varietiesdeveloped by the Crop Development Centre. As aresult, pulse producers in Saskatchewan andAlberta have a quick and steady supply onew, improved pulse crop varieties.
A producer examining a pea crop.
33 U.S. ANBERD gures show a rapid decline in U.S. BERD in wholesale/retail in the mid- to late 2000s, when there was a reclassi-
cation o much o the R&D ormerly classied as ‘wholesale’ into the pharmaceutical and ICT sectors in the United States.
[OECD (2009), Research and Development Expenditure in Industry: ANBERD 1990–2007.] Similar reclassication has not been
done in Canada, but recent data rom Statistics Canada suggest that this may similarly aect Canada’s wholesaling R&D intensity
(Statistics Canada, Science Statistics: Industrial Research and Development 2005–2009, Catalogue no. 88-001, July 2009, p.12).
In other words, much o the ‘wholesaling’ R&D gure is likely attributable to rms rom highly R&D-intensive industries (such as
pharmaceutical or ICT) whose principal activity in Canada happens to be wholesaling.
Peas, lentils and beans — pulse crops — are stapleoods in ast growing emerging markets, and are alsobeing used in non-ood products such as uel, lubri-cants and pharmaceuticals. These crops fourish best inthe dry, ertile soil o the Canadian prairies. Canada isnow one o the world’s leading producers and export-ers o peas and lentils.
Rapid expansion o pulse crop acreage in Canadacombined with more intense rotations requires thatthe crops have broad adaptation to various conditions.Expansion increases the risk o lea and soil diseases,
which threaten the sustainability o crop production.
Industry-led Innovation:Saskatchewan Pulse Growers

8/6/2019 State of the Nation 2010: Imagination to Innovation, Building Canadian Paths to Prosperity
http://slidepdf.com/reader/full/state-of-the-nation-2010-imagination-to-innovation-building-canadian-paths 42/86

8/6/2019 State of the Nation 2010: Imagination to Innovation, Building Canadian Paths to Prosperity
http://slidepdf.com/reader/full/state-of-the-nation-2010-imagination-to-innovation-building-canadian-paths 43/86
For the Canadian economy as awhole, a little more than one quarter (27 percent) o business R&D was
perormed by rms with less than$50 million in revenues, with around
9 percent o total expendituresundertaken by rms reportingless than $1 million in revenues.
Figure 19 shows the contribution to total R&D in agiven sector that was made by small (under $1 millionin revenues), medium ($1 million – $50 million in rev-enues) and large (over $50 million in revenues) rms.For example, around 75 percent o total business R&Din manuacturing was perormed by large rms, withsmall rms contributing less than 5 percent and the
remainder contributed by medium-sized rms.Sectors or which large rms ($50 million and morein revenues) were particularly important to total R&Dexpenditures included manuacturing, utilities, andthe nance and insurance sectors. In the retail trade,
construction, real estate and the proessional, scien-tic and technical services sectors, small and mediumenterprises (under $50 million in revenues) accountedor the majority o business R&D expenditures.
6.1.5 Innovation through Investmentsin Machinery and EquipmentInvestment in advanced technology is one channelthrough which knowledge is transerred betweenrms; that is, it is a channel through which technologyand practices diuse. This process, sometimes called‘embodied innovation,’ contributes to productiv-ity gains, especially in the case o the adoption oinormation and communications technologies (ICT).Adoption o new technologies in supply chains and inproduction also gives rise to process innovation.
The relationship between ICT and productivity hasbeen widely studied. Findings suggest that the eecto ICT adoption on productivity has varied betweencountries and industries.34 While investments in ICToten result in productivity and competitiveness gainsor adopters, adoption o ICT itsel requently requires
* Average 2004–2007Source: Statistics Canada tabulations or STIC, November 2010.
Figure 19 Distribution o Business Perormance o R&D by Revenue Size o Firm
34 OECD (2004), D. Pilat., The ICT Productivity Paradox , OECD Economic Studies, No. 38.

8/6/2019 State of the Nation 2010: Imagination to Innovation, Building Canadian Paths to Prosperity
http://slidepdf.com/reader/full/state-of-the-nation-2010-imagination-to-innovation-building-canadian-paths 44/86
State of the nation 2010
34
telecommunications industries, which include the tele-communications service industries and which generallyhave a airly high level o ICT investment, are also moreICT-capital intensive than average, as are Canada’s util-ity and certain sales industries.
The Survey o Innovation and Business Strategy indi-cates that 83 percent o enterprises that adoptedadvanced technology purchased o-the-shel advan-ced technology, 10 percent leased o-the-sheladvanced technology, and 13 percent licensed advancedtechnology. Many o these enterprises also customized,signicantly improved, or developed their own (or inconjunction with others) advanced technologies.
organizational change and demands a workorcewith the skills to make use o the new technologies.35 Furthermore, as well as being a catalyst o innova-tion, ICT adoption may have the strongest productivitybenets or rms that are innovative to begin with.36
Canadian industry seems to invest less in ICT equip-ment per worker than other countries. Figure 20 showsthat there are some areas o higher relative CanadianICT investment. Canada’s wood products manuactur-ing industry, or example, seems to be more highlyICT-intensive than in many other countries, refect-ing a airly pronounced rise in ICT investments rom2000–04 (the time o the gure). Canada’s post and
Figure 20 ICT Capital Intensity (Investment per Worker, 2004)
*Available countries: Australia, Austria, Canada, Denmark, Finland,Germany, Italy, Japan, Korea, Netherlands, Sweden, U.K., U.S.
Source: KLEMS database.
35 M. Draca, R. Sadun and J. Van Reenend, Productivity and ICT: A Review o the Evidence, Centre or Economic Perormance Discus-sion Paper no. 749, London School o Economics and Political Science , August 2006; OECD (2004), D. Pilat., The ICT Productivity Paradox , OECD Economic Studies, No. 38, p. 50.
36 OECD (2004), D. Pilat., The ICT Productivity Paradox , OECD Economic Studies, No. 38, p. 53.

8/6/2019 State of the Nation 2010: Imagination to Innovation, Building Canadian Paths to Prosperity
http://slidepdf.com/reader/full/state-of-the-nation-2010-imagination-to-innovation-building-canadian-paths 45/86
Canadian industry seems to invest lessin ICT equipment per worker thanother countries.
The data presented in Figure 21 show industry adop-tion rates o ‘advanced technology,’ dened here asinormation technologies (IT), communications equip-ment and measuring and control instrumentation. Therst two components, IT (computers and sotware) andcommunications equipment, comprise what is gener-ally reerred to as ICT capital.37
There are inherent dierences in the rates o adop-tion o advanced technology between industries; someindustries require greater baseline investments in tech-nology to compete. Within the Canadian data, pro-nounced dierences can be seen between industriesin terms o the shares o machinery and equipment
capital stock that are composed o advanced tech-nology assets. The types o advanced technology
adopted also vary considerably by industry(Figure 22). For example, Statistics Canada’s recentSurvey o Advanced Technology ound that over53 percent o semiconductor and electronic compon-ents manuacturing business units reported adoptingsome orm o inspection and verication technology,compared to only 23 percent o manuacturing busi-ness units overall.
While IT tends to be the most important component oadvanced technology adopted by industry, other ormso advanced technology investment are important tospecic sectors. For example, while IT is over 90 per-cent o advanced technology capital stock in somenancial sector industries, it is less than 40 percento the total advanced technology capital stock in theR&D services industry. Research that has looked atthe impact o IT equipment, sotware and communica-
tions equipment adoption on productivity has oundthat all three can play an important role in improving
Figure 21 Share o Advanced Technology Capital Stock in Total M&E CapitalStock, Average 2004–2008
Source: Statistics Canada tabulations or STIC.
37 While data on instruments are not included in the international comparison o ICT adoption rates in Figure 20, instruments areincluded in the denition o ‘advanced technology’ capital used or the Canadian inter-industry comparison. Modern monitoringand control instruments oten embody signicant advanced technology; indeed, the instruments manuacturing industry is includedin the denition o the ICT manuacturing sector. Ultimately, monitoring and control involve the collection, transmission, and use oinormation. Data on investments in instruments were available or Canada. I data on instruments, as well as other ICT investments,
were available or other countries, these data would have been used to make international comparisons.

8/6/2019 State of the Nation 2010: Imagination to Innovation, Building Canadian Paths to Prosperity
http://slidepdf.com/reader/full/state-of-the-nation-2010-imagination-to-innovation-building-canadian-paths 46/86
Veran has over 90 employees and is one o NorthAmerica’s leading providers o compliance, anti-moneylaundering and raud detection sotware with morethan 650 customers. Veran was able to transer ICTexpertise and technology rom a context o engineer-ing or harsh environments to the nancial industry.
Veran Inc. o St. John’s, Newoundland, was oundedin 2003 by a team o electrical engineers with back-grounds in articial intelligence and pattern recog-nition. Its sotware solution helps banks and creditunions identiy raud, money laundering and othersuspicious activity on its computer networks. Today,
A Step Ahead in Technology — A Step Ahead o Financial Crime
Verafn Inc.
State of the nation 2010
36
38 It should be noted that this report analyzed the impact o IT and communications equipment adoption on productivity but did notspecically look at adoption o instrumentation, which is included in this State o the Nation report as a component o ‘advancedtechnology capital.’ A. Sharpe, The Relationship between ICT Investment and Productivity in the Canadian Economy: A Review o
the Evidence, Centre or the Study o Living Standards, 2006.
productivity.38 Recent Canadian policy measures to pro-mote the adoption o advanced technology and spurproductivity growth have generally ocused on IT (i.e.,
computers and sotware) and not other components oadvanced technology capital noted here such as com-munications equipment and instrumentation.
6.1.6 Innovation and theRise o Service Industries
In 2008, service industries accounted or 61.5 percent oreal private sector GDP and 72.6 percent o private sectoremployment in the Canadian economy. The rise o serviceindustries is a long-term trend, which is experienced
Figure 22 Advanced Technology Capital Stock by Asset Type (Average 2004–08)
Source: Statistics Canada tabulations or STIC.
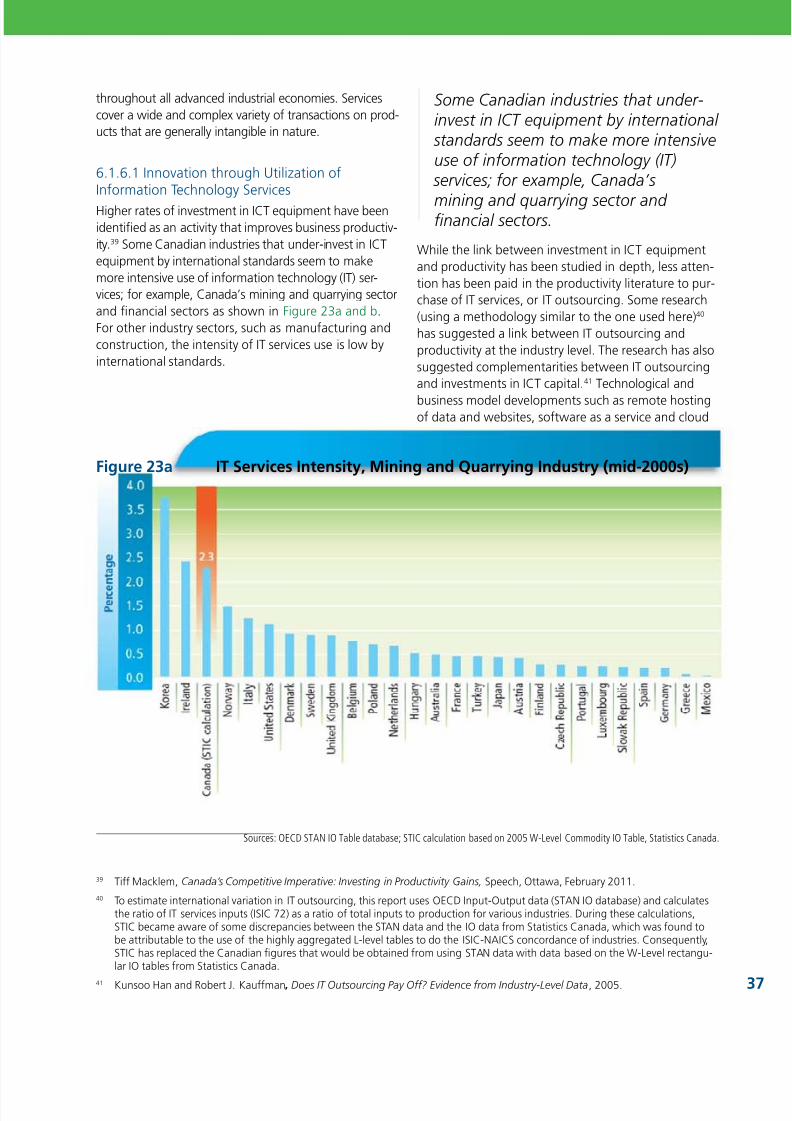
8/6/2019 State of the Nation 2010: Imagination to Innovation, Building Canadian Paths to Prosperity
http://slidepdf.com/reader/full/state-of-the-nation-2010-imagination-to-innovation-building-canadian-paths 47/86
Some Canadian industries that under-invest in ICT equipment by international
standards seem to make more intensiveuse o inormation technology (IT)
services; or example, Canada’s
mining and quarrying sector and nancial sectors.
While the link between investment in ICT equipmentand productivity has been studied in depth, less atten-tion has been paid in the productivity literature to pur-chase o IT services, or IT outsourcing. Some research(using a methodology similar to the one used here)40 has suggested a link between IT outsourcing andproductivity at the industry level. The research has alsosuggested complementarities between IT outsourcingand investments in ICT capital.41 Technological andbusiness model developments such as remote hostingo data and websites, sotware as a service and cloud
throughout all advanced industrial economies. Servicescover a wide and complex variety o transactions on prod-ucts that are generally intangible in nature.
6.1.6.1 Innovation through Utilization o
Inormation Technology ServicesHigher rates o investment in ICT equipment have beenidentied as an activity that improves business productiv-ity.39 Some Canadian industries that under-invest in ICTequipment by international standards seem to makemore intensive use o inormation technology (IT) ser-vices; or example, Canada’s mining and quarrying sectorand nancial sectors as shown in Figure 23a and b.For other industry sectors, such as manuacturing andconstruction, the intensity o IT services use is low byinternational standards.
39 Ti Macklem, Canada’s Competitive Imperative: Investing in Productivity Gains, Speech, Ottawa, February 2011.
40 To estimate international variation in IT outsourcing, this report uses OECD Input-Output data (STAN IO database) and calculatesthe ratio o IT services inputs (ISIC 72) as a ratio o total inputs to production or various industries. During these calculations,STIC became aware o some discrepancies between the STAN data and the IO data rom Statistics Canada, which was ound tobe attributable to the use o the highly aggregated L-level tables to do the ISIC-NAICS concordance o industries. Consequently,STIC has replaced the Canadian gures that would be obtained rom using STAN data with data based on the W-Level rectangu-lar IO tables rom Statistics Canada.
41 Kunsoo Han and Robert J. Kauman, Does IT Outsourcing Pay O? Evidence rom Industry-Level Data, 2005.
Figure 23a IT Services Intensity, Mining and Quarrying Industry (mid-2000s)
Sources: OECD STAN IO Table database; STIC calculation based on 2005 W-Level Commodity IO Table, Statistics Canada.

8/6/2019 State of the Nation 2010: Imagination to Innovation, Building Canadian Paths to Prosperity
http://slidepdf.com/reader/full/state-of-the-nation-2010-imagination-to-innovation-building-canadian-paths 48/86
State of the nation 2010
38
Figure 23b IT Services Intensity, Finance and Insurance (mid-2000s)
Sources: OECD STAN IO Table database; STIC calculation based on 2005 W-Level Commodity IO Table, Statistics Canada.
computing may contribute to an increasingly blurry linebetween what constitutes a purchased IT service andwhat constitutes an investment in capital. Research onproductivity and the interplay between IT services out-
sourcing and ICT capital investments, such as whetheror not these are complements or substitutes or eachother, could urther our understanding o this area.
6.1.6.2 Technology Intensive Trade Flows(services and goods)
With the rise o service industries, one would expect agrowing trade in commercial services between coun-tries. International transactions in commercial servicesare compiled as exports (or receipts, i.e., revenuederived rom services sold abroad) and imports (or
payments, i.e., expenses or services received romabroad), and include the ollowing types o services:
• communications services;
• construction services;
• insurance services;
• other nancial services;
• computer and inormation services;
• royalties and licence ees;
• management services;
• research and development services;
• architectural, engineering and othertechnical services;
•
other miscellaneous services to business; and • audiovisual services.
Other broad categories o services transaction, in addi-tion to commercial services, are travel, transportationand government services.
In order to gauge the most technology intensiveaspects o commercial services trade, Figure 24 com-bines transactions or the computer and inorma-tion services; royalties and licence ees; research anddevelopment services; and architectural, engineeringand other technical services rom 1990 to the third
quarter o 2010. While many other aspects o servicestrade may involve research and development activ-ities, these our categories42 were chosen because theyrefect explicit payments or receipts or technologytransers and the cross-border trade in research anddevelopment intensive activities.

8/6/2019 State of the Nation 2010: Imagination to Innovation, Building Canadian Paths to Prosperity
http://slidepdf.com/reader/full/state-of-the-nation-2010-imagination-to-innovation-building-canadian-paths 49/86
Engineering the Spine
The École Polytechnique engineers and the research-ers o Sainte-Justine University Hospital are workingtogether to develop next-generation technologies orthe treatment o spinal pathologies. Dierent simula-tors make it possible to design and optimize spinalbraces and surgical instrumentation that are personal-
ized and optimized. An integrated “operating room othe uture” combining imaging applications, navigation
Dr. Carl-Éric Aubin and his teams o engineers and researchers are designing the next-generationtechnologies or advanced treatment o young patients with scoliosis.
R&D Sub-Priority: Biomedical Engineering and Medical Technologies
42 Computer and Inormation Services: According to Statistics Canada, computer services cover the design, engineering and man-agement o computer systems (exclusive o the value o hardware). Also covered are the development and production o originalsotware (including operating sotware). Computer processing services as well as equipment maintenance and repair are coveredhere. This category also includes consulting and training related to the provision o computer services. Inormation services coveronline inormation retrieval services, including database services (the development o subject matter through to storage anddissemination) and computer-assisted document searches and retrievals and news agency services (such as syndicated reportingservices to the media).
Royalties and Licence Fees: This is dened as the use o intellectual property rights, or the ollowing sub-categories:
•
Patents and industrial design: royalty or licence ees or the use o patents, industrial designs, industrial know-how or manuac-turing rights, as well as payments or non-patented industrial processes.
• Trademarks: royalties or ees or the use o trademarks, that is, words, symbols, designs or combinations thereo that distin-guish the holder’s products or services rom those o another provider.
• Franchises: contractual privileges granted by an individual or corporation to another, permitting the sale o a product or servicein a specied area or manner.
• Copyrights and related rights: royalty or licence ees or the use o original artistic, literary, dramatic or musical works; orexample, to stage productions or perormances, or to make recordings or lms.
• Sotware: royalties or sotware and other computer-related items, including ees or the right to replicate, distribute or other-wise use sotware, whether custom or pre-packaged.
Research and Development Services: This includes charges related to systematic investigation through experiment or analysis toachieve a scientic or commercial advance or, or through, the creation o new or signicantly improved products or processes.Research and development extends to the social sciences and humanities but excludes market research and technical studies.
Architectural, Engineering and Other Technical Services: This includes a range o architectural and engineering activities together with
a diverse group o scientic and technical services and specic services related to mineral extraction, processing and the environment.
technologies and a surgical simulator will assist thesurgeons during the operation. A trans-disciplinaryteam o engineers, orthopaedists and biologists aredeveloping usionless implants that are minimally inva-sive and intelligent or the advanced treatmento young patients with scoliosis.

8/6/2019 State of the Nation 2010: Imagination to Innovation, Building Canadian Paths to Prosperity
http://slidepdf.com/reader/full/state-of-the-nation-2010-imagination-to-innovation-building-canadian-paths 50/86

8/6/2019 State of the Nation 2010: Imagination to Innovation, Building Canadian Paths to Prosperity
http://slidepdf.com/reader/full/state-of-the-nation-2010-imagination-to-innovation-building-canadian-paths 51/86
received by innovative44 SMEs compared to 8.7 per-cent or non-innovative SMEs.45 Ninety percent o thetotal equity nancing received by innovative SMEs wasprovided by angel investors and VC rms compared toonly 42.3 percent or non-innovative SMEs.46
The Impact o the Economic Downturn
The economic downturn has been the principal storyin the VC industry since the State o the Nation 2008 report. Data rom 2008 and 2009 show a dramaticdecline in absolute nancing along with declines in thenumber o rms nanced and the amount o invest-ment per company. Total venture capital investment in2009 was the lowest since 1996, alling to $1.035billion, or about hal o the value reached in 2007.47 Compared to other countries in the OECD, Canadaranked seventh in 2008 (the most recent ranking
available) in terms o absolute VC investment.48
Thelargest amount o VC investment occurred in the U.S.,which accounted or almost hal o the OECD total.49 That said, VC investment in the U.S. has experienced adecline similar to that suered by Canada (Figure 25).In European countries, the investment volume alsodramatically declined, alling between 20 percent and83 percent in 2009 compared to the ve-year aver-age.50 In terms o total deals and average deal size,Canada ranked second in the world in 2009 or thenumber o deals, behind only the U.S., yet ranked21st in average deal size.51
While global VC investment declined during the reces-sion, Canada’s VC industry was hit particularly hard.In 2008, Canada ranked 17th in the OECD in termso VC as a percentage o GDP.52 This was a declinerom 2003 and 2005 when Canada ranked in thetop 10.53 Canada’s share o VC to GDP also ell rom
its newest international measure or traded techno-logical intensive services. It captures both the abilityand desire o Canadian enterprises to export theirlocally produced technology intensive service activitiesabroad, but also Canadian enterprises’ desire to benetrom the technology intensive service activities prod-
uced abroad. Given the increasing role o services inadvanced economies, the growing complementaritiesbetween goods and services, and the increasing inter-nationalization o Canadian corporate strategy, it is aninnovation related measure well worth monitoring inthe uture.
In addition to technology intensive services trade,imports and exports o high-technology products alsowarrant monitoring in the uture. High-technologyproducts are identied as products, or groups o prod-ucts, that have a high R&D expenditure in relation to
their sales. Using high-technology product denitionsin combination with high-technology industry den-itions is benecial or many reasons. It allows countriesto determine the true proportion o high-technologyproducts in their economy and identiy whether suchhigh-technology products originate in high-, medium-or low-technology industries. It also allows benchmark-ing o these results with other countries, providing amore detailed analysis o trade and competitiveness.
6.1.7 Financing Innovation through
Venture CapitalVenture capital (VC) rms play an important role inthe nancing o innovation. New technology rmsdepend on VC to und R&D and und growth sincethey are oten perceived as too high-risk or traditionalinstitutional unding.43 A study released in 2009 basedon 2004 data shows that, in Canada, equity nan-cing accounted or 44.3 percent o the total nancing
43 OECD (2009), Science, Technology and Industry Scoreboard , p. 22.
44 Innovative rms are dened as those that spend more than 20 percent o their total investment expenditures on R&D.
45, 46 Shunji Wang, “Financing Innovative Small and Medium-Sized Enterprises in Canada Working Paper,” Industry Canada SME Financing Data Initiative, 2009, p. 24.
47 CVCA and Thomson Reuters, Canada’s Venture Capital Industry in 2009, 2010. (http://www.cvca.ca/fles/Downloads/Final_English_Q4_2009_VC_Data_Deck.pd )
48, 49 OECD (2009), Science, Technology and Industry Scoreboard 2009, p. 23, doi: http://dx.doi.org/10.1787/741702681416.
50 Deutsche Bank Research, Venture Capital Adds Economic Spice, 2010. (http://www.dbresearch.com/PROD/DBR_INTERNET_EN-PROD/PROD0000000000262487.PDF)
51 Thomson Financial, Canadian Venture Capital Overview, 2010. (http://www.canadavc.com/fles/public/UoT,%20Jan%202010.pd)
52 OECD (2010), Science, Technology and Industry Outlook 2010, p. 110, doi: http://dx.doi.org/10.1787/888932333044.
53 OECD (2007), Science, Technology and Industry Scoreboard 2007 , p. 39, doi: http://dx.doi.org/10.1787/117030452887. Itshould be noted that there is inconsistency with the country denitions o VC and some countries have remarked that Canada
includes types o unding that are not to be considered “venture capital.”
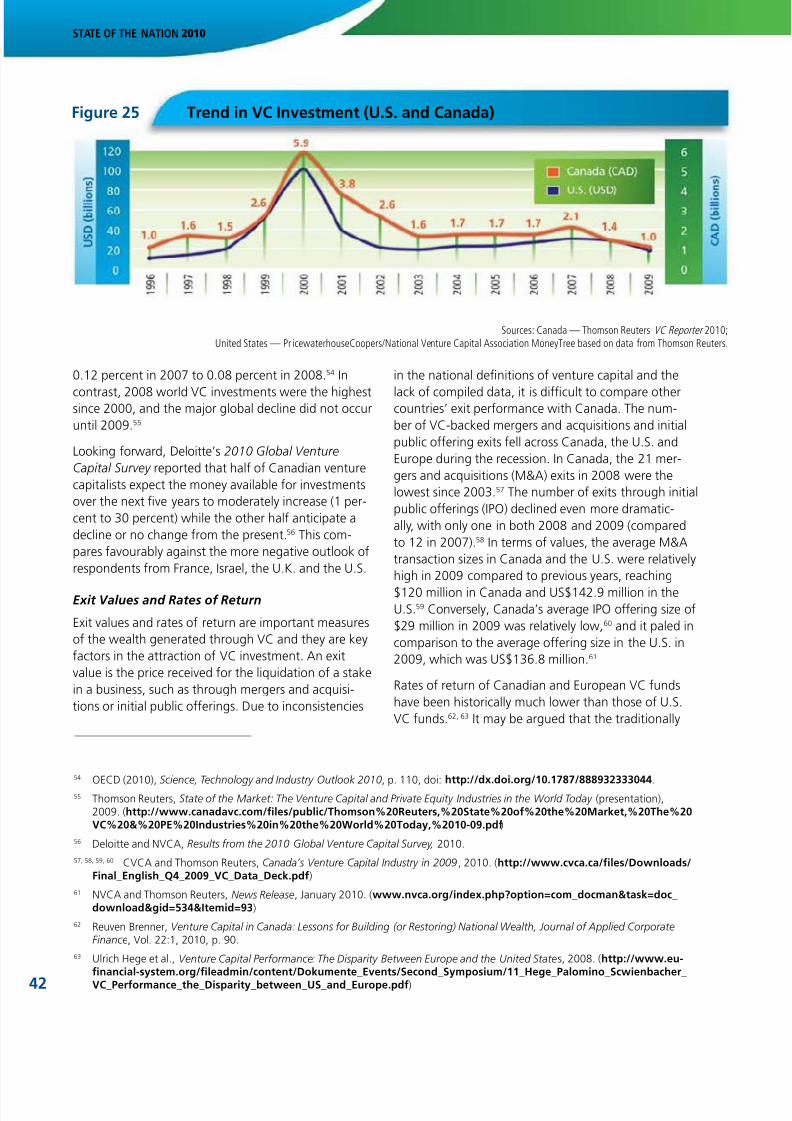
8/6/2019 State of the Nation 2010: Imagination to Innovation, Building Canadian Paths to Prosperity
http://slidepdf.com/reader/full/state-of-the-nation-2010-imagination-to-innovation-building-canadian-paths 52/86
State of the nation 2010
42
Sources: Canada — Thomson Reuters VC Reporter 2010;United States — Pr icewaterhouseCoopers/National Venture Capital Association MoneyTree based on data rom Thomson Reuters.
Figure 25 Trend in VC Investment (U.S. and Canada)
54
OECD (2010), Science, Technology and Industry Outlook 2010, p. 110, doi:http://dx.doi.org/10.1787/888932333044
.55 Thomson Reuters, State o the Market: The Venture Capital and Private Equity Industries in the World Today (presentation),2009. (http://www.canadavc.com/fles/public/Thomson%20Reuters,%20State%20o%20the%20Market,%20The%20VC%20&%20PE%20Industries%20in%20the%20World%20Today,%2010-09.pd)
56 Deloitte and NVCA, Results rom the 2010 Global Venture Capital Survey, 2010.
57, 58, 59, 60 CVCA and Thomson Reuters, Canada’s Venture Capital Industry in 2009, 2010. (http://www.cvca.ca/fles/Downloads/Final_English_Q4_2009_VC_Data_Deck.pd)
61 NVCA and Thomson Reuters, News Release, January 2010. (www.nvca.org/index.php?option=com_docman&task=doc_download&gid=534&Itemid=93)
62 Reuven Brenner, Venture Capital in Canada: Lessons or Building (or Restoring) National Wealth, Journal o Applied CorporateFinance, Vol. 22:1, 2010, p. 90.
63 Ulrich Hege et al., Venture Capital Perormance: The Disparity Between Europe and the United States, 2008. (http://www.eu-fnancial-system.org/fleadmin/content/Dokumente_Events/Second_Symposium/11_Hege_Palomino_Scwienbacher_
VC_Perormance_the_Disparity_between_US_and_Europe.pd )
in the national denitions o venture capital and the
lack o compiled data, it is dicult to compare othercountries’ exit perormance with Canada. The num-ber o VC-backed mergers and acquisitions and initialpublic oering exits ell across Canada, the U.S. andEurope during the recession. In Canada, the 21 mer-gers and acquisitions (M&A) exits in 2008 were thelowest since 2003.57 The number o exits through initialpublic oerings (IPO) declined even more dramatic-ally, with only one in both 2008 and 2009 (comparedto 12 in 2007).58 In terms o values, the average M&Atransaction sizes in Canada and the U.S. were relativelyhigh in 2009 compared to previous years, reaching
$120 million in Canada and US$142.9 million in theU.S.59 Conversely, Canada’s average IPO oering size o$29 million in 2009 was relatively low,60 and it paled incomparison to the average oering size in the U.S. in2009, which was US$136.8 million.61
Rates o return o Canadian and European VC undshave been historically much lower than those o U.S.VC unds.62, 63 It may be argued that the traditionally
0.12 percent in 2007 to 0.08 percent in 2008.54 In
contrast, 2008 world VC investments were the highestsince 2000, and the major global decline did not occuruntil 2009.55
Looking orward, Deloitte’s 2010 Global Venture
Capital Survey reported that hal o Canadian venturecapitalists expect the money available or investmentsover the next ve years to moderately increase (1 per-cent to 30 percent) while the other hal anticipate adecline or no change rom the present.56 This com-pares avourably against the more negative outlook orespondents rom France, Israel, the U.K. and the U.S.
Exit Values and Rates o Return
Exit values and rates o return are important measureso the wealth generated through VC and they are keyactors in the attraction o VC investment. An exitvalue is the price received or the liquidation o a stakein a business, such as through mergers and acquisi-tions or initial public oerings. Due to inconsistencies

8/6/2019 State of the Nation 2010: Imagination to Innovation, Building Canadian Paths to Prosperity
http://slidepdf.com/reader/full/state-of-the-nation-2010-imagination-to-innovation-building-canadian-paths 53/86

8/6/2019 State of the Nation 2010: Imagination to Innovation, Building Canadian Paths to Prosperity
http://slidepdf.com/reader/full/state-of-the-nation-2010-imagination-to-innovation-building-canadian-paths 54/86
State of the nation 2010
71 Joshua Aizenman and Jake Kendall, The Internationalization o Venture Capital and Private Equity , National Bureau o Economic Research, Working Paper 14344, September 2008, p. 3.
72 CVCA, Why Venture Capital is Essential to the Canadian Economy , 2009, p. 14. (http://www.cvca.ca/fles/Downloads/CVCA_Impact_Study_ENGLISH_March_2009.pd)
73 Thomson Reuters, VC Reporter , 2010.
74, 75 CVCA and Thomson Reuters, Canada’s Venture Capital Industry in 2009, 2010. (http://www.cvca.ca/fles/Downloads/Final_English_Q4_2009_VC_Data_Deck.pd )
76 CVCA, Thomson Reuters and Macdonald & Associates Limited, 2002–2010. (http://www.cvca.ca/resources/statistics/)77 PwC/NVCA MoneyTree based on data rom Thomson Reuters, 2010. (http://www.nvca.org/index.php?option=com_
docman&task=doc_download&gid=543)78 CVCA and Thomson Reuters, 2009 VC Investment Activity by Sector , 2010. (http://www.cvca.ca/fles/Downloads/2009_VC_
Investment_Activity_by_Sector.pd)79, 80 CVCA, Thomson Reuters and Macdonald & Associates Limited, 2002–2010. (http://www.cvca.ca/resources/statistics/)
81 CVCA and Thomson Reuters, Canada’s Venture Capital Market in 2010, 2011. (http://www.canadavc.com/fles/Q42010EnglishOverview.pd)
82 Thomson Financial, Canadian Venture Capital Overview , 2010. (http://www.canadavc.com/fles/public/UoT,%20Jan%202010.pd)
83 Deloitte and Touche, Global Trends in Venture Capital 2007 Survey , December 2007, p. 53. (http://www.deloitte.com/assets/Dcom-Global/Local%20Assets/Documents/dtt_tmt_globaltrendsVC_2007.pd )
84 One way this may be achieved is through Tandem Expansion, a large new private growth capital und with signicant investments romthe Business Development Bank o Canada (BDC), Export Development Canada (EDC) and Teralys Capital.
85 Calculations based on data rom the Industry Canada SME Financing Data Initiative (2009) and Thomson Reuters (2010).
Seizing Opportunities
While 2010 saw the rst year-over-year increase in invest-ment levels since 2007, investments remain weak andundraising is the lowest it has been in 16 years.81 Asa result, it is more imperative than ever to seize oppor-tunities. Although Canada borders the U.S. which hasthe largest VC industry in the world, it places 8th in theranking o countries invested in by American unds.82 Ina 2007 survey by Deloitte & Touche, 40 percent o U.S.investors identied Canada as having the least avourabletreatment o investors o any country they had dealingswith.83 The survey also noted the extremely low returnson Canadian VC investment. Dealing with regulatorybarriers, like the elimination o the reporting requirementsunder Section 116 o the Income Tax Act (as announcedin the ederal budget 2010), along with improving per-ormance o investments in Canada (such as through the
promotion o later-stage investment84
) may help Canada’sposition in this ranking improve.
6.1.7.1 Debt Financing o Small andMedium-Sized Enterprises
While venture capital plays an important role in thenancing o innovation, over 180,000 small andmedium-sized enterprises (SMEs) in Canada receivedormal debt nancing in 2007 (an average o roughly$0.26 million per company) compared to 404 rmsthat received VC in the same year (an average o
$5.1 million per company).85
About 13 percent o SMEsapplied or nancing rom a lending institution in 2007
Signifcant Foreign Component in Canada’s
VC Industry
The signicance o oreign unds is also a centraleature o the Canadian VC industry. Canada, alongwith China, Sweden, the U.K., France and India, is amajor net importer o VC.71 Foreign investment hasaccounted or at least 20 percent o total VC invest-ment in Canada since 1999.72 In 2009, oreign VCaccounted or about 30 percent o total VC invest-ment, yet only 16 percent o deals in Canada hadoreign participation.73 In 2009, the average deal sizewith oreign participation was $5.3 million comparedto the $2.3 million o all-domestic deals.74 On average,oreign investors invested three times that odomestic investors.75
Another consistent eature o the Canadian VC indus-try is the dominance o the IT sector that has received
on average almost 50 percent o total VC investmentduring the past decade.76 In 2009, 48 percent o allVC in Canada was invested in IT (compared to 45 per-cent in the U.S.77) while 21 percent was invested in liesciences and 10 percent was invested in energy andenvironmental technologies.78 The lie sciences industryin Canada was particularly aected by the recessionwith its share o total investment declining 30 percentin 2009 rom its level in 2007.79 The biggest gainsbelonged to the traditional sectors, primarily consumerand business services, which rose rom a 9 percentshare in 2007 to a 19 percent share in 2009.80
44

8/6/2019 State of the Nation 2010: Imagination to Innovation, Building Canadian Paths to Prosperity
http://slidepdf.com/reader/full/state-of-the-nation-2010-imagination-to-innovation-building-canadian-paths 55/86
6.2 Kwldg Dvlpmd trsr idcrs
6.2.1 Advancing the Frontiers oKnowledge through Science
and TechnologyThe development o knowledge is the root o a coun-try’s innovation ecosystem. The quality and quantityo knowledge that is generated is dicult to quantiy,more so as the Internet has allowed or ree and opencollaboration at unprecedented levels. This report usesbibliometric indicators and university rankings to exam-ine Canada’s perormance in knowledge developmentthrough research.
6.2.1.1 Measuring Outputs o Research through
Bibliometric IndicatorsBibliometric indicators are the most widely usedindicators in international comparative studies on theoutputs o research. They all into ve main categories:the number o publications, specialization in a particu-lar scientic discipline, the number o citations, relativeimpact and the level o international cooperation, asrevealed by the volume o co-publications.94
Number o publications — International datapublished by the Observatoire des sciences et des
techniques in Paris show that in 2008 Canada,
with a share o only 0.5 percent o global population,accounted or 3.3 percent o scientic publications inthe world. In absolute terms, this places us in 8th pos-ition ater the United States, China, Japan, Germany,the United Kingdom, France and Italy. It is worth not-ing that between 2003 and 2008 China increased its
with about $51 billion authorized.86 Chartered banksare the primary source o debt nancing and received68 percent o total nancing requests rom SMEs in2007.87 Along with traditional nancing methods,SMEs (especially start-ups) also tend to use inormalnancing sources such as personal savings (73 percent
o start-ups and 54 percent o all SMEs) and loansrom riends and amily (9 percent o all SMEs).88
The Business Development Bank o Canada (BDC) hasalso emerged as a major nancier o SMEs. During thescal year that ended on March 31, 2010, the valueo loans given out by the BDC, which totalled $4.4 bil-lion, was higher than in any other year in the Crowncorporation’s history.89
Nearly hal o SMEs that applied or loans did so toincrease their working capital.90 For the most part,SMEs did not use debt nancing or technology-relatedinvestments, such as computer equipment and sot-ware (11 percent) and R&D (5 percent).91 Clear excep-tions are knowledge-based industries (i.e., knowledgeproducers, such as science and technology-based rms,and high-knowledge users, such as business innov-ators and large scale knowledge-user rms) with anestimated 22 percent o debt nancing intended orR&D.92 Manuacturing was also above the averageat 10 percent.93
86 Statistics Canada, Survey on Financing o Small and Medium Enterprises 2007 , 2009.
87
Industry Canada SME Financing Data Initiative, Key Small Business Financing Statistics, 2009, p. 3. (http://www.sme-di.gc.ca/
eic/site/sme_di-pr_pme.ns/vwapj/KSBFS-PSFPE_Dec2009_eng.pd/$FILE/KSBFS-PSFPE_Dec2009_eng.pd )
88 Industry Canada SME Financing Data Initiative, Key Small Business Financing Statistics, 2009, p. 4. (http://www.sme-di.gc.ca/eic/site/sme_di-pr_pme.ns/vwapj/KSBFS-PSFPE_Dec2009_eng.pd/$FILE/KSBFS-PSFPE_Dec2009_eng.pd )
89 Business Development Bank o Canada, BDC increased nancing or entrepreneurs by 53% during nancial crisis, News Releases,August 19, 2010. (http://www.bdc.ca/en/about/mediaroom/news_releases/Pages/BDC_increased_fnancing_or_entrepreneurs_during_fnancial_crisis.aspx)
90 Industry Canada SME Financing Data Initiative, Key Small Business Financing Statistics, 2009, p. 13. (http://www.sme-di.gc.ca/eic/site/sme_di-pr_pme.ns/vwapj/KSBFS-PSFPE_Dec2009_eng.pd/$FILE/KSBFS-PSFPE_Dec2009_eng.pd )
91 Industry Canada SME Financing Data Initiative, Key Small Business Financing Statistics, 2009, p. 4. (http://www.sme-di.gc.ca/eic/site/sme_di-pr_pme.ns/vwapj/KSBFS-PSFPE_Dec2009_eng.pd/$FILE/KSBFS-PSFPE_Dec2009_eng.pd )
92, 93 Statistics Canada, Survey on Financing o Small and Medium Enterprises 2007 , 2009.
94 Observatoire des Sciences et des Techniques, Bibliometrics as a tool or the analysis o the scientic production o a country ,
2009, p. 2.

8/6/2019 State of the Nation 2010: Imagination to Innovation, Building Canadian Paths to Prosperity
http://slidepdf.com/reader/full/state-of-the-nation-2010-imagination-to-innovation-building-canadian-paths 56/86
State of the nation 2010
46
Citations — Metrics based on the number o publica-tions, however, only give part o the story. It is alsouseul to look at the number o times scientic papersare cited as sources.99 A calculation done in 2007 bythe Observatoire des sciences et des technologies de
l’Université du Québec à Montréal , using the Thomson
Reuters database, shows that, in terms o volume ocitations received by scientic papers over a two-yearperiod ollowing publication, Canada ranks 4th in theworld behind the United States, U.K. and Germany.100 Since, as we have seen, Canada ranks 8th in terms onumber o publications, this means that on averageCanadian scientic papers are cited more than theworld average.
Relative impact — According to the relative impactindex published by the Observatoire des sciences et des
techniques,101 in 2008, Canada’s relative impact index
over a two-year period was 1.09, which makes us —among the twenty countries that account individuallyor at least 1 percent o world publications — one oonly nine countries with a relative impact index greaterthan one, behind the United States (1.47), Switzerland(1.44), the Netherlands (1.33), Denmark (1.32), theU.K. (1.25), Germany (1.20), Sweden (1.17) andBelgium (1.10).102 Interestingly Canada, even thoughwe under-specialize in chemistry in terms o volumeo publications, has a specialized relative impact indexor this discipline that is higher than or any otherdiscipline (1.29). This may suggest that Canadian
publications in this eld are o a high quality, and thatCanada’s under-specialization in it should not necessarilybe interpreted as an area o scientic weakness.
International co-publication — Over the past tenyears, the science communities in a number o indus-trializing countries have begun to make an impact. Forinstance, China, South Korea, India and Turkey are nowmaking signicant contributions to the global total o
share o publications by 93 percent. China is now thesecond largest producer o publications in the worldbetween the United States and Japan.95
In 2006, 82.4 percent o Canadian scientic publica-tions came rom the higher education sector (up rom
77.6 percent in 1996). Researchers working in hospi-tals, ederal government laboratories, private sectorrms and provincial government laboratories added toCanada’s total output as well. Ontario (45.8 percent)and Quebec (23.6 percent) contributed approximately70 percent o Canadian publications.96
Scientifc specialization — Publications data can alsobe used to get a rough idea o the scientic specializa-tion o a country.97 Overall, European countries arenot heavily specialized, with relatively equal shares opublications in specic elds that do not dier muchrom their total publications shares. Asia and NorthAmerica, by contrast, display much greater concentra-tion o scientic research. As a rule, Asian countriestend to specialize in physics, chemistry and engineer-ing science but under-specialize in the lie sciences.Conversely, in North America, there tends to be aspecialization in biology and medical research but anunder-specialization in physics and chemistry. Canadianresearchers account or 4 percent o world publica-tions in basic biology, but only or 2 percent and or2.1 percent respectively in physics and chemistry. Thesame degree o specialization also holds or the United
States. Canada also has a number o specializationsthat do not refect North American trends and so maybe regarded as comparative advantages, especially overthe U.S. In particular, Canadian researchers account or4.3 percent o world publications in applied biologyand ecology, and 4.2 percent in astronomy, astrophys-ics and cosmology, as well as 3.9 percent in engineer-ing science.98
95 Observatoire des Sciences et des Techniques, Indicateurs de sciences et de technologies, 2010, p. 403.
96 Observatoire des sciences et des technologiques, L’observation S&T. Note no. 21, Septembre 2008, p. 2.
97 This is done by comparing the share o publications in a eld produced by a given country to its world share o publications orall disciplines.
98 Observatoire des Sciences et des Techniques, Indicateurs de sciences et de technologies, 2010, p. 406.
99 The number o times a country’s scientic papers are cited is essentially an indicator o the scientic visibility o the country, but itcan also be interpreted as a rough indicator o the quality o scientic papers it produces and their impact on scientic advance-ment. Indeed Y. Gingras in Le classement de Shanghai n’est pas scientique, La recherche, no. 430, May 2009, p. 48 has shownthat there is a correlation between citations received and the likeliness o researchers obtaining international prizes and awards.
100 Y. Gingras, Le classement de Shanghai n’est pas scientique, La recherche, no. 430, May 2009, p. 48.
101 The relative impact index is dened as the ratio between world share o citations or a given country and its world share o pub-lications. Thereore, according to this indicator, when a country’s relative impact index is greater than 1, its visibility is better thanthe world average.
102 Observatoire des Sciences et des Techniques, Indicateurs de sciences et de technologies, 2008, pp. 391, 396.

8/6/2019 State of the Nation 2010: Imagination to Innovation, Building Canadian Paths to Prosperity
http://slidepdf.com/reader/full/state-of-the-nation-2010-imagination-to-innovation-building-canadian-paths 57/86
Canada ranks th on the list o countries with the greatest number o universities in the top 100.
Shanghai Jiao Tong University (GSE-SJTU) — In2010, according to GSE-SJTU, Canada had our univer-sities in the top 100: University o Toronto (27th place),University o British Columbia (36th place), McGillUniversity (61st place) and McMaster University(88th place).106 Overall, Canada had 23 universitiesranked in the Shanghai ranking top 500. These resultsare similar to the ones obtained in 2008. While itmay still be disappointing that no Canadian univer-sity gures in the ranking’s top 10 or top 20, Canadanevertheless ranks 5th (out o 39 countries) on the listo countries with the greatest number o universities inthe top 100, and 6th on the list o countries with the
greatest number o universities in the top 500. Onboth lists, only much larger countries rank ahead ous. Canadian universities account or 4.0 percento universities ranked in the top 100 and or 4.6 per-cent o the ones ranked in the top 500. We achievethese results with a share o only 0.5 percent o globalpopulation. This means that, with a ratio o 8.0 or thepercentage o universities in the top 100 relative tothe share o global population, we clearly outperormcountries such as Germany, Japan and France. Ourresults are even better or the top 500. With a ratio o9.2 or the percentage o universities in the top 500
relative to the share o global population, Canada out-perorms the United States and United Kingdom.
A dierent weighting o the Shanghai ranking’s indica-tors placing greater emphasis on indicators o currentrather than past perormance would place Canadianuniversities higher. The Shanghai ranking’s rst twoindicators (total number o alumni and sta havingwon Nobel Prizes and Fields Medals) have a com-bined weight o 30 percent. These indicators take intoaccount Nobel Prizes and Fields Medals won in pastdecades. In contrast, the Shanghai ranking’s indica-
tor that ocuses the most on the current research
published scientic literature. The emergence o thesecountries is an opportunity or Canadian researchersto network globally, especially through scienticco-publications. Between 2001 and 2006, thepercentage o world scientic publications that areinternational co-publications (i.e., involving researchers
rom at least two dierent countries) has risen rom16.3 percent to 19.1 percent, which representsa 17 percent increase in the total number o co-publications. Over the same period, Canada haskept pace with the general increase o co-publicationsthroughout the world with an 18 percent increase inits total number o co-publications. In 2006, 42.1 per-cent o Canada’s total publications were co-publicationscompared with 35.8 percent in 2001. This puts usin the top tier o international co-publishers, withSwitzerland (57.7 percent), South Arica (46.6 percent),Mexico (43.8 percent) and Israel (41.2 percent).103
6.2.1.2 Measuring the Perormance oCanada’s Universities
Along with bibliometric indicators, rankings o worlduniversities have grown in popularity as measures oa country’s perormance in research. There are threecommonly cited sources or measuring the qualityo universities: the Graduate School o Education,Shanghai Jiao Tong University (GSE-SJTU) AcademicRanking o World Universities (the “Shanghai rank-ing”);104 the Quacquarelli Symonds (QS) WorldUniversity Rankings, and the Times Higher Educationranking (THE). Many strong criticisms have been raisedby experts about the methodology and validity o theserankings.105 Despite their possible methodologicalfaws, university rankings now play a major role ininfuencing the international reputation o our highereducation sector. Reputation helps an institution recruitand retain the best researchers, enhances opportunitiesor collaboration and networking and can improve itsability to attract research unding and undingor scholarships.
103 Observatoire des Sciences et des Techniques, Indicateurs de sciences et de technologies, 2008, p. 402.
104 The GSE-SJTU Academic Ranking o World Universities evaluates universities on our criteria: quality o education, quality o ac-ulty, research output and size o institution. These are all based on six homogenous indicators, such as awards per aculty memberand citations.
105 Y. Gingras, Le classement de Shanghai n’est pas scientique, La recherche, no. 430, May 2009. J.C. Billaut, D. Bouyssou andP. Vincke, Should you believe in the Shanghai ranking? an MCDM view , Laboratoire d’Inormatique, Université François-Rabelais,2009. Contrary to bibliometric indicators, which are homogenous and easy-to-interpret indicators, university rankings are hetero-geneous indicators, aggregating measures that may in act be undamentally dierent in nature and very dicult to add up in ameaningul way.
106 Graduate School o Education (ormerly the Institute o Higher Education), Shanghai Jiao Tong University, Academic Ranking o
World Universities-2009.

8/6/2019 State of the Nation 2010: Imagination to Innovation, Building Canadian Paths to Prosperity
http://slidepdf.com/reader/full/state-of-the-nation-2010-imagination-to-innovation-building-canadian-paths 58/86
Turning Skin into Blood — A Canadian Researcher DevelopsNew Opportunities or Cancer Treatment
Dr. Mick Bhatia, director o the Stem Cell and CancerResearch Institute (SCC-RI) at McMaster University, andCanada Research Chair in Human Stem Cell Biology,
and his team, have ound a way to create blood roma patch o a person’s own skin.
R&D Sub-Priority: Regenerative Medicine
Dr. Mick Bhatia, and his team, published research
ndings in the prestigious scientic journal Nature (November 7, 2010), which demonstrated — or therst time — that human skin cells could be directlyconverted into blood cells.
The impact o this research could mean that patientsrequiring blood or surgery, cancer treatments ortreatments or blood conditions, could create bloodrom their own skin. This could revolutionize cancertreatment approaches, or bone marrow transplantsor example, by eliminating the need to nd a donormatch, and in turn reducing time and treatment costs.
Dr. Bhatia is a recognized leader in the eld o humanhematopoietic stem cell biology and pluripotent stemcells. He is also the current director o the Stem Celland Cancer Research Institute (SCC-RI) at McMasterUniversity, and Canada Research Chair in HumanStem Cell Biology. His discovery builds on pioneeringresearch by other Canadians, Dr. Jim Till and Dr. ErnestMcCulloch, who rst published evidence o the exist-ence o stem cells in 1963.
Dr. Bhatia’s research was unded by the CanadianInstitutes o Health Research, Canadian Cancer Society
Research Institute, Stem Cell Network and OntarioMinistry o Research and Innovation.
State of the nation 2010
48
perormance o universities has a weight o 20 per-cent. It takes into account the total number o papers
indexed in the Science Citation Index-Expanded andthe Social Sciences Citation Index in the previous year.Canadian universities score substantially higher orthis indicator than in total scores. For example, theUniversity o Toronto perorms remarkably well, rank-ing third on the complete list, behind only HarvardUniversity and the University o Tokyo. Ranked 18th,the University o British Columbia is on par withCambridge University.
Rankings by Field and Subject — Since 2007 and 2009respectively, the GSE-SJTU has also been producing
rankings o universities according to ve dierent elds (natural sciences and mathematics; engineering/ technology and computer sciences; lie andagriculture sciences; clinical medicine and pharmacy;and social sciences) as well as ve dierent subjects (mathematics; physics; chemistry; computer science;and economy/business). The methodology behind thesespecialized rankings diers rom the one used to buildthe overall ranking. It places less weight on the indica-tors pertaining to the total number o alumniand sta having won Nobel Prizes and Fields Medals(25 percent instead o 30 percent), and more on
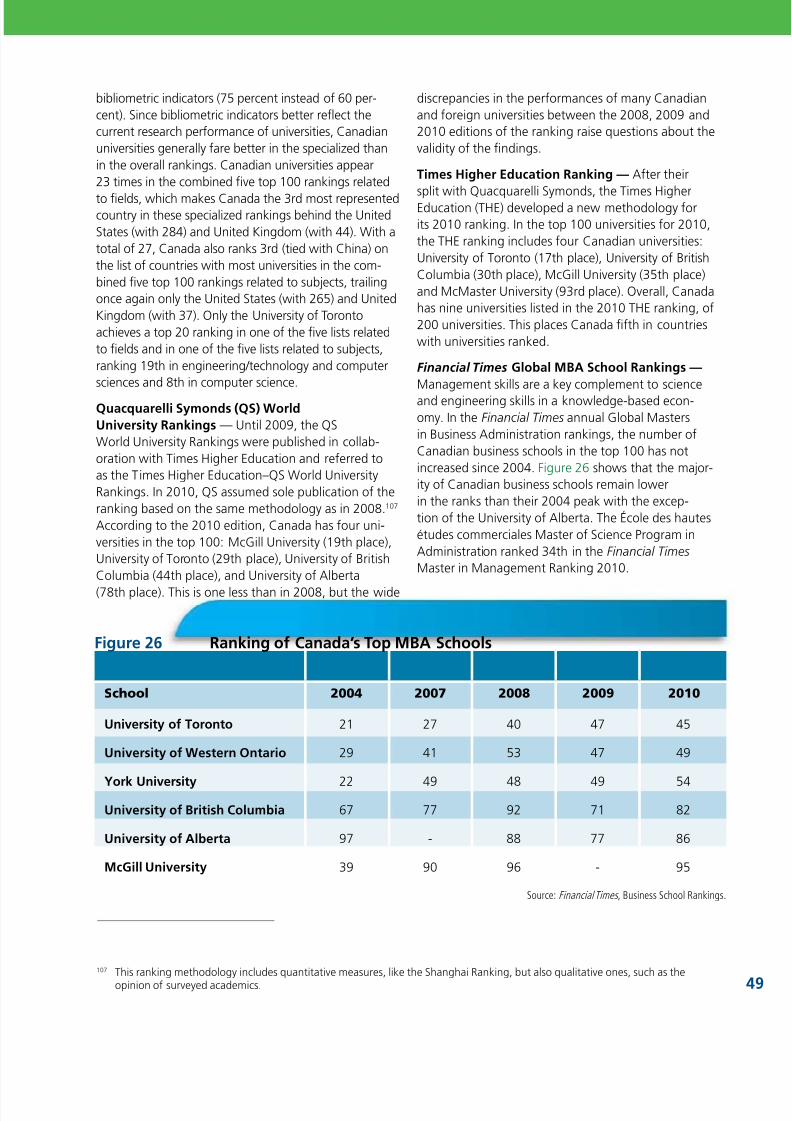
8/6/2019 State of the Nation 2010: Imagination to Innovation, Building Canadian Paths to Prosperity
http://slidepdf.com/reader/full/state-of-the-nation-2010-imagination-to-innovation-building-canadian-paths 59/86
107 This ranking methodology includes quantitative measures, like the Shanghai Ranking, but also qualitative ones, such as the
opinion o surveyed academics.
discrepancies in the perormances o many Canadianand oreign universities between the 2008, 2009 and2010 editions o the ranking raise questions about thevalidity o the ndings.
Times Higher Education Ranking — Ater their
split with Quacquarelli Symonds, the Times HigherEducation (THE) developed a new methodology orits 2010 ranking. In the top 100 universities or 2010,the THE ranking includes our Canadian universities:University o Toronto (17th place), University o BritishColumbia (30th place), McGill University (35th place)and McMaster University (93rd place). Overall, Canadahas nine universities listed in the 2010 THE ranking, o200 universities. This places Canada th in countrieswith universities ranked.
Financial Times Global MBA School Rankings — Management skills are a key complement to scienceand engineering skills in a knowledge-based econ-omy. In the Financial Times annual Global Mastersin Business Administration rankings, the number oCanadian business schools in the top 100 has notincreased since 2004. Figure 26 shows that the major-ity o Canadian business schools remain lowerin the ranks than their 2004 peak with the excep-tion o the University o Alberta. The École des hautesétudes commerciales Master o Science Program inAdministration ranked 34th in the Financial Times Master in Management Ranking 2010.
bibliometric indicators (75 percent instead o 60 per-cent). Since bibliometric indicators better refect thecurrent research perormance o universities, Canadianuniversities generally are better in the specialized thanin the overall rankings. Canadian universities appear23 times in the combined ve top 100 rankings related
to elds, which makes Canada the 3rd most representedcountry in these specialized rankings behind the UnitedStates (with 284) and United Kingdom (with 44). With atotal o 27, Canada also ranks 3rd (tied with China) onthe list o countries with most universities in the com-bined ve top 100 rankings related to subjects, trailingonce again only the United States (with 265) and UnitedKingdom (with 37). Only the University o Torontoachieves a top 20 ranking in one o the ve lists relatedto elds and in one o the ve lists related to subjects,ranking 19th in engineering/technology and computersciences and 8th in computer science.
Quacquarelli Symonds (QS) WorldUniversity Rankings — Until 2009, the QSWorld University Rankings were published in collab-oration with Times Higher Education and reerred toas the Times Higher Education–QS World UniversityRankings. In 2010, QS assumed sole publication o theranking based on the same methodology as in 2008.107 According to the 2010 edition, Canada has our uni-versities in the top 100: McGill University (19th place),University o Toronto (29th place), University o BritishColumbia (44th place), and University o Alberta
(78th place). This is one less than in 2008, but the wide
Source: Financial Times , Business School Rankings.
Figure 26 Ranking o Canada’s Top MBA Schools
School 2004 2007 2008 2009 2010
University o Toronto 21 27 40 47 45
University o Western Ontario 29 41 53 47 49
York University 22 49 48 49 54University o British Columbia 67 77 92 71 82
University o Alberta 97 - 88 77 86
McGill University 39 90 96 - 95

8/6/2019 State of the Nation 2010: Imagination to Innovation, Building Canadian Paths to Prosperity
http://slidepdf.com/reader/full/state-of-the-nation-2010-imagination-to-innovation-building-canadian-paths 60/86

8/6/2019 State of the Nation 2010: Imagination to Innovation, Building Canadian Paths to Prosperity
http://slidepdf.com/reader/full/state-of-the-nation-2010-imagination-to-innovation-building-canadian-paths 61/86
6.2.2.3 Knowledge Transer through ResearchCollaboration and Partnerships
The number o university-industry co-authored scien-tic articles increased by 80 percent between 1990and 2005 and the average number o citations oco-authored papers in 2005 was greater than non-collaborative papers.113
In terms o management, business, and nanceresearch in Canada, the Council o CanadianAcademies has noted that collaboration was observedprimarily between universities; collaborations betweenuniversities and private sector or public sector entitiescomprised only 10 percent o the total number ocollaborative papers.114
6.2.2.4 Licensing Technologies and
Trademarking InnovationsLicences are an indicator o technologies ready orcommercialization. According to Statistics Canada’sSurvey o Intellectual Property Commercialization in
the Higher Education Sector (2008), 81 percent oresponding (101) Canadian universities and aliatedteaching hospitals were engaged in IP management,a number that has remained steady since 2005.
In 2007–08, Canada’s 42 academic health-care organ-izations initiated over 1,500 new clinical trials with apotential value o over $300 million; and created nearly
300 licences and 200 disclosures. In addition, between2003 and 2006, they generated approximately$30 million in licence and technology transer income.Since 1995, they have created at least 100 world-rstdiscoveries and 65 new spino companies.115
mission — educating students to create, analyze andthink or themselves. An internship can also better pre-pare students or the workplace and or the demandsto deliver on time and on budget.
The Government o Canada has strengthened intern-
ship programs through commitments in recentbudgets, including additional support or the IndustrialResearch and Development Internship program (Budget2009) and the Career Focus component o the YouthEmployment Strategy (Budget 2010). This urtherincreases receptor capacity, which is the capacity to seepotential applications o research to solve problemsand achieve perormance targets and cost savings.
Where companies do not have largein-house research capacities withdedicated resources, internships and
co-operative education can allow companies to gain insight into thelatest scientic and technical thinkingand to identiy sources o expertise.
6.2.2.2 Knowledge Transer throughContract Research
In 2008, Canadian universities undertook researchcontracts worth almost $2 billion, representing a sig-nicant 55 percent increase rom 2007.112 The ederal
government and provincial and other levels o govern-ment maintained their respective share o that amount(a th and a quarter respectively) while Canadian busi-nesses and non-prot organizations accounted or athird o the total value o those research contracts.
112 Statistics Canada, Survey o Intellectual Property Commercialization in the Higher Education Sector 2008, 2010.
113 OECD (2007), Science, Technology and Industry Scoreboard .
114 Canadian Council o Academies, Better Research or Better Business: Report o the Expert Panel on Management , Business, and Finance Research, May 2009.
115 Data rom ACAHO.
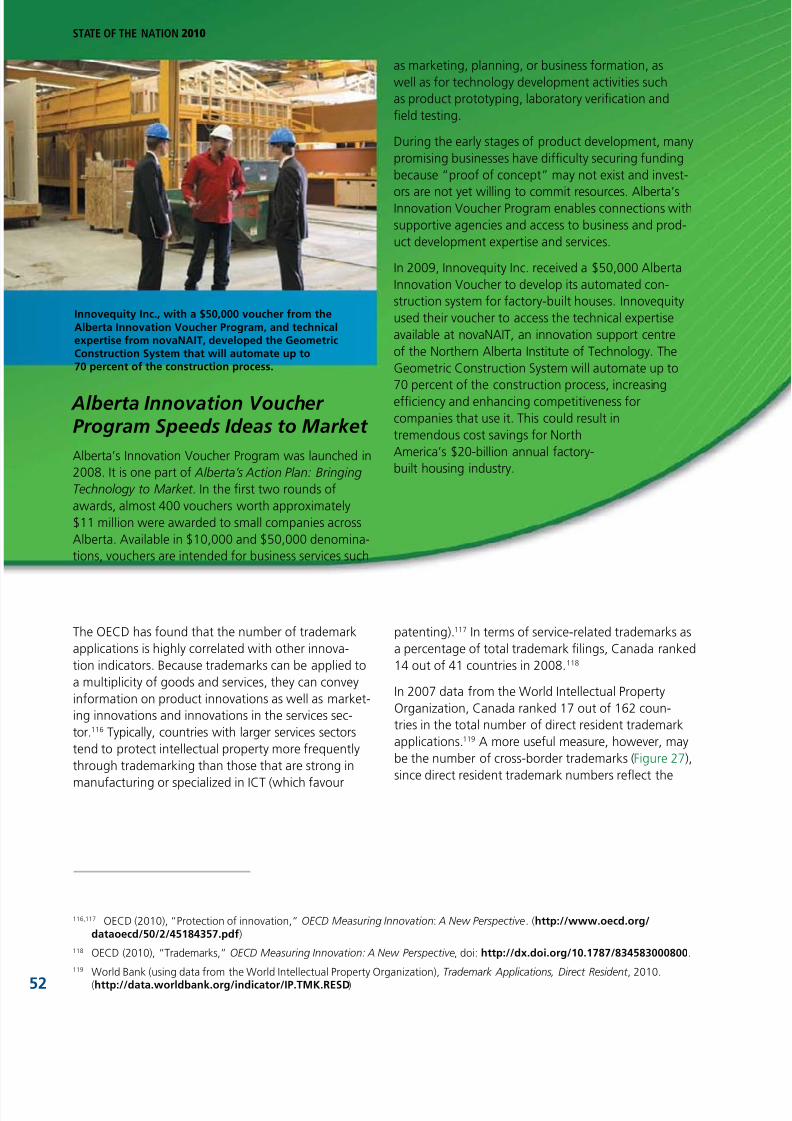
8/6/2019 State of the Nation 2010: Imagination to Innovation, Building Canadian Paths to Prosperity
http://slidepdf.com/reader/full/state-of-the-nation-2010-imagination-to-innovation-building-canadian-paths 62/86
Innovequity Inc., with a $50,000 voucher rom theAlberta Innovation Voucher Program, and technicalexpertise rom novaNAIT, developed the GeometricConstruction System that will automate up to70 percent o the construction process.
116,117 OECD (2010), “Protection o innovation,” OECD Measuring Innovation: A New Perspective. (http://www.oecd.org/dataoecd/50/2/45184357.pd)
118 OECD (2010), “Trademarks,” OECD Measuring Innovation: A New Perspective, doi: http://dx.doi.org/10.1787/834583000800.
119 World Bank (using data rom the World Intellectual Property Organization), Trademark Applications, Direct Resident , 2010.
(http://data.worldbank.org/indicator/IP.TMK.RESD)52
The OECD has ound that the number o trademarkapplications is highly correlated with other innova-tion indicators. Because trademarks can be applied toa multiplicity o goods and services, they can conveyinormation on product innovations as well as market-ing innovations and innovations in the services sec-tor.116 Typically, countries with larger services sectorstend to protect intellectual property more requentlythrough trademarking than those that are strong in
manuacturing or specialized in ICT (which avour
patenting).117 In terms o service-related trademarks asa percentage o total trademark lings, Canada ranked14 out o 41 countries in 2008.118
In 2007 data rom the World Intellectual PropertyOrganization, Canada ranked 17 out o 162 coun-tries in the total number o direct resident trademarkapplications.119 A more useul measure, however, maybe the number o cross-border trademarks (Figure 27),since direct resident trademark numbers refect the
State of the nation 2010
Alberta’s Innovation Voucher Program was launched in2008. It is one part o Alberta’s Action Plan: Bringing
Technology to Market . In the rst two rounds oawards, almost 400 vouchers worth approximately$11 million were awarded to small companies acrossAlberta. Available in $10,000 and $50,000 denomina-tions, vouchers are intended or business services such
as marketing, planning, or business ormation, aswell as or technology development activities suchas product prototyping, laboratory verication andeld testing.
During the early stages o product development, manypromising businesses have diculty securing undingbecause “proo o concept” may not exist and invest-
ors are not yet willing to commit resources. Alberta’sInnovation Voucher Program enables connections withsupportive agencies and access to business and prod-uct development expertise and services.
In 2009, Innovequity Inc. received a $50,000 AlbertaInnovation Voucher to develop its automated con-struction system or actory-built houses. Innovequityused their voucher to access the technical expertiseavailable at novaNAIT, an innovation support centreo the Northern Alberta Institute o Technology. TheGeometric Construction System will automate up to70 percent o the construction process, increasingeciency and enhancing competitiveness orcompanies that use it. This could result intremendous cost savings or NorthAmerica’s $20-billion annual actory-built housing industry.
Alberta Innovation Voucher Program Speeds Ideas to Market
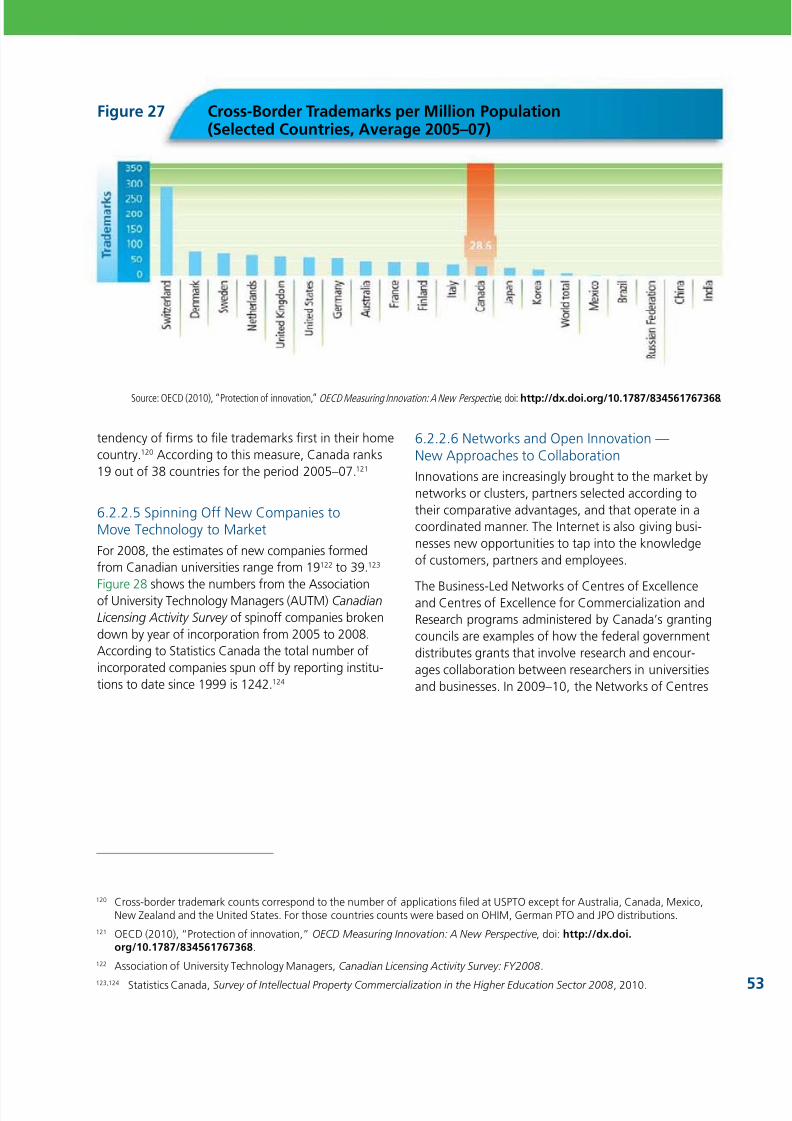
8/6/2019 State of the Nation 2010: Imagination to Innovation, Building Canadian Paths to Prosperity
http://slidepdf.com/reader/full/state-of-the-nation-2010-imagination-to-innovation-building-canadian-paths 63/86
tendency o rms to le trademarks rst in their homecountry.120 According to this measure, Canada ranks19 out o 38 countries or the period 2005–07.121
6.2.2.5 Spinning O New Companies toMove Technology to Market
For 2008, the estimates o new companies ormedrom Canadian universities range rom 19122 to 39.123
Figure 28 shows the numbers rom the Associationo University Technology Managers (AUTM) Canadian
Licensing Activity Survey o spino companies brokendown by year o incorporation rom 2005 to 2008.According to Statistics Canada the total number oincorporated companies spun o by reporting institu-tions to date since 1999 is 1242.124
6.2.2.6 Networks and Open Innovation —New Approaches to Collaboration
Innovations are increasingly brought to the market bynetworks or clusters, partners selected according totheir comparative advantages, and that operate in acoordinated manner. The Internet is also giving busi-nesses new opportunities to tap into the knowledgeo customers, partners and employees.
The Business-Led Networks o Centres o Excellenceand Centres o Excellence or Commercialization andResearch programs administered by Canada’s grantingcouncils are examples o how the ederal governmentdistributes grants that involve research and encour-ages collaboration between researchers in universitiesand businesses. In 2009–10, the Networks o Centres
120 Cross-border trademark counts correspond to the number o applications led at USPTO except or Australia, Canada, Mexico,New Zealand and the United States. For those countries counts were based on OHIM, German PTO and JPO distributions.
121 OECD (2010), “Protection o innovation,” OECD Measuring Innovation: A New Perspective, doi: http://dx.doi.org/10.1787/834561767368.
122 Association o University Technology Managers, Canadian Licensing Activity Survey: FY2008.
123,124 Statistics Canada, Survey o Intellectual Property Commercialization in the Higher Education Sector 2008, 2010.
Figure 27 Cross-Border Trademarks per Million Population(Selected Countries, Average 2005–07)
Source: OECD (2010), “Protection o innovation,” OECD Measuring Innovation: A New Perspective , doi: http://dx.doi.org/10.1787/834561767368.

8/6/2019 State of the Nation 2010: Imagination to Innovation, Building Canadian Paths to Prosperity
http://slidepdf.com/reader/full/state-of-the-nation-2010-imagination-to-innovation-building-canadian-paths 64/86
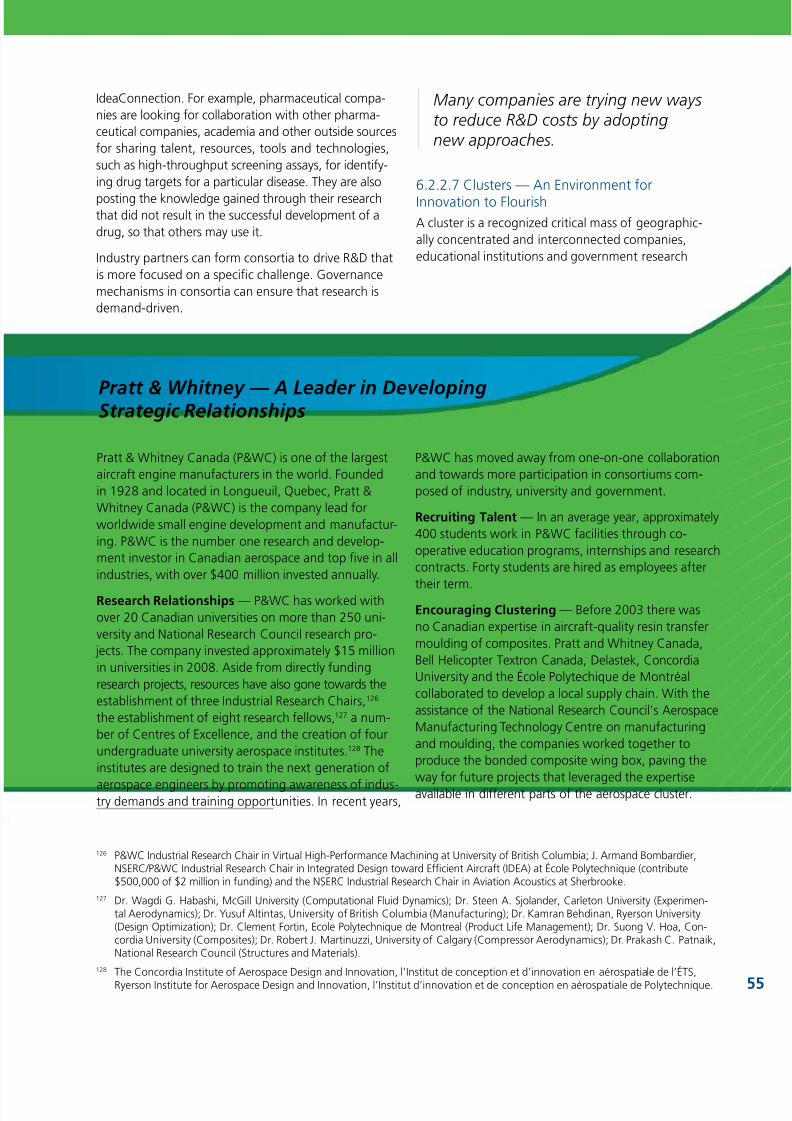
8/6/2019 State of the Nation 2010: Imagination to Innovation, Building Canadian Paths to Prosperity
http://slidepdf.com/reader/full/state-of-the-nation-2010-imagination-to-innovation-building-canadian-paths 65/86
Pratt & Whitney Canada (P&WC) is one o the largestaircrat engine manuacturers in the world. Foundedin 1928 and located in Longueuil, Quebec, Pratt &Whitney Canada (P&WC) is the company lead orworldwide small engine development and manuactur-ing. P&WC is the number one research and develop-ment investor in Canadian aerospace and top ve in allindustries, with over $400 million invested annually.
Research Relationships — P&WC has worked withover 20 Canadian universities on more than 250 uni-versity and National Research Council research pro-
jects. The company invested approximately $15 millionin universities in 2008. Aside rom directly undingresearch projects, resources have also gone towards theestablishment o three Industrial Research Chairs,126 the establishment o eight research ellows,127 a num-ber o Centres o Excellence, and the creation o ourundergraduate university aerospace institutes.128 Theinstitutes are designed to train the next generation o
aerospace engineers by promoting awareness o indus-try demands and training opportunities. In recent years,
P&WC has moved away rom one-on-one collaborationand towards more participation in consortiums com-posed o industry, university and government.
Recruiting Talent — In an average year, approximately400 students work in P&WC acilities through co-operative education programs, internships and researchcontracts. Forty students are hired as employees ater
their term.Encouraging Clustering — Beore 2003 there wasno Canadian expertise in aircrat-quality resin transermoulding o composites. Pratt and Whitney Canada,Bell Helicopter Textron Canada, Delastek, ConcordiaUniversity and the École Polytechique de Montréalcollaborated to develop a local supply chain. With theassistance o the National Research Council’s AerospaceManuacturing Technology Centre on manuacturingand moulding, the companies worked together toproduce the bonded composite wing box, paving theway or uture projects that leveraged the expertiseavailable in dierent parts o the aerospace cluster.
Many companies are trying new waysto reduce R&D costs by adoptingnew approaches.
6.2.2.7 Clusters — An Environment orInnovation to FlourishA cluster is a recognized critical mass o geographic-ally concentrated and interconnected companies,educational institutions and government research
126 P&WC Industrial Research Chair in Virtual High-Perormance Machining at University o British Columbia; J. Armand Bombardier,NSERC/P&WC Industrial Research Chair in Integrated Design toward Ecient Aircrat (IDEA) at École Polytechnique (contribute$500,000 o $2 million in unding) and the NSERC Industrial Research Chair in Aviation Acoustics at Sherbrooke.
127 Dr. Wagdi G. Habashi, McGill University (Computational Fluid Dynamics); Dr. Steen A. Sjolander, Carleton University (Experimen-tal Aerodynamics); Dr. Yusu Altintas, University o British Columbia (Manuacturing); Dr. Kamran Behdinan, Ryerson University(Design Optimization); Dr. Clement Fortin, Ecole Polytechnique de Montreal (Product Lie Management); Dr. Suong V. Hoa, Con-cordia University (Composites); Dr. Robert J. Martinuzzi, University o Calgary (Compressor Aerodynamics); Dr. Prakash C. Patnaik,National Research Council (Structures and Materials).
128 The Concordia Institute o Aerospace Design and Innovation, l’Institut de conception et d’innovation en aérospatiale de l’ÉTS,
Ryerson Institute or Aerospace Design and Innovation, l’Institut d’innovation et de conception en aérospatiale de Polytechnique.
IdeaConnection. For example, pharmaceutical compa-nies are looking or collaboration with other pharma-ceutical companies, academia and other outside sourcesor sharing talent, resources, tools and technologies,such as high-throughput screening assays, or identiy-ing drug targets or a particular disease. They are also
posting the knowledge gained through their researchthat did not result in the successul development o adrug, so that others may use it.
Industry partners can orm consortia to drive R&D thatis more ocused on a specic challenge. Governancemechanisms in consortia can ensure that research isdemand-driven.
Pratt & Whitney — A Leader in DevelopingStrategic Relationships

8/6/2019 State of the Nation 2010: Imagination to Innovation, Building Canadian Paths to Prosperity
http://slidepdf.com/reader/full/state-of-the-nation-2010-imagination-to-innovation-building-canadian-paths 66/86
State of the nation 2010
56
Highly Qualied People (HQP). Immigration and train-ing policies can assist in enhancing the pool o peoplewith needed skills.
The State o the Nation 2008 report identied someareas where Canada was excelling, but also
some gaps and emerging trends. The 2008 reportnoted Canadian primary school children placed thirdin the world in terms o the OECD’s Programme orInternational Student Assessment (PISA) 2006 sci-ence scores. Canada has a highly educated popula-tion, and in 2006, 47 percent o the adult population(aged 25–64) attained a university or college educa-tion; the highest among OECD countries.129 In terms opercentage o the population with a university educa-tion, Canada ranked sixth in the world. These trendshave translated into an internationally recognizedstrong talent pool. Many o the results tracked in the
talent section o the State o the Nation 2008 report,where updated data were available, have not changedsignicantly or the State o the Nation 2010 report —though relative to other countries — Canada has lostsome ground as other countries have made gains.
6.3.1 Science, Math, Reading Skillso 15 Year-OldsEvery three years the OECD’s PISA measures the abil-ities o 15 year-olds in reading, math and science. In2006, Canadian 15 year-olds scored comparatively high
when ranked against their international counterparts,ranking third with only Finland and Hong Kong (China)scoring better.
PISA 2009 results released in 2010, demonstrate thatCanadian 15-year-old students continue to perormwell internationally and have strong skill sets in read-ing, mathematics and sciences (Figure 29). WhileCanada continues to be ranked near the top in theOECD in each o these skill sets, Canada’s scores haveremained stable between 2000 and 2009 and its rela-tive ranking declined in all three assessment domains in
2009. This decline can be attributed to improvementsin the perormance o other countries, and the intro-duction o Shanghai (China) and Singapore, whichhad high perormance levels.
Further analysis o PISA 2006 data was also released in2010, which correlated computer use and PISA sciencescores. Data ndings identied that students whohave been using a computer or a longer time receivedhigher science scores than their peers (Figure 30).
organizations. Clusters usually involve enterprisesrom the same sector, having similar characteristics orproducts or holding complementary positions in a valuechain, including proessional services rms, as well asgovernment and educational institutions. The ormsand boundaries o clusters are dynamic, build upon
existing private sector strengths, and evolve over aperiod o 15 to 20 years.
Entrepreneur-driven companies and individuals withinthe cluster compete, but also cooperate with eachother. Taking advantage o the “spillover eects”that enhance the prospects o individual cluster rmsas well as the overall productivity and success o thegroup, the companies and institutions within the clus-ter are typically able to enhance productivity and getgreater access to outside nancing, including venturecapital. Always client ocused, clusters typically under-
take research and development activities and encour-age risk-taking as well as interdisciplinary work. Theyare also characterized by a high degree o mobilitybetween cluster participants. Clusters have a regionaland national economic impact.
In clusters, smaller companies that have establishedlinks with larger ones typically have shorter times tomarket because they benet rom both better marketknowledge and access o larger companies. Largercompanies benet rom the innovative ideas and fex-ibility o smaller companies. Companies o dierent
sizes also draw on specialized expertise that exists inuniversities, colleges and research institutions butin dierent ways and on dierent scales.
6.3 tl idcrs
A successul innovation system requires a mix o actorsincluding individuals who have the necessary skills tospur growth and development. The indicators in thissection track eorts to nurture talent at all levels romsecondary school to attracting and maintaining con-nections with world-class researchers. This section alsoincludes some best practices in deploying talent.
Canada aces twin demographic challenges o an agingpopulation and declining birth rate. Fewer individualsparticipating in the labour orce will support a relativelylarger group o retired citizens who will live longerlives. This trend, coupled with more complex interdisci-plinary innovation processes, poses new challengesand opportunities or Canada in developing its pool o
129 OECD (2010), Education at a Glance 2009.

8/6/2019 State of the Nation 2010: Imagination to Innovation, Building Canadian Paths to Prosperity
http://slidepdf.com/reader/full/state-of-the-nation-2010-imagination-to-innovation-building-canadian-paths 67/86
Figure 29 PISA Science, Mathematics and Reading Scores(Selected rom Top 25 by 2009 Average Reading Score)
Note: Rank or each indicator is given in brackSource: OECD (2010): PISA 2009 Results: What Students Know and Can Do: Student Performance in Reading, Mathematics and Science (Volum
Source: OECD (2010), Educational Research and Innovation — Are New Millennium Learners Making the Grade?: TechnUse and Educational Performance in PISA, doi: http://dx.doi.org/10.1787/8121868141
Figure 30 Length o Time Students Have Been Using a Computer and MeanPISA Science Score, 2006
Average
ReadingScore
On the Reading SubscalesAverage
MathScale
Averag
ScienceScale
Accessand
Retrieve
Integrateand
Interpret
Refectand
Evaluate
Continuous
Texts
Non-Continuous
Texts
Shanghai –China
556 (1) 549 (1) 558 (1) 557 (1) 564 (1) 539 (2) 600 (1) 575 (1)
Korea 539 (2) 542 (2) 541 (2) 542 (2) 538 (2) 542 (1) 546 (4) 538 (6)
Finland 536 (3) 532 (3) 538 (3) 536 (4) 535 (4) 535 (4) 541 (6) 554 (2)
Hong Kong –China
533 (4) 530 (5) 530 (4) 540 (3) 538 (3) 522 (8) 555 (3) 549 (3)
Singapore 526 (5) 526 (6) 525 (5) 529 (7) 522 (6) 539 (3) 562 (2) 542 (4)
Canada 524 (6) 517 (9) 522 (6) 535 (5) 524 (5) 527 (6) 527 (10) 529 (8)
Japan 520 (8) 530 (4) 520 (7) 521 (9) 520 (7) 518 (9) 529 (9) 539 (5)Australia 515 (9) 513 (11) 513 (9) 523 (8) 513 (9) 524 (7) 514 (15) 527 (10
Netherlands 508 (10) 519 (8) 504 (10) 510 (11) 506 (10) 514 (10) 526 (11) 522 (11
Norway 503 (12) 512 (12) 502 (14) 505 (13) 505 (11) 498 (21) 498 (21) 500 (25
UnitedStates
500 (17) 492 (25) 495 (22) 512 (10) 500 (15) 503 (16) 487 (31) 502 (23
Sweden 497 (19) 505 (16) 494 (23) 502 (17) 499 (16) 498 (20) 494 (26) 495 (29
Germany 497 (20) 501 (20) 501 (16) 491 (27) 496 (23) 497 (22) 513 (16) 520 (13
France 496 (22) 492 (26) 497 (20) 495 (23) 492 (25) 498 (19) 497 (22) 498 (27
UnitedKingdom
494 (25) 491 (28) 491 (26) 503 (14) 492 (27) 506 (14) 492 (28) 514 (16

8/6/2019 State of the Nation 2010: Imagination to Innovation, Building Canadian Paths to Prosperity
http://slidepdf.com/reader/full/state-of-the-nation-2010-imagination-to-innovation-building-canadian-paths 68/86
State of the nation 2010
Canadian 15-year-old students continueto perorm well internationally and have
strong skill sets in reading, mathematicsand sciences.
6.3.2 Pursuing Formal Education(15 to 19 Year-Olds)Enrolment rates o 15 to 19 year-olds provide anindicator o participation in upper secondary educa-tion. Since 1995 there has been an average increaseo 8 percentage points, rom 74 percent in 1995 to82 percent in 2008, o 15 to 19 year-olds enrolled ineducation in OECD countries. In Canada, 80 percent oyouth aged 15 to 19 were pursuing a ormal educationin 2008. This result was slightly lower than the OECDaverage and has remained unchanged since 1995.
Statistics Canada noted provincial and territorial di-erences. The proportion o youth aged 15 to 19 nolonger in ormal education ranged rom 14 percent inNew Brunswick to 26 percent in Alberta. Data or theterritories ranged rom 25 percent to 34 percent.130
6.3.3 Share o the Population withPost-Secondary EducationThe share o the population with a tertiary educationis regarded as an indicator o a country’s supply oadvanced skills, which can contribute to productivitygains, innovation and growth.131 As shown in Figure 31,in 2008, Canada continued to rank rst in theeducational attainment o its adult population(aged 25–64).132, 133
Seeking Inormation by Questioning
Inquiry-based learning is an innovative method oteaching that allows students to question their waytowards useul ndings and solutions through experi-mentation and the accumulation o data. Studentslearn how to eectively problem-solve rather thansimply ‘memorize the acts.’ While there are variants o
the method o inquiry-based learning, a global curricu-lum is in practice in many countries. Individual schoolsand networks o schools in Canada are increasinglyadopting inquiry-based learning programs.
Smarter Science is a ramework or teaching andlearning science in grades 1–12 and or developing theskills o inquiry, creativity, and innovation in a mean-ingul and engaging manner. The ramework enablesteachers to develop classroom activities or studentsthat refect the investigative, creative and social natureo science or any curriculum unit. Smarter Sciencewas piloted in 50 schools in Ontario between 2006and 2010 and is now part o Youth Science Canada’s
program or engaging youth in inquiry and criticalthinking through science. In 2011 the organizationwill celebrate 50 years o developing and promotingCanadian youth science and technology.
Calgary-based Galileo Educational Network is anothernon-prot organization promoting inquiry-based learn-
ing. Through research and the creation o 21st Centurylearning environments, Galileo educators have infu-enced curriculum and classroom delivery both inter-nationally and across Canada. Teaching or deeperunderstanding in all classroom subjects is a primarygoal. This is accomplished by supporting new andexperienced teachers and leaders through individual-ized proessional development. The result is an educa-tional environment where digital technologies are usedin inquiry-based projects, allowing or students tolearn in creative and thoughtul ways.
58
130 Statistics Canada, Education indicators in Canada: An international perspective, September 7, 2010.
131 Leitch Review o Skills, Prosperity or all in the global economy — world class skills, December 2006. p. 8.
132 OECD (2010), Education at a Glance 2009.
133 Tertiary education is dened as programs that are classied under the International Standard Classication o Education’s (ISCED)levels 5A, 5B and 6. Level 5A is considered to be more theory-based and designed to train students or their entry into advancedresearch programs and high-skill proessions. Level 5B programs ocus more on practical skills. Level 6 is the second stage o tertiaryeducation and it includes advanced studies and programs that require original research. Due to some Labour Force Survey (LFS)limitations, ISCED 5A and 6 cannot be disentangled in Canada. The proportion recorded or tertiary-type B programs (ISCED level 5B)may be somewhat overestimated because this category includes, or example, some Collège d’enseignement général et proession-nel (CEGEP) or college university transer program graduates which, under the international system, would be placed in ISCED level 4
(programs that straddle the boundary between upper-secondary and post-secondary education).

8/6/2019 State of the Nation 2010: Imagination to Innovation, Building Canadian Paths to Prosperity
http://slidepdf.com/reader/full/state-of-the-nation-2010-imagination-to-innovation-building-canadian-paths 69/86
6.3.4 College and UniversityGraduation RatesGraduation rom a college or university programprovides individuals with a package o skills andknowledge. In Canada the graduation rate o collegestudents, at 29.6 percent, is much higher thanthe OECD average o 10 percent. As shown inFigure 32, although some advances have been madesince 2000, rst-time bachelor’s degree graduationrates in Canada were 34 percent in 2008, whichremains lower than the OECD average o 38 percent.134
Non-completion o a degree does not mean skillsand competencies acquired are lost or not valued bythe labour market. In addition, students who do notcomplete a program may leave, gain employment andthen decide to continue their studies at a later date.Data also capture enrolments o individuals, such aspart-time students, who enter a program to improveknowledge and skill levels.
Figure 31 Percentage o 25–64 Year-Old Population withTertiary Education, Top 12OECD Countries, 2008
Source: OECD (2010), Education at a Glance 2009 .
6.3.5 Science and Engineering Educationor Growth and ProsperityRecent eorts to boost science and engineering skills inCanada have resulted in signicant gains. Accordingto newly released data shown in Figure 33, rom 2005
to 2008, there was a 13 percent increase in the num-ber o undergraduate degrees, with a 28 percent and9.1 percent increase in science and engineeringgraduates respectively.135
Figure 34 shows that since 1992 in Canada, there hasbeen an increase in enrolments and degrees granted inphysical and lie sciences, and architecture and engin-eering related programs, while math, computer andinormation sciences program enrolments and degreesgranted have been decreasing since 2001. This decreaseis likely in response to the high-technology industryboom and decline in North America in the late 1990sand early 2000s.
6.3.6 Inormation and CommunicationsTechnologies Skills; Access and Use o ICTCanada has strengths in inormation and communica-tions technologies (ICT) skills, access and use amongthe general population. Access and skills are pre-conditions to ICT use. According to the InternationalTelecommunication Union,136 while Canada rankedonly 18th, 22nd, and 20th respectively or access, skillsand use in 2008 amongst 159 countries, particular sub-components were higher or Canada. For example, orICT skills — which include adult literacy rates, second-ary gross enrolment ratio, and tertiary gross enrolmentratio — the Canadian ICT skills index rating was 8.65compared to the rst-placed Republic o Korea at9.84. For the components o ICT use, Canada ranked11th or Internet users per 100 inhabitants, 10th orxed broadband Internet subscribers per 100 inhabit-ants, and 56th or mobile broadband subscriptions per100 inhabitants.
According to Statistics Canada’s Canadian Internet Use
Survey o 2009, 80 percent o Canadians aged 16 andolder, or 21.7 million people, used the Internet or per-sonal reasons. This is up rom 73 percent in 2007 whenthe survey was last conducted.137
134 Statistics Canada, Education indicators in Canada: An international perspective, 2010.
135 In 2003, Ontario eliminated the Ontario Academic Credit (OAC) program, or th year o secondary education, resulting in a“double cohort” graduating class. Although undergraduate enrolment and graduation trends have been increasing in Canada,the policy change in Ontario may account or some o the increase in 2008.
136 International Telecommunications Union, Measuring the Inormation Society 2010, Switzerland, 2010.
137 Statistics Canada, Canadian Internet Use Survey , 2009.

8/6/2019 State of the Nation 2010: Imagination to Innovation, Building Canadian Paths to Prosperity
http://slidepdf.com/reader/full/state-of-the-nation-2010-imagination-to-innovation-building-canadian-paths 70/86
State of the nation 2010
60
Figure 32 Graduation Rates rom Tertiary Education (1995, 2000, 2008)
Source: OECD (2010), Education at a Glance 2010 , doi: http://dx.doi.org/10.1787/888932310130.
University-level education
College-level education

8/6/2019 State of the Nation 2010: Imagination to Innovation, Building Canadian Paths to Prosperity
http://slidepdf.com/reader/full/state-of-the-nation-2010-imagination-to-innovation-building-canadian-paths 71/86
Figure 34 Annual Number o Persons Enrolled and Degrees Granted inCanadian University Undergraduate Science, Engineering, Math,Computer, Inormation Sciences and Related Programs
Figure 33 Selected OECD Countries by Total Number o Degrees Granted inTertiary Science, Engineering, and All Fields o Study or 2008;and Percentage Change rom 2005 to 2008
Source: Data compiled by STIC Secretariat based on data rom OECD.stat,"Graduates by Field o Study.”
Source: OECD (2009), Science, Technology and Industry Scoreboard 2009 , p.
Country
Science Engineering All Fields o Study
Number o
Degrees
Growth
rom
Number o
Degrees
Growth
rom
Number o
Degrees
Growth
rom
20082005 to
20082008
2005 to
20082008
2005 to
2008
United States 190,987 1.2 134,351 3.5 2,279,805 8.5
Japan 28,771 1.9 125,934 -1.7 654,768 2.8
United Kingdom 68,123 -3.0 45,879 11.9 520,117 7.8
France 51,973 -20.9 53,781 -1.0 401,421 -11.5
Mexico 40,464 2.1 56,013 9.7 392,783 10.5
Korea 37,122 16.2 90,150 12.0 388,128 30.6
Germany 54,074 79.1 43,417 21.3 344,309 60.8
Australia 26,567 -11.1 16,077 1.3 230,878 3.4
Canada 28,372 28.0 18,241 9.1 222,541 13.0
Netherlands 7,373 -1.4 8,947 6.7 121,014 16.6
Finland 6,619 118.5 8,700 9.6 58,072 56.3
Sweden 2,969 -17.3 7,963 -11.9 49,929 0.9

8/6/2019 State of the Nation 2010: Imagination to Innovation, Building Canadian Paths to Prosperity
http://slidepdf.com/reader/full/state-of-the-nation-2010-imagination-to-innovation-building-canadian-paths 72/8662
State of the nation 2010
6.3.7 Education or
Entrepreneurial SuccessEntrepreneurship helps create the economy builders othe uture. Educational institutions can oer a trainingground to oster entrepreneurship, and some institu-tions have been successul at integrating training andmentorship activities into their program oerings inorder to promote student entrepreneurial results.
6.3.8 PhDs — Country Comparisons138 Knowledge economies rely on a highly-skilled work-orce and a PhD represents the height o academic
achievement. The number o doctoral degrees is alsoan indicator o the labour orce potential to engage incutting-edge research and training the next generation.Relative to other countries, Canada produces ewer
138 Labelled “advanced research programmes” by the OECD or ISCED level 6.
doctoral graduates per million population. SinceState o the Nation 2008, Canada has slipped rom20th to 23rd when compared to other OECDcountries (Figure 35).
State o the Nation 2008 reported data rom 2005,and since then there has been a signicant increase inthe number o doctoral (advanced research program)degrees granted by Canadian universities and percent-age growth has outpaced other countries (Figure 36).The percentage increase rom 2005–08 in Canadasurpassed comparator countries in growth o sciencedoctoral degrees (63.7 percent) and was second toSweden in growth o engineering doctoral degrees
(42.1 percent).
The Digital Media Zone (DMZ) at Ryerson University is amultidisciplinary workplace designed or entrepreneur-
ship. The DMZ provides the environment or digitally-inspired ideas with sound business plans to incubate andaccelerate into market-ready products, services or solu-tions. It is unique in the way it cultivates the concept obeing a company within a company. Participants benetrom resources such as StartMeUp, a program cre-ated by Students In Free Enterprise (SIFE Ryerson), thatnurtures entrepreneurial success by giving new businesscreators inormation and advice on business planning,unding, patents, marketing and more. The DMZ hasbeen open since early 2010. Business projects rangerom digital technology elds including mobile/webapplications to social media, virtual reality, 3-D, gamingand interactive marketing.
R&D Sub-Priority: New Media, Animation, Games
Ryerson University’s Digital Media Zone
Inspiring YoungEntrepreneurs to InnovateStrengthening Canada’s
digital media industries
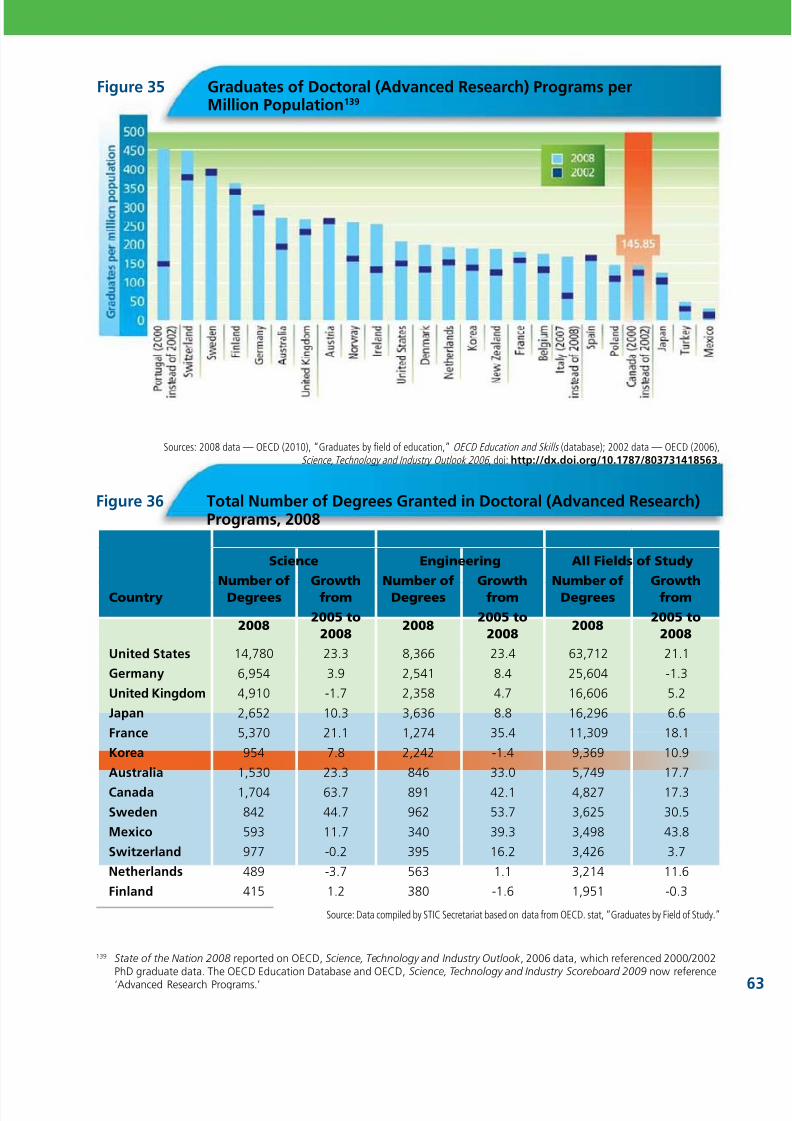
8/6/2019 State of the Nation 2010: Imagination to Innovation, Building Canadian Paths to Prosperity
http://slidepdf.com/reader/full/state-of-the-nation-2010-imagination-to-innovation-building-canadian-paths 73/86
139 State o the Nation 2008 reported on OECD, Science, Technology and Industry Outlook , 2006 data, which reerenced 2000/2002PhD graduate data. The OECD Education Database and OECD, Science, Technology and Industry Scoreboard 2009 now reerence
‘Advanced Research Programs.’
Figure 35 Graduates o Doctoral (Advanced Research) Programs perMillion Population139
Sources: 2008 data — OECD (2010), “Graduates by feld o education,” OECD Education and Skills (database); 2002 data — OECD (2006),Science, Technology and Industry Outlook 2006 , doi: http://dx.doi.org/10.1787/803731418563.
Source: Data compiled by STIC Secretariat based on data rom OECD. stat, “Graduates by Field o Study.”
Figure 36 Total Number o Degrees Granted in Doctoral (Advanced Research)Programs, 2008
Country
Science Engineering All Fields o Study
Number o
Degrees
Growth
rom
Number o
Degrees
Growth
rom
Number o
Degrees
Growth
rom
20082005 to
20082008
2005 to
20082008
2005 to
2008
United States 14,780 23.3 8,366 23.4 63,712 21.1
Germany 6,954 3.9 2,541 8.4 25,604 -1.3
United Kingdom 4,910 -1.7 2,358 4.7 16,606 5.2
Japan 2,652 10.3 3,636 8.8 16,296 6.6
France 5,370 21.1 1,274 35.4 11,309 18.1
Korea 954 7.8 2,242 -1.4 9,369 10.9
Australia 1,530 23.3 846 33.0 5,749 17.7
Canada 1,704 63.7 891 42.1 4,827 17.3
Sweden 842 44.7 962 53.7 3,625 30.5
Mexico 593 11.7 340 39.3 3,498 43.8
Switzerland 977 -0.2 395 16.2 3,426 3.7
Netherlands 489 -3.7 563 1.1 3,214 11.6
Finland 415 1.2 380 -1.6 1,951 -0.3

8/6/2019 State of the Nation 2010: Imagination to Innovation, Building Canadian Paths to Prosperity
http://slidepdf.com/reader/full/state-of-the-nation-2010-imagination-to-innovation-building-canadian-paths 74/86
State of the nation 2010
64
Figure 37 Doctoral Students Who Were Canadian Residents andEnrolled in Canadian University Science-Based Programs
Source: Statistics Canada, Postsecondary Student Information System (PSIS) , 2010.
6.3.11 Internships and Co-ops orEnhanced OpportunitiesInternship and co-op programs provide valuableexperiences or students to enhance their employ-ment opportunities and mitigate capacity issues
within organizations. Recently released research hasalso identied that co-op students: typically earnmore than non-co-op students; were in more presti-gious jobs than their non-co-op peers; and assessedthemselves as having better computing, mathematicaland problem-solving skills. These results may point tobenets or both individuals who pursue co-op andinternship programs and organizations who partici-pate in such programs.141
The Canadian Association or Co-operative Education(CAFCE) is comprised o 74 member institutions acrossCanada that have worked in partnership since 1973.CAFCE is currently developing a statistical database onco-op enrolments covering its members with plans torelease ndings in the spring o 2011.
6.3.9 Enrolment and Graduation inScience-Based Doctoral Programs byCanadian StudentsThe number o Canadians enrolled and graduatingrom science-based doctoral programs in Canadian
universities has been increasing steadily in most pro-grams since 1999 (Figure 37).
6.3.10 Unemployment Rates oDoctorate HoldersMore Canadians are graduating rom science andengineering doctoral programs; however, in 2006Canada had higher levels o unemployment rates odoctorate holders by eld o science when comparedto other countries (Figure 38).140
Additional uptake o doctorate holderswithin private, higher education, and public sectors could create incentivesor more individuals to pursue a PhD
program and increase innovationcapacity at the highest levels.
140 OECD (2010), Science, Technology and Industry Working Papers, Careers o Doctorate Holders: Employment and Mobility Patterns.
141 M. Drysdale, J. Goyder and A. Cardy, The Transition rom University to the Labour Market: The Role o Cooperative Education –Phase 3, presentation made at the Cooperative Education and Internship Association (CEIA) Annual Conerence, Portland, USA
(April 20, 2009).

8/6/2019 State of the Nation 2010: Imagination to Innovation, Building Canadian Paths to Prosperity
http://slidepdf.com/reader/full/state-of-the-nation-2010-imagination-to-innovation-building-canadian-paths 75/86
Figure 38 2006 Unemployment Rates o Doctorate Holders by Field o Science
Note: 2005 data or Belgium, Finland and Norway; 1987–2005 graduates and 2005 data or Den* Unemployment rates or these countries are or PhD holders who received their degrees between 1990 and
Source: OECD, 2009 OECD/UIS/Eurostat data collection on careers o doctorate ho
142, 143 Statistics Canada, Education Indicators in Canada: An International Perspective, 2010.
144 OECD (2010), Education at a Glance 2009.
145 Graduate data are more dicult to track, which means that between 25–100 students per year in each program are not identi-ed as either “Canadian” or “International” students. In 2008, inormation on socio-demographic characteristics was unknownor a large number o students in Ontario. This may account or the apparent decrease in the number o Canadian PhD graduates.
The total number o PhD graduates has been increasing in nearly all science-based programs since 1999.
Canada ound that graduates rom university programsearned more, 75 percent more on average, than highschool or trade/vocational program graduates.142
Employment prospects also increase with educationlevel. In 2008, the employment rate or Canadians 25to 64 who had not completed high school was 58 per-cent, compared with 83 percent or college
and university graduates.143
6.3.13 Attracting Great Talent to CanadaCanada is one o the top destinations in the world orskilled immigrants and top-ranked oreign students.Canada continues to attract a signicant share o or-eign students in the world. The percentage o oreignstudents enrolled in Canada, when compared to totaloreign student enrolments internationally, has remainedairly stable since 2000, though there has been a slightincrease to 5.5 percent (2008), rom 5.1 percent (2006)as reported in State o the Nation 2008.144, 145
6.3.12 Returns on ObtainingPost-Secondary EducationThe private rate o return to an individual or obtaining atertiary education in Canada is shown in Figure 39 and isslightly lower but comparable to the OECD average.
The private internal rate o return represents a measure
o the returns obtained, over time, relative to thecosts o the initial investment in education and is equalto the discount rate that equalizes the costs o edu-cation during the period o study to the gains romeducation thereater.
When compared internationally, Canadian economicreturns data may be under-represented as Canadiantertiary education graduate statistics include univer-sity, college, and also post-secondary programs witha shorter duration (e.g., CEGEP in Quebec, and shortcareer training or development programs).
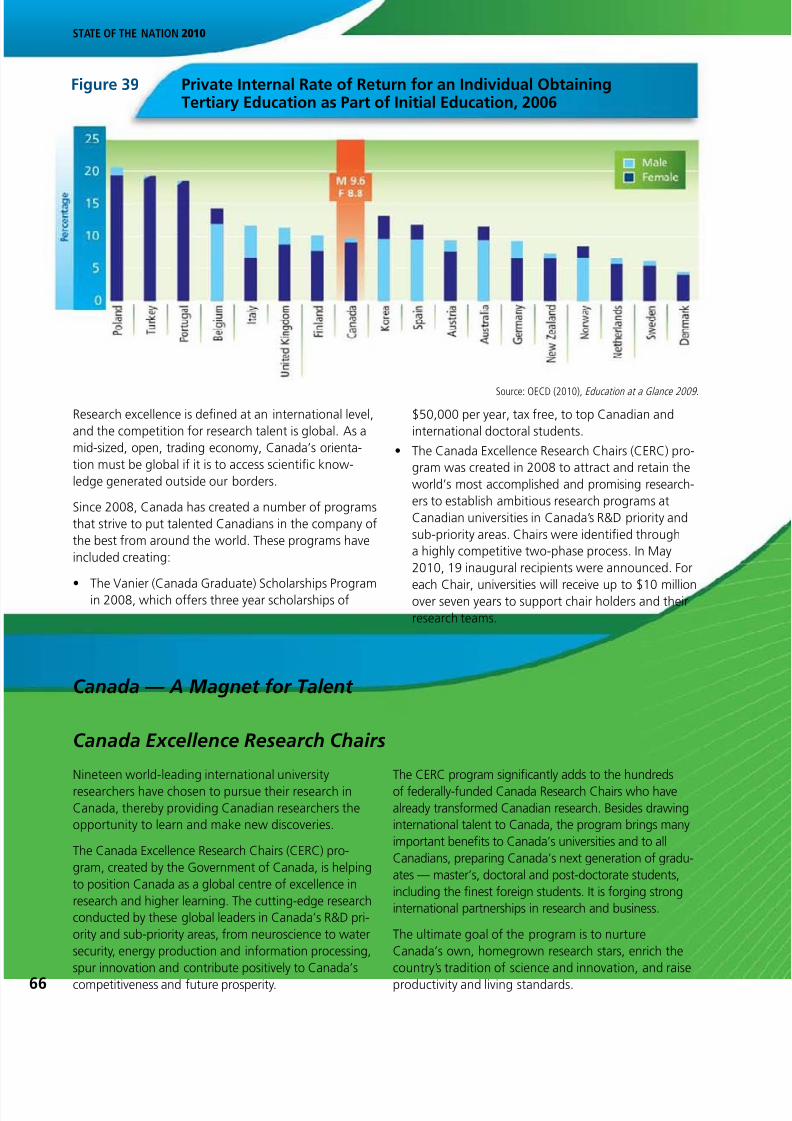
8/6/2019 State of the Nation 2010: Imagination to Innovation, Building Canadian Paths to Prosperity
http://slidepdf.com/reader/full/state-of-the-nation-2010-imagination-to-innovation-building-canadian-paths 76/86
State of the nation 2010
66
Figure 39 Private Internal Rate o Return or an Individual ObtainingTertiary Education as Part o Initial Education, 2006
Research excellence is dened at an international level,and the competition or research talent is global. As amid-sized, open, trading economy, Canada’s orienta-tion must be global i it is to access scientic know-ledge generated outside our borders.
Since 2008, Canada has created a number o programsthat strive to put talented Canadians in the company othe best rom around the world. These programs haveincluded creating:
•
The Vanier (Canada Graduate) Scholarships Programin 2008, which oers three year scholarships o
$50,000 per year, tax ree, to top Canadian andinternational doctoral students.
• The Canada Excellence Research Chairs (CERC) pro-gram was created in 2008 to attract and retain theworld’s most accomplished and promising research-ers to establish ambitious research programs atCanadian universities in Canada’s R&D priority andsub-priority areas. Chairs were identied througha highly competitive two-phase process. In May2010, 19 inaugural recipients were announced. For
each Chair, universities will receive up to $10 millionover seven years to support chair holders and theirresearch teams.
Source: OECD (2010), Education at a Glance 2009.
Canada — A Magnet or Talent
The CERC program signicantly adds to the hundreds
o ederally-unded Canada Research Chairs who havealready transormed Canadian research. Besides drawinginternational talent to Canada, the program brings manyimportant benets to Canada’s universities and to allCanadians, preparing Canada’s next generation o gradu-ates — master’s, doctoral and post-doctorate students,including the nest oreign students. It is orging stronginternational partnerships in research and business.
The ultimate goal o the program is to nurtureCanada’s own, homegrown research stars, enrich thecountry’s tradition o science and innovation, and raise
productivity and living standards.
Nineteen world-leading international university
researchers have chosen to pursue their research inCanada, thereby providing Canadian researchers theopportunity to learn and make new discoveries.
The Canada Excellence Research Chairs (CERC) pro-gram, created by the Government o Canada, is helpingto position Canada as a global centre o excellence inresearch and higher learning. The cutting-edge researchconducted by these global leaders in Canada’s R&D pri-ority and sub-priority areas, rom neuroscience to watersecurity, energy production and inormation processing,spur innovation and contribute positively to Canada’s
competitiveness and uture prosperity.
Canada Excellence Research Chairs

8/6/2019 State of the Nation 2010: Imagination to Innovation, Building Canadian Paths to Prosperity
http://slidepdf.com/reader/full/state-of-the-nation-2010-imagination-to-innovation-building-canadian-paths 77/86
Canada Excellence Research Chairs
R&D Priority and
Sub-Priority Area
Canada Excellence
Research ChairResearcher Came rom
Environment
Water
Ecohydrology —University o Waterloo
Philippe VanCappellen
Georgia Institute o Technology;Utrecht University, Netherlands
Aquatic Epidemiology —University o PrinceEdward Island
Ian A.Gardner
UC Davis School o VeterinaryMedicine; the University oCaliornia, USA
Ocean Science andTechnology —Dalhousie University
DouglasWallace
Leibniz Institute oMarine Sciences, Germany
Water Security — Universityo Saskatchewan
HowardWheater
Imperial College London,United Kingdom
Cleaner extracting,
processing, utilizing
hydrocarbons
Hybrid Powertrain —McMaster University
Ali EmadiElectric Power and Power ElectronicsCentre at the Illinois Institute oTechnology, USA
Natural Resources and Energy
Energy production in
the oil sands
Oil Sands MolecularEngineering — Universityo Alberta
ThomasThundat
University o Tennessee, USA; Universityo Burgundy, France
Arctic
Remote Sensing oCanada’s New Arctic
Frontier — Université Laval
Marcel BabinLaboratoire d’Océanographie deVilleranche, France
Arctic Resources —University o Alberta
D. GrahamPearson
Durham University, United Kingdom
Arctic Geomicrobiologyand Climate Change —University o Manitoba
SørenRysgaard
University o Southern Denmark;Climate Research Center, Greenland

8/6/2019 State of the Nation 2010: Imagination to Innovation, Building Canadian Paths to Prosperity
http://slidepdf.com/reader/full/state-of-the-nation-2010-imagination-to-innovation-building-canadian-paths 78/86
State of the nation 2010
68
Canada Excellence Research Chairs (cont’d)
R&D Priority and
Sub-Priority Area
Canada Excellence
Research ChairResearcher Came rom
Health and Lie Sciences
Neuroscience
Neurogeneticsand TranslationalNeuroscience — Universityo British Columbia
MatthewFarrer
Mayo Clinic, USA
Cognitive Neuroscience andImaging — The Universityo Western Ontario
Adrian OwenMedical Research Council’s Cognitionand Brain Sciences Unit in Cambridge,United Kingdom
Neuroscience; Health
in an aging population
Structural Neurobiology —University o Toronto
Oliver Ernst Charité - Universitätsmedizin, Germany
Health in an
aging populationVirology —University o Alberta
MichaelHoughton
Epiphany Biosciences, USA
Regenerative medi-
cine; Health in
an aging popula-
tion; Neuroscience;
Biomedical engin-
eering and medical
technologies
Diabetes — Universityo Alberta
PatrikRorsman
University o Oxord, United Kingdom
Biomedical engin-
eering and medical technologies
Integrative Biology —
University o Toronto
Frederick
Roth Harvard Medical School, USA
Inormation and Communications Technologies (ICT)
Broadband networks;
Telecommunications
equipment
Quantum NonlinearOptics — Universityo Ottawa
Robert W.Boyd
University o Rochester, USA
New media, animation
and games; Wireless
networks and services;
Broadband networks;
Telecommunications
equipment
Quantum InormationProcessing — Universityo Waterloo
David CoryMassachusetts Instituteo Technology, USA
Broadband networks;
Telecommunications
equipment
Enabling PhotonicInnovations or Inormationand Communication —Université Laval
YounèsMessaddeq
Universidade Estadual Paulista, Brazil
New media, anima-
tion and games;
Telecommunications
equipment
Quantum SignalProcessing — Universitéde Sherbrooke
BertrandReulet
Laboratoire de physique des solides atthe Université Paris-Sud XI, France
8/6/2019 State of the Nation 2010: Imagination to Innovation, Building Canadian Paths to Prosperity
http://slidepdf.com/reader/full/state-of-the-nation-2010-imagination-to-innovation-building-canadian-paths 79/86
• The Banting Postdoctoral Fellowships Program,launched in July 2010, provides $45 million overve years to attract and retain top-level talent toCanada. At a steady state, 140 ellowships will besupported annually, with 70 new awards each year.Awards are tenable or two years, with a value o
$70,000 per year. These ellowships are open toboth Canadian and international researchers whohave recently completed a PhD, PhD-equivalent orhealth proessional degree, and up to 25 percent oCanadian awardees are eligible to go to a oreignresearch institution.
• In November 2010, the Ontario provincial govern-ment announced that it will be oering ull schol-arships or oreign PhD candidates, each worth$40,000 annually or our years. Starting in 2011–12,scholarships will be divided among the province’s uni-
versities, and unded two thirds by the governmentand one third by the various educational institutions.
As a mid-sized, open, trading economy,Canada’s orientation must be global i it is to access scientic knowledge
generated outside our borders.
These programs have received international attentionand resulted in attracting some o the best research-ers in the world to Canada, as shown on the previouspages. The targeted nature o these programs will help
promote research impact on an internationally com-petitive basis throughout Canada.
6.3.14 Education: A Lielong PursuitAdult literacy scores remain an area where it has beendicult to make progress in Canada. The Programmeor the International Assessment o Adult Competencies(PIAAC) is a multi-cycle international program oassessment o adult skills and competencies initiatedby the OECD that will build upon testing completedin 2003 or the International Adult Literacy and Skills
Survey (IALSS). The IALSS tracked the knowledge andskills o 16–65 year-old Canadians in prose and docu-ment literacy, numeracy and problem solving. TheOECD, in coordination with Statistics Canada, willinitiate PIAAC data collection in 2011, and ndingswill be reported in 2013. Four areas o competence will
be assessed in the PIAAC: problem-solving in atechnology-rich environment; literacy; readingcomponent measures; and numeracy.
In 2008, organizations spent an average o $787 peremployee on training, learning and development (TLD)
with two thirds o ull-time employees taking training.This is up rom 2006, when $699 per employee wasspent, but still down rom 1996 when the investmentper employee was $842. Changes are also taking placein the type o learning employees are provided with andinormal learning now accounts or 56 percent o learn-ing, which is up signicantly rom 2004.146
An aging population, and growth in the immigrantlabour orce, may also urther require increasing use onon-traditional sources o skill development and a lie-long approach to learning. Employers and training pro-viders may need to adopt new approaches or specicsegments o the labour orce. In terms o potentialgaps in the uture a recent report by the ConerenceBoard o Canada has identied that “though organiza-tions use TLD to deal with skills shortages, ew see it asa tool to retain and retrain mature workers or integratenew Canadians into their workorce.”147
New trends in lielong learning also have the potentialto change enrolment patterns in universities, collegesand other educational institutions in Canada. Studentscoming out o secondary education may graduallycease to be the primary clientele o tertiary educa-
tion institutions. Universities and colleges may needto organize themselves to accommodate the learningand training needs o a very diverse clientele, whichmay include: working, mature, stay-at-home, travelling,part-time, day, night, and weekend students. TheU.S. is already noticing this change. Almost hal othe student population in the U.S. consists o matureand part-time students, which is a dramatic shitrom the previous generation.148
6.3.15 Human Resources in
Science and TechnologyHuman resources in science and technology (HRST) isdened as persons having graduated at the tertiary levelo education or employed in a science and technologyoccupation or which a high qualication is normallyrequired and the innovation potential is high. The inter-national comparison o HRST share in the labour orce
146 Conerence Board o Canada, How Canada Perorms: A Report Card on Canada, June 2007 .
147 Conerence Board o Canada, How Canada Perorms: A Report Card on Canada, June 2007 , p. I.
148 Tamara Knighton, Filsan Hujaleh, Joe Iacampo and Gugsa Werkneh, Lielong Learning Among Canadians Aged 18 to 64 Years:
First Results rom the 2008 Access and Support to Education and Training Survey , 2009.

8/6/2019 State of the Nation 2010: Imagination to Innovation, Building Canadian Paths to Prosperity
http://slidepdf.com/reader/full/state-of-the-nation-2010-imagination-to-innovation-building-canadian-paths 80/86

8/6/2019 State of the Nation 2010: Imagination to Innovation, Building Canadian Paths to Prosperity
http://slidepdf.com/reader/full/state-of-the-nation-2010-imagination-to-innovation-building-canadian-paths 81/86
Figure 40 Share o Human Resources in Science and Technology (HRST)Employees by Industry, 2007
Source: OECD (2009), Science, Technology and Industry Scoreboard.
Figure 41 Growth o HRST Employees by Industry, 1997–2007
Source: OECD (2009), Science, Technology and Industry Scoreboard 2009 , p. 137.
150 The EU KLEMs database uses the ollowing denitions: High skill — College graduate and above; Medium skill — High school andsome years o college (but not completed); Low skill — Less then high school and some years o high school (but not completed).Due to slight dierences in national classications international comparability may be aected. When comparing, or example,
Canadian, U.S. and EU data there may be an underestimation o ‘high skilled’ data rom the EU.

8/6/2019 State of the Nation 2010: Imagination to Innovation, Building Canadian Paths to Prosperity
http://slidepdf.com/reader/full/state-of-the-nation-2010-imagination-to-innovation-building-canadian-paths 82/86
State of the nation 2010
72
Figure 42 Researchers, 2007 and Growth o Business Researchers, 1997–2007
Researchers, 2007 Growth o Business Researchers, 1997–2007
Source: OECD (2009), Science, Technology and Industry Scoreboard 2009 , p. 41.(http://dx.doi.org/10.1787/742515411553) and
(http://dx.doi.org/10.1787/742528481768)

8/6/2019 State of the Nation 2010: Imagination to Innovation, Building Canadian Paths to Prosperity
http://slidepdf.com/reader/full/state-of-the-nation-2010-imagination-to-innovation-building-canadian-paths 83/86
Figure 43 Share o Total Hours Worked by Skill Level, Canada,United States and EU15ex*, 2004
* EU15ex consists o Austria, Belgium, Denmark, F inland, France, Germany, Italy, Netherlands, Spain and the United KingdomSource: Compilation by STIC Secretariat based on data rom EU KLEMS
Canada United States EU15ex
Industry or SECTOR HighSkill
MediumSkill
High Skill MediumSkill
High Skill MediumSkill
GOODS SECTOR
AGRICULTURE, FORESTRY, FISHINGAND HUNTING SECTOR
5.22 81.14 15.03 61.55 3.70 61.59
MINING ANDQUARRYING SECTOR
13.31 84.55 20.57 66.60 11.83 69.76
UTILITIES SECTOR 20.87 78.65 32.18 64.90 12.78 72.75
CONSTRUCTION SECTOR 6.89 88.48 11.68 66.68 4.72 66.12
MANUFACTURING SECTOR 15.72 79.39 23.15 63.01 9.04 68.95
SERVICES SECTORSale, maintenance and repair omotor vehicles and motorcycles;retail sale o uel industries
4.65 89.73 11.30 74.29 6.14 71.53
Wholesale trade and commissiontrade, except o motor vehiclesand motorcycles industries
17.79 79.95 29.74 62.49 6.39 72.37
Retail trade, except o motorvehicles and motorcycles; repairo household goods industries
11.41 85.75 20.26 68.92 6.01 70.33
Hotels and restaurants industries 9.44 86.02 12.90 65.21 5.10 69.57
Transport and storage industries 9.69 85.69 18.54 69.64 5.95 71.90Post and telecommunicationsindustries
19.88 78.85 42.04 56.43 12.06 71.13
Financial intermediation industries 32.60 66.98 44.35 53.91 22.56 71.10
Real estate activities industries 21.14 76.14 37.82 56.54 26.12 55.47
Renting o M&E and otherbusiness activities industries
45.50 53.98 47.31 46.75 29.98 54.27
Public administration and deence;compulsory social security industries
40.22 58.79 30.71 66.16 19.68 67.58
Education industries 41.57 57.45 68.54 29.05 47.52 44.32
Health and social work industries 35.65 62.78 39.50 55.83 19.90 66.30
Other community, social and per-sonal services industries
23.60 73.68 32.43 58.99 14.75 62.38
Private households with employedpersons industries
7.86 88.57 8.34 58.31 6.59 72.18
AVERAGE FOR SERVICE SECTOR 22.93 74.60 31.70 58.75 16.34 65.75
Average o all Industriesand Sectors
20.16 76.66 28.76 60.28 14.26 66.30

8/6/2019 State of the Nation 2010: Imagination to Innovation, Building Canadian Paths to Prosperity
http://slidepdf.com/reader/full/state-of-the-nation-2010-imagination-to-innovation-building-canadian-paths 84/86
While investment in ICT by Canadian industries gener-ally lags such investments in other countries, someCanadian sectors, such as the nance and insurancesector and the mining and quarrying sector, seem topurchase more IT services compared with the samesectors in other countries. Some companies may
benet rom ICTs through the purchase o IT services,as well as investment in ICT capital. This indicatorbears watching.
Industry clusters are a promising area or building pathsor knowledge transer and product development.Large companies play a smaller role in unding R&D inCanada than in other leading innovative countries. Thismay indicate a weak receptor capacity or spotting andusing R&D or inadequate consideration o innovationopportunities in corporate strategies. Small technologyintensive companies have strong receptor capacity andcould benet rom the marketing and nancing know-how in large companies. Both large and small compan-ies can source talent and ideas by building strategicrelationships with higher education institutions andwith each other.
Current best eorts are not getting us to where wewant to be. Looking ahead to a period o govern-ment restraint around the globe, Canada has the bestopportunities to move orward provided industry seizesleadership in doing so. The job o those who partnerwith industry (including governments and higher edu-cation and research institutions) is to enable perorm-
ance gains by adapting, consolidating and simpliyingthe policy instruments and mechanisms or collaborat-ing with the private sector on innovation. The 2012
State o the Nation report will measure the outcomeso these eorts.
An excellent talent pool and increased eorts bygovernment, higher education and some industriesare not preventing stagnation in Canada’s overallinnovation perormance. This assessment is based onan evaluation o indicators that measure more thanR&D expenditure and is refected in slowing productiv-ity growth in many industries.
Despite an overall economic perormance the past two
years that has exceeded that o its major trading part-ners, the current level o eort by all perorming sectorshas not been sucient to bring Canada’s expenditures inR&D to the G7 average. As a country we have seenour R&D to GDP ratio decline. Expenditures on R&D inChina and Korea have outpaced strong GDP growthin those countries (Figure 2).
In real terms, R&D expenditures by the higher educa-tion sector have been increasing. Funding to highereducation is the largest component o ederal R&Dexpenditures and this component continues to increase
in real terms (Figure 7).
Canada’s low private sector research and developmentparticipation limits overall innovation perormance.While higher education R&D continues to increase,business R&D expenditures have been decreasing inreal terms since 2006 (Figure 4). Canada’s businessR&D spending in many industries is also low by inter-national standards. OECD data in 2005 indicate that,in 8 o 16 industries it tracks, Canadian businesses’perormance o R&D alls below the OECD averagein the same industry. Canada’s lagging business R&D
is a unction o both its industrial structure, in whichresearch-based industries comprise a relatively smallpart o the economy, and o the relatively lower R&Dexpenditures o other industries.
Canadian industry also tends to invest signicantly lessin ICT equipment than selected comparator countries —exceptions being in utilities, post and telecommunica-tions, wood manuacturing, and public administrationand deence. R&D and investment in ICT both contrib-ute to productivity-enhancing innovation.
Conclusion7
74
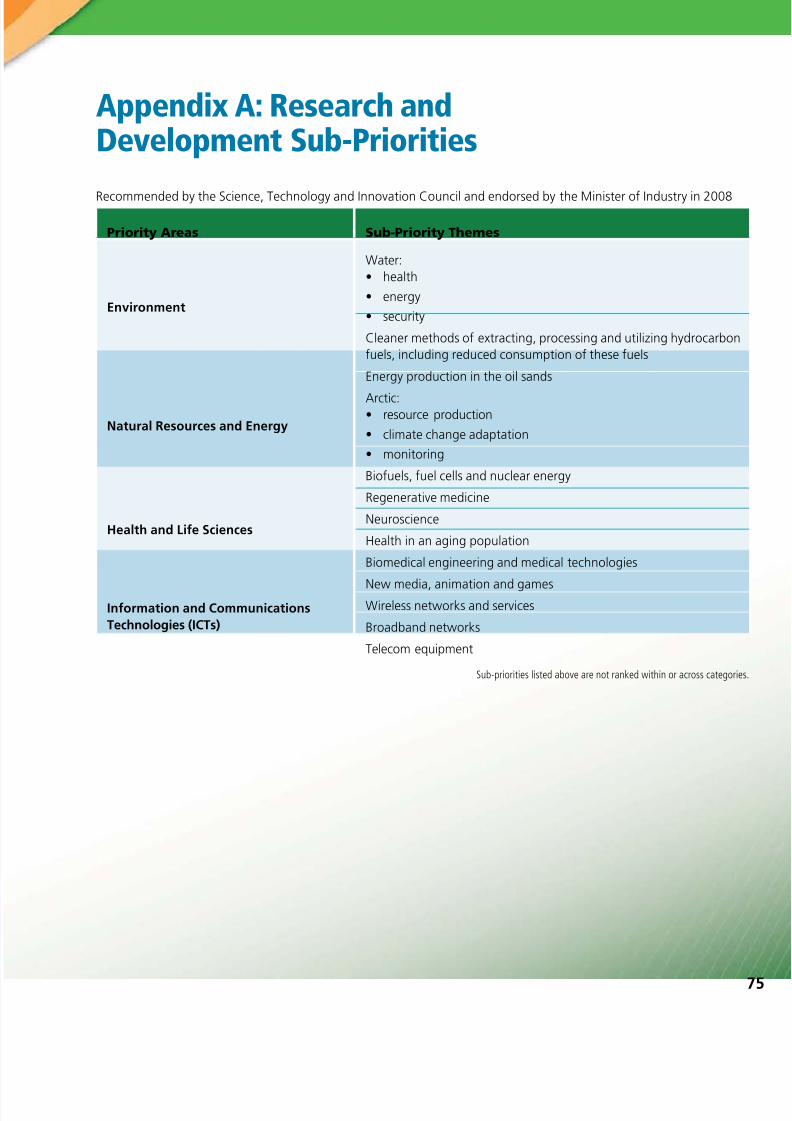
8/6/2019 State of the Nation 2010: Imagination to Innovation, Building Canadian Paths to Prosperity
http://slidepdf.com/reader/full/state-of-the-nation-2010-imagination-to-innovation-building-canadian-paths 85/86
Appendix A: Research andDevelopment Sub-Priorities
Recommended by the Science, Technology and Innovation Council and endorsed by the Minister o Industry in 2008
Sub-priorities listed above are not ranked within or across categorie
Priority Areas Sub-Priority Themes
Environment
Water: • health
• energy
• security
Cleaner methods o extracting, processing and utilizing hydrocarbonuels, including reduced consumption o these uels
Natural Resources and Energy
Energy production in the oil sands
Arctic:• resource production
• climate change adaptation
• monitoring
Biouels, uel cells and nuclear energy
Health and Lie Sciences
Regenerative medicine
Neuroscience
Health in an aging population
Biomedical engineering and medical technologies
Inormation and CommunicationsTechnologies (ICTs)
New media, animation and gamesWireless networks and services
Broadband networks
Telecom equipment

8/6/2019 State of the Nation 2010: Imagination to Innovation, Building Canadian Paths to Prosperity
http://slidepdf.com/reader/full/state-of-the-nation-2010-imagination-to-innovation-building-canadian-paths 86/86
State of the nation 2010
Business innovation
• Canadian companies do not invest as much astheir competitors around the world in R&D. Wehave made little progress in understanding whythese competitors are more likely to see investmentsin the lab and on the shop foor as contributing totheir business goals. This understanding is unda-mental to evaluating the ecacy o policy instru-ments to stimulate innovation.
• How Canadian technology companies nance theirventures and the availability o dierent sources o
risk capital at dierent stages o business develop-ment can have a signicant impact on commer-cialization success. Business associations and theventure capital industry can assist in the under-standing o this area.
Tracking progress
• More resources and greater eort must be devotedwithin the innovation system to capturing data,which better explain how individuals, companiesand other institutions innovate. This can be donethrough business R&D and innovation surveys,sector-specic technology surveys and user surveyson inormation technologies and their applications.Without the tools to understand how innovationhappens, we will be unable to ormulateappropriate strategies or improvinginnovation perormance.
All participants in the innovation system have arole to play in strengthening Canada’s innovationcapabilities. In the STIC’s view, Canada has strong
Talent — developing a highly qualifed work-orce attuned to innovation opportunities
• Young Canadians are excelling in science, math-ematics and reading in comparison to their peersaround the world, ranking in the top ve in eacho these categories. We must keep up with otherswho are improving their rankings.
• In comparison to those in other OECD countries,ew Canadian students are completing master’sand doctoral programs in areas that drive discov-ery and innovation. Companies, governments,
and universities can encourage more Canadians tocomplete advanced degrees by educating studentson the range o S&T careers and providing stu-dents with career opportunities in S&T develop-ment, application, management and nancing.
• Canadians in the workplace who apply and adaptnew technologies can drive innovation to newlevels. Canada has not made progress in a decadein increasing the proportion o Canadians withbasic literacy and numeracy skills. Governmentsand employers must champion adult literacy andtechnology training to address this skills decit.
Knowledge development and transer
• In Canada, governments at dierent levels andthe private sector have chosen to build researchcapacity at institutions o higher learning. Focusingresources o all sectors on research priorities,conducting research at international levels oexcellence and better using research acilities atuniversities and colleges to train students in state-o the art acilities can help improve innovation
Appendix B: State of the Nation 2008 Areas or Attention