State of the art of biofuel production and utilization in Indonesia Kamaruddin Abdullah Laboratory...
46
State of the art of State of the art of biofuel production biofuel production and utilization in and utilization in Indonesia Indonesia Kamaruddin Abdullah Kamaruddin Abdullah Laboratory of Energy and Agricultural Laboratory of Energy and Agricultural Electrification, Electrification, Department of Agricultural Engineering, Department of Agricultural Engineering, Bogor Agricultural University (IPB) Bogor Agricultural University (IPB) / Also working now at Darma Persada / Also working now at Darma Persada University, Jakarta University, Jakarta e-mail: <[email protected]>. e-mail: <[email protected]>.
-
date post
20-Dec-2015 -
Category
Documents
-
view
215 -
download
0
Transcript of State of the art of biofuel production and utilization in Indonesia Kamaruddin Abdullah Laboratory...

State of the art of biofuel State of the art of biofuel production and utilization in production and utilization in
Indonesia Indonesia Kamaruddin AbdullahKamaruddin Abdullah
Laboratory of Energy and Agricultural Electrification,Laboratory of Energy and Agricultural Electrification,Department of Agricultural Engineering,Department of Agricultural Engineering,
Bogor Agricultural University (IPB)Bogor Agricultural University (IPB)/ Also working now at Darma Persada University, / Also working now at Darma Persada University,
JakartaJakartae-mail: <[email protected]>.e-mail: <[email protected]>.
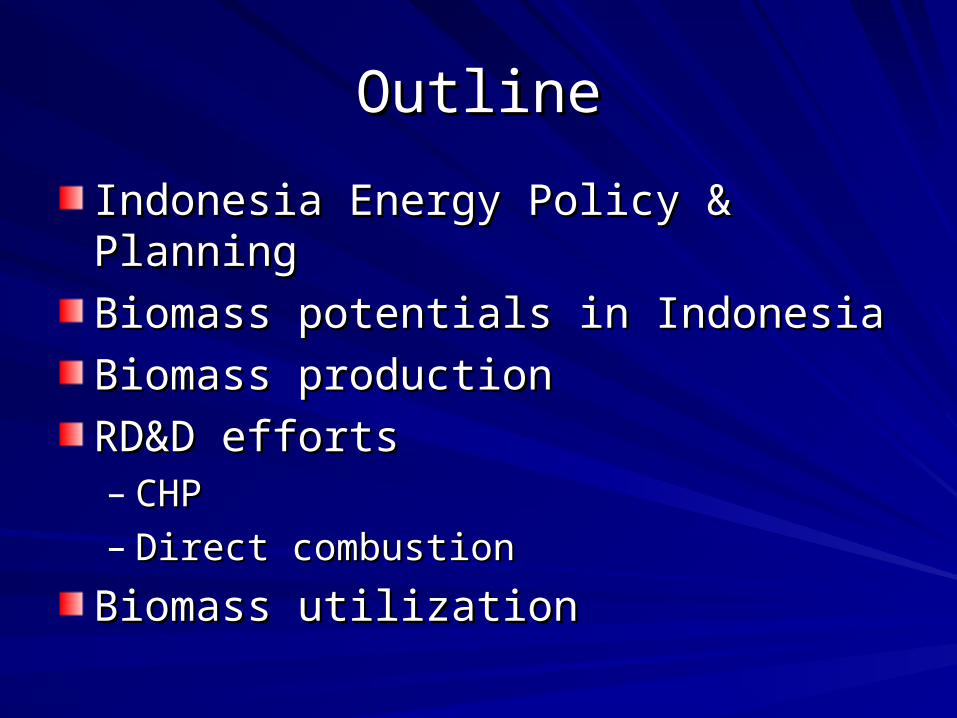
OutlineOutline
Indonesia Energy Policy & PlanningIndonesia Energy Policy & Planning
Biomass potentials in IndonesiaBiomass potentials in Indonesia
Biomass productionBiomass production
RD&D effortsRD&D efforts– CHPCHP– Direct combustionDirect combustion
Biomass utilizationBiomass utilization

Conservation scenario, ALGAS,1998
Deregulation scenario, ALGAS, 1998
MARKAL model projection, BATAN,2004
Legend:
BP-PEN 2005-2025 Projection
on primary energy demand (MEMR, 2005)
MBOE
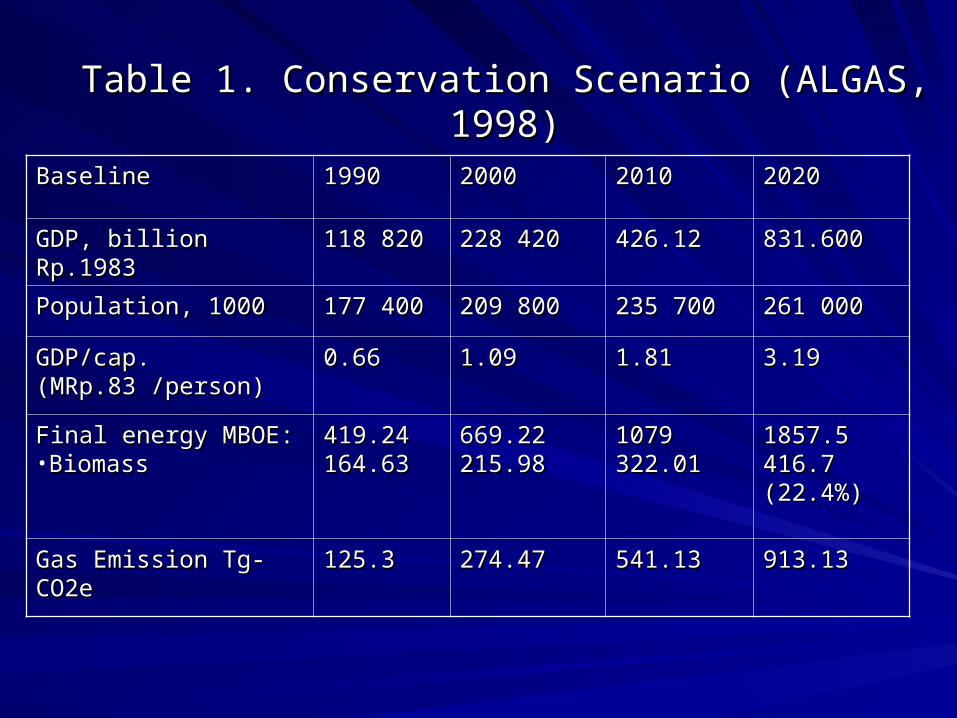
Table 1. Conservation Scenario (ALGAS, 1998)Table 1. Conservation Scenario (ALGAS, 1998)
BaselineBaseline 19901990 20002000 20102010 20202020
GDP, billion Rp.1983GDP, billion Rp.1983 118 820118 820 228 420228 420 426.12 426.12 831.600831.600
Population, 1000Population, 1000 177 400177 400 209 800209 800 235 700235 700 261 000261 000
GDP/cap. (MRp.83 GDP/cap. (MRp.83 /person)/person)
0.660.66 1.091.09 1.811.81 3.193.19
Final energy MBOE:Final energy MBOE:•BiomassBiomass
419.24419.24164.63164.63
669.22669.22215.98215.98
10791079322.01322.01
1857.51857.5416.7416.7(22.4%)(22.4%)
Gas Emission Tg-CO2eGas Emission Tg-CO2e 125.3125.3 274.47274.47 541.13541.13 913.13913.13

Biomass energyBiomass energy
Solid fuel:Solid fuel:– Fuel woodFuel wood– CharcoalCharcoal– BriquetteBriquette– PelletPellet
Liquid fuel: Bio-diesel, Bio-ethanol, Bio-Liquid fuel: Bio-diesel, Bio-ethanol, Bio-kerosenekerosene
Gaseous fuels: Gasification, biogasGaseous fuels: Gasification, biogas

Advantages and constraintsAdvantages and constraints
AdvantagesAdvantagesEconomyEconomyWood and other types of biomass are widely used as fuels in the Wood and other types of biomass are widely used as fuels in the (private) domestic and industrial sectors, basically because they are (private) domestic and industrial sectors, basically because they are cheaper than other fuels. Local availability and reliability of supply cheaper than other fuels. Local availability and reliability of supply add to the economic advantages. Modern applications in both add to the economic advantages. Modern applications in both industrialised countries and in South-East Asia have demonstrated industrialised countries and in South-East Asia have demonstrated that biomass energy can also be competitive for larger-scale that biomass energy can also be competitive for larger-scale industrial applications. For fuel-importing countries, the use of local industrial applications. For fuel-importing countries, the use of local biomass can save substantial amounts of foreign exchange. The biomass can save substantial amounts of foreign exchange. The value of woodfuels currently being used in ASEAN economies is value of woodfuels currently being used in ASEAN economies is equivalent to an estimated US$ 7 billion annually. equivalent to an estimated US$ 7 billion annually.

Advantage-ContdAdvantage-Contd
EnvironmentEnvironment
The sustainable use of biomass energy sources helps to The sustainable use of biomass energy sources helps to manage the local environment. When wood and other manage the local environment. When wood and other biomass are properly valued by local populations as an biomass are properly valued by local populations as an important resource base, they are more likely to be important resource base, they are more likely to be protected. Sustainable use of biomass is also beneficial protected. Sustainable use of biomass is also beneficial for the global climate, because it is carbon-neutral, for the global climate, because it is carbon-neutral, whereas substitution by fossil fuels would add to the whereas substitution by fossil fuels would add to the greenhouse effect. This is the main reason why many greenhouse effect. This is the main reason why many industrialized countries have embarked upon policies for industrialized countries have embarked upon policies for increasing the share of biomass in national energy increasing the share of biomass in national energy consumption. consumption.

Rural incomeRural income
The use of wood and some other forms of The use of wood and some other forms of biomass energy generates at least 20 times biomass energy generates at least 20 times more local employment within the national more local employment within the national economy than any other form of energy, per unit. economy than any other form of energy, per unit. A large amount of unskilled labour is engaged in A large amount of unskilled labour is engaged in growing, harvesting, processing, transporting growing, harvesting, processing, transporting and trading the fuels, which generates off-farm and trading the fuels, which generates off-farm income for rural populations, either regularly or income for rural populations, either regularly or off-season. off-season. Policy makers in the European Union are Policy makers in the European Union are increasingly coming to recognise the increasingly coming to recognise the employment benefits for their own countries. employment benefits for their own countries.
AdvantagesAdvantages
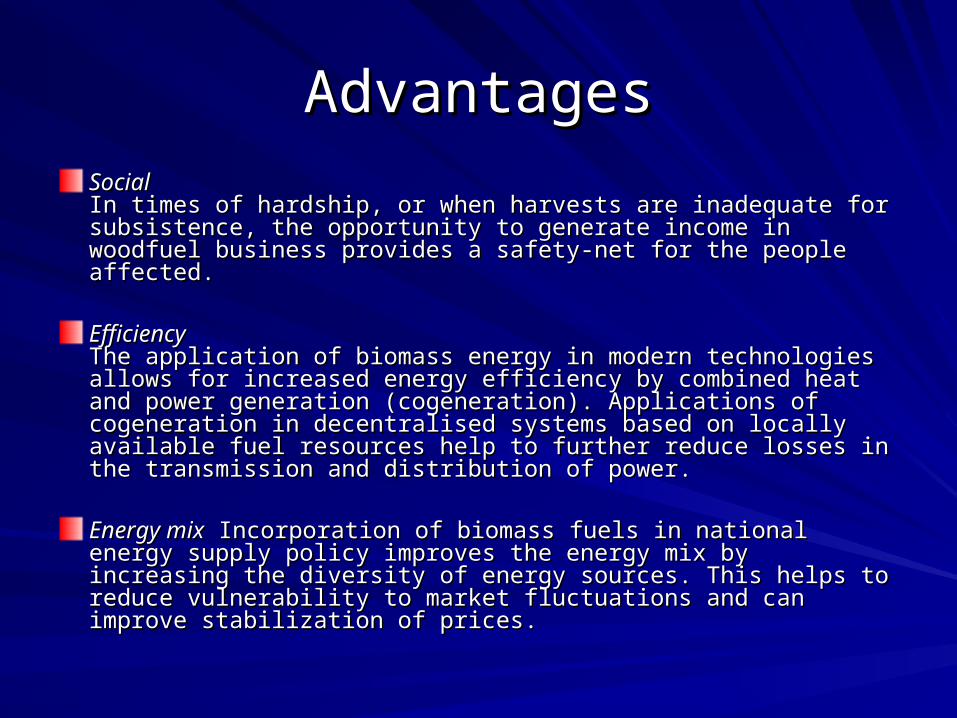
SocialSocialIn times of hardship, or when harvests are inadequate for In times of hardship, or when harvests are inadequate for subsistence, the opportunity to generate income in woodfuel subsistence, the opportunity to generate income in woodfuel business provides a safety-net for the people affected. business provides a safety-net for the people affected.
EfficiencyEfficiencyThe application of biomass energy in modern technologies allows The application of biomass energy in modern technologies allows for increased energy efficiency by combined heat and power for increased energy efficiency by combined heat and power generation (cogeneration). Applications of cogeneration in generation (cogeneration). Applications of cogeneration in decentralised systems based on locally available fuel resources decentralised systems based on locally available fuel resources help to further reduce losses in the transmission and distribution of help to further reduce losses in the transmission and distribution of power. power.
Energy mixEnergy mix Incorporation of biomass fuels in national energy supply Incorporation of biomass fuels in national energy supply policy improves the energy mix by increasing the diversity of energy policy improves the energy mix by increasing the diversity of energy sources. This helps to reduce vulnerability to market fluctuations sources. This helps to reduce vulnerability to market fluctuations and can improve stabilization of prices. and can improve stabilization of prices.
ConstraintsConstraints
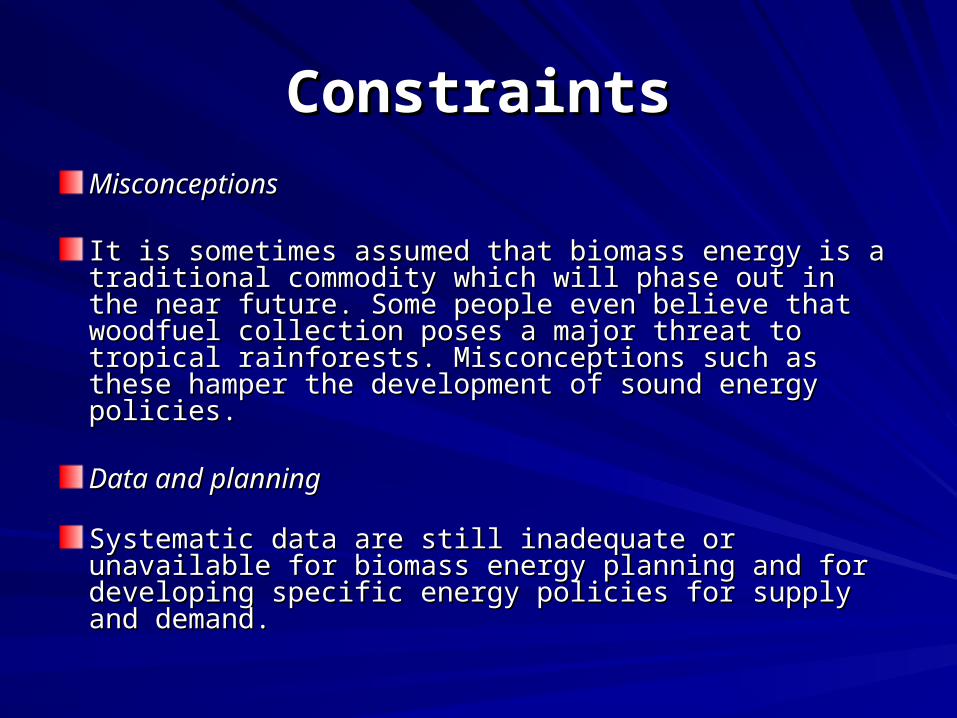
MisconceptionsMisconceptions
It is sometimes assumed that biomass energy is a It is sometimes assumed that biomass energy is a traditional commodity which will phase out in the near traditional commodity which will phase out in the near future. Some people even believe that woodfuel future. Some people even believe that woodfuel collection poses a major threat to tropical rainforests. collection poses a major threat to tropical rainforests. Misconceptions such as these hamper the development Misconceptions such as these hamper the development of sound energy policies. of sound energy policies.
Data and planningData and planning
Systematic data are still inadequate or unavailable for Systematic data are still inadequate or unavailable for biomass energy planning and for developing specific biomass energy planning and for developing specific energy policies for supply and demand. energy policies for supply and demand.
TechnologiesTechnologies
Technologies for biomass combustion Technologies for biomass combustion which are at present widely used in which are at present widely used in ASEAN economies still need to be ASEAN economies still need to be improved towards best practice. improved towards best practice.
Financial, institutional and legal issues Financial, institutional and legal issues have to be resolved to make the best use have to be resolved to make the best use of available technologies. of available technologies.

Biomass resourcesBiomass resources
Biomass wastes:Biomass wastes:– Rice husks, saw dusts and other wood mill Rice husks, saw dusts and other wood mill
wastes, oil palm wastes, sugar mill wasteswastes, oil palm wastes, sugar mill wastes
Biomass plantation:Biomass plantation:– JatrophaJatropha– Oil PalmOil Palm

Palm oil Production in IndonesiaPalm oil Production in Indonesia
YearYear Production (thousand. tons)Production (thousand. tons)
20002000 67006700
20012001 69356935
20022002 72477247
20032003 76097609
20042004 79907990
20052005 83908390
20062006 88098809
20072007 92509250
20082008 97129712
20092009 1019810198
20102010 1070810708

Wastes potential for energyWastes potential for energy
9%
54%
37%
Sumatera590 MWe
Kalimantan230 MWe
Java 280 MWe
Bali and Nusa Tenggara
Sulawesi60 MWe
Irian Jaya
Maluku
11%
13%
40%
29%
7%
Plymills
Sawmills
Sugar mills
Palm oil mills
Rice mills
56%33%
6% 5% 5%16%
48%
31%
ZREU, 2000, C. Budiono, 2002

Biomass wastes (ZREU, 2000)Biomass wastes (ZREU, 2000)Biomass Main region Production
[million t/year]Technical energy
potential[million GJ/year]
Remarks
Rubber wood Sumatera, Kalimantan, Java
41(replanting)
120 small logs <10 cmbig and medium logs are used as fire wood in brick and roof tile industry: price 20,000 – 30,000 IDR/m³
Logging residues Sumatera, Kalimantan
4.5 19
Sawn timber residues Sumatera, Kalimantan
1.3 13 Residues of the factories are often used as fire wood by local communities, residues available for free
Plywood and veneer production residues
Kalimantan, Sumatera, Java, Irian Jaya, Maluku
1.5 16 Residues are generally used, yet
Sugar residues Java, Sumatera, South Kalimantan
Bagasse: 10cane tops: 4
cane leaves: 9.6
78 Bagasse is generally used in sugar factories (90 %)The use of cane tops and leaves needs to be investigated
Rice residues Java, Sumatera, Sulawesi, Kalimantan, Bali/Nusa Tenggara
Husk: 12bran 2.5stalk: 2
straw: 49
150 Stalk and straw are generated at the field and generally burnt, in some areas used for feeding or raw material for paper industryHusks often burnt uncontrolled
Coconut residues Sumatera, Java, Sulawesi
Shell: 0.4husk: 0.7
7 Residues are generated decentralized and usually left on the plantation fieldLargely used as fire wood and for the production of charcoal
Palm oil residues Sumateranew areas: Kalimantan, Sulawesi, Maluku, Nusa Tenggara, Irian Jaya
Empty fruit bunches: 3.4
Fibers: 3.6palm shells: 1.2
67
Palm shells and fibres are common fuel sources, EFB are generally incinerated
Fossil fuel substitution planFossil fuel substitution plan
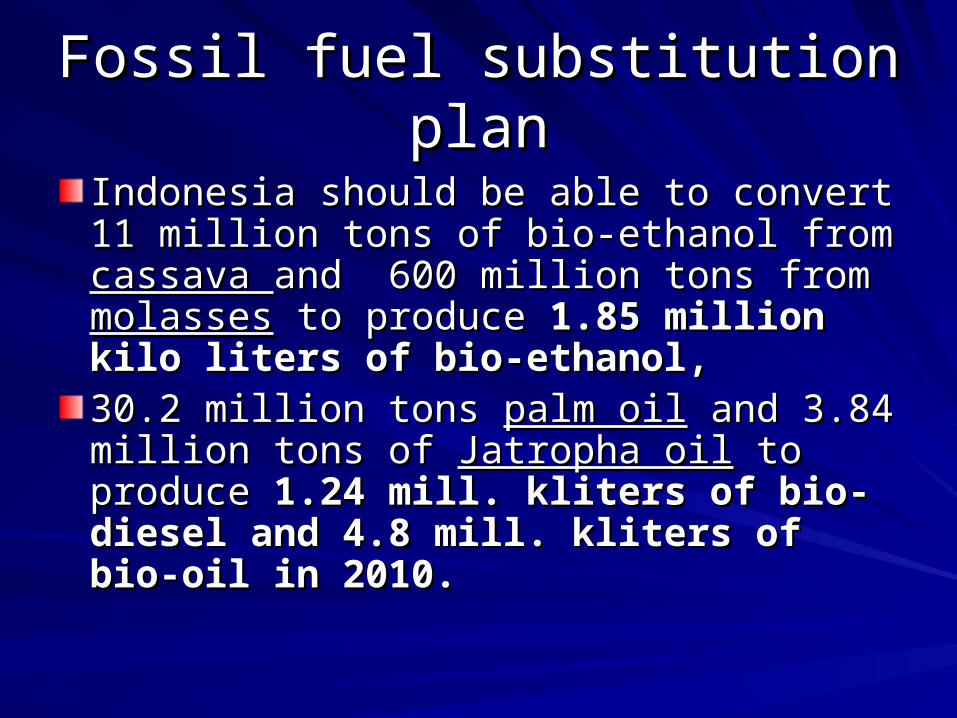
Indonesia should be able to convert 11 Indonesia should be able to convert 11 million tons of bio-ethanol from million tons of bio-ethanol from cassava cassava and 600 million tons from and 600 million tons from molassesmolasses to to produce produce 1.85 million kilo liters of bio-1.85 million kilo liters of bio-ethanol, ethanol, 30.2 million tons 30.2 million tons palm oilpalm oil and 3.84 million and 3.84 million tons of tons of Jatropha oilJatropha oil to produce to produce 1.24 mill. 1.24 mill. kliters of bio-diesel and 4.8 mill. kliters kliters of bio-diesel and 4.8 mill. kliters of bio-oil in 2010.of bio-oil in 2010.
Indonesia Bio-fuel programIndonesia Bio-fuel program
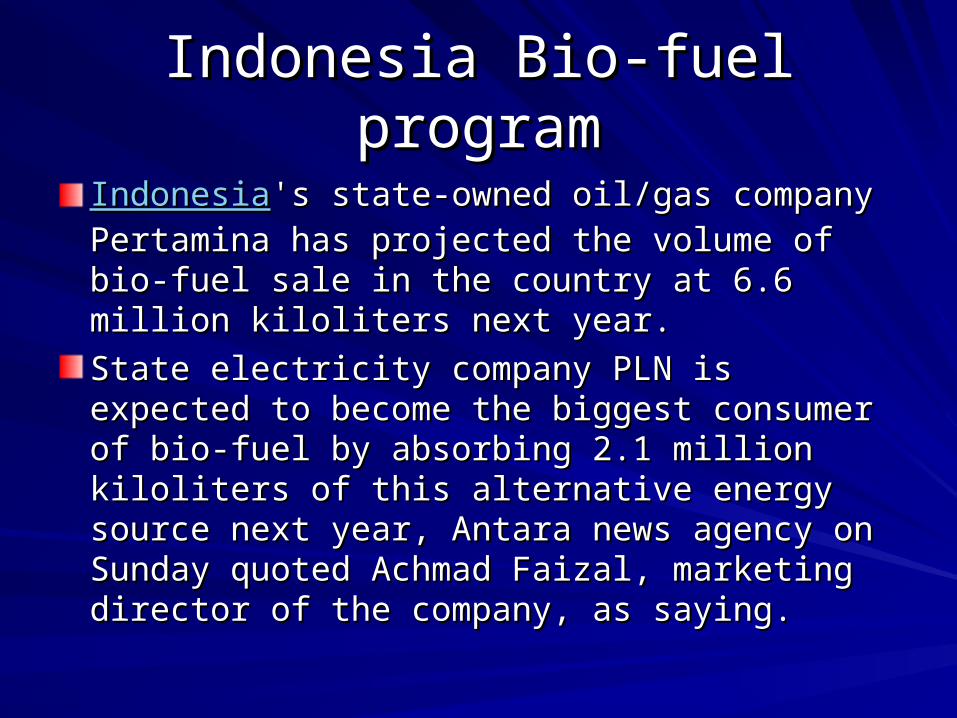
IndonesiaIndonesia's state-owned oil/gas company 's state-owned oil/gas company Pertamina has projected the volume of bio-fuel Pertamina has projected the volume of bio-fuel sale in the country at 6.6 million kiloliters next sale in the country at 6.6 million kiloliters next year. year.
State electricity company PLN is expected to State electricity company PLN is expected to become the biggest consumer of bio-fuel by become the biggest consumer of bio-fuel by absorbing 2.1 million kiloliters of this alternative absorbing 2.1 million kiloliters of this alternative energy source next year, Antara news agency energy source next year, Antara news agency on Sunday quoted Achmad Faizal, marketing on Sunday quoted Achmad Faizal, marketing director of the company, as saying. director of the company, as saying.

Bio-diesel, Bio-ethanol blendsBio-diesel, Bio-ethanol blends
B-10: 10% bio-diesel, 90% diesel (plan 5-B-10: 10% bio-diesel, 90% diesel (plan 5-20%)20%)
E-5: 5% bio-ethanol, 95 %, gasoline (plan E-5: 5% bio-ethanol, 95 %, gasoline (plan 5-20%)5-20%)

National plant for bio-fuel (2006-2010)National plant for bio-fuel (2006-2010)
1.5 mil ha of oil palm1.5 mil ha of oil palm
} B-10 (1.24 mill. Kliter) } B-10 (1.24 mill. Kliter)
1.5 mill. Ha of jatropha1.5 mill. Ha of jatropha
1.5 mil ha of cassava1.5 mil ha of cassava
} E-10 (1.85 mill. Kliter) } E-10 (1.85 mill. Kliter)
.75 mill. Ha of sugarcane.75 mill. Ha of sugarcane
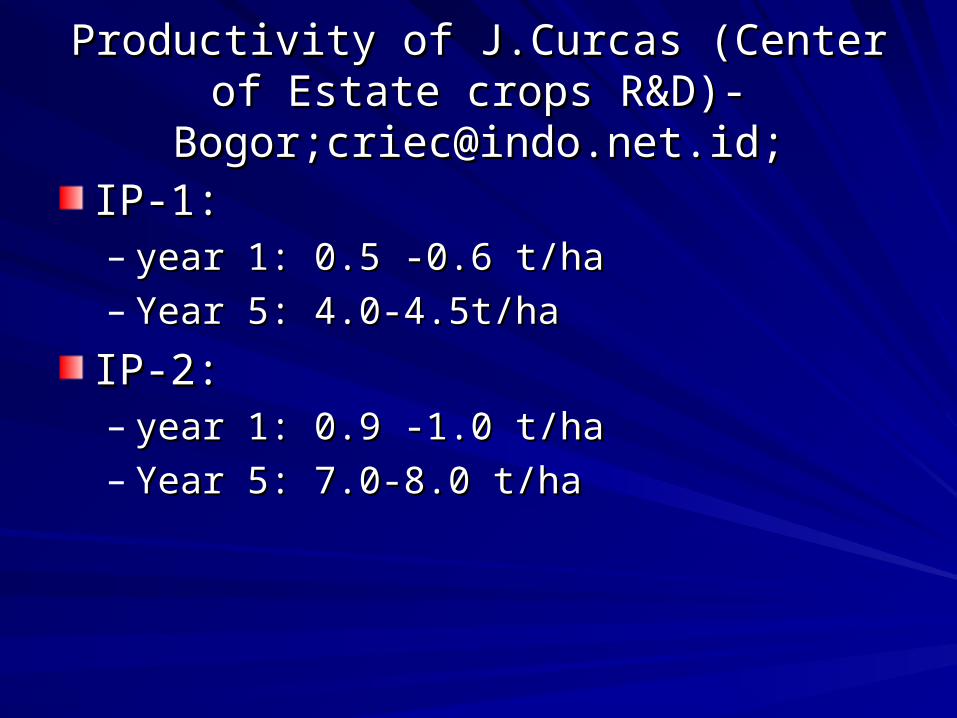
Productivity of J.Curcas (Center of Estate Productivity of J.Curcas (Center of Estate crops R&D)-Bogor;[email protected];crops R&D)-Bogor;[email protected];
IP-1: IP-1: – year 1: 0.5 -0.6 t/hayear 1: 0.5 -0.6 t/ha– Year 5: 4.0-4.5t/haYear 5: 4.0-4.5t/ha
IP-2:IP-2:– year 1: 0.9 -1.0 t/hayear 1: 0.9 -1.0 t/ha– Year 5: 7.0-8.0 t/haYear 5: 7.0-8.0 t/ha

Bio-fuel programBio-fuel program
The industrial sector, believed to be the second The industrial sector, believed to be the second biggest bio- fuel consumer in Indonesia, is biggest bio- fuel consumer in Indonesia, is expected to use 1.65 million kiloliters of bio-expected to use 1.65 million kiloliters of bio-diesel and 850,000 kiloliters of bio-premium. diesel and 850,000 kiloliters of bio-premium. The Indonesian government has begun The Indonesian government has begun implementing a bio-fuel development program in implementing a bio-fuel development program in 2006, and in this connection, Pertamina 2006, and in this connection, Pertamina introduced its bio-diesel under a brand name of introduced its bio-diesel under a brand name of 'Biosolar' on the market on May 20, 2006, and 'Biosolar' on the market on May 20, 2006, and bio-ethanol under a brand name of ' Biopremium' bio-ethanol under a brand name of ' Biopremium' on August 12. on August 12.
Bio-fuel demandBio-fuel demand
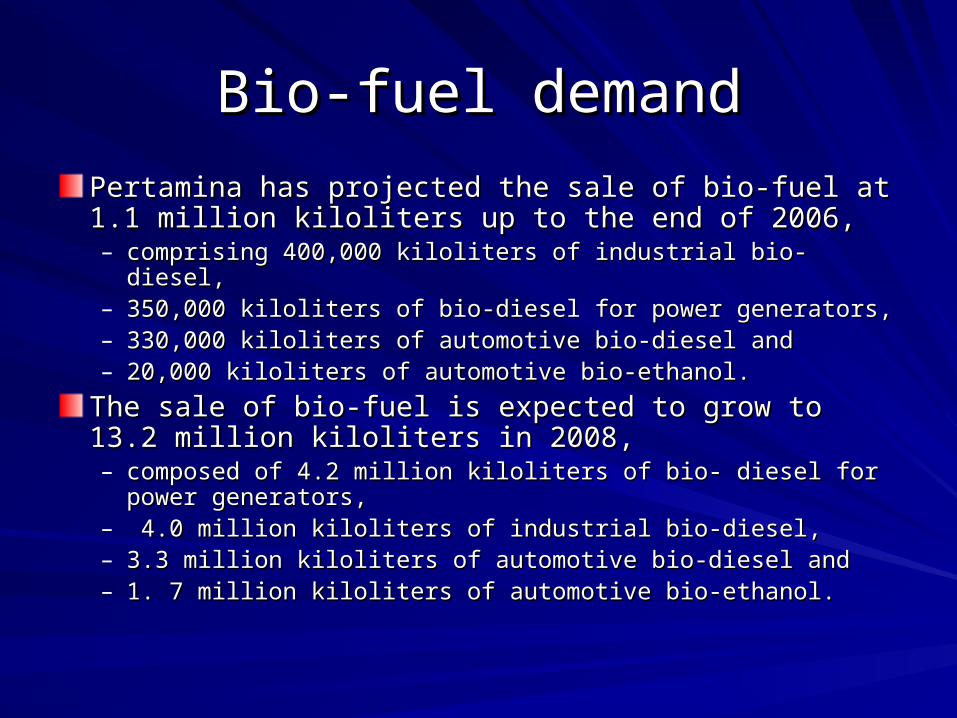
Pertamina has projected the sale of bio-fuel at 1.1 million Pertamina has projected the sale of bio-fuel at 1.1 million kiloliters up to the end of 2006, kiloliters up to the end of 2006, – comprising 400,000 kiloliters of industrial bio-diesel,comprising 400,000 kiloliters of industrial bio-diesel,– 350,000 kiloliters of bio-diesel for power generators,350,000 kiloliters of bio-diesel for power generators,– 330,000 kiloliters of automotive bio-diesel and 330,000 kiloliters of automotive bio-diesel and – 20,000 kiloliters of automotive bio-ethanol. 20,000 kiloliters of automotive bio-ethanol.
The sale of bio-fuel is expected to grow to 13.2 million The sale of bio-fuel is expected to grow to 13.2 million kiloliters in 2008, kiloliters in 2008, – composed of 4.2 million kiloliters of bio- diesel for power composed of 4.2 million kiloliters of bio- diesel for power
generators,generators,– 4.0 million kiloliters of industrial bio-diesel, 4.0 million kiloliters of industrial bio-diesel, – 3.3 million kiloliters of automotive bio-diesel and 3.3 million kiloliters of automotive bio-diesel and – 1. 7 million kiloliters of automotive bio-ethanol. 1. 7 million kiloliters of automotive bio-ethanol.
Bio-fuel demandBio-fuel demand
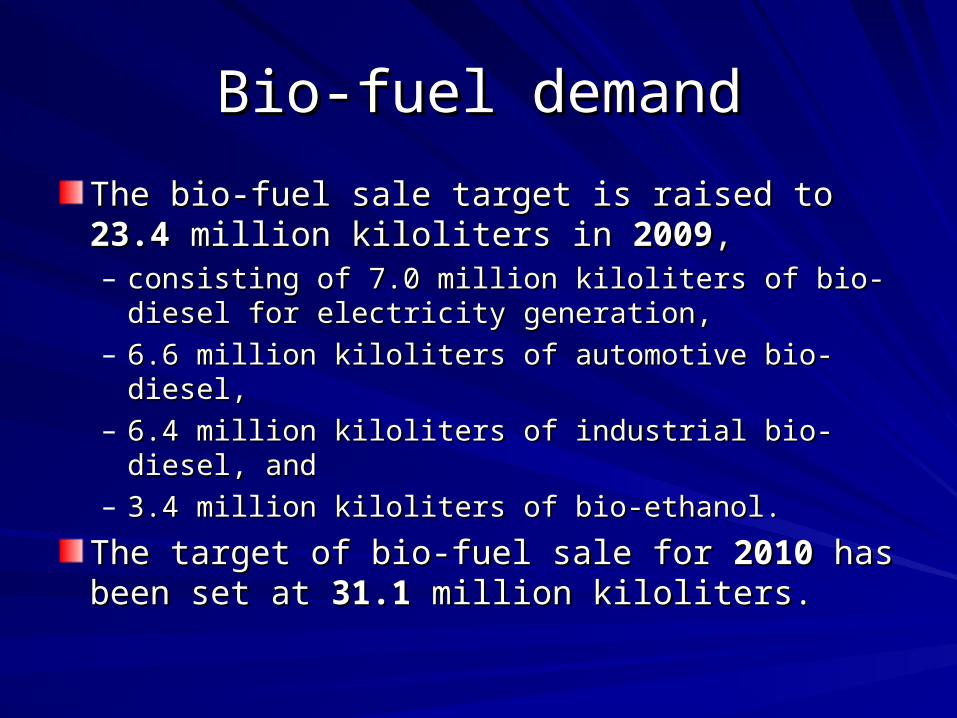
The bio-fuel sale target is raised to The bio-fuel sale target is raised to 23.423.4 million million kiloliters in kiloliters in 20092009, , – consisting of 7.0 million kiloliters of bio-diesel for consisting of 7.0 million kiloliters of bio-diesel for
electricity generation, electricity generation, – 6.6 million kiloliters of automotive bio- diesel,6.6 million kiloliters of automotive bio- diesel,– 6.4 million kiloliters of industrial bio-diesel, and 6.4 million kiloliters of industrial bio-diesel, and – 3.4 million kiloliters of bio-ethanol. 3.4 million kiloliters of bio-ethanol.
The target of bio-fuel sale for The target of bio-fuel sale for 20102010 has been set has been set at at 31.131.1 million kiloliters. million kiloliters.

Semi-mechanic briquette machineSemi-mechanic briquette machine
Rice husk charcoal briquette
Rice husk charcoal briquette

Rice husk briquette
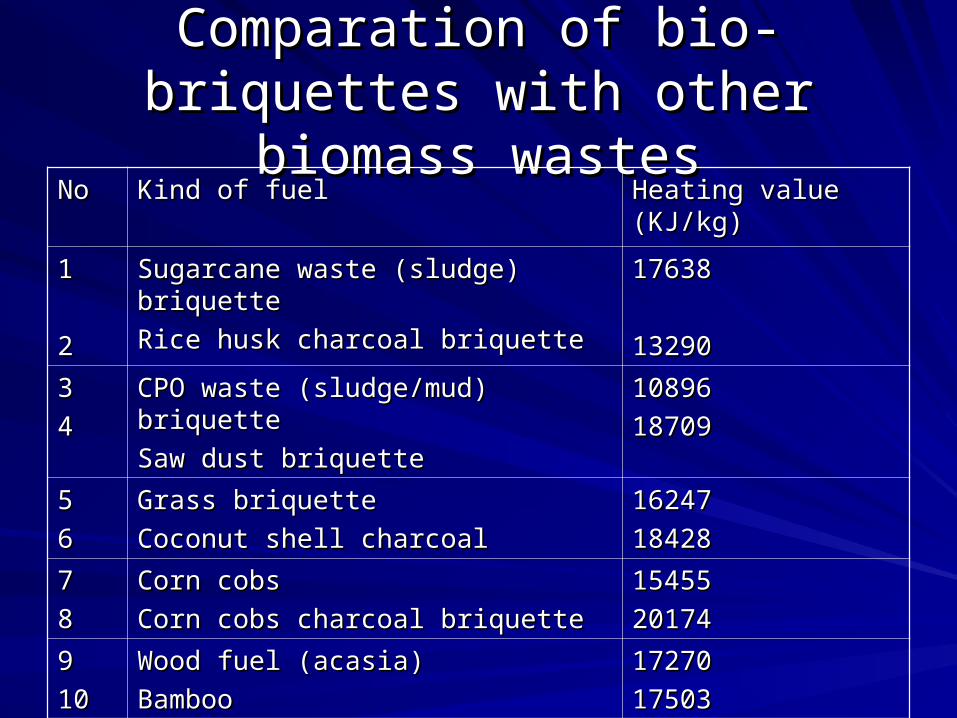
Comparation of bio-briquettes with Comparation of bio-briquettes with other biomass wastesother biomass wastes
NoNo Kind of fuelKind of fuel Heating value (KJ/kg)Heating value (KJ/kg)
11
22
Sugarcane waste (sludge) briquetteSugarcane waste (sludge) briquette
Rice husk charcoal briquetteRice husk charcoal briquette
1763817638
1329013290
33
44
CPO waste (sludge/mud) briquetteCPO waste (sludge/mud) briquette
Saw dust briquetteSaw dust briquette
1089610896
1870918709
55
66
Grass briquetteGrass briquette
Coconut shell charcoalCoconut shell charcoal
1624716247
1842818428
77
88
Corn cobsCorn cobs
Corn cobs charcoal briquetteCorn cobs charcoal briquette
1545515455
2017420174
99
1010
Wood fuel (acasia)Wood fuel (acasia)
BambooBamboo
1727017270
1750317503

Biomass stoveBiomass stove

Imbert Downdraft Biomass CHPImbert Downdraft Biomass CHP
Feed fuel:: 25 mm x 25 mm x 25 mm

Wood CHP and adsorption coolingWood CHP and adsorption cooling

Table 1. Results of Gas analysis from Table 1. Results of Gas analysis from experimental runs using Borneo cubes. experimental runs using Borneo cubes.
Location of gas Location of gas samples & samples & CompositionComposition
HH22
(%wt)(%wt)COCO(%wt)(%wt)
COCO22
(%wt)(%wt)CHCH44
(%wt)(%wt)CC22HH66
(%wt)(%wt)CC33HH88
(%wt)(%wt)
Method of Method of AnalysisAnalysis
Gas Chromatography FID and Gas Chromatography TCDGas Chromatography FID and Gas Chromatography TCD
Run 01 Run 01 00 55.5955.59 42.9042.90 1.141.14 0.2990.299 0,0750,075
Run 02 Run 02 00 41.2341.23 55.8655.86 2.102.10 0.660.66 0.150.15
Run 03Run 03 00 43.1043.10 54.2854.28 1.931.93 0.520.52 0.170.17

Table 2.. Proximate analysis of experimental runs Table 2.. Proximate analysis of experimental runs using respectively, the Borneo cubes, Tamarind using respectively, the Borneo cubes, Tamarind
and and LeucenaLeucena cubes. cubes.
NoNo Analysis. Analysis. Borneo Borneo cubescubes
Tamarind Tamarind cubescubes
Leucena Leucena cubescubes
11 ProximateProximate
m.c. (%)m.c. (%) 9.259.25 7.787.78 12.9812.98
Volatile matter (%)Volatile matter (%) 72.1872.18 78.5578.55 73.0473.04
Fixed carbon (%)Fixed carbon (%) 18.3118.31 12.0612.06 12.9612.96
22 UltimateUltimate
Ash content (%)Ash content (%) 0.250.25 1.591.59 1.021.02
Carbon (%)Carbon (%) 47.8747.87 43.8643.86 42.8542.85
Hydrogen (%)Hydrogen (%) 5.235.23 5.235.23 4.934.93
Nitrogen (%)Nitrogen (%) 1.431.43 0.250.25 0.150.15
Oxygen (%)Oxygen (%) 35.9835.98 41.2941.29 38.0738.07
33 Calorific value (MJ/kg) Calorific value (MJ/kg) 18.897.18.897. 17.22417.224 16.35116.351

Table 3. . Estimated power output of Table 3. . Estimated power output of experimental runs using Borneo cubesexperimental runs using Borneo cubes
Feed fuel Feed fuel /experimental /experimental RunsRuns
Run 01Run 01 Run 02Run 02 Run 03Run 03
Borneo cubesBorneo cubes 60,39 kW60,39 kW 58.98 kW58.98 kW 61.82 kW61.82 kW
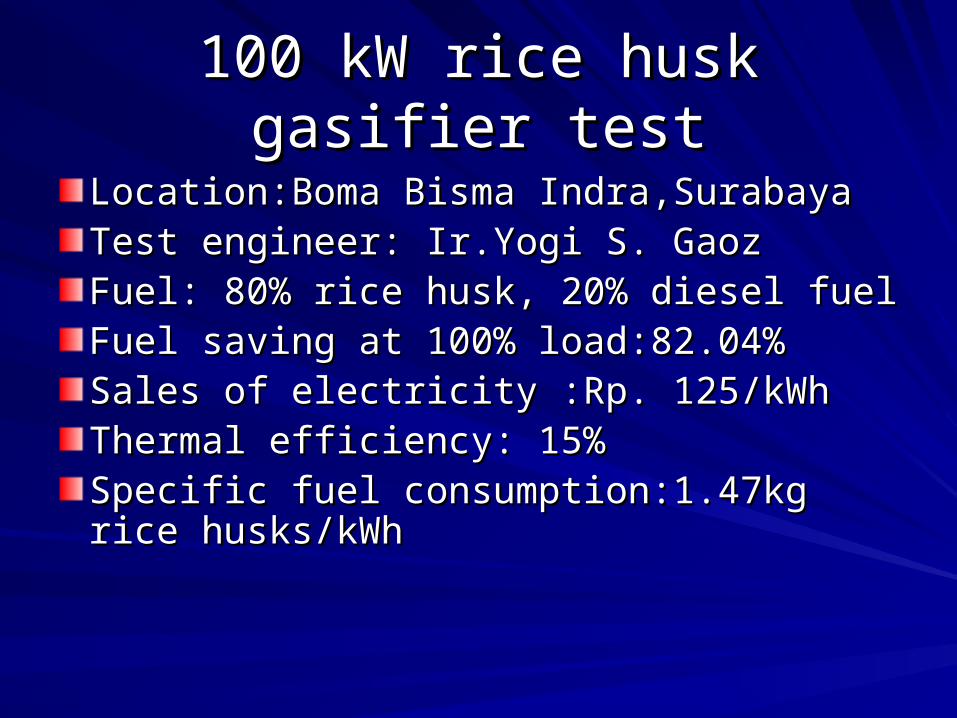
100 kW rice husk gasifier test100 kW rice husk gasifier test
Location:Boma Bisma Indra,SurabayaLocation:Boma Bisma Indra,SurabayaTest engineer: Ir.Yogi S. GaozTest engineer: Ir.Yogi S. GaozFuel: 80% rice husk, 20% diesel fuelFuel: 80% rice husk, 20% diesel fuelFuel saving at 100% load:82.04%Fuel saving at 100% load:82.04%Sales of electricity :Rp. 125/kWhSales of electricity :Rp. 125/kWhThermal efficiency: 15%Thermal efficiency: 15%Specific fuel consumption:1.47kg rice Specific fuel consumption:1.47kg rice husks/kWhhusks/kWh

Performance of rice husk gasifier-Performance of rice husk gasifier-BBI TestBBI Test

Coco-diesel fuel test (Desrial, Coco-diesel fuel test (Desrial, 2007)2007)
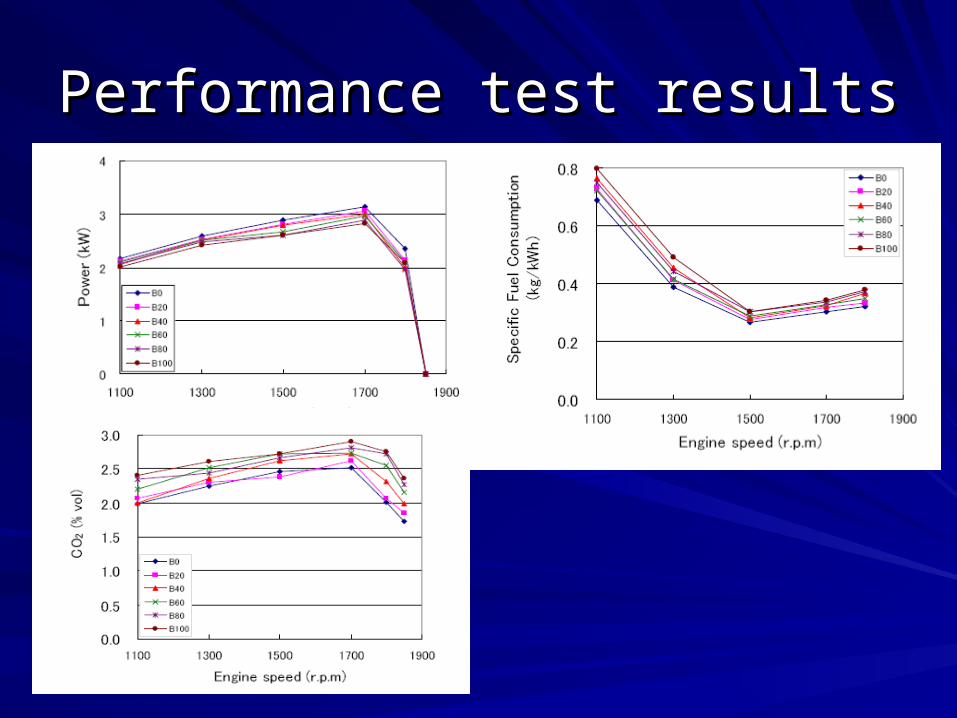
Performance test resultsPerformance test results

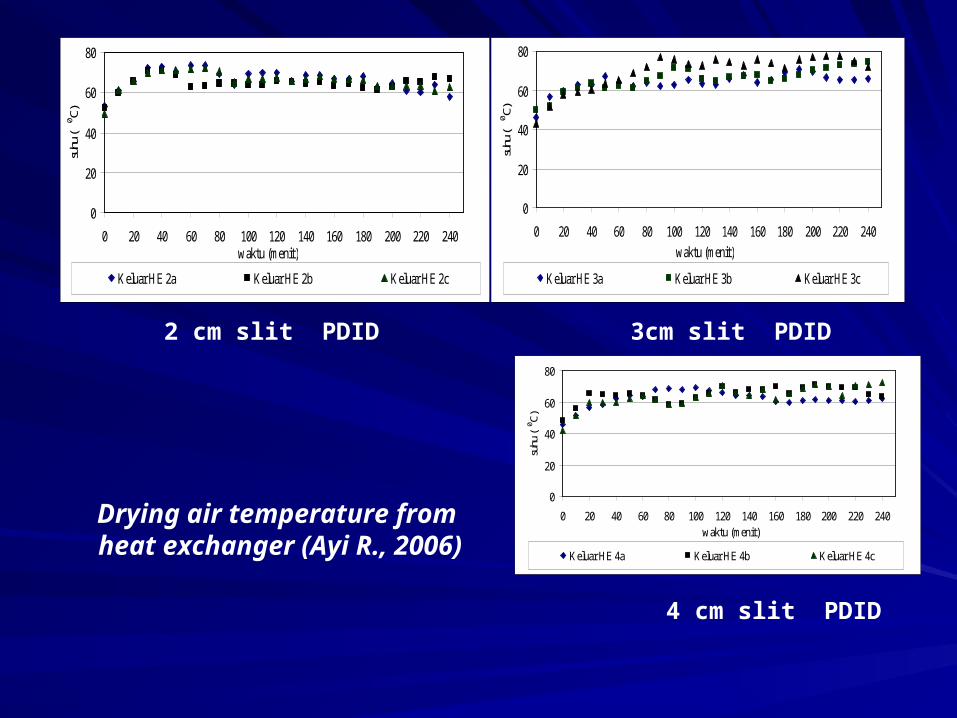
Drying air generator using biomass Drying air generator using biomass stove and heat exchangerstove and heat exchanger
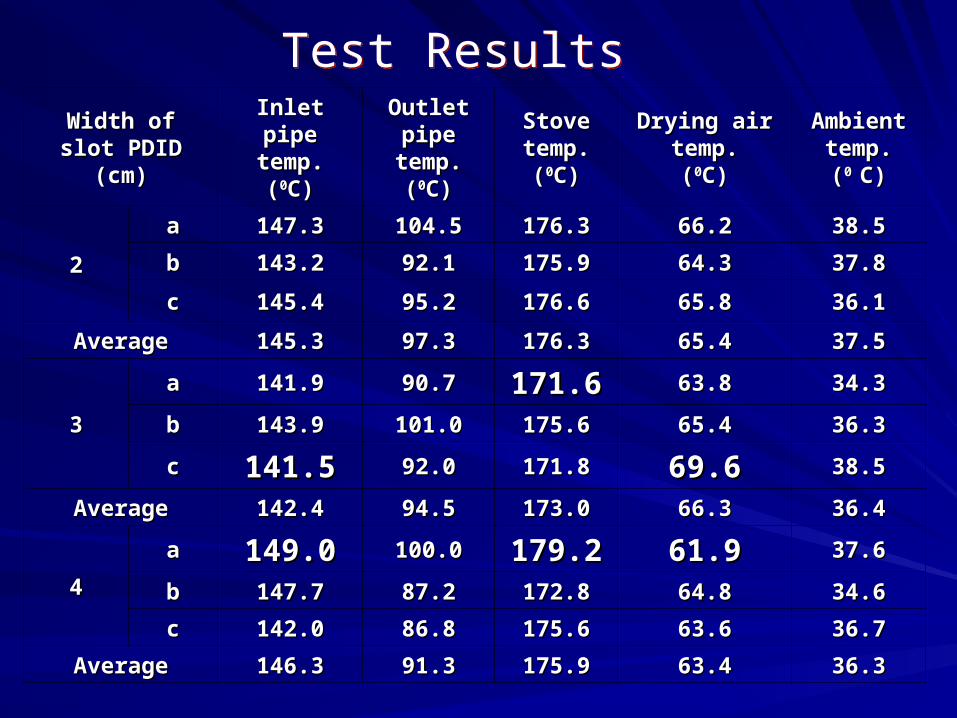
Width of slot Width of slot PDIDPDID(cm)(cm)
Inlet pipe Inlet pipe temp.temp.((00C)C)
Outlet pipe Outlet pipe temp.temp.((00C)C)
Stove Stove temp.temp.((00C)C)
Drying air Drying air temp.temp.((00C)C)
Ambient Ambient temp.temp.((0 0 C)C)
22
aa 147.3147.3 104.5104.5 176.3176.3 66.266.2 38.538.5
bb 143.2143.2 92.192.1 175.9175.9 64.364.3 37.837.8
cc 145.4145.4 95.295.2 176.6176.6 65.865.8 36.136.1
AverageAverage 145.3145.3 97.397.3 176.3176.3 65.465.4 37.537.5
33
aa 141.9141.9 90.790.7 171.6171.6 63.863.8 34.334.3
bb 143.9143.9 101.0101.0 175.6175.6 65.465.4 36.336.3
cc 141.5141.5 92.092.0 171.8171.8 69.669.6 38.538.5
AverageAverage 142.4142.4 94.594.5 173.0173.0 66.366.3 36.436.4
44
aa 149.0149.0 100.0100.0 179.2179.2 61.961.9 37.637.6
bb 147.7147.7 87.287.2 172.8172.8 64.864.8 34.634.6
cc 142.0142.0 86.886.8 175.6175.6 63.663.6 36.736.7
AverageAverage 146.3146.3 91.391.3 175.9175.9 63.463.4 36.336.3
Test ResultsTest Results
0
20
40
60
80
0 20 40 60 80 100 120 140 160 180 200 220 240waktu (menit)
suhu
(0 C)
Keluar HE 2a Keluar HE 2b Keluar HE 2c
0
20
40
60
80
0 20 40 60 80 100 120 140 160 180 200 220 240
waktu (menit)
suhu
(0 C)
Keluar HE 3a Keluar HE 3b Keluar HE 3c
0
20
40
60
80
0 20 40 60 80 100 120 140 160 180 200 220 240waktu (menit)
suhu
(0 C
)
Keluar HE 4a Keluar HE 4b Keluar HE 4c
2 cm slit PDID
Drying air temperature from heat exchanger (Ayi R., 2006)
3cm slit PDID
4 cm slit PDID


ELC-05 ELC-05 GHEGHE solar dryer (Anggita, Diaz, A., solar dryer (Anggita, Diaz, A., 2006)2006)
Banana flower and spikes for jerked banana spikes

RD/D of RE technology dissemination by Lab. of Energy and Agric. RD/D of RE technology dissemination by Lab. of Energy and Agric. Electrification IPBElectrification IPB

Cash flow of Barrak Cooperative, Cimahi, West Java. Cash flow of Barrak Cooperative, Cimahi, West Java. Case 1: dryer as grantCase 1: dryer as grant
YearYear Revenue (Rp)Revenue (Rp) Operating Operating interestinterest Income (Rp.)Income (Rp.) Cumulative (Rp)Cumulative (Rp)
00 3300000033000000 Cost (Rp)Cost (Rp) 17.50%17.50% -33000000-33000000
11 3500000035000000 90210009021000 57750005775000 2020400020204000 -12796000-12796000
22 3500000035000000 90210009021000 57750005775000 2020400020204000 74080007408000
33 3500000035000000 90210009021000 00 2597900025979000 3338700033387000
44 3500000035000000 90210009021000 00 2597900025979000 5936600059366000
55 3500000035000000 90210009021000 00 2597900025979000 8534500085345000
66 3500000035000000 90210009021000 00 2597900025979000 111324000111324000
77 3500000035000000 90210009021000 00 2597900025979000 137303000137303000
88 3500000035000000 90210009021000 00 2597900025979000 163282000163282000
99 3500000035000000 90210009021000 00 2597900025979000 189261000189261000
1010 3500000035000000 90210009021000 00 2597900025979000 215240000215240000

SPU for coffee -SumbawaSPU for coffee -SumbawaInvestment and Annual working capital (US$) US$
1. Operational cost for drying 600
(3 operators x US$50/mo x 4 mo )
2. Operation cost for milling 600
(3 operators x US$50/mo x 3 mo )
3. Maintenance cost 3.45E+02
4. Transportation &Packaging 800
5. Procurement of raw materials
(2000 kg/batch*40*US$0.1) 5.17E+02
6. Variable cost for drying 7.60E+02
(40 x2000xUS$0.0127/kg)
7. Variable cost for milling (inc.hulling+roasting) 1.08E+03
(US$0.145/kgx 185.4 kg/dx(30/3)x4mos.)
8.Depreciation (US$) 1.50E+03
9. Electricity charge US$/yr 3.60E+02
Total working capital +initial investment 6.20E+03

Cash flowCash flow
Annual Revenue (US$) US$
1. Annual revenue (before pay back) 8866.95
(185.4 kg/d x 10 x 4 d x US$1.3/kg)
2. Annual revenue (after pay back) 8866.95

Cash flow for coffee processingCash flow for coffee processing
Year Revenue CostInterest rates(0.175%/y) Net Cummulative
0 6.20E+03 -6.20E+03 -6.20E+03
1 8866.956522 6.20E+03 1.08E+03 1.59E+03 -4.61E+03
2 8866.956522 6.20E+03 1.08E+03 1.59E+03 -3.03E+03
3 8866.956522 6.20E+03 1.08E+03 1.59E+03 -1.44E+03
4 8866.956522 6.20E+03 0.00E+00 2.67E+03 1.23E+03
5 8866.956522 6.20E+03 0.00E+00 2.67E+03 3.90E+03
6 8866.956522 6.20E+03 0.00E+00 2.67E+03 6.57E+03
7 8866.956522 6.20E+03 0.00E+00 2.67E+03 9.24E+03
8 8866.956522 6.20E+03 0.00E+00 2.67E+03 1.19E+04
9 8866.956522 6.20E+03 0.00E+00 2.67E+03 1.46E+04
10 8866.956522 6.20E+03 0.00E+00 2.67E+03 1.72E+04