State of the Art Clarifier Modeling Technology -...
16
1 WEFTEC ‘05 Clarifier Design MOP FD-8 State of the Art Clarifier Modeling Technology-Part II Siping Zhou, Alex McCorquodale, John Richardson and Tom Wilson Abstract: As part of summary of the clarifier modeling chapter in Clarifier Design MOP FD-8, this paper illustrates modeling applications in several clarifier troubleshooting, retrofit and design evaluation projects. It emphasizes the practical application aspects of modeling. Included are results from model predictions for the clarifiers with and without modifications as well as field data measured before and after the field retrofit. 1 INTRODUCTION 1.1 Why a Numerical Model for Clarifiers There is debate among design engineers and clarifier manufacturers on the performance (or efficiency) of several design alternatives developed for secondary clarifiers. For many years, a significant amount of field testing work has been conducted in order to evaluate and select design alternatives, which can be applied to build a secondary clarifier with a substantially higher performance and capacity. The field data provide us clarifier performance understanding in general as well as producing physical results. However, convincing conclusions may not be drawn only based on field tests and observational results due primarily to the following three reasons: 1. Many unavoidable uncertainty factors in the field tests, such as flow distribution and variations of process parameters, disturb a reliable evaluation of product alternatives. 2. Insufficient information obtained from the field tests prevents us from fully understanding the mechanism of the evaluated alternatives. 3. In a field test, it is very difficult to isolate a single evaluation factor from others to reveal its exact impact of the evaluated alternative. Using a CFD model, clarifiers with two different design alternatives can be set exactly side by side under an identical operational condition. The desired field testing data includes the 3D solids and flow fields within the tested clarifier at each different time steps in the operations under a diurnal flow condition and many variable process/bioreactor operational parameters. It is almost impossible to obtain an entire set of information needed to evaluate two different alternatives in a field test since a dramatic amount of performance data and operational conditions need to be monitored under a wide enough loading range. So far, the most available field data which could be useful in explaining certain phenomenon under the given conditions still appear only piecemeal. For example, someone promotes a shallow flocculation well because he found it was doing well in a
-
Upload
trinhkhanh -
Category
Documents
-
view
222 -
download
1
Transcript of State of the Art Clarifier Modeling Technology -...

1
WEFTEC ‘05 Clarifier Design MOP FD-8
State of the Art Clarifier Modeling Technology-Part II
Siping Zhou, Alex McCorquodale, John Richardson and Tom Wilson
Abstract: As part of summary of the clarifier modeling chapter in Clarifier Design MOP
FD-8, this paper illustrates modeling applications in several clarifier troubleshooting,
retrofit and design evaluation projects. It emphasizes the practical application aspects of
modeling. Included are results from model predictions for the clarifiers with and without
modifications as well as field data measured before and after the field retrofit.
1 INTRODUCTION
1.1 Why a Numerical Model for Clarifiers
There is debate among design engineers and clarifier manufacturers on the performance
(or efficiency) of several design alternatives developed for secondary clarifiers. For many
years, a significant amount of field testing work has been conducted in order to evaluate
and select design alternatives, which can be applied to build a secondary clarifier with a
substantially higher performance and capacity. The field data provide us clarifier
performance understanding in general as well as producing physical results. However,
convincing conclusions may not be drawn only based on field tests and observational
results due primarily to the following three reasons:
1. Many unavoidable uncertainty factors in the field tests, such as flow distribution
and variations of process parameters, disturb a reliable evaluation of product
alternatives.
2. Insufficient information obtained from the field tests prevents us from fully
understanding the mechanism of the evaluated alternatives.
3. In a field test, it is very difficult to isolate a single evaluation factor from others to
reveal its exact impact of the evaluated alternative.
Using a CFD model, clarifiers with two different design alternatives can be set exactly
side by side under an identical operational condition.
The desired field testing data includes the 3D solids and flow fields within the tested
clarifier at each different time steps in the operations under a diurnal flow condition and
many variable process/bioreactor operational parameters. It is almost impossible to obtain
an entire set of information needed to evaluate two different alternatives in a field test
since a dramatic amount of performance data and operational conditions need to be
monitored under a wide enough loading range.
So far, the most available field data which could be useful in explaining certain
phenomenon under the given conditions still appear only piecemeal. For example,
someone promotes a shallow flocculation well because he found it was doing well in a
2
clarifier with massive sludge inventory due to longer sludge age in the process, while
others are insisting that a deeper well is better based on their field experiences in a
process with a lower MLSS.
The 3D Computational Fluid Dynamic (CFD) based clarifier/process modeling is an
effective approach to simulate those pieces collected in different field tests and connect
them together. The modeling practice is able to provide us a complete and objective
picture describing both performance and application conditions for the evaluated
alternatives.
1.2 Modeling Technology
Clarifier models can be generally divided into two classes, i.e. "Black Box" and "Glass
Box" models based on their ability to represent the physical processes to describe the
flow and solids fields within clarifiers.
1.2.1 “Black Box” Models
The first “black box” clarifier model was developed and published by Dobbins (1944).
This type of models developed earlier have to adopt very rough approximations of
clarifier hydraulic behavior, relying on over-simplifications or ‘correction factors’ and
based mainly on solids flux equations.
The earlier clarifier models [Dobbins (1944) and Dick and Young (1972)] are considered
to be black box models since the plug flow is a major assumption used in these models.
Since true plug flow conditions are never achieved in any real clarifiers, the information
provided by these models is limited if the models are used for clarifier design
optimization or troubleshooting of existing system. The reliability of the model
simulations is heavily dependent on the similarity between the calibration and the
prediction scenarios. It is dubious to use these black box models to predict (or explain)
the behavior of clarifiers with different configurations under the practical operating
conditions.
1.2.2 “Glass Box” Models
During the last 25 years, the great advances in Computational Fluid Dynamics (CFD) and
computer hardware have made it possible to base clarifier simulation upon the glass box
models. The numerical solutions of the momentum and mass transport equations are able
to give more complete multi-dimensional fields for the realistic flow and suspended
solids in clarifiers. The research on clarifier modeling based on CFD principles was
initiated by Larsen (1977). The clarifier models presented by Schamber and Larock
(1981), Imam and McCorquodale (1983), Celik and Rodi (1985), Lyn and Zhang (1989),
Adams and Rodi (1990), Gasonato and Gallerano (1990), and Szalai, Krebs and Rodi
(1994) neglected density effects.
3
The density effects are included in the models of DeVantier and Larock (1987), Lyn,
Stamou and Rodi (1992) and Larsen, et al (1977). The numerical difficulty encountered
with strong density flows in clarifiers was overcome and the clarifier inlet “density water
fall” and “the entrainment flow” into the flocculation well was captured by the modeling
of Zhou and McCorquodale (1992a, b).
The ASCE Clarifier Research Technical Committee (CRTC) protocol field was applied
in a performance evaluation of two circular secondary clarifiers located in the South
Secondary Complex at MWRD's Center Treatment Plant, Denver Colorado (Wahlberg et
al 1995). The protocol from this study provides a standard for field testing of clarifiers.
The unsteady 2 and 3-D clarifier model (Zhou and McCorquodale, 1992) based on the
Computational Fluid Dynamic theory was verified based on the field data gathered by
Wahlberg (Vitasovic, Zhou and McCorquodale 1996).
In clarifier simulations the density impact is very strong in comparison with the weak
flow convections. The commercial available CFD packages may not be readily applied in
clarifier simulations until the numerical approach, which can effectively enhance the
stability of numerical solutions, are developed and incorporated into the code.
2 Clarifier Retrofit with Better Cost-Effectiveness
2.1 Field Observation of Existing Clarifier Performance
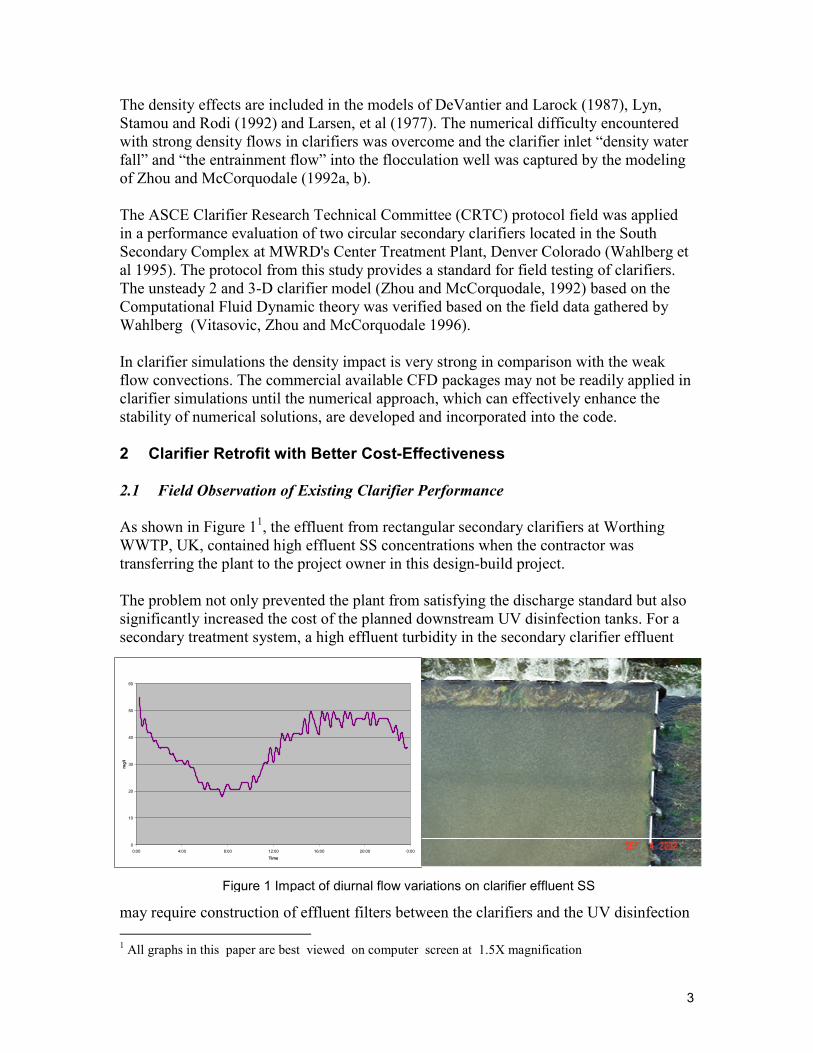
As shown in Figure 11, the effluent from rectangular secondary clarifiers at Worthing
WWTP, UK, contained high effluent SS concentrations when the contractor was
transferring the plant to the project owner in this design-build project.
The problem not only prevented the plant from satisfying the discharge standard but also
significantly increased the cost of the planned downstream UV disinfection tanks. For a
secondary treatment system, a high effluent turbidity in the secondary clarifier effluent
may require construction of effluent filters between the clarifiers and the UV disinfection
1 All graphs in this paper are best viewed on computer screen at 1.5X magnification
Figure 5 - EFFLUENT SS
0
10
20
30
40
50
60
0:00 4:00 8:00 12:00 16:00 20:00 0:00
Time
mg/l
Figure 1 Impact of diurnal flow variations on clarifier effluent SS

4
tanks in order to reduce the size of the UV disinfection tanks and lower the overall
construction and maintenance cost.
Figure 1 shows a typical monitoring profile of clarifier effluent SS in 24 hours, which
was provided by the project owner (Southern Water, 2002). In the figure, the clarifier
effluent quality is with respect to the system operation time. The field data show the very
clear impact of clarifier flow variations on the effluent SS concentration. The effluent SS
trend indicates that the clarifier effluent SS was between 20 to 30 mg/L during the daily
low flow period and 40 to 50 mg/L during the daily high flow period.
It had been found in
most of the current
process/clarifier
operations that the light
flocculant solids were
consistently blowing out
in substantial amounts
around the existing
launder system - even
during the daily low flow
period as shown in Figure
1. There were no obvious
flocculant solids
observed on the rest of
clarifier surface area
except in the area around the existing effluent launders, which are located at the very
downstream end of the clarifier and cover only approximately 1/10 of the total clarifier
surface area as shown on Figure 2(a).
During site visits, the following major features of hydraulic performance have been
observed in the existing clarifiers:
1. There is strong impingement between the clarifier water surface water and
upward influent jet flows, which are created at the upstream end of the clarifiers
by directing MLSS through influent diffusers consisting of four nozzles aimed
toward the water surface.
2. After the impingement with the water surface, the clarifier influent dives toward
the clarifier floor within a distance ranging from 2 to 3 meters away the influent
wall due to the strong density current formed.
3. The density interface between clarifier influent jets and ambient clean water in the
surface layers can be visually observed, although massive scum behind the scum
baffle often covers it.
4. The direction of the surface flow is driven more or less by the wind within a very
shallow surface layer of a few inches as well as scum floating on the water
surface. Therefore, it often changes due to variations of the wind direction.
Figure 2 Clarifiers with and with on baffle and launder Modifications
a) Existing Clarifier
42.5m
10.23m
3.5m
b) Influent Flocculation Baffle and Extended Effluent Launders
42.5m
10.23m
3.5m 1.94m
a) Existing Clarifier
b) Influent flocculation baffle and extended effluent launders
5
However, the clear and consistent reverse current towards clarifier upstream end
was observed in layers a few inches below the surface.
Massive amounts of light flocculant solids are consistently blowing out around the
existing launder system - even during the daily low flow period.
2.2 3D Modeling Results
The 3D CFD based clarifier modeling technology was used to explore an optimized
modification package in order to enhance the performance of the existing secondary
treatment system by improving clarifier hydraulic behavior and solids flocculation within
clarifiers while satisfying the requirement of a low construction cost.
Existing Clarifier Configurations: As shown in Figures 2(a) and 2(b) the length of the
existing clarifier = 42.5 m, the tank width = 10.25 m, the average water depth at the tank
midstream part = 3.5 m. The surface area of each tank is 435.6 m2. Each tank’s influent
flow is introduced through an influent diffuser with four inlet nozzles aimed toward the
surface. In each tank there are 3 effluent launders, which go along the lateral direction
and are distributed in a range of 4 meters from the downstream wall. The multiple
scrapers driven by chain move toward the tank upstream hopper to collect the settled
sludge into the sludge hoppers located at the front end of tank.
The modeling scenarios for the modified system include two major alternatives:
• Alternative 1 = a flocculation baffle with optimized depth and location
• Alternative 2 = A flocculation baffle + extended effluent launders.
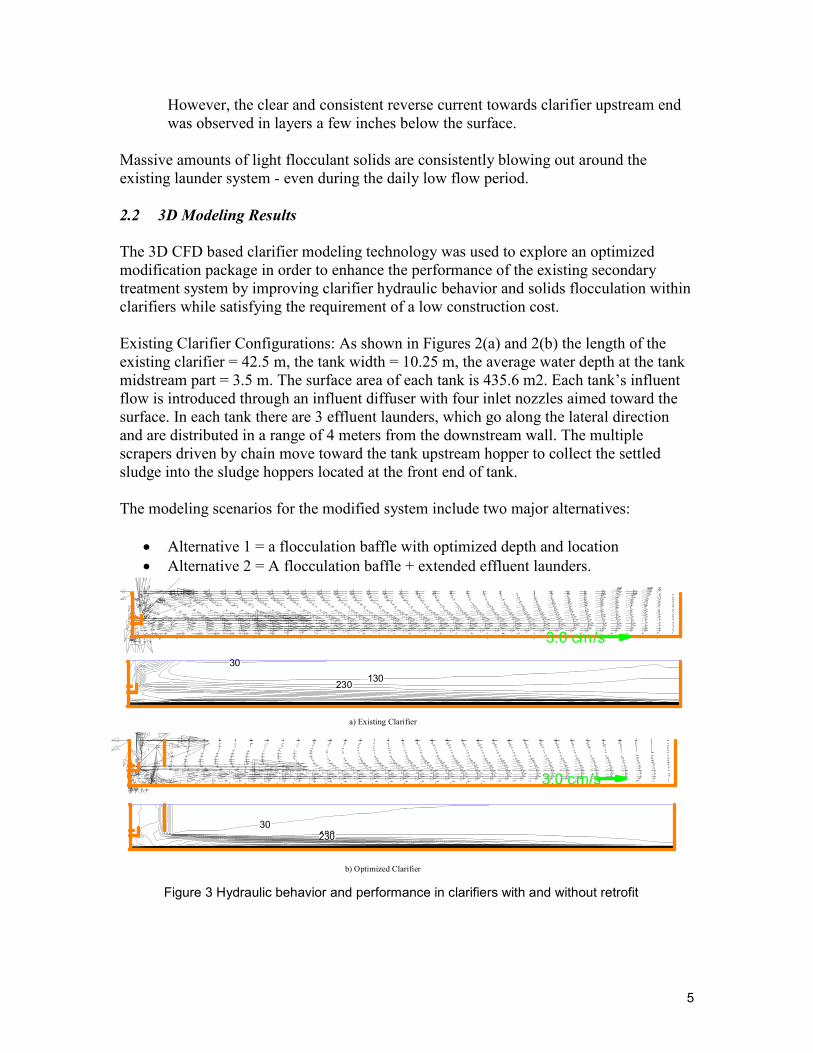
3.0 cm/s
3.0 cm/s
30
130230
30130230
a) Existing Clarifier
b) Optimized Clarifier
Figure 3 Hydraulic behavior and performance in clarifiers with and without retrofit

6
The two scenarios cases developed in the study not only provide the contractor (and
project owner) a solution with the best effectiveness but also let them have a choice
requiring a very limited cost while providing reasonable performance enhancement.
Figures 3(a) and 3(b)1present the comparison of velocity fields between the existing
clarifier and the clarifier with Alternative 1 to give insight into the significant
enhancement of clarifier performance due to the modifications. The flow pattern is
presented in a vertical section near the center axis for the clarifier SOR of 1.5 m3/m2/h
and MLSS of 2300 mg/L.
As shown in Figure 3(a), the predicted hydraulic regime typically consists of the upward
inlet jet, the influent density waterfall, a bottom density current and a strong surface
reverse flow in the absence of proper baffling. For a case with a thick sludge blanket (not
shown), the simulated velocity field showed that the bottom density current deflects
upward while near the tank bottom a strong reverse sludge flow appears. According to
both the field observations and the modeling of the existing process, each of the
following reasons (or combination of them) may cause the clarification problems, i.e. the
flocculant solids blowing out:
1. The location of the existing launders (distributed in a range of 4 meters at the very
downstream end of the clarifier) cause very strong upward currents, which could
be one of the major reasons that the flocculant solids were blowing out around
the effluent area (see Figure 2).
2. The strong upward flow is not only related to the small cross section area the
effluent flow passes through but also to the rebound effect between the clarifier
bottom density current and the downstream wall. The “rebound” phenomenon has
been observed and reported by many operators as well as field investigators,
especially in circular clarifiers with small amounts of sludge inventory. A
reasonable amount of sludge inventory can help dissipate the kinetic energy of the
bottom density current, which is often described by some operators as “sludge
blanket filtering”.
3. The relatively shallow water depth (3.5 m) in the existing clarifiers provide less
separation between the high concentration layers and the surface effluent than that
of clarifiers with a deeper water depth. Therefore, the effluent quality might be
more sensitive to the launder arrangement in a shallow clarifier than that in a
deeper clarifier.
4. In the existing operation, the bottom density current must be fairly strong due to
the lack of proper baffling and the shortage of sludge inventory in the tank.
It can be observed that in clarifiers with both retrofit packages 1 and 2, the clarifier-
settling zone is effectively isolated from the influent zone as well as the surface influent
momentum due to the application of the optimized flocculation baffle [see Figure 3(b) for
1 All graphs in this paper are best viewed on computer screen at 1.5X magnification
7
package 1]. In the settling zone, the strong surface reverse flow, which occurs in the
existing tank, has been almost eliminated due to the flocculation baffle. The extended
launder gives a much lower intensity of the upward velocities caused by the effluent flow
withdrawal.
Figure 3(a) also visually illustrates that the level of solids contour line of 130 mg/L is
very close to the downstream effluent area in the existing clarifier in the simulation with
an ultimate SOR of 1.5 (m3/m2/h) combined with a MLSS of 2300 mg/L although the
sludge blanket is lower than 20% of water depth. In the clarifier with the full retrofit
package [Figure 3(b)], the contour line of 130 is very close to tank bottom.
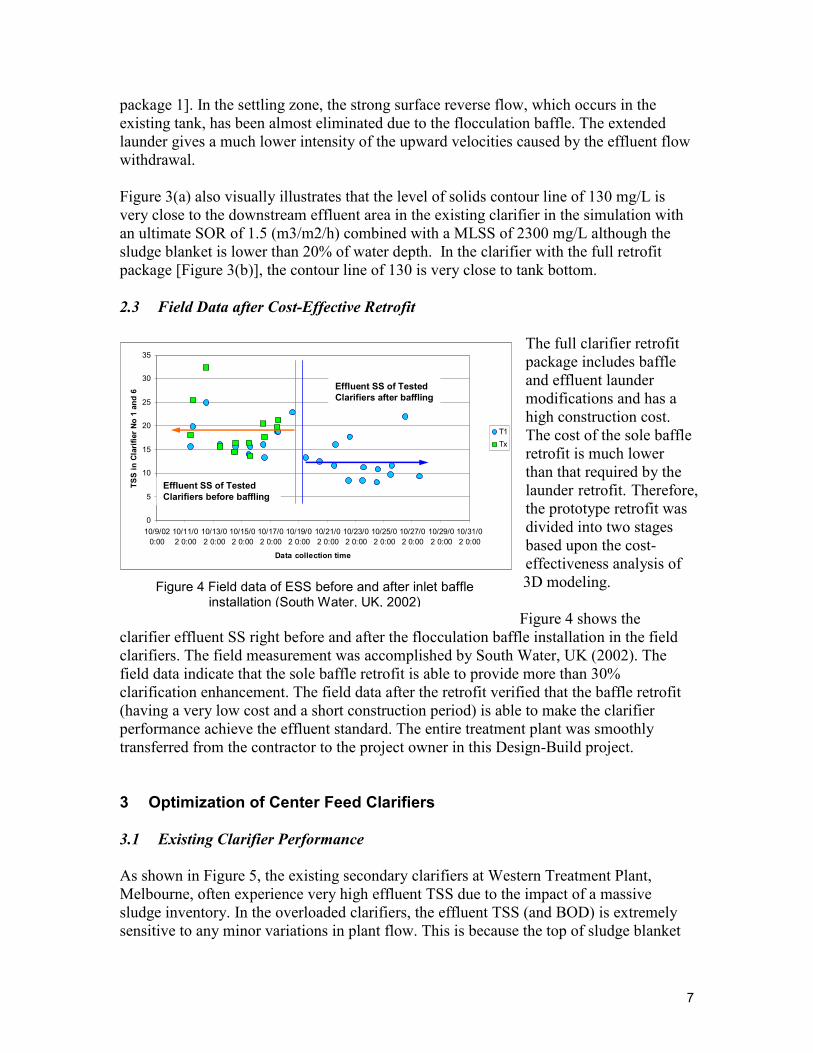
2.3 Field Data after Cost-Effective Retrofit
The full clarifier retrofit
package includes baffle
and effluent launder
modifications and has a
high construction cost.
The cost of the sole baffle
retrofit is much lower
than that required by the
launder retrofit. Therefore,
the prototype retrofit was
divided into two stages
based upon the cost-
effectiveness analysis of
3D modeling.
Figure 4 shows the
clarifier effluent SS right before and after the flocculation baffle installation in the field
clarifiers. The field measurement was accomplished by South Water, UK (2002). The
field data indicate that the sole baffle retrofit is able to provide more than 30%
clarification enhancement. The field data after the retrofit verified that the baffle retrofit
(having a very low cost and a short construction period) is able to make the clarifier
performance achieve the effluent standard. The entire treatment plant was smoothly
transferred from the contractor to the project owner in this Design-Build project.
3 Optimization of Center Feed Clarifiers
3.1 Existing Clarifier Performance
As shown in Figure 5, the existing secondary clarifiers at Western Treatment Plant,
Melbourne, often experience very high effluent TSS due to the impact of a massive
sludge inventory. In the overloaded clarifiers, the effluent TSS (and BOD) is extremely
sensitive to any minor variations in plant flow. This is because the top of sludge blanket
Figure 4 Field data of ESS before and after inlet baffle installation (South Water, UK, 2002)
0
5
10
15
20
25
30
35
10/9/02
0:00
10/11/0
2 0:00
10/13/0
2 0:00
10/15/0
2 0:00
10/17/0
2 0:00
10/19/0
2 0:00
10/21/0
2 0:00
10/23/0
2 0:00
10/25/0
2 0:00
10/27/0
2 0:00
10/29/0
2 0:00
10/31/0
2 0:00
Data collection time
TSS in Clarifier No 1 and 6
T1
Tx
Effluent SS of Tested
Clarifiers after baffling
Effluent SS of Tested
Clarifiers before baffling
8
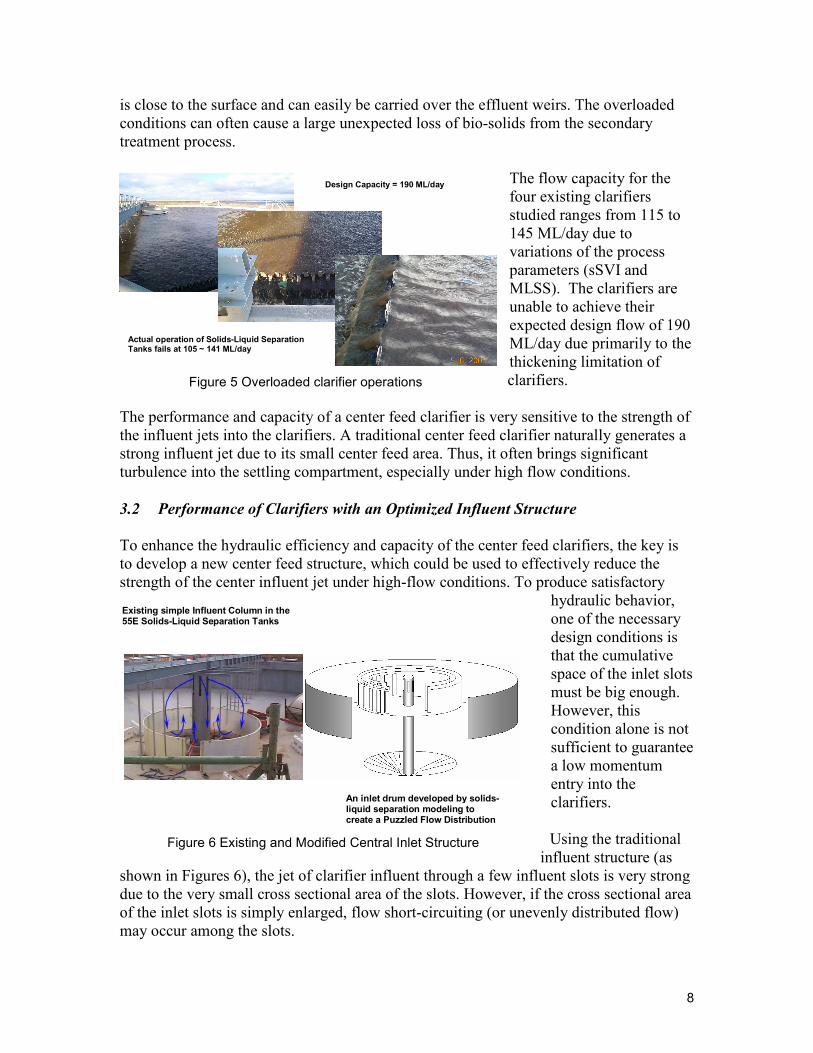
is close to the surface and can easily be carried over the effluent weirs. The overloaded
conditions can often cause a large unexpected loss of bio-solids from the secondary
treatment process.
The flow capacity for the
four existing clarifiers
studied ranges from 115 to
145 ML/day due to
variations of the process
parameters (sSVI and
MLSS). The clarifiers are
unable to achieve their
expected design flow of 190
ML/day due primarily to the
thickening limitation of
clarifiers.
The performance and capacity of a center feed clarifier is very sensitive to the strength of
the influent jets into the clarifiers. A traditional center feed clarifier naturally generates a
strong influent jet due to its small center feed area. Thus, it often brings significant
turbulence into the settling compartment, especially under high flow conditions.
3.2 Performance of Clarifiers with an Optimized Influent Structure
To enhance the hydraulic efficiency and capacity of the center feed clarifiers, the key is
to develop a new center feed structure, which could be used to effectively reduce the
strength of the center influent jet under high-flow conditions. To produce satisfactory
hydraulic behavior,
one of the necessary
design conditions is
that the cumulative
space of the inlet slots
must be big enough.
However, this
condition alone is not
sufficient to guarantee
a low momentum
entry into the
clarifiers.
Using the traditional
influent structure (as
shown in Figures 6), the jet of clarifier influent through a few influent slots is very strong
due to the very small cross sectional area of the slots. However, if the cross sectional area
of the inlet slots is simply enlarged, flow short-circuiting (or unevenly distributed flow)
may occur among the slots.
Existing simple Influent Column in the 55E Solids-Liquid Separation Tanks
An inlet drum developed by solids-liquid separation modeling to create a Puzzled Flow Distribution
Figure 6 Existing and Modified Central Inlet Structure
Design Capacity = 190 ML/day
Actual operation of Solids-Liquid Separation Tanks fails at 105 ~ 141 ML/day
Figure 5 Overloaded clarifier operations

9
An optimized design of clarifier inlet structure should simultaneously satisfy both the
principles, i.e. a large slot space and a uniform flow distribution among the slots. An
innovative “Multilayer Puzzled Inlet Slots” (MPIS) was used as an effective solution
against the problem of strong center influent jets. As shown in Figures 6 and 7, the MPIS
consists of multiple
perforated columns and a
circular bottom, which
partially seals the bottom
of the drum. There are
many vertical slots on the
walls of the columns. The
layout of the slots between
any two perforated
columns must be
staggered to create a
puzzled flow path and flow impingement on the baffles.
The 3D clarifier modeling technology was used to evaluate the retrofit alternative.
Comparing the modeling results presented in Figure 8, substantially improved clarifier
hydraulic behavior as well as enhanced performance can be observed in the following
aspects:
1. The very strong influent jet due to the small influent slots impinges with the
perforated baffles one after another. The velocities of the influent jets have been
reduced to less than 3 cm/sec before and after the last perforated baffle as shown
in Figure 8. The resistance created by multiple perforated baffles forces the
influent jet to be sufficiently distributed along the vertical and tangential
directions before the jet enters the flocculation well.
2. The downward current due to the deflection of the influent jet on the flocculation well has been significantly reduced since the momentum of the influent jet is
effectively dissipated by applying multiple perforated baffles.
Figure 7 Prototype of Modified Central Inlet Structure
Existing Clarifier
Optimized Clarifier
A) Lowered turbulence due to inlet retrofit
C) Reduced dispersion
in sludge blanket B) Reduced solids inventory
Figure 8 Performance before and after central inlet retrofit
10
3. The pinched flow underneath the lip of the baffle (flocculation well) has been eliminated and the level of density forward current is much closer to the clarifier’s
bottom due to the sufficiently controlled sludge inventory in the clarifier.
4. Because the significantly slowed influent jet generates a much weaker shear
influence on the ambient flow, the significant reverse flow underneath the surface
influent jet predicted in the clarifiers has been almost eliminated.
5. The dispersed sludge blanket has been significantly lowered due primarily to the
substantially reduced turbulence in the clarifiers equipped with a MPIS (See
Figure 8)
The existing clarifiers have flow capacities of approximately 1500 (m3/h) under the
normal process condition, which is most of the year. The optimized clarifiers can achieve
a flow capacity of around 2000 (m3/h), which is 30% higher than that of the existing
clarifiers.
4 Troubleshooting of Clarifiers
4.1 Performance of Existing Clarifiers
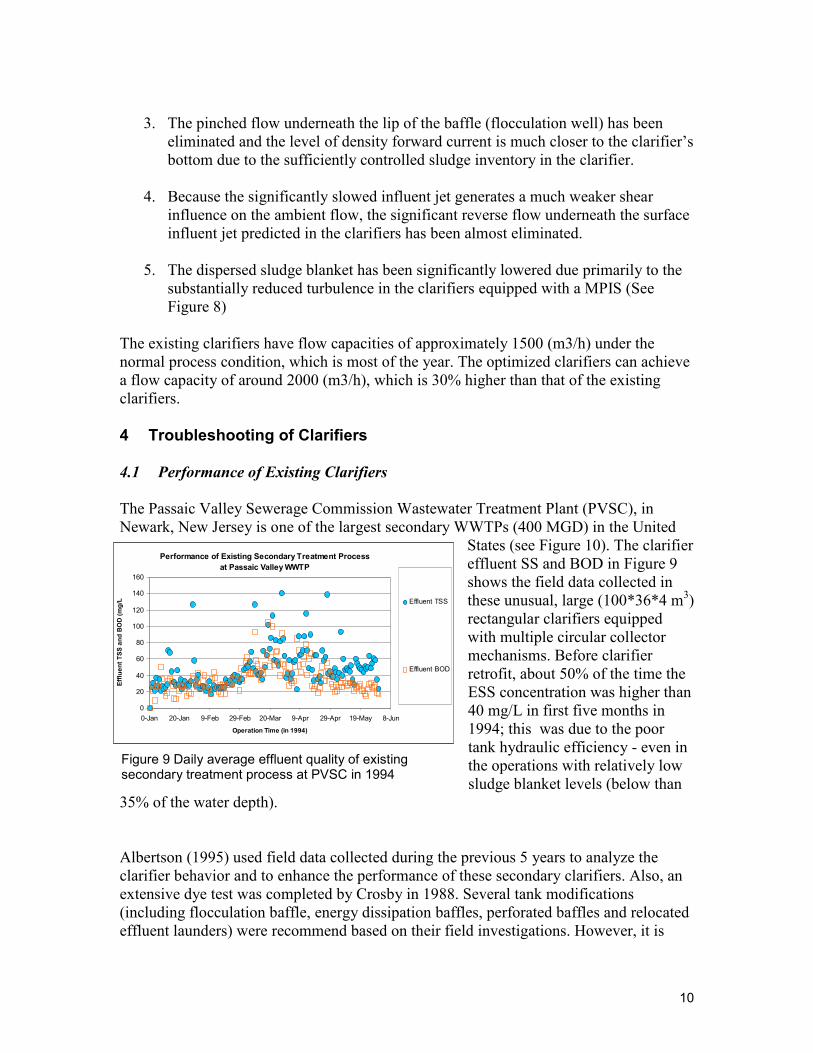
The Passaic Valley Sewerage Commission Wastewater Treatment Plant (PVSC), in
Newark, New Jersey is one of the largest secondary WWTPs (400 MGD) in the United
States (see Figure 10). The clarifier
effluent SS and BOD in Figure 9
shows the field data collected in
these unusual, large (100*36*4 m3)
rectangular clarifiers equipped
with multiple circular collector
mechanisms. Before clarifier
retrofit, about 50% of the time the
ESS concentration was higher than
40 mg/L in first five months in
1994; this was due to the poor
tank hydraulic efficiency - even in
the operations with relatively low
sludge blanket levels (below than
35% of the water depth).
Albertson (1995) used field data collected during the previous 5 years to analyze the
clarifier behavior and to enhance the performance of these secondary clarifiers. Also, an
extensive dye test was completed by Crosby in 1988. Several tank modifications
(including flocculation baffle, energy dissipation baffles, perforated baffles and relocated
effluent launders) were recommend based on their field investigations. However, it is
Performance of Existing Secondary Treatment Process
at Passaic Valley WWTP
0
20
40
60
80
100
120
140
160
0-Jan 20-Jan 9-Feb 29-Feb 20-Mar 9-Apr 29-Apr 19-May 8-Jun
Operation Time (in 1994)
Effluent TSS and BOD (mg/L)
Effluent TSS
Effluent BOD
Figure 9 Daily average effluent quality of existing secondary treatment process at PVSC in 1994
11
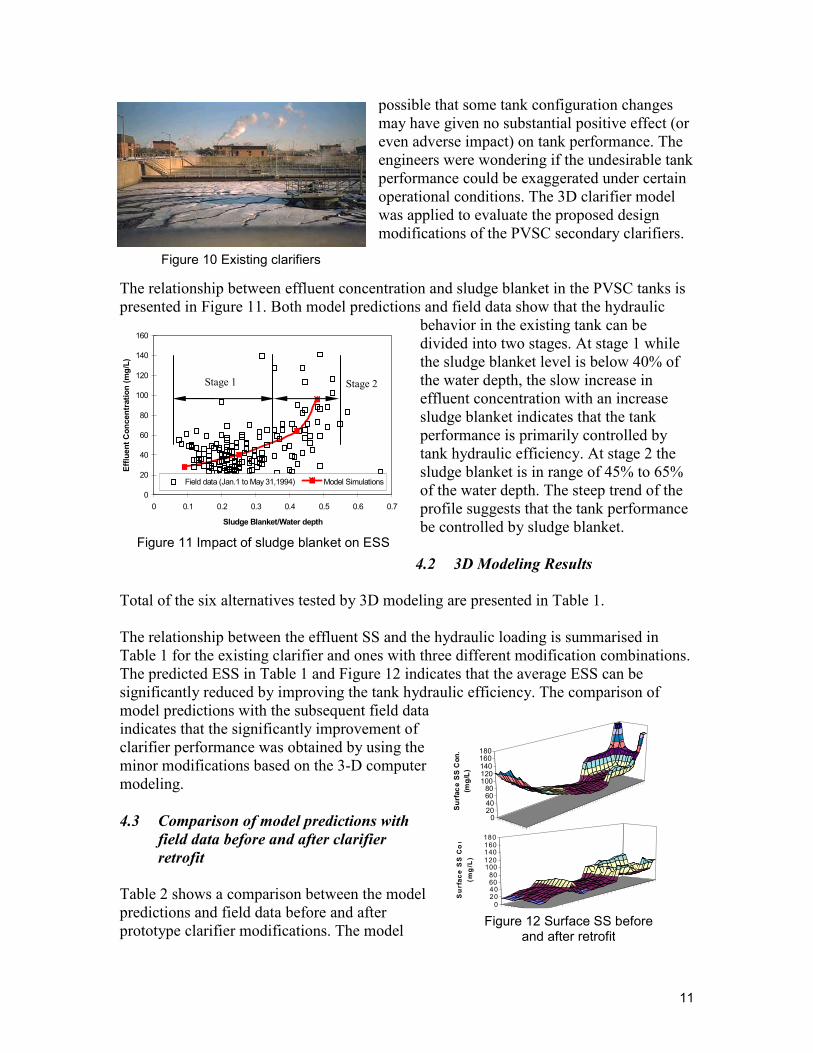
possible that some tank configuration changes
may have given no substantial positive effect (or
even adverse impact) on tank performance. The
engineers were wondering if the undesirable tank
performance could be exaggerated under certain
operational conditions. The 3D clarifier model
was applied to evaluate the proposed design
modifications of the PVSC secondary clarifiers.
The relationship between effluent concentration and sludge blanket in the PVSC tanks is
presented in Figure 11. Both model predictions and field data show that the hydraulic
behavior in the existing tank can be
divided into two stages. At stage 1 while
the sludge blanket level is below 40% of
the water depth, the slow increase in
effluent concentration with an increase
sludge blanket indicates that the tank
performance is primarily controlled by
tank hydraulic efficiency. At stage 2 the
sludge blanket is in range of 45% to 65%
of the water depth. The steep trend of the
profile suggests that the tank performance
be controlled by sludge blanket.
4.2 3D Modeling Results
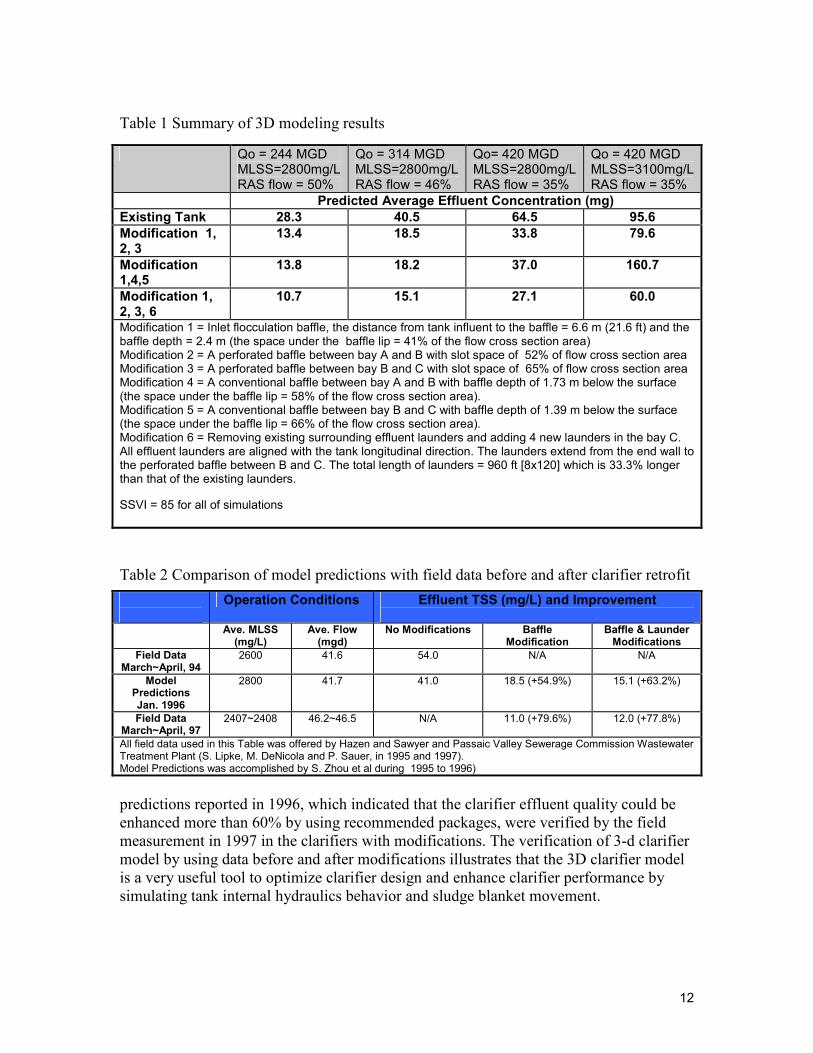
Total of the six alternatives tested by 3D modeling are presented in Table 1.
The relationship between the effluent SS and the hydraulic loading is summarised in
Table 1 for the existing clarifier and ones with three different modification combinations.
The predicted ESS in Table 1 and Figure 12 indicates that the average ESS can be
significantly reduced by improving the tank hydraulic efficiency. The comparison of
model predictions with the subsequent field data
indicates that the significantly improvement of
clarifier performance was obtained by using the
minor modifications based on the 3-D computer
modeling.
4.3 Comparison of model predictions with
field data before and after clarifier
retrofit
Table 2 shows a comparison between the model
predictions and field data before and after
prototype clarifier modifications. The model
0
20
40
60
80
100
120
140
160
0 0.1 0.2 0.3 0.4 0.5 0.6 0.7
Sludge Blanket/Water depth
Effluent Concentration (mg/L)
Field data (Jan.1 to May 31,1994) Model Simulations
Stage 1 Stage 2
Figure 11 Impact of sludge blanket on ESS
Figure 10 Existing clarifiers
020406080100120140160180
Surface SS Con.
(mg/L)
020406080100120
140160180
Surface SS C
on.
(mg/L)
Figure 12 Surface SS before and after retrofit
12
Table 1 Summary of 3D modeling results
Table 2 Comparison of model predictions with field data before and after clarifier retrofit
predictions reported in 1996, which indicated that the clarifier effluent quality could be
enhanced more than 60% by using recommended packages, were verified by the field
measurement in 1997 in the clarifiers with modifications. The verification of 3-d clarifier
model by using data before and after modifications illustrates that the 3D clarifier model
is a very useful tool to optimize clarifier design and enhance clarifier performance by
simulating tank internal hydraulics behavior and sludge blanket movement.
Qo = 244 MGD MLSS=2800mg/L RAS flow = 50%
Qo = 314 MGD MLSS=2800mg/L RAS flow = 46%
Qo= 420 MGD MLSS=2800mg/L RAS flow = 35%
Qo = 420 MGD MLSS=3100mg/L RAS flow = 35%
Predicted Average Effluent Concentration (mg)
Existing Tank 28.3 40.5 64.5 95.6
Modification 1, 2, 3
13.4 18.5 33.8 79.6
Modification 1,4,5
13.8 18.2 37.0 160.7
Modification 1, 2, 3, 6
10.7 15.1 27.1 60.0
Modification 1 = Inlet flocculation baffle, the distance from tank influent to the baffle = 6.6 m (21.6 ft) and the baffle depth = 2.4 m (the space under the baffle lip = 41% of the flow cross section area) Modification 2 = A perforated baffle between bay A and B with slot space of 52% of flow cross section area Modification 3 = A perforated baffle between bay B and C with slot space of 65% of flow cross section area Modification 4 = A conventional baffle between bay A and B with baffle depth of 1.73 m below the surface (the space under the baffle lip = 58% of the flow cross section area). Modification 5 = A conventional baffle between bay B and C with baffle depth of 1.39 m below the surface (the space under the baffle lip = 66% of the flow cross section area). Modification 6 = Removing existing surrounding effluent launders and adding 4 new launders in the bay C. All effluent launders are aligned with the tank longitudinal direction. The launders extend from the end wall to the perforated baffle between B and C. The total length of launders = 960 ft [8x120] which is 33.3% longer than that of the existing launders.
SSVI = 85 for all of simulations
Operation Conditions Effluent TSS (mg/L) and Improvement
Ave. MLSS (mg/L)
Ave. Flow (mgd)
No Modifications Baffle Modification
Baffle & Launder Modifications
Field Data March~April, 94
2600 41.6 54.0 N/A N/A
Model Predictions Jan. 1996
2800 41.7 41.0 18.5 (+54.9%)
15.1 (+63.2%)
Field Data March~April, 97
2407~2408 46.2~46.5 N/A 11.0 (+79.6%) 12.0 (+77.8%)
All field data used in this Table was offered by Hazen and Sawyer and Passaic Valley Sewerage Commission Wastewater Treatment Plant (S. Lipke, M. DeNicola and P. Sauer, in 1995 and 1997). Model Predictions was accomplished by S. Zhou et al during 1995 to 1996)

13
There are ten clarifiers in the PVSC plant. The retrofit for the first two clarifiers was
accomplished in early 1997 and the last two clarifiers were modified in 2003 since a
significant amount of construction is required for the retrofit in the large clarifiers.
5 Evaluations of Clarifier Design Alternatives
The 3D clarifier model can be used for design evaluations to select clarifier equipment,
which fits the specified process better. For example, bigger clarifier storage may reduce
the cost of sludge collection facility. An optimized sludge removal mechanism could
significantly reduce the possibility of under flow short-circuiting (or watery sludge) due
to insufficient sludge transport ability. In a process with longer sludge age for nitrogen
removal, an optimized sludge transfer facility could also achieve a rapid sludge removal
and a more concentrated sludge blanket, thus quickly returning the biomass into clarifiers
for a more stable process operation.
The efficiency of sludge collection/withdrawal facilities is also dependent on clarifier
floor slopes. For a specified clarifier configuration and the process conditions, an
optimized sludge withdrawal facility could be obtained by comparing sludge
compression/withdrawal efficiencies between different alternatives.
5.1 Scrapers and Center Sludge Withdrawal Hopper
As shown in Figure 13(a) the model prediction uncovers the mechanism of sludge
compression/withdrawal process for the clarifiers equipped with sludge collection
scrapers combined with a center sludge withdrawal hopper. The sludge withdrawal
efficiency is proportional to the sludge inventory in clarifiers. The design alternative
provides a better sludge withdrawal efficiency when the clarifier operations hold enough
amount of sludge inventory. It shows a relatively weak ability to control solids inventory
rising up during a flow increase period because of its poor efficiency at the operation
stages with a lower solids inventory.
Figure 13 Impact of sludge withdrawal facilities on sludge blanket
a ) Scrapers + Central hopper
b ) Unitube headers

14
5.2 Sludge Blanket Stratifications
Figure 13 shows the model predicted sludge reverse flow toward to the center hopper. It
explains that the sludge transfer in this case is primarily dependent on the bottom slope
and the sludge inventory. For the given bottom slope of 1/12, the strongest sludge reverse
flow appears when the clarifier operation accumulates the highest solids inventory.
As shown in Figure 13, the sludge
blanket can be divided into two layers,
i.e. a highly concentrated layer and a
dispersed sludge layer in which the
sludge has a solids concentration less
than the influent MLSS. The sludge
concentration often exceeds 10,000
mg/L near the bottom of concentrated
sludge layers. The model revealed
sludge blanket stratification can be
confirmed by the field measurement
data presented in Figures 14. As
shown in the figure, depth of the
dispersed sludge layer is significant
because of the peak flow conditions during the field test. The well concentrated sludge
layer has a thickness of approximately 3 feet.
5.3 Rotational Unitube Headers
There is another sludge collection facility commonly used in recent years2. In principle,
the tested rotational unitube headers collect and withdraw sludge along the entire clarifier
diameter thus they could avoid sludge dilution in the operations with less sludge
inventory.
Using the rotational unitube headers the concentrated sludge layers in Figures 13 are
substantially lowered in comparison with that in clarifiers equipped with scrappers and a
center hopper. The tested rotational unitube header was able to quickly return solids
inventory back into the bioreactors since the unitube header design with evenly space
orifices significantly lowers the dilution risk within the sludge compression layers. The
detailed modeling results conclude that the application of rotational unitube headers in
secondary clarifiers is an effective approach in terms of controlling the concentrated
sludge blanket layers.
Using the rotational unitube header the dispersed sludge layers in Figure 13(b) is similar
to that in the clarifiers equipped with the first alternative presented in Figure 13(a). The
direct impact of the tested rotational unitube header on the dispersed sludge layers, in
which the sludge concentration is less than the influent MLSS, is limited. The modeling
2 as exemplified by USFilter’s Tow-Bro® collectors
Highly condensed sludge layers
Diffused sludge layers
Figure 14 Sludge blanket stratifications
15
results illustrate not only a fast sludge compression and withdrawal process but also a
consistent higher sludge draw-off concentration in the clarifiers using tested rotational
unitube header. The simulation results can be confirmed by many field tests conducted by
the vendor in recent years.
6 Conclusions
As the examples illustrated here, a well developed clarifier modeling technology is a
powerful tool to help process design engineers and clarifier manufacturers in following
aspects:
1. Troubleshoot existing clarifiers and related process operations 2. Evaluated clarifier design under the specified process conditions 3. Develop reliable retrofit alternatives with the best cost-effectiveness
References
1. Adams, E.W. and Rodi, W. (1990),"Modeling Flow and Mixing in Sedimentation Tanks", J. Hydraulic Engineering,
ASCE, Vol. 116, No. 7.
2. Albertson, Orris (1995) Report of “Evaluation and Design Recommendations for the PVSC Final Clarifier Modifications”,
Personal communication. 3. Anderson, N.E., (1945) “Design of final settling tanks for activated sludge.” J. Water Pollut. Fed 17, 50
4. Casonato, M. and Gallerano, F. (1990) " A Finite Difference Self-adaptive Mesh Solution of Flow in a Sedimentation
Tank" Int. Journal for Numerical Methods in Fluids, Vol. 10, pp. 697-711. 5. Celik, I., Rodi, W. and Stamou, A. (1985), "Prediction of Hydrodynamic Characteristics of Rectangular Settling Tanks",
Proc. Int. Symp. Refined Flow Modeling and Turbulence Measurements, Iowa City, Iowa, U.S.A.
6. Daigger, G.T. (1995) “Development of refined clarifier operating diagrams using an updated settling characteristics database.” Water Environment Research, Volume 67, Number 1, 95-100
7. Dick, R.I. and K.W. Young (1972) “Analysis of thickening performance of final settling tanks.” paper presented at the 27th
Annual Purdue Industrial Waste Conference, Purdue University, Lafayette, Indiana, 34 pp 8. Dobbins, W.E. (1944), "Effect of Turbulence on Sedimentation", Transaction, ASCE, Vol. 109, No. 2218, pp. 629-656.
9. Imam, E., McCorquodale, J.A. and Bewtra, J.K. (1983), "Numerical Modeling of Sedimentation Tanks", ASCE, J.
Hydraulic Engineering, Vol. 109, No. 12, pp. 1740-1754. 10. Larsen, P. (1977), "On the Hydraulics of Rectangular Settling Basins, Experimental and Theoretical Studies", Dept. of
Water Resources Engineering, Lund Institute of Technology, Lund University, Report No. 1001, Lund Sweden.
11. Lyn, D.A. and Zhang, Z. (1989), "Boundary-Fitted Numerical Modeling of Sedimentation Tanks", Proc. 23rd, IAHR and AIRH, Ottawa, Canada.
12. Lyn, D.A., Stamou, A.I. and W. Rodi (1992), " Density Currents and Shear-Induced Flocculation in Sedimentation Tanks",
J. of Hydraulic Engineering, ASCE, Vol. 118(6), pp. 849-867. 13. Mazurczyk, A.L. et al (1980),"Methodology for assessing clarifier operation as demonstrated at Pruszkow, Poland", 53rd
Annual Conf. of WPCF, Las Vegas, USA.
14. McCorquodale, J.A. and Zhou, Siping, "Effects of Hydraulic and Solids Loading on Clarifier Performance", Vol.31, No.4, April 1993, Journal of Hydraulic Research, IAHR.
15. McCorquodale, J.A. and S. Zhou (1994) “Use of numerical models in clarifier design: optimization of inlet structures.”
paper presented at WEFTEC, the 67th Annual WEF Conference and Exposition, Chicago IL 16. Parker, D.A. (1983), "Assessment of secondary clarifier design concepts", J. WPCF, Vol. 55, No.4, 349-359.
17. Rodi, W. (1980), "Turbulence Models and Their Application in Hydraulics A State-of-the-Art Review", International
Association for Hydraulic Research, Delft, Netherlands. 18. Schamber, D.R. and Larock, B.E. (1981), "Numerical Analysis of Flow in Sedimentation Basins", J. of the Hydraulics
Division, ASCE, Vol. 107, No. HY5, pp. 575-591.
19. Takacs, I. and Patry, G. and Nolasco, D., (1991), " Dynamic Model of Clarifier-Thickening Process", Journal of Water Res, 25(10), 1263-1271.
20. Wahlberg, E.J., Peterson, M.A., and Flancher, D.M. (1993) “Field Application of the CRTC’s Protocol for Evaluating
Secondary Clarifier Performance: a Comparison of Sludge Removal Mechanisms in Circular Clarifiers.” Presented at the Rocky Mountain Water Pollution Control Association Annual Meeting, Albuquerque, New Mexico, September 20, 1993
21. Zhou, Siping and McCorquodale, J.A., "Modeling of Rectangular Settling Tanks", Vol. 118, No. 10, October 1992, Journal
of Hydraulic Engineering, ASCE, pp 1391-1405. 22. Zhou, Siping, McCorquodale, J.A. and Vitasovic, Z.," Influences of Density on Circular Clarifier with Baffles", Vol. 118,
No. 6, Nov./Dec. 1992, Journal of Environmental Engineering, ASCE, pp 829-847.
23. Zhou, Siping, McCorquodale, J.A. and Ji, Z. "Semi-Implicit Skew Upwind Method for Problems of Environmental Hydraulics", Vol. 17, October 1993, Int. Journal for Numerical Methods in Fluids, pp 803-823

16
24. Zhou, Siping, Vitasovic, C. Ji, Z. and Pfeil, R., “Impact of Design Features on Clarifier Performance”, 18th IAWQ Biennial
International Conference and Exhibition, June 1996, Singapore, Conference Preprint Book 3, pp 278-285. 25. Zhou, Siping, Vitasovic, Z., McCorquodale, J.A., Lipke, S, DeNicola, M. and Saurer, P., “Improving performance of large
rectangular clarifiers ”, Oct. 1997, Proceedings of WEFTEC’ 97 70th Annual Conference and Exposition, Chicago.