State of the Africa Region SUSTAINING GROWTH€¦ · Source: Seck et al. 2013 Annual yield growth...
25
1 State of the Africa Region SUSTAINING GROWTH AMID RISING GLOBAL RISKS
Transcript of State of the Africa Region SUSTAINING GROWTH€¦ · Source: Seck et al. 2013 Annual yield growth...
1
State of the Africa Region
SUSTAINING GROWTHAMID
RISING GLOBAL RISKS
RISING GLOBAL RISKS
2
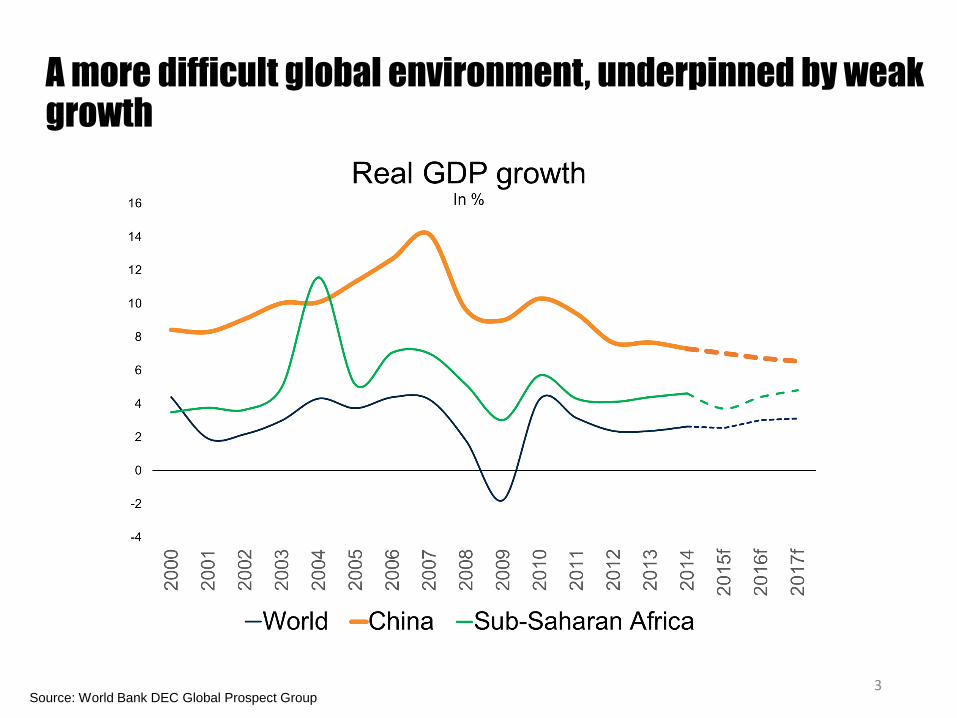
A more difficult global environment, underpinned by weak growth
3Source: World Bank DEC Global Prospect Group

Slowdown in trade
4

. . . and sharply lower and volatile commodity prices, signaling the end of the commodity super cycle
5Source: Bloomberg

CHALLENGES FOR AFRICA
6

Africa’s growth has been impressive, but recent growth trends are less robust
7Source: World Bank
0
2
4
6
8
10
12
SSA Oil-Rich Non Resource-Rich (Fast Growing)
Real GDP Growth(in %)
Average 2003-08 Average 2010-14

COMPOSITION OF GROWTH
8Source: World Bank
0
2
4
6
8
10
2003-08 2010-14 2003-08 2010-14 2003-08 2010-14
Sub-Saharan Africa Resource-Rich NonResource-Rich
Contribution of Economic Sectors to Growth (%)
Services
Resources
Manufacturing
Agriculture

Relative contribution of investment to growth has increased in resource-rich countries
Source: World Bank
9
34
39
19
85
45
37
12
17
9
27
10
11
-4
-2
0
2
4
6
8
10
12
2003-08 2010-14 2003-08 2010-14 2003-08 2010-14
Sub-Saharan Africa Oil-Rich NonResource-Rich (Fast-Growing)
Contribution of aggregate demand to output growth (%)
Net Exports
Public Consumption
Domestic Investment
Private Consumption
2003-082010-142003-08 2003-08 2010-14 2010-14
Oil-RichSub-Saharan Africa Non-Resource-Rich (Fast-Growing)

Capital accumulation is the main driver of growth
10
-0.5
0.0
0.5
1.0
1.5
2.0
2.5
Sub-Saharan Africa Resource-Rich NonResource-Rich NonResource-Rich -Fast Growing
Source of output per worker growth, 1995-2011 (percent per year)
Capital per worker Total factor productivity
Source: Feenstra, Robert C., Robert Inklaar and Marcel P. Timmer (2015), "The Next Generation of the Penn World Table" forthcoming American
Economic Review, available for download at www.ggdc.net/pwt

Poverty remains high, with fragile countries sharply lagging in reducing poverty
-
50
100
150
200
250
300
350
400
0
10
20
30
40
50
60
70
80
90
100
1990 2012 2012* with NGA
No
. of p
oo
r pe
op
le (M
illion
s)
Po
vert
y h
ead
cou
nt
(%)
56
4337
284
338
389
Note: a) 2012* with NGA = using comparable and quality data, including Nigeria b) Rest are estimates from PovcalNet database. 11
Poverty headcount and number of poor
0
5
10
15
20
25
30
Fragile Non-fragile
Poverty reduction, 1996-2012, in percentage points

Worsening current account balances and downward pressure on currencies
Current account balance
12
Nominal exchange rate change
Source: IMF

Rising fiscal deficits are fueling the rise in debt
Fiscal deficit
13
Public debt
Source: IMF
Note: Republic of Congo received debt relief in 2010

The weight of concessional debt is declining, and countries are exposed to exchange rate risk
14Source: Bloomberg
Currency composition of public debt(in % of PPG debt)
Concessional debt(% of total external debt)

Yield on African sovereign debt has been increasing
15
Source: Bloomberg. JP Morgan Emerging Market Bond Index Yield for Africa. This graph represents the evolution of the secondary yield of African
sovereign debt

16
OPPORTUNITIES FOR GROWTH IN AFRICA
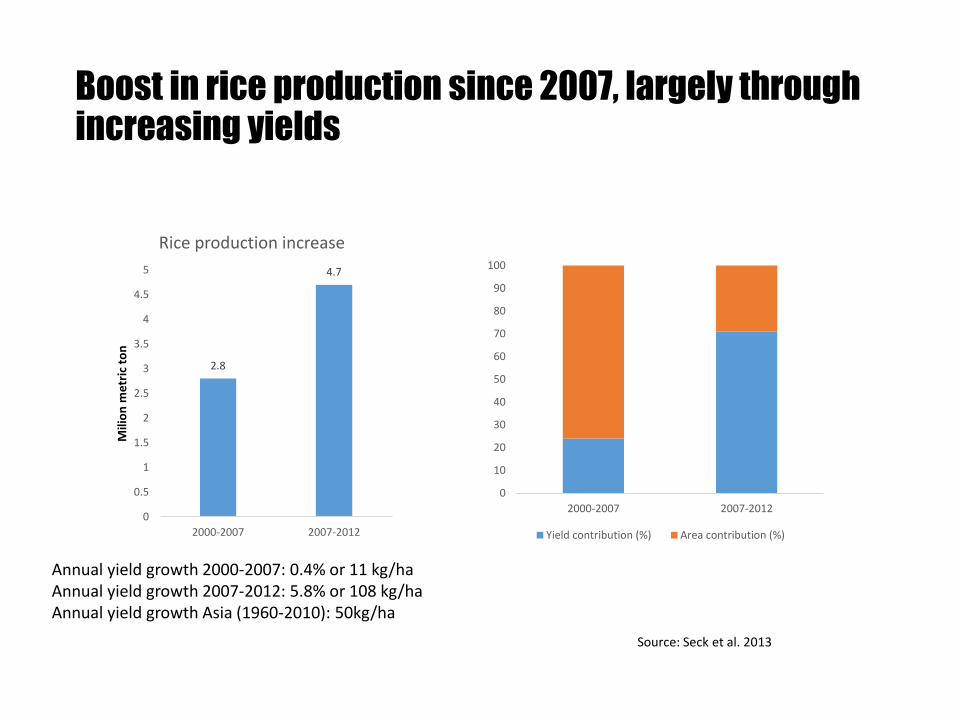
Boost in rice production since 2007, largely through increasing yields
2.8
4.7
0
0.5
1
1.5
2
2.5
3
3.5
4
4.5
5
2000-2007 2007-2012
Mili
on
me
tric
to
n
Rice production increase
0
10
20
30
40
50
60
70
80
90
100
2000-2007 2007-2012
Yield contribution (%) Area contribution (%)
Source: Seck et al. 2013
Annual yield growth 2000-2007: 0.4% or 11 kg/haAnnual yield growth 2007-2012: 5.8% or 108 kg/haAnnual yield growth Asia (1960-2010): 50kg/ha

Africa’s domestic resource mobilization is low
Source: IMF
18

Tax revenues are low, with varying structures across countries
Source: IMF
19
0
2
4
6
8
10
12
14
16
Sub-Saharan Africa Resource-Rich NonResource-Rich
Tax Revenues Composition(in % of GDP)
Taxes on International Trade
Taxes on income, profits andcapital gains
Taxes on Goods and Services
Other Taxes
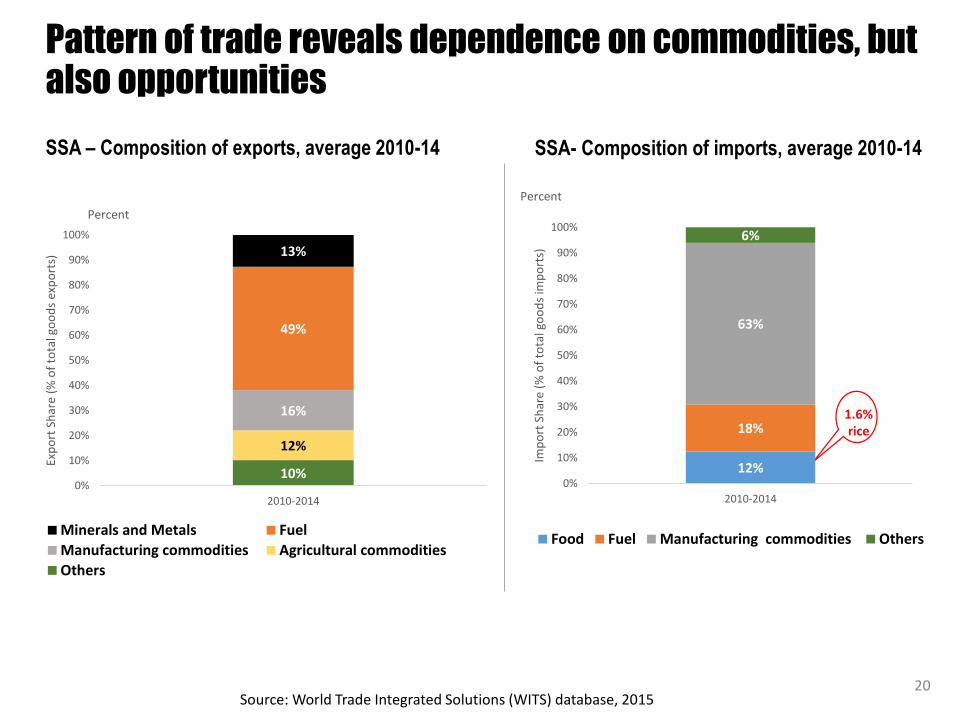
Pattern of trade reveals dependence on commodities, but also opportunities
20
SSA – Composition of exports, average 2010-14
Source: World Trade Integrated Solutions (WITS) database, 2015
SSA- Composition of imports, average 2010-14
% %
% %
1.6% rice
12%
18%
63%
6%
0%
10%
20%
30%
40%
50%
60%
70%
80%
90%
100%
2010-2014
Imp
ort
Sh
are
(% o
f to
tal g
oo
ds
imp
ort
s)
Percent
Food Fuel Manufacturing commodities Others
10%
12%
16%
49%
13%
0%
10%
20%
30%
40%
50%
60%
70%
80%
90%
100%
2010-2014
Exp
ort
Sh
are
(% o
f to
tal g
oo
ds
exp
ort
s)
Percent
Minerals and Metals Fuel
Manufacturing commodities Agricultural commodities
Others

21
High fertility rates reduce benefits of growth
0
1
2
3
4
5
Low fertility countries High fertility countries
Perc
enta
ge c
han
ge1
99
5-2
01
4 a
vera
ge
GDP
GDP per capita
GDP
GDP per capita
0
1
2
3
4
5
SSA MNA SAR LAC EAP OECD ECA
Total Fertility Rate (Births per woman)

Invest in human high-return capital
Few children in early child development programs despite proven high returns.
Few tertiary graduates, and few of them are in STEM fields.
22Source: African Center for Economic Transformation 2014
0
10
20
30
40
50
60
70
80
90
ECA LAC SSA SAR EAP MNA OECD
% o
f ch
ildre
n e
nro
lled
in e
arly
ch
ild e
du
cati
on
Source: World Development Indicators
STEM Non-STEM
0% 5% 10% 15% 20% 25% 30%
15 African countries
Global comparators
Percentage of population that graduates from tertiary education

Accelerate the reform agenda in energy
• Energy costs remain high
• High levels of subsidies are fiscally unsustainable
• Distribution companies are performing poorly
• Insufficient investment in maintenance
• High levels of commercial losses – a major obstacle to
private sector investment in production
• Good news -- private sector is increasingly involved in
energy production
• Need to sustain the reform agenda

CONCLUSION
24
MAJOR OPPORTUNITIES DESPITE CHALLENGES
1. Agriculture
2. Revenue Mobilization
3. Quality of spending
4. Energy
5. Demography
25