State of States - yourbudgit.com · Usually, the federal government collects revenue from crude oil...
48
State of States Quick Factsheet 2016 www.yourbudgit.com
Transcript of State of States - yourbudgit.com · Usually, the federal government collects revenue from crude oil...

State of States
Quick Factsheet 2016
www.yourbudgit.com

BUDGET TERMS

03
About BudgIT
BudgIT is a civic organisation driven to make the Nigerian budget and public data more understandable and accessible across every literacy span. BudgIT’s innovation within the public circle comes with a creative use of government data by either presenting these in simple tweets, interactive formats or infographic displays. Our primary goal is to use creative technology to intersect civic engagement and institutional reform.
Lead Partner : Oluseun Onigbinde
Research Team: Atiku Samuel, Oluwadamilola Oladunjoye, Ayomide Faleye, Olaleye Olaniyi, and Toluwanimi Cole (Intern)
Creative Development: Segun Adeniyi and Richard Ofunrein
Editor: Omowunmi Afolabi
Contact: [email protected] +234-803-727-6668, +234-908-333-1633Address: 3rd Floor, No. 13 Hughes Avenue, Alagomeji, Yaba, Lagos, Nigeria.
Data Sources: Office of Accountant-General of the Federation/Debt Management Office/National Bureau of Statistics/BudgIT Research
© 2016
Disclaimer: This document has been produced by BudgIT to provide information on budgets and public data issues. BudgIT hereby certifies that all the views expressed in this document accurately reflect our analytical views that we believe are reliable and fact- based.
State of States | Factsheet

Many state governments are faced with an increasingly huge budget deficit as they struggle to pay salaries, meet contractual obligations and service overhanging debts accumulated when oil price was relatively favourable.
Most states in Africa’s most populous country are highly leveraged when compared with revenue, leaving them vulnerable to the price volatility of crude oil which serves as the biggest contributor to the revenue basket.
Crude oil price came under intense pressure at the tail end of 2014 as the growth of demand trailed off and overproduction created a glut in the market.
The down tide significantly affected the revenue of states and basic commitments such as payment of salaries, utility bills, procurement of medical kits among others gradually became difficult, thereby prompting two-third of Nigeria’s 36 governors to demand for bailout.
Around the world, 46 percent of crude oil produced is converted to gasoline majorly used by cars, and other transportation equipment. But with massive investment and innovation in battery technology, shale oil and alternative fuel technology, the outlook of crude oil that backs most state governments debt has become bleak.
With this unfavorable outcome, state government debt holders and investors should have demanded sharp haircuts, reforms and a high degree of transparency - including the publishing of budget proposals, the enacted budget, budget implementation reports,audit reports, quarterly and annual reports for state-owned enterprises among others, as a precondition for investment.
However, bonds issued by Nigerian states are usually assisted by an irrevocable standing payment order (ISPOs), which legally empowers the Accountant General of the Federation (AGF) to withdraw money due to debt holders from state government’s revenue account held by the federal government. Hence, the little level of transparency.
As about 75% of state government's revenue are collected by the federal government, the state government only gets the balance after obligations to debt holders are deducted at source. Based on this revenue disbursement process, the governors of the 36 states under the aegis of the Nigeria’s Governors Forum (NGF) promptly demanded a Fiscal Restructuring Plan that intends to see more revenue allocated to states at the expense of the federal government.
04
Introduction
State of States | Factsheet

Usually, the federal government collects revenue from crude oil and natural gas on behalf of the federation, and about 13% of accrued income of the government from the oil sector is deducted and handed over to the states where the commodity originates from. Then approximately 52% of the balance is retained by the federal government while the balance goes to the state and the state-controlled entity (local government) using a web of complicated calculations that make use of population among others.
Regarding tax revenue, the state government and state-controlled entities (local government) collect and control 100% revenue generated from personal income tax, property tax, road tax, radio and television tax among other networks of complex and somewhat overlapping tax.
But the federal government, collects VAT - a form of consumption tax, on behalf of the states but retains approximately 15% as the cost of collection,Company Income Tax (CIT) and revenue from customs duties and excise are collected by the federal government on behalf of the federation, retaining approximately 52% and releasing the balance to states and state-controlled entities.
It can be said that the volume of revenue pulled from taxation is strongly connected to the overall health of the economy. Hence, our economic health is obviously unstable as Nigeria is presently in an economic recession with the gross domestic product (GDP) - the sum total of economy activities undertaken - contracting for two quarters.
The state governments therefore need to tremendously embrace high level of transparency and accountability, develop workable economic plans, take haircuts especially on overheads, and expand their internally generated revenue (IGR) base.
05State of States | Factsheet

Abia God’s Own State
ABIA
AN
AM
BR
A
Date Created: 27 August 1991Governor: Okezie Ikpeazu
**AVERAGE MONTHLY RECURRENT EXPENDITURE(JAN-JUN 2016)
N5.77bnN
AVERAGE MONTHLY PERSONNEL COST (JAN-JUN 2016)
N2.7bn
BREAKDOWN
AVERAGE MONTHLY OVERHEADCOST (JAN-JUN 2016)
N3.07m
ABILITY TO MEET MONTHLY RECURRENT EXPENDITURE COMMITMENTS (JAN - JUN 2016)
Monthly commitments (Recurrent expenditure)
Total average monthly revenueN3.56bn
N5.77bn
-N2.21bn(Bad Indicator)Shortfall
EXTERNALDEBT
$41.5m
DOMESTIC DEBT
N33.5bnN
TOTAL DEBT STOCK
N41.7bn2015
20112012201320142015
N48.2bnN53.5bn
N61.1bnN54.9bn
N40.1bn
NET FAAC ALLOCATION
20112012201320142015 N13.3bn
IGR20112012201320142015
N29.5bnN14.3bn
N37.2bnN31.2bn
N41.7bn
TOTAL DEBT STOCK
N11.8bnN16.8bn
N12.5bnN12.4bn
06State of States | Factsheet
JAN FEB MAR APR MAY JUNNET FAAC ALLOCATION 2016
N2.3bnN1.9bn
N2.1bn N2.1bn N1.9bn
N3.6bn
VAT
AVERAGE MONTHLY VAT(JAN-JUN 2016)
N648.1mAVERAGE MONTHLY INTERNALLY GENERATED REVENUE (JAN-JUN 2016)
N1.12bn
N
AVERAGE MONTHLYSTATUTORY ALLOCATION (JAN-JUN 2016)
N1.63bnAVERAGE MONTHLY 13% SHARE OF DERIVATION (JAN-JUN 2016)
N167.2m
IGR
BREAKDOWN
*AVERAGE MONTHLY REVENUE (JAN-JUN 2016)
N3.56bn
30.9%
69.1%
Structure of State’s Revenue 2016
IGR
NET FAAC
Abia seems to remain in an unfavourable financial position as her monthly recurrent expenditure continues to rise despite a weak revenue base. Although the state has a large informal clusters that serve as inputs for industries across the country, Abia has not been able take maximum advantage to raise her revenue profile.
*Based on Average FAAC Allocation and IGR Calculations on previous year **Based on Average 2016 Recurrent Expenditure projections

JAN FEB MAR APR MAY JUNNET FAAC ALLOCATION 2016
N2.2bn N2.0bn N2.0bnN2.0bnN1.8bn
N3.5bn
15.5%
84.5%
Structure of State’s Revenue 2016
IGR
NET FAAC
20112012201320142015
N48.6bnN51.5bnN57.8bn
N50.9bnN37.8bn
NET FAAC ALLOCATION
20112012201320142015
IGR20112012201320142015
N30.6bnN29.0bn
N20.9bnN34.9bn
N56.9bn
TOTAL DEBT STOCK
N4.1bnN4.6bnN4.1bn
N4.9bnN4.45n
AdamawaLand of Beauty
VAT
AVERAGE MONTHLY VAT(JAN-JUN 2016)
N677.5mAVERAGE MONTHLY INTERNALLY GENERATED REVENUE (JAN-JUN 2016)
N370.98m
N
AVERAGE MONTHLYSTATUTORY ALLOCATION (JAN-JUN 2016)
N1.74bnAVERAGE MONTHLY 13% SHARE OF DERIVATION (JAN-JUN 2016)
N/A
IGR
BREAKDOWN
**AVERAGE MONTHLY RECURRENT EXPENDITURE(JAN-JUN 2016)
N5.01bnN
AVERAGE MONTHLY PERSONNEL COST (JAN-JUN 2016)
N1.75bn
BREAKDOWN
AVERAGE MONTHLY OVERHEADCOST (JAN-JUN 2016)
N3.26m
ABILITY TO MEET MONTHLY RECURRENT EXPENDITURE COMMITMENTS (JAN - JUN 2016)
Monthly commitments (Recurrent expenditure)
Total average monthly revenueN2.79bn
N5.01bn
-N2.22bn(Bad Indicator)Shortfall
EXTERNALDEBT
$49.1m
DOMESTIC DEBT
N47.2bnN
TOTAL DEBT STOCK
N56.9bn2015
ADAMAWA
Date Created: 27 August 1991Governor: Bindo Jibrilla
07
*AVERAGE MONTHLY REVENUE (JAN-JUN 2016)
N2.79bn
Adamawa state relies solely on the Federation allocations. Her average monthly IGR is less than N500m which is terribly awful. Insurgency has dampened her economic outlook but a clear path to sustainability will be agriculture and her entire value chain.
*Based on Average FAAC Allocation and IGR Calculations on previous year **Based on Average 2016 Recurrent Expenditure projections State of States | Factsheet

AKWA-IBOM
Date Created: 22 September 1987
Governor: Udom Gabriel Emmanuel
Akwa IbomLand of Promise
VAT
AVERAGE MONTHLY VAT(JAN-JUN 2016)
N725.91mAVERAGE MONTHLY INTERNALLY GENERATED REVENUE (JAN-JUL 2016)
N1.23bn
N
AVERAGE MONTHLYSTATUTORY ALLOCATION (JAN-JUN 2016)
N1.76bnAVERAGE MONTHLY 13% SHARE OF DERIVATION (JAN-JUN 2016)
N6.09bn
IGR
*AVERAGE MONTHLY REVENUE (JAN-JUN 2016)
N9.8bn
BREAKDOWN
**AVERAGE MONTHLY RECURRENT EXPENDITURE(JAN-JUN 2016)
N15.08bnN
AVERAGE MONTHLY PERSONNEL COST (JAN-JUN 2016)
N4.41bn
BREAKDOWN
AVERAGE MONTHLY OVERHEADCOST (JAN-JUN 2016)
N10.67bn
ABILITY TO MEET MONTHLY RECURRENT EXPENDITURE COMMITMENTS (JAN - JUN 2016)
Monthly commitments (Recurrent expenditure)
Total average monthly revenueN9.81bn
N15.08bn
-N5.27bn(Bad Indicator)Shortfall
EXTERNALDEBT
$52.7m
DOMESTIC DEBT
N147.6bnN
TOTAL DEBT STOCK
N157.9bn2015
As the largest beneficiary of the revenue that comes from the oil sector, it is obvious that collapse in the price of crude oil has affected the FAAC allocations. Her IGR in comparison to Rivers and Delta State is very weak. The state needs to position herself as a hub and would need to do more to expand her IGR to keep the fiscal state stable.
08
20112012201320142015
N240.4bnN254.2bn
N294.7bnN258.3bn
N163.9bn
NET FAAC ALLOCATION
20112012201320142015 N14.8bn
N11.7bnN13.5bn
N15.4bnN15.7bn
IGR20112012201320142015
N51.2bnN118.5bn
N134.9bnN92.4bn
N157.9bn
TOTAL DEBT STOCK
JUNNET FAAC ALLOCATION 2016
N9.1bn
JAN FEB MAR APR MAY
N8.6bnN8.9bn
N8.3bn
N6.6bn N6.8bn13.9%
86.1%
Structure of State’s Revenue 2016
IGR
NET FAAC
*Based on Average FAAC Allocation and IGR Calculations on previous year **Based on Average 2016 Recurrent Expenditure projections State of States | Factsheet

Anambra Light of the Nation
VAT
AVERAGE MONTHLY VAT(JAN-JUN 2016)
N750.05mAVERAGE MONTHLY INTERNALLY GENERATED REVENUE (JAN-JUN 2016)
N1.23bn
N
AVERAGE MONTHLYSTATUTORY ALLOCATION (JAN-JUN 2016)
N1.74bnAVERAGE MONTHLY 13% SHARE OF DERIVATION (JAN-JUN 2016)
N/A
IGR
*AVERAGE MONTHLY REVENUE (JAN-JUN 2016)
N3.7bn
BREAKDOWN
**AVERAGE MONTHLY RECURRENT EXPENDITURE(JAN-JUN 2016)
N4.05bnN
AVERAGE MONTHLY PERSONNEL COST (JAN-JUN 2016)
N1.38bn
BREAKDOWN
AVERAGE MONTHLY OVERHEADCOST (JAN-JUN 2016)
N2.67bn
ABILITY TO MEET MONTHLY RECURRENT EXPENDITURE COMMITMENTS (JAN - JUN 2016)
Monthly commitments (Recurrent expenditure)
Total average monthly revenueN3.72bn
N4.05bn
-N331.55m(Bad Indicator)
Shortfall
Anambra state fiscal structure seem to be trailing off from her prudent economic history. However, the state's drive to grow her IGR is encouraging. With Onitsha and Nnewi being hub for retail products, Anambra needs to do more to expand her internally generated revenues.
ANAMBRA
Date Created: 27 August 1991Governor: Willie Obiano
09
20112012201320142015
N50.6bnN54.5bn
N58.9bnN52.2bn
N40.4bn
NET FAAC ALLOCATION
20112012201320142015 N14.8bn
N6.1bnN7.6bnN8.7bnN10.5bn
IGR20112012201320142015
N10.3bnN18.5bn
N7.9bnN11.0bnN15.6bn
TOTAL DEBT STOCK
JAN FEB MAR APR MAY JUNNET FAAC ALLOCATION 2016
N2.5bnN2.3bn N2.1bn N2.1bn N2.1bn
N3.8bn
25.9%
74.1%
Structure of State’s Revenue 2016
IGR
NET FAAC
EXTERNALDEBT
$60.8m
DOMESTIC DEBT
N3.58bnN
TOTAL DEBT STOCK
N15.6bn2015
*Based on Average FAAC Allocation and IGR Calculations on previous year **Based on Average 2016 Recurrent Expenditure projections State of States | Factsheet

BauchiPearl of Tourism
VAT
AVERAGE MONTHLY VAT(JAN-JUN 2016)
N771.35mAVERAGE MONTHLY INTERNALLY GENERATED REVENUE (JAN-JUN 2016)
N449.48m
N
AVERAGE MONTHLYSTATUTORY ALLOCATION (JAN-JUN 2016)
N2.09bnAVERAGE MONTHLY 13% SHARE OF DERIVATION (JAN-JUN 2016)
N/A
IGR
*AVERAGE MONTHLY REVENUE (JAN-JUN 2016)
N3.3bn
BREAKDOWN
20112012201320142015
N54.9bnN59.1bn
N64.5bnN57.3bn
N41.2bn
NET FAAC ALLOCATION
20112012201320142015 N5.4bn
N4.5bnN4.1bn
N4.9bnN4.9bn
IGR20112012201320142015
N28.5bnN29.3bnN28.1bn
N43.8bnN74.5bn
TOTAL DEBT STOCK
**AVERAGE MONTHLY RECURRENT EXPENDITURE(JAN-JUN 2016)
N5.41bnN
AVERAGE MONTHLY PERSONNEL COST (JAN-JUN 2016)
N2.1bn
BREAKDOWN
AVERAGE MONTHLY OVERHEADCOST (JAN-JUN 2016)
N3.31bn
ABILITY TO MEET MONTHLY RECURRENT EXPENDITURE COMMITMENTS (JAN - JUN 2016)
Monthly commitments (Recurrent expenditure)
Total average monthly revenueN3.31bn
N5.41bn
-N2.09bn(Bad Indicator)
Shortfall
EXTERNALDEBT
$85.3m
DOMESTIC DEBT
N57.7bnN
TOTAL DEBT STOCK
N74.5bn2015
Jalingo
BAUCHI
Date Created: 3 February 1976Governor: Muhammed Abubakar
10
JAN FEB MAR APR MAY JUNNET FAAC ALLOCATION 2016
N2.6bnN2.3bn N2.2bn
N2.0bnN1.9bn
N4.0bn
13.9%
86.1%
Structure of State’s Revenue 2016
IGR
NET FAAC
Bauchi a relatively small state has a bad fiscal structure, with a surprising large monthly recurrent expenditure of N5.41bn. If her monthly IGR remain N449.48m and her average monthly wage bill continue to increase, the state will continually nose dive financially. Bauchi has a great chance to make tourism lead her internal revenues drive.
*Based on Average FAAC Allocation and IGR Calculations on previous year **Based on Average 2016 Recurrent Expenditure projections State of States | Factsheet

BayelsaGlory of all Lands
BAYELSA
VAT
AVERAGE MONTHLY VAT(JAN-JUN 2016)
N578.52mAVERAGE MONTHLY INTERNALLY GENERATED REVENUE (JAN-JUN 2016)
N726.13m
N
AVERAGE MONTHLYSTATUTORY ALLOCATION (JAN-JUN 2016)
N1.54bnAVERAGE MONTHLY 13% SHARE OF DERIVATION (JAN-JUN 2016)
N3.24bn
IGR
*AVERAGE MONTHLY REVENUE (JAN-JUN 2016)
N6.1bn
BREAKDOWN
20112012201320142015
N161.6bnN158.4bn
N187.9bnN150.9bn
N88.3bn
NET FAAC ALLOCATION
20112012201320142015 N8.7bn
N3.7bnN4.9bn
N10.5bnN10.9bn
IGR20112012201320142015
N167.2bnN226.8bn
N74.1bnN97.9bn
N110.8bn
TOTAL DEBT STOCK
**AVERAGE MONTHLY RECURRENT EXPENDITURE(JAN-JUN 2016)
N11.05bnN
AVERAGE MONTHLY PERSONNEL COST (JAN-JUN 2016)
N4.20bn
BREAKDOWN
AVERAGE MONTHLY OVERHEADCOST (JAN-JUN 2016)
N6.85bn
ABILITY TO MEET MONTHLY RECURRENT EXPENDITURE COMMITMENTS (JAN - JUN 2016)
Monthly commitments (Recurrent expenditure)
Total average monthly revenueN6.09bn
N11.05bn
-N4.96bn(Bad Indicator)
Shortfall
EXTERNALDEBT
$37.6m
DOMESTIC DEBT
N103.34bnN
TOTAL DEBT STOCK
N110.8bn2015
Date Created: 1 October 1996Governor: Henry Dickson
11
JAN FEB MAR APR MAY JUNNET FAAC ALLOCATION 2016
N3bn
N2.2bn N2.4bn
N3.4bnN2.8bn
N5bn
22.6%
77.4%
Structure of State’s Revenue 2016
IGR
NET FAAC
The oil rich state is neck deep in debt, with a total debt stock topping N110.8bn as at the end of fiscal year 2015. Her average monthly recurrent expenditure commitment remains abnormally high at N11.05bn. Bayelsa is a poster-child of mismanagement, she currently owes workers up to 3 month salaries although her population is less than that of Alimosho Local Government.
*Based on Average FAAC Allocation and IGR Calculations on previous year **Based on Average 2016 Recurrent Expenditure projections State of States | Factsheet

BenueFood basket of the Nation
BENUE
ENUGU
VAT
AVERAGE MONTHLY VAT(JAN-JUN 2016)
N751.29mAVERAGE MONTHLY INTERNALLY GENERATED REVENUE (JAN-JUN 2016)
N635.92m
N
AVERAGE MONTHLYSTATUTORY ALLOCATION (JAN-JUN 2016)
N1.96bnAVERAGE MONTHLY 13% SHARE OF DERIVATION (JAN-JUN 2016)
N/A
IGR
*AVERAGE MONTHLY REVENUE (JAN-JUN 2016)
N3.3bn
BREAKDOWN
20112012201320142015
N49.6bnN53.3bn
N58.2bnN52.8bn
N37.8bn
NET FAAC ALLOCATION
20112012201320142015 N7.6bn
N11.1bnN8.4bnN8.4bnN8.3bn
IGR20112012201320142015
N20.9bnN28.8bnN29.9bn
N23.8bnN46.9bn
TOTAL DEBT STOCK
**AVERAGE MONTHLY RECURRENT EXPENDITURE(JAN-JUN 2016)
N5.53bnN
AVERAGE MONTHLY PERSONNEL COST (JAN-JUN 2016)
N2.8bn
BREAKDOWN
AVERAGE MONTHLY OVERHEADCOST (JAN-JUN 2016)
N2.64bn
ABILITY TO MEET MONTHLY RECURRENT EXPENDITURE COMMITMENTS (JAN - JUN 2016)
Monthly commitments (Recurrent expenditure)
Total average monthly revenueN3.34bn
N5.54bn
-N2.19bn(Bad Indicator)
Shortfall
EXTERNALDEBT
$35.70m
DOMESTIC DEBT
N39.94bnN
TOTAL DEBT STOCK
N46.99bn2015
Date Created: 2 February 1976Governor: Samuel Ortom
12
JAN FEB MAR APR MAY JUNNET FAAC ALLOCATION 2016
N2.1bnN1.8bn N1.7bn N1.7bn N1.5bn
N3.9bn
24.5%
75.5%
Structure of State’s Revenue 2016
IGR
NET FAAC
Benue “the food basket of the nation” has not been able to attract agro-allied products. Benue state's fiscal situation is difficult with the current Governor inheriting a mass of unpaid salaries and ballooned debt. If the state's spendings are not checked and radical fiscal reforms quickly undertaken, she could be heading for a fiscal breakdown.
*Based on Average FAAC Allocation and IGR Calculations on previous year **Based on Average 2016 Recurrent Expenditure projections State of States | Factsheet

BornoHome of Peace
VAT
AVERAGE MONTHLY VAT(JAN-JUN 2016)
N732.60mAVERAGE MONTHLY INTERNALLY GENERATED REVENUE (JAN-JUN 2016)
N294.19m
N
AVERAGE MONTHLYSTATUTORY ALLOCATION (JAN-JUN 2016)
N2.17bnAVERAGE MONTHLY 13% SHARE OF DERIVATION (JAN-JUN 2016)
N/A
IGR
*AVERAGE MONTHLY REVENUE (JAN-JUN 2016)
N3.2bn
BREAKDOWN
20112012201320142015
N58.7bnN61.7bn
N68.4bnN63.2bn
N48.2bn
NET FAAC ALLOCATION
20112012201320142015 N3.5bn
N2.3bnN2.4bnN2.1bn
N2.8bn
IGR20112012201320142015
N3.8bnN26.6bn
N26.4bnN26.5bnN26.9bn
TOTAL DEBT STOCK
**AVERAGE MONTHLY RECURRENT EXPENDITURE(JAN-JUN 2016)
N4.25bnN
AVERAGE MONTHLY PERSONNEL COST (JAN-JUN 2016)
N2.7bn
BREAKDOWN
AVERAGE MONTHLY OVERHEADCOST (JAN-JUN 2016)
N1.55bn
ABILITY TO MEET MONTHLY RECURRENT EXPENDITURE COMMITMENTS (JAN - JUN 2016)
Monthly commitments (Recurrent expenditure)
Total average monthly revenueN3.19bn
N4.25bn
-N1.05bn(Bad Indicator)Shortfall
BORNO
Date Created: 27 August 1991Governor: Kashim Shettima
13
JAN FEB MAR APR MAY JUNNET FAAC ALLOCATION 2016
N2.9bnN2.7bn N2.4bn N2.4bn N2.1bn
N4.3bn
7.6%
92.4%Structure of State’s Revenue 2016
IGR
NET FAAC
$28.19m
DOMESTIC DEBT
N22.34bnN
TOTAL DEBT STOCK
N26.91bn2015
EXTERNALDEBT
The war torn state is in dire need of an urgent economic makeover. However, current financial indices potentially stall this. The state's total revenue can only cover her average monthly wage bill which is not healthy for a state that is on an economic revival journey. A commitment to run lean civil service will be helpful for her economic state, and lift the financial burden.
*Based on Average FAAC Allocation and IGR Calculations on previous year **Based on Average 2016 Recurrent Expenditure projections State of States | Factsheet

Cross RiverThe Peoples’ Paradise
VAT
AVERAGE MONTHLY VAT(JAN-JUN 2016)
N652.99mAVERAGE MONTHLY INTERNALLY GENERATED REVENUE (JAN-JUN 2016)
N1.13bn
N
AVERAGE MONTHLYSTATUTORY ALLOCATION (JAN-JUN 2016)
N1.75bnAVERAGE MONTHLY 13% SHARE OF DERIVATION (JAN-JUN 2016)
N/A
IGR
*AVERAGE MONTHLY REVENUE (JAN-JUN 2016)
N3.5bn
BREAKDOWN
20112012201320142015
N52.5bnN51.4bn
N53.5bnN49.8bn
N30.0bn
NET FAAC ALLOCATION
20112012201320142015 N13.6bn
N9.2bnN12.7bnN12.0bnN15.7bn
IGR20112012201320142015
N107.9bnN108.5bn
N135.5bnN131.1bn
N142.4bn
TOTAL DEBT STOCK
**AVERAGE MONTHLY RECURRENT EXPENDITURE(JAN-JUN 2016)
N5.41bnN
AVERAGE MONTHLY PERSONNEL COST (JAN-JUN 2016)
N2.08bn
BREAKDOWN
AVERAGE MONTHLY OVERHEADCOST (JAN-JUN 2016)
N3.33bn
ABILITY TO MEET MONTHLY RECURRENT EXPENDITURE COMMITMENTS (JAN - JUN 2016)
Monthly commitments (Recurrent expenditure)
Total average monthly revenueN3.54bn
N5.40bn
-N1.87bn(Bad Indicator)
Shortfall
With a rather unique history of revenue growth from 2011-2014, the current financial status of the state is not enviable. The state throws around ambitious numbers and projects that lack sound economic fundamentals. The state need to maximise her tourist potential and continue in the precedence set by former leaders. Cross River has the potential to be a manufacturing hub for South-South Nigeria.
CROSS RIV
ER
Date Created: 27 May 1967
Governor: Benedict Ayade
14
$136.40m
DOMESTIC DEBT
N115.52bnN
TOTAL DEBT STOCK
N142.43bn2015
EXTERNALDEBT
JAN FEB MAR APR MAY JUNNET FAAC ALLOCATION 2016
N1.1bn
N967.5m
N1.2bn N1.2bn
N804.1m
N2.7bn
49.9%
50.1%
Structure of State’s Revenue 2016
IGR
NET FAAC
*Based on Average FAAC Allocation and IGR Calculations on previous year **Based on Average 2016 Recurrent Expenditure projections State of States | Factsheet

DeltaThe Finger of God
VAT
AVERAGE MONTHLY VAT(JAN-JUN 2016)
N804.84mAVERAGE MONTHLY INTERNALLY GENERATED REVENUE (JAN-JUN 2016)
N3.40bn
N
AVERAGE MONTHLYSTATUTORY ALLOCATION (JAN-JUN 2016)
N1.77bnAVERAGE MONTHLY 13% SHARE OF DERIVATION (JAN-JUN 2016)
N4.34bn
IGR
*AVERAGE MONTHLY REVENUE (JAN-JUN 2016)
N10.3bn
BREAKDOWN
N328.3bn
20112012201320142015
N211.7bnN203.6bn
N217.9bnN188.9bn
N120.1bn
NET FAAC ALLOCATION
20112012201320142015 N40.8bn
N34.8bnN45.6bn
N50.2bnN42.8bn
IGR20112012201320142015
N93.3bnN86.6bn
N105.2bnN216.3bn
TOTAL DEBT STOCK
**AVERAGE MONTHLY RECURRENT EXPENDITURE(JAN-JUN 2016)
N12.77bnN
AVERAGE MONTHLY PERSONNEL COST (JAN-JUN 2016)
N5.7bn
BREAKDOWN
AVERAGE MONTHLY OVERHEADCOST (JAN-JUN 2016)
N7.06bn
ABILITY TO MEET MONTHLY RECURRENT EXPENDITURE COMMITMENTS (JAN - JUN 2016)
Monthly commitments (Recurrent expenditure)
Total average monthly revenueN10.32bn
N12.77bn
-N2.45bn(Bad Indicator)
Shortfall
EXTERNALDEBT
$38.79m
DOMESTIC DEBT
N320.60bnN
TOTAL DEBT STOCK
N328.26bn2015
Another large recipient of the oil revenue is surprisingly neck deep in debt with a sum of (N328.3bn). The state's total average monthly revenue of N10.3bn can’t cover her N12.77bn average monthly recurrent expenditure. Delta State runs a huge recurrent bill that cannot be understood considering her size. The government needs to put serious fiscal reforms in place.
Delta
Date Created: 27 August 1991
Governor: Arthur Okowa Ifeanyi
15
JAN FEB MAR APR MAY JUNNET FAAC ALLOCATION 2016
N6.1bn
N6.5bnN6.4bn
N4.2bnN2.9bn
N5.1bn 40.7%
59.3%
Structure of State’s Revenue 2016
IGR
NET FAAC
*Based on Average FAAC Allocation and IGR Calculations on previous year **Based on Average 2016 Recurrent Expenditure projections State of States | Factsheet

Ebonyi Salt of the Nation
VAT
AVERAGE MONTHLY VAT(JAN-JUN 2016)
N603.67mAVERAGE MONTHLY INTERNALLY GENERATED REVENUE (JAN-JUN 2016)
N919.37m
N
AVERAGE MONTHLYSTATUTORY ALLOCATION (JAN-JUN 2016)
N1.56bnAVERAGE MONTHLY 13% SHARE OF DERIVATION (JAN-JUN 2016)
N/A
IGR
*AVERAGE MONTHLY REVENUE (JAN-JUN 2016)
N3.1bn
BREAKDOWN
20112012201320142015
N34.9bnN37.9bn
N42.2bnN39.5bn
N30.5bn
NET FAAC ALLOCATION
20112012201320142015 N11.0bn
N2.3bn
N8.2bnN10.4bnN11.0bn
IGR20112012201320142015
N46.8bnN35.4bn
N20.1bnN15.2bn
N43.5bn
TOTAL DEBT STOCK
**AVERAGE MONTHLY RECURRENT EXPENDITURE(JAN-JUN 2016)
N3.23bnN
AVERAGE MONTHLY PERSONNEL COST (JAN-JUN 2016)
N1.4bn
BREAKDOWN
AVERAGE MONTHLY OVERHEADCOST (JAN-JUN 2016)
N1.83bn
ABILITY TO MEET MONTHLY RECURRENT EXPENDITURE COMMITMENTS (JAN - JUN 2016)
Monthly commitments (Recurrent expenditure)
Total average monthly revenueN3.08bn
N3.23bn
-N145.26m(Bad Indicator)
Shortfall
EBONYI
Date Created: 1 October 1996
Governor: David Nweze Umahi
16
JAN FEB MAR APR MAY JUNNET FAAC ALLOCATION 2016
N2.2bnN1.9bn N1.8bn N1.8bn N1.8bn
N3.4bn
29.8%
70.2%
Structure of State’s Revenue 2016
IGR
NET FAAC
Like some states, Ebonyi could fall short in fulfilling her monthly financial obligations (N3.23bn) if she does not develop and implement methods to revive her IGR apparatus, reduce her overheads and expand the potential growth areas of the economy. With the famed Abakaliki rice, Ebonyi can actually use agriculture to carve a self-sustaining outlook for herself.
EXTERNALDEBT
$47.17m
DOMESTIC DEBT
N34.17bnN
TOTAL DEBT STOCK
N43.47bn2015
*Based on Average FAAC Allocation and IGR Calculations on previous year **Based on Average 2016 Recurrent Expenditure projections State of States | Factsheet
Edo The Heartbeat of the Nation
VAT
AVERAGE MONTHLY VAT(JAN-JUN 2016)
N729.86mAVERAGE MONTHLY INTERNALLY GENERATED REVENUE (JAN-JUN 2016)
N1.59bn
N
AVERAGE MONTHLYSTATUTORY ALLOCATION (JAN-JUN 2016)
N1.63bnAVERAGE MONTHLY 13% SHARE OF DERIVATION (JAN-JUN 2016)
N408.78m
IGR
*AVERAGE MONTHLY REVENUE (JAN-JUN 2016)
N4.4bn
BREAKDOWN
20112012201320142015
N58.2bnN58.4bn
N65.2bnN58.1bn
N40.1bn
NET FAAC ALLOCATION
20112012201320142015 N19.1bn
N14.76bnN18.9bnN18.9bnN17.0bn
IGR20112012201320142015
N45.8bnN68.9bn
N55.3bnN62.3bn
N79.5bn
TOTAL DEBT STOCK
**AVERAGE MONTHLY RECURRENT EXPENDITURE(JAN-JUN 2016)
N4.38bnN
AVERAGE MONTHLY PERSONNEL COST (JAN-JUN 2016)
N2.11bn
BREAKDOWN
AVERAGE MONTHLY OVERHEADCOST (JAN-JUN 2016)
N2.27bn
ABILITY TO MEET MONTHLY RECURRENT EXPENDITURE COMMITMENTS (JAN - JUN 2016)
Monthly commitments (Recurrent expenditure)
Total average monthly revenueN4.36bn
N4.38bn
-N19.35m(Bad Indicator)
Shortfall
EXTERNALDEBT
$168.19m
DOMESTIC DEBT
N46.29bnN
TOTAL DEBT STOCK
N79.47bn2015
Edo State is piling up debt too fast and her share of the 13% allocation is shrinking on a yearly basis. Undoubtedly, the state may run into more debt except drastic action is taken to reduce it recurrent expenditure commitments and redirect her efforts in boosting its IGR.
EDO
Date Created: 27 August 1991
Governor: Adams Oshiomhole
17
JAN FEB MAR APR MAY JUNNET FAAC ALLOCATION 2016
N2.1bn N2bn N1.9bn N1.7bnN1.2bn
N2.9bn
41.9%
58.1%
Structure of State’s Revenue 2016
IGR
NET FAAC
*Based on Average FAAC Allocation and IGR Calculations on previous year **Based on Average 2016 Recurrent Expenditure projections State of States | Factsheet

EkitiLand of Honour
VAT
AVERAGE MONTHLY VAT(JAN-JUN 2016)
N617.81mAVERAGE MONTHLY INTERNALLY GENERATED REVENUE (JAN-JUN 2016)
N274.81m
N
AVERAGE MONTHLYSTATUTORY ALLOCATION (JAN-JUN 2016)
N1.56bnAVERAGE MONTHLY 13% SHARE OF DERIVATION (JAN-JUN 2016)
N/A
IGR
*AVERAGE MONTHLY REVENUE (JAN-JUN 2016)
N2.5bn
BREAKDOWN
20112012201320142015
N40.5bnN39.8bnN44.3bn
N40.1bnN28.2bn
NET FAAC ALLOCATION
20112012201320142015 N3.3bn
N2.5bnN3.8bn
N2.3bnN3.5bn
IGR20112012201320142015
N29.2bnN45.2bn
N28.3bnN38.9bn
N63.4bn
TOTAL DEBT STOCK
**AVERAGE MONTHLY RECURRENT EXPENDITURE(JAN-JUN 2016)
N3.58bnN
AVERAGE MONTHLY PERSONNEL COST (JAN-JUN 2016)
N2.12bn
BREAKDOWN
AVERAGE MONTHLY OVERHEADCOST (JAN-JUN 2016)
N1.46bn
ABILITY TO MEET MONTHLY RECURRENT EXPENDITURE COMMITMENTS (JAN - JUN 2016)
Monthly commitments (Recurrent expenditure)
Total average monthly revenueN2.45bn
N3.58bn
N-1.13bn(Bad Indicator)
Shortfall
Ekiti is one of the state on the lowest rung of FAAC monthly allocation. She can boost her tourism with investment in Ikogosi but it is unclear if the leadership will follow up with equal zeal. The state's monthly recurrent expenditure of N3.58bn is abnormally high as against her average monthly revenue projections of N2.4bn. The state will need to do more in reducing cost of governance and improving her IGR receipts.
EKITI
Date Created: 1 October 1996Governor: Ayodele Fayose
18
JAN FEB MAR APR MAY JUNNET FAAC ALLOCATION 2016
N1.4bnN1.1bn
N1.2bn N1.3bn
N903.6m
N2.4bn
17.4%
82.6%
Structure of State’s Revenue 2016
IGR
NET FAAC
EXTERNALDEBT
$54.98m
DOMESTIC DEBT
N52.56bnN
TOTAL DEBT STOCK
N63.41bn2015
*Based on Average FAAC Allocation and IGR Calculations on previous year **Based on Average 2016 Recurrent Expenditure projections State of States | Factsheet

EnuguCoal City State
VAT
AVERAGE MONTHLY VAT(JAN-JUN 2016)
N718.55mAVERAGE MONTHLY INTERNALLY GENERATED REVENUE (JAN-JUN 2016)
N1.51bn
N
AVERAGE MONTHLYSTATUTORY ALLOCATION (JAN-JUN 2016)
N1.75bnAVERAGE MONTHLY 13% SHARE OF DERIVATION (JAN-JUN 2016)
N/A
IGR
*AVERAGE MONTHLY REVENUE (JAN-JUN 2016)
N3.98bn
BREAKDOWN
20112012201320142015
N46.1bnN50.0bn
N55.3bnN51.7bn
N39.0bn
NET FAAC ALLOCATION
20112012201320142015 N18.1bn
N7.3bnN12.2bn
N20.2bnN19.3bn
IGR20112012201320142015
N18.0bnN25.2bn
N20.5bnN35.1bn
N51.7bn
TOTAL DEBT STOCK
**AVERAGE MONTHLY RECURRENT EXPENDITURE(JAN-JUN 2016)
N3.64bnN
AVERAGE MONTHLY PERSONNEL COST (JAN-JUN 2016)
N2.4bn
BREAKDOWN
AVERAGE MONTHLY OVERHEADCOST (JAN-JUN 2016)
N1.24bn
ABILITY TO MEET MONTHLY RECURRENT EXPENDITURE COMMITMENTS (JAN - JUN 2016)
Monthly commitments (Recurrent expenditure)
Total average monthly revenueN3.98bn
N3.64bn
N339m(Good Indicator)
EXTERNALDEBT
$71.83m
DOMESTIC DEBT
N37.55bnN
TOTAL DEBT STOCK
N51.72bn2015
Enugu has always maintained a conservative spending position with prudent fiscal management. The state maintains a relatively manageable operating costs with a monthly recurrent expenditure commitments standing at N3.6bn. The state will need to aggressively improve her IGR to maintain her present financial status. There has to be conversations on exploiting coal power in a sustainable manner. Cheap energy access is a core incentive for investments.
ENU
GU
Date Created: 27 August 1991Governor: Ifeanyi Ugwuanyi
19
JAN FEB MAR APR MAY JUNNET FAAC ALLOCATION 2016
N2.4bnN2.2bn N2.1bn N2.0bnN2.0bn
N3.7bn
Structure of State’s Revenue 2016
39.9%
60.0%
IGR
NET FAAC
*Based on Average FAAC Allocation and IGR Calculations on previous year **Based on Average 2016 Recurrent Expenditure projections State of States | Factsheet

JAN FEB MAR APR MAY JUNNET FAAC ALLOCATION 2016
N1.6bn N1.5bn N1.3bn N1.3bn N1.2bn
N2.9bn
21.1%
78.9%
Structure of State’s Revenue 2016
IGR
NET FAAC
GombeJewel in the Savannah
20112012201320142015
N43.3bnN42.2bn
N46.9bnN42.1bn
N29.5bn
NET FAAC ALLOCATION
20112012201320142015 N4.8bn
N3.2bnN3.7bnN3.9bnN5.2bn
IGR20112012201320142015
N11.7bnN35.2bnN33.4bnN36.7bn
N61.3bn
TOTAL DEBT STOCK
**AVERAGE MONTHLY RECURRENT EXPENDITURE(JAN-JUN 2016)
N3.55bnN
AVERAGE MONTHLY PERSONNEL COST (JAN-JUN 2016)
N1.37bn
BREAKDOWN
AVERAGE MONTHLY OVERHEADCOST (JAN-JUN 2016)
N2.18bn
ABILITY TO MEET MONTHLY RECURRENT EXPENDITURE COMMITMENTS (JAN - JUN 2016)
Monthly commitments (Recurrent expenditure)
Total average monthly revenueN2.97bn
N3.55bn
-N576.89m(Bad Indicator)
Shortfall
GOMBE
Date Created: 1 October 1996Governor: Ibrahim Dankwambo
20
VAT
AVERAGE MONTHLY VAT(JAN-JUN 2016)
N616.73mAVERAGE MONTHLY INTERNALLY GENERATED REVENUE (JAN-JUN 2016)
N398.72m
N
AVERAGE MONTHLYSTATUTORY ALLOCATION (JAN-JUN 2016)
N1.96bnAVERAGE MONTHLY 13% SHARE OF DERIVATION (JAN-JUN 2016)
N/A
IGR
*AVERAGE MONTHLY REVENUE (JAN-JUN 2016)
N2.97bn
BREAKDOWN
EXTERNALDEBT
$39.82m
DOMESTIC DEBT
N53.45bnN
TOTAL DEBT STOCK
N61.31bn2015
As the growing gap between the state's revenue and recurrent expenditure widens, the state will need to embrace structural adjustment including cutting down her operational costs. Gombe need to serially position herself to contribute meaningfully to the Nigerian state.
*Based on Average FAAC Allocation and IGR Calculations on previous year **Based on Average 2016 Recurrent Expenditure projections State of States | Factsheet

ImoEastern Heartland
VAT
AVERAGE MONTHLY VAT(JAN-JUN 2016)
N727.22mAVERAGE MONTHLY INTERNALLY GENERATED REVENUE (JAN-JUL 2016)
N456.05m
N
AVERAGE MONTHLYSTATUTORY ALLOCATION (JAN-JUN 2016)
N1.82bnAVERAGE MONTHLY 13% SHARE OF DERIVATION (JAN-JUN 2016)
N172.35m
IGR
*AVERAGE MONTHLY REVENUE (JAN-JUN 2016)
N3.2bn
BREAKDOWN
20112012201320142015
N53.7bnN57.3bn
N62.8bnN55.8bn
N39.5bn
NET FAAC ALLOCATION
20112012201320142015 N5.5bn
N5.7bnN6.8bn
N7.6bnN8.1bn
IGR20112012201320142015
N33.4bnN24.8bn
N21.0bnN38.5bn
N83.4bn
TOTAL DEBT STOCK
**AVERAGE MONTHLY RECURRENT EXPENDITURE(JAN-JUN 2016)
N4.85bnN
AVERAGE MONTHLY PERSONNEL COST (JAN-JUN 2016)
N2.04bn
BREAKDOWN
AVERAGE MONTHLY OVERHEADCOST (JAN-JUN 2016)
N2.81bn
ABILITY TO MEET MONTHLY RECURRENT EXPENDITURE COMMITMENTS (JAN - JUN 2016)
Monthly commitments (Recurrent expenditure)
Total average monthly revenueN3.17bn
N4.85bn
-N1.68bn(Bad Indicator)
Shortfall
EXTERNALDEBT
$59.16m
DOMESTIC DEBT
N71.74bnN
TOTAL DEBT STOCK
N83.42bn2015
Very little is expected from a state like Imo whose recurrent expenditure (N3.67bn in 2015 ) exceeds her total monthly revenue (N3.1bn). Her monthly IGR (N676.31m) is not enough to pay monthly salaries as it debt profile (N83.4bn) continues to rise to a worrisome state. Her future financial stability will be threatened if she continues to spend without thinking of what to do to increase her revenue.
IMO
Date Created: 3 February 1976Governor: Rochas Nwanyo Okorocha
21
JAN FEB MAR APR MAYNET FAAC ALLOCATION 2016
N2.3bnN1.6bn
N2.3bn N2.3bnN1.9bn
JUN
N3.8bn
22.3%
77.7%
Structure of State’s Revenue 2016
IGR
NET FAAC
*Based on Average FAAC Allocation and IGR Calculations on previous year **Based on Average 2016 Recurrent Expenditure projections State of States | Factsheet

VAT
AVERAGE MONTHLY VAT(JAN-JUN 2016)
N753.57mAVERAGE MONTHLY INTERNALLY GENERATED REVENUE (JAN-JUL 2016)
N423.45m
N
AVERAGE MONTHLYSTATUTORY ALLOCATION (JAN-JUN 2016)
N1.99bnAVERAGE MONTHLY 13% SHARE OF DERIVATION (JAN-JUN 2016)
N/A
IGR
*AVERAGE MONTHLY REVENUE (JAN-JUN 2016)
N3.1bn
BREAKDOWN
20112012201320142015
N54.7bnN58.3bn
N64.0bnN58.0bn
N44.7bn
NET FAAC ALLOCATION
20112012201320142015 N5.1bn
N1.5bnN7.9bn
N9.8bnN6.3bn
IGR20112012201320142015
N6.0bnN7.3bnN7.3bnN8.0bn
N28.9bn
TOTAL DEBT STOCK
**AVERAGE MONTHLY RECURRENT EXPENDITURE(JAN-JUN 2016)
N5.18bnN
AVERAGE MONTHLY PERSONNEL COST (JAN-JUN 2016)
N3.25bn
BREAKDOWN
AVERAGE MONTHLY OVERHEADCOST (JAN-JUN 2016)
N1.93bn
ABILITY TO MEET MONTHLY RECURRENT EXPENDITURE COMMITMENTS (JAN - JUN 2016)
Monthly commitments (Recurrent expenditure)
Total average monthly revenueN3.13bn
N5.18bn
-N2.05bn(Bad Indicator)
Shortfall
EXTERNALDEBT
$34.09m
DOMESTIC DEBT
N22.19bnN
TOTAL DEBT STOCK
N29.92bn2015
The “New World” is gradually being exposed to “new” fiscal troubles. With her total average monthly revenue of N3.1bn and the average recurrent expenditure of N5.18bn, it is evident that the state cannot fulfil her monthly financial obligations. The state will continue in the bailout trough if her present financial condition remains.
JigawaThe New World
JIGAWA
Date Created: 27 August 1991Governor: Abubakar Badaru
22
NET FAAC ALLOCATION 2016
15.9%
84.0%
Structure of State’s Revenue 2016
IGR
NET FAACJAN FEB MAR APR MAY JUN
N2.8bn N2.6bn N2.3bn N2.3bn N2.3bn
N4.3bn
*Based on Average FAAC Allocation and IGR Calculations on previous year **Based on Average 2016 Recurrent Expenditure projections State of States | Factsheet

Kaduna Centre of Learning
VAT
AVERAGE MONTHLY VAT(JAN-JUN 2016)
N902.58mAVERAGE MONTHLY INTERNALLY GENERATED REVENUE (JAN-JUL 2016)
N961.39m
N
AVERAGE MONTHLYSTATUTORY ALLOCATION (JAN-JUN 2016)
N2.28bnAVERAGE MONTHLY 13% SHARE OF DERIVATION (JAN-JUN 2016)
N/A
IGR
*AVERAGE MONTHLY REVENUE (JAN-JUN 2016)
N4.2bn
BREAKDOWN
20112012201320142015
N59.9bnN64.3bn
N70bnN63bn
N48.6bn
NET FAAC ALLOCATION
20112012201320142015 N11.6bn
N9.8bnN11.5bn
N10.9bnN12.8bn
IGR20112012201320142015
N63.8bnN56.5bn
N48.3bnN59.1bn
N94.5bn
TOTAL DEBT STOCK
**AVERAGE MONTHLY RECURRENT EXPENDITURE(JAN-JUN 2016)
N5.33bnN
AVERAGE MONTHLY PERSONNEL COST (JAN-JUN 2016)
N2.65bn
BREAKDOWN
AVERAGE MONTHLY OVERHEADCOST (JAN-JUN 2016)
N2.68bn
ABILITY TO MEET MONTHLY RECURRENT EXPENDITURE COMMITMENTS (JAN - JUN 2016)
Monthly commitments (Recurrent expenditure)
Total average monthly revenueN4.15bn
N5.34bn
-N1.18bn(Bad Indicator)
Shortfall
KADUNA
Date Created: 27 May 1967
Governor: Mallam Nasir El-Rufai
23
JAN FEB MAR APR MAY JUNNET FAAC ALLOCATION 2016
N2.9bn N2.8bn N2.6bn N2.6bn N2.5bn
N4.8bn
26%
74.0%
Structure of State’s Revenue 2016
IGR
NET FAAC
For a considerably rich mineral resourced state, currently notable for being the first state to subscribe to an Open Budget online platform fondly called 'Open Kaduna', Kaduna State is also expanding debt rapidly and needs to balance this with IGR. Recent conversations on investments shows a direction of purpose but it will need a long-term approach to see all the fruits bloom.
EXTERNALDEBT
$226.4m
DOMESTIC DEBT
N49.85bnN
TOTAL DEBT STOCK
N94.50bn2015
*Based on Average FAAC Allocation and IGR Calculations on previous year **Based on Average 2016 Recurrent Expenditure projections State of States | Factsheet

Kano Centre of Commerce
VAT
AVERAGE MONTHLY VAT(JAN-JUN 2016)
N1.21bnAVERAGE MONTHLY INTERNALLY GENERATED REVENUE (JAN-JUL 2016)
N1.13bn
N
AVERAGE MONTHLYSTATUTORY ALLOCATION (JAN-JUN 2016)
N2.77bnAVERAGE MONTHLY 13% SHARE OF DERIVATION (JAN-JUN 2016)
N/A
IGR
*AVERAGE MONTHLY REVENUE (JAN-JUN 2016)
N5.1bn
BREAKDOWN
20112012201320142015
N78.7bnN83.4bn
N92.3bnN82.3bn
N64.1bn
NET FAAC ALLOCATION
20112012201320142015
N6.6bnN11.1bn
N17.1bnN13.7bnN13.7bn
IGR20112012201320142015
N15.4bnN15.5bn
N42.4bnN42.3bn
N76.4bn
TOTAL DEBT STOCK
**AVERAGE MONTHLY RECURRENT EXPENDITURE(JAN-JUN 2016)
N7bnN
AVERAGE MONTHLY PERSONNEL COST (JAN-JUN 2016)
N5.04bn
BREAKDOWN
AVERAGE MONTHLY OVERHEADCOST (JAN-JUN 2016)
N1.96bn
ABILITY TO MEET MONTHLY RECURRENT EXPENDITURE COMMITMENTS (JAN - JUN 2016)
Monthly commitments (Recurrent expenditure)
Total average monthly revenueN5.10bn
N6.99bn
-N1.89bn(Bad Indicator)
Shortfall
EXTERNALDEBT
$76.4m
DOMESTIC DEBT
N65.01bnN
TOTAL DEBT STOCK
N76.37bn2015
A refocus on her agricultural and mineral resources potentials could ensure the state remains at the centre of commercial activities in Northern Nigeria. Kano actually needs to do better with the leather industry and other agro-allied industry. Kano is seriously punching below its weight in terms of IGR.
KANO
Date Created: 27 May 1967Governor: Dr. Abdullahi Umar Ganduje
24
JAN FEB MAR APR MAY JUNNET FAAC ALLOCATION 2016
N3.9bnN3.6bn N3.4bn N3.3bn N3.2bn
N6.0bn
22.6%
77.4%
Structure of State’s Revenue 2016
IGR
NET FAAC
*Based on Average FAAC Allocation and IGR Calculations on previous year **Based on Average 2016 Recurrent Expenditure projections State of States | Factsheet

Katsina Home of Hospitality
VAT
AVERAGE MONTHLY VAT(JAN-JUN 2016)
N867.47mAVERAGE MONTHLY INTERNALLY GENERATED REVENUE (JAN-JUL 2016)
N482.58m
N
AVERAGE MONTHLYSTATUTORY ALLOCATION (JAN-JUN 2016)
N2.15bnAVERAGE MONTHLY 13% SHARE OF DERIVATION (JAN-JUN 2016)
N/A
IGR
*AVERAGE MONTHLY REVENUE (JAN-JUN 2016)
N3.5bn
BREAKDOWN
20112012201320142015
N58.9bnN64.3bn
N69.5bnN63.4bn
N48.4bn
NET FAAC ALLOCATION
20112012201320142015
N4.2bnN5.0bnN6.9bn
N6.2bnN5.8bn
IGR20112012201320142015
N13.9bnN12.6bnN12.0bnN14.9bn
N25.7bn
TOTAL DEBT STOCK
**AVERAGE MONTHLY RECURRENT EXPENDITURE(JAN-JUN 2016)
N3.65bnN
AVERAGE MONTHLY PERSONNEL COST (JAN-JUN 2016)
N1.66bn
BREAKDOWN
AVERAGE MONTHLY OVERHEADCOST (JAN-JUN 2016)
N1.99bn
ABILITY TO MEET MONTHLY RECURRENT EXPENDITURE COMMITMENTS (JAN - JUN 2016)
Monthly commitments (Recurrent expenditure)
Total average monthly revenueN3.5bn
N3.65bn
-N154.17m(Bad Indicator)
Shortfall
EXTERNALDEBT
$72.15m
DOMESTIC DEBT
N11.5bnN
TOTAL DEBT STOCK
N25.73bn2015
KATSINA
Date Created: 23 September 1987
Governor: Aminu Bello Masari
25
JAN FEB MAR APR MAY JUNNET FAAC ALLOCATION 2016
N3bn N2.9bn N2.5bn N2.5bnN2.4bn
N4.5bn
Structure of State’s Revenue 2016
85.0%NET FAAC
15%IGR
With a debt profile considerably lower than her neighboring states and decrease in FAAC due to falling oil prices, the state needs to maintain her current expenses and also develop strategies to grow her locally generated revenue.
*Based on Average FAAC Allocation and IGR Calculations on previous year **Based on Average 2016 Recurrent Expenditure projections State of States | Factsheet

Kebbi Land of Equity
VAT
AVERAGE MONTHLY VAT(JAN-JUN 2016)
N675.35mAVERAGE MONTHLY INTERNALLY GENERATED REVENUE (JAN-JUL 2016)
N299.37m
N
AVERAGE MONTHLYSTATUTORY ALLOCATION (JAN-JUN 2016)
N1.84bnAVERAGE MONTHLY 13% SHARE OF DERIVATION (JAN-JUN 2016)
N/A
IGR
*AVERAGE MONTHLY REVENUE (JAN-JUN 2016)
N2.8bn
BREAKDOWN
20112012201320142015
N49.4bnN51.8bn
N58.4bnN53.9bn
N41bn
NET FAAC ALLOCATION
20112012201320142015
N4.5bnN5.4bnN3.7bnN3.8bnN3.6bn
IGR20112012201320142015
N15bnN10.2bn
N8.3bnN25.2bn
N72.7bn
TOTAL DEBT STOCK
**AVERAGE MONTHLY RECURRENT EXPENDITURE(JAN-JUN 2016)
N2.83bnN
AVERAGE MONTHLY PERSONNEL COST (JAN-JUN 2016)
N1.20bn
BREAKDOWN
AVERAGE MONTHLY OVERHEADCOST (JAN-JUN 2016)
N1.63bn
ABILITY TO MEET MONTHLY RECURRENT EXPENDITURE COMMITMENTS (JAN - JUN 2016)
Monthly commitments (Recurrent expenditure)
Total average monthly revenueN2.82bn
N2.83bn
-N12.05m(Bad Indicator)
Shortfall
EXTERNALDEBT
$45.3m
DOMESTIC DEBT
N63.79bnN
TOTAL DEBT STOCK
N72.72bn2015
KEBBI
Date Created: 27 August 1991
Governor: Abubakar Atiku Bagudu
26
JAN FEB MAR APR MAY JUNNET FAAC ALLOCATION 2016
N2.5bn N2.2bn N2bn N2bn N2.9bn
N3.8bn
Structure of State’s Revenue 2016
88.3%NET FAAC
11.8%IGR
Governor Bagudu has taken agriculture has a core focus, most especially the production of rice. Her IGR is very weak but creating formal structures within the agro-allied chain is critically important. With an average monthly IGR of N299.37m in 2016, alongside a debt profile of N72.69b, Kebbi needs to watch how it expands debt.
*Based on Average FAAC Allocation and IGR Calculations on previous year **Based on Average 2016 Recurrent Expenditure projections State of States | Factsheet

KogiThe Confluence State
VAT
AVERAGE MONTHLY VAT(JAN-JUN 2016)
N678.12mAVERAGE MONTHLY INTERNALLY GENERATED REVENUE (JAN-JUN 2016)
N564.72m
N
AVERAGE MONTHLYSTATUTORY ALLOCATION (JAN-JUN 2016)
N1.93bnAVERAGE MONTHLY 13% SHARE OF DERIVATION (JAN-JUN 2016)
N/A
IGR
*AVERAGE MONTHLY REVENUE (JAN-JUN 2016)
N3.2bn
BREAKDOWN
20112012201320142015
N49.0bnN52.6bn
N58.8bnN54.8bn
N40.4bn
NET FAAC ALLOCATION
20112012201320142015
N2.9bnN3.2bnN5.0bnN6.6bnN6.8bn
IGR20112012201320142015
N39.6bnN20.3bn
N12.5bnN16.8bnN48.7bn
TOTAL DEBT STOCK
**AVERAGE MONTHLY RECURRENT EXPENDITURE(JAN-JUN 2016)
N4.85bnN
AVERAGE MONTHLY PERSONNEL COST (JAN-JUN 2016)
N1.87bn
BREAKDOWN
AVERAGE MONTHLY OVERHEADCOST (JAN-JUN 2016)
N2.98bn
ABILITY TO MEET MONTHLY RECURRENT EXPENDITURE COMMITMENTS (JAN - JUN 2016)
Monthly commitments (Recurrent expenditure)
Total average monthly revenueN3.17bn
N4.85bn
-N1.68bn(Bad Indicator)
Shortfall
EXTERNALDEBT
$51.03m
DOMESTIC DEBT
N42.03bnN
TOTAL DEBT STOCK
N48.67bn2015
A potentially rich but regrettably poor state with an average personnel cost of N1.87bn (2016) and average IGR of N564.72m has a total debt of N48.64bn. Kogi hosts the largest cement plant in Nigeria and yet does not benefit substantially through taxes and royalties. Kogi also needs to tap in the neighbouring Abuja market in terms of agricultural produce and allied industries.
KOGI
Date Created: 27 August 1991
Governor: Idris Wada
27
JAN FEB MAR APR MAY JUNNET FAAC ALLOCATION 2016
N2.5bn N2.3bn N2.0bn N1.9bn N1.8bn
N3.9bn
81.5%
Structure of State’s Revenue 2016
IGR
NET FAAC
18.5%
*Based on Average FAAC Allocation and IGR Calculations on previous year **Based on Average 2016 Recurrent Expenditure projections State of States | Factsheet

KwaraState of Harmony
VAT
AVERAGE MONTHLY VAT(JAN-JUN 2016)
N619.23mAVERAGE MONTHLY INTERNALLY GENERATED REVENUE (JAN-JUL 2016)
N598.24m
N
AVERAGE MONTHLYSTATUTORY ALLOCATION (JAN-JUN 2016)
N1.55bnAVERAGE MONTHLY 13% SHARE OF DERIVATION (JAN-JUN 2016)
N/A
IGR
*AVERAGE MONTHLY REVENUE (JAN-JUN 2016)
N2.8bn
BREAKDOWN
20112012201320142015
N43.0bnN46.3bn
N50.0bnN44.3bn
N34.0bn
NET FAAC ALLOCATION
20112012201320142015 N7.2bn
N8.8bnN11.3bnN13.8bnN12.4bn
IGR20112012201320142015
N32.2bnN36.8bn
N29.7bnN31.6bn
N42.0bn
TOTAL DEBT STOCK
**AVERAGE MONTHLY RECURRENT EXPENDITURE(JAN-JUN 2016)
N5.06bnN
AVERAGE MONTHLY PERSONNEL COST (JAN-JUN 2016)
N2.51bn
BREAKDOWN
AVERAGE MONTHLY OVERHEADCOST (JAN-JUN 2016)
N2.55bn
ABILITY TO MEET MONTHLY RECURRENT EXPENDITURE COMMITMENTS (JAN - JUN 2016)
Monthly commitments (Recurrent expenditure)
Total average monthly revenueN2.77bn
N5.06bn
-N2.29bn(Bad Indicator)
Shortfall
With Kwara state experiencing a fall in IGR in the first half of year 2016 and a total debt of N41.99bn (end of 2015), a bail out of N19.92bn last year had to be taken in order to pay salaries. Interestingly, the state abounds with mineral resources and rich Islamic cultural heritage.
Ibadan
KWARA
Date Created: 27 May 1967Governor: Abdulfatah Ahmed
28
JAN FEB MAR APR MAY JUNNET FAAC ALLOCATION 2016
N1.8bn N1.7bn N1.8bn N1.8bn N1.6bn
N3.1bn
34.7%
65.3%
Structure of State’s Revenue 2016
IGR
NET FAAC
EXTERNALDEBT
$51.03m
DOMESTIC DEBT
N31.96bnN
TOTAL DEBT STOCK
N42.03bn2015
*Based on Average FAAC Allocation and IGR Calculations on previous year **Based on Average 2016 Recurrent Expenditure projections State of States | Factsheet

Lagos Centre of Excellence
VAT
AVERAGE MONTHLY VAT(JAN-JUN 2016)
N6.18bnAVERAGE MONTHLY INTERNALLY GENERATED REVENUE (JAN-JUL 2016)
N22.35bn
N
AVERAGE MONTHLYSTATUTORY ALLOCATION (JAN-JUN 2016)
N2.33bnAVERAGE MONTHLY 13% SHARE OF DERIVATION (JAN-JUN 2016)
N/A
IGR
*AVERAGE MONTHLY REVENUE (JAN-JUN 2016)
N30.9bn
BREAKDOWN
20112012201320142015
N111.5bnN118.5bn
N117.3bnN105.0bn
N88.3bn
NET FAAC ALLOCATION
20112012201320142015
N202.76bnN219.2bnN236.1bn
N276.1bnN268.2bn
IGR20112012201320142015
N236.0bnN325.8bn
N428.5bnN479.7bnN456.8bn
TOTAL DEBT STOCK
**AVERAGE MONTHLY RECURRENT EXPENDITURE(JAN-JUN 2016)
N23.24bnN
AVERAGE MONTHLY PERSONNEL COST (JAN-JUN 2016)
N10.43bn
BREAKDOWN
AVERAGE MONTHLY OVERHEADCOST (JAN-JUN 2016)
N12.81bn
ABILITY TO MEET MONTHLY RECURRENT EXPENDITURE COMMITMENTS (JAN - JUN 2016)
Monthly commitments (Recurrent expenditure)
Total average monthly revenueN30.87bn
N23.24bn
N7.62bn(Good Indicator)
EXTERNALDEBT
$1.2bn
DOMESTIC DEBT
N218.53bnN
TOTAL DEBT STOCK
N456.84bn2015
Lagos continues to expand her IGR portfolio and recently reined on her debts. Lagos has the largest aggregation of formal workers and continues to focus on infrastructural projects. Her personnel cost (N10bn) is the highest, yet she meets her obligations. Lagos state needs to considers power generation and work on the increasingly challenge with security.
LAGOS
Date Created: 27 May 1967
Governor: Akinwunmi Ambode
29
JAN FEB MAR APR MAY JUNNET FAAC ALLOCATION 2016
N6.6bnN5.8bn N5.5bn N5.6bn N6.1bn
N8.3bn
78.5%
21.5%
Structure of State’s Revenue 2016
IGR
NET FAAC
*Based on Average FAAC Allocation and IGR Calculations on previous year **Based on Average 2016 Recurrent Expenditure projections State of States | Factsheet

Nasarawa Home of Solid Minerals
VAT
AVERAGE MONTHLY VAT(JAN-JUN 2016)
N578.71mAVERAGE MONTHLY INTERNALLY GENERATED REVENUE (JAN-JUL 2016)
N356.80m
N
AVERAGE MONTHLYSTATUTORY ALLOCATION (JAN-JUN 2016)
N1.60bnAVERAGE MONTHLY 13% SHARE OF DERIVATION (JAN-JUN 2016)
N/A
IGR
*AVERAGE MONTHLY REVENUE (JAN-JUN 2016)
N2.6bn
BREAKDOWN
20112012201320142015
N38.2bnN41.6bn
N46.6bnN44.8bn
N34.9bn
NET FAAC ALLOCATION
20112012201320142015
N4.13bnN4.13bn
N4.01bnN4.09bn
N4.3bn
IGR20112012201320142015
N11.2bnN12.9bn
N36.4bnN43.5bn
N51.0bn
TOTAL DEBT STOCK
**AVERAGE MONTHLY RECURRENT EXPENDITURE(JAN-JUN 2016)
N4.15bnN
AVERAGE MONTHLY PERSONNEL COST (JAN-JUN 2016)
N1.99bn
BREAKDOWN
AVERAGE MONTHLY OVERHEADCOST (JAN-JUN 2016)
N2.16bn
ABILITY TO MEET MONTHLY RECURRENT EXPENDITURE COMMITMENTS (JAN - JUN 2016)
Monthly commitments (Recurrent expenditure)
Total average monthly revenueN2.54bn
N4.15bn
-N1.61bn(Bad Indicator)
Shortfall
EXTERNALDEBT
$53.06m
DOMESTIC DEBT
N40.55bnN
TOTAL DEBT STOCK
N51.02bn2015
Nasarawa abounds with mineral resources but bears a worrisome debt of N50.98bn (end of 2015). With an exploration of potentials hidden in the land, and fixing more workers in the tax net, there should be hope for increase in revenue. However, the state named “Home of Solid Minerals” has not lived up to the expectations.
Nasarawa
Date Created: 1 October 1996
Governor: Umaru Tanko Al-Makura
30
JAN FEB MAR APR MAY JUNNET FAAC ALLOCATION 2016
N2.2bn N2bnN1.6bn N1.7bn N1.7bn
N3.3bn
Structure of State’s Revenue 2016
IGR13.9%
86.0%NET FAAC
*Based on Average FAAC Allocation and IGR Calculations on previous year **Based on Average 2016 Recurrent Expenditure projections State of States | Factsheet

Niger The Power State
VAT
AVERAGE MONTHLY VAT(JAN-JUN 2016)
N731.28mAVERAGE MONTHLY INTERNALLY GENERATED REVENUE (JAN-JUL 2016)
N497.92m
N
AVERAGE MONTHLYSTATUTORY ALLOCATION (JAN-JUN 2016)
N2.1bnAVERAGE MONTHLY 13% SHARE OF DERIVATION (JAN-JUN 2016)
N/A
IGR
BREAKDOWN
20112012201320142015
N52.5bnN56.8bn
N61.6bnN53.1bn
N40.1bn
NET FAAC ALLOCATION
20112012201320142015
N3.79bnN3.78bnN4.11bnN5.73bnN5.98bn
IGR20112012201320142015
N21.4bnN22.4bn
N29.8bnN31.5bnN30.3bn
TOTAL DEBT STOCK
**AVERAGE MONTHLY RECURRENT EXPENDITURE(JAN-JUN 2016)
N3.45bnN
AVERAGE MONTHLY PERSONNEL COST (JAN-JUN 2016)
N2.48bn
BREAKDOWN
AVERAGE MONTHLY OVERHEADCOST (JAN-JUN 2016)
N0.97bn
ABILITY TO MEET MONTHLY RECURRENT EXPENDITURE COMMITMENTS (JAN - JUN 2016)
Monthly commitments (Recurrent expenditure)
Total average monthly revenueN3.29bn
N3.45bn
-N155.81m(Bad Indicator)
Shortfall
The power state has little financial power to keep its economy stable. Though the state's IGR averages N497.93m in the year running, her debt profile stands at N30.3bn. With a cut on overheads, and focus on agro-allied products, a financial stability may return to the state.
NIGER
Date Created: 3 February 1976
Governor: Abubakar Sani Bello
31
JAN FEB MAR APR MAY JUNNET FAAC ALLOCATION 2016
N2.4bn N2.1bn N1.8bn N1.8bn N1.8bn
N3.8bn
Structure of State’s Revenue 2016
17.3%
82.7%
IGR
NET FAAC
*AVERAGE MONTHLY REVENUE (JAN-JUN 2016)
N3.3bn
EXTERNALDEBT
$44.7m
DOMESTIC DEBT
N21.50bnN
TOTAL DEBT STOCK
N30.33bn2015
*Based on Average FAAC Allocation and IGR Calculations on previous year **Based on Average 2016 Recurrent Expenditure projections State of States | Factsheet

OgunGateway State
VAT
AVERAGE MONTHLY VAT(JAN-JUN 2016)
N722.59mAVERAGE MONTHLY INTERNALLY GENERATED REVENUE (JAN-JUL 2016)
N2.88bn
N
AVERAGE MONTHLYSTATUTORY ALLOCATION (JAN-JUN 2016)
N1.62bnAVERAGE MONTHLY 13% SHARE OF DERIVATION (JAN-JUN 2016)
N/A
IGR
*AVERAGE MONTHLY REVENUE (JAN-JUN 2016)
N5.2bn
BREAKDOWN
20112012201320142015
N48.9bnN52.8bn
N56.8bnN48.9bn
N34.3bn
NET FAAC ALLOCATION
20112012201320142015
N10.83bnN12.43bnN13.77bn
N17.49bnN34.59bn
IGR20112012201320142015
N45.2bnN61.6bn
N77.0bnN89.9bn
N96.3bn
TOTAL DEBT STOCK
**AVERAGE MONTHLY RECURRENT EXPENDITURE(JAN-JUN 2016)
N8.41bnN
AVERAGE MONTHLY PERSONNEL COST (JAN-JUN 2016)
N5.11bn
BREAKDOWN
AVERAGE MONTHLY OVERHEADCOST (JAN-JUN 2016)
N3.30bn
ABILITY TO MEET MONTHLY RECURRENT EXPENDITURE COMMITMENTS (JAN - JUN 2016)
Monthly commitments (Recurrent expenditure)
Total average monthly revenueN5.22bn
N8.41bn
-N3.19bn(Bad Indicator)
Shortfall
OGUN
Date Created: 3 February 1976Governor: Ibikunle Amosun
32
$103.3m
DOMESTIC DEBT
N75.92bnN
TOTAL DEBT STOCK
N96.30bn2015
EXTERNALDEBT
JAN FEB MAR APR MAY JUNNET FAAC ALLOCATION 2016
N1.2bnN999.7m
N1.9bn N1.9bn
N935.4m
N2.8bn
47.2%
52.7%
Structure of State’s Revenue 2016
IGR
NET FAAC
Ogun State in spite of an IGR increase of N1.42bn in 2016, has a total debt stock of N96.23bn by the end of last year. She availed herself a bailout of N75.4bn from the Central Bank to invest in capital projects that could grow her economy. Ogun has a long list of abandoned projects, revealing poor fiscal planning and risk management. Ogun State has also not done enough to tap into the Lagos market , 40% of the Nigerian market.
*Based on Average FAAC Allocation and IGR Calculations on previous year **Based on Average 2016 Recurrent Expenditure projections State of States | Factsheet

OndoSunshine State
VAT
AVERAGE MONTHLY VAT(JAN-JUN 2016)
N692.42mAVERAGE MONTHLY INTERNALLY GENERATED REVENUE (JAN-JUL 2016)
N541.50m
N
AVERAGE MONTHLYSTATUTORY ALLOCATION (JAN-JUN 2016)
N1.62bnAVERAGE MONTHLY 13% SHARE OF DERIVATION (JAN-JUN 2016)
N857.51m
IGR
*AVERAGE MONTHLY REVENUE (JAN-JUN 2016)
N4.0bn
BREAKDOWN
20112012201320142015
N73.3bnN73.1bn
N81.1bnN66.4bn
N41.6bn
NET FAAC ALLOCATION
20112012201320142015
N8.01bnN10.15bnN10.5bnN11.71bn
N10.1bn
IGR20112012201320142015
N56.3bnN44.6bn
N39.2bnN28.8bn
N36.9bn
TOTAL DEBT STOCK
**AVERAGE MONTHLY RECURRENT EXPENDITURE(JAN-JUN 2016)
N5.67bnN
AVERAGE MONTHLY PERSONNEL COST (JAN-JUN 2016)
N3.14bn
BREAKDOWN
AVERAGE MONTHLY OVERHEADCOST (JAN-JUN 2016)
N2.53bn
ABILITY TO MEET MONTHLY RECURRENT EXPENDITURE COMMITMENTS (JAN - JUN 2016)
Monthly commitments (Recurrent expenditure)
Total average monthly revenueN4.01bn
N5.66bn
-N1.66bn(Bad Indicator)
Shortfall
EXTERNALDEBT
$52.0m
DOMESTIC DEBT
N26.64bnN
TOTAL DEBT STOCK
N36.92bn2015
With total debt profile of N36.88bn(end of 2015), the state unfortunately fall short in payment of monthly salaries to her workers. To save the economy of the state, its needs to revitalize cocoa industry and also invest in bitumen industry.
ONDO
Date Created: 3 February 1976
Governor: Olusegun Mimiko
33
JAN FEB MAR APR MAY JUNNET FAAC ALLOCATION 2016
N2.3bnN2.1bn N1.8bn N1.7bn N1.8bn
N3.5bn
Structure of State’s Revenue 2016
IGR
30.8%
69.2%NET FAAC
*Based on Average FAAC Allocation and IGR Calculations on previous year **Based on Average 2016 Recurrent Expenditure projections State of States | Factsheet

OsunLand of Virtue
VAT
AVERAGE MONTHLY VAT(JAN-JUN 2016)
N688.80mAVERAGE MONTHLY INTERNALLY GENERATED REVENUE (JAN-JUL 2016)
N672.74m
N
AVERAGE MONTHLYSTATUTORY ALLOCATION (JAN-JUN 2016)
N1.59bnAVERAGE MONTHLY 13% SHARE OF DERIVATION (JAN-JUN 2016)
N/A
IGR
*AVERAGE MONTHLY REVENUE (JAN-JUN 2016)
N3.0bn
BREAKDOWN
20112012201320142015
N46.4bnN48.0bn
N46.0bnN35.9bn
N20.2bn
NET FAAC ALLOCATION
20112012201320142015
N7.39bnN5.02bnN7.28bnN8.51bnN8.07bn
IGR20112012201320142015
N15.2bnN48.3bn
N51.2bnN51.2bn
N159.8bn
TOTAL DEBT STOCK
**AVERAGE MONTHLY RECURRENT EXPENDITURE(JAN-JUN 2016)
N6.6bnN
AVERAGE MONTHLY PERSONNEL COST (JAN-JUN 2016)
N2.78bn
BREAKDOWN
AVERAGE MONTHLY OVERHEADCOST (JAN-JUN 2016)
N3.82bn
ABILITY TO MEET MONTHLY RECURRENT EXPENDITURE COMMITMENTS (JAN - JUN 2016)
Monthly commitments (Recurrent expenditure)
Total average monthly revenueN2.95bn
N6.59bn
-N3.645bn(Bad Indicator)
Shortfall
Osun State is not yet immune from the previous debt that it acquired and has suffered deduction of up to N2.4bn every month reducing available FAAC resources. This situation might persist till her debt runs out in 2018. She still struggles to meet full obligations with workers and contractors.
OSUN
Date Created: 27 August 1991
Governor: Rauf Aregbesola
34
JAN MAR APR JUN
NET FAAC ALLOCATION 2016
N6.2m-N131.6m
N999.7mN915.7m
-N324.6m
N1.23bn
Structure of State’s Revenue 2016
61.2%
38.8%
IGR
NET FAACFEB MAY
EXTERNALDEBT
$78.9m
DOMESTIC DEBT
N144.69bnN
TOTAL DEBT STOCK
N159.87bn2015
*Based on Average FAAC Allocation and IGR Calculations on previous year **Based on Average 2016 Recurrent Expenditure projections State of States | Factsheet
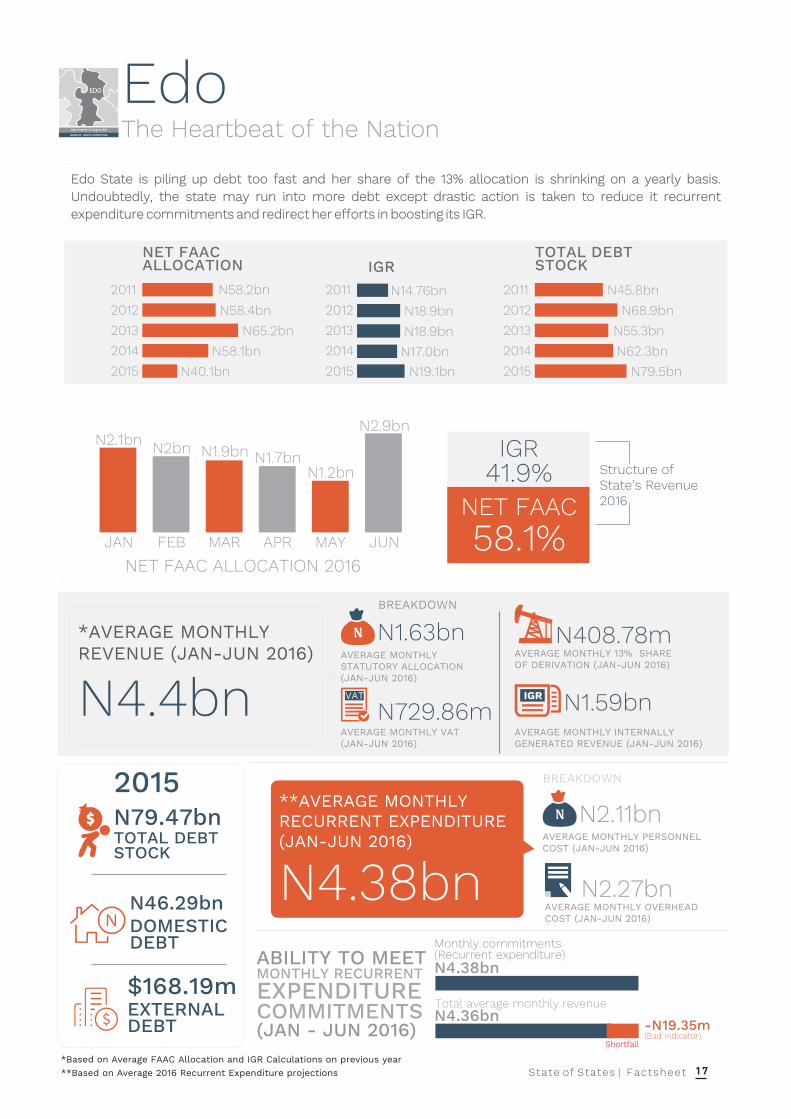
OyoPace Setter
VAT
AVERAGE MONTHLY VAT(JAN-JUN 2016)
N988.25mAVERAGE MONTHLY INTERNALLY GENERATED REVENUE (JAN-JUL 2016)
N1.30bn
N
AVERAGE MONTHLYSTATUTORY ALLOCATION (JAN-JUN 2016)
N1.95bnAVERAGE MONTHLY 13% SHARE OF DERIVATION (JAN-JUN 2016)
N/A
IGR
*AVERAGE MONTHLY REVENUE (JAN-JUN 2016)
N4.3bn
BREAKDOWN
20112012201320142015
N56.9bnN62.4bn
N67.1bnN57.4bn
N42.9bn
NET FAAC ALLOCATION
20112012201320142015
N8.91bnN14.59bnN15.25bn
N16.30bnN15.66bn
IGR20112012201320142015
N17.2bnN23.6bn
N31.9bnN26.0bnN60.6bn
TOTAL DEBT STOCK
**AVERAGE MONTHLY RECURRENT EXPENDITURE(JAN-JUN 2016)
N8.3bnN
AVERAGE MONTHLY PERSONNEL COST (JAN-JUN 2016)
N3.73bn
BREAKDOWN
AVERAGE MONTHLY OVERHEADCOST (JAN-JUN 2016)
N4.57bn
ABILITY TO MEET MONTHLY RECURRENT EXPENDITURE COMMITMENTS (JAN - JUN 2016)
Monthly commitments (Recurrent expenditure)
Total average monthly revenueN4.25bn
N8.3bn
-N4.05bn(Bad Indicator)
Shortfall
OYO
Date Created: 3 February 1976
Governor: Abiola Ajimobi
35
JAN FEB MAR APR MAY JUNNET FAAC ALLOCATION 2016
N2.6bnN2.2bn N2.2bn N2.1bn N2.2bn
N4.1bn
34.6%
65.4%
Structure of State’s Revenue 2016
IGR
NET FAAC
EXTERNALDEBT
$66.75bn
DOMESTIC DEBT
N47.43bnN
TOTAL DEBT STOCK
N60.60bn2015
Oyo State's average recurrent expenditure at N7.7bn (2016) is high and drastic action needs to be taken to correct the abnormalities, given that her average monthly revenue is approximately N4.2bn. This can barely settle personnel costs with nothing left for capital investment. Oyo needs strategic thinkers to position it as a hub to Lagos, a city 120km away from her capital.
*Based on Average FAAC Allocation and IGR Calculations on previous year **Based on Average 2016 Recurrent Expenditure projections State of States | Factsheet

PlateauHome of Peace Tourism
VAT
AVERAGE MONTHLY VAT(JAN-JUN 2016)
N648.05mAVERAGE MONTHLY INTERNALLY GENERATED REVENUE (JAN-JUL 2016)
N578.11m
N
AVERAGE MONTHLYSTATUTORY ALLOCATION (JAN-JUN 2016)
N1.82bnAVERAGE MONTHLY 13% SHARE OF DERIVATION (JAN-JUN 2016)
N/A
IGR
*AVERAGE MONTHLY REVENUE (JAN-JUN 2016)
N3.1bn
BREAKDOWN
20112012201320142015
N47.8bnN52.2bn
N56.9bnN52.5bn
N33.8bn
NET FAAC ALLOCATION
20112012201320142015
N4.52bnN6.93bn
N6.94bn
N8.49bnN8.28bn
IGR20112012201320142015
N24.2bnN27.5bn
N56.0bnN84.0bn
N102.2bn
TOTAL DEBT STOCK
**AVERAGE MONTHLY RECURRENT EXPENDITURE(JAN-JUN 2016)
N6.3bnN
AVERAGE MONTHLY PERSONNEL COST (JAN-JUN 2016)
N2.01bn
BREAKDOWN
AVERAGE MONTHLY OVERHEADCOST (JAN-JUN 2016)
N4.24bn
ABILITY TO MEET MONTHLY RECURRENT EXPENDITURE COMMITMENTS (JAN - JUN 2016)
Monthly commitments (Recurrent expenditure)
Total average monthly revenueN3.05bn
N6.25bn
-N3.201bn(Bad Indicator)
Shortfall
EXTERNALDEBT
$30.47m
DOMESTIC DEBT
N96.20bnN
TOTAL DEBT STOCK
N102.21bn2015
Plateau state, with her rich mineral and natural resources, continues to fall short of expectation. Her monthly recurrent expenditure commitments at N6.2bn is unhealthily high than her average revenue projections which is estimated at N3bn. Plateau despite her unique weather has lost the allure of tourism due to crisis over the years. There is a need to reset perception and also explore mineral endowments.
PLATEAU
Date Created: 3 February 1976Governor: Simon Lalong
36
JAN FEB MAR APR MAY JUNNET FAAC ALLOCATION 2016
N1.5bnN1.1bn
N1.4bnN1.3bn N1.0bn
N2.8bn
Structure of State’s Revenue 2016
30.9%
69.1%
IGR
NET FAAC
*Based on Average FAAC Allocation and IGR Calculations on previous year **Based on Average 2016 Recurrent Expenditure projections State of States | Factsheet

Rivers Treasure Base of the Nation
VAT
AVERAGE MONTHLY VAT(JAN-JUN 2016)
N1.03bnAVERAGE MONTHLY INTERNALLY GENERATED REVENUE (JAN-JUL 2016)
N6.84bn
N
AVERAGE MONTHLYSTATUTORY ALLOCATION (JAN-JUN 2016)
N1.88bnAVERAGE MONTHLY 13% SHARE OF DERIVATION (JAN-JUN 2016)
N3.59bn
IGR
*AVERAGE MONTHLY REVENUE (JAN-JUN 2016)
N13.3bn
BREAKDOWN
20112012201320142015
N244.8bnN226.5bn
N246.4bnN184.2bn
N105.2bn
NET FAAC ALLOCATION
20112012201320142015
N52.71bnN66.28bn
N87.91bnN89.11bn
N82.1bn
IGR20112012201320142015
N89.4bnN87.2bn
N136.4bnN99.9bn
N144.2bn
TOTAL DEBT STOCK
**AVERAGE MONTHLY RECURRENT EXPENDITURE(JAN-JUN 2016)
N10.10bnN
AVERAGE MONTHLY PERSONNEL COST (JAN-JUN 2016)
N4.58bn
BREAKDOWN
AVERAGE MONTHLY OVERHEADCOST (JAN-JUN 2016)
N5.43bn
ABILITY TO MEET MONTHLY RECURRENT EXPENDITURE COMMITMENTS (JAN - JUN 2016)
Monthly commitments (Recurrent expenditure)
Total average monthly revenueN13.35bn
N10.10bn
N3.35bn(Good Indicator)
EXTERNALDEBT
$46.92m
DOMESTIC DEBT
N134.96bnN
TOTAL DEBT STOCK
N144.22bn2015
Rivers State continues to improve her IGR but the total debt stock continues to rise hitting a N144.2bn mark. The state need to re-introduce the independently managed fiscal buffer to ensure a relatively stable economy, hereby increasing the IGR receipts. Rivers State frittered her reserves and currently will have to keep expanding debt to meet her huge overhead obligations.
RIVERS
Date Created: 27 May 1967Governor: Ezenwo Wike
37
JAN FEB MAR APR MAY JUNNET FAAC ALLOCATION 2016
N5.4bnN4.9bn
N4.1bn N4.1bn N4.4bn
N6.8bn
60.1%
39.9%
Structure of State’s Revenue 2016
IGR
NET FAAC
*Based on Average FAAC Allocation and IGR Calculations on previous year **Based on Average 2016 Recurrent Expenditure projections State of States | Factsheet

SokotoSeat of the Caliphate
20112012201320142015
N51.7bnN54.8bn
N60.7bnN56.1bn
N43.2bn
NET FAAC ALLOCATION
20112012201320142015
N4.19bnN4.31bnN5.50bnN5.62bnN6.22bn
IGR20112012201320142015
N11.3bnN9.4bn
N12.8bnN15.8bnN19.9bn
TOTAL DEBT STOCK
ABILITY TO MEET MONTHLY RECURRENT EXPENDITURE COMMITMENTS (JAN - JUN 2016)
Monthly commitments (Recurrent expenditure)
Total average monthly revenueN3.15bn
N4.20bn
-N1.055bn(Bad Indicator)
Shortfall
EXTERNALDEBT
$41.94m
DOMESTIC DEBT
N11.65bnN
TOTAL DEBT STOCK
N19.93bn2015
SOKOTO
Date Created: 3 February 1976Governor: Amino Waziri Tambuwal
38
N2.7bnN2.3bn N2.1bn N2.2bn N2.2bn
N4.1bn
Structure of State’s Revenue 2016
15.3%IGR
NET FAAC
VAT
AVERAGE MONTHLY VAT(JAN-JUN 2016)
N711.06mAVERAGE MONTHLY INTERNALLY GENERATED REVENUE (JAN-JUL 2016)
N518.70m
N
AVERAGE MONTHLYSTATUTORY ALLOCATION (JAN-JUN 2016)
N1.92bnAVERAGE MONTHLY 13% SHARE OF DERIVATION (JAN-JUN 2016)
N0.00bn
IGR
*AVERAGE MONTHLY REVENUE (JAN-JUN 2016)
N3.2bn
BREAKDOWN
**AVERAGE MONTHLY RECURRENT EXPENDITURE(JAN-JUN 2016)
N4.21bnN
AVERAGE MONTHLY PERSONNEL COST (JAN-JUN 2016)
N1.87bn
BREAKDOWN
AVERAGE MONTHLY OVERHEADCOST (JAN-JUN 2016)
N2.34bn
JAN FEB MAR APR MAY JUNNET FAAC ALLOCATION 2016
84.7%
With IGR contributing little to the state's total revenue, a high level of debt and bailout, the state requires a lot more to redeem the image of once being ranked Nigeria's poorest state. Capital investments in her arable sectors, especially agriculture can potentially save the state from her deplorable fiscal status. She needs to focus on education needs to be balanced with immediate investments in critical sectors.
*Based on Average FAAC Allocation and IGR Calculations on previous year **Based on Average 2016 Recurrent Expenditure projections State of States | Factsheet

TarabaNature’s Gift of the Nation
VAT
AVERAGE MONTHLY VAT(JAN-JUN 2016)
N607.98mAVERAGE MONTHLY INTERNALLY GENERATED REVENUE (JAN-JUL 2016)
N346.25m
N
AVERAGE MONTHLYSTATUTORY ALLOCATION (JAN-JUN 2016)
N1.68bnAVERAGE MONTHLY 13% SHARE OF DERIVATION (JAN-JUN 2016)
N0.00bn
IGR
*AVERAGE MONTHLY REVENUE (JAN-JUN 2016)
N2.7bn
BREAKDOWN
20112012201320142015
N48.6bnN52.2bn
N55.9bnN48.9bn
N36.8bn
NET FAAC ALLOCATION
20112012201320142015
N2.87bnN3.42bnN3.34bnN3.80bn
N4.15bn
IGR20112012201320142015
N21.2bnN20.3bn
N17.6bnN18.5bn
N32.2bn
TOTAL DEBT STOCK
**AVERAGE MONTHLY RECURRENT EXPENDITURE(JAN-JUN 2016)
N3.56bnN
AVERAGE MONTHLY PERSONNEL COST (JAN-JUN 2016)
N2.04bn
BREAKDOWN
AVERAGE MONTHLY OVERHEADCOST (JAN-JUN 2016)
N1.52bn
ABILITY TO MEET MONTHLY RECURRENT EXPENDITURE COMMITMENTS (JAN - JUN 2016)
Monthly commitments (Recurrent expenditure)
Total average monthly revenueN2.64bn
N3.56bn
-N925.09m(Bad Indicator)
Shortfall
$22.93m
TOTAL DEBT STOCK
N32.17bn2015
With a 8.58% increase in IGR, Taraba state has a total debt stock of N32.15bn as at December 31, 2015. However, despite the decrease in its average monthly wage bill spending(Jan-Jun 2016), the state still needs to effectively manage its rich economy to ensure its fiscal sustainability.
TARABA
Date Created: 27 August 1991Governor: Darius D. Ishaku
39
EXTERNALDEBT
JAN FEB MAR APR MAY JUNNET FAAC ALLOCATION 2016
N2.1bnN1.9bn N1.9bn N1.9bn N1.7bn
N3.4bn
Structure of State’s Revenue 2016
12.9%
87.2%
IGR
NET FAAC
DOMESTIC DEBT
N27.65bnN
*Based on Average FAAC Allocation and IGR Calculations on previous year **Based on Average 2016 Recurrent Expenditure projections State of States | Factsheet
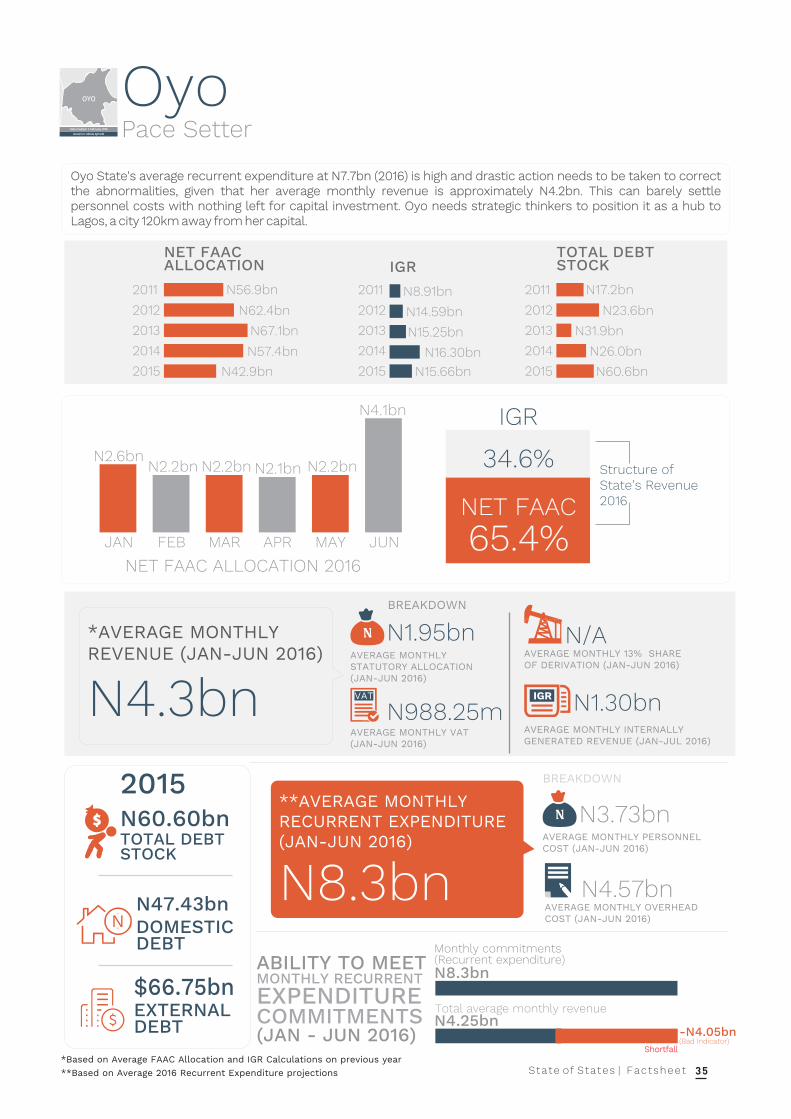
Yobe Pride of the Sahel
VAT
AVERAGE MONTHLY VAT(JAN-JUN 2016)
N609.45mAVERAGE MONTHLY INTERNALLY GENERATED REVENUE (JAN-JUL 2016)
N187.61m
N
AVERAGE MONTHLYSTATUTORY ALLOCATION (JAN-JUN 2016)
N1.73bnAVERAGE MONTHLY 13% SHARE OF DERIVATION (JAN-JUN 2016)
N/A
IGR
* AVERAGE MONTHLY REVENUE (JAN-JUN 2016)
N2.5bn
BREAKDOWN
20112012201320142015
N48.1bnN51.2bn
N56.2bnN50.8bn
N39.0bn
NET FAAC ALLOCATION
20112012201320142015
N2.39bn
N2.25bn
N1.79bnN3.07bnN3.07bn
IGR20112012201320142015
N7.0bnN8.9bn
N6.4bnN7.3bn
N9.9bn
TOTAL DEBT STOCK
**AVERAGE MONTHLY RECURRENT EXPENDITURE(JAN-JUN 2016)
N3.85bnN
AVERAGE MONTHLY PERSONNEL COST (JAN-JUN 2016)
N1.64bn
BREAKDOWN
AVERAGE MONTHLY OVERHEADCOST (JAN-JUN 2016)
N2.21bn
ABILITY TO MEET MONTHLY RECURRENT EXPENDITURE COMMITMENTS (JAN - JUN 2016)
Monthly commitments (Recurrent expenditure)
Total average monthly revenueN2.53bn
N3.85bn
-N1.322bn(Bad Indicator)
Shortfall
EXTERNALDEBT
$30.46m
DOMESTIC DEBT
N3.86bnN
TOTAL DEBT STOCK
N9.87bn2015
Yobe state can only boast of an average monthly IGR of N187.6m. Years of insurgency crippled her economy and there is a need to think smartly on how to mine her deposits. Blessed with limestone, gypsum and others, she needs to position itself for aggressive revenue generation.
YOBE
Date Created: 27 August 1991
Governor: Ibrahim Geidam
40
JAN FEB MAR APR MAY JUNNET FAAC ALLOCATION 2016
N2.4bn N2.2bnN1.9bn N2.0bn N1.9bn
N3.7bn9.80%
90.2%
Structure of State’s Revenue 2016
IGR
NET FAAC
*Based on Average FAAC Allocation and IGR Calculations on previous year **Based on Average 2016 Recurrent Expenditure projections State of States | Factsheet

*Based on Average FAAC Allocation and IGR Calculations on previous year **Based on Average 2016 Recurrent Expenditure projections
ZamfaraFarming is our Pride
VAT
AVERAGE MONTHLY VAT(JAN-JUN 2016)
N674.80mAVERAGE MONTHLY INTERNALLY GENERATED REVENUE (JAN-JUL 2016)
N228.47m
N
AVERAGE MONTHLYSTATUTORY ALLOCATION (JAN-JUN 2016)
N1.74bnAVERAGE MONTHLY 13% SHARE OF DERIVATION (JAN-JUN 2016)
N/A
IGR
*AVERAGE MONTHLY REVENUE (JAN-JUN 2016)
N2.6bn
BREAKDOWN
20112012201320142015
N46.5bnN48.0bn
N56.8bnN51.2bn
N32.1bn
NET FAAC ALLOCATION
20112012201320142015
N1.71bnN2.59bnN3.04bn
N3.15bnN2.74bn
IGR20112012201320142015
N17.2bnN19.9bn
N33.4bnN17.5bn
N53.2bn
TOTAL DEBT STOCK
**AVERAGE MONTHLY RECURRENT EXPENDITURE(JAN-JUN 2016)
N3.33bnN
AVERAGE MONTHLY PERSONNEL COST (JAN-JUN 2016)
N2.1bn
BREAKDOWN
AVERAGE MONTHLY OVERHEADCOST (JAN-JUN 2016)
N1.23bn
ABILITY TO MEET MONTHLY RECURRENT EXPENDITURE COMMITMENTS (JAN - JUN 2016)
Monthly commitments (Recurrent expenditure)
Total average monthly revenueN2.64bn
N3.33bn
-N692.96m(Bad Indicator)
Shortfall
EXTERNALDEBT
$34.92m
DOMESTIC DEBT
N46.28bnN
TOTAL DEBT STOCK
N53.16bn2015
The state struggles to gain independence from the support of the Federal Government with an average IGR of N228.5m. Zamfara can learn from Kebbi and also create a viable alternative through farming.
Zamfara
Date Created: 1 October 1996
Governor: Abdul’aziz Abubakar Yari
41
JAN FEB MAR APR MAY JUNNET FAAC ALLOCATION 2016
N1.6bn N1.5bn N1.5bn N1.5bn N1.2bn
N2.9bn 13.2%
86.8%
Structure of State’s Revenue 2016
IGR
NET FAAC
State of States | Factsheet

Source: NBS Nigeria
INTERNALLY GENERATED REVENUE AT STATE LEVEL 2015
IGR123456789101112131415161718192021222324252627282930313233343536
Rank StateLAGOSRIVERSDELTAOGUNEDOENUGUOYOANAMBRAAKWA IBOMKANOCROSS RIVERABIAKADUNAEBONYIONDOBAYELSAOSUNBENUEKWARAPLATEAUKOGISOKOTONIGERKATSINAIMOBAUCHIJIGAWAGOMBEADAMAWANASSARAWATARABAKEBBIBORNOEKITIZAMFARAYOBE
N268.22bn82.10bn40.81bn34.59bn19.12bn18.08bn15.66bn14.79bn14.79bn13.61bn13.57bn13.35bn11.54bn11.03bn10.09bn8.71bn8.07bn7.63bn7.18bn6.94bn6.78bn6.22bn5.98bn5.79bn5.47bn5.39bn5.08bn4.78bn4.45bn4.28bn4.15bn3.59bn3.53bn3.29bn2.74bn2.25bn
NNNNNNNNNNNNNNNNNNNNNNNNNNNNNNNNNNN
42State of States | Factsheet

1,207,900,597.65
226,368,167.93
168,186,197.48
136,403,069.67
103,331,349.94
85,335,689.1
76,896,131.15
72,153,818.01
71,828,840.62
66,754,604.54
60,781,525.58
59,163,843.12
57,612,298.94
54,982,558.3
53,066,146.92
52,717,441.23
52,089,561.21
51,032,662.69
49,056,440.81
47,166,600.06
46,922,403.74
45,275,904.28
44,780,717.63
41,946,527.11
41,502,309.09
39,822,769.29
38,792,421.97
37,602,856.36
35,700,600.77
34,919,653.15
34,085,704.85
33,632,106.66
30,474,421.99
30,456,120.37
23,189,858.24
22,934,478.17
LAGOS
KADUNA
EDO
CROSS RIVER
OGUN
BAUCHI
OSUN
KATSINA
ENUGU
OYO
ANAMBRA
IMO
KANO
EKITI
NASARAWA
AKWA IBOM
ONDO
KWARA
ADAMAWA
EBONYI
RIVERS
KEBBI
NIGER
SOKOTO
ABIA
GOMBE
DELTA
BAYELSA
BENUE
ZAMFARA
JIGAWA
KOGI
PLATEAU
YOBE
BORNO
TARABA
EXTERNAL DEBT PROFILE (2015) State Amount (USD)
Source: DMO
43State of States | Factsheet

DELTALAGOS
AKWA IBOMOSUN
RIVERSCROSS RIVER
BAYELSAPLATEAU
OGUNIMO
KANOKEBBI
BAUCHIGOMBE
EKITIKADUNA
OYOADAMAWA
EDOZAMFARA
KOGINASARAWA
BENUEENUGUEBONYI
ABIAKWARATARABA
ONDOBORNO
JIGAWANIGER
SOKOTOKATSINA
YOBEANAMBRA
320,605,705,560.12218,538,866,537.99147,575,744,158.56
144,699,560,798.75134,966,595,276.76115,522,252,057.76
103,374,234,640.8296,204,851,687.4775,921,433,395.5971,743,513,593.94
65,007,329,454.7763,793,338,564.4957,652,771,752.74
53,454,395,426.5852,564,975,851.0549,847,912,415.0747,437,006,181.9747,201,622,579.9646,289,079,475.9346,280,694,674.2842,034,626,226.8440,557,054,662.4239,944,214,752.4537,550,234,882.4934,168,940,626.6533,530,526,404.80
31,966,815,195.1827,646,234,687.0826,647,789,528.5822,338,730,000.0022,194,825,541.3321,501,786,900.4711,658,206,030.8211,495,034,109.563,867,455,411.903,575,774,874.94
DOMESTIC DEBT PROFILE (2015)
44State of States | Factsheet
N

RANKINGS - ABILITY OF STATE TO MEET MONTHLY RECURRENT EXPENDITURE COMMITMENTS (JAN - JULY 2016)
Total Monthly Recurrent
Expenditure ** States
Total Monthly Average Revenue *
Ability to meet recurrent
Expenditure Commitments
on a monthly basis
7,628,981,177.22
3,348,730,938.21
339,140,102.92
(15,387,691.07)
(19,349,920.22)
(145,257,972.51)
(154,174,784.03)
(155,818,032.20)
(331,549,802.51)
(576,893,745.06)
(692,957,216.28)
(925,098,740.49)
(1,054,400,105.21)
(1,054,753,979.78)
(1,129,893,855.91)
(1,186,377,556.46)
(1,322,029,916.07)
(1,608,012,660.42)
(1,650,252,490.03)
(1,680,187,503.22)
(1,867,725,755.38)
(1,889,652,466.71)
(2,054,182,244.11)
(2,099,059,167.77)
(2,196,734,278.83)
(2,219,290,733.86)
(3,081,811,688.39)
(2,204,420,271.53)
(3,645,010,518.28)
(4,965,660,561.67)
(5,271,941,603.53)
Ranks
1
2
3
4
5
6
7
8
9
10
11
12
13
14
15
16
17
18
19
20
21
22
23
24
25
26
27
28
29
30
31
32
33
34
35
36
LAGOS
RIVERS
ENUGU
KEBBI
EDO
EBONYI
KATSINA
NIGER
ANAMBRA
GOMBE
ZAMFARA
TARABA
BORNO
SOKOTO
EKITI
KADUNA
YOBE
NASSARAWA
ONDO
KOGI
CROSS RIVER
KANO
JIGAWA
BAUCHI
BENUE
ADAMAWA
PLATEAU
ABIA
OSUN
BAYELSA
AKWA IBOM
30,871,397,843.89
13,348,730,938.21
3,980,806,769.59
2,817,945,642.26
4,363,983,413.11
3,084,742,027.49
3,495,825,215.97
3,296,931,967.80
3,718,450,197.49
2,973,106,254.94
2,640,376,117.05
2,635,734,592.84
3,195,599,894.79
3,153,579,353.55
2,453,439,477.42
4,151,122,443.54
2,530,470,083.93
2,545,320,672.91
4,016,414,176.64
3,172,145,830.11
3,538,940,911.29
5,108,680,866.62
3,129,151,089.22
3,308,857,498.90
3,344,932,387.84
2,787,375,932.81
3,049,021,644.94
3,562,246,395.47
2,953,572,815.05
6,085,172,771.66
9,811,391,729.80
(1,676,943,704.53)IMO 3,170,556,295.47
(2,291,161,342.89)KWARA 2,771,338,657.11
(2,447,623,101.28)DELTA 10,319,043,565.39
(3,181,690,715.73)OGUN 5,227,392,617.60
(4,136,078,670.07)OYO 4,251,421,329.93
23,242,416,666.67
10,000,000,000.00
3,641,666,666.67
2,833,333,333.33
4,383,333,333.33
3,230,000,000.00
3,650,000,000.00
3,452,750,000.00
4,050,000,000.00
4,847,500,000.00
3,550,000,000.00
3,333,333,333.33
3,560,833,333.33
4,250,000,000.00
4,208,333,333.33
3,583,333,333.33
5,337,500,000.00
3,852,500,000.00
4,153,333,333.33
5,666,666,666.67
4,852,333,333.33
5,406,666,666.67
6,998,333,333.33
5,183,333,333.33
5,407,916,666.67
5,541,666,666.67
5,062,500,000.00
12,766,666,666.67
5,006,666,666.67
8,409,083,333.33
6,130,833,333.33
5,766,666,667.00
8,387,500,000.00
6,598,583,333.33
11,050,833,333.33
15,083,333,333.33
STA
TES W
ITH
SH
OR
TFA
LLS (
MO
NTH
LY)
*Based on Average FAAC Allocation and IGR Calculations on previous year **Based on Average 2016 Recurrent Expenditure projections
45State of States | Factsheet
NN N
State without shortfalls State with shortfalls State with shortfalls (Fair)

STATE GOVERNMENT 2016 BUDGET
ABIA ADAMAWA AKWA IBOM ANAMBRA BAUCHI BAYELSA BENUE BORNO CROSS-RIVER DELTA EBONYI EDO EKITI ENUGU GOMBE IMO JIGAWA KADUNA KANO KATSINA KEBBI KOGI KWARA LAGOS NASARAWA NIGER OGUN ONDO OSUN OYO PLATEAU RIVERS SOKOTO TARABA YOBE ZAMFARA
TotalN’bn101.4120.1423.00101.40135.31170.60150.70159.00259.2*268.00101.16116.6070.585.1076.8102.2137.20171.7274.33114.3109.0099.94128.10662.677.3085.09200.20123.7141.27173.10146.7307.00174.30100.8889.93109.4
46State of States | Factsheet
*Revised budget (October 2016)

KANO
MAIDUGURI
PORTHARCOURT
CONSTRUCTION OFCALABAR-LAGOS
RAILWAYS
N60bn
RAILWAY MODERNIZATION LAGOS-KANO
N60bn
KADUNA
COMPLETION OF ABUJA-KADUNA SINGLE TRACK
RAIL-LINE
N19.8bn
ITAKPE
MINNA
COMPLETION OF ITAKPE-WARRIRAIL TRACK &
SIGNAL SYSTEMS
N8.5bnABUJA
WARRI
LAGOS
CALABAR
for Provision of Power, Water, Station building, Fence,
etc for rail lines
N3.2bnOTHERS
SELECTED RAILWAY PROJECTS
PROVISION FOR RAILWAYS
N149.3bn
[email protected] @trackaNG www.facebook.com/trackanigeria
# A s k Q u e s t i o n s

www.yourbudgit.com
SIMPLIFYING THE NIGERIAN BUDGET At BudgIT, we believe it is the RIGHT of every citizen tohave access to, and also understand public budgets.We also believe budgets must be efficiently implementedfor the GOOD of the people.
For Corporate Clients’ bespoke design services, Visit: budgit.co or Call +234-816 612-4314 +234-908-333-1633