State of New Mexico - U.S. Department of · PDF fileArthur J. Martinez, Bureau Chief ......
51
Transcript of State of New Mexico - U.S. Department of · PDF fileArthur J. Martinez, Bureau Chief ......


State of New Mexico Workforce Report 2008
Bill Richardson Governor
Betty Sparrow Doris Cabinet Secretary, NMDWS
Raymond H. Gonzales Deputy Cabinet Secretary, NMDWS
Prepared by New Mexico Department of Workforce Solutions Economic Research and Analysis Bureau
Arthur J. Martinez, Bureau Chief
Major Contributors
Herb Greenwall Robert Richards Joy Forehand Tracy Shaleen Suzan Reagan Michelle Doran Roger Saunders Monique Ortiz Mark Boyd
June 2008
For further information contact: New Mexico Department of Workforce Solutions
Economic Research and Analysis Bureau P.O. Box 1928
Albuquerque, NM 87103 (505) 841-8645


i
Table of Contents
State of New Mexico Workforce Report Update.........................................................................................1 Summary and Findings ........................................................................................................................................2
Workforce Demand .......................................................................................................................................5 Statewide and MSA Employment Growth Reflects Economic Growth of Region..................................................5 Statewide and WIA Areas Employment Growth Reflects Economic Growth Throughout the Region ....................................................................................................................................................................6 Employment Distribution by Industry Sectors...................................................................................................7 Establishing or Expanding Presence in New Mexico......................................................................................8 Many New Jobs in the Educational and Medical Fields Created Each Year ..........................................9 Many New Jobs in the Public Sector, Health Care Fields and Retail Created Each Year in the Northern Workforce Investment Area.............................................................................................................10 Central Workforce Investment Area Projected to See Many New Jobs in Health Care and Social Services Each Year.................................................................................................................................11 New Jobs in the Health Care and Educational Fields Lead the Growth in the Southwestern Workforce Investment Area .............................................................................................................................12 Health Care and Education Offer Many New Jobs in the Eastern Workforce Investment Area.........13 Clustering of Earnings Across Occupations Depicts Office Economy......................................................14 Minimal Education and Training are Required for Many Jobs...................................................................15 Distribution of Employment by Education and Training Categories .........................................................16 Meeting the Occupational Needs of the Health Care Industry................................................................17 Residential Development Softens ...................................................................................................................18 Value of Residential Permits .............................................................................................................................19
Current Workforce Supply...........................................................................................................................20 New Mexico’s Unemployment Rate Falls Below the National Rate..........................................................20 Understanding Population Size, Change, and Density ...............................................................................21 Understanding Population Size, Change, and Density ...............................................................................22 Strong “Entry-Level” Age Demographics Compared to National Average ...........................................24 New Mexico Enjoys Broad Racial and Ethnic Diversity................................................................................25 Median Family Income Varies Among Regional Cities ...............................................................................26 High Poverty Rates Signal Underlying Trouble...............................................................................................27 More New Mexico Households Are Led by Single Females with Children Under 18..............................28 Households Receiving Public Assistance Higher in New Mexico...............................................................29 Labor Supply and the Demand for High School Graduates ......................................................................30 Demand for Bachelor’s Degrees.....................................................................................................................31 National Labs and Technology Centers Boost Graduate and Professional Degrees............................32 Racial and Ethnic Inequality in Educational Attainment............................................................................33 Government Workers as a Percent of Total Workforce...............................................................................34

ii
Future Workforce Supply .............................................................................................................................35 Diverse Student Enrollment ...............................................................................................................................35 High School Graduation Rates ........................................................................................................................36 Graduation Rates Vary Among Students ......................................................................................................37 Domestic Migration of Young, Single & College-Educated People .........................................................38
WorkInNewMexico.gov...............................................................................................................................39 New Mexico Career Clusters Guidebook......................................................................................................39
Quality of Life ...............................................................................................................................................40 Albuquerque, NM: An Attractive Locale for Singles and Families.............................................................40 Higher Median Home Values Take Greater Share of Income ...................................................................41 Housing Costs Take Large Share of Household Income..............................................................................42 Telecommunication Access an Urban/Rural Issue.......................................................................................43 Housing Density as an Indicator of Quality of Life ........................................................................................44
Conclusions..................................................................................................................................................45

1
State of New Mexico Workforce Report Update
June 2008
June 2008 Update
The State of the Workforce Report is an annual planning
resource that has been produced by the New Mexico
Workforce Solutions Department’s Economic Research
and Analysis Bureau since 2003. Most of the data and
findings were updated for this version of the report to
reflect the most current information available at the time
of publication.
The most notable revision in this year’s report is the inclu-
sion of statistical data for the four Workforce Investment
Act (WIA) areas. All of the trends and analyses were
verified and new observations duly noted.
The 2008 update comes at an exciting time for New
Mexico. The state has continued a period of vibrant job
growth that began several years ago. Overall, the
state’s rate of job growth is consistent with our long-term
average. Much of the credit for New Mexico’s job
growth can be traced to the decisions of far-seeing policy
makers and legislators. The effects of economic de-
velopment efforts to attract new employers to the state can
be seen in the emerging motion picture and aerospace
industries. Within the near-term horizon is the possibility of
hundreds of additional jobs in aircraft and automobile
manufacturing, cabinet manufacturing, mattress manufac-
turing, and scientific research and development.
While much of the state enjoys a wealth of new jobs,
persistent problems confront jobseekers in some rural areas.
Additionally, there are some longstanding concerns about
the quality of the current job opportunities across the state.
This report looks at the character of the New Mexico
workforce and highlights strengths and weaknesses in the
state’s economy. The report examines workforce demand,
workforce supply, future workforce supply, and quality of life.
.
The Sandia Mountains and residential area east of Albuquerque, NM.

2
Summary and Findings Workforce Demand
• Job growth is a primary indicator of the health of a
state economy. In 2006, the rate of job growth in
the state of New Mexico was 3.0 percent for an
increase of about 19,900 jobs over the year. New
Mexico had the seventh highest job growth in the
country, while Arizona, Wyoming, and Nevada had
the highest rates. New Mexico’s job growth was 13.7
percent over the last ten years. The Las Cruces MSA
led the state with about 28.5 percent job growth,
followed by Santa Fe (20.7 percent), Farmington
(12.3 percent), and Albuquerque (11.0 percent).
The Southwestern WIA area led the WIA regions,
growing by 23.2 percent over the past ten years.
The Northern WIA area grew by 15.3 percent,
followed by the Eastern WIA area (11.8 percent)
and the Central WIA area (11.1 percent).
• Most of the jobs in the state of New Mexico are in
either the service-providing industries or govern-
ment. The concentration of services employment in
New Mexico is similar to that of the nation as a
whole, while the proportion of government jobs in
New Mexico is higher because of the presence of
two national defense laboratories and three large
Air Force bases.
• Every two years, the New
Mexico Department of Work-
force Solutions’ research staff
projects employment growth
for the following ten years. The
industry projected to have the
largest growth between 2004
and 2014 is Administrative &
Support Services with an em-
ployment increase of about
21,100 jobs. Health Care &
Social Assistance comes in
second with growth of 17,800
jobs. Health Care employment
is expected to remain very important to the New
Mexico economic picture with combined growth in
ambulatory health services, hospitals, and nursing
care. Complete industry projections for period 2006-
2016 will be available by late June 2008.
• Tourism-related employment is expected to perform
well with growth of 11,700 jobs in Accommodation &
Food Services and 2,500 jobs in Arts, Entertainment,
& Recreation industries.
• The largest occupational clusters in New Mexico are
in Office & Administrative Support occupations with
employment of about
124,600 in 2006. Employ-
ment in Retail and Whole-
sale Sales occupations
comes next with about
91,400 workers, followed by
Food Preparation & Serving-
related occupations esti-
mated at 75,500 workers
and Construction & Extrac-
tion occupations estimated
at 67,500 workers.
• Many of the occupations with the largest
concentrations of employ-
ment require little educa-
tion. For example, the oc-
cupation “retail salesper-
son” accounts for about
3.8 percent of the state’s
workforce, but requires only
short-term on-the-job train-
ing. As might be imagined,
jobs that require little in the
way of education tend to
be lower paying. Other
low-skill, low-wage jobs that
employ many workers
Administrative & Support Services are expected to be the biggest future growth area.
Mike Dinallo and Larry Schneider (left) prepare to employ the PASD diagnostic on a wiring bundle in the cockpit of a
retired Boeing 737 at Sandia’s FAA Airworthiness Assurance NDI Validation Center.

3
include cashiers and waiters & waitresses. On the
other hand, the general & operations manager
occupation, with employment of about 11,200 in
2006, requires a bachelor’s degree plus work
experience. Registered nurses are another
occupation requiring more education, with a
minimum of an associate’s degree or bachelor’s
degree required. There were about 12,100 registered
nurses working in New Mexico in 2006.
• In 2006, 49.2 percent of the jobs existing in New
Mexico required a high school diploma or short-term
on-the-job training, while 27.1 percent required an
associate’s degree or moderate on-the-job training.
The remaining 23.7 percent of the jobs in New
Mexico required a higher education degree.
• New Mexico has made a concerted effort to join
the ranks of the New Economy states by
encouraging technology transfer from the Sandia
and Los Alamos National Laboratories. According
to the 2002 State New Economy Index of the
Progressive Policy Institute Technology Project, New
Mexico ranked 27th out of the 50 states. New
Mexico ranked 46th in workforce education, 36th in
manufacturing workforce education, 38th in
technology in schools, and 6th in information
technology jobs.
Current and Future Workforce Supply • New Mexico’s 2007 unemployment rate was 3.6
percent, down from 4.2 percent in 2006. The
October unemployment rate of 3.1 percent was the
lowest for the state since the current series began in
1976. The 2007 national unemployment rate was 4.6
percent for comparison.
• According to the 2007 Census estimates, New
Mexico’s population was 1.970 million. That
represents growth of 8.3 percent between 2000 and
2007. This was one of the fastest growth rates in the
country. New Mexico still had a low population
density with fewer than 16 persons per square mile,
compared to an average of 54 persons for our
neighboring states.
• New Mexico is a younger state, as are most states in
the West. New Mexico’s median age was 35.2
years, compared to a national average of 36.4
years. New Mexico has a diverse population that
includes the largest population based proportion of
Hispanics of any state (44 percent) and the second
largest concentration of Native Americans (9.8
percent).
• New Mexico’s median family income was $48,200 in
2006, compared to the national average of $58,500.
Albuquerque median family income was higher
than the state level at $55,300.
• Poverty in New Mexico is a continuing problem, as
evidenced by recent data from the American
Community Survey indicating that 18.5 percent of
the state’s population meet the standard definition.
The comparable proportion for the United States
was 13.3 percent. Neighboring states ranged from
10.6 percent in Utah to 18.5 percent in Texas.
Roughly 2.1 percent of New Mexico households
receive Temporary Assistance for Needy Families,
compared to a U.S. average of 2.4 percent.
• New Mexico has a higher percentage of households
headed by a single parent than does the nation as
a whole. The state’s
8.1 percent rate ex-
ceeds the national
rate of 7.4 percent for
households headed
by a single female. A
single male heads ap-
proximately 3 percent of New Mexico households.
• The proportion of individuals with a bachelor’s
degree aged 25 and above is a key indicator of
workforce preparedness, as is the number of high
school graduates. In New Mexico, the proportion of
residents with a high school diploma was 27.7 in
NM is high in single parent head of household.

4
2006. The percentage of individuals with a
bachelor’s degree was 14.4 percent in 2006, up from
14.2 percent in the previous year. New Mexico has
a high proportion of residents with graduate or
professional degrees (10.9 percent) due in part to
the national labs, technical universities, and high-
tech industries.
• Approximately 23 percent of the New Mexico
workforce is on the payroll of federal, state, or local
government. New Mexico ranks high in measures of
state government employment because of the
state’s geographically dispersed higher education
system.
• Almost 50 percent of the students in the public
education system in New Mexico are Hispanic,
reflecting the diversity and youth of the state’s
population. The national average of Hispanic
students in public education was closer to 15
percent.
• The high school graduation rate in New Mexico has
been falling over the last fifteen years, which clearly
represents a problem for workforce preparedness.
The rate has fallen from just over 84 percent in the
1989-91 period to about 83 percent in the most
recent period reported. New Mexico’s high school
graduation rate was about three points below the
national average.
• New Mexico has experienced a troubling out-
migration of young, college-educated people, with
18 percent of this group leaving the state between
1990 and 2000. This is an indication of weak
demand for an educated labor force that is also
reflected in the employment projections.
Quality of Life • New Mexico is slightly above the national average
for attracting singles, with over one quarter of its
residents living alone. The proportion was 35.3
percent in Albuquerque. Of regional cities, Denver
was the highest with over 41 percent of its residents
living alone.
• New Mexico’s median home value in 2006 was
$141,200, substantially less than the national aver-
age of $185,200. The median home value in Albu-
querque, however, was $172,300. According to the
U.S. Department of Hous
ing and Urban Develop-
ment, a home is con-
sidered affordable if not
more than 30 percent of
household income is
spent on housing costs.
Nearly one-fourth of
owned households in New Mexico have owner costs
that exceed 30 percent of the household income,
which is below the national average. Albuquerque
is fifth out of eight regional cities.
Eclipse Aviation facility in Albuquerque.
Albuquerque housing is higher than surrounding communities.

5
Workforce Demand
Information on employment and economic growth, education and training, and residential development.
A Metropolitan Statistical Area (MSA), as designated by the federal Office of Management and Budget, refers to a large
population nucleus, together with adjacent communities having a high degree of economic and social integration with
that nucleus.
Statewide and MSA Employment Growth Reflects Economic Growth of Region How are we doing? New Mexico and the Metropolitan Statistical Areas within
the state have experienced substantial employment
growth over the past ten years. The state has added
nearly 14 percent more jobs than a decade ago,
compared to the national growth rate of less than 11
percent. Job growth has been moderate for most of the
state’s MSAs over the one, five, and ten-year horizons.
The Las Cruces MSA had the fastest employment growth
over the 10-year period, at about 28 percent. The
Albuquerque MSA has been the most affected by the
downturn in the economy that started in 2001 and lasted
through 2003, which is reflected in the five-year period.
However, the state and each of the MSAs outperformed
the national growth rate of 4.5 percent. The
Albuquerque MSA has the largest and most diverse share
of employment in the state. It is important to understand
an area's employment size and rate of change before
considering other factors, such as critical industries and
occupations.
Why is this important and who is it important to? This report reviews several areas, including statewide, the
MSAs and the Workforce Investment Act (WIA) areas.
Geographic detail provides an important dimension for
the data to follow. Policy-makers use this information to
determine if adopted strategies are working to the
benefit of their area.
Percent Employment Change MSAs - 1997-2006
0.0%
5.0%
10.0%
15.0%
20.0%
25.0%
30.0%
2005-2006 2002-2006 1997-2006New Mexico Albuquerque Farmington Las Cruces Santa Fe
Source: NM Department of Workforce Solutions, Local Area Unemployment Statistics, 2007.

6
Statewide and WIA Areas Employment Growth Reflects Economic Growth Throughout the Region
How are we doing? New Mexico and the state’s Workforce Investment Act
areas have experienced substantial employment growth
over the past ten years. The state has almost fourteen
percent more jobs than a decade ago. Job growth has
been moderate for most of the WIAs over the one, five,
and ten-year horizons, yet has mostly exceeded the
national trend for each period of growth which was 2
percent, 4.5 percent, and 11 percent respectively.
Why is this important and who is it important to? This report reviews several areas, including Statewide, the
MSAs and the Workforce Investment Act areas.
Geographic detail provides an important dimension for
the data to follow. Job growth is an important indicator
of the state’s overall economic well-being. The New
Mexico economy has proven capable of generating jobs
for the influx of people entering the job market.
Economic developers use this data to attract businesses
looking to locate in growing areas.
Percent Employment Change WIAs, 1997-2006
0.0%
5.0%
10.0%
15.0%
20.0%
25.0%
2005-2006 2002-2006 1997-2006
New Mexico Northern Central Southwestern Eastern
Source: NM Department of Workforce Solutions, Local Area Unemployment Statistics, 2007.

7
Employment Distribution by Industry Sectors
How are we doing? In 2007, nearly one of every four in New Mexico jobs is
in the government sector. The largest private sector
industries are Professional & Business Services and
Educational & Health Services, each accounting for 13
percent of the state’s jobs, followed by Retail Trade
and Leisure & Hospitality, each with 11 percent of the
total employment. Today’s economy has become
very service-oriented, with the goods-producing
industries of Mining, Construction, and Manufacturing
accounting for about 13 percent of all employment in
the state, unchanged from one year ago.
Why is this important and who is it important to? To the extent workforce policy makers target entry-level
workers, services and government industries offer many
competitive advantages. While some service jobs are high
paying, most are not and require minimal education and
training. Government jobs are also plentiful in the area at
various levels and offer an element of perceived security.
Policy-makers utilize this information to encourage industry
diversification. When successful, this softens the affects of
economic downturns.
Manufacturing 4%
Wholesale Trade 3%
Retail Trade 11%
Transportation Warehousing & Utilities
3%
Information 2%
Financial Activities 4%
Professional and Business Services
13%
Educational and Health Services
13%
Leisure and Hospitality 11%
Other Services 3%
Construction 7%
Government 24%
Natural Resources and Mining
2%
Source: NM Department of Workforce Solutions, Current Employment Statistics, 2007.
September 2007 Industry Distribution

8
Establishing or Expanding Presence in New Mexico
How are we doing? A number of firms have indicated their intention to
expand operations in New Mexico, creating thousands of
new jobs. The table below is adapted from a University
of New Mexico, Bureau of Business and Economic
Research (BBER) forecast for the New Mexico economy.
The table shows “add-factor” adjustments in the forecast
for employment gains that are expected in the state.
Employment numbers are shown cumulatively for each
quarter through the end of 2012.
Why is this important and who is it important to? New Mexico needs new jobs for workers who will be
entering the workforce as well as for those who are
currently unemployed. Export industries, where the
product or service is sold beyond the state’s boundaries,
provide a net gain in employment and the most benefits
for the state. Workforce development professionals use
this information to establish strategies to meet the
expected demand for labor.
Source: University of New Mexico, BBER, 2007.
Add-Factor Adjustments
-600
-400
-200
0
200
400
600
800
1000
1200
1400
07q3
07q4
08q1
08q2
08q
3
08q
4
09q1
09q2
09q3
09q4
10q
1
10q2
10q3
10q4
11q1
11q2
11q
3
11q4
12q1
12q2
12q3
12q4
Manufacturing Construction Business Services Information

9
Many New Jobs in the Educational and Medical Fields Created Each Year
How are we doing? In looking at the NAICS sector industry projections for
New Mexico, the Educational Services industry will be
adding the most employment with nearly 21,000
additional jobs projected by 2014. The Health Care &
Social Assistance sector is estimated to contribute
another 19,600 jobs to the economy as the population
ages. Administrative & Support Services will provide
another 19,200 jobs over the projection period.
Accommodation & Food Services is projected to add
over 16,000 jobs. It appears Mining is the only sector that
will experience negative growth.
Why is this important and who is it important to? It is important to know where the job growth is expected
to be. The fastest growing industries represent areas of
high worker demand, and this is where the need for
future workers is projected. Economic developers can
use this information to attract targeted industries.
New Mexico Industry Estimated Cumulative
Growth, 2004-2014 1 Educational Services 20,285 2 Health Care & Social Assistance 19,584 3 Administrative & Support Services 19,188 4 Accommodation & Food Services 16,111 5 Retail Trade 15,772 6 Local Government 9,943 7 Information 6,536 8 Arts, Entertainment & Recreation 5,808 9 Construction 4,566
10 Transportation & Warehousing 4,274 11 Management of Companies 3,930 12 Other Services 3,743 13 Finance & Insurance 3,552 14 State Government 3,365 15 Manufacturing 2,635 16 Professional, Scientific & Technical 2,624 17 Real Estate, Rental & Leasing 1,771 18 Wholesale Trade 1,697 19 Federal Government 806 20 Mining -668
Source: NM Department of Workforce Solutions, Economic Research & Analysis, 2006.

10
Many New Jobs in the Public Sector, Health Care Fields and Retail Created Each Year in the Northern Workforce Investment Area
How are we doing? In looking at the NAICS sector industry projections for the
Northern WIA, Local Government will add the most
employment through 2014. In the medical field, Health
Care & Social Assistance will create over 5,400 new jobs
as the population ages. Retail Trade is projected to grow
over 5,100 jobs in the region, while Accommodation &
Food Services and Educational Services are estimated to
add about 4,700 and 3,400 jobs respectively. It appears
Utilities is the only sector that will experience negative
growth in the region.
Why is this important and who is it important to? It is important to know where the job growth is expected
to be. The fastest growing industries represent areas of
high worker demand and this is where the need for future
workers is projected. Job seekers use this information to
determine career choices in changing economies.
Northern WIA Area Industries Estimated
Cumulative Growth, 2004-2014
1 Local Government 6,796 2 Health Care & Social Assistance 5,434 3 Retail Trade 5,194 4 Accommodation & Food Services 4,731 5 Educational Services 3,422 6 Arts, Entertainment & Recreation 3,107 7 Administrative & Support Services 2,625 8 Construction 2,483 9 Other Services 1,755
10 Professional, Scientific & Technical 1,373 11 Real Estate, Rental & Leasing 648 12 Finance and Insurance 568 13 Transportation & Warehousing 531 14 Wholesale Trade 448 15 Mining 377 16 Federal Government 370 17 Information 288 18 Management of Companies 186 19 Agriculture, Forestry, Fishing & Hunting 71 20 Utilities -14
Source: NM Department of Workforce Solutions, Economic Research & Analysis, 2006.

11
Central Workforce Investment Area Projected to See Many New Jobs in Health Care and Social Services Each Year
How are we doing? In looking at the NAICS sector industry projections for the
Central WIA area, Health Care & Social Assistance will
create nearly 11,400 new jobs as the population ages.
Accommodation & Food Services and Administrative &
Support Services are projected to add about 6,000 jobs.
The Construction industry will provide over 5,400 jobs to
the economy even as construction nationally is
hampered by the credit crunch. Retail Trade and
Professional, Scientific, & Technical Services are each
estimated to add over 5,000 jobs through 2014.
Projections indicate Utilities, Agriculture, and Information
will experience negative growth through the projection
horizon.
Why is this important and who is it important to? It is important to know where the job growth is expected
to be. The fastest growing industries represent areas of
high worker demand and this is where the need for future
workers is projected. Training providers benefit from the
knowledge of anticipated job growth to most affectively
invest their resources.
Central WIA Area Industries Estimated
Cumulative Growth, 2004-2014
1 Health Care & Social Assistance 11,374 2 Accommodation & Food Services 6,054 3 Administrative & Support Services 5,879 4 Construction 5,426 5 Retail Trade 5,373 6 Professional, Scientific & Technical 5,116 7 Educational Services 4,863 8 Local Government 1,522 9 Finance & Insurance 1,062
10 Wholesale Trade 755 11 State Government 607 12 Other Services 606 13 Management of Companies 378 14 Transportation & Warehousing 338 15 Manufacturing 308 16 Real Estate, Rental & Leasing 292 17 Federal Government 167 18 Utilities -10 19 Agriculture, Forestry, Fishing & Hunting -77 20 Information -361
Source: NM Department of Workforce Solutions, Economic Research & Analysis, 2006.

12
New Jobs in the Health Care and Educational Fields Lead the Growth in the Southwestern Workforce Investment Area
How are we doing? In looking at the NAICS sector industry projections for the
Southwestern WIA area, Health Care & Social Assistance
will add the greatest number of jobs to the region
through 2014. Educational Services and Administrative &
Support Services industries will each add approximately
3,000 jobs. Local Government and Accommodation &
Food Services are projected to add about 2,100 jobs and
1,900 jobs, respectively. Projections indicate as many as
nine industries may experience relatively flat or negative
growth.
Why is this important and who is it important to? It is important to know where the job growth is expected
to be. The fastest growing industries represent areas of
high worker demand and this is where the need for future
workers is projected. The business community uses this
information to track the growth or decline of industry
clusters.
Southwestern WIA Area Industries Estimated
Cumulative Growth, 2004-2014
1 Health Care & Social Assistance 4,255 2 Educational Services 3,237 3 Administrative and Support Services 2,897 4 Local Government 2,101 5 Accommodation & Food Services 1,924 6 Retail Trade 1,409 7 Construction 1,175 8 Professional, Scientific & Technical 720 9 Manufacturing 703
10 Transportation & Warehousing 501 11 Other Services 347 12 Wholesale Trade 198 13 Arts, Entertainment & Recreation 134 14 Real Estate, Rental & Leasing 65 15 Management of Companies 35 16 Information 26 17 Finance & Insurance 18 18 State Government 15 19 Utilities -16 20 Agriculture, Forestry, Fishing & Hunting -267
Source: NM Department of Workforce Solutions, Economic Research & Analysis, 2006.

13
Health Care and Education Offer Many New Jobs in the Eastern Workforce Investment Area
How are we doing? Health Care & Social Assistance will lead the
employment growth in the Eastern WIA area during the
2004 - 2014 projection period. Educational Services and
Accommodation & Food Services are estimated to add
over 2,600 jobs each, followed by Retail Trade adding
over 2,000 jobs to the region. Six industries could
experience flat growth.
Why is this important and who is it important to? It is important to know where the job growth is expected
to be. The fastest growing industries represent areas of
high worker demand and this is where the need for future
workers is projected. WIA regional partners use this
information to determine what trainings to offer and at
what level to fund the training.
Eastern WIA Area Industries Estimated
Cumulative Growth, 2004-2014
1 Health Care & Social Assistance 4,592 2 Educational Services 2,698 3 Accommodation & Food Services 2,613 4 Retail Trade 2,010 5 Construction 1,265 6 Administrative & Support Services 1,264 7 Mining 1,079 8 Agriculture, Forestry, Fishing & Hunting 939 9 Manufacturing 908
10 Local Government 719 11 Transportation & Warehousing 490 12 Other Services 475 13 Professional, Scientific & Technical 390 14 Finance & Insurance 373 15 Real Estate, Rental & Leasing 323 16 Arts, Entertainment & Recreation 202 17 Information 82 18 State Government 68 19 Management of Companies 56 20 Utilities -50
Source: NM Department of Workforce Solutions, Economic Research & Analysis, 2006.

14
Clustering of Earnings Across Occupations Depicts Office Economy
How are we doing? Building on data seen on previous pages, broad clustering of occupations identifies an office economy that accounts for almost a third of all the wages earned in the state. These include the core clusters of Office & Administrative Support (13.1 percent of all wages earned), Management (10.4 percent of all wages earned), Business & Financial Operations (4.7 percent of all wages earned), and Computer and Mathematical occupations (2.8 percent of all wages earned).
Why is this important and who is it important to? In addition to looking at key industries, it is important to look for occupations that are critical in a labor market area. Policy makers need to be able to determine whether to focus on jobs that are the highest paying or on jobs for which there is the most demand. In looking at the quality of jobs in a region, we can look at both employment and wages of major occupational groups. One method to do this is an analysis of total annual wages, calculated by multiplying employment by annual earnings.
Clusters of occupations are also relevant across various industries or disciplines. Management occupations, for example, exist across all sectors of employment, as do computer occupations. Therefore, developing skills and knowledge critical to success in these occupations will benefit all industry sectors. Workforce planning groups will find this information useful when developing strategies.
Occupational Sectors Employment Annual Wage
Total Annual Wage
% of Total
Wages Office & Administrative Support 132,970 $26,400 $3,510,408,000 13.1% Management 39,890 $70,180 $2,799,480,200 10.4% Healthcare Practitioners & Technical 39,150 $58,060 $2,273,049,000 8.5% Education 54,630 $40,820 $2,229,996,600 8.3% Sales & Related 80,960 $27,180 $2,200,492,800 8.2% Construction & Extraction 62,110 $31,580 $1,961,433,800 7.3% Architecture & Engineering 21,170 $65,150 $1,379,225,500 5.1% Business & Financial Operations 23,750 $53,450 $1,269,437,500 4.7% Transportation & Material Moving 45,520 $27,520 $1,252,710,400 4.7% Food Preparation & Serving Related 75,840 $15,920 $1,207,372,800 4.5% Installation, Maintenance & Repair 33,140 $34,900 $1,156,586,000 4.3% Production 33,940 $30,580 $1,037,885,200 3.9% Computer & Mathematical 11,790 $63,280 $746,071,200 2.8% Protective Service 21,970 $30,790 $676,456,300 2.5% Life, Physical & Social Science 9,400 $59,010 $554,694,000 2.1% Building & Grounds Maintenance 27,950 $18,930 $529,093,500 2.0% Community & Social Services 13,920 $34,030 $473,697,600 1.8% Healthcare Support 20,640 $22,740 $469,353,600 1.7% Personal Care & Service 23,300 $18,660 $434,778,000 1.6% Legal 5,270 $60,020 $316,305,400 1.2% Arts, design & Entertainment 7,780 $37,230 $289,649,400 1.1% Farming, Fishing & Forestry 4,250 $16,060 $68,255,000 0.3% Total 789,360 $33,980 $26,822,452,800
Source: Bureau of Labor Statistics, 2006. - http://www.bls.gov/oes/current/oes_nm.htm#b00-0000.

15
Minimal Education and Training are Required for Many Jobs
How are we doing? Many of the jobs that New Mexican workers fill are entry-
level positions. This list is typical for most states and areas.
While entry-level positions are generally low paying, they
usually afford easy labor market entry and minimal
training. They typically represent a start to a career that
can often lead to more advanced positions.
Why is this important and who is it important to? When considering specific occupations, it is valuable to
work from current estimates of employment because
these are often the best guides as to what entry-level
jobs are going to be available. However, when
considering these jobs, it is important to note that while
many require only short- to mid-term on-the-job training,
they also tend to have high turnover and high rates of
part-time employment. Therefore, the overall quality of
the job must be taken into account when deciding on
job training priorities and resources. While entry-level
positions provide easy access for job seekers into the
labor market, there is a need to target job training for
positions that can provide competitive wages.
Appropriate on-the-job training and adult education are
necessary in teaching existing workers and new labor
entrants new skills that will lead to new careers. Job
seekers use this information in pursuit of employment
opportunities.
Occupational Title Estimated Employment
Annual Wage Education and Training
Retail Salespersons 29,750 $21,780 Short-Term on-the-Job Training Secretaries 19,410 $25,510 Moderate-Term on-the-Job Training Cashiers 18,800 $16,900 Short-Term on-the-Job Training Combined Food Preparation and Serving Workers 18,190 $14,060 Short-Term on-the-Job Training Office Clerks 15,760 $21,730 Short-Term on-the-Job Training Waiters and Waitresses 14,800 $14,700 Short-Term on-the-Job Training General and Operations Managers 13,620 $76,810 Degree Plus Work Experience Janitors and Cleaners 12,890 $18,720 Short-Term on-the-Job Training Registered Nurses 11,680 $57,000 Associate’s Degree Bookkeeping, Accounting, and Auditing Clerks 10,900 $28,260 Moderate-Term on-the-Job Training Customer Service Representatives 10,290 $25,100 Moderate-Term on-the-Job Training Elementary School Teachers 9,890 $41,190 Bachelor’s Degree Laborers and Freight, Stock, and Material Movers, Hand 9,550 $19,340 Short-term on-the-job training Truck Drivers, Heavy and Tractor-Trailer 9,440 $33,060 Moderate-Term on-the-Job Training Construction Laborers 9,230 $22,380 Moderate-Term on-the-Job Training Stock Clerks and Order Fillers 9,010 $20,950 Short-Term on-the-Job Training Executive Secretaries and Administrative Assistants 8,600 $35,040 Moderate-term on-the-job training First-Line Supervisors/Managers of Retail Sales Workers 8,340 $35,070 Work Experience in a Related Maintenance and Repair Workers, General 7,960 $28,040 Moderate-term on-the-job training Teacher Assistants 7,640 $16,370 Short-Term on-the-Job Training Carpenters 7,480 $30,310 Long-term on-the-job training Maids and Housekeeping Cleaners 7,050 $15,400 Short-Term on-the-Job Training Nursing Aides, Orderlies, and Attendants 6,220 $20,790 Short-Term on-the-Job Training Farmworkers and Laborers, Crop, Nursery, & Greenhouse 3,100 $14,020 Short-Term on-the-Job Training
Source: Bureau of Labor Statistics, 2006. - http://www.bls.gov/oes/current/oes_nm.htm#b00-0000.

16
Distribution of Employment by Education and Training Categories
How are we doing? About 21 percent of the state's total jobs require a
bachelor’s degree or higher. Conversely, over 37
percent of the area's jobs require only short-term on-
the-job training. Overall, these numbers suggest that
there are opportunities for both entry-level and more
highly educated workers.
Why is this important and who is it important to? While New Mexico has a high rate of jobs that require a
bachelor’s degree or higher, there are many
opportunities for entry-level workers. The state's high
rates of service and government employment help to
maintain the trend as employers hire workers based
upon the appropriate skill and educational
requirements. We will look at that relationship in a later
section of the report. Workforce development
professionals use this information when discussing the
state of the workforce with career counselors.
0%
5%
10%
15%
20%
25%
30%
35%
40%
Short-
term
on-th
e-job tra
ining
Moderate
-term
on-th
e-job tra
ining
Long-te
rm o
n-the-jo
b training
Work
experie
nce in a
relate
d occupatio
n
Postsecondary
vocatio
nal award
Associate
's degre
e
Bachelor's degre
e
Bachelor's plus e
xperie
nce
Master's
degree
Doctora
l degre
e
First
profe
ssional d
egree
Distribution of Employment by Education and Training
Source: NM Department of Workforce Solutions (Base 2002 Estimated Employment.

17
Meeting the Occupational Needs of the Health Care Industry
How are we doing? The United States has had an on-going critical shortage
of skilled nurses. Much of the work is difficult and the
profession requires several years of training in return for
high pay. The demand for health care workers is
projected to exceed the supply as the population ages.
The health care sector represents an enormous
opportunity for education and training professionals to
prepare individuals for a career. The challenge in New
Mexico is that many health care support occupations do
not pay an adequate wage compared to other states.
There is a huge chasm between the education and
training requirements of professional and support workers,
making career ladders very challenging and somewhat
unattainable.
Why is this important and who is it important to? Understanding the demand for health care is important,
considering the divide between professionals and
support workers. While support jobs provide ample entry-
level opportunities, career advancement is limited
without proper education and training. Health care
providers should consider this when attracting and
retaining health care workers in rural New Mexico.
Occupation Employment Annual Wage Professionals:
Family and general practitioners 1,370 $155,900
Registered nurses 11,680 $58,850
Licensed practical and licensed vocational nurses 4,880 $41,420
Pharmacy technicians 1,580 $28,410
Medical and clinical laboratory technologists 760 $48,610
Support:
Nursing aides, orderlies, and attendants 6,220 $21,470
Medical assistants 3,120 $25,250
Dental assistants 1,770 $30,300
Veterinary assistants and laboratory animal caretakers 530 $21,060
Medical transcriptions 280 $28,120
Source: NM Department of Workforce Solutions. Economic Research & Analysis Bureau, Estimates Delivery System, 2006. Bureau of Labor Statistics, 2006. http://www.bls.gov/oes/current/oes_nm.htm#b00-0000.

18
Residential Development Softens
How are we doing? The number of housing permits across the state increased
steadily from 2000 through 2004 before leveling off in
2005 and then declining by more than 2,000 in 2006. The
issuance of permits in the Albuquerque area appears to
have peaked in 2002-2003, followed by declines each
year since 2004. Fourth quarter data are expected to
show a further decline in 2007.
Why is this important and who is it important to? In addition to having an impact on construction
employment and wages, it is also important to
understand the implications for future development. To
maintain this growth, the retention and recruitment of
new businesses and employees should focus on bringing
an appropriate mix of industry, occupations, and skills.
Attracting new employers offering higher-paying jobs will
help compensate for the recent losses of high-wage jobs
in mining and manufacturing. State, county, and local
officials use this information to estimate tax revenues.
Residential Building Permits Issued
0 2,000 4,000 6,000 8,000 10,000 12,000 14,000 16,000 18,000
2006
2005
2004
2003
2002
2001
2000
Albuquerque New Mexico
Source: University of New Mexico, BBER, 2006.

19
Value of Residential Permits
How are we doing? The value of housing construction across the state has
increased steadily from 2000 through 2005. Data for 2005
show that we hit new records in new residential
construction values both statewide and in Albuquerque.
In 2006, statewide construction values declined by
roughly $200,000,000. Indications are 2007 values will
continue to be lower when the fourth quarter permit
data are compiled.
Why is this important and who is it important to? The direct impact of the real estate and construction
industry fundamentally consists of construction and real
estate-related transactions. The indirect impact of the
construction and real estate industry is the tax revenue
generated by the real property produced. State,
county, and local officials use this information to estimate
tax revenues.
Value of Residential Permits
$0 $500 $1,000 $1,500 $2,000 $2,500 $3,000
2006
2005
2004
2003
2002
2001
2000
(millions)
Albuquerque New Mexico
Source: University of New Mexico, BBER, 2006.

20
Unemployment Rates, 1993-2007
0
1
2
3
4
5
6
7
8
1993 1994 1995 1996 1997 1998 1999 2000 2001 2002 2003 2004 2005 2006 2007
Perc
ent (
%)
United States New Mexico
Current Workforce Supply
Information on population, personal income, employment, wages, poverty, industry and occupational forecasts, Labor Surplus Areas and educational data. A Metropolitan Statistical Area (MSA), as designated by the federal Office of Management and Budget, refers to a large population nucleus, together with adjacent communities having a high degree of economic and social integration with that nucleus.
New Mexico’s Unemployment Rate Falls Below the National RateHow are we doing? Unemployment rates in New Mexico have continued to
decrease since 2003 and currently are well below
national rates. The state’s unemployment rate fell to a
historic 3.1 percent in October 2007, which was the
lowest rate since the current series of unemployment
statistics began in 1976. New Mexico’s relatively low
unemployment rate indicates a tight labor market with a
potential for workforce supply shortages.
Why is this important and who is it important to? Relatively low unemployment rates (3.6 percent)
compared to the national average (4.6 percent) reveal
an imbalance between the demand and supply of
workers. The low rates are good for job seekers and
employees because of the availability of jobs and
increases in wages associated with a tighter labor
market. However, during these periods, employers have
difficulty recruiting and retaining employees and are
limited in investing and expanding their businesses. The
business community is very interested in low
unemployment figures. Lower unemployment means
companies will experience greater competition for
workers.
Source: NMDWS, Economic Research and Analysis Bureau, http://www.dws.state.nm.us/dws-lmi.html. Bureau of Labor Statistics, Labor Force Statistics. Rates not seasonally adjusted. Revised 03/08.

21
Unemployment Rates Vary by Region
How are we doing? Historically, unemployment in the Central WIA region has
been lower than other regions within the state. Major
reasons for the lower rate are the diversity of the region’s
employer base, the scale of employment opportunities,
and the relative clustering of workers and employers
characteristic of high-density, urban centers. The Eastern
WIA area dipped below the Central WIA area in 2005
and has remained slightly below to the present.
Why is this important and who is it important to? While the economy in the Central and Eastern Regions
have been strong, many residents within the state have
not shared in the prosperity. Improving basic worker skills,
encouraging new and existing business, and eliminating
barriers to employment (e.g., transportation, child care,
etc.) in all areas of the state are issues that can be
addressed to bring equality to all regions. Economic
Developers are very interested in the available
workforce. Greater competition for workers in the rural
areas of New Mexico is attributed to high-paying jobs in
the northwest and the southeast part of the state, as well
as more opportunities in the urban areas.
Unemployment Rates WIA Regions, 1993-2007
0
2
4
6
8
10
12
1993 1994 1995 1996 1997 1998 1999 2000 2001 2002 2003 2004 2005 2006 2007
Une
mpl
oym
ent R
ate
(%)
New Mexico Northern Central Eastern Southwestern
Source: NMDWS, Economic Research and Analysis Bureau, http://www.dws.state.nm.us/dws-lmi.html. Civilian Labor Force, Employment, Unemployment, and Unemployment Rate < http://www.dws.state.nm.us/dws-data.html>. Rates not seasonally adjusted. Revised 03/08.

22
Understanding Population Size, Change, and Density
How are we doing? In 2007, the Census Bureau estimated New Mexico’s
population at 1.970 million. Most of New Mexico’s growth
is occurring in or near the larger cities. There are four
Metropolitan Statistical Areas (MSAs) in the state,
accounting for about 66 percent of the state’s total
population. The state is divided into four WIA regions:
Northern, Central, Southwestern, and Eastern.
Why is this important and who is it important to? In terms of attracting new business and skilled workers,
the relative size of New Mexico’s population, as well as
the rate of change in size and density, matters. New
Mexico is competing with large states with highly dense
urban centers. The implications of these data can be
seen when potential employers evaluate locations on
conditions of workforce availability, diversity, and
proximity. Grant writers and regional planners find this a
good source of demographic information.
Source: U.S. Census Bureau, Population Division. Table 2: Cumulative Estimates of Population Change for the United States, Regions, States and Puerto Rico and Region and State Rankings: April 1, 2000 to July 1, 2006 (NST-EST2006-02). Release Date: 12/22/2006.
Source: U.S. Census Bureau, Population Division. Table 2: Cumulative Estimates of Population Change for the United States, Regions, States and Puerto Rico and Region and State Rankings: April 1, 2000 to July 1, 2006 (NST-EST2006-02). Release Date: 12/22/2006.
1,819 1,970
5,131 6,3394,301 4,862
3,451 3,617
20,85223,904
2,233 2,645
0
5,000
10,000
15,000
20,000
25,000
New Mexico Arizona Colorado Oklahoma Texas Utah
Total Population, 2000-2007 (Thousands)
2000 2007
8%
24%
13%
5%
15%
18%
0%
5%
10%
15%
20%
25%
New Mexico Arizona Colorado Oklahoma Texas Utah
Population Change, 2000-2007
23
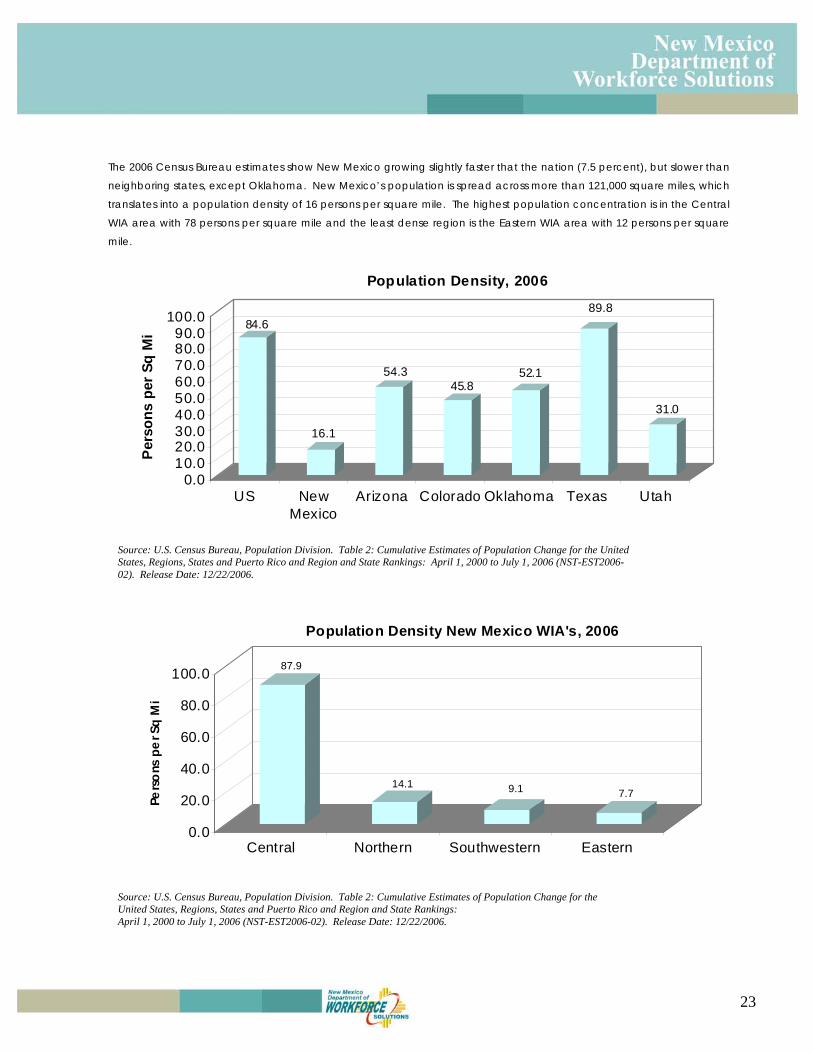
The 2006 Census Bureau estimates show New Mexico growing slightly faster that the nation (7.5 percent), but slower than
neighboring states, except Oklahoma. New Mexico’s population is spread across more than 121,000 square miles, which
translates into a population density of 16 persons per square mile. The highest population concentration is in the Central
WIA area with 78 persons per square mile and the least dense region is the Eastern WIA area with 12 persons per square
mile.
84.6
16.1
54.345.8
52.1
89.8
31.0
0.010.020.030.040.050.060.070.080.090.0
100.0
Per
sons
per
Sq
Mi
US NewMexico
Arizona Colorado Oklahoma Texas Utah
Population Density, 2006
Source: U.S. Census Bureau, Population Division. Table 2: Cumulative Estimates of Population Change for the United States, Regions, States and Puerto Rico and Region and State Rankings: April 1, 2000 to July 1, 2006 (NST-EST2006-02). Release Date: 12/22/2006.
87.9
14.1 9.1 7.7
0.0
20.0
40.0
60.0
80.0
100.0
Perso
ns p
er S
q M
i
Central Northern Southwestern Eastern
Population Density New Mexico WIA's, 2006
Source: U.S. Census Bureau, Population Division. Table 2: Cumulative Estimates of Population Change for the United States, Regions, States and Puerto Rico and Region and State Rankings: April 1, 2000 to July 1, 2006 (NST-EST2006-02). Release Date: 12/22/2006.

24
Strong “Entry-Level” Age Demographics Compared to National Average
How are we doing? Like most of the western United States, New Mexico is a
younger state with a median age of 35.3 years.
Why is this important and who is it important to? New Mexico is well positioned for the future with a
competitive edge in rates of youth and entry-level
workers compared to national averages. At the same
time, New Mexico’s prime age workforce (age 25-44) is
currently below the national average and all neighboring
states. As the last of the Baby Boomers (those born from
1946 to 1964) move closer to retirement, young workers
will begin to enter the labor market. Organizations
providing services to youths will use this information to
demonstrate the need for proactive policies targeting
the new entrants.
0%
10%
20%
30%
40%
50%
60%
70%
80%
90%
100%
Perc
ent o
f Pop
ulat
ion
US New Mexico Arizona Colorado Texas Utah
Age Distibution of Population
Age under 18 Age 18-24 Age 25-44 Age 45-64 Age 65+
Source: U.S. Census Bureau, 2006 American Community Survey, S0101 Age and Sex. Revised 09/12/2007.

25
New Mexico Enjoys Broad Racial and Ethnic Diversity
How are we doing? Racial and ethnic diversity are fundamental aspects of
New Mexico’s social landscape. New Mexico has much
larger Hispanic and American Indian populations than
the national average. In fact, New Mexico continues to
have the largest concentration of Hispanics among the
states (44 percent) and the second largest concentration
of persons who identify only as American Indian or
Alaskan Native (9.8 percent).
Why is this important and who is it important to? Cultural diversity of the New Mexico workforce offers
many advantages in the new economy. Employers take
advantage of opportunities that are more global and
thus seek multilingual and culturally sensitive workers.
0
10
20
30
40
50
60
Perc
ent o
f Tot
al
US New Mexico Arizona Colorado Texas Utah
Racial and Ethnic Diversity
African American American Indian Hispanic Origin
Source: U.S. Census Bureau, Population Division. Table 4: Estimates of the Population by Race and Hispanic or atino Origin for the United States and States: July 1, 2006 (SC-EST2006-04). Release date: 05/17/2007.

26
Median Family Income Varies Among Regional Cities
How are we doing? New Mexico falls somewhat below the national average,
while Albuquerque is second among eight regional cities.
Why is this important and who is it important to? Median family income is the amount that divides the
income distribution into two equal groups, half having
incomes above the median and half having incomes
below the median. Successful economies create
opportunities for all families to increase their incomes and
standard of living. Median family income underscores the
importance of attracting and retaining high quality jobs
in the state. Policy-makers benefit from this information
as it provides a snapshot of income relative to other
areas.
48,199
55,295
48,546
64,231
50,167
36,268
48,465
54,538
44,217
0
10,000
20,000
30,000
40,000
50,000
60,000
70,000
Dol
lars
New M
exico
Albuquerq
ue
Amarillo
Co. Spri
ngs
Denver
El Pas
o
Lubbo
ck
Phoenix
Tucson
Median Family Income 2006: Regional Cities
Source: U.S. Census Bureau, 2006 American Community Survey, S1903. Median Income in the Past 12 Months (In 2006 Inflation-Adjusted Dollars).

27
High Poverty Rates Signal Underlying Trouble
How are we doing? New Mexico’s poverty rate is one of the highest in the
nation and significantly higher than the neighboring
states.
Why is this important and who is it important to? A high rate of people living in poverty ultimately impacts
many other indicators such as education, employment,
income, etc. To successfully recruit new business and
foster business expansion, policy-makers must address the
issues of poverty and breaking the cycle of poverty for
future generations.
13.3
18.5
14.2
12
17 16.9
10.6
0
2
4
6
8
10
12
14
16
18
20
Perc
ent (
%)
US New Mexico Arizona Colorado Oklahoma Texas Utah
State Estimates for Individuals of All Ages in Poverty, 2006
Source: U.S. Census Bureau, 2006 American Community Survey, S1701. Poverty Status in the Past 12 Months.

28
More New Mexico Households Are Led by Single Females with Children Under 18
How are we doing? According to the U.S. Census Bureau, the number of
households headed by single females with children under
the age of 18 is significantly higher in New Mexico than
the majority of neighboring states and the nation.
Why is this important and who is it important to? Of all households in New Mexico, over 8 percent are led
by a female with no spouse present and with children
under the age of 18. This provides both challenges and
opportunities for policy makers as they seek to fill critical
skills shortages, provide accessible childcare options, and
minimize the number of children living in poverty.
7.4
8.1
7.2
6.4
7.6
8.5
5.7
0
1
2
3
4
5
6
7
8
9
Perc
ent (
%)
US NewMexico
Arizona Colorado Oklahoma Texas Utah
Female Householders, With No Husband Present
Source: U.S. Census Bureau, 2006 American Community Survey, S1101. Households and Families.

29
Households Receiving Public Assistance Higher in New Mexico
How are we doing? About 2 percent of New Mexico households were
receiving cash public assistance in 2006, a rate lower
than the national average but second highest among
the surrounding states.
Why is this important and who is it important to? Like poverty rates and other indicators of economic well-
being, the high level of public assistance in New Mexico
serves as witness to potential underlying troubles in the
economy. Typically, those receiving public assistance
have encountered problems that prevent them from
achieving independence within society and require
support services such as training, childcare, and
transportation subsidies. Organizations that provide
these services face tremendous challenges to meet the
needs with available resources within the state.
2.42.2
1.91.7
3.7
1.5
2
0
0.5
1
1.5
2
2.5
3
3.5
4
Perc
ent (
%)
US NewMexico
Arizona Colorado Oklahoma Texas Utah
Percent of Households Receiving Cash Public Assistance
Source: U.S. Census Bureau, 2006 American Community Survey, Selected Economic Characteristics, 2006.

30
Labor Supply and the Demand for High School Graduates
How are we doing? Albuquerque ranks 5th out of 8th regional cities in the
percentage of the population age 25 and over that
have graduated from high school. That percentage
continues to be well below the national average of
30.2 percent. The statewide average is two and one-
half percentage points below the national average.
Why is this important and who is it important to? Many entry-level jobs require basic education and
training levels characteristic of those learned in high
school. Education providers look at this data and
develop strategies to improve the state’s position.
30.2
27.7
23.1
28.2
21.423 22.7
26 26 26.7
0
5
10
15
20
25
30
35
Perc
ent (
%)
US
New M
exico
Albuquerq
ue
Amarillo
Co. Spri
ngs
Denve
r
El Pas
o
Lubbo
ck
Phoenix
Tucso
n
High School Graduates Age 25 & Above, Regional Cities, 2006
Source: U.S. Census Bureau, 2006 American Community Survey, S1501. Educational Attainment.

31
Demand for Bachelor’s Degrees
How are we doing? The New Economy Index ranks New Mexico 26th
among all states for workforce education, which is a
weighted measure of the educational attainment of
the workforce. New Mexico had the greatest rank
increase, from 47th in 2002, among all the states.
However, as this chart shows, only 14.4 percent of
residents age 25 and above possess a bachelor’s
degree statewide. In a comparison of regional cities,
Albuquerque ranks fourth out of the eight cities
reviewed.
Why is this important and who is it important to? This is critically important and appears to be a potential
weakness for New Mexico. The state has an average
lower than the nation, which implies potential shortage
of qualified workers. Albuquerque, however, has a
significantly higher penetration of bachelor’s-degreed
residents. Employers are likely to locate “knowledge
jobs” where they believe there are “knowledgeable
people”.
17.1
14.4
17.8
13
22.721.2
13.3
20.5
15.8 15.6
0
5
10
15
20
25
Perc
ent (
%)
US
New M
exico
Albuque
rque
Amarillo
Co. Spri
ngs
Denve
r
El Paso
Lubbo
ck
Phoen
ix
Tucso
n
Bachelor's Degrees Age 25 & Above, Regional Cities, 2006
Source: U.S. Census Bureau, 2006 American Community Survey, S1501. Educational Attainment.

32
National Labs and Technology Centers Boost Graduate and Professional Degrees
How are we doing? In contrast to the previous chart showing a relatively low
percentage of residents with bachelor’s degrees in the
state, here we see that New Mexico actually has a
slightly higher penetration of graduate or professional
degrees than the nation. Contributing to this fact are the
national laboratories and advanced technology firms
throughout the state. Albuquerque has the second
highest percentage of residents with graduate or
professional degrees among the eight regional cities.
Why is this important and who is it important to? This is critically important and appears to be a significant
strength for New Mexico and Albuquerque. A greater-
than-average percentage of residents with graduate or
professional degrees provide a competitive advantage
over other areas in the region. High-tech firms look for a
good supply of well-educated recruits.
9.910.9
14.7
5.3
12.8
15.1
6.6
10.2
8.7
9.9
0
2
4
6
8
10
12
14
16
Perc
ent (
%)
US
New Mex
ico
Albuquerq
ue
Amarillo
Co. Spri
ngs
Denver
El Pas
o
Lubb
ock
Phoenix
Tucso
n
% Graduate or Professional Degrees, Regional Cities, 2006
Source: U.S. Census Bureau, 2006 American Community Survey, S1501. Educational Attainment.

33
Racial and Ethnic Inequality in Educational Attainment
How are we doing? Of all bachelor’s degrees held by the state’s
population age 25 and over, 71 percent are held by
non-Hispanic whites compared to 21 percent held by
Hispanics and just under 4 percent held by Native
Americans. At the other end of the scale, Hispanics
account for about 76 percent of those who have less
than a 9th grade education.
Why is this important and who is it important to? While the state’s employers demand educated workers
and can find workers to fill their positions, many of New
Mexico’s people lack the educational credentials for
high-wage, high-skill jobs. Workforce development
professionals armed with this information should work
with education providers in an effort to even out the
disparity in education attainment.
Source: U.S. Census Bureau, 2006 American Community Survey, B15002H. B15002I. B15002C. B15002B. B15002D. Sex by Educational Attainment for the Population 25 Years and Over.
Highest Education Attainment level by Race in New Mexico
0%
10%
20%
30%
40%50%
60%
70%
80%
90%
Pop
ulatio
n 25 Yea
rs an
d Ove
r
Less t
han 9th G
rade
9th to
12th G
rade;
No Dipl
oma
High S
chool
Graduate
Some C
ollege
; No D
egree
Ass
ociat
e's D
egree
Bach
elor's
Degre
e
Gradu
ate or Profess
ional
Degree
White (not Hispanic) Hispanic or Latino Native American Black or African American Asian

34
Government Workers as a Percent of Total Workforce
How are we doing? New Mexico is considerably above the national average
in the percentage of government workers in the
workforce. Among regional cities, Albuquerque is high in
the percentage of government workers. Some factors
that may explain part of this difference are the presence
of national laboratories, numerous Indian tribal
governments, and an extensive higher education
workforce.
Why is it important and who is it important to? Nationally, over the past two decades, employment in
the government sector has grown more slowly than
employment in the private sector. The enticement of
private sector wages, benefits, and flexibility is a potential
lure for job seekers. Career counselors find this
information useful when counseling new entrants to the
labor force, and those seeking career changes.
14.4
21.6
18.9
14.3
11.9
21.1 20.5
9.4
17.8
0
5
10
15
20
25
Perc
ent (
%)
US
New M
exico
Albuque
rque
Co. Spri
ngs
Denve
r
El Pas
o
Lubb
ock
Phoenix
Tucso
n
Percent Workforce Government Workers, 2006
Source: U.S. Census Bureau, 2006 American Community Survey, S2406. Occupation by Class of Worker for the Civilian Employed Population 16 Years and Over.

35
Demographic Composition of Schools
0
10
20
30
40
50
60
70
80
90
100
United St
ates
New Mexic
o
Arizona
Colorado
Oklahoma
Texa
s Uta
h
Perc
ent (
%)
White Black Hispanic Asian NativeAmerican
Future Workforce Supply Information on student enrollment, graduation rates, and domestic migration.
A Metropolitan Statistical Area (MSA), as designated by the federal Office of Management and Budget, refers to a
large population nucleus, together with adjacent communities having a high degree of economic and social
integration with that nucleus.
Diverse Student Enrollment
How are we doing? New Mexico is a minority-majority state with the largest
percentage of Hispanic students in the nation, reflecting
the diversity of the overall population.
Why is this important and who is it important to? As we look at the other education indicators, it is
important to keep diversity in mind as not all student
groups graduate at the same rate. Education providers
find this data useful when developing training programs
and policies targeting the student population.
Source: National Center for Education Statistics.

36
High School Graduation Rates
How are we doing? The graduation rate is computed and published for the
young adult population in the years beyond high
school—that is, the 18 through 24-year-old population.
At the state level, three-year rolling averages are
computed to yield more stable estimates for graduation
rates. The high school graduation rate is calculated
based on responses to a basic item in the Current
Population Survey regarding the highest level of
educational attainment achieved by a person. While
the graduation rate for New Mexico is about 3 percent
lower than the national average, it exceeds that of
Arizona and Texas.
Why is this important and who is it important to? The education of the workforce is a key ingredient in the
decision-making process for economic planners
considering relocating or expanding businesses.
Graduation from high school is seen as a minimum
standard that is necessary for further education and
training. Education providers look at this data and
develop strategies to improve the state’s position.
Source: National Center for Education Statistics.
High School Graduation Rates
70
72
74
76
78
80
82
84
86
88
1989–91 1990–92 1991–93 1992–94 1993–95 1994–96 1995–97 1996–98 1997–99 1998–00
All States Arizona New Mexico Texas

37
Graduation Rates Vary Among Students
How are we doing? The high school graduation rates for 2001 show that New
Mexico’s minority students lag behind those of white
students. Graduation rates need to be equalized for
minority students to ensure that the state has a trainable,
well-educated workforce in the future.
Why is this important and who is it important to? New Mexico is behind the national average in
graduation rates from high school. While many New
Mexico students complete an equivalency diploma,
their chances for continued education are more limited
than for students who graduate from high school. The
low graduation rate for Hispanic students is especially
troubling because Hispanic students make up about half
of the state’s student population. Workforce develop-
ment professionals, along with education providers, use
this data to determine how to even out the disparity in
education attainment.
74.4 73.9 73.268.5
75.881.8
-6
4
14
24
34
44
54
64
74
84
Per
cent
(%)
Total NativeAmerican
Asian Hispanic Black White
Graduation Rate by Race/Ethnicity 2001
Source: National Center for Education Statistics.

38
Domestic Migration of Young, Single & College-Educated People
How are we doing? New Mexico shows a net out-migration, meaning that
more college-educated, single, young people left the
state than entered. We are losing our young people
after they get their degrees and instead gaining
individuals at the lowest educational levels who are
moving into the state.
Why is this important and who is it important to? Defying the general population trend of outward
migration, young, single, college-educated people are
moving to the larger metropolitan areas. Younger
college-educated people are highly mobile and more
likely to move. The state is presented with challenges for
keeping our graduates who are looking for suitable
employment and quality of life. Policy-makers will use
this data to develop strategies to keep the brightest
members of our workforce in New Mexico.
-17.8
74.3
43.8
5.48.1
13.1
-20
-10
0
10
20
30
40
50
60
70
80
Net
Mig
ratio
n (%
)
New Mexico Arizona Colorado Oklahoma Texas Utah
Domestic Migration of Young, Single and College Educated People
Source: U.S. Census Bureau, Census 2000.

39
WorkInNewMexico.gov A Guide to Career Clusters in New Mexico
A career cluster is a grouping of occupations and broad industries based on commonalities. By exploring careers
within a cluster, job seekers and students can quickly and easily compare occupations that match their individual
interests, skills, and education requirements.
New Mexico Career Clusters Guidebook
Career Planning Tool The New Mexico Career Clusters Guidebook identifies
seven strategic marketing sectors or “clusters” as the
foundation for the state’s future economy. The high-
growth industries within these targeted sectors will
create job opportunities requiring skilled workers with the
appropriate levels of education and training. The
guidebook assists in career planning and exploration by
providing industry and occupational information and
detailing the career pathways available in each career
cluster.
Another valuable planning and exploration tool is the list
of sixteen career clusters defined by the U.S.
Department of Education. These career clusters were
developed to foster the adoption of career pathways
strategies nationwide and are therefore structured
differently than the seven career clusters that highlight
areas in which New Mexico has special value or
competitive advantage. Job seekers and students can
use the two complementary sources to explore career
clusters from both the U.S. and statewide perspectives.
Source: www.WorkInNewMexico.gov
7 Marketing Sectors The following is a list of the New Mexico Career Clusters
Guidebook seven strategic marketing sectors next to
the sixteen career clusters defined by the U.S.
Department of Education.
Arts & Entertainment
Business Services
Communications & Information
Energy & Environmental Technologies
Engineering, Construction & Manufacturing
Health & Biosciences
Hospitality & Tourism
These industries are part of 7 new Career Clusters that define the economy we want to build for New Mexico.
Department of Education Career Clusters Agriculture, Food & Natural Resources
Architecture & Construction
Arts, A/V Technology & Communications
Business, Management & Administration
Education & Training
Finance
Government & Public Administration
Health Science
Hospitality & Tourism
Human Services
Information Technology
Law, Public Safety & Security
Manufacturing
Marketing, Sales & Service
Science, Technology, Engineering &
Mathematics
Transportation, Distribution & Logistics
These industries are part of 16 Career Clusters defined by the U.S. Department of Education.

40
27.328.4
35.4
2830.2
41.2
21.7
29.227.9
34.8
0
5
10
15
20
25
30
35
40
45
Perc
ent (
%)
US
New Mexic
o
Albuquerque
Amarillo
Co. Sprin
gs
Denver
El Paso
Lubbock
Phoenix
Tucso
n
% Living Alone, 2006
Quality of Life Many people are enchanted with New Mexico’s quality of life.
Quality of Life is an important measure of the ability of the state, or an area, to attract and retain its workforce. Equally
important is to provide the services necessary to support a growing retirement population.
Albuquerque, NM: An Attractive Locale for Singles and Families
How are we doing? New Mexico has more households led by singles than
the national average. However, nearly 66 percent of
households in the state are considered family
households. As compared to eight regional cities,
Albuquerque, at over 35 percent, is second to Denver
for singles living alone.
Why is it important and who is it important to? Areas of New Mexico heavily reliant on hospitality and
service industries are more likely to attract a younger,
single, mobile workforce. Policy makers should also
consider family-friendly alternatives to meet the needs
of New Mexico workers including business diversity,
flexible hours, flexible working arrangements, childcare,
education and job training opportunities, better
healthcare benefits, and convenient public
transportation.
Source: U.S. Census Bureau, 2006 American Community Survey, S2501. Occupancy Characteristics.

41
Higher Median Home Values Take Greater Share of Income
How are we doing? New Mexico housing values are considerably below the
national average, but Albuquerque is closer to the
national average and ranks fifth among regional cities.
Median prices do not take into account quality
differences that may exist.
Why is it important and who is it important to? Expanding home ownership is good for the housing
market and therefore good for the economy. Policy
makers should also consider the impact of median
home value as we compete for new jobs, new
industries, and a representative workforce reflecting the
diversity of New Mexico.
$185,200
$141,200
$172,300
$94,900
$204,900
$236,100
$92,600 $102,700
$244,200
$175,500
$0
$25,000
$50,000
$75,000
$100,000
$125,000
$150,000
$175,000
$200,000
$225,000
$250,000
$275,000
US
New Mexic
o
Albuquerque
Amarillo
Co. Sprin
gs
Denver
El Pa
so
Lubboc
k
Phoenix
Tucs
on
Median Home Value, Regional Cit ies, 2006
Source: U.S. Census Bureau, 2006 American Community Survey, R2510. Median Housing Value of Owner-Occupied Housing Units (Dollars): 2006 Universe: Owner-occupied housing units.

42
Housing Costs Take Large Share of Household Income
How are we doing? Nearly one-fourth of owned households in New Mexico
have owner costs that exceed 30 percent of household
income. This is below the national average, and
Albuquerque is sixth among regional cities.
Why is it important and who is it important to? According to the U.S. Department of Housing and Urban
Development, a home is considered affordable if not
more than 30 percent of household income is spent on
housing costs. Job Seekers will look at this data when
making decisions on where to locate.
30.3
23.727.5
22
27.8
38.1
28.3
21
35.231
0
5
10
15
20
25
30
35
40
Perc
ent (
%)
US
New M
exico
Albuqu
erque
Amarillo
Co. Spri
ngs
Denve
r
El Pas
o
Lubb
ock
Phoen
ix
Tucs
on
Selected Monthly Owner Costs Greater Than 30% Household Income
Source: U. S. Census Bureau, 2006 American Community Survey, B25091. Mortgage Status by Selected Monthly Owner Costs as a Percentage of Household Income in the Past 12 Months.

43
Telecommunication Access an Urban/Rural Issue
How are we doing? New Mexico is significantly higher than both the national
and regional averages in homes without landline
telephones. Wireless technology is partially responsible
for this.
Why is it important and who is it important to? If the Internet becomes an indispensable tool in
everyday life, all citizens, regardless of geography,
social, or economic status, need access to public
information. Policy makers should examine ways to
guarantee communities equality of access to local
telephone service at reasonable rates to avoid social
exclusion and reduce the gap between information
haves and have-nots. (It should be noted that the
number of households that prefer to use wireless
communications is on the rise and the Census survey
does not report this growing trend). Grant writers use
this information when seeking funding based on needs
within communities.
4.3
8.3
6.4
5.4
7.17.4
3.8
0
1
2
3
4
5
6
7
8
9
Per
cent
(%)
US
New M
exico
Arizon
a
Colorad
o
Oklaho
maTex
asUtah
% Homes Without Telephone Service, 2006
Source: U.S. Census Bureau, 2006 American Community Survey, Selected Housing Characteristics, 2006.

44
35.7
7.0
22.920.2
23.4
35.2
11.0
0.0
5.0
10.0
15.0
20.0
25.0
30.0
35.0
40.0
Num
ber o
f Uni
ts P
er S
quar
e M
ile
US
New M
exico
Arizon
a
Colorad
o
Oklaho
maTex
asUtah
Housing Units per Square Mile, 2006
Housing Density as an Indicator of Quality of Life
How are we doing? Among regional states, New Mexico, with seven housing
units per square mile, is far below the regional average
housing density of 20 units per square mile.
Why is it important and who is it important to? Higher density housing development requires less land
and provides economies of scale for infrastructure and
transportation. Using public transportation, workers can
move easily between workplace and home.
Conversely, lower density development, often referred
to as “urban sprawl,” uses more land and requires a
transportation network to support longer commuting
requirements. In addition, higher infrastructure costs for
water, sewer, roads, and lighting systems must be
considered. Is sufficient land available at a low enough
price to ensure that the land and housing markets are
competitive and affordable? While New Mexico is the
fifth largest state, less than 45 percent of the land is
privately owned and available for development. Job
seekers use demographic data to compare New
Mexico to other potential work locations.
Source: U.S. Census Bureau, 2006 Estimates, Table 3: Estimates of Housing Unit Change for the United States and States, and State Rankings: July 1, 2005 to July 1, 2006 (HU-EST2006-03). Release date: 08/15/2007.

45
Conclusions In the near-term, New Mexico’s economic outlook fairly
mirrors the national picture in several key industry
sectors. The Construction sector is impacted by the
current credit crunch, as expected growth from
residential construction will likely continue to be sluggish.
Relatively strong non-residential construction in New
Mexico is preventing a more severe decline in this
sector.
Recent layoffs in Manufacturing have heightened
concern over the employment situation statewide.
Among those affected, Intel, Tempur Pedic, Advent
Solar and Millennium Transit have recently announced
workforce reductions in New Mexico. However, New
Mexico is fortunate to have a number of firms adding
high-wage manufacturing jobs at a significant rate.
Eclipse Aviation, in Albuquerque, Raytheon Corp. in San
Juan County, L.E.S. in Lea County, and Schott AG in
Albuquerque have announced openings or expansions.
Rising oil prices, coupled with federal incentive
packages, have created a boom for the state’s
Extraction industry. In areas of the state with oil and gas
resources, worker shortages are common. Competition
for skilled employees among employers is ongoing.
Information, one of the state’s leading growth industry
sectors, continues to add jobs, most significantly in
motion pictures. New openings and expansions at
Albuquerque Studios, Sony Pictures Imageworks, and
Lions Gate Studios are expected to bring hundreds of
jobs to the area. Telecommunications is growing in New
Mexico as well, with Verizon, Comcast, and Nexum
Technologies adding people every year for the past
several years.
The outlook for the Healthcare and Social Assistance
sector is encouraging with employment coming from
expansions to existing facilities, as well as construction of
new ones throughout the state. The aging population
may help fuel the continued growth of this sector.
Professional & Business Services, Education, and
Government are expected to be a good source of
employment growth in the near-term. Transportation & Warehousing, and Utilities likewise, will continue to keep
the New Mexico economy growing through added
employment. Trades, Accommodations & Food Services, and Arts, Entertainment & Recreation sectors
are all expected to show positive growth, albeit at a
somewhat slower pace.
Overall, the state is in a period of moderate
employment growth, while the unemployment rate
remains at near-record lows. The quality of the labor
force generally meets the requirements of the state’s
occupational needs. According to the U.S. Census
Bureau, in 2006, 25.3 percent of the population in New
Mexico, 25 years and over has at least a bachelor’s
degree. Statewide, the total number of jobs requiring a
minimum of a bachelor’s degree was 165,900 or 20.2
percent in 2004. While it appears the population with
these degrees is sufficient to meet the state’s needs,
rural parts of the state continue to lose degreed
individuals to the urban areas.