Maryland Adult Education Technology Standards - Department of

STATE OF MARYLANDHEALTHCHOICE ADULT AND CHILD POPULATIONS
CAHPS® 20094.0H Adult and Child Medicaid Survey Results
Executive Summary
Date: October 2009
Job Number: 09-502
2191 Defense Highway, Suite 401
Crofton, MD 21114
Phone: 410.721.0500
Fax: 410.721.7571
www.WBandA.com

2
2009 State of Maryland
Adult and Child Medicaid Populations
Executive SummaryBackground and Purpose
Beginning in 2008, the State of Maryland Department of Health and Mental Hygiene (DHMH) selected WB&A Market Research
(WB&A), a National Committee for Quality Assurance (NCQA) certified survey vendor, to conduct its Consumer Assessment of
Healthcare Providers and Services (CAHPS®1) 4.0H Adult Medicaid Survey and 4.0H Child Medicaid Survey (with Children with
Chronic Conditions (CCC) Measurement Set)2.
Members from each of the seven managed care organizations (MCOs) that provide Medicaid services in the HealthChoice
program participated in this research:
AMERIGROUP Community Care,
Diamond Plan,
Jai Medical Systems,
Maryland Physicians Care,
MedStar Family Choice,
Priority Partners, and
UnitedHealthcare.
The CAHPS® 4.0H Adult and Child Medicaid Surveys measure those aspects of care for which members are the best and/or the only
source of information. From these surveys, members’ ratings of and experiences with the medical care they receive can be
determined. Then based on members’ health care experiences, potential opportunities for improvement can be identified.
Specifically, the results obtained from these consumer surveys will allow DHMH to determine how well participating managed
care organizations are meeting their members’ expectations, provide feedback to the MCOs to improve quality of care,
encourage MCO accountability, and develop MCO action to improve members’ quality of care.
Results from the CAHPS® 4.0H Adult and Child Medicaid Surveys summarize member satisfaction through ratings,
composites and question Summary Rates. In general, Summary Rates represent the percentage of respondents who chose
the most positive response categories as specified by NCQA.
1CAHPS® is a registered trademark of the Agency for Healthcare Research and Quality (AHRQ).2A child with a chronic condition, included in the survey, refers to a child who currently experiences a consequence associated with a condition. The consequence results from a
medical/behavioral/health condition, and the duration of the condition is expected to be at least twelve (12) months.

3
2009 State of Maryland
Adult and Child Medicaid Populations
Executive SummaryBackground and Purpose (continued)
In 2009, there were survey changes made by NCQA to the CAHPS® 4.0H Adult Medicaid Survey and to the 4.0H Child Medicaid
Survey (with CCC Measurement Set) but no changes made by DHMH.
NCQA revised question 11 in the CAHPS® 4.0H Adult Medicaid Survey. NCQA added the words “you thought” as shown
below:
“In the last six months, when there was more than one choice for your treatment or health care, did a doctor or other
health provider ask you which choice you thought was best for you?”
In 2009, NCQA adopted the 4.0H version of the CAHPS® Child Medicaid Satisfaction Survey. Revisions include changes to
the number, order and wording of survey questions, as well as changes to the composite measures.
Revised Rating of Personal Doctor question.
Revised Getting Needed Care composite; omitted questions and significantly altered the remaining two questions and
response choices.
Revised Getting Care Quickly composite; omitted two questions.
Revised How Well Doctors Communicate composite.
Omitted Courteous and Helpful Office Staff composite.
Revised Customer Service composite; omitted questions, added one question and significantly altered an existing
question and its response choices.
Added one new composite (Shared Decision-Making) and two questions on new content areas (Health Promotion and
Education, Coordination of Care), which will be treated as first-year measures.
The number of “complete and valid” surveys was revised. The requirement that Q1 and at least 80% of the core survey
questions be answered was omitted.

4
2009 State of Maryland
Adult and Child Medicaid Populations
Executive SummaryResearch Approach
WB&A administered a mixed-methodology which, involved mail with telephone follow-up.
Specifically, two questionnaire packages and follow-up postcards were sent to samples of eligible adult and child members from each
of the seven MCOs with “Return Service Requested” and WB&A’s toll-free number included. The mail materials also included a toll-
free number for Spanish-speaking members to complete the survey over the telephone. Those who did not respond by mail were
contacted by telephone to complete the survey. During the telephone follow-up, members had the option to complete the survey in
either English or Spanish.
The child surveys were conducted by proxy, that is, with the parent/guardian who knows the most about the sampled child’s
health care.
The required sample size is 1,350 for adult Medicaid plans and 1,650 for child Medicaid plans (General Population/Sample A). In
addition to the required sample size, DHMH chose to over-sample their adult and child Medicaid populations by 30%.
To qualify, adult Medicaid members had to be 18 years of age or older, while child Medicaid members had to be 17 years of age
or younger. Furthermore, members of both populations had to be continuously enrolled in the MCO for five of the last six months
as of the last day of the measurement year (December 31, 2008).
Among the child population, an additional over-sample of 1,840 members with diagnoses indicative of a probable chronic condition
was also pulled (CCC Over-sample/Sample B). This is standard procedure when the CAHPS® 4.0H Child Medicaid Survey (with CCC
Measurement Set) is administered, to ensure the validity of the information collected.
The CCC population is identified based on member’s responses to the CCC survey-based screening tool (questions 59 to 72),
which contains five questions representing five different health consequences; four are three-part questions and one is a two-part
question. A child member is identified as having a chronic condition if all parts of the question for at least one of the specific
health consequences are answered “Yes”.
It’s important to note that the General Population data set (Sample A) and CCC Over-sample data set (Sample B) are not
mutually exclusive groups. For example, if a child member is randomly selected for the CAHPS® Child Survey sample (General
Population/Sample A) and is identified as having a chronic condition based on responses to the CCC survey-based screening
tool, the member is included in both General and CCC Population results.

5
2009 State of Maryland
Adult and Child Medicaid Populations
Executive SummaryResearch Approach (continued)
Between February and May 2009, WB&A collected 3,746 valid surveys from the eligible Medicaid adult population and 4,830 valid surveys
from the eligible Medicaid child population (2,533 of the child members across all MCOs qualified as being children with chronic conditions
based on the parent’s/guardian’s responses to the CCC survey-based screening tool).
Ineligible adult and child members included those who were deceased, did not meet eligible population criteria, or had a language barrier. In
addition, adult members who were mentally or physically incapacitated were considered ineligible. Non-respondents included those who had
refused to participate, could not be reached due to a bad address or telephone number, or were unable to be contacted during the survey
time period.
Ineligible surveys are subtracted from the sample size when computing a response rate.
Table 1 below shows the total number of adult and child members in the sample that fell into each disposition category:
Disposition Group Disposition Category Adult
Child(General
Population/ Sample A)
Ineligible
Deceased (M20/T20) 15 4
Does not meet eligibility criteria (M21/T21) 186 141
Language barrier (M22/T22) 89 363
Mentally/Physically incapacitated (M24/T24) 57 N/A
Total Ineligible 347 508
Non-Response
Bad address/phone (M23/T23) 1,142 895
Refusal (M32/T32) 490 523
Maximum attempts made (M33/T33)* 6,227 6,295
Total Non-Response 7,859 7,713
*Maximum attempts made include two survey mailings and an average of six call attempts.
N/A=Not applicable to this population
Table 1: Sample Dispositions

6
2009 State of Maryland
Adult and Child Medicaid Populations
Executive SummaryResearch Approach (continued)
Tables 2 and 3 below illustrate the number of adult and child surveys mailed, the number of completed surveys (mail and phone) and the
response rate for each MCO.
MCO
Surveys Mailed
General Population
Mail and Phone
Completes
CCC
Respondents2
Response
RateTotal Child
General Population
(Sample A)
CCC
Over-sample
(Sample B)1
AMERIGROUP Community Care 3,542 2,145 1,397 732 398 38%
Diamond Plan 1,073 1,073 3 0 366 105 35%
Jai Medical Systems 1,253 1,253 3 0 356 121 29%
Maryland Physicians Care 3,047 2,145 902 861 461 41%
MedStar Family Choice 2,267 2,145 122 807 277 38%
Priority Partners 3,874 2,145 1,729 851 714 41%
UnitedHealthcare 3,131 2,145 986 857 457 42%
Total HealthChoice 18,187 13,051 5,136 4,830 2,533 39%
1In MCOs with fewer members than the required child sample size (1,840), the sample includes all members with a diagnosis indicative of a probable chronic condition who were not already selected for the General
Population sample.2As explained on page 4, it is important to note that the General Population data set (Sample A) and CCC Over-sample (Sample B) data set are not mutually exclusive groups.3Due to a small number of Diamond Plan and Jai Medical Systems members being eligible for the study, a smaller sampling frame was produced (rather than 2,145).
MCO Surveys Mailed
Mail and Phone
Completes Response Rate
AMERIGROUP Community Care 1,755 514 30%
Diamond Plan 1,422 1 389 28%
Jai Medical Systems 1,755 581 34%
Maryland Physicians Care 1,755 539 32%
MedStar Family Choice 1,755 547 32%
Priority Partners 1,755 595 35%
UnitedHealthcare 1,755 581 35%
Total HealthChoice 11,952 3,746 32%
1Due to a small number of Diamond Plan adult members being eligible for the study, a sampling frame of 1,422 was produced (rather than 1,755).
Table 2: Adult Survey
Table 3: Child Survey

7
2009 State of Maryland
Adult and Child Medicaid Populations
Executive SummaryProfile of Adult Members Surveyed
37%
40%
44%
17%
16%
15%
25%
24%
22%
22%
20%
19%
0% 20% 40% 60% 80% 100%
2007
2008
2009
18-34 35-44 45-54 55+
Gender (Q46)
Age (Q45)
32%
36%
34%
68%
64%
66%
0% 20% 40% 60% 80% 100%
2007
2008
2009
Male Female
54%
40%
4% 2% 6%
54%
5% 4% 6%
54%
3% 3% 6%
43%36%
0%
20%
40%
60%
80%
100%
Black/AA White/Caucasian Hispanic/Latino Asian Other
2009 2008 2007
Ethnicity/Race (Q48/Q49)*
Level of Education (Q47)
75%
76%
74%
21%
20%
23%
4%
3%
5%
0% 20% 40% 60% 80% 100%
2007
2008
2009
High school or less Some college College graduate or more
40%
39%
36%
28%
29%
30%
31%
31%
33%
0% 20% 40% 60% 80% 100%
2007
2008
2009
Fair/Poor Good Excellent/Very good
Health Status (Q36)
significant increase from previous year
significant decrease from previous year
*Multiple Responses Accepted
Average Age
39.1
40.0
41.0
Base = Those answering

8
2009 State of Maryland
Adult and Child Medicaid Populations
Executive Summary
4%
4%
17%
16%
18%
79%
80%
77%
4%
0% 20% 40% 60% 80% 100%
2007
2008
2009
Fair/Poor Good Excellent/Very good
33%
32%
33%
21%
21%
18%
23%
25%
25%
23%
22%
24%
0% 20% 40% 60% 80% 100%
2007
2008
2009
0-4 5-8 9-13 14-18
Child’s Gender (Q74)Child’s Age (Q73)
52%
51%
51%
48%
49%
49%
0% 20% 40% 60% 80% 100%
2007
2008
2009
Male Female
Child’s Ethnicity/Race* (Q75/76)Child’s Health Status (Q58)
Child Member Profile – General Population
*Multiple Responses Accepted
Base = Those answering
significant increase from previous year
significant decrease from previous year
Average Age
8.4
8.2
8.1
44% 44%
12%4%
12%13%5%
14%
40%
51%
10% 7% 10%
45%42%
0%
20%
40%
60%
80%
100%
Black/AA White Hispanic/Latino Asian Other
2009 2008 2007
Profile of Child Members Surveyed

9
2009 State of Maryland
Adult and Child Medicaid Populations
Executive Summary
13%
13%
32%
30%
32%
55%
58%
55%
12%
0% 20% 40% 60% 80% 100%
2007
2008
2009
Fair/Poor Good Excellent/Very good
20%
20%
19%
17%
18%
17%
29%
30%
30%
33%
33%
34%
0% 20% 40% 60% 80% 100%
2007
2008
2009
0-4 5-8 9-13 14-18
Child’s Gender (Q74)Child’s Age (Q73)
56%
57%
56%
44%
43%
44%
0% 20% 40% 60% 80% 100%
2007
2008
2009
Male Female
Child’s Ethnicity/Race* (Q75/76)Child’s Health Status (Q58)
Child Member Profile – CCC Population
*Multiple Responses Accepted
Base = Those answering
significant increase from previous year
significant decrease from previous year
Average Age
10.3
10.0
10.1
51%
8%2%
8%
45%
9%3%
11%
55%
40%
7% 5% 9%
43%49%
0%
20%
40%
60%
80%
100%
White Black/AA Hispanic/Latino Asian Other
2009 2008 2007
Profile of Child Members Surveyed (continued)
10
2009 State of Maryland
Adult and Child Medicaid Populations
Executive SummaryOverall Ratings
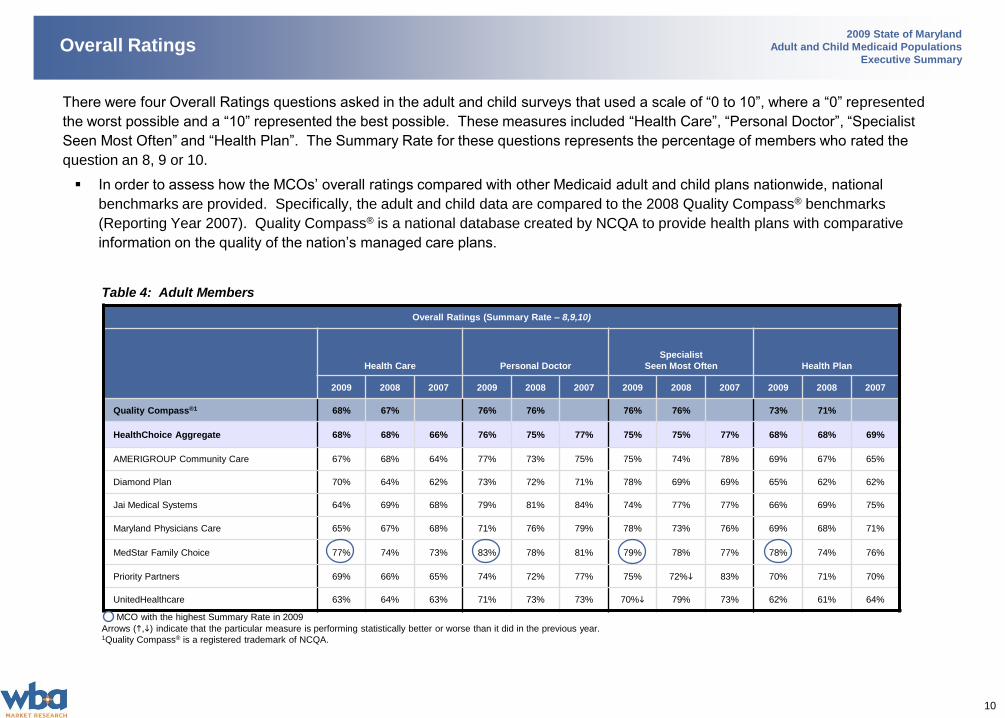
There were four Overall Ratings questions asked in the adult and child surveys that used a scale of “0 to 10”, where a “0” represented
the worst possible and a “10” represented the best possible. These measures included “Health Care”, “Personal Doctor”, “Specialist
Seen Most Often” and “Health Plan”. The Summary Rate for these questions represents the percentage of members who rated the
question an 8, 9 or 10.
In order to assess how the MCOs’ overall ratings compared with other Medicaid adult and child plans nationwide, national
benchmarks are provided. Specifically, the adult and child data are compared to the 2008 Quality Compass® benchmarks
(Reporting Year 2007). Quality Compass® is a national database created by NCQA to provide health plans with comparative
information on the quality of the nation’s managed care plans.
Overall Ratings (Summary Rate – 8,9,10)
Health Care Personal Doctor
Specialist
Seen Most Often Health Plan
2009 2008 2007 2009 2008 2007 2009 2008 2007 2009 2008 2007
Quality Compass®1 68% 67% 76% 76% 76% 76% 73% 71%
HealthChoice Aggregate 68% 68% 66% 76% 75% 77% 75% 75% 77% 68% 68% 69%
AMERIGROUP Community Care 67% 68% 64% 77% 73% 75% 75% 74% 78% 69% 67% 65%
Diamond Plan 70% 64% 62% 73% 72% 71% 78% 69% 69% 65% 62% 62%
Jai Medical Systems 64% 69% 68% 79% 81% 84% 74% 77% 77% 66% 69% 75%
Maryland Physicians Care 65% 67% 68% 71% 76% 79% 78% 73% 76% 69% 68% 71%
MedStar Family Choice 77% 74% 73% 83% 78% 81% 79% 78% 77% 78% 74% 76%
Priority Partners 69% 66% 65% 74% 72% 77% 75% 72% 83% 70% 71% 70%
UnitedHealthcare 63% 64% 63% 71% 73% 73% 70% 79% 73% 62% 61% 64%
MCO with the highest Summary Rate in 2009
Arrows (,) indicate that the particular measure is performing statistically better or worse than it did in the previous year.1Quality Compass® is a registered trademark of NCQA.
Table 4: Adult Members

11
2009 State of Maryland
Adult and Child Medicaid Populations
Executive SummaryOverall Ratings (continued)
Overall Ratings (Summary Rate – 8,9,10)
Health Care Personal Doctor Specialist Seen Most Often Health Plan
2009 2008 2007 2009 2008 2007 2009 2008 2007 2009 2008 2007
Quality Compass®1 79% 82% 84% 83% 83% 80% 81% 80%
HealthChoice Aggregate 83% 86% 82% 87% 85% 84% 79% 80% 76% 82% 82% 79%
AMERIGROUP Community Care 81% 85% 81% 86% 83% 82% 78% 85% 73% 83% 85% 83%
Diamond Plan 81% 83% 81% 84% 83% 80% 77% 81% 80% 74% 73% 73%
Jai Medical Systems 84% 87% 86% 91% 88% 93% 79% 80% 71% 84% 81% 79%
Maryland Physicians Care 80% 85% 84% 86% 84% 84% 80% 77% 79% 83% 81% 82%
MedStar Family Choice 86% 88% 80% 85% 87% 84% 77% 81% 75% 84% 83% 79%
Priority Partners 82% 89% 86% 89% 84% 84% 81% 83% 76% 85% 84% 81%
UnitedHealthcare 85% 87% 80% 86% 87% 86% 82% 76% 76% 78% 80% 73%
MCO with the highest Summary Rate in 2009
Arrows (,) indicate that the particular measure is performing statistically better or worse than it did in the previous year.1Quality Compass® is a registered trademark of NCQA.
Table 5: Child Members - General Population

12
2009 State of Maryland
Adult and Child Medicaid Populations
Executive SummaryOverall Ratings (continued)
Overall Ratings (Summary Rate – 8,9,10)
Health Care Personal Doctor Specialist Health Plan
2009 2008 2007 2009 2008 2007 2009 2008 2007 2009 2008 2007
HealthChoice Aggregate 79% 83% 79% 86% 84% 84% 79% 80% 76% 78% 77% 74%
AMERIGROUP Community Care 78% 84% 75% 85% 80% 80% 77% 82% 76% 79% 80% 76%
Diamond Plan 77% 86% 84% 79% 85% 80% 72% 84% 77% 66% 71% 59%
Jai Medical Systems 83% 76% 85% 94% 86% 94% 74% 79% 56% 82% 83% 75%
Maryland Physicians Care 78% 84% 80% 86% 86% 84% 82% 81% 78% 80% 78% 78%
MedStar Family Choice 83% 84% 79% 83% 85% 84% 79% 80% 68% 81% 80% 77%
Priority Partners 78% 84% 83% 88% 83% 85% 80% 80% 80% 79% 79% 75%
UnitedHealthcare 77% 81% 76% 84% 87% 84% 78% 76% 76% 71% 70% 66%
MCO with the highest Summary Rate in 2009
Arrows (,) indicate that the particular measure is performing statistically better or worse than it did in the previous year.
Table 6: Child Members - CCC Population
13
2009 State of Maryland
Adult and Child Medicaid Populations
Executive SummaryComposite Measures
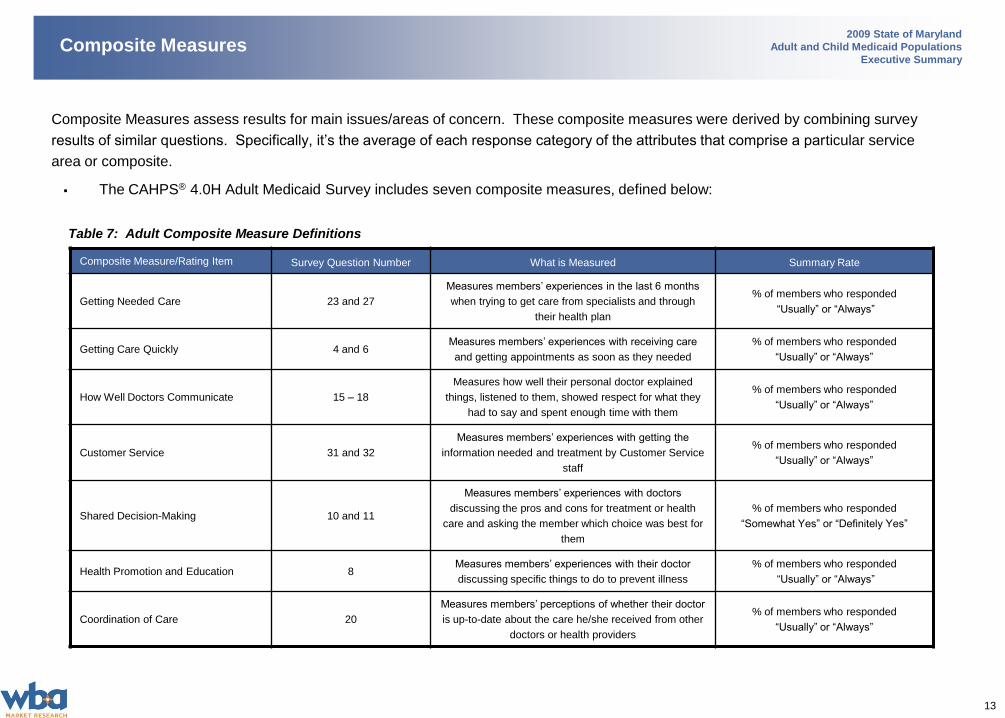
Composite Measures assess results for main issues/areas of concern. These composite measures were derived by combining survey
results of similar questions. Specifically, it’s the average of each response category of the attributes that comprise a particular service
area or composite.
The CAHPS® 4.0H Adult Medicaid Survey includes seven composite measures, defined below:
Table 7: Adult Composite Measure Definitions
Composite Measure/Rating Item Survey Question Number What is Measured Summary Rate
Getting Needed Care 23 and 27
Measures members’ experiences in the last 6 months
when trying to get care from specialists and through
their health plan
% of members who responded
“Usually” or “Always”
Getting Care Quickly 4 and 6Measures members’ experiences with receiving care
and getting appointments as soon as they needed
% of members who responded
“Usually” or “Always”
How Well Doctors Communicate 15 – 18
Measures how well their personal doctor explained
things, listened to them, showed respect for what they
had to say and spent enough time with them
% of members who responded
“Usually” or “Always”
Customer Service 31 and 32
Measures members’ experiences with getting the
information needed and treatment by Customer Service
staff
% of members who responded
“Usually” or “Always”
Shared Decision-Making 10 and 11
Measures members’ experiences with doctors
discussing the pros and cons for treatment or health
care and asking the member which choice was best for
them
% of members who responded
“Somewhat Yes” or “Definitely Yes”
Health Promotion and Education 8Measures members’ experiences with their doctor
discussing specific things to do to prevent illness
% of members who responded
“Usually” or “Always”
Coordination of Care 20
Measures members’ perceptions of whether their doctor
is up-to-date about the care he/she received from other
doctors or health providers
% of members who responded
“Usually” or “Always”

14
2009 State of Maryland
Adult and Child Medicaid Populations
Executive SummaryComposite Measures (continued)
The CAHPS® 4.0H Child Medicaid Survey includes seven standard composite measures, defined below:
Table 8: Child Composite Measure Definitions
Composite Measure/
Rating Item What is Measured Response Choices Summary Rate
Getting Needed Care Measures members’ experiences in the last 6 months
when attempting to get care from doctors and specialists
“Always, Usually, Sometimes or Never”
[In previous years, the response choices were “A Big Problem, A
Small Problem or Not a Problem”. Therefore, due to significant
changes in response choices, this composite is not trendable.]
% of members who responded
“Usually” or “Always”
Getting Care QuicklyMeasures members’ experiences with receiving care and
getting appointments as soon as they wanted
“Always, Usually, Sometimes or Never”
[Since two questions were omitted from this composite in the 2009
survey, this composite is not trendable.]
% of members who responded
“Usually” or “Always”
How Well Doctors
Communicate
Measures how well personal doctor explained things,
listened to them, showed respect for what they have to
say and spent enough time with them
“Always, Usually, Sometimes or Never”
[Although there were minor wording changes in the 2009 survey,
this composite is still trendable.]
% of members who responded
“Usually” or “Always”
Customer Service
Measures members’ experiences with getting the
information needed and treatment by customer service
staff
“Always, Usually, Sometimes or Never”
[In previous years, the response choices were “A Big Problem, A
Small Problem or Not a Problem”. Therefore, due to significant
changes in response choices, this composite is not trendable.]
% of members who responded
“Usually” or “Always”
Shared Decision-Making
Measures members’ experiences with doctors discussing
the pros and cons for treatment or health care and asking
the member which choice was best for them
“Definitely Yes, Somewhat Yes, Somewhat No or Definitely No”
[New composite measure in the 2009 survey.]
% of members who responded
“Somewhat Yes” or “Definitely Yes”
Health Promotion and
Education
Measures members’ experience with their doctor
discussing specific things to do to prevent illness
“Always, Usually, Sometimes or Never”
[New content area in the 2009 survey.]
% of members who responded
“Usually” or “Always”
Coordination of Care
Measures members’ perception of whether their doctor is
up-to-date about the care he/she received from other
doctors or health providers
“Always, Usually, Sometimes or Never”
[New content area in the 2009 survey.]
% of members who responded
“Usually” or “Always”
15
2009 State of Maryland
Adult and Child Medicaid Populations
Executive SummaryComposite Measures (continued)
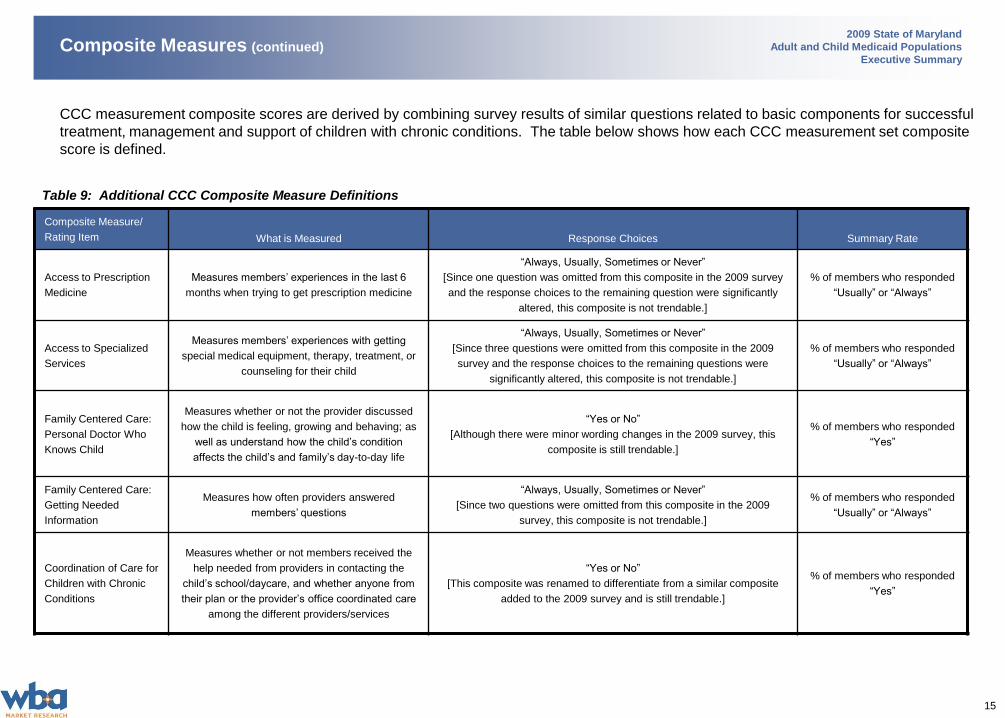
CCC measurement composite scores are derived by combining survey results of similar questions related to basic components for successful
treatment, management and support of children with chronic conditions. The table below shows how each CCC measurement set composite
score is defined.
Table 9: Additional CCC Composite Measure Definitions
Composite Measure/
Rating Item What is Measured Response Choices Summary Rate
Access to Prescription
Medicine
Measures members’ experiences in the last 6
months when trying to get prescription medicine
“Always, Usually, Sometimes or Never”
[Since one question was omitted from this composite in the 2009 survey
and the response choices to the remaining question were significantly
altered, this composite is not trendable.]
% of members who responded
“Usually” or “Always”
Access to Specialized
Services
Measures members’ experiences with getting
special medical equipment, therapy, treatment, or
counseling for their child
“Always, Usually, Sometimes or Never”
[Since three questions were omitted from this composite in the 2009
survey and the response choices to the remaining questions were
significantly altered, this composite is not trendable.]
% of members who responded
“Usually” or “Always”
Family Centered Care:
Personal Doctor Who
Knows Child
Measures whether or not the provider discussed
how the child is feeling, growing and behaving; as
well as understand how the child’s condition
affects the child’s and family’s day-to-day life
“Yes or No”
[Although there were minor wording changes in the 2009 survey, this
composite is still trendable.]
% of members who responded
“Yes”
Family Centered Care:
Getting Needed
Information
Measures how often providers answered
members’ questions
“Always, Usually, Sometimes or Never”
[Since two questions were omitted from this composite in the 2009
survey, this composite is not trendable.]
% of members who responded
“Usually” or “Always”
Coordination of Care for
Children with Chronic
Conditions
Measures whether or not members received the
help needed from providers in contacting the
child’s school/daycare, and whether anyone from
their plan or the provider’s office coordinated care
among the different providers/services
“Yes or No”
[This composite was renamed to differentiate from a similar composite
added to the 2009 survey and is still trendable.]
% of members who responded
“Yes”

16
2009 State of Maryland
Adult and Child Medicaid Populations
Executive SummaryComposite Measures (continued)
Composite Measures
Getting Needed Care Getting Care Quickly
How Well Doctors
Communicate Customer Service Shared Decision-Making
Health Promotion and
Education Coordination of Care
Summary Rate:
Always/Usually
Summary Rate:
Always/Usually
Summary Rate:
Always/Usually
Summary Rate:
Always/Usually
Def-
initely
Yes2
Summary Rate:
Definitely Yes/
Somewhat Yes
Summary Rate:
Always/Usually
Summary Rate:
Always/Usually
2009 2008 2007 2009 2008 2007 2009 2008 2007 2009 2008 2007 2009 2009 2008 2007 2009 2008 2007 2009 2008 2007
Quality
Compass®176% 75% 80% 80% 87% 87% 80% 79% 58% 57% 56% 76% 76%
HealthChoice
Aggregate74% 73% 72% 82% 80% 82% 87% 87% 87% 78% 77% 77% 56% 89% 92% 89% 62% 62% 62% 78% 78% 76%
AMERIGROUP
Community Care70% 70% 72% 81% 74% 85% 89% 86% 87% 78% 79% 77% 56% 89% 90% 91% 59% 61% 59% 82% 71% 72%
Diamond Plan 66% 61% 61% 78% 81% 78% 85% 85% 86% 75% 77% 75% 53% 88% 93% 89% 64% 61% 60% 71% 73% 70%
Jai Medical
Systems76% 78% 79% 80% 80% 82% 89% 89% 88% 76% 77% 74% 58% 90% 91% 91% 66% 67% 67% 85% 84% 82%
Maryland
Physicians Care75% 75% 74% 83% 83% 82% 85% 87% 87% 81% 72% 78% 49% 86% 92% 86% 61% 60% 61% 77% 80% 75%
MedStar Family
Choice82% 80% 78% 87% 80% 86% 89% 89% 91% 85% 80% 85% 62% 90% 94% 92% 63% 62% 68% 78% 80% 78%
Priority Partners 75% 72% 73% 81% 80% 81% 88% 85% 87% 76% 80% 80% 57% 90% 91% 89% 62% 64% 59% 76% 77% 81%
UnitedHealthcare 70% 70% 67% 82% 79% 80% 85% 86% 84% 73% 73% 69% 55% 87% 90% 85% 58% 58% 58% 74% 75% 73%
MCO with the highest Summary Rate in 2009
Arrows (,) indicate that the particular composite measure is performing statistically better or worse than it did in the previous year.1Quality Compass® is a registered trademark of NCQA.2While the Summary Rate for “Shared Decision-Making” is “Definitely Yes/Somewhat Yes”, Quality Compass reports only on “Definitely Yes”; therefore, both percentages are shown.
The following tables show composite measure comparisons of the seven HealthChoice MCOs.
In order to assess how the MCOs’ overall composite ratings compared with other Medicaid adult and child plans nationwide,
national benchmarks are provided. Specifically, the adult and child data are compared to the 2008 Quality Compass® benchmarks
(Reporting Year 2007). Quality Compass® is a national database created by NCQA to provide health plans with comparative
information on the quality of the nation’s managed care plans.
Table 10: Adult Composite Measures
17
2009 State of Maryland
Adult and Child Medicaid Populations
Executive SummaryComposite Measures (continued)
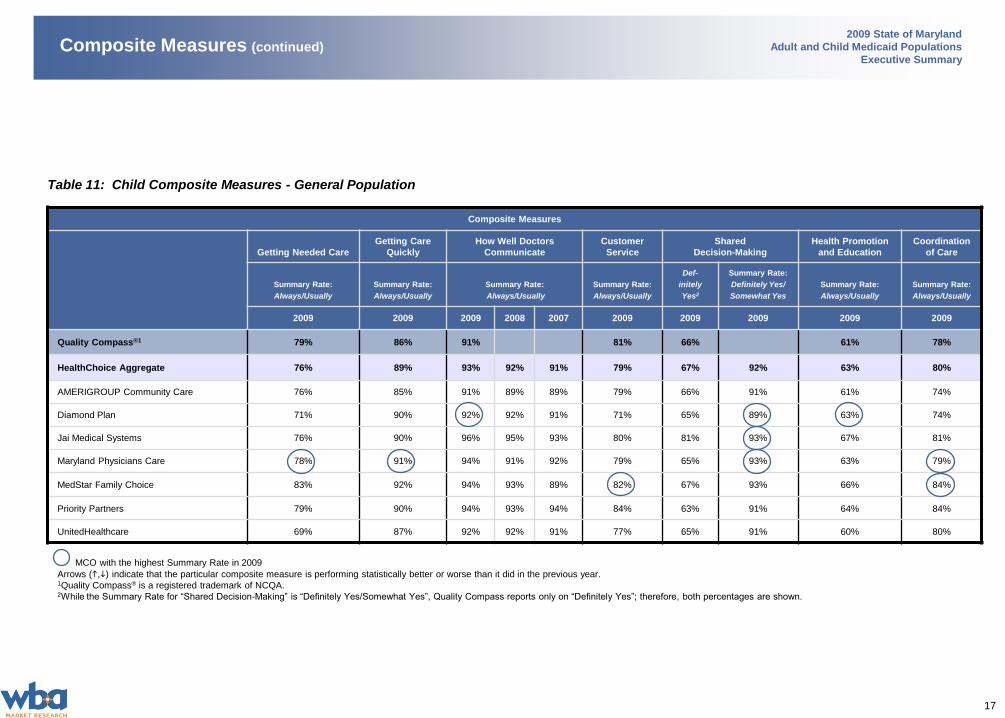
Table 11: Child Composite Measures - General Population
Composite Measures
Getting Needed Care
Getting Care
Quickly
How Well Doctors
Communicate
Customer
Service
Shared
Decision-Making
Health Promotion
and Education
Coordination
of Care
Summary Rate:
Always/Usually
Summary Rate:
Always/Usually
Summary Rate:
Always/Usually
Summary Rate:
Always/Usually
Def-
initely
Yes2
Summary Rate:
Definitely Yes/
Somewhat Yes
Summary Rate:
Always/Usually
Summary Rate:
Always/Usually
2009 2009 2009 2008 2007 2009 2009 2009 2009 2009
Quality Compass®1 79% 86% 91% 81% 66% 61% 78%
HealthChoice Aggregate 76% 89% 93% 92% 91% 79% 67% 92% 63% 80%
AMERIGROUP Community Care 76% 85% 91% 89% 89% 79% 66% 91% 61% 74%
Diamond Plan 71% 90% 92% 92% 91% 71% 65% 89% 63% 74%
Jai Medical Systems 76% 90% 96% 95% 93% 80% 81% 93% 67% 81%
Maryland Physicians Care 78% 91% 94% 91% 92% 79% 65% 93% 63% 79%
MedStar Family Choice 83% 92% 94% 93% 89% 82% 67% 93% 66% 84%
Priority Partners 79% 90% 94% 93% 94% 84% 63% 91% 64% 84%
UnitedHealthcare 69% 87% 92% 92% 91% 77% 65% 91% 60% 80%
MCO with the highest Summary Rate in 2009
Arrows (,) indicate that the particular composite measure is performing statistically better or worse than it did in the previous year.1Quality Compass® is a registered trademark of NCQA.2While the Summary Rate for “Shared Decision-Making” is “Definitely Yes/Somewhat Yes”, Quality Compass reports only on “Definitely Yes”; therefore, both percentages are shown.

18
2009 State of Maryland
Adult and Child Medicaid Populations
Executive SummaryComposite Measures (continued)
MCO with the highest Summary Rate in 2009
Arrows (,) indicate that the particular composite measure is performing statistically better or worse than it did in the previous year.
Table 12: Child Composite Measures - CCC Population
Composite Measures
Getting Needed
Care
Getting Care
Quickly
How Well Doctors
Communicate
Customer
Service
Shared
Decision-Making
Health
Promotion and
Education
Coordination
of Care
Summary Rate:
Always/Usually
Summary Rate:
Always/Usually
Summary Rate:
Always/Usually
Summary Rate:
Always/Usually
Summary Rate:
Definitely Yes/
Somewhat Yes
Summary Rate:
Always/Usually
Summary Rate:
Always/Usually
2009 2009 2009 2008 2007 2009 2009 2009 2009
HealthChoice Aggregate 75% 90% 93% 91% 91% 77% 92% 66% 79%
AMERIGROUP Community Care 74% 87% 93% 89% 88% 76% 91% 65% 80%
Diamond Plan 73% 88% 92% 89% 91% 78% 92% 59% 74%
Jai Medical Systems 71% 91% 97% 95% 94% 76% 91% 72% 76%
Maryland Physicians Care 78% 92% 93% 92% 91% 79% 93% 68% 79%
MedStar Family Choice 80% 92% 93% 92% 89% 77% 92% 67% 84%
Priority Partners 77% 91% 94% 90% 93% 78% 93% 67% 79%
UnitedHealthcare 68% 90% 89% 92% 90% 73% 89% 63% 75%

19
2009 State of Maryland
Adult and Child Medicaid Populations
Executive Summary
MCO with the highest Summary Rate in 2009
Arrows (,) indicate that the particular composite measure is performing statistically better or worse than it did in the previous year.
Composite Measures (continued)
Additional CCC Composite Measures
Access to
Prescription
Medicine
Access to
Specialized Services
FCC: Personal Doctor
Who Knows Child
FCC: Getting
Needed
Information
Coordination of Care for
Children with Chronic
Conditions
Summary Rate:
Always/Usually
Summary Rate:
Always/Usually
Summary Rate:
Yes
Summary Rate:
Always/Usually
Summary Rate:
Yes
2009 2009 2009 2008 2007 2009 2009 2008 2007
HealthChoice Aggregate 90% 74% 88% 87% 87% 88% 76% 76% 73%
AMERIGROUP Community Care 84% 67% 86% 86% 86% 87% 76% 76% 71%
Diamond Plan 89% 77% 84% 84% 85% 88% 70% 81% 87%
Jai Medical Systems 89% 73% 91% 87% 90% 91% 77% 82% 86%
Maryland Physicians Care 92% 75% 88% 89% 89% 89% 81% 77% 73%
MedStar Family Choice 93% 76% 87% 88% 85% 86% 76% 74% 71%
Priority Partners 92% 78% 89% 87% 89% 89% 77% 76% 73%
UnitedHealthcare 89% 70% 88% 87% 84% 85% 71% 75% 71%
Table 13: Child Composite Measures - CCC Population
20
2009 State of Maryland
Adult and Child Medicaid Populations
Executive SummaryKey Drivers of Satisfaction
In an effort to identify the underlying components of adult and child members’ ratings of their Health Plan and Health Care, advanced
statistical techniques were employed.
Regression analysis is a statistical technique used to determine which influences or “independent variables” (composite measures)
have the greatest impact on an overall attribute or “dependent variable” (overall rating of Health Plan or Health Care).
In addition, correlation analyses were conducted between each composite measure attribute and overall rating of Health Plan and
Health Care in order to ascertain which attributes have the greatest impact.
Adult Medicaid Members – Key Drivers of Satisfaction with Health Plan
Based on the 2009 findings, there are two composite measures that have a significant impact on adult members’ rating of their Health
Plan overall: “Customer Service” and “Getting Needed Care”.
The attributes listed below are identified as unmet needs1 and should be considered priority areas for HealthChoice. If
performance on these attributes is increased, it could have a positive impact on adult members’ overall rating of their Health Plan.
Got the care, tests, or treatment you thought necessary
Received information or help needed from the health plan’s Customer Service
Adult Medicaid Members – Key Drivers of Satisfaction with Health Care
Based on the 2009 findings, the following composite measures have a significant impact on adult members’ rating of their Health Care
overall: “Getting Needed Care”, “Customer Service” and “How Well Doctors Communicate”.
The attribute “Got the care, tests, or treatment you thought necessary” is identified as an unmet need1 and should be
considered a priority area for HealthChoice. If performance on this attribute is increased, it could have a positive impact on adult
members’ overall rating of their Health Care.
1Unmet needs are key drivers that are of high importance to members where they perceive HealthChoice to be performing at a lower level (Summary Rate is less than 80%).

21
2009 State of Maryland
Adult and Child Medicaid Populations
Executive SummaryKey Drivers of Satisfaciton (continued)
Child Medicaid Members – Key Drivers of Satisfaction with Health Plan
Based on the 2009 findings, there are two composite measures that have a significant impact on child members’ rating of their Health Plan
overall: “Customer Service” and “Getting Needed Care”.
The attribute “Received the information or help needed from Customer Service” is identified as an unmet need1 and should
be considered a priority area for HealthChoice. If performance on this attribute is increased, it could have a positive impact on
child members’ overall rating of their Health Plan.
Child Medicaid Members – Key Drivers of Satisfaction with Health Care
Based on the 2009 findings, the following composite measures have a significant impact on child members’ rating of their Health Care
overall: “Shared Decision-Making”, “How Well Doctors Communicate” and “Getting Needed Care”.
Given some of the high ratings received, there were no attributes identified as unmet needs1 that should be considered priority
areas for improving ratings of child members’ Health Care overall.
Instead, the attributes listed below are identified as driving strengths2 and performance in these areas should be maintained. If
performance for these attributes is decreased, it could have a negative impact on child members’ overall rating of their Health
Care.
Doctor listened carefully to you
Doctor explained things in a way that was easy to understand
Doctor showed respect for what you had to say
1Unmet needs are key drivers that are of high importance to members where they perceive HealthChoice to be performing at a lower level (Summary Rate is less than 80%).2Driving strengths are key drivers that are of high importance to members where they perceive HealthChoice to be performing at a higher level (Summary Rate is 90% or more).

22
2009 State of Maryland
Adult and Child Medicaid Populations
Executive SummaryGlossary of Terms
Attributes are the questions that relate to a specific service area or composite as specified by NCQA.
Composite Measures are derived by combining the survey results of similar questions that represent an overall aspect of plan quality.
Specifically, it’s the average of each response category of the attributes that comprise a particular service area or composite.
Confidence Level is the degree of confidence, expressed as a percentage, that a reported number’s true value is between the lower and upper
specified range.
Correlation Coefficient is a statistical measure of how closely two variables or measures are related to each other.
Disposition Category is the final status given to a member record within the sample surveyed. The category signifies both the survey
administration used to complete the survey (M=Mail, T=Telephone) and the status of the member record (M21=Mail, Ineligible; T10= Phone,
Complete).
Key Drivers are composite measures that have been found to impact ratings of overall Health Plan and Health Care among MCO members as
determined by regression analysis.
Over-Sampling is sampling more than the minimum required sample size. The recommended sample size for adult Medicaid MCOs is 1,350
and the target number of completed surveys is 411. The recommended sample size for child Medicaid MCOs is 1,650 (General
Population/Sample A) and the target number of completed surveys is 411. The Department may choose to over-sample to obtain a greater
number of completed surveys, particularly if it anticipates, by history, a low response rate.
Significance Test is a test used to determine the probability that a given result could not have occurred by chance.
Summary Rates generally represent the most favorable responses for a particular question (i.e., Always and Usually; 8, 9 or 10; Definitely Yes
and Somewhat Yes; etc.). Keep in mind that not every question is assigned a Summary Rate.
Trending is the practice of examining several years of data in a comparative way to identify common attributes.