State of Environment Outlook Report for the Western Cape Province ...
36
i State of Environment Outlook Report for the Western Cape Province State of Environment Outlook Report for the Western Cape Province Energy Chapter September 2013
Transcript of State of Environment Outlook Report for the Western Cape Province ...

i State of Environment Outlook Report for the Western Cape Province
State of Environment Outlook Report
for the Western Cape Province
Energy Chapter
September 2013


i State of Environment Outlook Report for the Western Cape Province
Document Title and Version:
Energy Chapter
Client:
Western Cape Department of Environmental Affairs & Development Planning
Project Name:
State of Environment Outlook Report for the Western Cape Province
Royal HaskoningDHV Reference Number:
E02.CPT.00330
Authority Reference:
EADP2/2013
Authors:
Sharleen Moodley & Gerard van Weele
Acknowledgements:
Western Cape Government Environmental Affairs & Development Planning
Karen Shippey, Joos Roelofse, Wouter Swart, Frances van der Merwe, and Lize
Jennings-Boom
Western Cape Government Economic Development and Tourism
Fernel Abrahams
City of Cape Town
Amy Davison
Photo Credits:
Pages 2, 8, 9, 18, 21, 22 - Gerard van Weele
Page 13 – John Cronjé
Date:
September 2013
DOCUMENT DESCRIPTION

State of Environment Outlook Report for the Western Cape Province ii
1 INTRODUCTION 1
2 OVERVIEW OF DRIVERS AND PRESSURES 1
2.1 DRIVERS 2
2.2 PRESSURES 2
3 STATE 3
3.1 ENERGY GENERATION 3
3.1.1 Coal 5 3.1.2 Oil 5 3.1.3 Natural gas 7 3.1.4 Nuclear energy 8 3.1.5 Renewable energy 8
3.2 ENERGY USE 12
3.3 ENERGY INTENSITY 15
3.4 DOMESTIC ENERGY USE 16
3.4.1 Electricity 16 3.4.2 Alternative fuels 17
4 IMPACTS 17
5 RESPONSES 19
5.1 NATIONAL PROGRAMMES 19
5.2 WESTERN CAPE 21
5.3 ENERGY RELATED TARGETS 22
5.4 POLICY, TOOLS AND LEGISLATION 23
6 CONCLUSION 25
7 REFERENCES 27
TABLE OF CONTENTS

iii State of Environment Outlook Report for the Western Cape Province
Figure 1: Percentage supply of primary energy (excluding electricity production) by source in South
Africa, 2002–2009 (StatsSA 2012b) 4
Figure 2: South African oil and gas infrastructure (adapted from Petroleum Agency of SA 2010) 5
Figure 3: Production and mining rights in Block 9 (Petroleum Agency of SA 2010) 6
Figure 4: Map showing the location of the shale gas exploration permit blocks in South Africa 7
Figure 5: Global Horizontal Irradiation: South Africa (SolarGIS © 2013 GeoModel Solar s.r.o.) 10
Figure 6: Overview of hydropower resources in South Africa (Source: DME/CSIR/Eskom 2002 cited in
DEADP, 2007a) 11
Figure 7: Energy use per District of the Western Cape (WCG 2013) 13
Figure 8: Energy use by fuel type (WCG 2013) 14
Figure 9: Energy use by sector (WCG 2013) 15
Figure 10: Energy per GDP for each District of the Western Cape (WCG 2013) 16
Figure 11: Percentages of Electrified Homes per Province 1996-2011 (StatsSA 2012c) 16
Figure 12: Electricity used for lighting, cooking and heating in the Western Cape (StatsSA 2012a) 17
Table 1: Key energy use and CO2e emissions Indicators for the Western Cape, 2009 (Source: WCG,
2013) 14
Table 2: Energy Targets for the City of Cape Town, Western Cape Province and National
Government 23
Table 3: Summary of policy, tools and legislation related to Energy 24
Table 4: Summary of key aspects identified in the chapter 26
Table 5: Summary of the outlook for energy based on the findings of the Western Cape State of
Environment Outlook Report 26
TABLE OF FIGURES
LIST OF TABLES


1 State of Environment Outlook Report for the Western Cape Province
1 INTRODUCTION
The human population, and indeed natural processes on the earth itself, are sustained by
energy. Energy sustains human livelihoods and powers the economy of South Africa. For
application in human society, energy is derived from many sources including direct
sunlight, fossil fuels as well as natural forces, and is conveyed over distance as electricity,
liquid, gaseous and solid fuels, or different forms of enriched mediums.
The energy sector is critical to South Africa‟s economy, where it indirectly and directly
contributes approximately 15% to the country‟s Gross Domestic Product (GDP) and
therefore underpins the rest of the economy (GCIS 2012). As the economy continues to
grow, energy is increasingly becoming a key focus. A transformation of the energy sector
is regarded as one of the major requirements through which equitable economic growth
and sustainable development can be achieved (NPC 2011). South Africa currently has a
well-developed energy supply and production system, but the challenge is to maintain
and expand it to keep up with and support the growing economy. It is also characterised
by the duality of low production costs but high environmental impacts as a consequence
of a heavy reliance on large coal reserves and other imported fossil fuels. In fact, about
70% of primary energy and 90% of electricity are derived from coal (NPC 2011). The low
production costs have over time encouraged heavy industry and especially the minerals
sector to invest in energy intensive beneficiation processes (NPC 2011).
Unfortunately, the energy intensity and reliance on fossil fuel derived energy translates into
relatively high greenhouse gas emissions such as carbon dioxide (CO2) whether measured
either per capita or by greenhouse gas (GHG) intensity (emissions per unit of GDP). A
heavy reliance on energy is also increasingly becoming a liability as energy prices rise to
compensate for the progressive internalisation of the environmental and social costs of
generating energy.
This chapter describes the energy sector in the Western Cape in terms of how energy
production and consumption affects environmental change. Specifically, indicators of
Energy Use, Energy Production, Energy Intensity and Domestic Energy Use are tracked in
order to understand the energy picture and identify trends. The chapter also provides a
discussion on the various responses of the Western Cape to issues related to energy.
Readers are encouraged to read this chapter along with those on Air Quality and Climate
Change due to close relationships between the three spheres.
2 OVERVIEW OF DRIVERS AND PRESSURES The energy requirements of the different economic sectors in South Africa are supplied
from a wide range of energy sources or carriers, including coal, electricity, nuclear, liquid
fuels (refined from crude oil and coal), gas and renewable energy sources. Energy
generation and consumption, however, place considerable pressures on the environment
through impacts such as the release of greenhouse gas emissions and air pollutants, the
alteration of land-use patterns, and consumption of water resources. This contributes to
climate change, damages natural ecosystems, and compromises the man-made
environment; all of which combines to impact on human health (Modi et al. 2005).

State of Environment Outlook Report for the Western Cape Province 2
It is demand side factors that determine the scale of the environmental change that can
be ascribed to energy. Consumption patterns, and particularly the total amount of energy
and the efficiency at which energy is used, ultimately determine the overall impact.
Drivers of consumption can therefore be seen as the primary determinants of
environmental change that impact on environmental features through various activities or
pressures.
2.1 Drivers
In terms of drivers, the primary agent driving the impact that energy generation and use
has on the environment is human population growth. As a rule of thumb, total energy
usage will increase along with population numbers. However, population dynamics can
materially influence or determine the
patterns of consumption, and therefore
the rate of increase. Relative wealth has
been shown to correlate with high per
capita energy usage (IEA 2008), as has
urbanisation, population age structure
and household size (Jiang & Hardee
2011).
The Western Cape satisfies, or show rising
trends for all the criteria mentioned. The
population structure itself can be
described as young (<35 years old),
urbanised and living in small households
(3.6 people per household). Well over 90% of households in the Western Cape have
access to electricity, and most have access to basic services as well as a radio, television,
refrigerator, landline telephone and at least one cellular telephone (StatsSA 2012a). The
2011 Census also shows a 2.5% annual population growth in the Western Cape. All of this
implies that the population of the Western Cape acts as a major driver of energy usage,
and therefore also the associated environmental impacts.
2.2 Pressures
It holds true that for both economic activities and household activities, the amount of
energy that is consumed is related to the efficiency of use, and this efficiency is
determined by inherent characteristics of the particular application. Domestic uses, for
example, require small units of energy for application in lighting, heating and cooking, as
well as to power a range of electronic appliances and gadgets. This need can be satisfied
through energy from biomass, coal, renewable sources or grid-supplied electricity. In
comparison, an energy intense industry like mining or smelting requires a constant large
amount of energy which in the Western Cape can only be supplied through coal, coal-
based grid supplied electricity or nuclear energy. The nature of the energy consumption
also determines whether opportunities exist for improvements in energy efficiency or
wholesale shifts to different forms of energy. Transportation, for example, will remain
heavily dependent on liquid fuels unless significant shifts in modal choice can be
achieved to allow for more electricity driven public transport and non- motorised

3 State of Environment Outlook Report for the Western Cape Province
transport. Consequently, the composition and size of the local economic system will
influence the pressure that energy consumption has on the environment.
The economy of the Western Cape is growing slightly faster than the rest of South Africa,
with 3% GDP growth in 2010, in part driven by a 5% growth in manufacturing (WCG 2012).
The Provincial Economic Review and Outlook (WCG 2012) further indicates that
manufacturing contributes 15% to the GDP while the built environment (services, business
and commerce) contributes well over 80%. This implies an inherent dependence on bulk
electricity supplies for the built
environment, but also a mix of
electricity, coal and diesel for various
forms of manufacturing. It also implies
that the bulk of the economic activity
would not necessarily be locked into a
particular type of primary energy, as
long as the requisite supply of
electricity is provided. It is necessary
though to ensure that the supply of
energy and integrity of the supply
networks keep pace with the consistent
economic growth.
Transportation affects energy usage in two ways. On the one hand it represents a direct
consumption of energy as goods and passengers are moved across the landscape. It is
calculated that in 2009 in Cape Town, the transportation sector comprised 57% of the
total energy use in the city once aviation and maritime uses are excluded. The figure rises
to 71% with aviation and maritime uses included (WCG 2013). On the other hand, the
built-in efficiencies and coverage of transport networks determine user behaviour and
consequently the energy intensity of human activities. The relative energy intensity of the
different modes differs, and therefore also the relative impact of shifts in modal choice.
3 STATE
This section provides information on the current
state of energy in the Western Cape, using energy
generation, energy consumption, energy intensity
and domestic use as indicators. An attempt is
made to provide a comparison between the state
of energy in 2005 and the current state, although
comparable information remains limited. Where possible, information is presented at a
District Municipality level in order to present a more refined perspective on the energy
sector in the province.
3.1 Energy generation
The indicator on energy generation depicts the production of energy in the Western Cape
Province, including energy from both renewable and non-renewable sources. The
rationale behind the use of the indicator for the state of the energy sector is to identify
Tracked indicators of the status of Energy:
Types of energy generation
Renewable energy sources
Energy use
Energy intensity
South Africa is the 27th largest economy in
the world, but the 12th largest carbon dioxide
emitter. This is mainly because the energy
intensive economy is largely dependent on
carbon-based fuels. As the world takes steps
to cost the negative effects of carbon, South
Africa is likely to face challenges (and
opportunities) in reducing emissions... It will
have to find ways of... improving both the
water and energy efficiency of industry.
National Development Plan - 2030

State of Environment Outlook Report for the Western Cape Province 4
trends in the responses to changes in energy demand, to highlight what the local energy
supply mix will consist of in future, and broadly indicate where the local environment will
be directly impacted on by energy generation. It should be recognised though that not all
the energy generated in the province is necessarily utilised within its borders, and not all
the energy consumed in the province originates from the Western Cape. This is due to
over- or undersupply of particular forms of energy or energy carriers relative to the local
energy demand.
Primary energy supply in South Africa is a mandate of National Government (in terms of
the National Energy Act, Act 34 of 2008). According to statistics from StatsSA (2012b), the
South African energy supply in 2009 was dominated by coal, which provided 61.8% of the
primary energy. This is followed by petroleum products (sourced from oil, coal and gas) at
16.3%, crude oil at 13.2%, and renewables and wastes at 5.3%. Small amounts of Gas
(1.5%), Nuclear (1.7%) and Hydro (0.2%) round off the list (Figure 1).
Figure 1: Percentage supply of primary energy (excluding electricity production) by
source in South Africa, 2002–2009 (StatsSA 2012b)
The Western Cape is home to only some of these energy generation activities. Most
notably, these include the Koeberg nuclear power station, the Open Cycle Gas Turbine
peaking power stations at Gourikwa (Mossel Bay) and Ankerlig (Atlantis), the Darling and
Windheuwel Wind Farms, oil refineries, as well as natural gas off both the South and West
coasts.
Oil and gas refineries produce petroleum products such as petrol, diesel, residual fuel, oil,
paraffin, jet fuel, aviation gasoline, liquefied petroleum gas (LPG) and refinery gas (StatsSA
2012b). Apart from the PetroSA refineries in Mossel Bay, a major refinery with an
approximate capacity of 100 000 barrels per day (bbl/d) is operated by Chevron in Cape
Town (Petroleum Agency of SA 2010).
0%
10%
20%
30%
40%
50%
60%
70%
2002
2005
2009

5 State of Environment Outlook Report for the Western Cape Province
3.1.1 Coal
The energy sector in South Africa is dominated by coal, and especially coal-based
electricity, due to the country‟s large coal reserves. Despite this, no coal is mined in the
Western Cape. Coal for direct application in industries is brought in by truck and rail from
coal fields in the northern provinces (especially Mpumalanga and KwaZulu-Natal) and
coal-based electricity is sourced from the national electricity grid to satisfy the bulk of the
electricity consumption in the Western Cape.
The South African coal reserve which is estimated at 30 billion tonnes, are at current
exploitation rates enough for another 121 years (StatsSA 2012b). Most of the coal mined in
South Africa is used for the generation of electricity, with a small yet significant portion
transformed into liquid fuels or other petrochemicals by Sasol. In 2006, 68.7 million tonnes of
coal were exported (DMR 2009).
As part of Eskom‟s electricity generation expansion programme, two new coal-fired power
stations – Medupi and Kusile – will be commissioned in Limpopo and Mpumalanga
respectively. The investment in coal-based electricity generation implies that the current
coal-dependent national electricity supply to the Western Cape will not change in the
near future.
3.1.2 Oil
South Africa relies heavily on imported crude oil for its liquid fuel demands, with most of
the supply being sourced from the Middle East (Saudi Arabia, Iran, Kuwait, the United Arab
Emirates, Yemen, Qatar and Iraq) and Africa (Nigeria, Egypt and Angola) (StatsSa 2012b).
Local reserves of crude oil are all located offshore, in an exploration area known as Block
9 in the Bredasdorp basin South of Mossel Bay. Block 9 contains three fields – Oribi, Oryx
and Sable - although since 2008 exploitation at Sable has shifted to gas and condensate
(Figure 2 and Figure 3).
Figure 2: South African oil and gas infrastructure (adapted from Petroleum Agency of SA
2010)
The Oribi/Oryx oil field, the site of South Africa‟s first conventional oil production field,
began production in 1997 and produces about 2% of the country‟s liquid fuel

State of Environment Outlook Report for the Western Cape Province 6
requirements (Petroleum Agency of SA 2010). Oil production is currently at a rate of less
than 2 000 bbl/d (PetroSA 2013).
Figure 3: Production and mining rights in Block 9 (Petroleum Agency of SA 2010)
Supplementation of the liquid fuel supply takes place through coal-to-liquid and gas-to-
liquid conversion processes (Sasol) as well as natural gas-to-liquid fuels conversion
(PetroSA)(StatsSA 2012b). At the PetroSA gas-to-liquid plant in Mossel Bay (Mossgas), a
modified version of the Fischer-Tropsch process can produce 36 000 bb/d liquid fuels
(Petroleum Agency of SA 2010).
Open Cycle Gas Turbine (OCGT) power stations run on liquid fuels are located in Mossel
Bay and Cape Town. These plants are key components of the Eskom Peaking Capacity
strategy, as they can begin generating electricity within 30 minutes of start-up. The
Gourikwa OCGT power plant at Mossel Bay (746 MW) comprises a fuel supply pipeline
from the PetroSA facility to the power plant, a substation at the OCGT power plant and
two transmission lines to transfer electricity from the OCGT substation to the Proteus
substation (and hence the national grid). A similar arrangement is found at the Atlantis
(Ankerlig) OCGT plant in Cape Town (1 338 MW), with fuel sourced from the refineries in
Milnerton and a connection to the Koeberg-Aurora transmission power line (ESKOM
2013a).
Two gas turbine power stations are present inside the City of Cape Town urban fabric.
Acacia power station is located in the vicinity of Wingfield. It is primarily intended as a
back-up power supply for the Koeberg nuclear reactor but otherwise functions as a
peaking power station in the ESKOM national grid. It consists of only three 57 MW gas
turbine generators, totalling 171 MW installed capacity (Eskom 2013b). Additionally, there
is the Roggebaai OCGT which has a capacity of 36 MW.
7 State of Environment Outlook Report for the Western Cape Province
3.1.3 Natural gas
The 2005 Western Cape State of Environment Report (DEADP 2005) stated that despite
playing a very small role compared to other countries, the rapidly expanding gas sector of
South Africa is of increasing importance to the local energy economy. This remains true,
and equally so for the Western Cape Province. Both on- and offshore natural gas reserves
are located in the Western Cape, with offshore natural gas found at the oil and gas fields
off the coast of Mossel Bay and large shale gas reserves presumably located in the Karoo
Basin.
Natural gas extracted from the F-A and E-M gas fields that form part of Block 9 off Mossel
Bay are converted into liquid fuels by PetroSA at the Mossgas plant. Several other
exploration blocks and mining rights are located in the same vicinity, and these are under
constant appraisal to determine feasibility of extraction (Petroleum Agency SA 2010).
Along the West Coast, gas is found at the Ibhubezi gas field which is located 380 km north
west of Cape Town just outside the boundary of the Western Cape. The field is capable of
producing 225 Million Standard Cubic Feet (MMscf)/day, which is equal to approximately
30% of the energy used in the Western Cape. Plans are underfoot to provide a gas
pipeline past the Ibhubezi cluster, from the Kudu field in Namibia to Cape Town, should
gas fields off the West Coast prove to be sufficiently viable (Petroleum Agency of SA 2010).
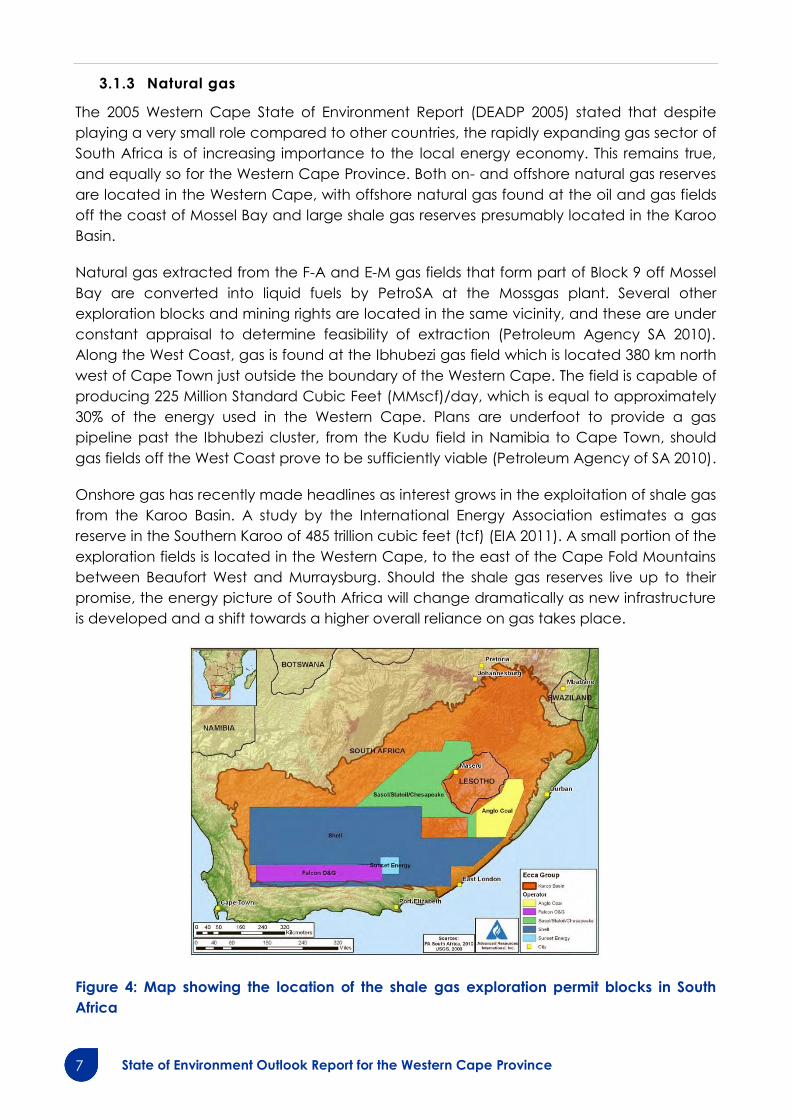
Onshore gas has recently made headlines as interest grows in the exploitation of shale gas
from the Karoo Basin. A study by the International Energy Association estimates a gas
reserve in the Southern Karoo of 485 trillion cubic feet (tcf) (EIA 2011). A small portion of the
exploration fields is located in the Western Cape, to the east of the Cape Fold Mountains
between Beaufort West and Murraysburg. Should the shale gas reserves live up to their
promise, the energy picture of South Africa will change dramatically as new infrastructure
is developed and a shift towards a higher overall reliance on gas takes place.
Figure 4: Map showing the location of the shale gas exploration permit blocks in South
Africa

State of Environment Outlook Report for the Western Cape Province 8
Shale gas is extracted through a process known as hydraulic fracturing, also referred to as
„Fracking‟. This process has gained notoriety due to a range of environmental impacts
and pollution incidents associated with the process. Current knowledge on the South
African shale gas resources and potential impacts from hydraulic fracturing is limited to
the information released in a report from the Department of Mineral Resources - Report on
Investigation of Hydraulic Fracturing in the Karoo Basin of South Africa (DMR 2012). This
report highlights the concerns with regards to potential environmental impacts and
conflicts with radio-astronomy operations, but also acknowledges the potential social and
economic benefits that responsible exploration can have for the region and the country. It
therefore recommends further investigative exploration and research (without actual
hydraulic fracturing), along with the augmentation of the regulatory framework before
any fracturing is allowed to proceed. The Western Cape Government is understandably
cautious about both the unproven potential and uncertain environmental impacts, and
has consequently taken a position to support the national stance that further studies and
proper consultation need to be undertaken before any definitive judgments can be
made.
3.1.4 Nuclear
energy
South Africa has two
commercial nuclear
reactor units at Koeberg,
Cape Town, generating
4% of the national
electricity supply.
The Koeberg plant has
been in operation since 1984. It has a pressurised water reactor design and it boasts the
largest turbine generators in the southern hemisphere. Koeberg is owned and managed
by Eskom and has a total installed capacity of 1800 MW. Low and intermediate level
waste from Koeberg is transported by road in steel and concrete containers to a remote
disposal site at Vaalputs in the Northern Cape. High level waste or spent fuel is stored on
site in special pools equipped with high-density racking (Eskom 2013b).
3.1.5 Renewable energy
The Western Cape is blessed with significant renewable energy resources, specifically in
terms of wind and solar potential, and there is far more energy available in the natural
environment than is required for provincial energy needs. However, not much of this
potential has been harnessed to date. As with the rest of the country, historic
dependencies on coal-fired electricity, practical and administrative obstacles and
concerns about cost-effectiveness are to blame.
Measuring the total amount of renewable energy that is produced off-grid or as
alternatives to the national fuel supply line networks is technically challenging due to the
multitude of data sources. It is therefore more common to report on large scale
contributions of renewable sources to the electricity grid and liquid fuels or gas market.
The 2005 State of Environment Report (DEADP 2005) estimated renewable energy

9 State of Environment Outlook Report for the Western Cape Province
contributing 5.6% to the total electricity production in South Africa (2000 statistics). This
figure was reported by the National Energy Regulator of South Africa as being 8% in 2006
(NERSA 2006).
3.1.5.1 Wind Energy
Current applications of wind energy include water pumping, wind farms for hydroelectric
systems, solar-hydro hybrid systems and distributed power generation, with the small scale
water pump „windpomp‟ structures on farms being a well-known South African image.
Large scale wind prospecting is, however, in its infancy in South Africa and descriptions of
the resource vary from abundant to merely modest. Estimations for the Western Cape
indicate that 2800 MW from Wind Power installations can be accommodated in the
national grid without “immediate challenges” (DEADP 2010). Based on figures from the IRP
2010 (DME 2010), this equates to approximately 6% of the national system capacity
requirement for 2013. The most promising wind power potential is located along the West
Coast, inland (Karoo) and Southern Cape.
Three large turbine based wind energy facilities are of relevance in the Western Cape.
These are the two demonstration farms at Klipheuwel and Darling, and the proposed
commercial scale Sere Wind Farm at Koekenaap.
The 3.2 MW demonstration facility at Klipheuwel in the Western Cape was developed by
Eskom as the first large wind turbine facility in sub-Saharan Africa. The three-year
experiment was designed to test the effectiveness of three types of turbines and the
viability of wind power for large-scale grid applications. Darling Wind Farm was launched
by an independent power producer in 2007 with 5.2 MW capacity shared between four
wind turbines. The City of Cape Town is the off-taker (StatsSA 2012b). The project plans to
increase the number of turbines from the current four to a total of ten, with a final installed
capacity of 13 MW.

State of Environment Outlook Report for the Western Cape Province 10
Eskom is expected to commence with construction of a commercial size wind farm, Sere,
in the Koekenaap / Vredendal area in April 2013 as a preferred bidder for the supply and
installation of the wind turbines was recently confirmed. This facility will have an installed
capacity of 100MW, and consist of 46 turbines rated at 2.3MW each (ESKOM 2011).
Wind energy generation capacity to be created in terms of the national Renewable
Energy Independent Power Producers Programme include four onshore wind power
facilities, namely West Coast 1 (90.8MW), Gouda (135.2MW), Dassiesklip (26.2MW) and
Hopefield (65.4MW) (DoE 2013).
3.1.5.2 Solar Power
Solar energy comprises different categories, the most well known being Solar Photovoltaic
(PV), Concentrated Solar Power (CSP) and Solar Water Heating (SWH). Solar energy can
be directly used to heat water, space, generate electricity and in some cases provide
process heat for industrial activities.
The resource in the Western Cape is very good although not as good as in north western
parts of the country. Averaged irradiance across the province ranges from 1500
kW/m2/pa in the East to over 2000 kW/m2/pa in the West (5 400 - 7 200 MJ/m2/pa) (Figure
5). This is comparable to the areas surrounding the Mediterranean Sea.
Figure 5: Global Horizontal Irradiation: South Africa (SolarGIS © 2013 GeoModel Solar s.r.o.)

11 State of Environment Outlook Report for the Western Cape Province
Large scale solar power generation does not currently exist in the Western Cape, but in
terms of the national Renewable Energy Independent Power Producers Programme four
Solar PV projects have been given the go-ahead by the Department of Energy (DoE
2013). These include facilities in Vredendal (8.8 MW), Aurora (9 MW), Touwsrivier (36 MW)
and in the Swartland (5 MW). Hessequa Municipality already has a 33 kW Solar PV
installation from which the wastewater treatment works outside Riversdale is run.
Ultimately, the goal is to expand the facility to 5 MW capacity.
3.1.5.3 Hydropower
Hydropower installations can either be primary power generation units or they can be
installed as pumped storage units. Primary power is generated where gravity assisted
water flow between higher level reservoirs or catchments and lower release points are
allowed to run through turbines to generate electricity. A pumped storage scheme on the
other hand pumps water from a lower to an upper reservoir using off-peak electricity and
then releases the water to run through turbines to generate supplementary power at times
of peak demand.
High level information on rainfall and topography indicate a reasonable potential for small
scale hydro power within the province (Figure 6). However, the total practically realisable
potential for small scale hydro power in the province is estimated at 20 MW (DEADP 2007).
The only existing ordinary hydropower plant in the Western Cape is at Ceres in the
Witzenberg Municipality, which has a capacity of 1.5 MW and produced 1 082 MWh in
2004 (DEADP, 2007).
Figure 6: Overview of hydropower resources in South Africa (Source: DME/CSIR/Eskom
2002 cited in DEADP, 2007a)

State of Environment Outlook Report for the Western Cape Province 12
The most significant hydroelectric power scheme in the Western Cape is the Steenbras /
Palmiet Pumped Storage Scheme which is located in the Kogelberg Biosphere Reserve.
The scheme plays a dual role of firstly providing peaking power for Eskom and secondly
through its reversible pump turbines, providing water for Cape Town as part of an
Interbasin Transfer Scheme. It has a capacity of about 580 MW.
3.1.5.4 Biomass
Biomass has the potential to contribute to Western Cape energy needs through a wide
range of resources and conversion processes. At present it is primarily used as a cooking
fuel or for space heating in low-income households (DEADP 2007), but large scale
production and use, either for commercial production or distributed micro-generation is
possible.
Bulk biomass energy production typically requires extensive dedicated farming or forestry
activities, but may draw on existing agricultural waste products. It has the potential to
enhance rural economic activity, but also goes hand-in-hand with environmental and
socio-economic concerns such as land degradation or compromised food security.
Further impacts result from the beneficiation of biomass or reprocessing of oils to convert it
into sufficiently energy dense liquid fuels for ordinary application. Biomass is also used for
direct application in the industrial sector as a feedstock for boilers or furnaces.
Domestic use of biomass occurs generally in poor households, where access to electricity
supplied by the national grid is unavailable or unaffordable. Often, over-exploitation of
natural woodlands and unsound harvesting practices lead to serious environmental
problems in many rural areas. Newer technologies such as biomass digesters create
opportunities for meeting domestic energy needs through micro-generation without the
need to resort to excessive wood burning.
3.2 Energy use
An indicator that provides information on the provincial use of energy is presented as a
means to show trends in energy use in the Western Cape Province as well as specific
energy dependencies. Information on energy use is primarily sourced from the recently
completed Energy Consumption and CO2 Emissions Database for the Western Cape
(WCG 2013) but also various other relevant publications.
According to the Energy Consumption and CO2 Emissions Database for the Western Cape
(WCG 2013), energy consumption in the province has grown from 247 742 000 GigaJoule
(GJ) in 2004 to 270 887 000 GJ in 2009 (excluding aviation and marine figures). It should be
noted though that various data uncertainties remain, and there is no consistent collection
and analysis of data, but the overall trend can be taken as indicative.
Figure 7 shows the energy used per district municipality within the Western Cape. Clear
distinctions are evident with Cape Town, as expected, being the heaviest user of energy.
This can be attributed to the fact that the majority of the Western Cape‟s population is
concentrated in Cape Town and surroundings, and it is also here that development is
most extensive. The energy-intense heavy industry of the West Coast (notably the iron and

13 State of Environment Outlook Report for the Western Cape Province
steel and cement/sand industries) brings this otherwise relatively less populated area of
the province in as the second-highest energy consumer.
Figure 7: Energy use per District of the Western Cape (WCG 2013)
In terms of the application of different fuels, energy use in South Africa as a whole is
characterized by a high dependence on historically cheap and abundantly available
coal for industrial application and electricity generation, as well as imported crude oil. As
shown in Figure 8, electricity, coal, petrol and diesel also dominate the mix of fuel
consumed in the Western Cape, in that order (WCG 2013). This demonstrates the
enormous reliance on fossil fuel in the province. Also, considering that only 30% of South
Africa‟s liquid fuels are locally sourced, the high (30%) liquid fuel component of the
Western Cape energy mix represents a dependence on foreign oil imports. This renders
the province vulnerable to disruptions in fairly long supply lines. The analysis also points out
that the direct use of coal in industry contributes substantially to the provincial energy
situation.

State of Environment Outlook Report for the Western Cape Province 14
Figure 8: Energy use by fuel type (WCG 2013)
Reliance on fossil fuels also translates into the release of greenhouse gasses. With aviation
and international marine values included, the energy consumption in the Western Cape
totals 339 117 323 GJ. This equates to 41 303 482 tonnes of carbon dioxide equivalent
(CO2e) (WCG 2013). The Energy Consumption and CO2e Emissions Database (WCG 2013)
states that, at a glance, the Western Cape energy consumption and emissions outputs are
in line with the province‟s relative population and economic size. Table 1 also gives the
figures for the per capita energy use and CO2e emissions for the Western Cape.
Table 1: Key energy use and CO2e emissions Indicators for the Western Cape, 2009
(Source: WCG, 2013)
Indicator Unit of measure Western Cape
2009
Total energy GJ 339 117 323
Total energy related GHG emissions tCO2e 41 303 482
Energy consumption per capita GJ/capita 64
GHG emissions per capita tCO2e/capita 8
Energy consumption per GDP (R‟ mill) GJ/GDP 1 428
GHG emissions per GDP (R‟ mill) tCO2e/GDP 178
In terms of a sectoral breakdown of energy use, transport and industrial applications seem
to be solidly entrenched as the heaviest energy users. The Energy Consumption and CO2
Emissions Database for the Western Cape show that 52% of energy consumption in the

15 State of Environment Outlook Report for the Western Cape Province
province is attributed to the transport sector, followed by industry at 34% (Figure 8). This
compares to 2004 figures 35% and 49% respectively for the sectors. In terms of preferred
energy source, transportation relies heavily on liquid fuels (petrol and diesel) whereas
industry uses coal and electricity by preference.
Across the province the residential/household sector is only responsible for just under 9% of
energy consumption. Together with commerce, this combined built environment energy
consumption consumes some 13% of total energy. However, this contribution is
proportionally larger when considering end use fuel carriers such as electricity on their own
(WCG 2013).
Figure 9: Energy use by sector (WCG 2013)
3.3 Energy intensity
For the purposes of this report, energy intensity refers to the relative amount of energy
required to produce a unit of economic value. The provincial energy intensity in terms of
population and GDP has already been discussed in section 3.2 (Table 1), therefore this
section provides a comparison of the relevant intensity of energy use between the Districts
of Western Cape.
When comparing the energy per GDP between the districts (refer to Figure 10), it can be
seen that the industries of the West Coast render the District particularly energy intensive.
In comparison, the City of Cape Town has much lower energy intensity, as the City‟s
economy is based on service sectors that are relatively less energy intensive. It also
indicates the energy efficiency achieved in this urban area - although it contributes to
74% of the province‟s GDP it accounts for only 60% of the province‟s energy use. The
Central Karoo District has a relatively high energy intensity, but it should be kept in mind
that a large proportion of the energy use within its boundaries is related to traffic passing
through on the national highways (WCG 2013).

State of Environment Outlook Report for the Western Cape Province 16
Figure 10: Energy per GDP for each District of the Western Cape (WCG 2013)
3.4 Domestic energy use
This indicator highlights aspects of domestic consumption. It shows trends in the domestic
use of energy which assists in describing the state of the human environment as an
environmental determinant of human health.
3.4.1 Electricity
The 2005 State of Environment Report showed that 83.5% of the houses in the Western
Cape were electrified (DEADP 2005). However, data from StatsSA (2012a) show that in
2001, at least 88% of houses used electricity for lighting purposes. The Western Cape
remains the best performing province of South Africa in this regard (Figure 11).
Figure 11: Percentages of Electrified Homes per Province 1996-2011 (StatsSA 2012c)
The most current information (from the 2011 census) shows that the current level of
electrification is at 93.4% (Figure 12). The West Coast has the highest rate of connectivity
(94.4%) whilst, as can be expected for a rural District with low population density, the
Central Karoo has the lowest (89.4%). Despite the general increase in connectivity, the

17 State of Environment Outlook Report for the Western Cape Province
proportion of people who use electricity for heating purposes in the Western Cape
decreased (StatsSa 2012a). This is most likely due to the cost of electricity.
Figure 12: Electricity used for lighting, cooking and heating in the Western Cape (StatsSA
2012a)
3.4.2 Alternative fuels
Various alternative fuels are used by households as substitutes for electricity or as primary
energy sources. These include gas (LPG), paraffin, wood, coal (anthracite), animal dung
and small scale solar. Statistics collected during the 2011 census reveal that 7% of lighting
needs, 13% of cooking needs and 21% of heating needs are satisfied through means other
than electricity (StatsSA 2012a). Paraffin is preferred for lighting and heating, whilst gas is
the preferred substitute for cooking purposes. What is concerning is that the burning of
wood, coal and animal dung constitute 1.4% of energy needs for cooking and 5% of
heating needs. Typically, the burning takes place indoors, which means that 22 000 and
85 000 households, respectively, are exposed to indoor air pollution and its associated
health impacts. The collection of biomass for burning also impacts on the environment
directly through deforestation and outdoor air pollution.
Although the use of alternative fuels are commonplace in rural households, it also persists
in newly electrified and/or urbanised households that tend to continue to use fuel wood
for a variety of reasons, including its low price or „free‟ availability, cultural reasons, lack of
money to buy alternative energy fuels, lack of money to buy appliances to run off other
energy forms and general preference (DEADP 2007).
4 IMPACTS
This section provides an overview of the effects of changes in the environment. Driven by
the Drivers and Pressures highlighted in section 2 above, the generation and use of energy
result in impacts which bring about change in the environment such as poor air quality

State of Environment Outlook Report for the Western Cape Province 18
resulting from the emission of gases, contamination of water sources and loss of
biodiversity.
The single most concerning impact is the close relationship that exists between the
generation of energy and the release of greenhouse gases. This is particularly relevant
where fossil fuel derived energy is prevalent. The use of fossil fuels result in the emission of
gases that accumulate in the atmosphere and in varying degrees intensifies the earth‟s
natural greenhouse effect. Based on 2009 figures, a total of 41 303 482 tonnes of CO2e
were released per year as direct result of our need for energy in the province (WCG 2013).
Renewable energy sources, on the other hand, tend to have much lower embodied
environmental footprints due to the inherent carbon neutrality and reduced operational
and maintenance requirements.
The transport sector is the largest consumer of energy in the province, at 52% (WCG 2013).
It is completely reliant on either coal-based electricity or combustion engines that emit
gases that are hazardous to people and
contribute to the greenhouse effect.
However, the sector is calculated to only
contribute 28% of total provincial
greenhouse gas emissions as the use of
liquid fuels has a lower emissions factor
than coal-based electricity (WCG 2013).
The environmental effects of
transportation is especially aggravated on
a local scale through the emission of
combustion gases, because the emissions
occur in close proximity to areas of high
human exposure such as in cities. Energy
use for transport activities furthermore causes impacts on water resources (water used for
power generation and hydrocarbon pollution) and soil (hydrocarbon pollution from
spillages).
Sectors that are more completely dependent on fossil-fuel derived electricity, such as
industry and the built environment, have relatively high contributions to the provincial
GHG emission total. Industry constitutes 36% of the provincial emissions and the built
environment 26% (WCG 2013).
The generation of electricity in South Africa is not only responsible for the bulk of our GHG
emissions, but also goes hand-in-hand with impacts associated with the mining and
beneficiation of minerals. Mining activities cause disturbances in the earth‟s surface and
can result in the loss of surface productivity through contamination or degradation, or the
contamination of water resources through excessive abstraction or polluted mine
drainage. The mining industry in South Africa is also responsible for many toxic by-products,
such as methane, uranium, thorium, and other radioactive and heavy metal
contaminants. In addition, raw materials need to be transported between the extraction
site and the power station, which itself requires energy and extensive infrastructure. In
comparison, solar and wind power generation do not emit harmful gasses since no fuels
are combusted during the generation of electricity. However, the production of

19 State of Environment Outlook Report for the Western Cape Province
generation equipment, installation of infrastructure and operational processes can have
impacts on the environment.
In terms of solar systems, photovoltaic systems do not require any water to create
electricity, but the maintenance of the photovoltaic panels can include cleaning with
water. Solar-thermal technologies on the other hand often require water to generate
steam as part of the generation process, although some of the steam can be condensed
back to water and re-used.
Wind energy systems do not cause water or air emissions and do not produce any kind of
hazardous waste as part of the generation process. Moreover, wind power does not make
use of natural resources like oil or gas and will therefore not cause damage to the
environment through resource transportation and extraction. Additionally, no water is
needed during operation. However, wind power plants do have some effects on the
environment, including potential noise pollution and visual impacts, as well as avian, insect
and bat mortalities.
As indicated previously, the use of alternative fuels in household applications can have
severe implications for human health and the environment, especially where the burning
of biomass or coal is involved. Conversion to cleaner burning fuels such as LPG gas can
improve the efficiency of energy use and reduce the local (indoor) emissions and
pollution. It should however be noted that the use of more efficient forms of energy, such
as electricity, does not necessarily lead to an overall reduction in environmental impact
since the impact remains partly dependent on the total amount of energy that is used. For
example, more efficient energy mediums could be more affordable and therefore lead to
an increase in energy usage.
5 RESPONSES
5.1 National programmes
The Integrated Electricity Resource Plan for South Africa ‐ 2010 to 2030 (IRP 2010) (DME
2010) is currently the most central policy regarding the planned mix of electricity
generation and supply in the country. According to the IRP 2010, an acceptable
„balance‟ between affordability, carbon emissions reductions, uncertainties around new
technologies, water usage, job creation and security of supply, will result in an energy mix
that still relies heavily on coal-based electricity. Nevertheless, large components of the
future capacity requirements will be satisfied through nuclear (25%), renewable energy
(42%) and gas (25%). Demand side management programmes will also be instituted to
reduce the total energy requirements.
With regards to the potential to produce energy from renewable sources, biomass, wind,
solar, small-scale hydro and waste, South Africa can be seen as very gifted, though these
resources remains largely unexploited. Momentum is building at a national level to make
use of the opportunities in the renewable energy field to supplement the national energy
supply network and empower individual households through low cost energy generation
solutions. Several important strategic initiatives have been launched in support of the

State of Environment Outlook Report for the Western Cape Province 20
development of wind power. The first is a project by the Department of Energy to
generate a Wind Atlas of South Africa. This atlas models a generalised wind climate at
100m above ground for a 5km x 5km grid covering the Northern, Western and Eastern
Cape. The information is available for application from the CSIR as one of the project
partners (www.wasa.csir.co.za).
The erstwhile Department of Minerals and Energy published a Renewable Energy White
Paper in 2003 which stipulated a target of 10 000 gigawatt hours (GWh) to be produced
from renewable energy by 2013. This White Paper has, however, not been updated as a
stand-alone document, but instead was superseded by integrated electricity supply
planning that included renewable energy as a component. Specifically, the IRP 2010
(DME 2010) makes provision for targets for different types of renewable energy as part of
the planned electricity mix for the country. According to the IRP 2010, renewable energy
will contribute 18.2 GW of new capacity for electricity generation by 2030 (about 42%).
Wind will contribute 8.4 GW to this total; solar PV 8.4 GW; concentrated solar 1 GW and
other renewables 0.4 GW.
The most important programme for renewable energy generation is the Renewable
Energy Independent Power Producer Procurement Programme administrated by the
Department of Energy (www.ipprenewables.co.za). Under this programme, private power
producers independent of the parastatal Eskom are offered the opportunity to generate
a portion of the national target for renewable energy as stated in the IRP 2010. The
programme is currently in its third bidding window (of a potential five), with 1 416 MW and
1 044 MW respectively allocated during the first two windows and an additional 1 266 MW
being offered in window 3. Although the total generation capacity is limited, the
programme is aimed at stimulating the local renewable energy industry and promoting
sustainable development and growth. At current prices for electricity generation from new
build projects, it appears as if it makes economic sense to push for investment in
renewable technologies. It is calculated that new coal fired power (Madupi & Kusile) will
cost 97c/kWh to generate, as compared to 89c/kWh to procure wind power from
Independent Power Producers (SAREC 2013).
The Koeberg Nuclear Power Station, one of only a handful of nuclear power stations on
the African continent, generates about 4% of total energy in South Africa. The use of
nuclear technology for energy generation is governed by the Nuclear Energy Policy (DME
2008), and currently Eskom (as national electricity provider) is investigating the possibility of
building new nuclear power stations, with two of the potential sites under investigation
being in the Western Cape (Bantamsklip and Koeberg). Under the IPR 2010, 9 600 MW of
new nuclear power capacity will be developed by 2030, constituting 25% of the new build
programme (DME 2010). This will undoubtedly have a major impact on the carbon
intensity of the county‟s energy sector, as nuclear is considered much „cleaner‟ than fossil
fuel based generation.
The Department of Energy‟s Energy Efficiency Strategy (draft second review 2012) sets
targets and guides the implementation of energy and demand savings through by
independent measurement and verification professionals. The strategy includes mass
energy efficiency programme roll-outs and individual sectoral strategies for energy
efficiency gains (DME 2012). A related initiative to promote energy efficiency is the

21 State of Environment Outlook Report for the Western Cape Province
amendment of sections 12(i) and 12(l) of the Income Tax Act, 1962 (Act No. 58 of 1962) to
incentivize companies to minimize electricity use.
Realising that transportation plays a large role in energy efficiency, the Energy Efficiency
Strategy includes specific targets for efficiencies for the transport sector, and alludes to
the carbon tax being imposed on less fuel efficient vehicles. The intended outcome is a
greater uptake of public transport.
5.2 Western Cape
The Western Cape Government has recognised the need for a more sustainable energy
sector, and in September 2010, the Western Cape Department of Environmental Affairs
and Development Planning (DEADP) published a White Paper on Sustainable Energy for
the Western Cape Province. The 2014 Sustainable Energy Vision for the Western Cape is
presented as:
“The Western Cape has a secure supply of quality, reliable, clean and safe energy, which
delivers social, economic and environmental benefits to the Province’s citizens, while also
addressing the climate change challenges facing the region and the eradication of
energy poverty” (DEADP 2010).
The White Paper follows on the Proposed Renewable Energy Plan of Action (2007),
Sustainable Energy Strategy and Programme of Action (2007) and Draft Integrated Energy
Strategy (2007). In order to achieve the vision of sustainable energy supply that moves
away from a dependency on fossil fuel based energy, energy demand management
programmes will be pursued, as well as a mix of renewable energy generation and clean
energy technologies. This will all be supported through the necessary legal, financial,
research and skills development initiatives (DEADP 2010).
In terms of the bulk generation of renewable energy,
the Western Cape is particularly suited to wind and
solar power technologies. DEADP has developed a
Strategic Environmental Assessment for the
Placement of Wind Energy Facilities, which mapped
the entire Western Cape in terms of environmental
and planning considerations in order to identify
preferred areas for the placement of wind energy
facilities. This tool can be used by developers and
officials responsible for EIA authorisations to support
decision-making. DEADP drives additional projects
which aim to stimulate investment in wind power in
the Western Cape through the removal of
institutional and administrative obstacles. This
includes a regulatory process guide and an
electricity grid assessment.
The province will, however, not be able to move away from fossil fuels entirely. Bulk
electricity will still be sourced from the main supply grid, whilst the industrial and mining
State of Environment Outlook Report for the Western Cape Province 22
hub in Saldanha Bay is envisaged as a key development point for the near future.
Specifically, the Saldanha Industrial Development Zone has been earmarked for the
development of an Oil and Gas Cluster, offering maintenance and repair as well as
fabrication services to external customers (oil drilling platforms and the like) and
communal and supply services to internal clients (SBIDZ 2012).
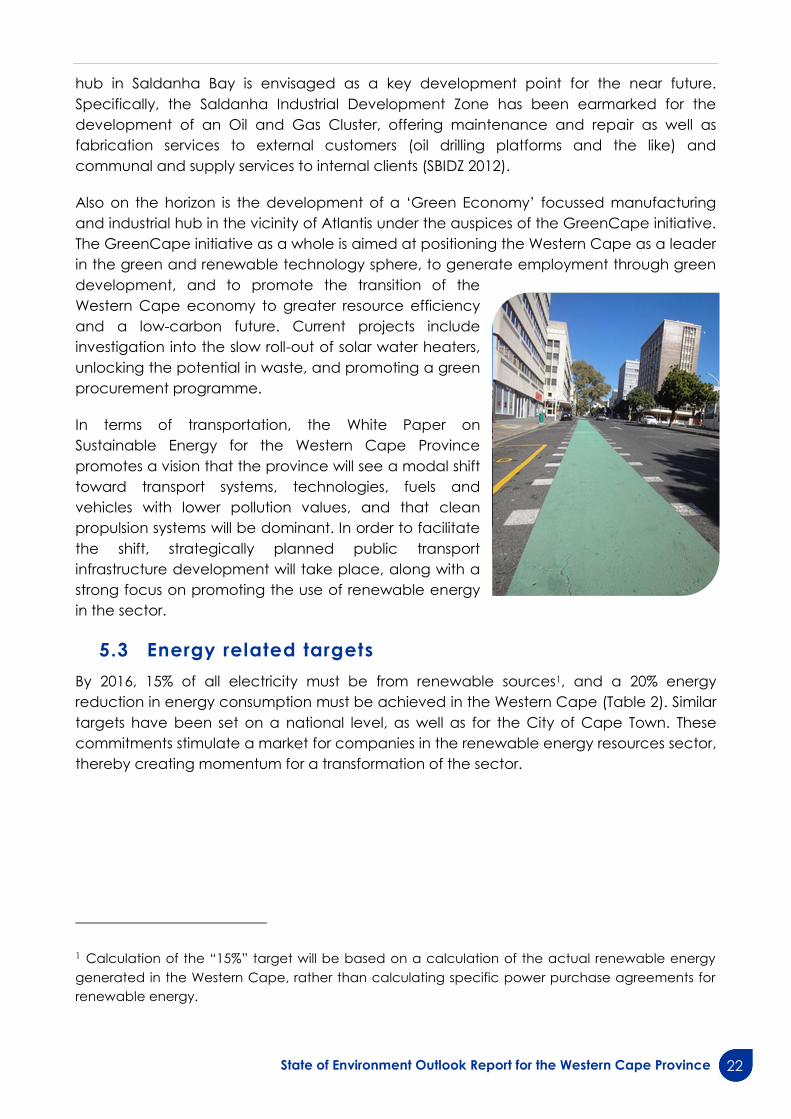
Also on the horizon is the development of a „Green Economy‟ focussed manufacturing
and industrial hub in the vicinity of Atlantis under the auspices of the GreenCape initiative.
The GreenCape initiative as a whole is aimed at positioning the Western Cape as a leader
in the green and renewable technology sphere, to generate employment through green
development, and to promote the transition of the
Western Cape economy to greater resource efficiency
and a low-carbon future. Current projects include
investigation into the slow roll-out of solar water heaters,
unlocking the potential in waste, and promoting a green
procurement programme.
In terms of transportation, the White Paper on
Sustainable Energy for the Western Cape Province
promotes a vision that the province will see a modal shift
toward transport systems, technologies, fuels and
vehicles with lower pollution values, and that clean
propulsion systems will be dominant. In order to facilitate
the shift, strategically planned public transport
infrastructure development will take place, along with a
strong focus on promoting the use of renewable energy
in the sector.
5.3 Energy related targets
By 2016, 15% of all electricity must be from renewable sources1, and a 20% energy
reduction in energy consumption must be achieved in the Western Cape (Table 2). Similar
targets have been set on a national level, as well as for the City of Cape Town. These
commitments stimulate a market for companies in the renewable energy resources sector,
thereby creating momentum for a transformation of the sector.
1 Calculation of the “15%” target will be based on a calculation of the actual renewable energy
generated in the Western Cape, rather than calculating specific power purchase agreements for
renewable energy.

23 State of Environment Outlook Report for the Western Cape Province
Table 2: Energy Targets for the City of Cape Town, Western Cape Province and National
Government
ENERGY AND CARBON EMISSIONS TARGETS FOR THE CITY OF CAPE TOWN, WESTERN CAPE PROVINCE
AND NATIONAL
CITY OF CAPE TOWN
WESTERN CAPE
PROVINCE NATIONAL
Sources
- City of Cape Town
Environmental
Agenda (CoCT 2009)
- Moving Mountains:
Cape Town’s Action
Plan for Energy and
Climate Change
(CoCT 2011a)
- State of Energy and
Energy Futures
Report (CoCT 2011b)
- Integrated
Development Plan
(CoCT 2012)
Provincial Strategic
Objectives : Energy
Work Group Targets
- White Paper on Renewable
Energy Policy (DME 2003)
- Draft Energy Efficiency
Strategy (DoE 2012)
Energy supply
and
consumption
- Renewable energy
share equal to 10% of
energy consumed by
2020 (CoCT 2011a,
2011b, 2012)
- By 2014, reduce
electricity
consumption by 10%
from 2007 levels
(CoCT 2009)
- By 2014, a 20%
reduction in
energy
consumption
- 15% of the
electricity
consumed must
be from
renewable
sources by 2016
- 12% final energy demand
reduction by 2015 (DoE
2012)
- 10 000GWh of renewable
energy contribution to final
energy consumption by
2013, to be produced
mainly from biomass, wind,
solar & small scale hydro
(DME 2003)
Government
operations
- 10% reduction in
energy consumption
by 2012 (City of
Cape Town 2011a &
2011b)
- 30% electricity
reduction in all
provincial
buildings
GHG Emissions
- Per capita carbon
footprint reduced to
5 tonnes CO2e by
2014 (CoCT 2009)
- CO2 emissions to peak
between 2020-2025 (DME
2003)
- CO2 emissions reduced to
34% below expected levels
by 2020, and 42% by 2025
(DME 2003)
5.4 Policy, tools and legislation
The creation of a regulatory and policy environment for the development of a renewable
energy sphere and an ongoing improvement in the efficiency of energy use commenced
with the publication of the White Paper on Energy Policy for the Republic of South Africa
(1998). The White Paper set the framework for energy policy and planning and made
provision for:

State of Environment Outlook Report for the Western Cape Province 24
The development of new and renewable sources of energy;
Adjustment of electricity market structures to achieve effective forms of
competition;
Regulations which promote a cost-of-supply approach to electricity pricing for non-
domestic consumers; and
Investigations into an environmental levy on energy sales to fund the development
of renewable energy, energy efficiency, and sustainable energy activities.
Since the publication of the White Paper, a number of policies, regulations and
implementation programmes came into effect. This includes the Integrated Electricity
Resource Plan for South Africa ‐ 2010 to 2030 (IRP 2010), Eskom‟s National Efficient Lighting
Programme, the Renewable Energy Independent Power Producer (REIPP) Procurement
Programme, Eskom‟s Medium Term Power Purchase Programme, the National Energy
Efficiency Strategy (2012). In the Western Cape, this was mirrored in the form of a range of
similar policy documents and regulations. Responses in the form of policies, tools and
legislation across all scales applicable to this theme are listed in the summary table below:
Table 3: Summary of policy, tools and legislation related to Energy
National
Responses
1998 The White Paper on Energy Policy for the Republic of South Africa.
2003 The White Paper on Renewable Energy
2003 Electricity Basic Services Support Grant (Free Basic Electricity) Policy
2003 The Integrated Energy Plan
2007 Free Basic Alternative Energy Policy (Household Energy Support
Programme)
2008 The National Energy Act (Act 34 of 2008)
2008 National Energy Security Master Plan: Liquid Fuels
2010 National Strategy for Sustainable Development and Action Plan – 2011-
2014
2010 Integrated Electricity Resource Plan for South Africa ‐ 2010 to 2030 (IRP
2010)
2011 National Climate Change Response White Paper
2011 Renewable Energy Independent Power Producer Procurement
Programme
2011 National Development Plan 2030
2012 Draft National Energy Efficiency Strategy (Second Review July 2012)
Provincial
Responses
2007 Proposed Renewable Energy Plan of Action for the Western Cape.
Resource Assessment, Scenarios, Proposed Objectives and Actions. A
Component of the Provincial Sustainable Energy Strategy
2007 Sustainable Energy Strategy for the Western Cape
2010 White Paper on Sustainable Energy
2013 Energy Consumption and CO2 Emissions Database for the Western Cape
Local Authority
Responses
2006 City of Cape Town Energy and Climate Change Action Plan
2006 City of Cape Town Framework for Adaptation to Climate Change
2009 Fleet Greening Framework
2011 City of Cape Town State of Energy and Energy Futures Report
2011 City of Cape Town Smart Living Handbook
2011 City of Cape Town – Moving Mountains, Energy and Climate Change Plan
of Action
2011 Eden District Demand Side Energy Awareness Program

25 State of Environment Outlook Report for the Western Cape Province
2011 Energy Scenarios for Cape Town to 2050
2013 Sustainable Energy Plans as part of the Provincial Municipal Support
Programme
6 CONCLUSION
O U T L O O K : S T A B L E / D E C L I N I N G
While the Western Cape‟s energy supply remains dominated by conventional
technologies and fossil fuels, there is a concerted move from non-renewable to
renewable energy, with firm targets set and various projects or programmes underway to
stimulate change. The challenge is, however, to put the planning into practice during the
coming years.
In comparison to the other provinces of South Africa, the Western Cape remains at a
good standard in terms of electrified homes, with the majority having access to electricity.
While the Western Cape population increased from 2001 to 2011 by 29%, there was also
an increase in electrified homes, from 86% to 93%, which renders it the best performing
province in this regard. Nevertheless there still remains a significant portion of the
population within the region that either do not have access to electricity supplied by the
national grid or that cannot afford electricity. These people typically resort to the use to
biomass for energy needs, which comes with a range of associated undesirable
consequences.
A particular focus for the short term should be the aggregation of accurate data on
energy generation and usage, to compensate for a dearth of actual usage data on a
national scale. In particular, information on independent generation of renewable energy
must be assembled in order to paint a clear picture of the energy sector in the Western
Cape. Attention should also be focussed on adjustment of policies, regulation and
infrastructure related to private microgeneration to supplement to the main electricity
supply grid. The current regulatory environment discourages such contributions, and
planning for large scale infrastructure roll-out such as smart metering must commence.
The findings of the Energy chapter can be summarised as an overall outlook for the future
as potentially stable or declining, depending on a number of connected factors. Table 4
contains a brief summary of the key pressures, impacts, challenges, progress and
recommended critical areas for action. Table 5 contains the anticipated changes or
outlook for the future of Energy, based on the findings in this chapter. All of these aspects
have been identified in the chapter, and should be referred to in more detail for a
complete understanding.
State of Environment Outlook Report for the Western Cape Province 26
Table 4: Summary of key aspects identified in the chapter
Aspect Summary of key points
Pressures Population growth
Growing consumerism
3% economic growth
Impacts Carbon footprint
Competition for land
Air quality
Displaced impacts of generation, e.g. mining, power station,
transmission
Challenges Energy dependencies, e.g. liquid fuels for transport
Grid-based electricity supply
No information on private sector initiatives
Role of - and impact of natural gas
Mandates of government
Progress Green economy initiatives
GreenCape
IPP facilitation
Critical
areas for
action
Drive renewable energy development
Built environment and urban infrastructure innovations – rethink
energy provisions
Gather information on private sector initiatives
Address energy intensity and dependencies
Improve understanding of natural gas potential and impact
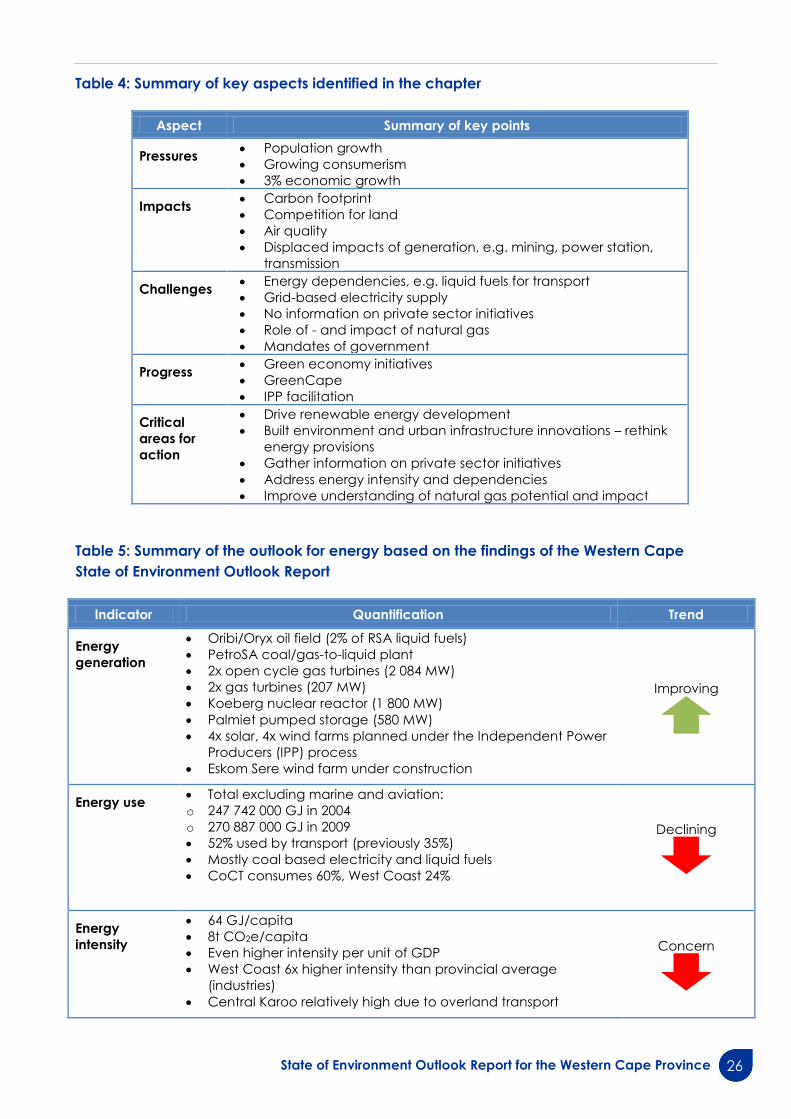
Table 5: Summary of the outlook for energy based on the findings of the Western Cape
State of Environment Outlook Report
Indicator Quantification Trend
Energy
generation
Oribi/Oryx oil field (2% of RSA liquid fuels)
PetroSA coal/gas-to-liquid plant
2x open cycle gas turbines (2 084 MW)
2x gas turbines (207 MW)
Koeberg nuclear reactor (1 800 MW)
Palmiet pumped storage (580 MW)
4x solar, 4x wind farms planned under the Independent Power
Producers (IPP) process
Eskom Sere wind farm under construction
Improving
Energy use Total excluding marine and aviation:
o 247 742 000 GJ in 2004
o 270 887 000 GJ in 2009
52% used by transport (previously 35%)
Mostly coal based electricity and liquid fuels
CoCT consumes 60%, West Coast 24%
Declining
Energy
intensity
64 GJ/capita
8t CO2e/capita
Even higher intensity per unit of GDP
West Coast 6x higher intensity than provincial average
(industries)
Central Karoo relatively high due to overland transport
Concern
27 State of Environment Outlook Report for the Western Cape Province
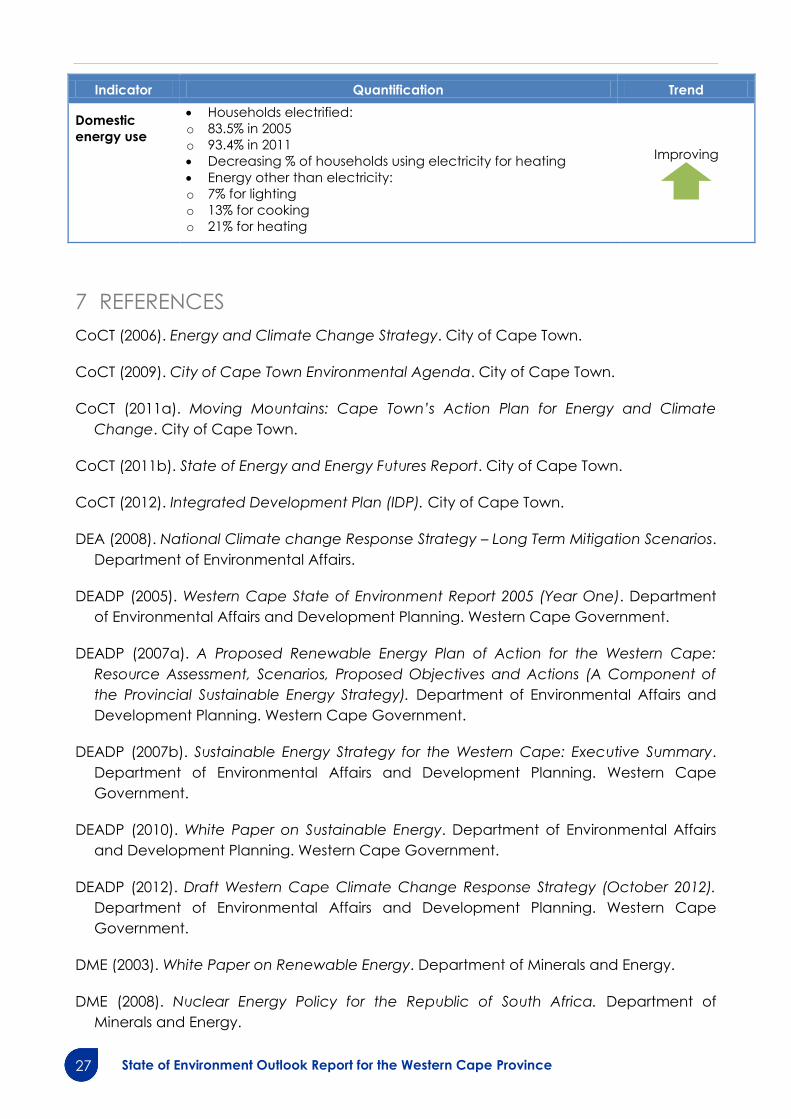
Indicator Quantification Trend
Domestic
energy use
Households electrified:
o 83.5% in 2005
o 93.4% in 2011
Decreasing % of households using electricity for heating
Energy other than electricity:
o 7% for lighting
o 13% for cooking
o 21% for heating
Improving
7 REFERENCES
CoCT (2006). Energy and Climate Change Strategy. City of Cape Town.
CoCT (2009). City of Cape Town Environmental Agenda. City of Cape Town.
CoCT (2011a). Moving Mountains: Cape Town’s Action Plan for Energy and Climate
Change. City of Cape Town.
CoCT (2011b). State of Energy and Energy Futures Report. City of Cape Town.
CoCT (2012). Integrated Development Plan (IDP). City of Cape Town.
DEA (2008). National Climate change Response Strategy – Long Term Mitigation Scenarios.
Department of Environmental Affairs.
DEADP (2005). Western Cape State of Environment Report 2005 (Year One). Department
of Environmental Affairs and Development Planning. Western Cape Government.
DEADP (2007a). A Proposed Renewable Energy Plan of Action for the Western Cape:
Resource Assessment, Scenarios, Proposed Objectives and Actions (A Component of
the Provincial Sustainable Energy Strategy). Department of Environmental Affairs and
Development Planning. Western Cape Government.
DEADP (2007b). Sustainable Energy Strategy for the Western Cape: Executive Summary.
Department of Environmental Affairs and Development Planning. Western Cape
Government.
DEADP (2010). White Paper on Sustainable Energy. Department of Environmental Affairs
and Development Planning. Western Cape Government.
DEADP (2012). Draft Western Cape Climate Change Response Strategy (October 2012).
Department of Environmental Affairs and Development Planning. Western Cape
Government.
DME (2003). White Paper on Renewable Energy. Department of Minerals and Energy.
DME (2008). Nuclear Energy Policy for the Republic of South Africa. Department of
Minerals and Energy.

State of Environment Outlook Report for the Western Cape Province 28
DME (2010). Executive Summary of the Draft Integrated Electricity Resource Plan for South
Africa ‐ 2010 to 2030 (IRP 2010). Department of Minerals and Energy.
DMR (2009). Developments in the Economic Contribution of Hydrocarbons, Natural Gas
and Coal. DMR Annual Report (Report R78/2009). South African National Department of
Minerals and Energy. Pretoria.
DMR (2012). Report on Investigation of Hydraulic Fracturing in the Karoo Basin of South
Africa. Department of Mineral Resources.
DoE (2010). South African Energy Synopsis, 2010. Department of Energy.
DoE (2012). Draft Second Review of the Energy Efficiency Strategy. Department of Energy.
DoE (2013). Renewable Energy Independent Power Producer Procurement Programme.
Department of Energy. www.ipprenewables.co.za (January 2013).
EIA (2011). World Shale Gas Resources: An Initial Assessment of 14 Regions Outside the
United States. Energy Information Administration. US Department of Energy. Washington.
ESKOM (2011). COP 17 Fact Sheet: Renewable Energy: Sere wind farm.
http://www.eskom.co.za/content/Sere%20Wind.pdf. (March 2013).
ESKOM (2013a). Fact sheet: Ankerlig and Gourikwa Gas Turbine Power Stations.
www.eskom.co.za (October 2013).
Eskom (2013b). Acacia Power Station. www.eskom.co.za (January 2013).
GCIS (2012). South Africa Yearbook 2011/2012. Government Communications and
Information System.
IEA (2008). Worldwide Trends in Energy Use and Efficiency: Key Insights from IEA Indicator
Analysis. International Energy Agency.
Jiang L & Hardee K (2011). How do Recent Population Trends Matter to Climate Change?
Population Research and Policy Review. Volume 30, pp. 287–312.
Modi V, McDade S, Lallement D & Saghir J (2005). Energy Services for the Millennium
Development Goals. World Bank: New York, NY.
NERSA (2006). 2006 Electricity Supply Statistics for South Africa. National Energy Regulator
of South Africa.
NPC (2011). National Development Plan 2030: Our Future – Make it Work. National
Planning Commission.
Petroleum Agency of SA (2010). Petroleum Exploration in South Africa: Information and
Opportunities.

29 State of Environment Outlook Report for the Western Cape Province
Petroleum Agency of SA (2013). Petroleum Exploration and Production Activities in South
Africa. Map produced by the Petroleum Agency of SA. www.petroleumagencysa.com
(January 2013).
PetroSA (2013). Products and Sales: Crude. www.petrosa.co.za (January 2013).
SAREC (2013). Submission to NERSA: Eskom MYPD 3 application. South African Renewable
Energy Council. www.nersa.org.za (February 2013).
SBIDZ (2012). Application for IDZ Designation and Operator Permit for the Saldanha Bay
Industrial Development Zone. Information Document for Government Gazette Notice.
The Saldanha Bay IDZ Licencing Company (Pty) Ltd.
StatsSA (2012a). Census 2011: Municipal report – Western Cape. Statistics South Africa,
www.statssa.gov.za (January 2013).
StatsSA (2012b). Energy Accounts for South Africa: 2002–2009. Statistics South Africa.
StatsSA (2012c). Census 2011: Provinces at a Glance. Statistics South Africa. Pretoria.
WCG (2012). Provincial Economic Review & Outlook 2012. Western Cape Government
Provincial Treasury.
WCG (2013). Energy Consumption and CO2 Emissions Database for the Western Cape.
Western Cape Government.

State of Environment Outlook Report for the Western Cape Province 2
Department of Environmental Affairs and Development Planning
Leeusig Building, 3rd Floor, 1 Dorp Street, Cape Town, 8001
Private Bag X9086, Cape Town, 8000
Telephone: +27 (0)21 483 4091 / Facsimile: +27 (0)21 483 3016
Email: [email protected]