State of Downtown Denver 2018sodd.downtowndenver.com/wp-content/uploads/2018/05/State-of... ·...
15
2018 State of Downtown Denver
Transcript of State of Downtown Denver 2018sodd.downtowndenver.com/wp-content/uploads/2018/05/State-of... ·...

2018State of Downtown Denver

“With the abundance of talent in Denver, we know it’s a perfect fit.”
– James Quarles, CEO, Strava
downtown residential population has tripled
since 2000
133,500 downtown employees, an all
time high
$2.3 billion of investment through developments in
the pipeline
39.3% of downtown employees commute
by transit
tech startups formed over the past three
years
3.3% retailvacancy rate in
Downtown Denver
68% of downtown residents have a bachelor’s degree
or higher
45,000 collegestudents in Downtown
Denver
4,525 residentialunits in the
pipeline
265
Highlights2018 State of Downtown Denver
74% increase in tech employment since
2010
average hoteloccupancy in Downtown
Denver
79%
Table of Contents01 Key Facts
02 Year in Review
14 Residents
05 Rankings
06 Development
08 Office Market
10 Talent
12 Mobility
16 Retail
18 Public Space
20 Tourism
22 Benchmarking
Produced by the Downtown Denver Partnership, a non-profit business organization dedicated to building an economically powerful center city.
downtowndenver.com
1
Produced by the Downtown Denver Partnership

Year in ReviewDowntown Denver enjoyed a record-setting year in 2017. This growth and prosperity is driven by the Downtown Denver Partnership’s vision and strategy to build an economically powerful center city.
Record-Setting YearThe rise of Downtown Denver continued throughout 2017 and the first half of 2018, establishing record highs for employment, residents, hotel occupancy, and tech startup formation. City builders throughout Denver have supported investments that are providing an extraordinary return—investments in strategic planning, transit, arts and culture, technology, infrastructure, parks and recreation, conventions and visitors have all created an environment that has propelled our economically powerful center city forward.
Highlights from the 2018 State of Downtown Report include:
Downtown’s residential population has tripled since 2000, with nearly 23,000 people now living downtown.
Employment downtown reached a record-high of 133,478 people, which is up 2.5% from last year.
Over $1.35 billion in new development was completed in 2017 and early 2018, with another $2.26 billion under construction or planned.
Retail downtown experienced a solid growth year, with retail sales tax collections up 6.4% year-over-year.
Hotel performance is achieving modern day records with an average 79% occupancy rate and $186 average daily room rate for downtown hotels in 2017.
Technology employment is up 74% since 2010 with 626 technology businesses located in Downtown Denver.
2 3
DENVER
UNION
STATION
LAFA
YET
TE S
T
E SPEER BLVD
E 19TH
GIL
PIN
ST
W
E 20TH AVE
FRA
NK
LIN
ST
HIG
H S
TW
ILLI
AGIL
PIN
ST
E 11TH AVE
E 30TH AVE
HU
MB
OLD
T ST
VIN
E ST
RA
CE
ST
LAFA
YET
TE S
T
GA
YLO
RD
ST
PLATTE ST
GIL
PIN
ST
GIL
PIN
ST
HIG
H S
T
WIL
LIA
MS
ST
GILP
IN ST
W COLFAX AVE
FRA
NK
LIN
ST
30TH ST
E 18TH AVE
HU
MB
OLD
T ST
ZU
NI S
T
FED
ERA
L B
LVD
SAN
TA FE D
R
E 24TH AVE
E 25TH AVE
MA
RIO
N S
TM
AR
ION
ST
HU
MB
OLD
T ST
HU
MB
OLD
T ST
16TH ST MALL
E 35TH AVE
E 29TH AVE
E 34TH E BRUCE
E 36TH
E 37TH AVE
FRA
NK
LIN ST
WIL
LIA
MS
STW
ILLI
AM
S ST
HIG
H S
TH
IGH
ST
GR
AN
T ST
E 16TH
W COLFAX AVE
BLAKE ST
E 14TH AVE
E 13TH AVE
VIN
E ST
VIN
E ST
VIN
E ST
VIN
E ST
VIN
E ST
RA
CE
STR
AC
E ST
RA
CE
STR
AC
E ST
PEC
OS
ST
38TH AVE
N SPEER
W 8TH AVE
BRIGHTON B
LVD
E 31ST AVE
20TH
LINC
OLN
STPARK AVE
E 8TH AVE
E 6TH AVE
DO
WN
ING
ST
CHAMPA
ST
SPEER
BR
OA
DW
AY
Gates Crescent
Park
JeffersonPark
Centennial
Gardens
City ofCuernavaca
Park
RudePark
LincolnPark
CommonsPark
CivicCenter
Park
CivicCenter
Park
20TH AVE
38TH ST
E 6TH AVE
CENTRALPLATTE VALLEY
HIGHLAND
JEFFERSONPARK
LODO
BALLPARK
RINO
CURTIS PARK/FIVE POINTS
UPTOWN
CAPITOLHILL
CENTRALBUSINESSDISTRICT
AURARIA
SUN VALLEY
GOLDEN
LA ALMA/LINCOLN PARK
TRIANGLE
25
BOUNDARYLEGEND:
CENTER CITYNEIGHBORHOODBOUNDARY
DOWNTOWNDENVER BOUNDARY
All data in this report uses the Downtown Denver boundary, unless otherwise noted.
> 2007 Downtown Area Plan Mid-Point Reflection
The 2007 Downtown Area Plan set forth a 20-year vision to make Downtown Denver one of the most livable places in the world. Ten years into the plan, the next generation of downtown leaders are marking its mid-point with a determination to keep the plan relevant with focused energy for the next ten years. To achieve a vibrant, economically healthy, growing and vital downtown, Denver is showing a sustained effort in each of the plan vision elements, Prosperous, Walkable, Diverse, Distinctive, and Green. This continued effort reflects downtown’s commitment to planning with a purpose, building our center city, and making meaningful impact.
+
+
+
+
+
+
Produced by the Downtown Denver Partnership

1. Austin, TX2. Colorado Springs, CO3. Denver, CO4. Des Moines, IA5. Fayetteville, AR
Third best place to live in the U.S.3 - US News and World Report, 2018
1. Denver, CO2. Washington, D.C.3. Philadelphia, PA4. Boston, MA5. Portland, OR
Highest increase inskilled labor1 - JLL, 2018
1. Denver, CO2. Seattle, WA3. Houston, TX4. Dallas, TX5. Riverside, CA
Top metro for small business employment 1 - Paychex, 2018
1. Portland, OR2. Raleigh, NC3. Seattle, WA4. Denver, CO5. Des Moines, IA
Fourth best place forbusiness and careers 4 - Forbes, 2017
1. Washington, D.C.2. Minneapolis, MN3. Sacramento, CA4. Denver, CO5. San Francisco, CA
Fourth best city for working women 4 - MagnifyMoney, 2018
1. Los Angeles, CA2. Austin, TX3. Chicago, IL4. Denver, CO5. Seattle, WA
Fourth most exciting foodcity in America4 - Zagat, 2018
1. San Jose, CA2. San Francisco, CA3. Austin, TX4. Seattle, WA5. Denver, CO
Fifth best economy among large US cities 5 - Business Insider, 2018
1. Austin, TX2. Charlotte, NC3. Denver, CO4. Seattle, WA5. Nashville, TN
Third fastest growinglarge city3 - WalletHub, 2018
> Rankings
4 5Photo Credit: Keri Geha
Produced by the Downtown Denver Partnership

DevelopmentWith record setting numbers of downtown jobs, residents, and visitors, developers are finding downtown a prime location for new investment, with $2.3 billion of projects in the pipeline.
6
ResidentialUnits Added
OfficeSF Added
HotelRooms Added
6,236
52
Leads tocapacity for
Leads tocapacity for
Leads tocapacity for
7,700NEW DOWNTOWN
RESIDENTS
3,807,514
13,400NEW DOWNTOWN
EMPLOYEES
1,9133,807,514
680,000NEW DOWNTOWNVISITOR NIGHTS
projects completed in 2017 & 2018, under
construction, or planned
(Estimated) (Estimated) (Estimated, annual)
7
“ Denver continues to see strong demand from capital investors nationally and now globally. We see this demand continuing and look forward to Denver’s continued rise as a destination for investment capital.
– Mark Katz Senior Managing Director, HFF
> Building for Growth
In 2017 and early 2018, 17 projects were completed in Downtown Denver, totaling $1,352,880,000 in investment and adding 1,711 residential units, 1,141 hotel rooms, and 1.1 million square feet of office.
As of mid-2018, there are 27 projects under construction and 8 planned for development in Downtown Denver, totaling $2,260,160,000 of investment and adding 4,525 residential units, 772 hotel rooms, and 2.7 million square feet of office to Downtown Denver.
The largest office project completed in the past year was Hines’ 1144 Fifteenth Street, a 40-story, 670,000 square foot, spec office tower that was nearly fully leased at opening in spring 2018.
The largest residential project completed in the past year was Holland Partner Group’s Union, adding 579 apartments adjacent to Denver Union Station and anchored by a flagship Whole Foods Market.
The largest hotel project completed in the past year was White Lodging’s Le Meridien/AC Hotel, featuring 495 new hotel rooms, 12,000 square feet of meeting and event space, and an outdoor rooftop bar.
+
+
+
+
+
$4.3 Billion Invested Over 5 Years
2014 2015 2016 2017 2018 (projected)
$975
M
$742
M
$280
M
$940
M$1
.5B
Photo Credit: Ryan Dravitz
Produced by the Downtown Denver Partnership
$4.4 Billion Invested Over 5 Years

Office MarketA downtown office location provides exceptional access to our regional talent pool and mobility options, driving 2.5% employment growth year-over-year and attracting a steady stream of business expansions.
Employment in Downtown Denver is at an all-time high of 133,478, a 2.5% year-over-year increase, compared to 1.9% year-over-year increase metro-wide and a 1.2% increase nationwide.
Downtown Denver has a total of 38,000,000 square feet of office space, up over 2% year-over-year.
While vacancy rates have increased slightly over the past few years to 11.4%, average lease rates have held steady at around $33/sf.
Downtown’s largest sectors are Professional/Business Services (31% of total employment), Government (19%), Leisure/Hospitality (16%), Financial Activities (12%), and Natural Resources/Construction (7%).
+
+
+
8
63%Growth in tech
companies from2010 to 2017
People are employed by high tech companies in Downtown Denver
10,000+
Increasing Employment in Tech Industry
2013 2014 2015 2016 2017
10,000
12,000
8,000
6,000
4,000
2,000
Increase in tech employment in Downtown
Denver since 2010
74%
Tech employment represents 8% of total downtown
employment
Definition of "technology sector" follows NAICS codes for businesses in the high tech sector as defined by the Colorado Technology Association. Data from the Quarterly Census on Workforce and Wages.
Increasing Technology Business Formation
7+
209
6
46
5
50
4
56
3
70
22017
2010
94
1
101
147 27 25 43 38 47 57
{{
626 tech businesses in
Downtown Denverin 2017
384 tech businesses in
Downtown Denverin 2010
Years inbusiness
9
Total Downtown Employment
’10 ’11 ’12 ’13 ’14 ’15 ’16 ’17
130K
135K
125K
120K
115K
110K
105K
100K
Recent Relocations and ExpansionsCompanies that have announced a headquarters relocation or new office in Downtown Denver this past year include:
• Accelo• Apple
• ChannelAdvisor
• Accenture• ALPS Fund Services• Anadarko Petroleum• Anthem Blue Cross Blue Shield• CenturyLink
• Comcast• DaVita HealthCare Partners• Deloitte LLP• Encana• Gates Corporation
• Hyatt Regency Hotel at the Colorado Convention Center• KPMG LLP• Mortenson Company • Sheraton
• TIAA• Transamerica Investments & Retirement• US Bank• Vertafore
• Wells Fargo• Xcel Energy
• DTT Surveillance
• Marketo
• Mavrck
• Mercer Advisors
• Mindflash
• RLH Corp.
• Strava
• Switchfly
• Tapingo
• Thanx
• Vertafore
• Xactly
Largest Downtown Denver Employers*
> Technology Hub
+
*list includes private, for-profit employers only
Downtown Denver Office Market Trends
1Q
-15
2Q
-15
3Q
-15
4Q
-15
1Q
-16
2Q
-16
3Q
-16
4Q
-16
1Q
-17
2Q
-17
3Q
-17
4Q
-17
Direct Vacancy Rates Direct Average Lease Rates (Per Square Foot)
$35
$25
$30
$20
16%
11%
6%
“ Denver is geographically central to our business and will be a great location for our new headquarters and employees, offering a high quality of life, affordability, and access to premium cultural and recreational activities.
– Dave Welling, CEO, Mercer Advisors
Produced by the Downtown Denver Partnership
Downtown Denver Office Market Trends Total Downtown Employment
TalentDowntown Denver’s highly educated and in-demand workforce is growing to support the center city as an epicenter of business and innovation.
10 11
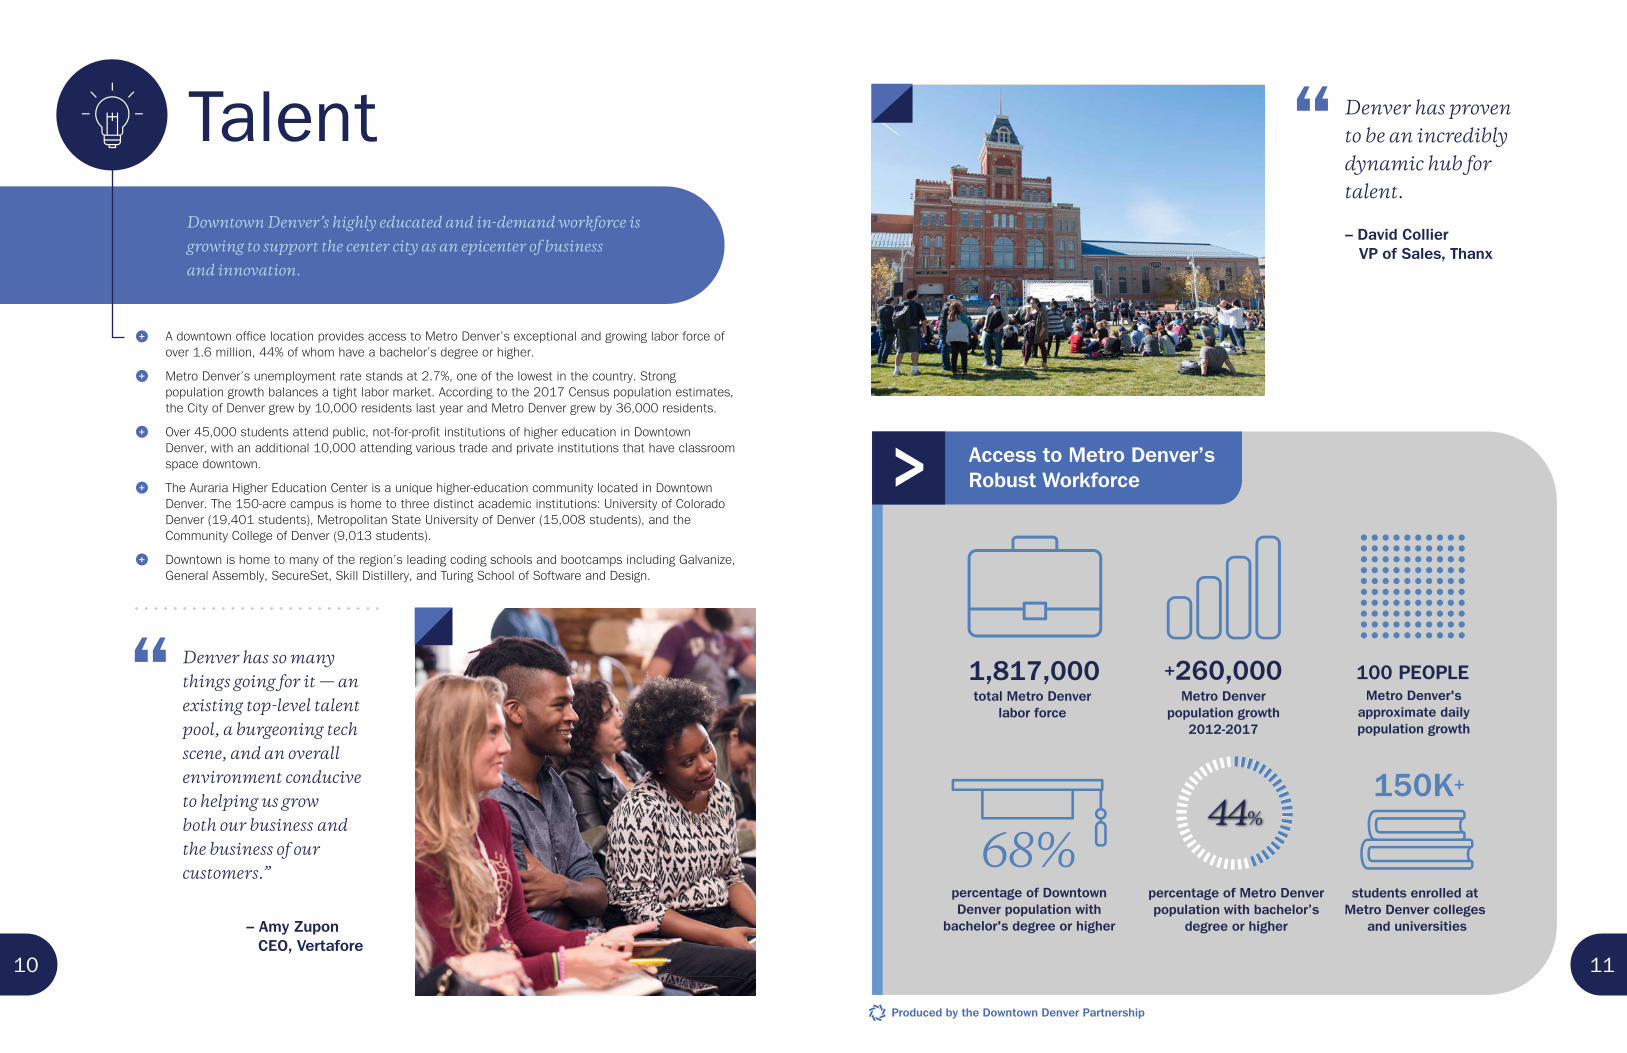
1,817,000 total Metro Denver
labor force
percentage of Downtown Denver population with
bachelor's degree or higher
150K+
students enrolled at Metro Denver colleges
and universities
+260,000 Metro Denver
population growth2012-2017
100 PEOPLEMetro Denver's
approximate dailypopulation growth
68%44%
percentage of Metro Denver population with bachelor’s
degree or higher
>
“ Denver has so many things going for it — an existing top-level talent pool, a burgeoning tech scene, and an overall environment conducive to helping us grow both our business and the business of our customers.”
– Amy Zupon CEO, Vertafore
Access to Metro Denver’s Robust Workforce
“ Denver has proven to be an incredibly dynamic hub for talent.
– David Collier VP of Sales, Thanx
A downtown office location provides access to Metro Denver’s exceptional and growing labor force of over 1.6 million, 44% of whom have a bachelor’s degree or higher.
Metro Denver’s unemployment rate stands at 2.7%, one of the lowest in the country. Strong population growth balances a tight labor market. According to the 2017 Census population estimates, the City of Denver grew by 10,000 residents last year and Metro Denver grew by 36,000 residents.
Over 45,000 students attend public, not-for-profit institutions of higher education in Downtown Denver, with an additional 10,000 attending various trade and private institutions that have classroom space downtown.
The Auraria Higher Education Center is a unique higher-education community located in Downtown Denver. The 150-acre campus is home to three distinct academic institutions: University of Colorado Denver (19,401 students), Metropolitan State University of Denver (15,008 students), and the Community College of Denver (9,013 students).
Downtown is home to many of the region’s leading coding schools and bootcamps including Galvanize, General Assembly, SecureSet, Skill Distillery, and Turing School of Software and Design.
+
+
+
+
+
Produced by the Downtown Denver Partnership

MobilityDowntown Denver’s extensive network of mobility options is central to its strength and attractiveness as the economic hub of the region.
12
DENVER
UNION STATION
E SPEER BLVD
16TH ST MALL
W COLFAX AVE
N
CHAMPA ST
BR
OA
DW
AYLincolnPark
20TH AVE
PARK AVE
B
BB
B
B
B
B
B
B
B
B
B
BB
B
B
B
B
B
B
BB
B
B
B
B
B
B
BB
BB
B
B
CIVICCENTERSTATION
25
20TH ST
RTD Free MetroRideRTD Free MallRideBicycle FacilityProtected Bicycle FacilityRailB-Cycle StationsTransit Center
B
LEG
END
13
Transit
39.3%Drive Alone
39.0%Bike
8.3%Walk
5.4%Carpool
4.0%Telework
2.2%Motorbike
0.9%Lyft/Taxi/Uber
0.9%Vanpool
0.1%
How 133,500 employees commute to downtown:
> Mobility Options in Downtown Denver
Downtown Denver has 9 rail lines, 19.4 miles of bike lanes and trails, 60 RTD bus routes including RTD Free MallRide and Free MetroRide, an extensive bike sharing network, and 4 carshare companies with 21 dedicated parking spaces.
Almost 60% of the Downtown Denver workforce uses transit, bikes, walks or shares the ride for its commute to work. The greatest increase in commuter mode share over the past five years is among bicycle use, which has almost doubled.
Transportation infrastructure continues to expand in Downtown Denver. Over the past year, Civic Center Station reopened after a $31 million renovation; portions of 19th and 20th Avenues and Grant and Logan Streets were converted to two-way complete streets with bicycle facilities; and the 14th Street bike lane was upgraded to a parking protected facility from Market Street to Court Place.
+
+
+
DenverInternationalAirport
N
DowntownDenver
“ In the process of relocating our regional headquarters to Downtown Denver, our employees ranked access to transit as one of the top two criteria for a new office. Denver’s investment in a strong mobility network is increasingly important as we grow our footprint here.
– Heather Larrabee Executive Director of Marketing, Whole Foods Market
Photo Credit: RTD
Produced by the Downtown Denver Partnership

ResidentsAttracted to vibrant walkable districts and high-quality residential amenities, more people than ever before are choosing to live in Downtown Denver and its center city neighborhoods.
80,271 people live in the center city boundary and 22,801 live in the Downtown Denver boundary.
The City of Denver has experienced rapid growth in recent years, adding over 100,000 residents since 2010. While annual population growth has slowed slightly from its peak in 2015, the city continues to add close to 30 people each day.
4,525 residential units are under construction or planned for development in Downtown Denver.
The average rent for a one-bedroom apartment in Downtown Denver is $1,734 and the average rent for a one-bedroom apartment in the center city is $1,462.
The average price of the 537 homes sold in Downtown Denver in 2017 was $583,000, and homes sold for an average of $458/sf. In the center city neighborhoods, 1,535 homes sold in 2017 for an average sales price of $495,000 at an average of $411/sf.
The recent wave of apartment construction in Downtown Denver has brought the ratio of jobs to apartment units to a healthy 5.9 jobs per unit. According to a CBRE study, that ratio remains higher than many other peer markets, showing additional potential demand for apartment homes.
+
+
+
+
+
14 15
Downtown Denver demographics
WH
ITE
76%
HIS
PAN
IC
8%
BLAC
K
4%
ASIA
N
5%
OTH
ER
6%
WH
ITE
64%
BLAC
K
7%
ASIA
N
3%
OTH
ER
10%
HIS
PAN
IC
16%
Race / EthnicityAge & Gender
*34.3
F 44%M 56%
F 45%M 55%
*median age
Center City Neighborhood demographics
years*33.8
years
14,226
47,849
Households
Average Household Size
Household Types
Non-familyHousehold
Family(with child/children)
Family(Married, No Child)
1.4household members
1.6household members
Family(Other, No Children)
$120,099
$92,595average household income
Educational Attainment
bachelor’s degree
master’s degreedoctoratedegree
professionalschool degree
42% 39%
2% 16%18%2%
6% 4%
2% 3%
81% 78%
13% 10%
bachelor’s degreeor higher:
61%
68%
4% 9%
Downtown DenverResidential Growth
2000census
2010census
2018estimate
25,000
20,000
15,000
10,000
5,000
199%population
growth
Center CityResidential Growth
2000census
2010census
2018estimate
90k80k70k60k50k40k30k20k10k
43%population
growth
+
Produced by the Downtown Denver Partnership
Downtown DenverResidential Growth
Center CityResidential Growth

RetailNew jobs, residents and visitors attracted to a thriving downtown have generated extraordinary demand for new goods, services, and entertainment options, with retail sales up 6.4% year-over-year.
Downtown Denver has over 4,000,000 square feet of retail space with a 3.3% vacancy rate (down 31% year-over-year) and a direct average lease rate of $24.90 (up 5% year-over-year).
Retail sales tax collections in Downtown Denver have increased over 60% since 2010. Retail sales in Downtown Denver are increasing at a faster rate than retail sales in the City and County of Denver overall.
Over two-thirds of Downtown Denver residents fit the “Metro Renters” Tapestry Segment. This demographic group is characterized by educated young-professionals who tend to rent vs. own, have higher than average incomes, prefer travelling without a car, and tend to live alone or with a roommate. The second most common segment is “Laptops and Lattes,” who represent 20% of downtown residents. This segment has very high labor force participation rates, high salaries, and are health-conscious, environmentally-conscious, and image-conscious consumers.
Sephora
Target
FlyWheel
Whole Foods
Free Market
Warby Parker
+
+
+
16 17
>
“ Target is thrilled to bring our first small-format store to Colorado and be part of a thriving community in Downtown Denver.
– Mark Schindele, Senior Vice President, Properties, Target
Increasing Retail Sales
’10 ’11 ’12 ’13 ’14 ’15 ’16 ’17
Total Retail Sales Tax $60M
$50M
$40M
$30M
$20M
$10M
Key RetailAnnouncements& Openings
restaurants
manufacturingother
hotel + otheraccommodation services
bus. admin.,waste/remediation
clothing +accessory stores
43% 24%
6%
7%
information +distributors
5%
3%12%
Produced by the Downtown Denver Partnership
Retail Distribution
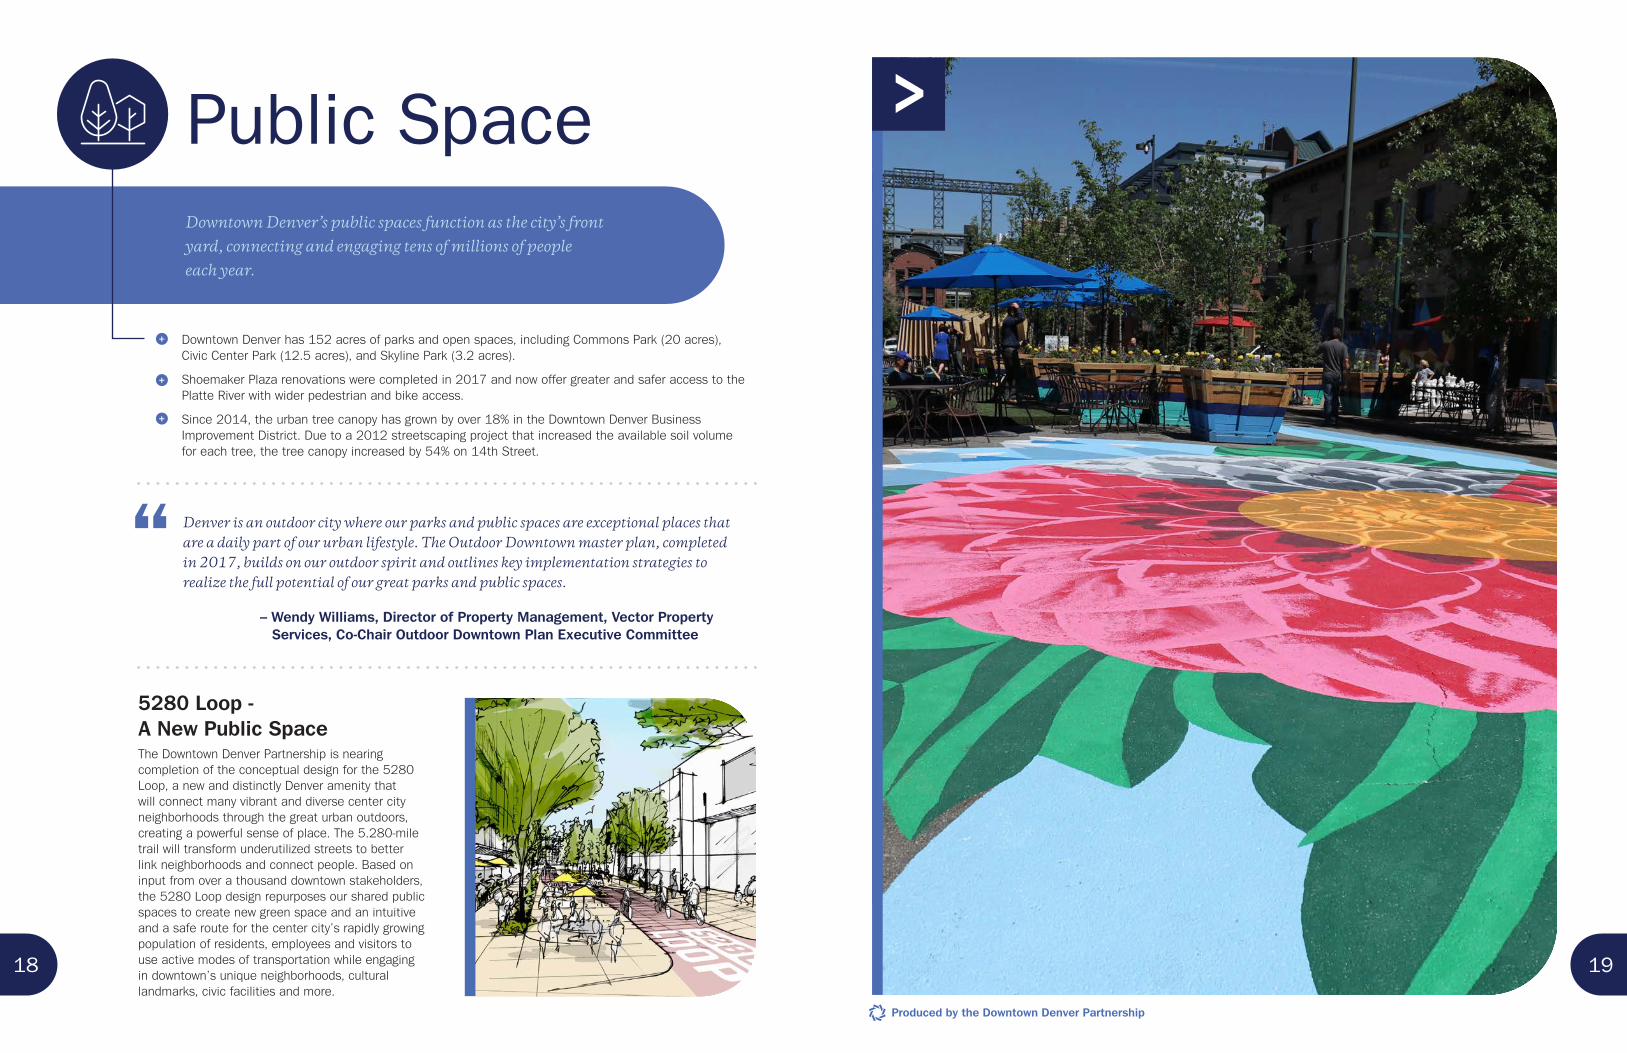
Public SpaceDowntown Denver’s public spaces function as the city’s front yard, connecting and engaging tens of millions of people each year.
Downtown Denver has 152 acres of parks and open spaces, including Commons Park (20 acres), Civic Center Park (12.5 acres), and Skyline Park (3.2 acres).
Shoemaker Plaza renovations were completed in 2017 and now offer greater and safer access to the Platte River with wider pedestrian and bike access.
Since 2014, the urban tree canopy has grown by over 18% in the Downtown Denver Business Improvement District. Due to a 2012 streetscaping project that increased the available soil volume for each tree, the tree canopy increased by 54% on 14th Street.
+
+
+
18 19
“ Denver is an outdoor city where our parks and public spaces are exceptional places that are a daily part of our urban lifestyle. The Outdoor Downtown master plan, completed in 2017, builds on our outdoor spirit and outlines key implementation strategies to realize the full potential of our great parks and public spaces.
– Wendy Williams, Director of Property Management, Vector Property Services, Co-Chair Outdoor Downtown Plan Executive Committee
5280 Loop - A New Public SpaceThe Downtown Denver Partnership is nearing completion of the conceptual design for the 5280 Loop, a new and distinctly Denver amenity that will connect many vibrant and diverse center city neighborhoods through the great urban outdoors, creating a powerful sense of place. The 5.280-mile trail will transform underutilized streets to better link neighborhoods and connect people. Based on input from over a thousand downtown stakeholders, the 5280 Loop design repurposes our shared public spaces to create new green space and an intuitive and a safe route for the center city’s rapidly growing population of residents, employees and visitors to use active modes of transportation while engaging in downtown’s unique neighborhoods, cultural landmarks, civic facilities and more.
>
Produced by the Downtown Denver Partnership

TourismPremier hotels, award-winning restaurants, and a world-class convention center, all connected by rail to the fifth busiest airport in the country, make Downtown Denver a global destination.
20 21
> Downtown Denver Hotel Scene
38 hotels and10,300 hotel rooms
$186 averagedaily room rate
Over 500,000 sfof hotel meetingspace
2,436 hotel roomsadded over the past five years
79% hoteloccupancy
$147 Revenue PerAvailable Room
Photo Credit: City of Denver
Produced by the Downtown Denver Partnership
Denver International Airport (DEN) is the fifth-busiest airport in the U.S., serving more than 61 million travelers annually. DEN serves over 190 nonstop destinations, including 26 international destinations in 11 countries.
Denver tourism has been setting visitor records for 11 consecutive years, according to VISIT DENVER’s annual visitor profile study. Denver welcomed 17.3 million overnight visitors in 2016, driven by an increase in leisure travelers, who spent $5.3 billion.
The Colorado Convention Center, which hosts nearly 1 million attendees in the heart of Downtown Denver each year, will be undergoing a major renovation and expansion beginning in 2019. The fully-funded expansion will make the Center the most high-tech, user-friendly meeting and event space in the nation by adding 80,000 square feet of flexible meeting space, 60,000 square feet of pre-function space and a 50,000 square foot outdoor rooftop terrace, all of which will have views of the Rocky Mountains as well as the Downtown Denver skyline.
Outdoor Retailer, the largest outdoor recreation expo and conference in the country, chose Downtown Denver as its new home beginning in 2018. Outdoor Retailer attracts over 85,000 attendees annually across three shows (January, June/July, and November) with an economic impact of $110 million.
+
+
+
+
Average Daily Room Rate
’12 ’13 ’14 ’15 ’16 ’17
$200
$180
$160
$140
Hotel Occupancy
’12 ’13 ’14 ’15 ’16 ’17
78%
80%
76%
74%
72%
Hotel Occupancy by Month
Jan
Feb
Mar Apr
May Jun
Jul
Aug
Sep Oct
Nov
Dec
100%
90%
80%
70%
60%
50%
40%
Revenue Per Available Room
’12 ’13 ’14 ’15 ’16 ’17
$150
$140
$130
$120
$110
$100
Average Daily Room Rate
Revenue Per Available Room
Hotel Occupancy
Hotel Occupancy by Month

With our rapid rise in recent years, Denver has moved up in weight class and now compares favorably with the best of the best cities across the country.
Benchmarking
Peer-to-Peer ReviewEach year the State of Downtown Denver provides the development community a comprehensive, year-over-year analysis of the economic performance of Downtown Denver. This year, we are adding a benchmarking analysis, showing how Denver compares with 14 other peer and aspirational markets. This exercise is intended to help provide context to the growth and development of the area. Compared to our past, Denver has experienced extraordinary growth; compared to our peers, we see opportunities to get even better.
1. Austin 22.5%2. Dallas 14.7%3. Nashville 13.6%4. Denver 13.1%5. Phoenix 12.7%6. Seattle 12.2%7. Atlanta 11.0%8. Salt Lake City 10.2%9. Portland 9.9%10. Washington DC 9.7%11. San Francisco 8.8%12. Minneapolis 7.3%13. Los Angeles 4.0%14. New York City 3.7%15. Chicago 0.7%
1. Nashville 39%2. Austin 37%3. Dallas 26%4. San Francisco 26%5. Denver 26%6. Salt Lake City 25%7. Seattle 23%8. Phoenix 23%9. Portland 22%10. Atlanta 22%11. Los Angeles 16%12. Minneapolis 15%13. New York City 15%14. Washington DC 13%15. Chicago 12%
1. Salt Lake City 172. Nashville 333. Phoenix 344. Denver 365. Minneapolis 416. Austin 437. Portland 508. Dallas 549. Seattle 5510. Chicago 5711. Washington DC 6312. Atlanta 7013. San Francisco 7914. New York City 9115. Los Angeles 102
1. San Francisco 54.8%2. Washington DC 53.6%3. New York City 47.5%4. Minneapolis 46.9%5. Denver 46.0%6. Austin 45.1%7. Seattle 44.8%8. Chicago 43.7%9. Nashville 41.9%10. Portland 40.7%11. Atlanta 39.0%12. Los Angeles 34.8%13. Dallas 34.8%14. Salt Lake City 34.2%15. Phoenix 29.2%
1. San Francisco $2,440 2. New York City $2,070 3. Los Angeles $1,350 4. Washington DC $1,320 5. Seattle $1,320 6. Portland $1,130 7. Austin $1,120 8. Chicago $1,070 9. Denver $1,040 10. Atlanta $1,01011. Minneapolis $910 12. Nashville $910 13. Dallas $880 14. Salt Lake City $850 15. Phoenix $830
1. Austin 104.542. Dallas 94.173. Denver 92.314. Los Angeles 92.265. Phoenix 92.126. Atlanta 89.937. San Francisco 86.508. New York City 86.489. Seattle 84.9710. Portland 82.8211. Nashville 82.2212. Washington DC 78.0513. Chicago 74.6814. Minneapolis 72.5215. Salt Lake City n/a
1. New York City $74.34 2. San Francisco $73.44 3. Los Angeles $39.75 4. Austin $37.61 5. Washington DC $37.26 6. Seattle $35.13 7. Chicago $31.26 8. Portland $28.04 9. Denver $27.02 10. Dallas $26.6411. Minneapolis $25.79 12. Nashville $25.78 13. Phoenix $24.91 14. Atlanta $24.17 15. Salt Lake City $20.70
1. Austin 34.4%2. Salt Lake City 26.0%3. San Francisco 24.1%4. Nashville 24.1%5. Denver 20.5%6. Atlanta 15.6%7. New York City 12.8%8. Portland 12.3%9. Dallas 11.8%10. Los Angeles 8.5%11. Chicago 7.1%12. Seattle 6.1%13. Washington DC 4.8%14. Minneapolis 3.6%15. Phoenix -0.7%
1. Austin 28.5%2. San Francisco 25.9%3. Nashville 23.5%4. Dallas 20.4%5. Denver 19.5%6. Seattle 18.9%7. Salt Lake City 15.6%8. Atlanta 14.9%9. Los Angeles 14.5%10. Phoenix 11.8%11. Minneapolis 10.5%12. New York City 8.2%13. Chicago 7.5%14. Washington DC 4.5%15. Portland 2.5%
Educated Millennials % college grads age 25-34
(Source: Brookings)
Apartment RentMedian rent for 1-bedroom
(Source: aparmentlist.com)
Startup Density# of startups per 1,000 firms
(Source: Kauffman Foundation)
Office Rent Avg. asking rent/sf, direct
(Source: JLL)
Young Firm GrowthIncrease in jobs 2011-2016
(Source: Brookings)
Gross Metro Product GMP increase 2011-2016
(Source: Brookings)
Population Growth Pop. increase 2010-2017
(Source: US Census data)
Job GrowthNon-farm job growth 2010-2017
(Source: BLS)
Traffic Congestion Hours in traffic during peak
(Source: INRIX)
22 23
Key Performance Indicators Among 15 Selected Metro Areas
Produced by the Downtown Denver Partnership

DOWNTOWN DENVER INC.BOARD OF DIRECTORS 2017-2018
Board OfficersRob Cohen, IMA Financial Group, Inc., Chairman*
Maja Rosenquist, Mortenson Construction, Secretary*
Mike Zoellner, ZF Capital, Vice-Chairman*
Cullin Barry, Wells Fargo
Jim Basey
Mike Bearup, KPMG LLP
Scott Booker
Terrance Carroll, Denver Public Schools
Steve Carter, 9News
Stephen Clark, S.B. Clark Companies
Dana Crawford, Urban Neighborhoods, Inc.
Lori Davis, Grant Thornton LLP*
David Eves, Public Service Company, an Xcel Energy Company
Andy Feinstein, EXDO Management
Cole Finegan, Hogan Lovells US LLP
Dorit Fischer, NAI Shames Makovsky
Bob Flynn, Crestone Partners, LLC
John Freyer, Jr., Land Title Gurantee Company
Tom Grimshaw, Spencer Fane Britt & Browne, LLP
Todd Hartman, Callahan Capital Properties
Scott Heimes
Michael Hobbs, Guaranty Bank and Trust Company
Jim Holder, Holmes Murphy
Kathy Holmes, Holmes Consulting Group
Dorothy Horrell, CU Denver
Rick Hosley, Davita, Inc.
Vernon Irvin, CenturyLink
Walter Isenberg, Sage Hospitality*
Bruce James, Brownstein Hyatt Farber Schrek LLP*
Chris Jensen, JP Morgan | Chase*
Steve Katich, J.E. Dunn Construction Company
Kevin Kelley, Husch Blackwell LLP*
David Kenney, The Kenney Group
Dick Kirk, Richard A. Kirk & Associates
Gail Klapper, Colorado Forum
Kim Koehn, K2 Ventures, LLC
Tom Lee, Newmark Knight Frank
Laura Love, Groundfloor Media
Lee Mayer, Havenly
Chad McWhinney, McWhinney
John Moye, Moye White
Katherine Ott, SlimGenics
Kevin Quinn, Citywide Banks
Gary Reiff, Black Creek Group
Jon Robinson, UMB
Marc Spritzer, MGMA
George Thorn, Mile High Development
Ellen Valde, PwC
Paul Washington, JLL
Tracy Winchester, Five Points Business District
Robin Wittenstein, Denver Health
David Wollard
Gary Yamashita, Sakura Square
DOWNTOWN DENVER BUSINESS IMPROVEMENT DISTRICT BOARD OF DIRECTORS 2017 Jon Buerge, Urban Villages Inc., Treasurer
Dorit Fischer, NAI Shames Makovsky
Gina Guarascio, Jones Lang LaSalle
Austin Kane, Unico Properties LLC, Vice Chair
David Kaufman, 910 Associates, Inc., Chair
Rick Kron, Spencer Fane Britt and Browne, Legal Advisor
Sandrena B. Robinson, Jones Lang LaSalle
Bahman Shafa, Focus Property Group, Secretary
GRAPHIC DESIGNDerek Berardi | www.derekberardi.com
DENVER CIVIC VENTURESBOARD OF DIRECTORS 2017-2018
Downtown Denver Management Group Chair 2017-2018Bill Mosher, Trammell Crow Company*
Board Officers Trinidad Rodriguez, D.A. Davidson & Co., Chairman*
Amy Hansen, Polsinelli, Secretary*
Sarah Rockwell, Kaplan Kirsch Rockwell LLP, Vice-Chairman*
Laura Aldrete, DEN Real Estate
Bruce Alexander, Vectra Bank Colorado
John Beeble, Beeble Company
Raymond Bellucci, TIAA
Ferd Belz, L.C. Fulenwinder
Brianna Borin, Snooze, an AM Eatery
Brent Bowman, Kaiser Permanente
Sarah Semple Brown, Semple Brown Design
Frank Cannon, Continuum Partners/Union Station Neighborhood Co.
Gene Commander, Gene Commander, Inc.
Chris Crosby, The Nichols Partnership*
Greg Feasel, Colorado Rockies Baseball Club
Patty Fontneau, Cigna
Chris Frampton, East West Partners
Dr. Everette Freeman, Community College of Denver
Jon Gambrill, Gensler
Jerry Glick, Columbia Group LLP
Tom Gougeon, Gates Family Foundation*
Beth Gruitch, Rioja
Ismael Guerrero, Denver Housing Authority*
Rus Heise
Doug Hock, Encana
Jennifer Johnson, NestBuilders
Jim Johnson, Johnson Nathan Strohe
Chris King, DPC Companies
Katie Kramer, Boettcher Foundation
Greg Leonard, Hyatt Regency Denver at Colorado Convention Center
Adam Lerner, Museum of Contemporary Art
Traci Lounsbury, Workplace ELEMENTS
Evan Makovsky, NAI Shames Makovsky*
Scott Martinez, Snell & Willmer
Pat McHenry, City Street Investors
Bill Mosher, Trammell Crow Company*
Cindy Parsons, Comcast
Adam Sands, FirstBank
Gloria Schoch, MillerCoors
Mark Sidell, Gart Properties
David Sternberg, Brookfield Properties
Mark Stiebeling, Grand Hyatt Denver
Frank Terrasi, CDM Smith
Rick Tucker, Hensel Phelps
Joe Vostrejs, City Street Investors*
Elbra Wedgeworth, Denver Health
FOR MORE INFORMATION CONTACTRandy ThelenVice President, Economic Development 303.825.6791 [email protected]
Emily BrettSenior Manager, Economic [email protected]
INFORMATION SOURCES2007 Downtown Area Plan, Airports
Council International, Auraria Higher
Education Campus, B-Cycle, City and
County of Denver, Colorado Comps,
Colorado Convention Center, Colorado
Department of Labor and Employment,
Quarterly Census of Employment and
Wages, CBRE, Community College of
Denver, CoStar, Denver Business Journal,
Denver Infill, Denver International Airport,
Denver Metro Apartment Vacancy and
Rent Survey, Denver Post, Development
Research Partners, Downtown Denver
Partnership, Emily Griffith Technical
College, Headlight Data, Metro Denver
Economic Development Council, Metro
State University of Denver, Nielsen
Segmentation and Market Solutions,
Rocky Mountain Lodging Report, RTD,
U.S. BLS Current Employment Statistics,
U.S. Census Bureau, University of
Colorado Denver, VISIT DENVER
Photo Credit: Ryan Dravitz
* Downtown Denver Partnership Management Group
>
24

Published May 2018 by:
Downtown Denver Partnership
1515 Arapahoe St., Tower 3, Suite 100
Denver, CO 80202
303.534.6161
downtowndenver.com
@DowntownDenver
DowntownDenver
/DowntownDen
For more than 60 years, the Downtown Denver Partnership has convened, collaborated and led a bold vision to build an economically powerful center city. With a bias for action, we invest for tomorrow and execute for today, converging the right people at the right time to make an IMPACT.
Guided by the 2007 Downtown Area Plan, we are a fast-moving, forward thinking, non-profit business organization with the foundational belief that every day is our chance to make the city a better place. Together with our more than 700 Member organizations, we are the leading voice for private sector businesses in the center city.
Visit downtowndenver.com today to become a member and to join us in building our city.
ABOUT THE DOWNTOWN DENVER PARTNERSHIP
Photo Credit: Ryan Dravitz Photography
Learn more: