STATE OF CALIFORNIA - California Community...
27
Transcript of STATE OF CALIFORNIA - California Community...

STATE OF CALIFORNIA JACK SCOTT, CHANCELLOR
CALIFORNIA COMMUNITY COLLEGES CHANCELLOR’S OFFICE 1102 Q STREET SACRAMENTO, CA 95811-6549 (916) 445-8752 HTTP://WWW.CCCCO.EDU
February 1, 2012
The Honorable Jerry Brown
Governor of California
State Capitol
Sacramento, California 95814
Dear Governor Brown:
I am pleased to present to you the California Community Colleges legislative report on
nursing education programs.
This report includes information about the allocation of funds, the additional number of
students served over the course of several years, completion rates, funds used to purchase
equipment, and the number of new and existing faculty receiving annual stipend awards. The
report highlights the number of students taking assessment tests prior to enrolling in the
nursing programs, the results of the tests, and various demographic and enrollment
information.
If you have questions or comments, please contact Erik Skinner, executive vice chancellor for
programs, at (916) 323-7007 or [email protected].
Again, it is my pleasure to provide you with this report.
Sincerely,
Jack Scott, Ph.D.
Chancellor

Nursing Education Programs 2 0 1 0 | 1
Nursing Education Programs
Executive Summary The California Community Colleges serve more than 2.6 million students each year and is the largest system of higher education in the nation. The state’s 112 community colleges are charged with providing workforce training, basic skills education, and preparing students to transfer to four-year universities.
Seventy-five California community colleges operate registered nursing programs, enrolling a statewide total of 13,057 full-time-equivalent students (FTES)1. Enrollments have increased by about 44.7 percent since 2005 (when the Nursing Program Support grants began) due to the development of new programs, expansion of enrollment capacity through partnerships with the healthcare industry, and federal and state funded programs and grants. Colleges with nursing and allied health programs receive funding through general apportionment/FTES. This report presents information on categorical funding awarded through a competitive process to the community colleges for nursing and allied health programs in 2009-10. It also includes a summary report on Nursing Program Support provided in the Budget Act of 2009 to expand community college nursing enrollments and to improve student retention (required by Provision (23) of Item 6870-101-0001 of the Budget Act of 2009).
1 Board of Registered Nursing Annual School Report 2008-09 and Chancellor’s Office enrollment data.
Table of Contents
Executive Summary Page 1
Reporting Requirements Page 2 Overview of Funding Page 3
Key Findings Page 5
Tables Page 8

2 | California Community Colleges Chancellor’s Office
Reporting Requirements Education Code Section 78261, Subdivisions (g) says: “As a condition of receiving grant funds pursuant to paragraph (2) of subdivision (d), each recipient district shall report to the Chancellor's Office the following data for the academic year on or before a date determined by the Chancellor's Office:
(1) The number of students enrolled in the nursing program. (2) The number of students taking diagnostic assessments. (3) The number of students failing to meet proficiency levels as determined by diagnostic assessment tools. (4) The number of students failing to meet proficiency levels that undertake preentry preparation classes. (5) The number of students who successfully complete pre-entry preparation coursework. (6) The average number of months between initial diagnostic assessment, demonstration of readiness, and enrollment in the nursing program for students failing to meet proficiency standards on the initial diagnostic assessment. (7) The average number of months between diagnostic assessment and program enrollment for students meeting proficiency standards on the initial diagnostic assessment. (8) The number of students who completed the associate degree nursing program and the number of students who pass the National Council Licensure Examination.
In subdivision (h) of Education Code Section 78261, the reporting requirements continue:
(1) Data reported to the chancellor under this article shall be disaggregated by age, gender, ethnicity, and language spoken at home. (2) The Chancellor's Office shall compile and provide this information to the Legislature and the governor by March 1 of each year.”

Nursing Education Programs 2 0 1 0 | 3
Overview of Funding Nursing
The overview of funding is detailed on tables beginning on page 10. A list of the colleges that received funding for the 2010-11 fiscal year, the amount received, and the number of full-time equivalent students served in the 2005-06, 2006-07, 2007-08, 2008-09 and 2009-10 academic years is provided on Table 1a. In fiscal year 2009-10 program funding was reduced by approximately 39% (from $22.1 million to $13.4 million) As a result, the number of additional students that could be funded each year was reduced from 2,386 to 1,487. The reduced funding meant that colleges that wanted to increase their program by more than 40 students were unable to do so, and in many instances funds were used to enable students already enrolled to complete their second year in the program. There were approximately 1,400 additional students enrolled in 2009-10. The Budget Act of 2010 provided approximately $13.3 million of Proposition 98 funds. Of this amount, $8.8 million was used to further expand community college nursing slots, and $4.5 million was used to provide diagnostic and support services to reduce student attrition. These funds are described further in Tables 1a -1b. Federal Workforce Investment Act (WIA) funds (approximately $3 million) were provided for the Governor's Nurse Education Initiative (NEI). Grants were awarded to nine colleges to assist them to lower nursing attrition rates, increase nursing faculty, expand public/private partnerships to develop additional nursing education capabilities, and expand nursing slots (by 1,440 FTES). Table 2 lists the colleges receiving these funds, funds awarded and the number of additional nursing slots created. These projects have been funded for another five-year period and are going into the second year of funding. The Chancellor’s Office received $1.3 million in Workforce Investment Act funds to implement a bridge program for paramedics to enter RN programs in California. Table 3 provides the colleges that received grants in FY 2009-10 to implement these programs.

4 | California Community Colleges Chancellor’s Office
Allied Health
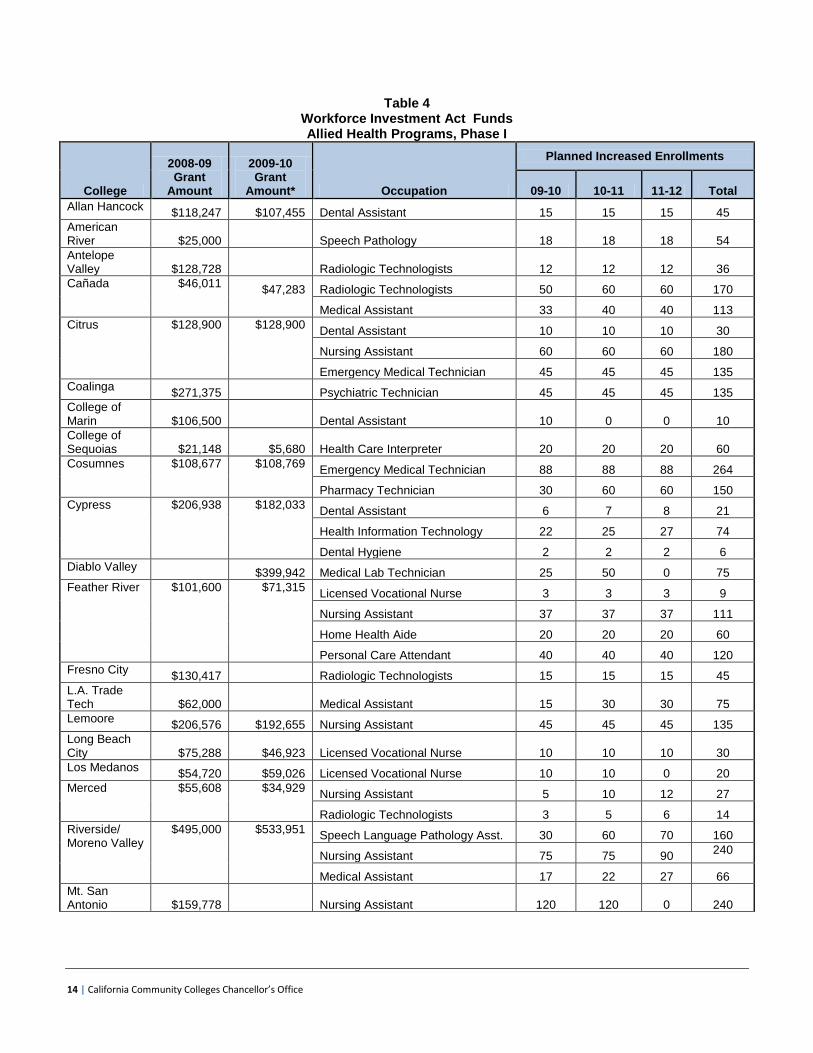
In the spring of 2009, the Chancellor's Office received $8 million in federal Workforce Investment Act Funds for the expansion of allied health programs, to be distributed over three fiscal years. Twenty-six colleges received funding, for a total increase in enrollments of 3,947 students in various occupational areas. Table 4 displays the colleges, funding amounts for the first and second years, the programs being expanded, and the number of additional students to be enrolled over the course of the grants. Note that not all colleges requested and/or received multiple years of funding. During the summer of 2009, $6 million of American Recovery and Reinvestment Act Funds (ARRA) were received for expansion of allied health programs. Nine-teen colleges were funded for a total of 1,007 additional students over a two year period. Table 5 displays the colleges and programs funded with ARRA funds. It is important to note the length of time it takes to complete an allied health programs can be different than registered nursing programs, which are two years or four semesters in length. Licensed vocational nursing to RN programs are, in general, two to three semesters in length. Allied health programs range from short-term certificate programs (nurse assistant or home health aide) that last eight weeks, to associate degree programs (radiology or respiratory technology) that take up to two years to complete. Some specialty upgrade courses can be only a matter of days in length. Consequently, some programs will have the ability to enroll more than one cohort of students in a semester or given period of time and thus have greater output during the timeframe of the grant.

Nursing Education Programs 2 0 1 0 | 5
Key Findings The Budget Act of 2010 directed the Chancellor’s Office to report on the award of nursing grants funded by the $13.4 million provided in the Act. These funds were awarded to colleges who participated in a competitive process in the spring of 2010 for a two year cycle of enrollment expansion which began in the fall of 2010, and will complete in June 2012. Below is summary information that addresses the specific areas (numbered) required by the Budget Act of 2010. In addition, Table 1 provides data by college on the funds that were awarded.
1. Amount of Funding Received Funds were awarded based on a competitive process that was conducted in the spring of 2010 for projects to be funded during FY 2010-11 and 2011-12. The Chancellor’s Office awarded funds to all colleges that applied, but not all colleges received the funding they requested. The following is a description of the grants that were awarded.
Enrollment Growth for Nursing: Sixty-three colleges received grants to expand enrollments by some 1,400 students. Some colleges requested additional funds to expand enrollments in the second year of the two-year cycle; however, that was not possible because of the reduction in funds.
Assessment, Remediation and Retention Funds: During 2010-11, all 63 colleges that requested enrollment growth funds received funds for diagnostic and support services, pre-entry coursework, and other services to reduce attrition. Table 1 provides a list of the colleges receiving funds for this purpose. Table 8 provides a list of all community college nursing programs and their respective attrition rates as reported to the Board of Registered Nursing for the 2009-10 Annual School Report. This item is also discussed in number 3.

6 | California Community Colleges Chancellor’s Office
2. Number of nursing FTES before and after grants awarded Fifty-seven of the 63 colleges receiving nursing grants for enrollment growth had 6,436 nursing FTES in 2004-05. Six colleges have new programs that have started since 2004-05. As a condition of receiving grant funds, the 63 colleges will maintain more than 1,400 nursing slots (FTES) statewide this year. Colleges normally receive $5,700 for each additional student they enroll. $8.4 million will maintain an additional enrollment growth of about 1,474 slots.
3. District Attrition and Completion Rates
The Chancellor’s Office used data reported by the colleges to the Board of Registered Nursing to determine the attrition rate for each college program. Data was collected on students who were scheduled, on admission, to complete the program between August 1, 2009, and July 31, 2010. These students have benefitted from the specific retention activities that were funded with grant funds beginning in spring 2008. The attrition2 data is presented in Table 6. Attrition rates were calculated by using the following data reported by the colleges:
Total number of students scheduled, on admission, to complete the program between August 1, 2009, and July 31, 2010.
The number of students who dropped out of the program or were disqualified are subtracted from this number.
The number of students who completed the program on time, or who are still enrolled in the program remain.
4. Equipment/Infrastructure Purchases
For the 2009-10 fiscal year funds colleges reported expenditures of approximately $965,000 for capital outlay (equipment and related costs).
5. Number of New and Existing Faculty Receiving Annual Stipend Awards
2 Attrition is the total number of students enrolled in a cohort less those that dropped out. Table 6 shows the percentage of those that completed on time, the percentage of those still enrolled, and the percentage of those that dropped out

Nursing Education Programs 2 0 1 0 | 7
In 2006-07 the Chancellor’s Office conducted a competitive grant process to award the funds designated for annual stipend awards. Eighteen colleges are participating in these grants. In 2009-10:
20 new full-time faculty were hired.
102 full-time faculty within their first five years of teaching nursing received stipend awards.
27 existing faculty and 39 part-time faculty will receive annual stipend awards for teaching evening and weekend clinical assignments.
6. Data Required by SB 1309, Statutes of 2006
SB 1309 (Stats. 2006, Chap. 837) requires the Chancellor’s Office to collect and report data from colleges receiving grants on the results of assessment testing for students as a condition of enrollment. Colleges were required to provide remediation to those students who did not achieve a statewide score. The Chancellor’s Office works with assessment vendors and colleges to collect the data required in subsection (g). The vendors provided information on exam results, gender, ethnicity, and age for students from 59 colleges. The colleges then provided information on remediation and enrollment. . In addition, this data reflects students who received assessment testing between January 2008 and June 2010; thus insufficient time has passed to collect data on some of the variables. Also, subsections (g)(6) and (7) are difficult to assess given the magnitude of the data to be collected over time. In response to subsection (g)(8) below, Table 8 lists the colleges, the number of students from the colleges that took the licensure exam, and the pass rate from 2005-06 through 2009-10.

8 | California Community Colleges Chancellor’s Office
Table 1(a) Enrollment Growth Funds Allocated, FTES, and Additional Enrollments
College
2010-11 Allocation
Total
FTES 2005-
06
FTES 2006-
07
FTES 2007-
08
FTES 2008-
09
FTES 2009-
10
Anticipated Additional
Enrollments 2010-11
Allan Hancock $28,500 32 31 40 37 46 5
American River $57,000 188 216 221 215 225 10
Antelope Valley $171,000 300 298 283 306 343 30
Bakersfield $142,500 282 317 339 329 389 25
Butte $228,000 86 121 134 178 234 40
Cabrillo $114,000 90 133 138 130 150 20
Cerritos $128,250 236 215 205 206 221 23
Chaffey $85,500 157 161 163 104 124 15
Citrus $102,600 New Program 24 66 89 18
College of Marin $114,000 81 88 92 91 106 20
College of San Mateo $68,400 113 117 118 116 126 12
College of the Canyons $114,000 194 252 294 266 306 20
College of the Desert $228,000 215 211 228 228 288 40
College of the Redwoods $85,500 84 105 105 95 106 15
College of the Siskiyous $171,000 New Program 26 26 45 30
El Camino (Compton Education Center) did not apply 95 86 97 133 178 0
Contra Costa $114,000 154 128 125 55 70 20
Copper Mountain $182,400 36 48 72 101 122 32
Cuesta did not apply 105 108 108 196 211 0
Cypress $99,750 183 210 212 263 283 18
El Camino $203,687 263 350 339 149 197 56
Evergreen Valley $114,000 122 141 112 157 164 20
Fresno City $570,000 417 560 477 582 380 100
Gavilan $57,000 22 22 22 22 31 10
Glendale $273,600 212 223 228 204 264 48
Golden West $17,100 278 335 312 269 298 3
Grossmont $85,500 New Program 15
Hartnell $57,000 New Program 10
Imperial Valley did not apply 148 165 158 126 166 0
Long Beach City did not apply 260 280 298 244 330 0
Los Angeles City did not apply 84 105 105 125 0
Los Angeles Harbor $57,000 238 250 264 244 259 10
Los Angeles Pierce $76,532 150 142 140 138 158 13
Los Angeles Southwest $85,500 160 165 124 190 209 15
Los Angeles Trade Technical $45,600 59 120 146 133 145 8
Los Angeles Valley $199,500 189 164 182 227 255 35
Los Medanos $62,700 89 96 99 99 115 11
Mendocino $68,400 48 40 41 39 64 12
Merced $228,000 88 102 107 99 142 40

Nursing Education Programs 2 0 1 0 | 9
Table 1(a) Enrollment Growth Funds Allocated, FTES, and Additional Enrollments
College
2010-11 Allocation
Total
FTES 2005-
06
FTES 2006-
07
FTES 2007-
08
FTES 2008-
09
FTES 2009-
10
Anticipated Additional
Enrollments 2010-11
Merritt $199,500 39 111 104 88 113 35
MiraCosta $195,313 New Program 28 35 56 34
Mission $114,000 New Program 30 39 59 20
Modesto Jr. $145,350 299 294 293 289 311 26
Monterey Peninsula $98,469 98 107 104 98 18 17
Moorpark $62,700 155 142 188 176 186 11
Mt. San Antonio $136,800 338 375 380 366 401 24
Mt. San Jacinto $56,999 102 100 123 145 154 10
Napa Valley $228,000 180 180 181 197 257 40
Palomar $228,000 129 135 165 146 183 40
Pasadena $85,500 New Program 15
Rio Hondo $142,500 84 207 210 193 26 25
Riverside $484,500 327 392 370 369 435 85
Sacramento City $42,750 New Program 8
Saddleback $136,800 217 225 225 241 274 24
San Joaquin Delta $456,000 280 288 280 315 375 80
Santa Ana $68,400 235 261 264 256 273 12
Santa Barbara City $57,000 137 147 118 109 118 10
Santa Monica $128,250 133 144 155 159 199 23
Santa Rosa Junior $342,000 144 163 230 227 265 60
Shasta $228,000 144 177 121 125 155 40
Sierra did not apply 90 117 83 96 106 0
Solano $102,600 86 118 113 143 227 18
Southwestern $57,000 116 142 124 135 161 10
Ventura $102,600 233 249 251 213 248 18
Victor Valley $128,250 187 205 237 210 235 23
West Hills - Lemoore $205,200 New Program 62 98 36
Yuba $148,200 107 107 128 117 137 26
Totals $8,816,200 9,318 10,491 10,578 10,717 12,034 1,567
Anticipated Total FTES 2010-11 13,601

10 | California Community Colleges Chancellor’s Office
Table 1(b) Assessment and Retention Funds Allocated
College Amount
Allan Hancock $32,687
American River $32,687
Antelope Valley $32,687
Bakersfield $32,687
Butte $32,687
Cabrillo $32,687
Cerritos $32,687
Chabot $203,687
Chaffey $32,687
Citrus $32,687
College of Marin $32,687
College of San Mateo $32,687
College of the Canyons $32,687
College of the Desert $32,687
College of the Redwoods $32,687
College of the Sequoias $203,687
College of the Siskiyous $32,687
Contra Costa $32,687
Copper Mountain $32,687
Cuesta $215,087
Cypress $32,687
East Los Angeles $317,687
El Camino $32,687
Evergreen Valley $32,687
Fresno City $32,687
Gavilan $32,687
Glendale $32,687
Golden West $32,687
Grossmont $32,687
Hartnell $32,687
Imperial $454,487
Long Beach $443,087
Los Angeles City $226,487
Los Angeles Harbor $32,687
Los Angeles Pierce $32,687
Los Angeles Southwest $32,687
Los Angeles Trade-Tech $32,687
Los Angeles Valley $32,687
Los Medanos $32,687
Mendocino $32,687
Merced $32,687
Merritt $32,687
MiraCosta $32,687
Mission $32,687

Nursing Education Programs 2 0 1 0 | 11
Table 1(b) Assessment and Retention Funds Allocated
College Amount
Modesto Jr. $32,687
Monterey Peninsula $32,687
Moorpark $32,687
Mt. San Antonio $32,687
Mt. San Jacinto $32,687
Napa Valley $32,687
Palomar $32,687
Pasadena $32,687
Reedley $101,087
Rio Hondo $32,687
Riverside $32,687
Saddleback $32,687
Sacramento City $32,687
San Diego $203,687
San Francisco City College $32,687
San Joaquin Delta $32,687
Santa Ana $32,687
Santa Barbara City $32,687
Santa Monica $32,687
Santa Rosa Junior $32,687
Shasta $32,687
Sierra $146,687
Solano $32,687
Southwestern $32,687
Ventura $32,687
Victor Valley $32,687
West Hills - Lemoore $32,687
Yuba $32,687
Total $4,476,890

12 | California Community Colleges Chancellor’s Office
Table 2 Workforce Investment Act Funds
Nursing Education Initiative Phase II
College Region 2010 2011 2012 2013 2014
Required Additional
Enrollments over five
years
Center for Nursing Expansion/Innovation
Santa Barbara City 6 $465,172 $465,172 $465,172 $465,172 $465,172 134
Napa Valley 4 $465,177 $465,177 $465,177 $465,177 $465,177 134
Golden West 8 $340,857 $340,857 $340,857 $340,857 $340,857 134
Santa Ana 8 $385,862 $385,862 $385,862 $385,862 $385,862 132
Healthy Community Forum
American River 2 $271,789 $271,789 $271,789 $271,789 $271,789 67
Butte 1 $271,975 $271,975 $271,975 $271,975 $271,975 67
Sequoias 5 $263,427 $266,817 $266,817 $266,817 $266,817 67
Mt. San Jacinto 9 $260,371 $260,371 $260,371 $260,371 $260,371 67
LA Harbor 7 $271,975 $271,975 $271,975 $271,975 $271,975 67
Total $2,996,605 $2,999,995 $2,999,995 $2,999,995 $2,999,995 869

Nursing Education Programs 2 0 1 0 | 13
Table 3 Workforce Investment Act Funds
Specialty Nursing
LVN to RN
College 2008/09 2009/10
College of the Canyons $50,000 $173,741
Mt. San Jacinto College $50,000 $244,766
Total Requested $100,000 $418,507
Specialty Nursing
College 2008/09 2009/10
College of the Canyons $50,000 $144,478
Los Angeles City College $67,114 $125,000
Santa Monica College $222,015
Total Requested $117,114 $491,493
Paramedic Programs
College 2008/09 2009/10
College of the Canyons $125,000
Victor Valley College $125,000 $ 125,000
Fresno $125,000
Napa Valley $125,000 $ 115,000
Total Requested $500,000 $240,000
Independent Duty Corpsmen
College 2008/09 2009/10
Southwestern CC $100,000
MiraCosta $100,000 $ 150,000
Total Requested $200,000 $150,000
Total Allocated $917,114 $1,300,000
14 | California Community Colleges Chancellor’s Office
Table 4 Workforce Investment Act Funds Allied Health Programs, Phase I
College
2008-09 Grant
Amount
2009-10 Grant
Amount* Occupation
Planned Increased Enrollments
09-10 10-11 11-12 Total
Allan Hancock $118,247 $107,455 Dental Assistant 15 15 15 45
American River $25,000 Speech Pathology 18 18 18 54
Antelope Valley $128,728 Radiologic Technologists 12 12 12 36
Cañada $46,011 $47,283 Radiologic Technologists 50 60 60 170
Medical Assistant 33 40 40 113
Citrus $128,900 $128,900 Dental Assistant 10 10 10 30
Nursing Assistant 60 60 60 180
Emergency Medical Technician 45 45 45 135
Coalinga $271,375 Psychiatric Technician 45 45 45 135
College of Marin $106,500 Dental Assistant 10 0 0 10
College of Sequoias $21,148 $5,680 Health Care Interpreter 20 20 20 60
Cosumnes $108,677 $108,769 Emergency Medical Technician 88 88 88 264
Pharmacy Technician 30 60 60 150
Cypress $206,938 $182,033 Dental Assistant 6 7 8 21
Health Information Technology 22 25 27 74
Dental Hygiene 2 2 2 6
Diablo Valley $399,942 Medical Lab Technician 25 50 0 75
Feather River $101,600 $71,315 Licensed Vocational Nurse 3 3 3 9
Nursing Assistant 37 37 37 111
Home Health Aide 20 20 20 60
Personal Care Attendant 40 40 40 120
Fresno City $130,417 Radiologic Technologists 15 15 15 45
L.A. Trade Tech $62,000 Medical Assistant 15 30 30 75
Lemoore $206,576 $192,655 Nursing Assistant 45 45 45 135
Long Beach City $75,288 $46,923 Licensed Vocational Nurse 10 10 10 30
Los Medanos $54,720 $59,026 Licensed Vocational Nurse 10 10 0 20
Merced $55,608 $34,929 Nursing Assistant 5 10 12 27
Radiologic Technologists 3 5 6 14
Riverside/ Moreno Valley
$495,000 $533,951 Speech Language Pathology Asst. 30 60 70 160
Nursing Assistant 75 75 90 240
Medical Assistant 17 22 27 66
Mt. San Antonio $159,778 Nursing Assistant 120 120 0 240

Nursing Education Programs 2 0 1 0 | 15
Table 4 Workforce Investment Act Funds Allied Health Programs, Phase I
College
2008-09 Grant
Amount
2009-10 Grant
Amount* Occupation
Planned Increased Enrollments
09-10 10-11 11-12 Total
Orange Coast $123,200 $95,305 Respiratory Therapy 12 12 12 36
Reedley $50,719 n/a Dental Assistant 14 14 14 42
Saddleback $437,095 $334,025 Medical Lab Technician 20 40 50 110
Santa Monica $178,090 Respiratory Therapy Program 10 10 10 30
Home Health Aide 20 20 20 60
Siskiyous $21,148 $208,885 Nursing Assistant 45 45 45 135
Licensed Vocational Nursing 20 20 20 60
Taft $80,000 Dental Hygiene 8 8 8 24
Ventura $266,174 Medical Assistant 30 30 30 90
Nursing Assistant 60 60 60 180
Personal Care Assistant 45 45 45 135
Phlebotomy 35 35 35 105
Yuba $51,150 $64,994 Psychiatric Technician 10 10 10 30
Total Funds Awarded $3,710,087 $2,622,070 Total Enrollments 1,265 1,408 1,274 3,947
NOTE: Several colleges did not ask for funding for all three funding cycles; in addition, several colleges did not submit
paperwork in time to be funded for the second cycle.
* Funds requested for the second cycle exceeded WIA funds available. ARRA funds were provided to make up the difference.

16 | California Community Colleges Chancellor’s Office
Table 5 American Recovery and Reinvestment Act Funds (ARRA)
Allied Health Programs, Phase II
College Grant Amount
2009-2011 Occupation Enrollments
American River $301,825 Respiratory Care Practitioner 10
Canada $138,713 Radiologic Technologists 100
Cerritos $252,542 Pharmacy Technician 45
City College of San Francisco $276,231 Certified Nurse Assistant 30
Medical Evaluation Assistant 20
College of Sequoias $245,854 Medical Assistant 20
Medical Asst/Medical Lab Technologists 24
College of the Canyons $414,715 Medical Laboratory Technologist 24
East Los Angeles $391,567 Health Information Technologist 20
Respiratory Therapist 30
Las Positas $122,947 Pharmacy Technician 48
Miramar $414,715 Medical Laboratory Technologist 10
Moorpark $320,494 Nuclear Medicine Technologists 16
Health Information Technologist 40
Riverside CCD/Moreno Valley Campus $364,718 Dental Assistant 30
Dental Hygienist 15
North Orange County CCD/ School of Continuing Education $235,854 Medical Assistant 40
Pasadena City $414,718 Medical Assistant 10
Medical Asst/Medical Lab Technologists 10
Radiologic Technologists 20
Dental Lab Technician 20
Dental Assistant 20
Sacramento City $302,717 Dental Assistant 20
San Diego Mesa $414,718 Radiologic Technologists 10
Interventional Radiology 10
Radiology - Magnetic Resonance Imaging 10
Radiology - CAT Scan 20
Santa Ana $414,718 Pharmacy Technician 100
Santa Barbara City $143,511 Medical Assistant 50
West Los Angeles $414,714 Pharmacy Technician 105
West Hills College Lemoore $414,718 Sterile Processing Technician 30
Electrocardiograph Technician 20
EMT (Emergency Medical Technician) 10
Medical Assistant 20
Total Funds Awarded $5,999,989 Total New Enrollments 1,007

Nursing Education Programs 2 0 1 0 | 17
Table 6 Community College Associate Degree Nursing (RN) 2009-10 Retention/Completion Data
School Name Program
Percent Completed
On Time
Percent Still
Enrolled
Percent Completed
Late Attrition
Rate
Allan Hancock College LVN to RN 85% 0% 0% 15%
American River College GADN 68% 7% 5% 20%
Antelope Valley College GADN 59% 21% 4% 16%
Bakersfield College GADN 84% 5% 5% 6%
Butte Community College GADN 85% 0% 0% 15%
Cabrillo College GADN 96% 0% 0% 4%
Cerritos College GADN 64% 19% 4% 13%
Chabot College GADN 79% 0% 0% 21%
Chaffey College GADN 56% 19% 19% 6%
Citrus College GADN 85% 2% 0% 13%
City College of San Francisco GADN 73% 4% 0% 23%
College of Marin GADN 94% 0% 2% 4%
College of San Mateo GADN 84% 3% 0% 12%
College of the Canyons GADN 80% 0% 16% 4%
College of the Desert GADN 68% 0% 0% 32%
College of the Redwoods GADN 80% 0% 0% 20%
College of the Sequoias GADN 82% 3% 1% 14%
College of the Siskiyous LVN to RN 96% 0% 0% 4%
Contra Costa College GADN 70% 13% 13% 4%
Copper Mountain College GADN 92% 0% 0% 8%
Cuesta College GADN 89% 5% 0% 5%
Cypress College GADN 75% 6% 8% 11%
DeAnza College GADN 66% 8% 6% 20%
East Los Angeles GADN 28% 6% 57% 9%
El Camino College GADN 49% 13% 1% 37%
El Camino College - Compton Education Center GADN 55% 23% 6% 16%
Evergreen Valley College GADN 65% 6% 5% 24%
Fresno City College GADN No data reported
Gavilan College LVN to RN 83% 0% 0% 17%
Glendale Community College GADN 78% 3% 3% 17%
Golden West College GADN 79% 4% 2% 15%
Grossmont College GADN 74% 6% 1% 18%
Hartnell College GADN 88% 3% 0% 10%
Imperial Valley College GADN 54% 15% 15% 15%
Long Beach City College GADN 52% 5% 12% 32%
Los Angeles City College GADN 83% 0% 0% 17%
Los Angeles Harbor College GADN 36% 26% 0% 38%
Los Angeles Pierce College GADN 78% 0% 12% 10%
Los Angeles Southwest College GADN 46% 16% 22% 16%
Los Angeles Trade-Tech College GADN 50% 6% 6% 38%
Los Angeles Valley College GADN 71% 7% 7% 16%
Los Medanos College GADN 66% 9% 0% 25%
Mendocino College GADN 84% 5% 0% 11%

18 | California Community Colleges Chancellor’s Office
Table 6 Community College Associate Degree Nursing (RN) 2009-10 Retention/Completion Data
School Name Program
Percent Completed
On Time
Percent Still
Enrolled
Percent Completed
Late Attrition
Rate
Merced College GADN 100% 0% 0% 0%
Merritt College GADN 29% 3% 0% 68%
Mira Costa College LVN to RN No data reported
Mission College LVN to RN 95% 0% 0% 5%
Modesto Junior College GADN 82% 0% 14% 4%
Monterey Peninsula College GADN 94% 0% 0% 6%
Moorpark College GADN 78% 3% 1% 18%
Mount San Antonio College GADN 68% 5% 4% 23%
Mount San Jacinto College GADN 72% 23% 0% 5%
Napa Valley College GADN 80% 0% 20% 0%
Ohlone College GADN 81% 5% 0% 14%
Palomar College GADN 50% 15% 1% 34%
Pasadena City GADN 83% 5% 1% 11%
Rio Hondo College GADN 73% 4% 3% 20%
Riverside Community College GADN 83% 12% 2% 2%
Sacramento City College GADN 47% 8% 14% 31%
Saddleback College GADN 78% 0% 10% 11%
San Bernardino Valley College GADN 88% 1% 4% 7%
San Diego City College GADN 68% 5% 4% 23%
San Joaquin Delta College GADN 75% 5% 6% 13%
Santa Ana College GADN 66% 11% 9% 15%
Santa Barbara City College GADN 53% 4% 29% 14%
Santa Monica College GADN 67% 12% 0% 20%
Santa Rosa Junior College GADN 93% 0% 0% 7%
Shasta College GADN 73% 8% 7% 12%
Sierra College GADN No data reported
Solano Community College GADN 59% 9% 21% 11%
Southwestern College GADN 82% 7% 8% 3%
Ventura College GADN 70% 2% 15% 13%
Victor Valley College GADN 66% 9% 13% 12%
West Hills College Lemoore GADN 83% 0% 0% 17%
Yuba College GADN 43% 17% 0% 40%
Average for all California Community Colleges 69% 8% 7% 16%

Nursing Education Programs 2 0 1 0 | 19
Table 7 Data for Colleges that used Assessment Testing as Part of the Selection Process
Total Number of Students Assessed: 21,736 Total Numberof Students Who Passed Test: 19,135 Percent of Total: 88%
Gender Total
Tested
Number that
Passed % of Total
Tested
Number that did not Pass
% of Total
Tested
Female 17,239 15,032 69.2% 2,207 10.2%
Male 3,832 3,522 16.2% 310 1.4%
Not Listed 665 581 2.7% 84 0.4%
Ethnicity Total
Tested
Number that
Passed
% of Total
Tested
Number that did not Pass
% of Total
Tested
African American 1,117 811 3.7% 306 1.4%
American Indian 137 123 0.6% 14 0.1%
Asian 4,328 3,659 16.8% 669 3.1%
Pacific Islander 195 172 0.8% 23 0.1%
Filipino 1,018 899 4.1% 119 0.5%
Hispanic 3,875 3,227 14.8% 648 3.0%
White-NonHispanic 8,169 7,743 35.6% 426 2.0%
Other 543 510 2.3% 33 0.2%
Unknown 2,354 1,991 9.2% 363 1.7%
Language Spoken at Home
Total Tested
Number that Passed
% of Total Tested
Number that did not Pass
% of Total
Tested
Arabic 18 11 0.8% 7 0.1%
Chinese 138 120 4.1% 18 0.5%
English 17,428 15,684 14.8% 1,744 3.0%
Farsi 41 29 35.6% 12 2.0%
Russian 149 114 2.3% 35 0.2%
Spanish 844 618 9.2% 226 1.7%
Tagalog 216 188 88.0% 28 12.0%
Other 394 327 0.0% 67 0.0%
No Response 2,508 2,044 0.0% 464 0.0%

20 | California Community Colleges Chancellor’s Office
Disability Accommodation
Total Tested
Number that
Passed % of Total
Tested
Number that did not Pass
% of Total
Tested
Yes 278 201 0.9% 77 0.4%
No 15,785 14,027 64.5% 1,758 8.1%
NDA 5,673 4,907 22.6% 766 3.5%
Age Cohort Total
Tested
Number that
Passed % of Total
Tested
Number that did not Pass
% of Total
Tested
<19 29 29 0.2% 0 0.0%
20-24 2,232 2,087 10.9% 145 0.8%
24-29 2,420 2,235 11.7% 185 1.0%
30-34 1,488 1,364 7.1% 124 0.6%
35-39 1,163 1,062 5.6% 101 0.5%
40-49 1,310 1,149 6.0% 161 0.8%
>50 374 324 1.7% 50 0.3%
NDA 12,720 10,885 56.9% 1,835 9.6%
Status of Successful Students Fall 08 Spring
09 Fall 09 Spring
10
0: Tested but did not apply at this site 254 454 390 844
1: Applied but not selected 1,336 1956 1842 1920
2: Selected but needed to remediate 22 28 47 24
3: Selected but not enrolled (on waitlist) 1,423 1257 1089 891
4: Selected but not enrolled (choose not to enroll) 197 250 356 229
5: Initial enrollment 1,767 1,400 1,795 1,128
6: Continuing enrollment 1,562 2,464 2,951 3,190
7: Graduation 104 621 551 1,260
8: Dropped for academic reasons (not eligible for return) 46 57 104 102
9: Dropped for academic reasons (eligible for return) 138 258 268 307
10: Dropped for other reasons 58 97 86 95
11: Transfer out 7 3 1 4
12: Transfer in (initial enroll) 15 7 14 20
X: No information available at this date 12,206 10,283 9,641 9,121

Nursing Education Programs 2 0 1 0 | 21
Remediation Participation Count Percent in
Remediation
Yes 771 30%
No 816 Blank 1,014 Total 2,601
Remediation Completion Count Percent Remediated
Yes 692 27%
No 821 Blank 1,088 Total 2,601
Status of Unsuccessful Students Fall 08 Spring
09 Fall 09 Spring
10
0: Tested but did not apply at this site 93 96 93 93
1: Applied but not selected 178 201 222 209
2: Selected but needed to remediate 225 221 256 230
3: Selected but not enrolled (on waitlist) 68 63 82 68
4: Selected but not enrolled (choose not to enroll) 37 29 34 35
5: Initial enrollment 83 57 71 70
6: Continuing enrollment 144 144 150 143
7: Graduation 6 54 7 15
8: Dropped for academic reasons (not eligible for return) 17 16 19 13
9: Dropped for academic reasons (eligible for return) 34 39 29 29
10: Dropped for other reasons 23 7 22 21
11: Transfer out 1 0 1 1
12: Transfer in (initial enroll) 0 1 0 1
X: No information available at this date 1,692 1,673 1,615 1,673

22 | California Community Colleges Chancellor’s Office
Table 8 National Council Licensing Exam - Registered Nursing
College Pass Rates
College
2005/2006 2006/2007 2007/2008 2008/2009 2009/2010
# Taken
% # Taken
% # Taken
% # Taken
% # Taken
%
Pass Pass Pass Pass Pass
Allan Hancock 23 78.26% 33 87.88% 34 82.35% 40 80% 35 80%
American River 112 89.29% 122 81.15% 100 84% 118 91.53% 103 92.23%
Antelope Valley 104 87.50% 78 94.87% 156 82.69% 129 89.92% 129 94.57%
Bakersfield 105 89.52% 97 93.81% 156 87.82% 151 80.13% 190 93.16%
Butte 18 77.78% 66 78.79% 59 67.80% 72 79.17% 85 82.35%
Cabrillo 41 95.60% 55 87.27% 61 93.44% 64 85.94% 57 85.96%
Cerritos 110 81.82% 96 85.42% 90 81.11% 81 96.30% 96 93.75%
Chabot 31 100% 44 100% 34 97.06% 46 97.83% 40 95%
Chaffey 53 98.11% 49 100% 44 95.45% 40 100% 52 96.15%
Citrus N/A N/A N/A N/A 2 100% 22 77.27% 1 100%
City College of San Francisco 66 90.91% 71 85.92% 108 84.26% 99 83.84% 103 89.32%
College of Marin 50 90% 36 80.56% 22 81.82% 44 95.45% 44 84.09%
College of San Mateo 51 90.20% 56 80.36% 41 80.49% 59 83.05% 55 70.91%
College of the Canyons 59 89.83% 89 80.90% 84 83.33% 138 88.41% 118 88.14%
College of the Desert 118 88.14% 114 84.21% 67 82.09% 104 85.58% 115 92.17%
College of the Redwoods 35 82.86% 69 89.86% 43 88.37% 69 81.16% 43 76.74%
College of the Sequoias 132 87.60% 77 74.03% 141 75.89% 173 91.33% 155 89.03%
College of the Siskiyous N/A N/A N/A N/A 2 100% 22 95.45% 27 96.30%
Contra Costa 43 97.67% 75 96% 81 91.36% 52 92.31% 51 96.08%
Copper Mountain N/A N/A 1 0% 33 75.76% 19 84.21% 29 75.86%
Cuesta 30 96.67% 64 96.88% 46 95.65% 55 90.91% 51 92.16%
Cypress 65 95.38% 92 98.91% 79 97.47% 100 94% 83 95.18%
De Anza 67 86.57% 82 80.49% 73 73.97% 78 87.18% 85 85.88%
East Los Angeles 74 85.14% 111 75.68% 90 64.44% 107 74.77% 120 61.67%
El Camino 95 80% 115 81.74% 95 85.26% 103 91.26% 113 92.04%
El Camino - Compton Ed. Center 17 52.94% 34 85.29% 17 88.24% 65 66.15% 57 71.93%
Evergreen Valley 57 91.23% 54 92.59% 68 88.24% 47 89.36% 65 86.15%
Fresno City 173 74.57% 235 85.11% 303 79.87% 268 76.49% 308 77.92%
Gavilan 13 100% 28 96.43% 12 83.33% 19 84.21% 23 91.30%
Glendale 57 87.72% 94 87.23% 90 95.56% 94 88.30% 115 93.04%
Golden West 113 91.15% 103 90.29% 123 93.50% 172 87.79% 143 91.61%
Grossmont 101 86.14% 136 91.91% 145 79.31% 102 84.31% 141 89.36%
Hartnell 16 100% N/A N/A 18 94.44% 32 84.38% 37 91.89%
Imperial Valley 55 80% 60 78.33% 56 66.07% 75 61.33% 76 88.16%
Long Beach City 111 92.79% 106 88.68% 91 92.31% 135 97.04% 110 98.18%
Los Angeles City 38 86.84% 57 91.23% 33 66.67% 65 86.15% 39 89.74%
Los Angeles Harbor 67 100% 97 94.85% 95 93.68% 97 95.88% 105 95.24%
Los Angeles Pierce 73 72.60% 68 73.53% 69 82.61% 48 85.42% 48 97.92%
Los Angeles Southwest 51 58.82% 30 73.33% 35 85.71% 49 79.59% 40 82.50%
Los Angeles Trade-Tech 52 73.08% 48 62.50% 49 61.22% 32 62.50% 65 75.38%
Los Angeles Valley 98 77.55% 75 84% 73 87.67% 71 90.14% 109 88.07%
Los Medanos 55 92.73% 34 85.29% 46 82.61% 45 91.11% 59 91.53%

Nursing Education Programs 2 0 1 0 | 23
Table 8 National Council Licensing Exam - Registered Nursing
College Pass Rates
College
2005/2006 2006/2007 2007/2008 2008/2009 2009/2010
# Taken
% # Taken
% # Taken
% # Taken
% # Taken
%
Pass Pass Pass Pass Pass
Mendocino 9 88.89% 18 83.33% 19 89.47% 37 94.59% 15 93.33%
Merced 44 86.36% 39 92.31% 35 68.57% 42 78.57% 50 80%
Merritt 27 96.30% 35 85.71% 43 95.35% 24 95.83% 68 97.06%
MiraCosta N/A N/A N/A N/A 7 100% 26 100% 21 90.48%
Mission N/A N/A N/A N/A N/A N/A N/A N/A 28 82.14%
Modesto Junior 107 96.26% 160 93.13% 144 93.06% 125 93.60% 123 86.18%
Monterey Peninsula 32 90.63% 48 97.92% 44 88.64% 44 86.36% 52 100%
Moorpark 69 95.65% 90 95.56% 70 91.43% 76 89.47% 94 88.30%
Mt. San Antonio 112 88.39% 102 95.10% 127 95.28% 239 89.54% 169 94.08%
Mt. San Jacinto 61 86.89% 61 91.80% 74 85.14% 70 88.57% 75 96%
Napa Valley 36 86.11% 84 80.95% 81 75.31% 75 78.67% 69 84.06%
Ohlone 47 97.87% 57 92.98% 50 90% 46 95.65% 48 95.83%
Palomar 58 98.28% 67 98.51% 41 97.56% 71 97.18% 55 87.27%
Pasadena City 107 85.98% 101 94.06% 113 93.81% 110 90% 121 86.78%
Porterville N/A N/A N/A N/A N/A N/A N/A N/A N/A N/A
Reedley N/A N/A N/A N/A N/A N/A N/A N/A N/A N/A
Rio Hondo 74 72.97% 83 85.54% 88 78.41% 99 92.93% 116 91.38%
Riverside 117 94.02% 131 95.42% 176 88.64% 206 89.81% 178 92.70%
Sacramento City 93 98.92% 144 99.31% 143 96.50% 160 92.50% 85 92.94%
Saddleback 96 96.88% 105 99.05% 125 94.40% 113 95.58% 107 99.07%
San Bernardino Valley 107 92.52% 78 85.90% 76 89.47% 90 82.22% 101 82.18%
San Diego City 62 91.94% 62 88.71% 74 93.24% 75 88% 56 89.29%
San Joaquin Delta 103 82.52% 139 79.14% 132 71.97% 179 85.47% 153 88.89%
Santa Ana 87 88.51% 104 93.27% 104 86.54% 131 85.50% 111 95.50%
Santa Barbara City 44 90.91% 41 90.24% 35 88.57% 47 93.62% 69 88.41%
Santa Monica 63 87.30% 57 92.98% 74 81.08% 56 94.64% 78 97.44%
Santa Rosa Junior 86 96.51% 68 97.06% 76 93.42% 125 94.40% 123 91.87%
Shasta 58 81.03% 86 90.70% 92 91.30% 62 91.94% 49 83.67%
Sierra 68 98.53% 23 100% 54 98.15% 70 92.86% 50 94%
Solano 70 85.71% 31 70.97% 28 82.14% 79 77.22% 56 85.71%
Southwestern 39 84.62% 50 82% 54 83.33% 70 91.43% 68 73.53%
Ventura 88 89.77% 75 93.33% 112 89.29% 92 92.39% 108 92.59%
Victor Valley 76 86.84% 41 87.80% 69 95.65% 95 88.42% 107 92.52%
West Hills Lemoore N/A N/A N/A N/A N/A N/A N/A N/A 2 100%
Yuba 32 100% 35 91.43% 37 89.19% 50 86% 40 92.50%

24 | California Community Colleges Chancellor’s Office