STATE OF ALASKA DEPARThXENT OF NATURAL...
68
STATE OF ALASKA DEPARThXENT OF NATURAL RESOUJXCES DIVISION OF GEOLOGICAL AND GEOPHYSICAL SURVEYS Walter J. Hickel, &vernor Glenn A. Olds, Commissioner Thomas E. Smith, Director and State Geologist July 1992 Report of Investigations 92-2 RECHARGE AREA EVALUATION FOR MOONLIGHT SPRINGS, NOME, ALASKA BY J.A. Munter, M.A. Maurer, M.G. Inghram, and W.A. Petrik Division of Water In cooperation with the City of Nome
Transcript of STATE OF ALASKA DEPARThXENT OF NATURAL...

STATE OF ALASKA
DEPARThXENT OF NATURAL RESOUJXCES
DIVISION OF GEOLOGICAL AND GEOPHYSICAL SURVEYS
Walter J. Hickel, &vernor
Glenn A. Olds, Commissioner
Thomas E. Smith, Director and State Geologist
July 1992
Report of Investigations 92-2RECHARGE AREA EVALUATION FOR
MOONLIGHT SPRINGS, NOME, ALASKABY
J.A. Munter, M.A. Maurer,M.G. Inghram, and W.A. Petrik
Division of Water
In cooperation with the City of Nome
STATE OF ALASKADepartment of Natural Resources
DIVISION OF GEOLOGICAL & GEOPHYSICAL SURVEYS
According to Alaska Statute 41, the Alaska Division of Geological and Geophysical Surveys is chargedwith conducting “geological and geophysical surveys to determine the potential of Alaskan land for productionof metals, minerals, fuels, and geothermal resources; the locations and supplies of ground water andconstruction materials; the potential geologic hazards to buildings, roads, bridges, and other installations andstructures; and shall conduct such other surveys and investigations as will advance knowledge of the geologyof Alaska.”
Administrative functions are performed under the direction of the State Geologist, who maintains his officein Fairbanks. The locations of DGGS offices are listed below:
794 University Avenue 400 Willoughby Avenuesuite 200 3 rd FloorFairbanks, Alaska 99709-3645 Juneau, Alaska 99801(907) 474-7147 (907) 465-2533
Geologic Materials Center18225 Fish Hatchery RoadP.O. Box 772116Eagle River, Alaska 99577(907) 696-0070
This report, printed in Fairbanks, Alaska, is for sale by DGGS for $3. DGGS publications may beinspected at the following locations. Address mail orders to the Fairbanks office.
Alaska Division of Geological & Geophysical Surveys794 University Avenue, Suite 200
Fairbanks, Alaska 99709-3645
Department of Natural ResourcesPublic Information Center3601 C Street, Suite 200
Anchorage, Alaska 99 110
U.S. Geological Survey Earth Science Information CenterGrace Hall, Alaska Pacific University Campus 605 West 4th Avenue4230 University Drive, Room 101 Room G84Anchorage, Alaska 995084664 Anchorage, Alaska 99501-2299
ii

CONTENTSPage
Introduction ....................................................................................................................Acknowledgments .............................................................................................................Previous investigations .......................................................................................................Geological setting .............................................................................................................Data collection .................................................................................................................Results .........................................................................................................................
Geology ......................................................................................................................Hydrology ...................................................................................................................Snow surveys ...............................................................................................................Water quality and isotopes ................................................................................................
Water analysis results and discussion ................................................................................Historical data validity .................................................................................................
Dissolved-constituents ...............................................................................................Tritium .................................................................................................................
Historical data comparisons ...........................................................................................Water budget ...................................................................................................................IllkrpEtatiOllS ..................................................................................................................
Moonlight Springs ground-water flow system .........................................................................Primary recharge area boundary .........................................................................................Sandary recharge area boundary ......................................................................................Low or non-recharge areas ...............................................................................................
Conclusions ....................................................................................................................References ......................................................................................................................Appendix A - Water-quality field measurements .........................................................................Appendix B - Waterquality analytical results ............................................................................Appendix 6 - Laboratory quality assurance evaluation report .........................................................Appendix D - Historical waterquaiity data for Moonlight Springs and vicinity, 1954-83 ........................Appendix E - Water-use records and statistics for Nome, Alaska .....................................................
F IGURES
11122556899
1 21 21 21 2131 51 51 51 6161 6181 923556167
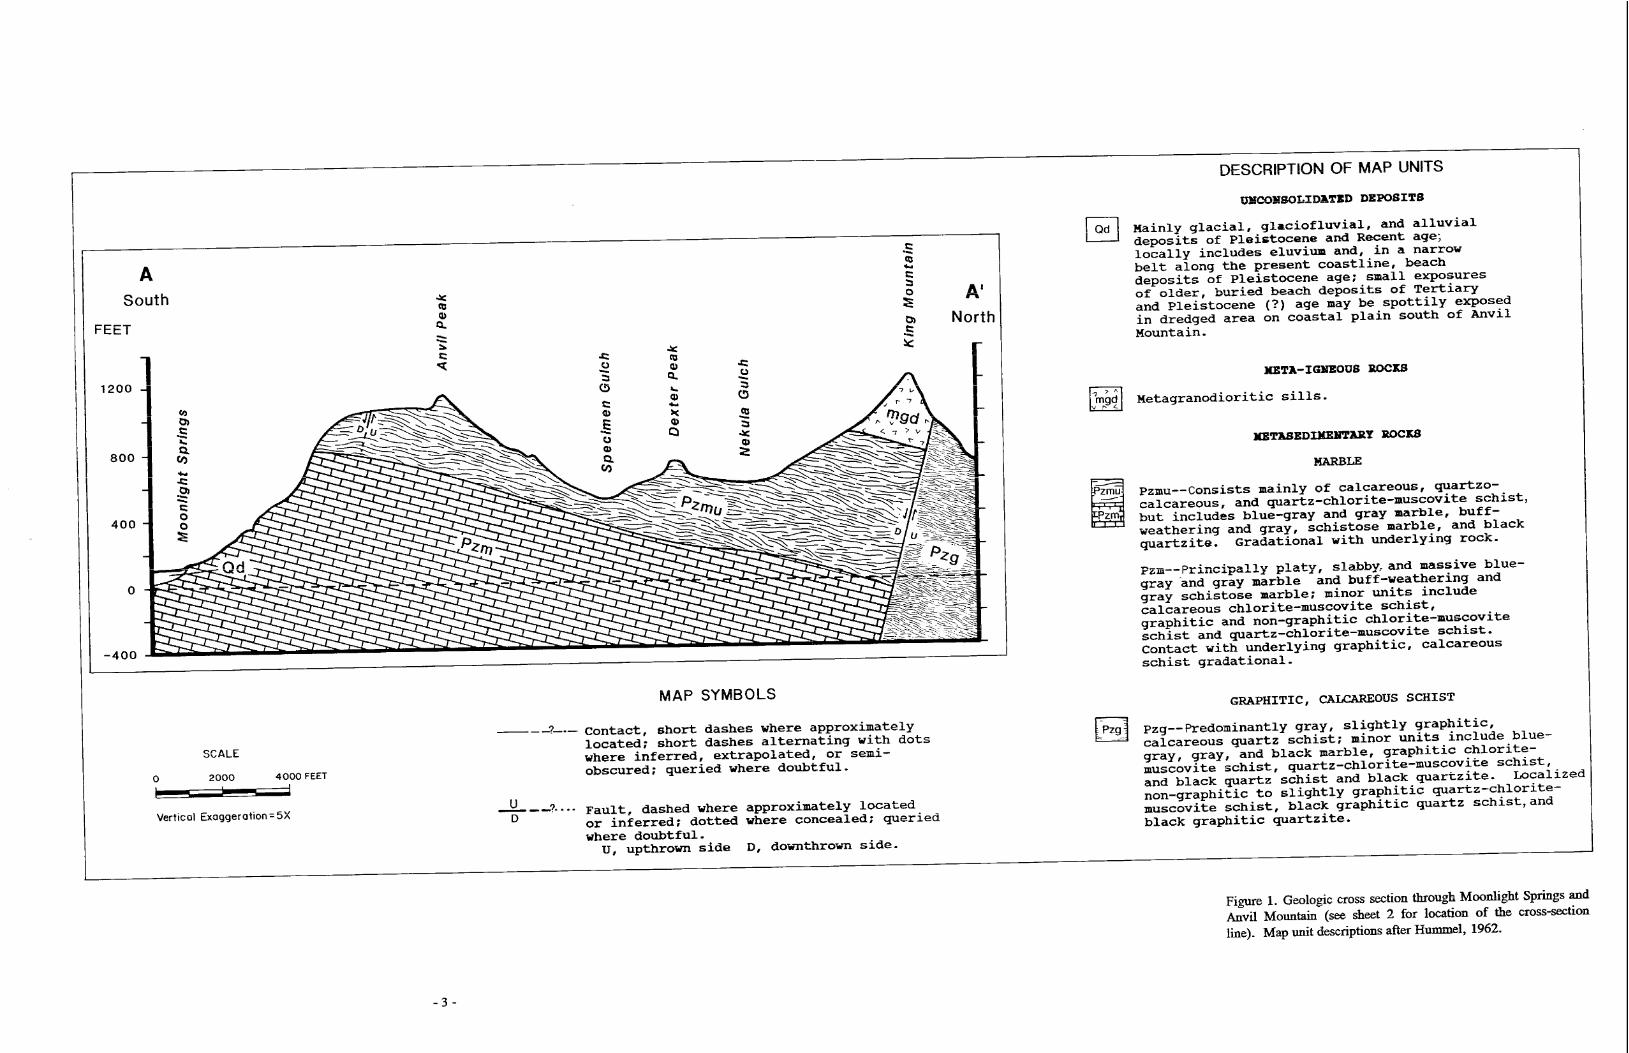
Figure I. Geologic cross section through Moonlight Springs and Anvil Mountain ............................
Figure 2. Graph showing total Moonlight Springs discharge and average total water use by theCity of Nome. ...............................................................................................
Figure 3. Graph showing total Moonlight Springs discharge, water temperature at the collectiongallery, and daily precipitation at Nome Airport ......................................................
Figure 4. Graph showing total Moonlight Springs discharge and mean daily air temperature atNome Airport ...............................................................................................
Figure 5. Graph showing daily average water temperature for Moonlight Springs collectiongallery and daily average air temperature for Nome Airport ........................................
Figure 6. Graph showing Anvil Creek discharge and daily precipitation at Nome Airport ....................Fiprre 7. Trilinear diagram of Nome area ground waters ...........................................................
TABLES
3
6
7
8
91 01 3
Table 1. Miscellaneous discharge measurements for Anvil Creek, Nome, Alaska ............................. 1 0Table 2. Precipitation data collected near Moonlight Springs during 1990 and 1991 .......................... 11Table 3. Snow survey measurements, Anvil Mountain area, Nome, Alaska .................................... 11
. . .- 111 -

SHEETSIIn pocket]
Sheet 1. Location of water-quality and isotope sample sites, Moonlight Springs area, Nome, AlaskaSheet 2. Geologic map, hydrologic data collection sites, and Moonlight Springs recharge area,
Anvil Creek-Moonlight Springs area, Nome, Alaska
- iv -

RECEIARGE AREA EVALUATION FOR MOONLIGHT SPRINGS, NOME, ALASKA
B YJ.A. MuII&.~,~ M.A. Maure.r,l M.G. Inghram,l and W.A. Petrikl
INTKoDucTroly
The City of Nome, Alaska, obtains 100 percent of its water supply from an underground collection gallery atMoonlight Springs. The springs are located at the foot of Anvil Mountain, approximately 6 km (3.7 mi) inlandfrom Nome and the Bering Sea. Recent gold exploration and mining near the springs have created increasedinterest in understanding the factors that govern the existence of the springs and in identifying recharge areas toprotect from contamination or diminution of spring flows.
This 2-yr investigation was initiated in September 1989 to define the source, watershed, and recharge area ofMoonlight Springs. The area’s paucity of wells necessitated using an indirect approach to identify the source andrecharge areas of the springs. The approach consisted of the following:
1 . Reviewing pertinent literature to obtain historic information about the springs;
2 . Conducting geologic reconnaissance to determine the structure and composition of rocks forming theMoonlight Springs aquifer;
3 . Sampling area wells, streams, and springs to determine water-quality variations and draw inferencesabout probable flow paths of ground water;
4 . Sampling local surface and ground waters for hydrogen and oxygen isotopes to use as tracers to inferwater origin;
5 . Establishing a water budget for the Moonlight Springs area by measuring precipitation, snowpack waterequivalent, streamflow and spring discharge to estimate the size of the Moonlight Springs recharge area;and
6 . Delineating primary and secondary recharge area boundaries for the Moonlight Springs recharge areausing available hydrogeological data.
ACKNOWLEDGMENTS
We acknowledge the City of Nome and the Alaska Department of Environmental Conservation for partialfunding for this project. We thank Ott/HDR Engineering, Inc., especially Scott Wheaton, for providing projectnotes and work files from previous work in the area. Roy Ireland and Stan Carrick (Division of Water) assistedwith field data collection. Tenneco Corporation and Alaska Gold Company provided geological information, andthe City of Nome, especially Robert E. Russell, provided information about the Nome water system. Specialappreciation is extended to Nome arcs property owners who graciously allowed access to their property for datacollection. Rick No11 (Division of Water) and Scott Wheaton (Ott/HDR Engineering, Inc.) reviewed the reportand provided many useful comments.
I’KEVTOUS INVESTIGATTONS
Gold mining activity has occurred in and near Nome since the original gold rush at the turn of the century,and ore deposits have been mined elsewhere on the Seward Peninsula. As a result, numerous geological reports
lAlaska Hydrologic Survey, Division of Water, 1822.5 Fish Hatchery Road, P.O. Box 772116, Eagle River, Alaska 99577.
-l-

are available for the Seward Peninsula (Robinson and Stevens, 1984). The most detailed published geologicalmap of the Moonlight Springs ares was done by Hummel (1962). Additional geological information wasprovided by a Tenneco geological exploration team (T. Eggleston, written commun., 1990).
Moonlight Springs is mentioned anecdotally as a source of water in early accounts of Nome’s development.Wailer and Mathur (1960), and Lohr (1957) sampled Moonlight Springs, and six miscellaneous dischargemeasurements taken at the springs between 1954 and 1976 are stored in the U.S. Geological Survey’s database.As-built diagrams of the subsurface collection galiery constructed in 1968 are also available.
Ott Water Engineers, Inc. (1982) and General Electric (1980) collected data to better understand thehydrogeology of the springs and Ott Water Engineers, Inc. (1982) showed a generalized recharge area for thesprings that encompassed Anvil Mountain above an elevation of about 150 m (500 ft). Wailer and Mathur (1960)noted that the springs emerged from ‘flat-bedded limestone. ’ R&M Consultants, Inc. (1981) discussed thehydrogeology of the springs and mapped a “possible sensitive area’ for the catchment area of the springs.
GEOLOGICAL SETTING
Nome is located on the south coastal plain of the Seward Peninsula adjacent to Norton Sound, Bering Sea.The coastal plain extends approximately 5.6 km (3.5 mi) inland to the base of a series of hills and ridges that riseto 550 m (1,800 ft) above sea level (sheet 1). The ridges are oriented predominantly north-south and separated bysouth-flowing primary drainages. The Nome area [including the Kigluaik Mountains located about 48 km (30 mi)north of Nome] was subjected to alpine glaciation during the Pleistocene Epoch (Pew& 1975).
Paleozoic to Tertiary metamorphic and igneous rocks in the Nome area are folded into broad anticlines andsynclines (sheet 2). Several faults occur in the study area, including a major northeast-trending fault in the AnvilCreek valley. Outcrops are typically found near ridgetops. Lower elevation areas are commonly mantled withcolluvium, alluvium, glacial deposits, coastal plain se&men& and placer mine spoils. A geologic cross sectionthrough Moonlight Springs and Anvil Mountain is shown in figure 1.
Nome ties in the region of discontinuous permafrost. Except for mined areas and alluvial sands and gravelsassociated with streams and rivers, the coastal plain is underlain by continuous or near-continuous permafrost.Uplands contain mixed frozen and unfrozen areas. Early 20th century underground miners working in coastal-plain sediments near Nome occasionally encountered “live’ water capable of flooding their undergroundoperations. Coastal plain deposits in the near vicinity of Moonlight Springs were extensively mined, but theextent of mining is undefmed because the detailed maps are not available to the public.
Moonlight Springs is located at a sharp physiographic boundary between flat coastal-plain topography andthe base of the slope leading up to Anvil Mountain. Small water seeps emanate from unconsolidated deposits thatmantle the lower slopes of Anvil Mountain . Most water is collected by perforated underground pipes anddischarged to the City of Nome and an overflow pipe and drainage ditch at Moonlight Springs. Other ground-water discharges occur at scattered locations along a 5OO-m-long lateral zone extending west and northwest fromMoonlight Springs at elevations of about 130 to 140 m above sea level. Regionally, other springs occur on thesouthern Seward Peninsula.
DATA COLLECTION
A reconnaissance-level geologic examination of the Moonlight Springs area was conducted to confirm andsupplement Hummel’s (1962) map. Numerous strikes and dips of rock structure were obtained on AnvilMountain, records from drill holes in Anvil Creek valley were reviewed, and fault locations were examined.Stereoscopic aerial photographs (scale 1:12,000) were used to interpret geologic features. Shallow holes wereexcavated at rain-gage sites to examine suficial deposits.
Water samples were collected at 19 sites (sheet 1). Methods used to sample, analyze, and report waterquality are given by Munter and others (1990) and Munter and others (1991). Ground-water and selected surface-
- 2 -
water samples from 12 of the 19 sites were analyzed for common dissolved ions, trace metals, radioactivity, andtotal iron. Appendix A contains measurements of field parameters made at the time of sample collection, andcomplete analytical results are provided in appendix B.
Stable isotopes of hydrogen (common hydrogen - IH; and deuterium - 2H) and oxygen (common oxygen -160; heavy oxygen - IsO) were sampled at 18 sites shown on sheet 1 and at precipitation gage 8 (sheet 2). Theradioactive isotope. of hydrogen, tritium -3H, was sampled at 12 sites (Q-l, Q-3 to Q-8, Q-15 to Q-17, and I-18)shown on sheet 1 and at precipitation gage 8 (sheet 2). Tritium analyses and stable hydrogen (2H/lII) and oxygen(18G/160) ratio data are provided in appendix B.
Appendix C contains the results of the quality -ce evaluation of data collected during thisinvestigation. Appendix D contains a summary of historic waterquality data from other reports and from theU.S. Geological Survey waterquality database.
To determine Moonlight Springs’ overflow discharges and water temperature, a digital stage recorder andthermistor were installed in the Moonlight Springs collection gallery on September 21, 1989. Total dischargeswere determined by adding total water-use figures to spring-overflow-discharge measurements. Total water-usefigures were obtained from the Nome Joint Utilities (app. E). Water-main leaks that may use up to 60,000 gal perday are unaccounted for and not quantifiable (R.E. Russell, 1992, oral commun.). Overflow dischargemeasurements were determined using the water stage in the collectiou gallery and a rating curve developed bygaging overflow discharges at different flow rates and stage heights.
From June 6, 1990, through August 16, 1990, a stream-gaging station using a float-driven digital stagerecorder was established on Anvil Creek near Moonlight Springs (sheet 2). Discharge measurements were takenon June 8 and 9, 1990, at five Anvil Creek locations (sheet 2). Rain gages were installed at nine locations in thearea. One gage was destroyed soon after installation by excavation work (sheet 2).
On April 2, 1991, snow surveys were conducti at three locations shown on sheet 2. Snowpack depth andwater equivalent were determined using methods described by Soil Conservation Service (1973). A deptb-integrated snow sample was colle~ti at map no. I-18 (see sheet 1) and melted at xnom temperature for tritium andstable isotopic analyses.
A time-averaged precipitation sample was collected by a precipitation collector installed next to rain gagenumber 8 (see sheet 2) on May 29, 1991, and retrieved September 25, 1991. The collector was constructed froma 19.5-cmdiam plastic funnel connected to a 4.1 plastic jug by 4.8 mm (inside diam) thick-walled silicone tubing.The jug was partially buried to limit evaporative loss, and the unshielded funnel was mounted approximately0.5 m above the ground surface. The precipitation sample was submitted for tritium and stable isotopic analyses.
Precipitation and air-temperature data for the Moonlight Springs ares was obtained from National Oceanicand Atmospheric Administration (1989-91). These data are gathered at the Nome Airport about 1.6 km (1 mi)northwest of Nome and about 4.8 km (3 mi) south of Moonlight Springs.
RESULTS
GEOLOGY
Fieldwork conducted during this investigation generally confirmed previous geologic mapping. Marbleoutcrops upslope of Moonlight Springs dip an average of 16O N-NW with a dip range from 6* to 320 in the samegeneral direction. The marble is truncated along the east side of the Anvil Creek valley by a major fault or faultsystem. The fault is not well exposed; its nature and location are approximately shown on sheet 2. Upland areascovered by tundra vegetation are generally underlain by permafrost, and upland elluvian soils are commonlyexpressed as solifluction lobes.
-5-

HYDROLOGY
Figures 2, 3, and 4 show Moonlight Springs discharges for the period of record and average water use,water temperature, air ternpemmm, and precipitation information. Figure 2 compares Nome area water use withtotal Moonlight Springs discharge. A seasonal pattern in total spring discharge is evident, with low flowsoccurring in mid-April. In April 1990, the low flow discharge almost reached average water use for that month.The April 1991 low flow discharge was higher than that of 1990. The brief period of record (approximately 2 yr)precludes correlation of armuaA low flow discharge rates to specific climatic conditions at Nome. Average wateruse by the City of Nome increased slightly during the study period (fig. 2).
Figure 3 shows the relationship between precipitation, water temperature, and discharge. Spring flowsdeclined during the winter -when precipitation fell as snow. Summer spring discharges typicaily rise within a fewdays of large precipitation events, and decline during lengthy periods of scant precipitation. Moonlight Springsdischarges peaked 19 days after the two largest precipitation events in 1990.
As shown on figure 3, the temperature of Moonlight Springs water increases within 1 day after large summerprecipitation events. This results when relatively warm summer ram water mixes with ground water and movesrapidly to Moonlight Springs.
5.0 (
4.5-1
?I2 2.0-cl
5 1.5-
s!l.O-
0.5-MONTHLY AVERAGE WATER USE, CFS
oOb701/a9I I I I I I
03/02/90 09/01/90 03/02/9112/01/89 06/01/90 12/01/90 06/01/91
DATE
Figure 2. Total Moonlight Springs discharge and average total water use by the City of Nome.

Water temperature and discharge are closely related, as shown in figure 3. Water temperature droppedsharply in early May, at about the same time that discharge increased, probably as the result of a sudden influx ofcold snowmelt. The temperature-discharge relationship reversed during summer, when precipitation is warmerthan ground water. Peak summer water tempera- coincided with two major precipitation events mentionedpreviously and with associated increases in discharge. Water temperature increased during the summer andpeaked in mid- to late August. Annual peak discharge occurred shortly thereafter.
Figure 4 shows a close relationship between discharge and air temperature, especially during springsnowmelt. Specifically, as the average daily air temperature rose above 00 C in early May, discharge kgan itssudden seasonal rise due to rapid transmittal of snow-melt water to Moonlight Springs. The close relationshipbetween air temperature and discharge continued until early June, when most snow had melted.
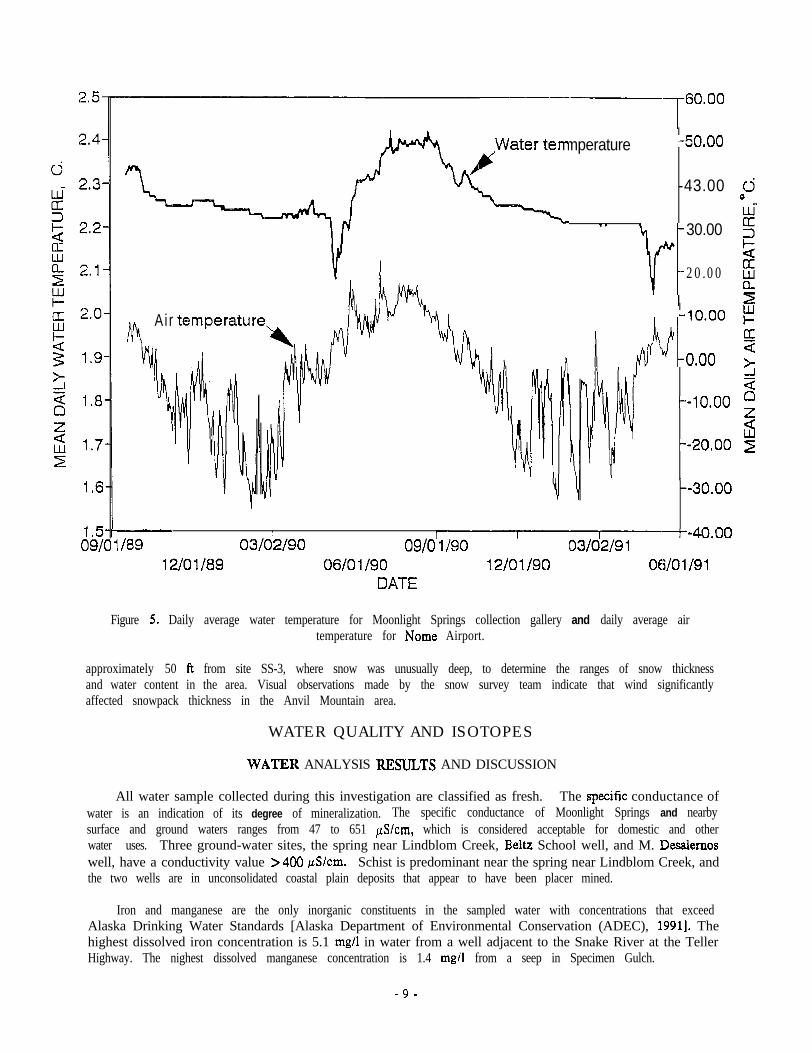
Figure 5 shows a close relationship between air temperature and water temperature at Moonlight Springs. Atthe onset of breakup in 1990 and 1991, water temperature dropped significantly at the same time that the averagedaily air ternperatuxe climbed above freezing. This is attributed to the addition of relatively cold snowmelt.
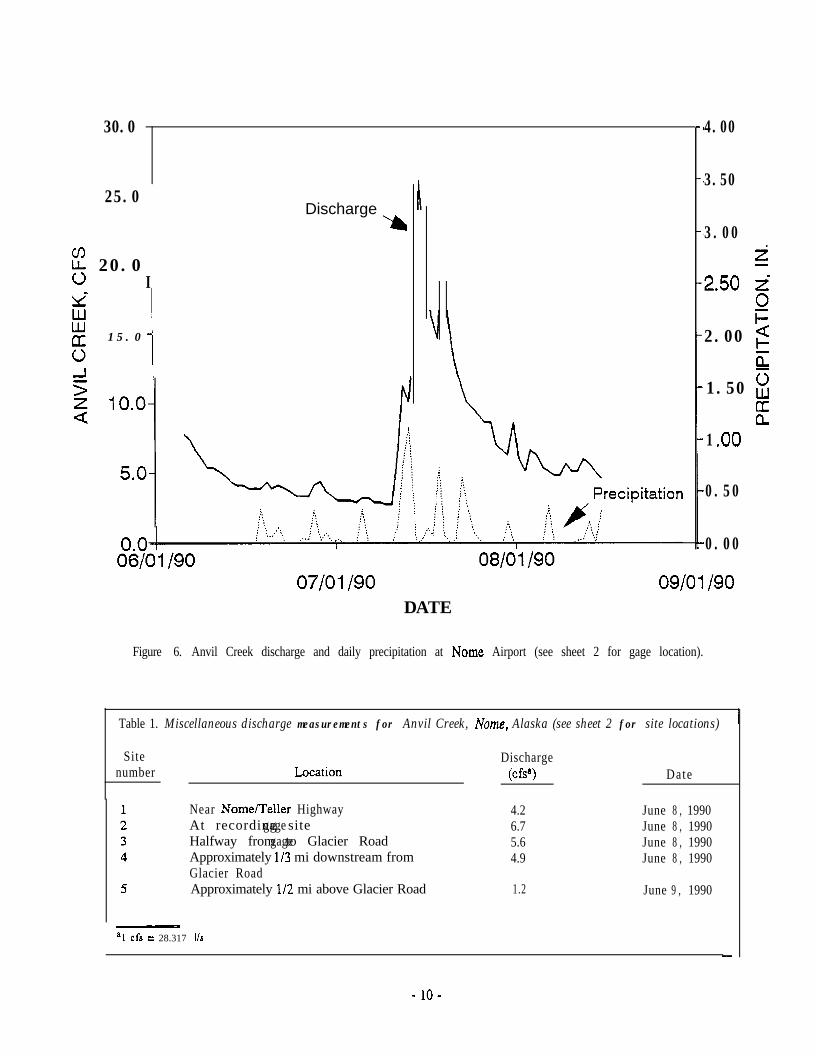
Figure 6 is a plot of Anvil Creek discharge data collected at the gaging site (sheet 2) and precipitation data.Anvil Creek shows a typical rainfall runoff relationship with peak discharges following precipitation events by
2.40
1.80
-1.70
12/O i/89 06/01/90 12/01/90 06/01/91DATE
Figure 3. Total Mmnlight Springs discharge, water temperature at the collection gallery, and daily precipitationat Nome Airport.

4,5-
4.0-
3.5-
3.0-
2.5-
2.0-
1.5-
1 ,o-
I
~b~Ol,89I I I
03/02/90I I I
09/01/90 03/02/g 1
30.0
20.0
0;0
10.0 ii
z
0 . 0Liz!iF
-10.0 51;3n
-20.052
-30.0
40,O
12/01/89 06/01/90 12/o l/90 06/01/91DATE
Figure 4. Total Moonlight Springs discharge and mean daily air temperature at Nome Airport.
approximately 2 days instead of the 19day lag for Moonlight Springs. The falling limb of the hydrograph islikewise much steeper.
Six discharge measuremerits (table 1) were made at different locations in Anvil Creek on June 8 and 9, 1990,to identify areas where the stream may be gaining or losing ground water. No significant amount of ram fell inthe Anvil Creek basin for at least 3 days before the discharge was measured. Stream measurements indicate thatAnvil Creek gains ground-water ahove the gage site and loses water below the gage site. This water loss does notappear to t>e related to Moonlight Springs discharges because the stream gage is at a slightly lower elevation thanMoonlight Springs. It is common for streams such as Anvil Creek to lose water to alluvial gravels where theyexit confined valleys and flow onto broad lowland plains.
Table 2 shows precipitation data collected near Moonlight Springs (see sheet 2 for locations) during 1990and 1991. The data show that average summer precipitation in the Anvil Mountain area is similar to precipitationat the Nome Airport.
SNOW SURVEYS
Table 3 shows results of three snow survey site measurements made on the hillside above MoonlightSprings. Five snowcore samples were collected at each site. In addition, one core measurement was taken
-8-
Air
Water temperature
b’r\ -- -50,oo
-43.002s’ 30.00
20.00
-10.00
h-
Ifa3
0.00 3
--I 0.00 3
2--20,OO g
-- 1 II /a9 03/02/90 09/o i/90 03/02/9112/01/89 06/01/90 12/01/90 06/01/91
DA-I-E
Figure 5. Daily average water temperature for Moonlight Springs collection gallery and daily average airtemperature for Nome Airport.
approximately 50 ft from site SS-3, where snow was unusually deep, to determine the ranges of snow thicknessand water content in the area. Visual observations made by the snow survey team indicate that wind significantlyaffected snowpack thickness in the Anvil Mountain area.
WATER QUALITY AND ISOTOPES
WATJIR ANALYSIS RJXUL,TS AND DISCUSSION
All water sample collected during this investigation are classified as fresh. The specific conductance ofwater is an indication of its degree of mineralization. The specific conductance of Moonlight Springs and nearbysurface and ground waters ranges from 47 to 651 &S/cm, which is considered acceptable for domestic and otherwater uses. Three ground-water sites, the spring near Lindblom Creek, Beltz School well, and M. Desalemoswell, have a conductivity value >400 pS/cm. Schist is predominant near the spring near Lindblom Creek, andthe two wells are in unconsolidated coastal plain deposits that appear to have been placer mined.
Iron and manganese are the only inorganic constituents in the sampled water with concentrations that exceedAlaska Drinking Water Standards [Alaska Department of Environmental Conservation (ADEC), 19911. Thehighest dissolved iron concentration is 5.1 mg/l in water from a well adjacent to the Snake River at the TellerHighway. The nighest dissolved manganese concentration is 1.4 mg/l from a seep in Specimen Gulch.
-9-
30.0 1
25.0
g 20.0IY;
i 15.0 1-I I
Discharge--a
4.00
3.50
3.00
2
2*50 l5i=
2.00 2E
1.50 g
E1 .oo
0.50
0.00
07/01/90 09/o l/90DATE
Figure 6. Anvil Creek discharge and daily precipitation at Nome Airport (see sheet 2 for gage location).
Table 1. Miscellaneous discharge measurements for Anvil Creek, Nome, Alaska (see sheet 2 for site locations)
Sitenumber Location
Discharge(cfs”) Date
Near Name/Teller HighwayAt recording sitegageHalfway from to Glacier RoadgageApproximately l/3 mi downstream fromGlacier RoadApproximately l/2 mi above Glacier Road
4.2 June 8 , 19906.7 June 8 , 19905.6 June 8 , 19904.9 June 8 , 1990
1.2 June 9 , 1990
81 cfs = 28.317 l/e
-lO-

ITable 2. Precipitation data collected near Moonlight Springs during 1990
and 1991 (see sheet 2 for site locations)
Gagelocation
Precip. (cm)6/9/90-9125190- -
Precip. (cm)5/29/91-9l25.19 1
123456789
AveragesNome WSOFactorAvg. factor
36.20836.83a38.1Oa
31.1237. 16a30.4835.8934.77a35.0730.45
1.15
Destroyed
1.05
20.1618.1819.53
20.4022.4719.610.00
18.1819.7920.73
0.95
‘Gage full at end of sampling period, value represents minimum precipitation.
A v e r a g e
A v e r a g e
Table 3. Snow survey measurements, Anvil Mountain area, Nome, Alaska (see sheet 2 for site bcafions)
Date: April 2 1991Samplers: Carrick, IrelandWeather: Clear, winds NE @ 25 mph, temperature 20-30°FSite conditions: All site-s affected by wind
Site
ss-1
ss-2
snow W a t e r( i n . )depth wivalent (in.)
67.0 32.754.0 23.537.5 15.325.0 9.517.0 6.540.1 17.5
25.0 11.329.0 11.748.0 19.346.5 19.529.5 11.035.6 14.6
Density (%)
49.044.041.038.038.042.0
45.040.040.042.037.040.8
ss-3
A v e r a g e
Single measurementnear site SS-3
50.5 19.1 38.073.5 28.5 39.041.5 15.0 36.026.5 8.7 33.041.0 14.3 35.046.6 17.1 36.2
126.5 43.0 34.0
- ll-

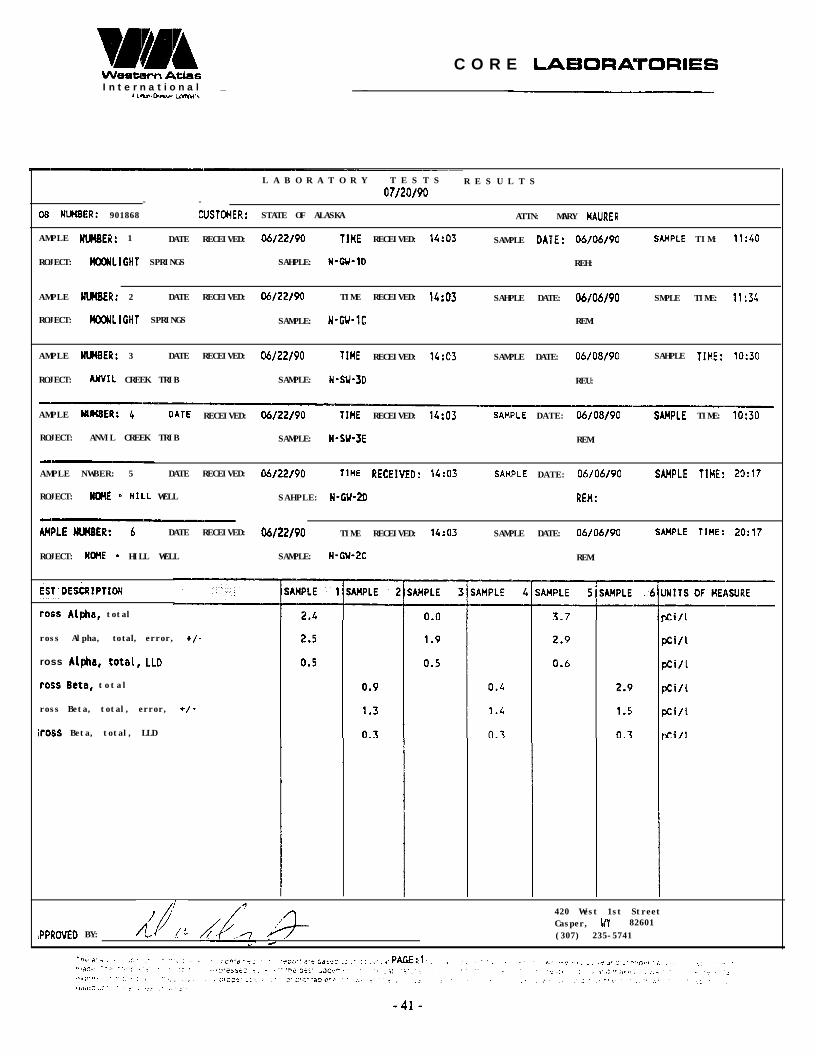
Gross alpha and gross beta radioactivity of Moonlight Springs and nearby waters is very low, (<0.3 to3.7 pCi/l). The Alaska Drinking Water Standard is 15 pCi/l for gross alpha radioactivity and 50 pCi/l for grossbeta radioactivity (ADEC, 1991).
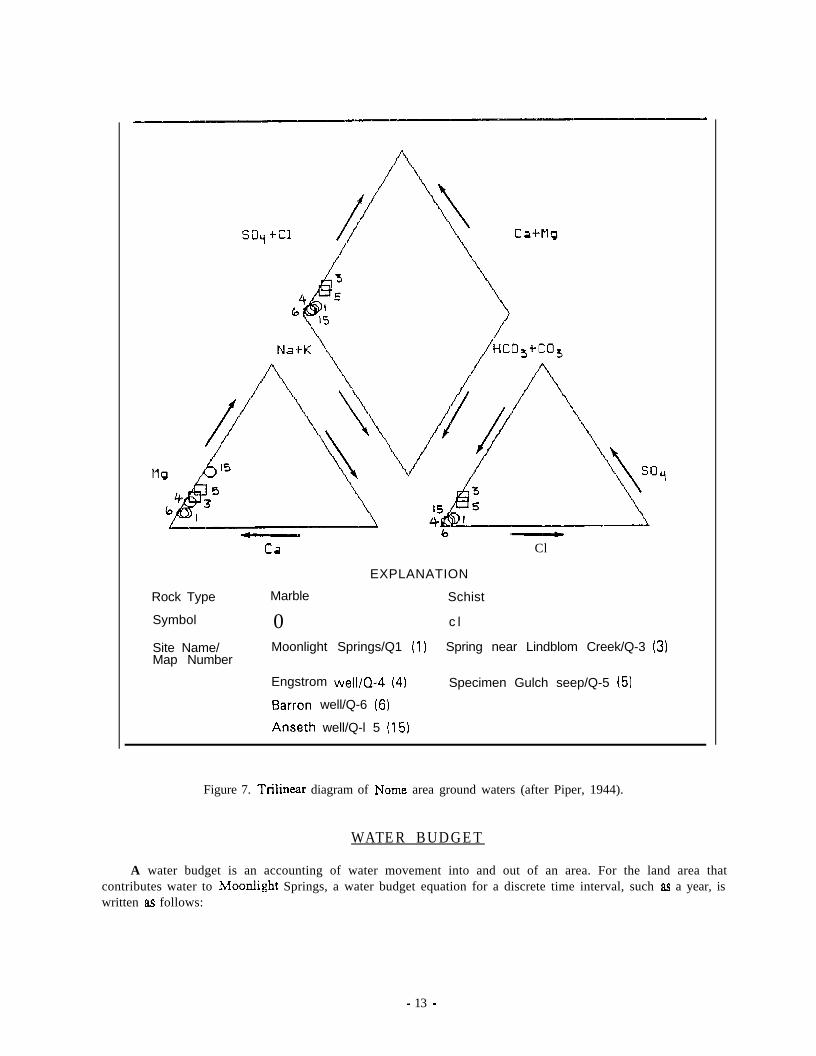
The accuracy of dissolved ion values, based on the calculated cation-anion balance, shows that all 17 sampleshave an acceptable sample error of <4 percent. All surface and ground waters examined are classified ascalcium-bicarbonate waters. Results of the common dissolved ion analyses from selected ground-water sites areshown in figure 7. Note the subtle but consistent difference between water from areas where schist is thepredominant rock type and water from areas where marble is the predominant rock type. Water from schist areastypically has higher sulfate levels and lower calcium and bicarbonate levels.
Tritium values for ground and surface waters occur in a relatively narrow range (app. A). Thirteen samplesfrom Moonlight Springs and nearby ground waters had a mean of 26 tritium units (TU). Rainfall had a tritiumvalue of 12 TU. A water sample derived mainly from a nearby melting snowfield (sample code N-SW-;?, mapnumber Q-8) and a snow core sample (sample code SS, map number I-18) had tritium values of 7.3 TU and 5 TU,respectively. These data are compared to historical data described below.
Stable isotope values do not correlate with the orographic position of sample sites or the distances inlandfrom the coast. Two sites sampled in June and September 1990, Moonlight Springs and S. Barron well, showedslightly lower 2H/lH values in June. Rainfall and snow have the lowest 2H/lH values, and rainfall also has alower 180/160 value than snow. Seasonal variation in the stable isotope composition of precipitation apparentlyaccounts for at least some variation in stable isotope composition among sites.
HISTORICAL DATA VALIDITY
Dissolved-constituents
Sample error, based on the cation-anion balance, was calculated on 19 historical analyses (app. D) todetermine data accuracy. Sample error is less than 10 percent for historical analyses, except for a sample labelled‘Spring, 150 ft S 45” E of overflow.’ Therefore, 18 samples are considered accurate and useable for datacomparison.
TlitiLUll
Eight previously collected tritium values (appx. D) were verified on unpublished laboratory reports providedby Ott/HDR Engineering, formerly Ott Water Engineers Inc., to determine data validity. Transformed tritiumvalues were 1.4 to 2.2 TU lower than those reported by Ott (1982). Because these small differences do not affectoverall data validity, the data are deemed useable for comparison.
HISTORICAL DATA COMPARISONS
Specific conductance measured at Moonlight Springs during this investigation is similar to historical specificconductance values. At the 95-percent confidence level, there is no statistical difference between the meanspecific conductance for this investigation (mean=258 FS/cm, range= 248-269 @/cm, n=3 samples) andhistorical investigations (mean=233 @/cm, range= 200-271 @/cm, n= 13 samples). The consistency in specificconductance values indicates an insignificant change in the dissolved mineral composition of Moonlight Springswater during the past 37 yr.
Moonlight Springs tritium values determined in this investigation ranged from 23 to 26 TU, compared to 47to 64 TU for Moonlight Springs and nearby springs in Ott (1982). These data indicate tritium content inMoonlight Springs water has decreased by 50 percent in 10 yr. The lack of a 1982 tritium value for rainfallprecludes a definitive interpretation of the data. Since Moonlight Springs receives at least part of its rechargefrom local rainfall, the drop in tritium is probably related to the worldwide trend of decreasing tritium in rainfalldue to less atmospheric nuclear-weapons testing (Hem, 1985).
- 12 -
Rock Type
Symbol
Site Name/Map Number
ca Cl
EXPLANATION
Marble Schist
0 c l
Moonlight Springs/Q1 (1) Spring near Lindblom Creek/Q-3 (3)
Engstrom well/Q-4 14) Specimen Gulch seep/Q-5 (51
Barron well/Q-6 (6)
Anseth well/Q-l 5 (15)
Figure 7. Trilinear diagram of Nome area ground waters (after Piper, 1944).
WATER BUDGET
A water budget is an accounting of water movement into and out of an area. For the land area thatcontributes water to hioonlight Springs, a water budget equation for a discrete time interval, such aa a year, iswritten as follows:
- 13 -

R+S=Q/A+ET+ROfdS
Where R = rainfall (m);S = snowmelt (m);Q = total Moonlight Springs discharge (m3);A = Area of basin (m2);ET = evapotranspiration (m);RO = surface runoff(m); anddS = changes in water in storage (m).
The water budget equation must be applied to a specific geographic an% usually a discrete drainage basin.In this analysis, the basin that supplies Moonlight Springs, although not well defined, is the basin of interest.This analysis assumes that any ground water flowing beneath or around Moonlight Springs into or through thecoastal plain is not part of the basin that supplies Moonlight Springs. The water budget equation can be solvedfor the basin area:
A=Q/(R+S-ET-ROfdS)
Terms on the right side of the equation can be measured or estimated for the period May 29,1990, toMay 28, 1991, and an estimate for the size of the Moonlight Springs recharge area is therefore calculable.
Rainfall for the period May 29 to October 1, 1990 was 30.8 cm (12.1 in.) at the Nome Airport. During thisperiod, at least 115 percent as much precipitation fell in the Anvil Mountain area as at the airport (table 3).Applying this correction factor, approximately 35.4 cm (13.9 in.) of rainfall is available for the water budgetcalculation.
The average water equivalent at three snow survey sites on the hillside above Moonlight Springs was41.7 cm (16.4 in.) on April 2, 1991, which we assume represents total water available from snowmelt on thesouthwest flanks of Anvil Mountain. This amount is significantly higher than the recorded precipitation [ 17.5 cm(7.3 in.)] at Nome between October 1, 1990, and April 2, 1991. Prevailing wind direction causes considerablesnow drifting on the southwest slopes of Anvil Mountain, which results in higher average precipitation thanmeasured at the Nome Airport.
Moonlight Springs’ discharge for the water budget year was 2,540,OOO I& (671 million gal) of water. Thisincludes water used by the City of Nome and overflow discharges.
Although evapotranspiration in the Nome area has not been studied in detail, Patric and Black (1968)calculated (using the Thornthwaite method) an evapotranspiration value of 35.9 cm (14.1 in.) for Nome.
Surface runoff values for the Moonlight Springs recharge area are difficult to estimate. Much of the uplandarea of Anvil Mountain consists of tundra or frost-rived rock surfaces. Field observations suggest that surfacerunoff does not occur on rock surfaces due to the high permeability of surficial materials. Near-water qualitysample site Q-8, for example, surface runoff from upslope melting snowfields disappeared into the grounddownslope from the sample site but upslope from a vegetation-bare rock slope. In addition, ditches dug duringearly mining activities ring Anvil Mountain and tend to intercept runoff and promote infiltration and rechargebecause of their slight hydraulic gradients and capacity to store water until it infiltrates. An initial estimate of thesize of the recharge area can be made assuming that all recharge to Moonlight Springs occurs in areas wheresurface runoff is negligible. Correspondingly, surface runoff is assigned a value of zero in the water balanceequation. The estimated size of the recharge area calculated using this assumption is smaller than the truerecharge area if areas of nonzero runoff exist in the recharge area.
The discharge of Moonlight Springs was nearly the same on May 28,1991, as it was on May 29, 1990,which indicates that changes in water storage within the Moonlight Springs basin are probably negligible. Avalue of zero was assumed for dS.
- 14 -

Using these values (converted to consistent units) in the water balance equation yields a recharge area (A) of6.2 km2 (2.4 mi2). Because this estimate is inherently uncertain due to simplifying assumptions used to make thecalculations, it provides only a general indication of the size of the Moonlight Springs recharge area.
INTERPRETATION
MOONLIGHT SPRINGS GROUND-WATER FLOW SYSTEM
The marble unit that crops out on the Anvil Mountain hillside above Moonlight Springs is interpreted to bethe primary aquifer for Moonlight Springs. Where exposed, the marble exhibits sufficient jointing and fracturingfor adequate permeability- for the transmission of water to Moonlight Springs. Although development ofMoonlight Springs has destroyed most natural ground discharges, the geology of the site and the geochemistry ofthe water strongly suggest that water is emitted from the marble aquifer at a depth of a few meters and flowsthrough unfrozen gravels into perforated pipes leading to the collection gallery. The geology of the site may havebeen better exposed prior to construction of the collection gallery, leading to Waller and Mathur’s (1962)comment that the source of Moonlight Springs water was “flat-bedded limestone. ”
Geochemical data suggest that the water has not flowed through appreciable thicknesses of schist, andregional geologic maps suggest that the marble aquifer is probably not continuous to distant recharge areas. Thegeochemical data therefore further support the conceptual model that most recharge occurs locally in the marbleaquifer near Moonlight Springs.
Ground-water discharge at and near Moonlight Springs occurs at various locations along a 5OQ-m-longground-water discharge zone at the base of the Anvil Mountain slope, elevation about 130 to 140 m. Thissuggests that Moonlight Springs is not part of a single conduit-type system that has been postulati near the majorfault in Anvil Creek valley. Water emanating in the Moonlight Springs area is probably doing so because it isblocked from flow towards Anvil Creek by the lower permeability schist on the west side of the fault.
The location of Moonlight Springs at the distinctive boundary between the coastal plain deposits and thelower slopes of Anvil Mountain is probably controlled by local topography and geology. The springs existbecause the site’s land surface is lower than the potentiometric surface of the Moonlight Springs aquifer, whichresults in an upward hydraulic head gradient and discharge of ground water. High hydraulic heads in the aquifermay be partially sustained by lower permeability permafrost zones or surficial deposits near the springs that tendto block ground-water discharges.
Sheet 2 shows the Moonlight Springs watershed boundary drawn on the basis of topographic contours.Watershed boundaries are normally drawn for surface water drainage systems, but an examination of theMoonlight Springs watershed is useful for illustrative and comparative purposes. The area of the MoonlightSprings watershed is 0.28 km2 (0.11 mi2), which is only 4.6 percent of the calculated area of the MoonlightSprings recharge area. This indicates that Moonlight Springs actually receives water from an area much largerthan the watershed depicted on sheet 2.
Delineation of the Moonlight Springs recharge area is complicated by the absence of direct information aboutthe configuration of the water table or potentiometric surface of the Moonlight Springs aquifer beneath AnvilMountain. Nevertheless, examination of surficiai geological features allows separation of areas baaed on theirrelative likelihood of being in the recharge area. Sheet 2 shows the approximate boundaries for primary rechargeareas, secondary areas, and low or non-recharge areas.
PRIMARY RECHARGE AREA BOUNDARY
The primary recharge area (sheet 2) was approximated using the following criteria:
1, The area is directly upslope or updip from Moonlight Springs;
- 15 -
2. Marble is the predominant rock type;
3 . Dips of rocks are favorable for directing flow towards Moonlight Springs; and
4 . Surface runoff is low to nonexistent because of abundant outcrops or frost-rived rocky slopes.
Most water that infiltrates the primary recharge area probably emerges at Moonlight Springs. The primaryrecharge area encompasses 4.6 km2 (1.8 mi2). A local ground-water flow system is inferred to exist within theprimary recharge area to provide relatively short (C 3 km) flow paths for ground water.
SECONDARY RECHARGE AREA BOUNDARY
The secondary recharge area boundary encompasses an area that contributes less water to Moonlight Springsor is less likely to discharge to the springs at all. This area has a greater potential for surface runoff because ofthe presence of permafrost soils or less permeable rocks, or both. Because the area is farther from the springs,water entering the secondary recharge area has a greater likelihood of discharging somewhere other thanMoonlight Springs. These alternate discharge areas could be small hillside seeps or springs, base flow dischargesto Anvil Creek or Nome River or its tributaries, or discharges to Norton Sound through or beneath coastal-plainsediments, Although the western edge of the secondary recharge area does not exactly follow the mapped locationof the fault in Anvil Creek valley (the fault location is somewhat uncertain), the western edge of the secondaryrecharge area is considered to be at the marble/schist contact at the fault. The primary and secondary rechargeareas together encompass 18.7 km2 (7.2 mi2).
LOW OR NON-RECHARGE AREAS
Areas outside the secondary recharge area boundary shown on sheet 2 have low to zero potential forcontributing to Moonlight Springs. Areas at elevations lower than the springs do not contribute to springdischarges because water cannot flow upgradient, and distant areas of the Seward Peninsula are unlikely tocontribute to spring flows. Data indicate that we cannot exclude highland areas between the Snake and NomeRivers from contributing to Moonlight Springs discharges. The persistence of the springs through the winter andtheir location springs relatively near the coast suggest that some regional flow component may be present.
The recharge areas shown on sheet 2 pertain to ground-water flow systems that currently exist. Shouldlarge-scale mining activity near the mapped boundaries result in major changes to local ground-water flowsystems, the location of recharge areas would also change. For example, a large open-pit type mine at the majorfault in Anvil Creek valley could dewater part of Moonlight Springs aquifer and intercept flow that currentlydischarges at the springs.
CONCLUSIONS
The indirect methods used in this study provide evidence to support several conclusions about the aquiferthat supplies water to Moonlight Springs:
1 . The annual discharge of Moonlight Springs occurs as relatively high spring, summer, and fall flows withrapid response times to snowmelt and rainfall events. Winter flows exhibit a relatively continuousdecline from high fall flows to low flows just prior to spring breakup in late April to early May. Thesewinter flows represent a gradual depletion of the Moonlight Springs aquifer. It is unknown if these flowsare from a regional flow system or if they represent depletion of the same local flow system providingmost of the summer flow.
2 . The travel time of some water from its recharge to its discharge at the springs is short, from a few hoursor less to a day or two. This indicates that some recharge probably occurs within several hundred metersof the springs and has a relatively short flow path. The aquifer’s fractured nature allows relatively rapid
- 16 -
ground-water flow compared to typical unconsolidated aquifers. Most water probably follows a longerflow path, as shown by peak discharges that follow precipitation events by 19 days.
a. A general indication of the size of the Moonlight Springs recharge area can be obtained by calculating awater budget. These calculations indicate that about 6.2 km2 (2.4 mi2) are necessary to support theannual discharge of Moonlight Springs. This area is slightly larger than Anvil Mountain. Although theannua4 water budget approach contains inherent uncertainties that could cause significant errors in therecharge area calculations, the calculations are useful because they indicate that a plausible conceptualmodel for Moonlight Springs flow system does not require input of water from distant areas.
4 . Approximate lotions of primary and secondary recharge areas are based on their relative likelihood forcontributing water to Moonlight Springs. The locations of recharge boundaries are considered to be mostprobable, based on existing information. Although the recharge area boundaries are indirectly inferred,they could be used to guide water management or land-use decisions that might affect spring flows.
5 . In April 1990, Moonlight Springs discharges declined to flow rates that were approximately equal to therate of water use by the City of Nome. The overflow pipe went dry during parts of at least 11nonconsecutive days during that time. The water-supply pipe to the City of Nome ran in a less than pipe-full condition April 15 to 17, 1990. Spring discharges did not drop to such low levels during 1991.Continuous flow data are not available for previous years to determine the typical range of low flowconditions during the spring. Moonlight Springs may be inadequate to meet water-use demands ifdemands increase during late winter low-flow conditions or if spring flows are reduced. Water demandson Moonlight Springs could increase through ordinary growth in water use or through water line leaks.
6 . Protection of Moonlight Springs flows should consider disturbance of both recharge areas and permafrostareas near the springs. Maintenance of the permafrost regime could be important in maintaining aquiferpressure that creates flowing conditions into the collectiou gallery.
- 17 -
REFERENCES
Alaska Department of Environmental Conservation (ADEC), 1991, State of Alaska Drinking Water Regulations18AAC80: ADEC, Juneau, Alaska 87 p.
General Electric, 1980, Moonlight Springs reconnaissance water resources study, Nome, Alaska: Alaska PowerAuthority unpublished report, unpaginated.
Hem, J.D., 1985, Study and interpretation of the chemical characteristics of natural water, Third Edition: U.S.Geological Survey Water-supply Paper 2254, 263 p.
Hummel, C.L., 1962, Preliminary geologic map of the Nome C-l Quadrangle, Seward Peninsula, Alaska: U.S.Geological Survey Miscellaneous Field Studies Map MF-247, 1 sheet, scale 1:63,360.
L&r, E.W., 1957, Chemical character of public water supplies of the larger cities of Alaska, Hawaii, and PuertoRico, 1954: U.S. G&logical Survey Water-Supply Paper 1460-A, 39 p.
Munter, J.A., Maurer, M.A., and Moor-man, Mary, 1990, Evaluation of the hydrology and geology of theMoonlight Springs area, Nome, Alaska: Quality assurance project plan: Alaska Division of Geological andGeophysical Surveys Public-data File 90-8, 23 p.
Mu&r, J.A., Maurer, M.A., Inghram, M.G., and Petrik, W.A., 1991, Preliminary hydrogeologicevaluation of Moonlight Springs, Nome, Alaska: Alaska Division of Geological and GeophysicalSurveys Public-data File 91-28, 63 p, 2 sheets, scale 1:63,360 and 1:12,000.
National Oceanic and Atmospheric Administration, 1989-1991, Climatological data, Alaska: Asheville,North Carolina, National Qimate Data Center.
Ott Water Engineers, Inc., 1982, Hydrology of Moonlight Springs: City of Nome unpublished report, 12 p,Patric, James H., and Black, Peter E., 1968, Potential evaporation and climate in Alaska by Thomthwaite’s
classification: U.S. Department of Agriculture, U.S. Forest Service Institute of Northern Forestry ForestService Research Paper PNW-71,28 p.
P&w&, Troy L., 1975, Quaternary geology of Alaska: U.S. Geological Survey Professional Paper 835, 145 p.Piper, A.M., 1944, A graphic procedure in the geochemical interpretation of water analyses: Transactions of the
American Geophysical Union v. 25, p. 914-923.R&M Consultants, Inc., 1981, Evaluation of engineering considerations, Nome annexation study: in David M.
Reaume, Alaska Economics, Inc., 1981, Nome annexation study: Alaska Department of Community andRegional Affairs, Division of Local Government Assistance unpublished report, unpaginated.
Robinson, M.S., and Stevens, D.L., 1984, Geologic map of the Seward Peninsula, Alaska: Alaska Division ofGeological and Geophysical Surveys Special Report 34, 1 sheet, scale 1:5OO,OtXI.
Soil Conservation Service, 1973, Snow survey sampling guide: U.S. Department of Agriculture, AgricultureHandbook No. 169, 32 p.
Waller, Roger M., and Mathur, Satyendra, P., 1962, Data on water supplies at Nome, Alaska: U.S. GeologicalSurvey Hydrologic Data Report No. 17, in cooperation with Alaska Department of Health and Welfare,unpaginated.
- 18 -

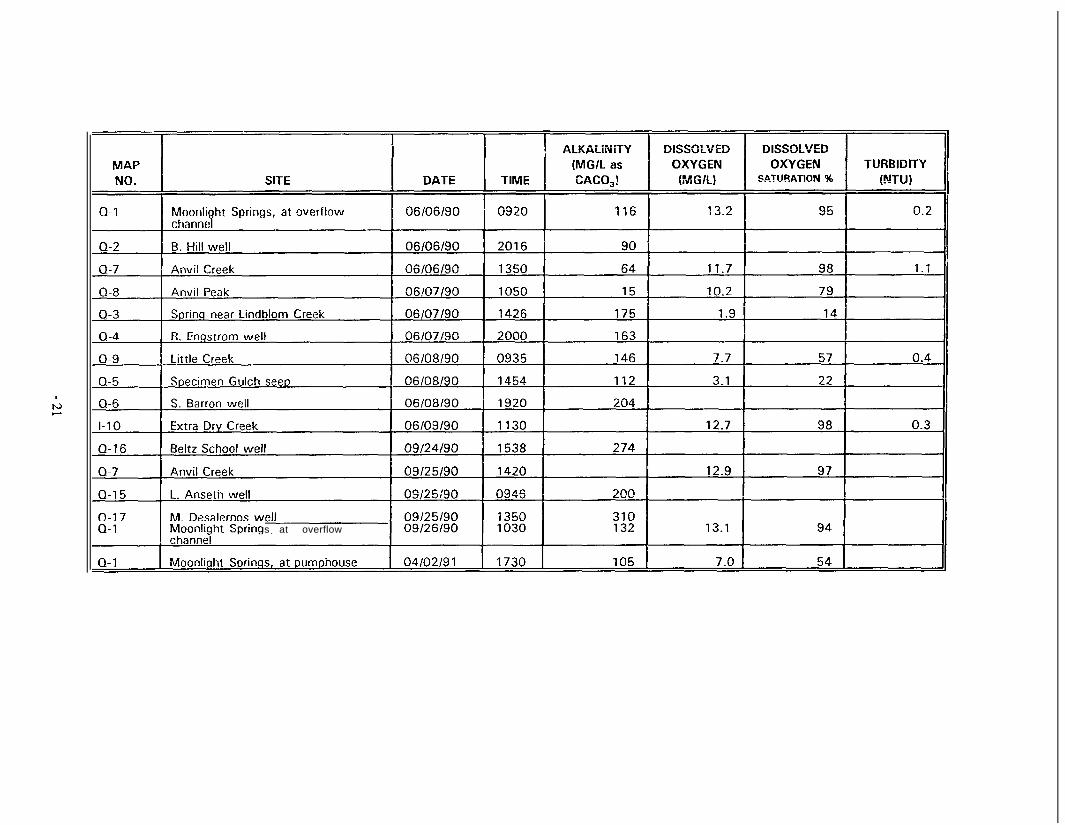
Appendix A. Water-quality field measurements made by Alaska Division of Water, 1990-1991.
MAP NO. SiTE
II
WATER SPECiFiCTEMP. QISCHARGE CONDUCTANCE
DATE TIME l”Ci ICFS) bSiCM; pH

APPENDIX AWATER-QUALITY FIELD MEASUREMENTS
- 19 -
AixALiNil-Y
s at overflow

APPENDIX BWATER-QUALITY ANALYTICAL RESULTS
Samples were analyzed by one of the following laboratories:
State of Alaska Division of Water(formerly Division of Geological & Geophysical Surveys),Water Quality L&oratory, Fairbanks, Alaska
Core Laboratories, Casper, Wyoming
University of Miami, Tritium Laboratory, Miami, Florida
Southern Methodist University Stable Isotope Laboratory, Dallas, Texas
- 23 -
Mapno.
Q-3
::Q-6Q-fjQ-7Q-7
:I;I-10I-11I-12I-13I-14Q-15Q-16Q-17I-1882
Samplec o d e
N-GW-1M SOF; PHN-GW-2N-GW-3;N-GW-4L-sN-GW-5N-GW-6N-GW-7B WN-SW-lAC; ABN-SW-2N-SW-3N-SW-4N-SW-5N-GW-8N-GW-9N-GW-10ANBS; FHMDssPrecipitationgage, Nome
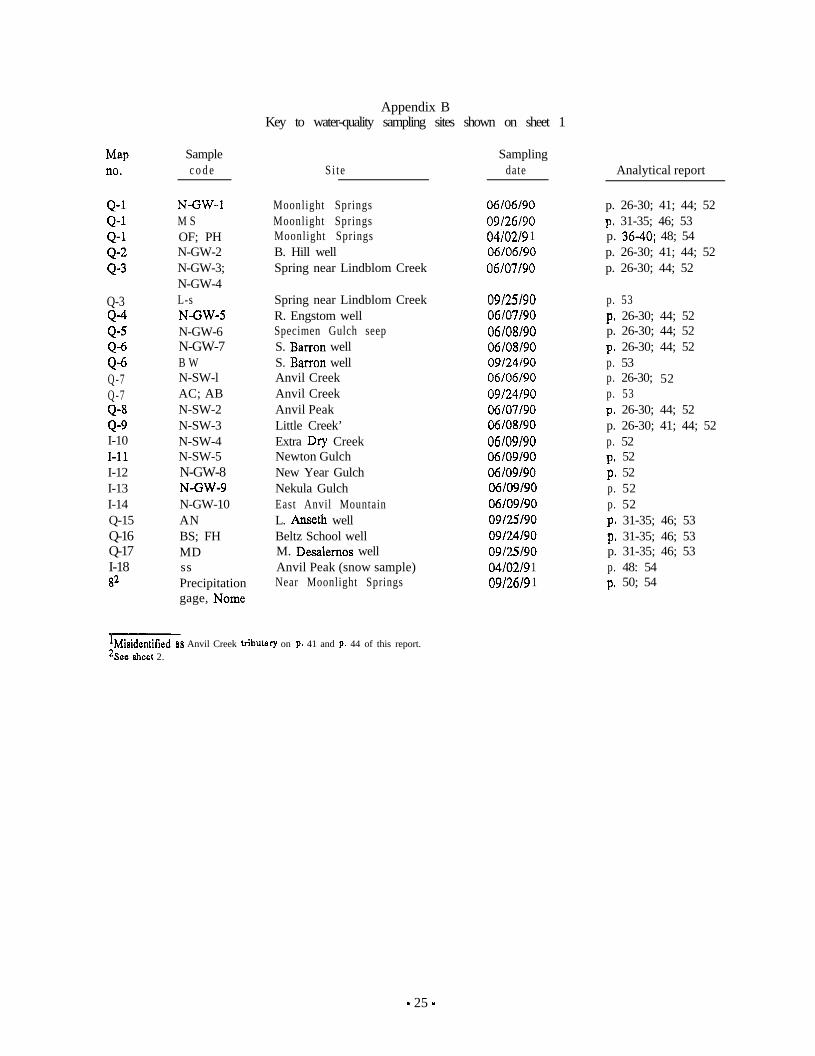
Appendix BKey to water-quality sampling sites shown on sheet 1
Si teSampling
date
Moonlight Springs 06/06/90Moonlight Springs 09/26/90Moonlight Springs 04/02/9 1B. Hill well 06/06/90Spring near Lindblom Creek 06/07/90
Spring near Lindblom Creek 09/25/90R. Engstom well 06107/90Specimen Gulch seep 06/08/90S. Barron well 06/08/90S. Barron well 09/24190Anvil Creek 06/06/90Anvil Creek 09/24/90Anvil Peak 06/07/90Little Creek’ 06/08/90Extra Dry Creek 06/09/90Newton Gulch 06/09/90New Year Gulch 06/09190Nekula Gulch c6/09/90East Anvil Mountain 06/09/90L. Anseth well 09/25/90Beltz School well 09/24/90M. Desalemos well 09/35/90Anvil Peak (snow sample) 04/02/g 1Near Moonlight Springs 09/2619 1
Analytical report
p. 26-30; 41; 44; 52p, 31-35; 46; 53p. 36-40; 48; 54p. 26-30; 41; 44; 52p. 26-30; 44; 52
p. 53p. 26-30; 44; 52p. 26-30; 44; 52p, 26-30; 44; 52p. 53p. 26-30; 52p. 53p. 26-30; 44; 52p. 26-30; 41; 44; 52p. 52p. 52p. 52p. 52p. 52p. 31-35; 46; 53p. 31-35; 46; 53p. 31-35; 46; 53p. 48: 54p, 50; 54
lMisidentifxd as Anvil Creek tribuhry on p. 41 and p. 44 of this report.2See s&et 2.
- 25 -

.... . : . : : . : : . .......... ..............................................................
Client: ADGGS - Eagle River
Submitted By: Mary Maurer
Date: June ll, 1990
1 Sample Calclum Magnesium Sodium Potassium I
N-GW-1 475 3.02 2 . 4 033N-GW-2 32.6 6.09 5 . 2 0.51N-GW3 72.2 10.9 3 . 1 037N-GW-4 7Ll 10.8 3 . 1 033N-GW-5 543 651 1 . 8 0.33N-GW-6 39.9 7.80 1.9 053N-GW-7 72.0 4.70 1 . 9 032N-SW-1 258 5.89 1 . 9 033N-SW-2 5.89 0.40 0 . 9 0.03N-SW-3 58.2 5.75 3 . 0 0.15N-GWB3 co.01 co.01 co.1 co.01
Units midI w/l w/l mg/lEPA Method AEsoo29 AEsm29 273.1 258.1
Detection Limit 0.01 0.01 0 . 1 0.01RPD 5 . 8 1.0 0 . 1 05
% Recovery 99 100 100 104
Approved By
3Jim Vohden, Chemist- 26 -
CLient: ADGGS - Eagle River
Submitted By: Mary Maurer
Date: June 11, 1990
N-GW-1 0.36N-GW-2 0 3 0N-GW-3 0 . 5 5N-GW4 0 . 5 5N-GWJ 037N-GW-6 056N-GW-7 0.41N-SW-1 0.29N-SW-2 0.07N-SW-3 0.43N-GWB3 co.01
UnitsEPA Method
Detection LimitR P D
% Keeovery
m/l3 0 0 . 00.014.485
mg/l300.00 . 0 15292
0 . 6 0 5.64co.02 183co.02 38.2co.02 38.1
0.60 5.180.05 193022 5.840.02 193
c 0.02 0.410.08 14.4
< 0.02 co.01
mg/l3 0 0 . 00 . 0 2
1 . 28 6
fng/l300.00.01
1 . 783
Approved By Date ‘?$WV 90/” Jim Vohden, Chemist
- 27 -

Client: ADGGS - Eagle River
Submitted By: Mary Maurer
Date: June ll,19!Xl
1 Sample Arsenic Mercury Cadmium Lead Aluminum I
N-GW-1 <4N-GW-2 1 0N-GW3 85N-GWd 9 . 0N-GW-5 <4N-GW-6 <4N-GW-7 <4N-SW-1 <4N-SW-2 <4N-SW-3 <4N-GWB-3 <4
mi3.sEPA Method
Detection LimitR P D
% Recovery
Ml/(2063
45.791
<2<2<2<2<2c2<2c 2c 2<2e2
&l/l245.1
2l
99
<5<5<5<5c5c5C5<5c5c5<5
m/lAEsoo29
5*
108
7180
14l21014
9167 01 7c5
/a/rAEsoo-295
4 . 996
* Relative Percent Difference (RPD) cannot be calculated when values are less than the detection limit.
Approved By A?h
im V&den, Chemist- 28 -
Date &NOLI/~
Client: ADGGS - Eagle River
Submitted By: Mary Maurer
Date: June ll,l990
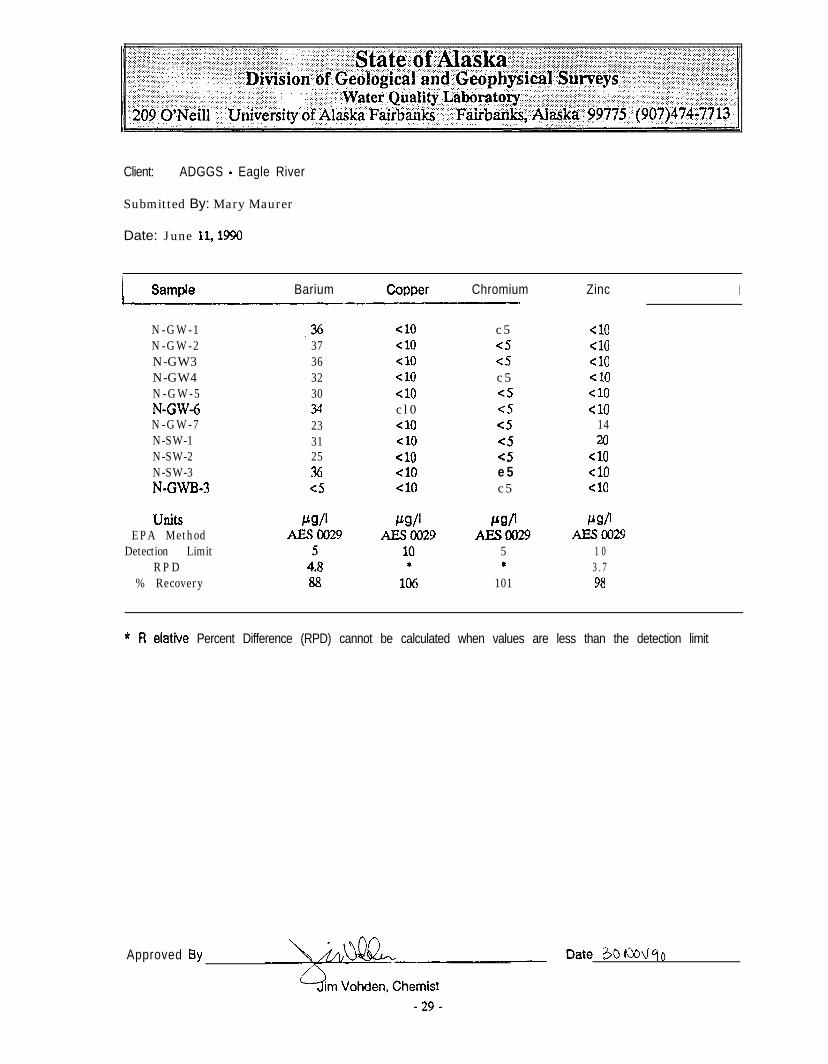
I Samtie Barium Chromium Zinc I
N-GW-1 .xN-GW-2 37N-GW3 36N-GW4 32N-GW-5 30N-GW-6 34N-GW-7 23N-SW-1 31N-SW-2 25N-SW-3 36N-GM-3 <5
unit.sEPA Method
Detection LimitR P D
% Recovery
cl0cl0cl0<locl0c l 0cl0<locl0cl0cl0
c 5c5c5c 5<5c5c5<5<5e5c 5
w-lAEsm29
5*
101
<lo<lo<lo<locl0cl0
1420
Cl0cl0<lo
PCIPmoo29
1 03 . 798
* ff elative Percent Difference (RPD) cannot be calculated when values are less than the detection limit
Approved By
. .. .
209 ‘OWeill :: U209 ‘OWeill :: U
Client: ADGGS - Eagle River
Submitted By: Mary Maurer
Date: June 11, 1990
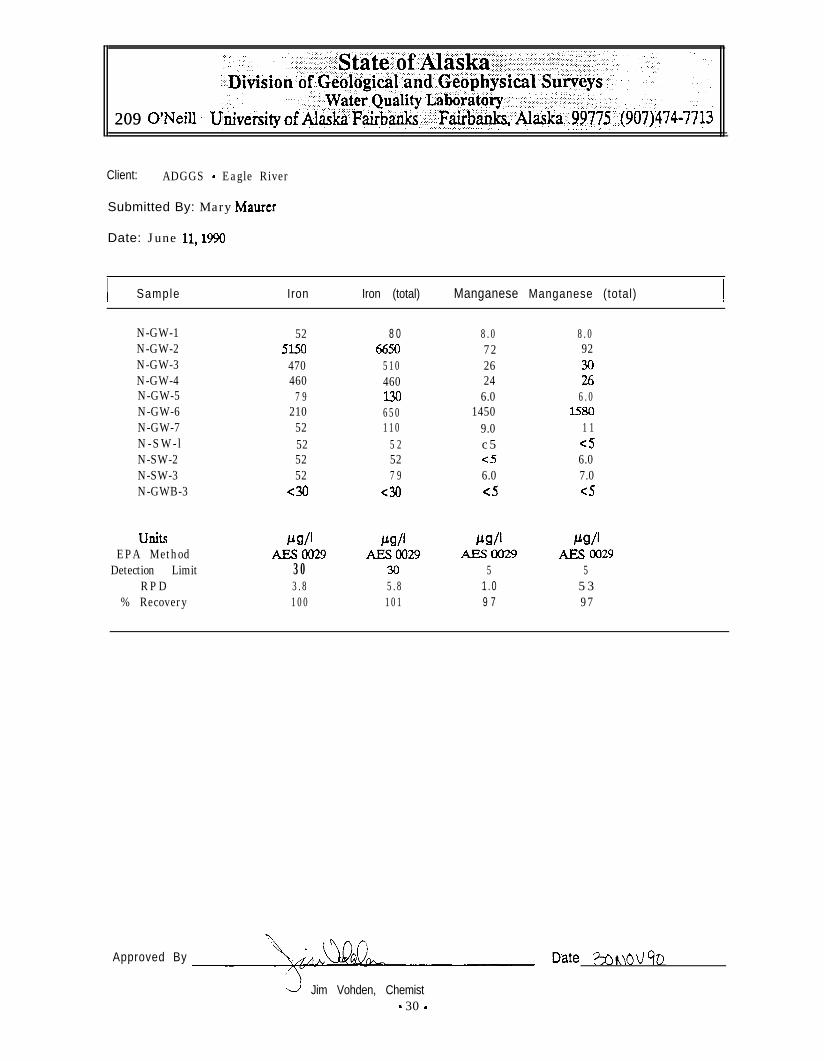
I Sample Iron Iron (total) Manganese Manganese (total) I
N-GW-1 52 8 0 8 . 0N-GW-2 slso 6650 72N-GW-3 470 510 26N-GW-4 460 460 24N-GW-5 7 9 130 6.0N-GW-6 210 650 1450N-GW-7 52 110 9.0N-SW-l 52 5 2 c 5N-SW-2 52 52 <5N-SW-3 52 7 9 6.0N-GWB-3 <30 c30 <5
Units /42/l m Pm PC?/1EPA Method moo29 AEsoo29 mm?!3 AES 0029
Detection Limit 3 0 30 5 5R P D 3 . 8 5 . 8 1 . 0 53
% Recovery 100 101 9 7 97
8 . 0923026
6 . 0
1 1<56.07.0<5
Approved By
J Jim Vohden, Chemist- 30 -
Client: ADGGS - Eagle River
Submitted By: Mary Maurer
Date Submitted: September 28,lW
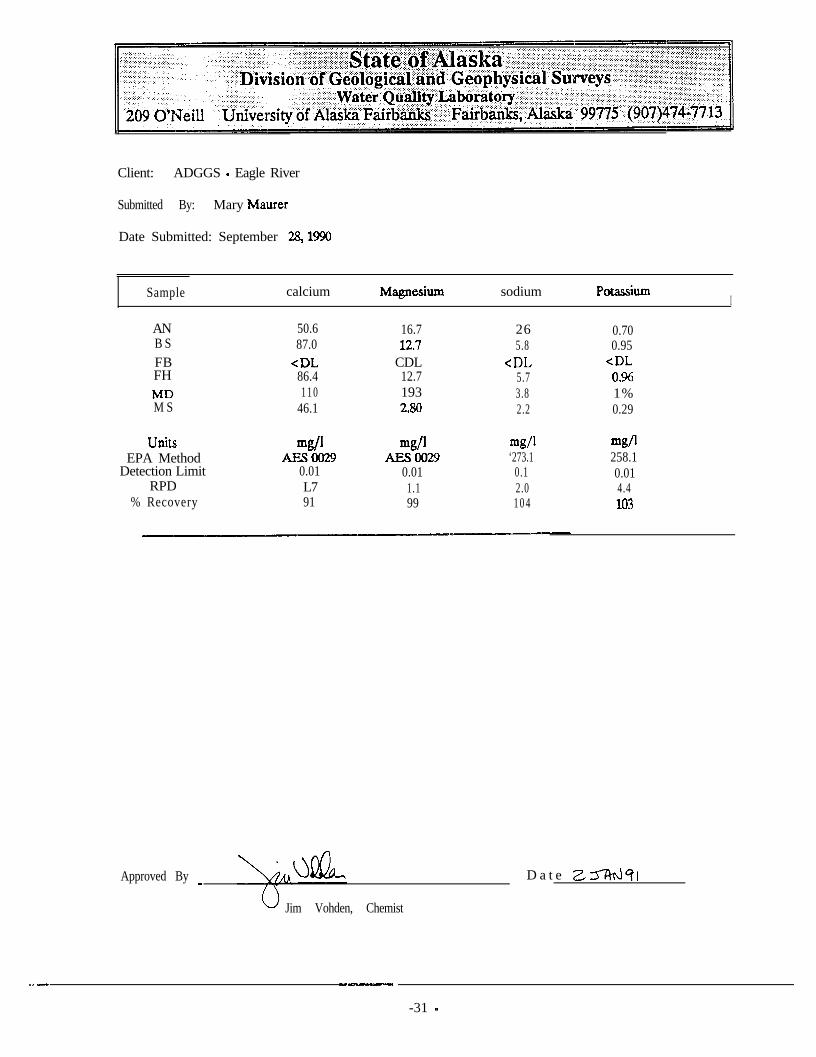
Sample
ANB SFBFH
M S
calcium MZtgWilUlI sodium PO&WiUmI
50.6 16.7 26 0.7087.0 12.7 5.8 0.95
CDL CDL CDL CDL86.4 12.7 5.7 O.%1 1 0 193 3.8 1%
46.1 280 2.2 0.29
Units mg/l mg/l mdl mg/lEPA Method AEsooz9 Al30029 ‘273.1 258.1
Detection Limit 0.01 0.01 0.1 0.01RPD L7 1.1 2.0 4.4
% Recovery 91 99 1 0 4 103
Approved By _
Jim Vohden, Chemist
D a t e ZTiN91
.,- --
-31 s

Client: ADGGS - Eiagle River
Submitted By: Mary Maurer
Date Submitted: September 28,199O
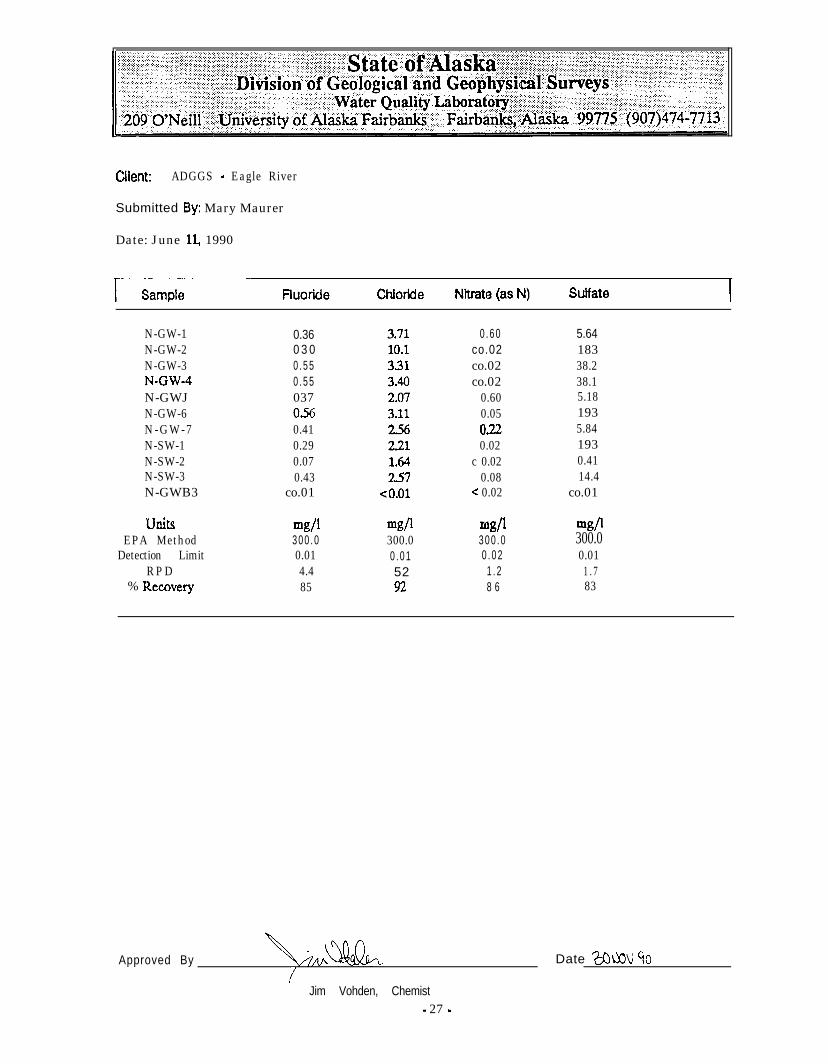
I Sample Fluoride cblolide Nitrate (as N) Sulfate I
ANB SFBFH
M S
UnitsEPA Method
Detection LimitRPD
5% Recovery
0.41 3.15 0.10 8.12032 3.61 <DL 0.41
CDL CDL CDL CDL052 355 CDL 0.440.58 4.11 0.06 70.50.23 3.04 0.11 5.88
mg/l300.00.011.293
mgP mg/l300.0 300.00.01 0.0229 9.593 87
m&?/l300.00.011387
Approved B Y k;s,..y,D a t e zr(F-@? 1
- 32 -

Client: ADGGS - Eagle River
Submitted By: Mary Maurer
Date Submined: September 2& 1990
I Sample Aluminum BaIilUIl cadmium Chromium I
ANB Si-33FH
M S
units UgPEPA Method AEsm9
Detection Limit 5RPD 2.2
% Recovery 102
6 5 CDL 261 0 0 CDL 51
<DE CDL CDL99 CDL 51
1 2 1 7 4760 <DL 20
w/l2n63
44.0102
%PAEsMl29
53 598
CDL CDL<DL CDL<DL CDL<DL CDLCDL CDLCDL <DL
UgPAl30029
50
88
w/lAEsoo29
5*
94
l Relative Percent Difference (RPD) cannot be calculated w&en values are less than the detection hit.
Approved By D a t e Zfmq\
oi im Vohden, Chemist
-33 -
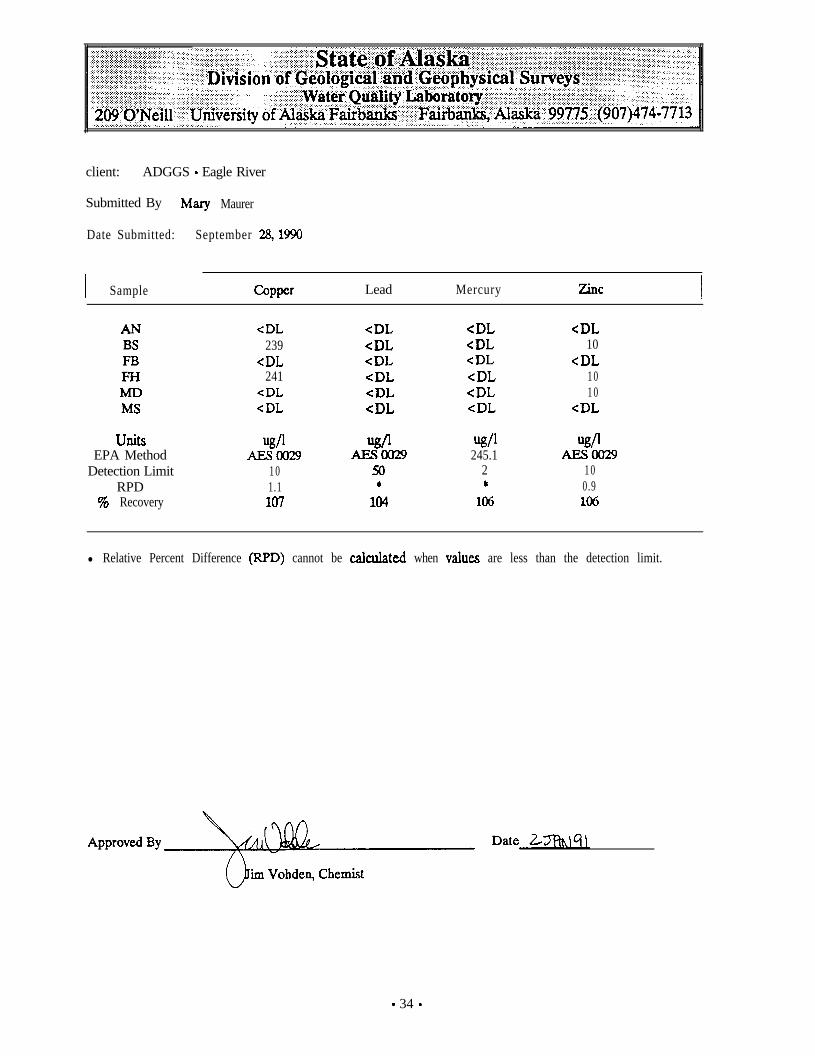
client: ADGGS - Eagle River
Submitted By Mary Maurer
Date Submitted: September 28,1990
I Sample tipper Lead Mercury ZiIK I
UnitsEPA Method
Detection LimitRPD
7% Recovery
CDL239
CDL241
CDLCDL
w/lAEsm9
1 01.1107
<DLCDLCDLCDLCDLCDL
ug/lAEsfxr29
50+
104
CDLCDLCDL<DL<DLCDL
w/l245.1
2*
106
-CDL10
<DL1 01 0
<DL
w/lAEscKm
1 00.9106
l Relative Percent Difference (RPD) cannot be cahlated when vahes are less than the detection limit.
- 34 -

Client: ADGGS - Eagle River
Submitted By: Mary Maurer
Date Submitted: Septemkr 28,199O
I Sample IrOn Lron (total) MangaIKX Manganese (total) I
AN C D L 68Bs 5-o 222FB <DL CDLFH CDL 210MD I28 480M S 50 82
bitsEPA Method
Detection LimitRPD
% Recovery
%/IAEsm9
50L895
wmoo29xl1.292
CDL CDL807 827
CDL CDL802 807
12 13<DL 5
%/lAEsoo29
5271 0 1
w/*AEsoo295
1.0%
Approved By
- 35 -
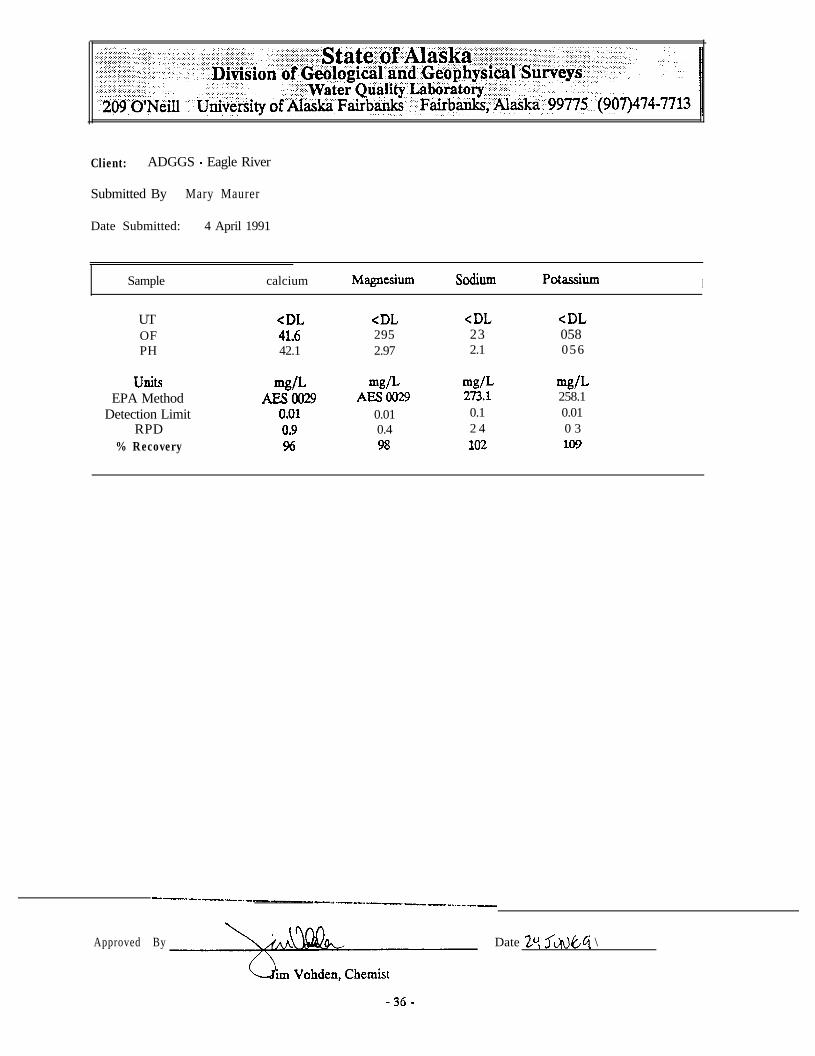
Client: ADGGS - Eagle River
Submitted By Mary Maurer
Date Submitted: 4 April 1991
Sample calcium MagntiIlm !wium PO&a&Urn I
UT CDLOF 4L6PH 42.1
UnitsEPA Method
Detection LimitRPD
% Recovery
w/LAEscm9
0.010.9%
CDL CDL CDL295 23 0582.97 2.1 056
mf3LAEsKt29
0.010.498
mg/L w/L273.1 258.10.1 0.012 4 0 3102 109
Approved By Date ZY fNh,Gi \

Client: ADGGS - FZagle River
Submitted By Mary Mawer
Date Submitted: 4 April 1991
I Sample Fluoride Chloride Nitrate Sulfate I
UT CDL CDL <DL CDLOF 036 3.08 0.47 6.38PH 034 2.95 0.46 638
Ihi&EPA Method
Detection LimitR P D
% Ihcovery
mg/L300.00.010.1%
mg/L mg NO3*N/L300.0 300.00.01 0.020.1 0.1102 90
w/L300.00.010.29 1
Approved By
Jim Vohden, Chemist
- 37 D

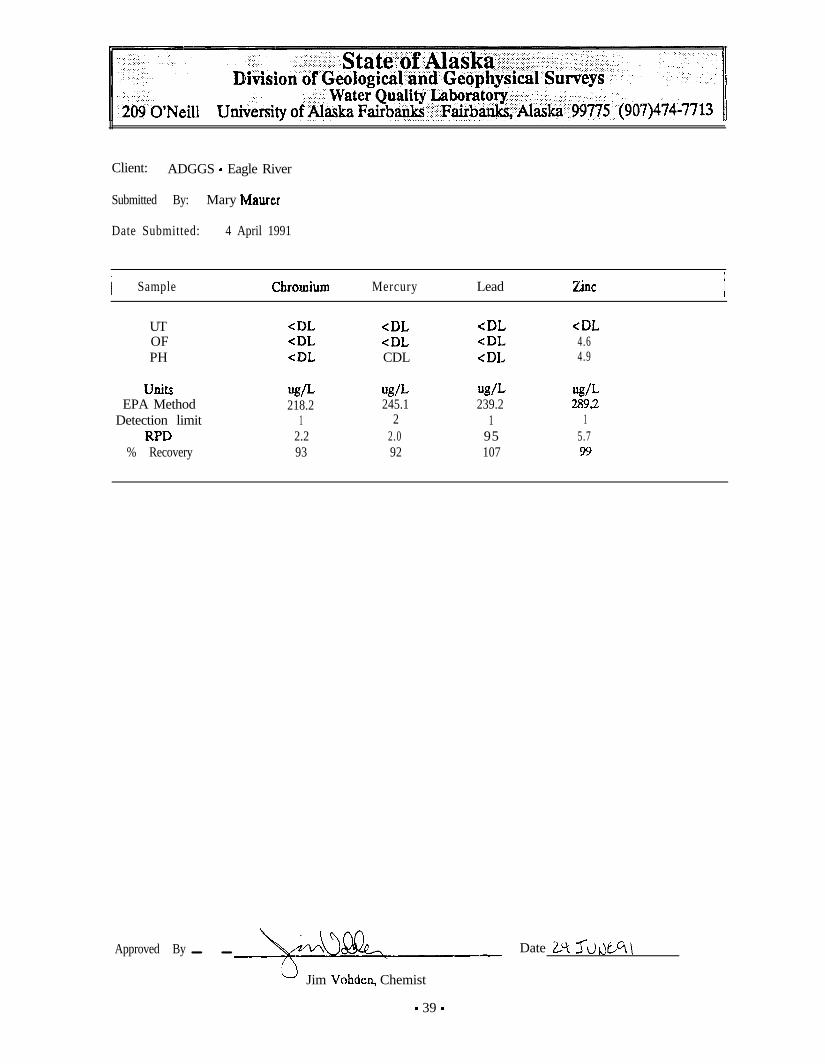
Client: ADGGS - Eagle River
Submitted By: Mary Maurer
Date Submitted: 4 April 1991
I ArseILiC A l u m i n u m Bahll cadmium tipper I
UT CDL <DL CDL CDL CDL
OF <DL 87 21 CDL CDL
PH CDL 90 21 CDL CDL
wnits UgL Q/L w/L w/L w/LEPA Method 206.2 AEsoo29 AEstxJ29 213.2 220.2
Detection Limit 1 5 5 1 1RPD 2.1 2.0 0.7 3.2 7.6
% Recovery 92 90 99 109 91
Approved By
” Jim Vohden, Chemist
Client: ADGGS - Eagle River
Submitted By: Mary h4aurer
Date Submitted: 4 April 1991
I Sample ChOIliUIIl Mercury Lead ZIlC I
UTOFPH
unitsEPA Method
Detection limitKPD
% Recovery
CDL<DLCDL
w/L w/L Q/L218.2 245.1 239.2
1 2 12.2 2.0 9593 92 107
CDL <DL <DLCDL <DL 4.6CDL <DL 4.9
43/L2892
15.799
Approved By Date .k“ fd#Y?\- -Jim Vohden, Chemist
- 39 -
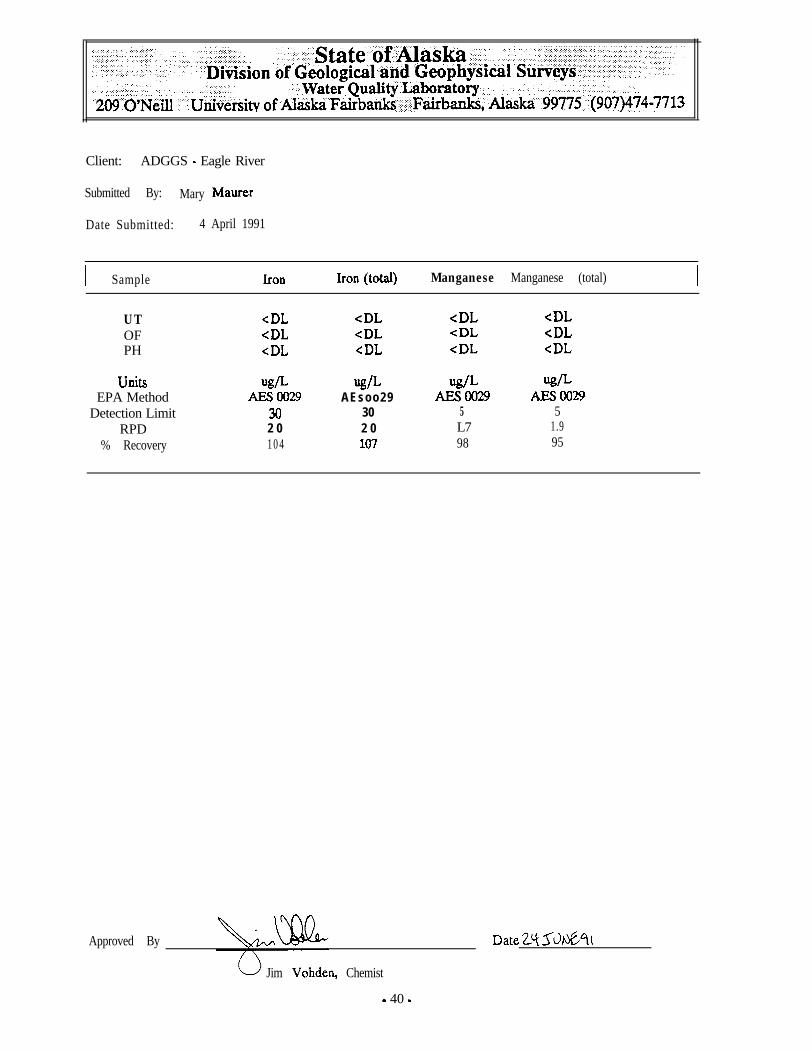
Client: ADGGS - Eagle River
Submitted By: Mary Maurer
Date Submitted: 4 April 1991
I Sample iron (total) Manganese Manganese (total)
UT <DLOF CDLPH <DL
unitsEPA Method
Detection LimitRPD
% Recovery
w3Lmoo29
302 01 0 4
CDLCDLCDL
x/LAEsoo29
302 0107
<DLCDL<DL
AEsoo2!25L798
<DL<DLCDL
w/LAEsoo29
51.995
Approved By
Jim Vohden, Chemist
- 40 -
C O R E LAE30RATORlESI n t e r n a t i o n a l _ _ _
* LnLn.h..P m’r
L A B O R A T O R Y T E S T S R E S U L T S07/20/9U
- -
08 NLMBER: 901868 CUSTWER: STATE OF ALASKA ATTN: MARY MAURER
AMPLE NWBER: 1 DATE RECEIVED: C&22/90 TIME RECEIVED: 14:03 SAMPLE OATE: 06/06/W SMPLE TIM: 11:4D
ROJECT: WLIGHY SPRINGS SAHPLE: N-GU-ID REH:
AMPLE JflMER: 2 DATE RECEIVED: 06/22/9U TIME RECEIVED: 14:03 SAHPLE DATE: 06/O&90 SMPLE TIME: 11:X
ROJECT: WLIGHT SPRINGS SAMPLE: N-&'-16 REM:
AMPLE NW5ER: 3 DATE RECEIVED: D&22/90 TInE RECEIVED: 14:03 SAMPLE DATE: 06/08/90 SAHPLE TIME: lo:30
ROJECT: ANVIL CREEK TRIB SAMPLE: N-W-30 REU:
AMPLE WER: 4 DATE RECEIVED: 06/22/90 TIME RECEIVED: 14:03 SAMPLE DATE: O&08/90 SAMPLE TIME: lo:30
ROJECT: ANVIL CREEK TRIB SAMPLE: N-SW-3E REM:
AMPLE NWBER: 5 DATE RECEIVED: D&22/90 TIHE RECEIMD: 14:03 SAMPLE DATE: O&06/90 SAJdPLE TIHE: 20:17
ROJECT: NWE - H1l.L WELL SAHPLE: N-GU-2D REM:
AllPLEWHXR: 6 DATE RECEIVED: 06/U/90 TIME RECEIVED: 14:03 SAMPLE DATE: 06/06/W SAWLE TIHE: 20:17
ROJECT: NWE - HILL WELL SAMPLE: N-GU-2C REM:
E~T.OES&IPTlDN
ross Alpha, total
ross Alpha, total, error, +/-
ross Alpha, total, CL0
ross BcYa, total
ross Beta, total, error, +/-
iross Beta, total, LLD
A: ~~~~ &
420 West 1st StreetCasper, C/T 82601
,PPRWED BY: (307) 235-5741ti -
West.etn AtlasInternational. Lnm.- CulUl
CORE LABORATORIES
A
PD
DDD
P0
D0
PPROVED BY:
620 Uest 1st StreetCasper, WY 82601(307) 235-5741
-.-- ~PAGE:1
N C = Not Calculabte due to values lower than the detection limit
Quality Controt Acceptance Criteria:Blanks . . . . . . . . . . . . . . Analyzed Value less than or equat to the Detection LimitReference Standards: 100 +/- 10 Percent RecoveryDuplicates.........: 20% Relative Percent Difference, or +/- the Detection LimitSpikes -............: 100 +/- 25 Percent Recovery
(1) EPA 600/4-79-020, Hethcds for Chemical Analysis of Uater ard Uastes, March 1983(2) EPA W-846, Test Methods for Evaluating Solid Waste, Third Edition, Novw&er 1986(3) Standards Methods for the Examinatiw of Uater and Uastwater, 16th, 1985(4) EPA/6004-80-032, Prescribed Procedures for Measurement of Radioactivity in Drinking Water, August 1980(5) federal Register, Friday, October 26, 1984 (40 CFR Part 136)(6) EPA 600/8-78-017, Microbiological Methods for Monitoring the Environment, December 1978
NOTE - DatgI;r~~t,~;in:Oq'rcport~,may.diffc~~romovabws awdatarpege~due~to di~crtion.of.sampl.e.jnto-ana~ytioaleracrges.-.-3-c'.:'I->a. :.-. _-. .-L'o,$:: ,Jjgy-r-~ _' : . . . Ld:ii,';'.' __ ~..m;l-.z' _ ~. .-. - .::.,,:, ., .,-.‘.. C.,. ,.._ .-<- , '+L.-.- ,. .-I
. . . . ...-..<. -: -; ai...'.. : :..,r... :. .- .‘,DrO,.'j~,~,‘.. . . . ..-. i ,,.a n,,,,, '->. L,> -. . . . . -_ -. : ,_., ,.,, :.u,-,'; , ,,,. . . -. I ,.:: ,
._ <': ,,, , .. _-. .,>;a; ,.-
- 42 -
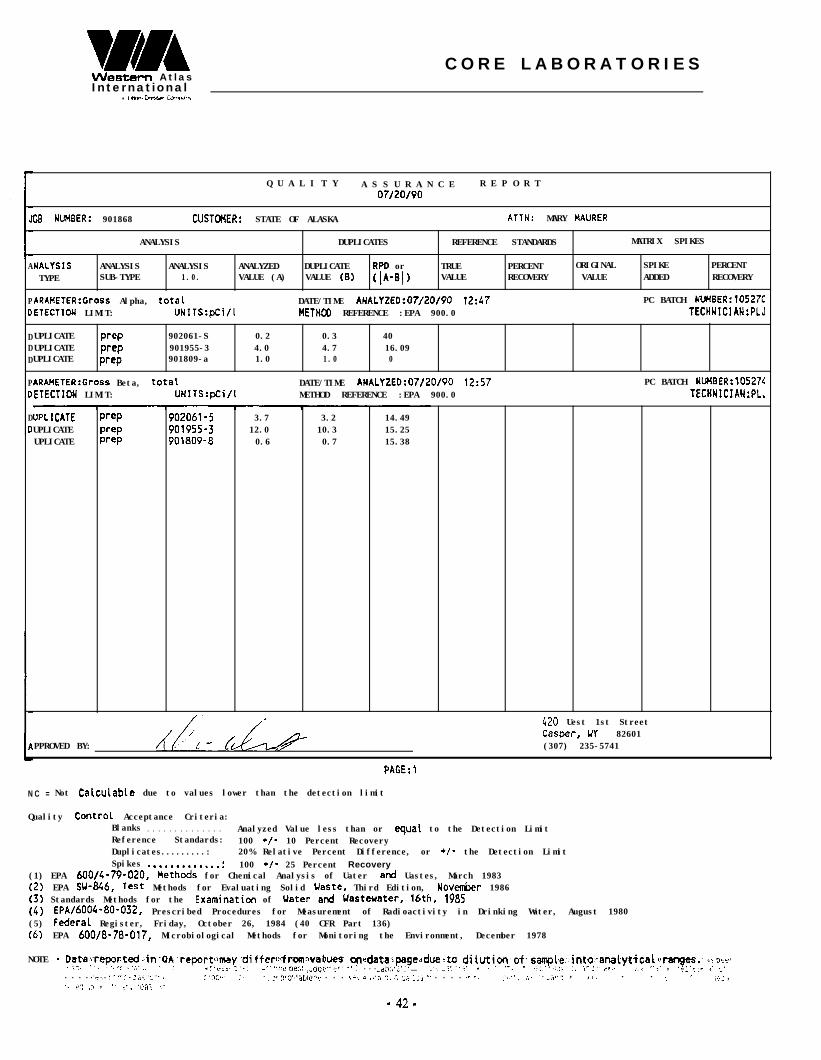
Q U A L I T Y A S S U R A N C E R E P O R T07/20/W
08 NLMBER: 901868 CUSTOnER: STATE OF ALASKA ATTH: MARY HAURER
ANALYSIS DUPLICATES REFERENCE STANDARDS MATRIX SPIKES
NALYSIS ANALYSIS ANALYSIS ANALYZED DUPLICATE RI3 or TRUE PERCENT ORIGINAL SPIKE PERCENTTYPE SUB-TYPE 1.0. VALUE (A) VALUE (B) ([A-6() VALUE RECOVERY VALUE ADDED RECOVERY
ARAHETER:Gross Alpha, total DATE/TIME ANALYZED:07/‘20/90 12:47 PC BATCH NWBER:105270ETECTIOR LIMIT: UNlTS:pCi/L l4ETHOO REFERENCE :EPA 900.0 TECHNIClAN:PLJ
UPLICATE prep 902061-S 0.2 0.3 40UPLICATE prep 901955-3 4.0 4.7 16.09UPLICATE prep 901809-a 1.0 1.0 0
ARABETER:Gross Beta, totaL DATE/TIME ANALYZED:07/20/90 12:57 PC BATCH NLMER:105271ETECTIMI LIMIT: LlNITS:pCi/t METHOD REFERENCE :EPA 900.0 TECHNICIAH:PL,
UPL ICATE prep 902061-5 3.7 3.2 14.49UPLICATE prep 901955-3 12.0 10.3 15.25UPLICATE prep 901809-a 0.6 0.7 15.38
July 26, 1990
TRITIUM LABORATORY
Data Release #90-29Job # 274
ALASKA DEPARTMENT OF NATURAL RESOURCESTRITIUM SAMPLES
Purchase Order D.Q. 188097
Distribution:Mary A. MaurerALASKA DEPARTMENT OF NATURAL RESOURCESP.O. E3ox 772116Eagle River, Alaska 99577-2116
Rosensticl School of Marine and Atmospheric ScienceTritium Laborator!
4600 Rickenbacker Causewa)Miami, Florida 33149-1098
(305) 3614100

Client: ALASKA DEPT. NATURAL RESOURCES Purchase Order: D.0.18897Recvd : 90/06/20 Contact: Mary Maurer (907)696-0070Job# : 274 18225 Fish Hatchery RoadFinal : 90/07/24 Eagle River, AK 99577-2116
Gust IABEL INFO JOB.SX REFDATE QUANT ELYS TU eTU--_-__---_____-__---____________________- -am----e ._---__---______ e---mm--m-----N-GW-1E Moonlight Spr. 274.01 900606 1000 2 5 6 25.8 0.9N-GW-3C Lindbloom Crk. Spr. 274.02 900607 1000 2 7 5 30.1 1.1N-GWB-3C Lindbloom Crk. Spr. 274.03 900607 1000 274 36.8 1.3N-GW-4C Nome Spring 274.04 900607 1000 2 7 5 30.8 1.0N-GW-SC Engstrom'S Well 274.05 900607 1000 275 15.2 0.6N-GW-6C Specimen Gulch 274.06 900608 1000 2 7 5 15.7 0.5N-GW-7C Barron S. Well 274.07 900608 1000 2 7 2 14.8 0.5N-SW-2C Anvil Peak 274.08 900607 1000 273 7.29 0.24N-SW-SC Anvil Creek Trib. 274.09 900608 1000 259 14.8 0 . 5
-44-
November 28, 1990
TRITIUM LABORATORY
Data Release #90-46Job # 288
ALASKA DEPARTMENT OF NATURAL RESOURCESTRITIUM SAMPLES
Purchase Order D.O. 237318
'ote OstlundTritim Laboratory
Distribution:Mary A. MaurerALASKA DEPARTMENT OF NATURAL RESOURCESP.O. Box 772116Eagle River, Alaska 99577-2116
Rosenstiel Scho4 of Marine and Atmospheric ScienceTritium I&orator!
4600 Rickehacker Causewa?Miami, Florida 33149-1098
(305) 361-4100
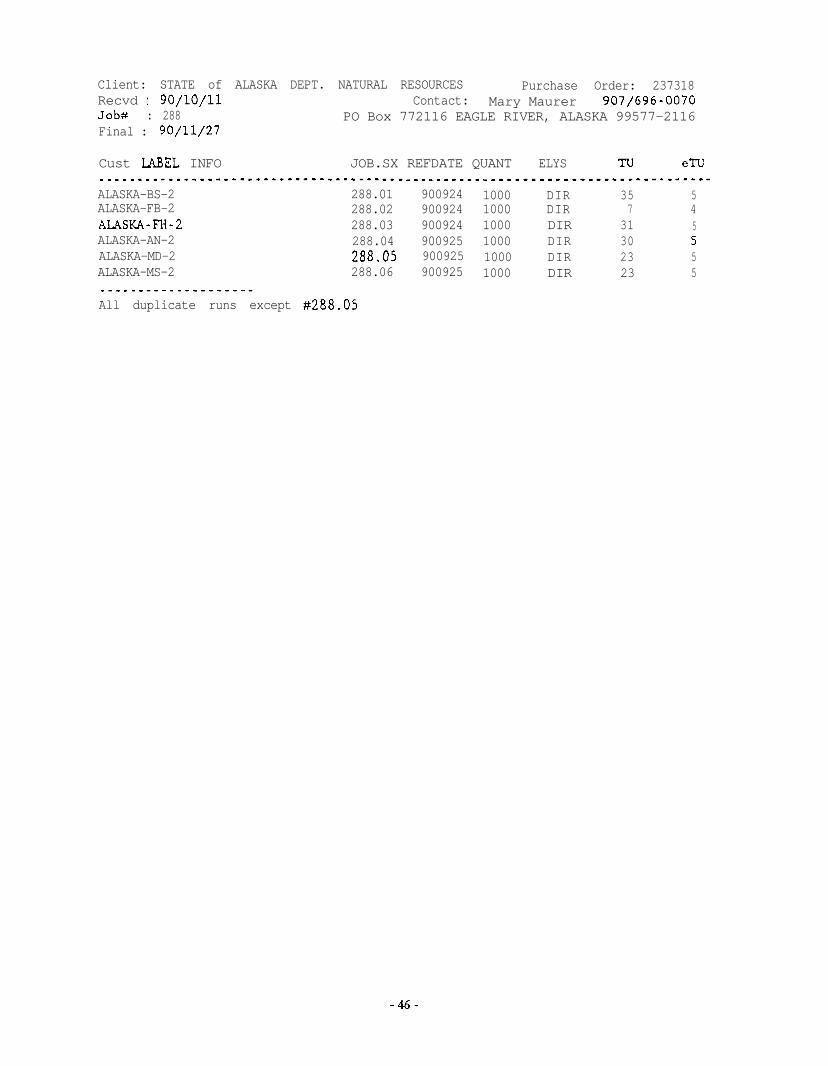
Client: STATE of ALASKA DEPT. NATURAL RESOURCES Purchase Order: 237318Recvd : 90/10/11 Contact: Mary Maurer 907/696-0070Job* : 288 PO Box 772116 EAGLE RIVER, ALASKA 99577-2116Final : 90/11/27
Cust MEL INFO JOB.SX REFDATE QUANT ELYS ‘x-u eTU____-___--_---_-_--------------------- _____*--_____--_-_-_--------------------ALASKA-BS-2 288.01 900924 1000 DIR 35 5ALASKA-FB-2 288.02 900924 1000 DIR 7 4ALASKA-FH-2 288.03 900924 1000 DIR 31 5ALASKA-AN-2 288.04 900925 1000 DIR 30 5ALASKA-MD-2 288.05 900925 1000 DIR 23 5ALASKA-MS-2 288.06 900925 1000 DIR 23 5
All duplicate runs except #288.05
-46-

TRITIUM LABORATORY
April 25, 1991
Data Release #91-17Job # 313
ALASKA DEPARTMENT OF NATURAL RESOURCESTRITIUMSAMPLES
Purchase Order D.O. 239014
Tritium Laboratory
Distribution:Mary A. MaurerALASKA DEPARTMENT OF NATURAL RESOURCESP.O. Box 772116Eagle River, Alaska 99577-2116
Rosensriel School of Marine and Atmospheric ScienceTritium l&orator)
4600 Rickenbacker Cau.sewa!Miami, florida 33 149.1098
(305) 361-4100
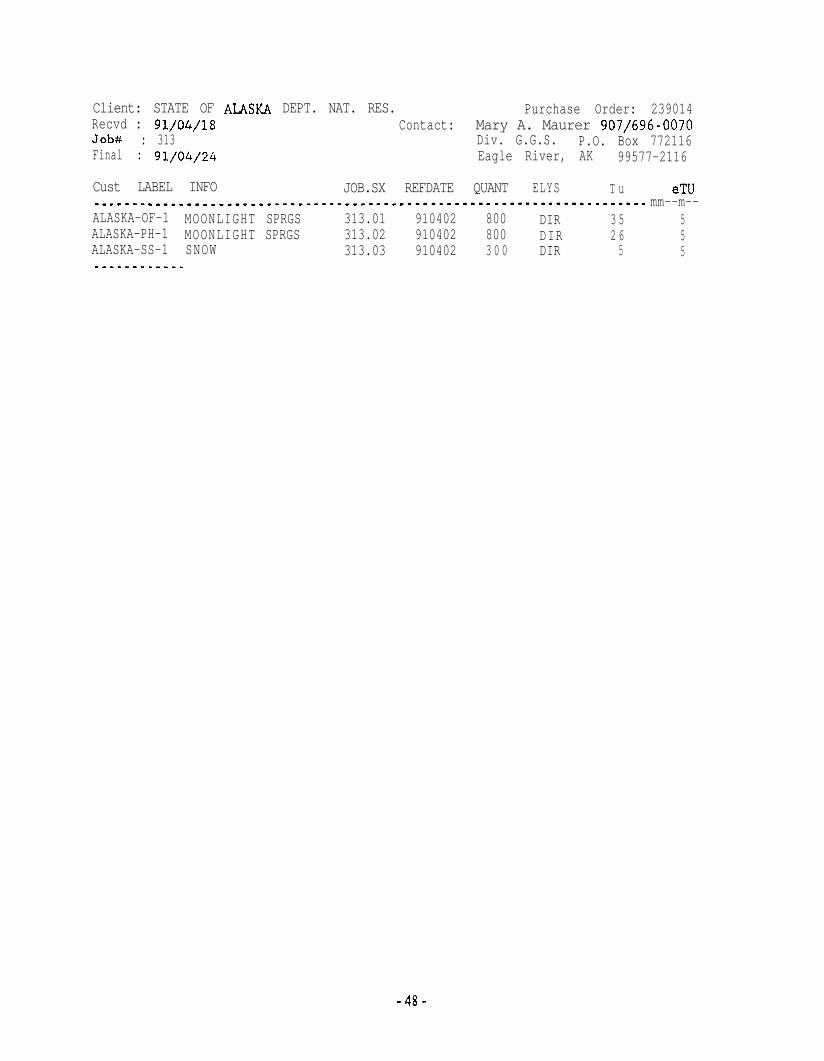
Client: STATE OF ALASKA DEPT. NAT. RES. Purchase Order: 239014Recvd : 91/04/18 Contact: Mary A. Maurer 907/696-0070Job# : 313 Div. G.G.S. P.O. Box 772116Final : 91/04/24 Eagle River, AK 99577-2116
Cust LABEL INFO JOB.SX REFDATE QUANT ELYS T u eTU___----_____________-------------------*------------------------------- mm--m--ALASKA-OF-1 MOONLIGHT SPRGS 313.01 910402 800 DIR 3 5 5ALASKA-PH-1 MOONLIGHT SPRGS 313.02 910402 800 DIR 2 6 5ALASKA-SS-1 SNOW 313.03 910402 3 0 0 DIR 5 5
-48-

A~SKADNR/DIVOF WATEREAGLE RIVER ALASKA
November 27, 1991
TRITIUM LABORATORY
Data Release #91-6XJob # 360
ALASKA DEPARTMENT OF NATURAL RESOURCESTRITIUM SAMPLES
Purchase Order ER 92-06
Head, Tritiurn Laboratory
Distribution:Mary A. MaurerALASKA DEPARTMENT OF NATURAL RESOURCESP.O. Box 772116Eagle River, Alaska 99577-2116
Rosenstlel School of 3larine and Atmospheric CenceTritium LabOraton
4600 Rickenbacker Causeway
Miami. Florida 33149.1098(jO5)361-4100
Fax (305) 361-4112

Client: STATE OF ALASKA Purchase Order: ER 92-06Recvd : 91/x/12 Contact: Mary Maurer, 907/696-0070, -0078(F)Job# : 360 Alaska D.N.R.; P.O. Box 772116Final : 91/11/26 Eagle River, Alaska 99566-2116
Cust LA3EL INFO JOB.SX REFDATE QUANT ELYS Tu eTU_--__-----___s-___-_____________________---------------~----------------------AK-Precipitation, Nome 360.01 910926 1000 DIR 1 2 5--e-"--m-s-
-50-

Revised 89/02/09
GENERAL COMMENTS ON TRITIUM RESULTS
_Tritium Scales
The tritium concentrations are expressed in TU, where 1 TU indicates a T/Hratio of lo-"*. The values refer to the old, internationally-adopted scale ofU.S. National Bureau of Standards (NBS), which is based on their tritium waterstandard #4926 as measured on 1961/09/03, and age-corrected with the old half-life of 12.26 years, i.e., X = 5.65% year-l. In this scale, 1 TU is 7.186 dpm/kgH,O 1 or 3.237 pCi/kg H,O. TU values are calculated for date of samplecollection, REFDATE in the table, as provided by the submitter. If no such dateis available, date of arrival of sample at our laboratory is used. The statederrors, eTU, are one standard deviation (1 sigma) including all conceivablecontributions.
In the table, QUANT is quantity of sample received, and ELYS is the amountof water taken for electrolytic enrichment. DIR means direct run (noenrichment).
It has been found lately that a better value for the half-life is 12.43years, i.e., X - 5.576% year-i. This will cause a change in the TU scale, whichis still based on the same NBS standard (#4926) as of the same date, 1961/09/03(Mann et &., 1982) In the new scale, lTU(N) is 7.088 dpm/kg H,O, 3.193 pCi/kgH,O . As of mid-1989, the numerical TU values were 3.8% higher in the new scalethan in the old, and the difference is slowly increasing with time.
Verv low tritiurn values
In some cases, negative TU values are listed. Such numbers can occurbecause the net tritium count rate is, in principle, the difference between thecount rate of the sample and that of a tritium-free sample (background count orblank sample). Given a set of "unknown" samples with no tritium, thedistribution of net results should become symmetrical around 0 TU. The negativevalues are reported as such for the benefit of allowing the user unbiasedstatistical treatment of sets of the data. For other applications, 0 TU shouldbe used.
Mann, W.B., M.P. Unterweger, and B.M. Coursey, Comments on the NBStritiated-water standards and their use, Int. J. Appl. Radiat. Isot., 33, 383-386, 1982.
-51-
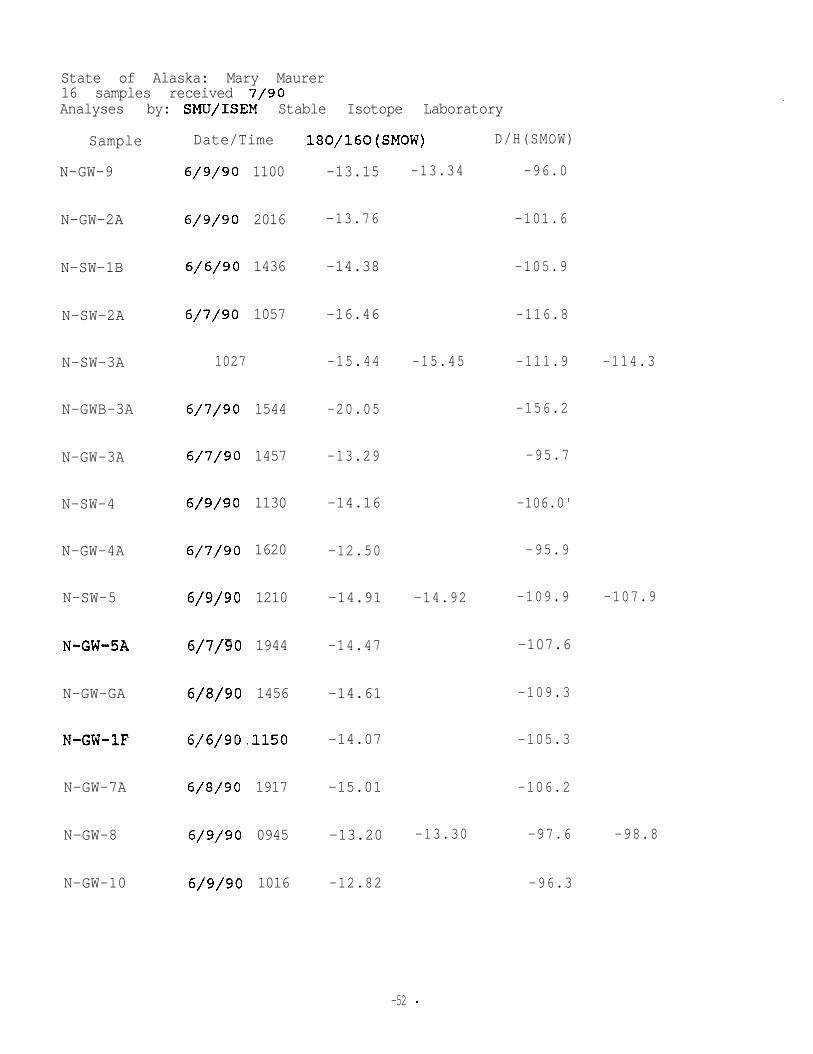
State of Alaska: Mary Maurer16 samples received 7/90Analyses by: SMU/ISEM Stable Isotope Laboratory
Sample
N-GW-9
Date/Time
6/9/90 1100
180/160(SMOW) D/H(SMOW)
-13.15
N-GW-2A 6/9/90 2016 -13.76
-13.34 -96.0
-101.6
N-SW-1B 6/6/90 1436 -14.38 -105.9
N-SW-2A 6/7/90 1057 -16.46 -116.8
N-SW-3A 1027 -15.44
N-GWB-3A 6/7/90 1544 -20.05
-15.45 -111.9 -114.3
-156.2
N-GW-3A 6/7/90 1457 -13.29 -95.7
N-SW-4 6/9/90 1130 -14.16 -106.0'
N-GW-4A 6/7/90 1620 -12.50 -95.9
N-SW-5 6/9/90 1210 -14.91
N-GW-SA 6/7/gO 1944 -14.47
-14.92 -109.9 -107.9
-107.6
N-GW-GA 6/8,'90 1456 -14.61 -109.3
N-GW-1F 6/6/90.1150 -14.07 -105.3
N-GW-7A 6/8/90 1917 -15.01 -106.2
N-GW-8 6/9/90 0945 -13.20 -13.30 -97.6 -98.8
N-GW-10 6/9/90 1016 -12.82 -96.3
-52 -
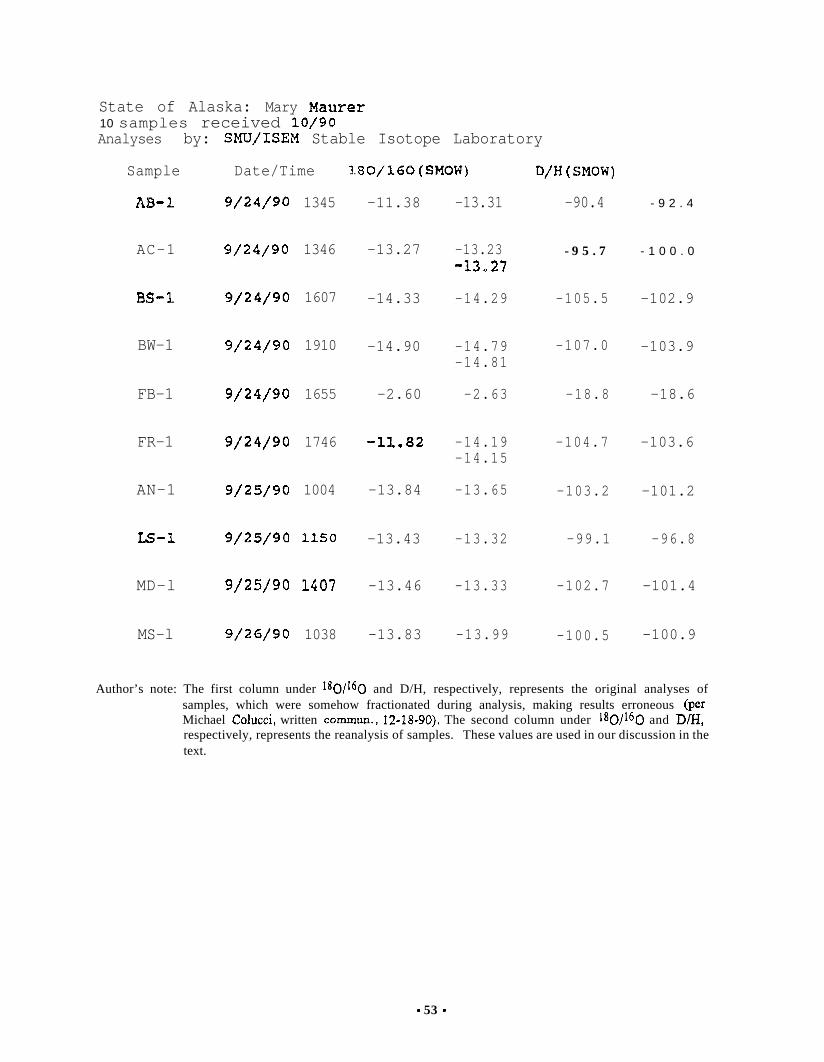
State of Alaska: Mary Maurer10 samples received lo/90Analyses by: SMU/ISEM Stable Isotope Laboratory
Sample
AB-1
AC-1
BS-I.
BW-1
FB-1
FR-1
AN-1
m-1
MD-l
MS-l
Date/Time 180/16U(SMOW)
g/24/90 1345
g/24/90 1346
g/24/90 1607
g/24/90 1910
g/24/90 1655
g/24/90 1746
g/25/90 1004
g/25/90 1150
g/25/90 1407
g/26/90 1038
-11.38
-13.27
-14.33
-14.90
-2.60
-11.82
-13.84
-13.43
-13.46
-13.83
-13.31
-13.23-13,27
-14.29
-14.79-14.81
-2.63
-14.19-14.15
-13.65
-13.32
-13.33
-13.99
D/H(SMOW)
-90.4
- 9 5 . 7
-105.5
-107.0
-18.8
-104.7
-103.2
-99.1
-102.7
-100.5
- 9 2 . 4
- 1 0 0 . 0
-102.9
-103.9
-18.6
-103.6
-101.2
-96.8
-101.4
-100.9
Author’s note: The first column under 180/160 and D/H, respectively, represents the original analyses ofsamples, which were somehow fractionated during analysis, making results erroneous (perMichael CZolucci, written commun., 12-18-90). The second column under 180/160 and D/H,respectively, represents the reanalysis of samples. These values are used in our discussion in thetext.
- 53 -

State of Alaska: Mary Maurer4 samples received 5/91Analyses by: SMU/ISEM Stable Isotope Laboratory
Sample Date/Time 180/160(SMOW) D/H(SMOW)
s s - 2 4/2/91 1 4 0 0 - 1 3 . 3 5 -107.9
-13.21 -102.8
s s - 3 4/2/91 1400 -13.42 -110.8 -108.5
PH-2 4/2/91 1730 -13.75 -13.88 -96.5
State of Alaska; Mary Maurer3 samples received 11/11/91Analyses by: SMU/ISEM Stable Isotope Laboratory
Sample Date/Time 180/160(SMOW) D/H(SMOW)
Precip. Gauge g/26/91 -15.09 -112.1Nome 1115
Same -15.13 -113.9
Same -14.60 -14.68 -112.7-112.9
- 54 -

APPENDIX CLABORATORY QUALITY ASSURANCE EVALUATION REPORT
- 55 -

Appendix CLaboratory quality assurance evaluation on water samples collected for the
recharge area evaluation project, Moonlight Springs area, Nome, Alaska
This quality assurance (QA) evaluation covers water samples collected from Moonlight Springs and nearbysurface and ground waters between June 1990 and September 1991 and associated field and laboratory checksamples.
Seventeen common dissolved ion and trace-metal samples were analyzed by the Alaska Division of WaterLaboratory, formerly Alaska Division of Geological and Geophysical Surveys Water Quality Laboratory,Fairbanks, Alaska. Six gross alpha and gross beta radioactivity samples were analyzed by Core Laboratories,Casper, Wyoming. Seventeen tritium samples were analyzed by the Tritium Laboratory at University of Miami,Miami, Florida. Thirty-one isotope frH/lH and 180/160) samples were analyzed by the Stable IsotopeLaboratory at Southern Methodist University, Dallas, Texas. Each analytical laboratory is discussed separately.Sample handling, holding times, rmalytical methods, and data-quality objectives are listed in the quality-assuranceproject plan (Munter and others, 1990).
Alaska Division of Water Laboratory
Samole handling: All samples were received intact by the laboratory according to chain-ofcustody records.
Field cmalitv control checks: Two equipment blank samples, GWB3 and FB, and one trip blank sample, UT,were collected. The equipment blank and trip blank samples are free of contamination.
Three blind field duplicate samples were collected. Sample GW-4 was collected at Lindblom spring, sample FHwas collected at Beltz School well, and sample PH was collected at Moonlight Springs.
Laboratoryaitv control checks: All method-required quality control (QC) checks, including reagent blanks,laboratory duplicate samples, matrix spike samples, matrix spike duplicate samples, and standard referencesamples, were performed by the laboratory.
Timeliness: All samples were analyzed within holding time limits.
ml and continuing calibration: Instrument calibrations were within acceptable limits.
Btanks: Field and laboratory blanks associated with the samples are free of contamination.
Detection limits: Acceptable.
Matrix snikes laccuracv): Constituent-specific data quality (DQ) objectives for accuracy were not available frompublished literature at the time the quality assurance plan was written (Munter and others, 1990). Consequently,no constituent-specific comparison with the DQ objective can be made. For evaluation purposes, the accuracyobjective for all constituents is 80 to 120 percent recovery. The accuracy actually obtained is 83 to 109 percentrecovery.
&Jd dunlicates (overall precision): Overall Precision, which is a measure of both field and lab precision, iscalculable for samples GW-3 and its field duplicate GW-4, BS and its field duplicate FH, and OF and its fieldduplicate PH. The relative percent difference (BPD) is less than 10 percent for all constituents for the BSiFH andthe OF/PH comparison and less than 20 Percent for the GW-3/GW-4 comparison.
- 57 -

Laboratorv duplicates (lab precision\: Three constituents do not meet DQ objectives for lab precision:
Constituent Date Collected Precision DQ obiective
Flso4
so4Z n
June 1990June 1990Sept. 1990April 1991
4.4% 3.14%1.7% 1.2%1.3% 1.2%5.7% 4 %
Fluoride and zinc concentrations are either at or below the lower end of the optimal concentration range forthe analytical method used.
Lab precision, which is also expressed as relative percent difference (RPD), cannot be calculated whenvalues are less than the detection limit. Lab precision is calculated for constituents below detection limits in theApril 1991 sample set because samples from other sources, which had detectable concentrations, were analyzedduring the same determination The resultant RPD values are a measure of the analytical precision of theinstrument at that time.
Conclusion: Accuracy for all analyzed constituents is within 80 to 120 percent recovery. Overall precision iswithin 20 percent for all constituents. Lab precision meets or closely approaches DQ objectives. Therefore, alldata are deemed acceptable for use.
Core Laboratories
Sample handling: All samples were received intact by the laboratory according to chain-of-custody records.
Field ctualitv control checks: The collection of equipment blank samples, a trip blank sample, and a field duplicatesample were inadvertantly omitted from the field sampling program.
Laboratorv oualitv control checks: All method-required QC checks, as specified in EPA Method 900.0, wereperformed by the laboratory.
Timeliness: All samples were analyzed 6 wk after collection, within the 6-mo holding time limit.
Detection limits: Acceptable.
Matrix s&es faccuracv): The QC acceptance criteria listed on the lab’s quality assurance report is 100 z!c2.5 percent recovery (see Munter and others, 1991, page 37).
Laboratorv duplicates (lab precision): Relative percent difference for the samples is not shown on the lab’s qualityassurance report because they were not selected out of a larger batch of potential duplicate samples. Five of thesix samples that were analyzed aa duplicates have a PRD of less than 20 percent. Analysis I.D. 902061-5 has aRPD of 40 percent, but the actual values (0.2 pCi/l and 0.3 pCi/l) are below the lower limit of detection (LLD)of 0.5 pCi/l for the analytical method.
Conclusion: These data are deemed acceptable for use.
University of Miami Tritium Laboratory
Sample handling: All samples were received intact by the laboratory according to chain-of-custody records.
Field aualitv control checks: Two equipment blank samples, N-GWBSC and FB-2, consisting of deionized water,were collected. These samples are not valid as blanks because the field quality control check procedure wasincorrectly designed. The appropriate field check sample is a trip “blank” with a quantified tritium value that is
- 58 -
prepared in the laboratory prior to the sampling trip and accompanies the tritium samples from collection toanalysis.
Three blind field duplicate samples were collected. Sample N-GW-4C was collected at a spring nearLindblom Creek, sample FH-2 was collected at Beltz School well, and sample PH-1 was collected at Moonlightsprings.
Laboratory aualitv control checks: All method-required QC checks were performed by the laboratory as specifiedin the laboratory’s Procedures and Standards document (Munter and others, 1991, p. 57).
Timeliness: All samples were analyzed within 9 weeks, an acceptable turuaround time.
Detection limits: 0.1 Tritium Units (TU), which is equal to 0.0003 pCi/ml, is acceptable.
Matrix suikes (accuracv]: Accumcy data, listed as stated error (eTU), is one standard deviation, including allconceivable contributions. All samples had a stated error of 45 eTU. A lower stated error, 0.24 - 1.1 eTU, islisted for the June 1990 sample set because low-level counting and enrichment was mistakenly performed.
Field duplicates (overall precision): The precision objective for field duplicates is 55 TU. The differencesbetween sample N-GW3C and its field duplicate N-GW-4C, BS-2 and its field duplicate FH-2, and OF-1 and itsfield duplicate PH-1 are 1 TU, 4 TU, and 11 TU, respectively.
uratorv duplicates (lab precision): Lab precision data are listed as stated error (eTu), and represent onestandard deviation, including all conceivable contributions. Samples have a stated error of 55 eTU. A lowerstated error, 0.24 - 1.1 eTU, is listed for the June 1990 sample set because low-level counting and enrichmentwere mistakenly performed.
Conclusion: Fifteen of 17 samples are acceptable for use because sample error is less than the DQ objective off 6 TU. The numerical values for samples OF-1 and its field duplicate, PH-1, are urmseable because sampleerror exceeds 5 TU.
Southern Methodist University Stable Isotope Laboratory
Samole handling: All samples were received intact by laboratory according to chain-of-custody records.
Field oualitv control checks: Two equipment blank samples, GWP3A and FB-1, consisting of deionized water,were collected. These samples are not valid as blanks because the field quality control check program wasincorrectly designed. The appropriate field check sample is a trip “blank,” with quantified 2H/1H and 180/160ratios, that is prepared in the laboratory prior to the sampling trip and accompanies the stable isotope samplesfrom collection to analysis.
A set of six field duplicate samples were collected: N-GW-4A (collected at a spring near Lindblom Creek),AB-1 (collected at Anvil Creek), FH-1 (collected at Beltz School), PH-2 (collected at Moonlight Springs), SS-3 amelted snow sample (collected on Anvil Mountain), and uncoded rain samples (labeled “precip. gauge”) collectedfrom a precipitation collector at Moonlight Springs.
Labomtorv aualitv control checks: All method-required QC checks were performed by the laboratory, as specifiedin ‘Technical Information’ (Munter and others, 1991, p, 60).
Timeliness: All samples were analyzed within 12 wk from the time they were collected, which is acceptable.
Matrix mikes (accumcv]: No accuracy data were included in the analytical report.
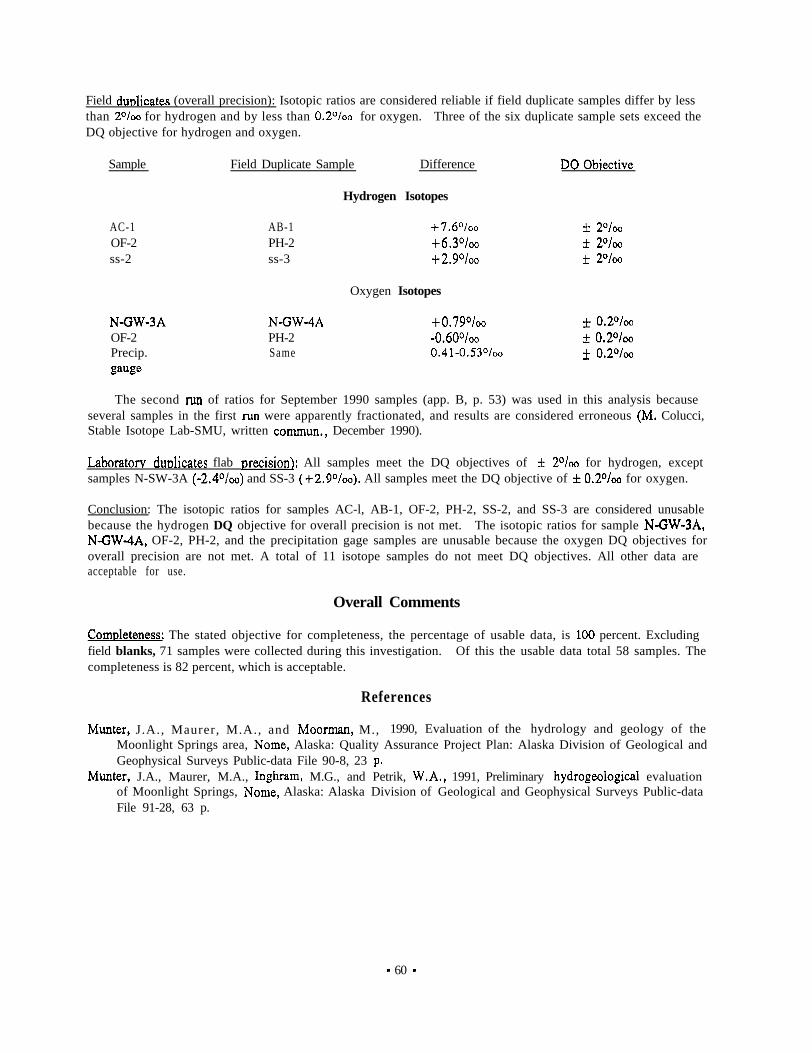
Field dunlicates (overall precision): Isotopic ratios are considered reliable if field duplicate samples differ by lessthan 2O/o0 for hydrogen and by less than 0.2O/o0 for oxygen. Three of the six duplicate sample sets exceed theDQ objective for hydrogen and oxygen.
Sample Field Duplicate Sample Difference DO Obiective
AC-1OF-2ss-2
AB-1PH-2ss-3
N-GW9AOF-2Precip.gauge
N-GW-4APH-2Same
Hydrogen Isotopes
+7.6°/oo+6.3O/oo+2.90/04
Oxygen Isotopes
* 20/00f 2Oloof 2o/oo
+0.790/00 * 0.2a/cm-0.60°/oa f 0.20/000.41-0.530/00 f 0.2~/00
The second run of ratios for September 1990 samples (app. B, p. 53) was used in this analysis becauseseveral samples in the first run were apparently fractionated, and results are considered erroneous (M. Colucci,Stable Isotope Lab-SMU, written commun., December 1990).
Laboratorv duolicates flab nrecision]: All samples meet the DQ objectives of * 2O/oo for hydrogen, exceptsamples N-SW-3A (-~.~O/OO) and SS-3 (+2,9O/oo). All samples meet the DQ objective of f 0.2O/00 for oxygen.
Conclusion: The isotopic ratios for samples AC-l, AB-1, OF-2, PH-2, SS-2, and SS-3 are considered unusablebecause the hydrogen DQ objective for overall precision is not met. The isotopic ratios for sample N-GW-3A,N-GWdA, OF-2, PH-2, and the precipitation gage samples are unusable because the oxygen DQ objectives foroverall precision are not met. A total of 11 isotope samples do not meet DQ objectives. All other data areacceptable for use.
Overall Comments
Comuleteness: The stated objective for completeness, the percentage of usable data, is 100 percent. Excludingfield blanks, 71 samples were collected during this investigation. Of this the usable data total 58 samples. Thecompleteness is 82 percent, which is acceptable.
References
Mu&r, J.A., Maurer, M.A., and Moorman, M., 1990, Evaluation of the hydrology and geology of theMoonlight Springs area, Nome, Alaska: Quality Assurance Project Plan: Alaska Division of Geological andGeophysical Surveys Public-data File 90-8, 23 p.
Munter, J.A., Maurer, M.A., In&ram, M.G., and Petrik, W.A., 1991, Preliminary hydrogeological evaluationof Moonlight Springs, Nome, Alaska: Alaska Division of Geological and Geophysical Surveys Public-dataFile 91-28, 63 p.
- 60 -

APPENDIX DHISTORICAL WATER-QUALITY DATA FOR MOONLIGHT SPRINGS
AND VICINITY, 1954-83
Locations of data: 1
USGS:1J.S. Geological SurveyWater Resources Division4230 University Drive, Suite 201Anchorage, Alaska
CH2M Hill:Data was obtained from report entitled: Water and Sewer Master Plan.Prepared for City of Nome by CH2M Hill, August 1976.
Qtt Water Engineers:Data was obtained from an unpublished report submitted to City of Nome by OttWater Engineers in 1982.
Alaska Gold Co.:Data was obtained from Alaska Dept. of Environmental Conservation files, Nome, Alaska.
ADEC:Data was obtained from Alaska Dept. of Environmental Conservation files, Nome, Alaska.
‘Copies of data are available at AIarkn Division of Water, 18225 Fish Hatchery Road, P.O. Box 772116, Eagle River, Alaska 99577.
-61 -
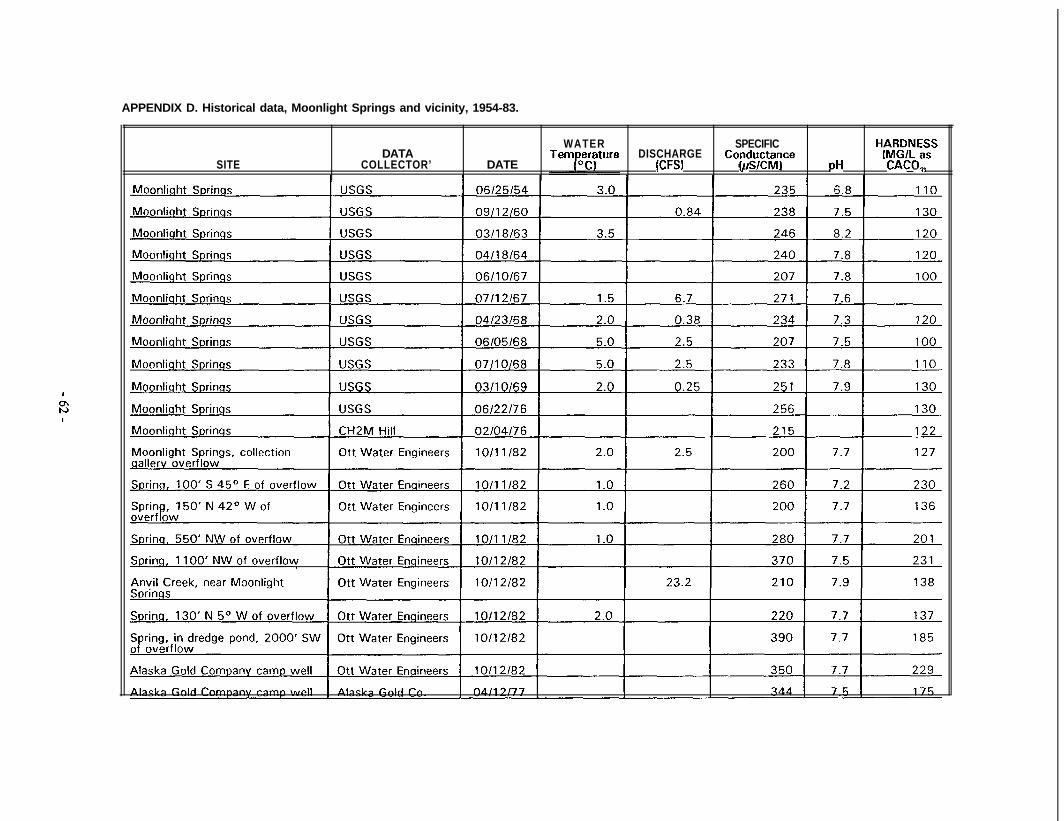
APPENDIX D. Historical data, Moonlight Springs and vicinity, 1954-83.
SITEDATA
COLLECTOR’ DATE
WATER SPECIFICDISCHARGE H$E:s
(CFSICOd!KtW3
fP I pH CACO,,
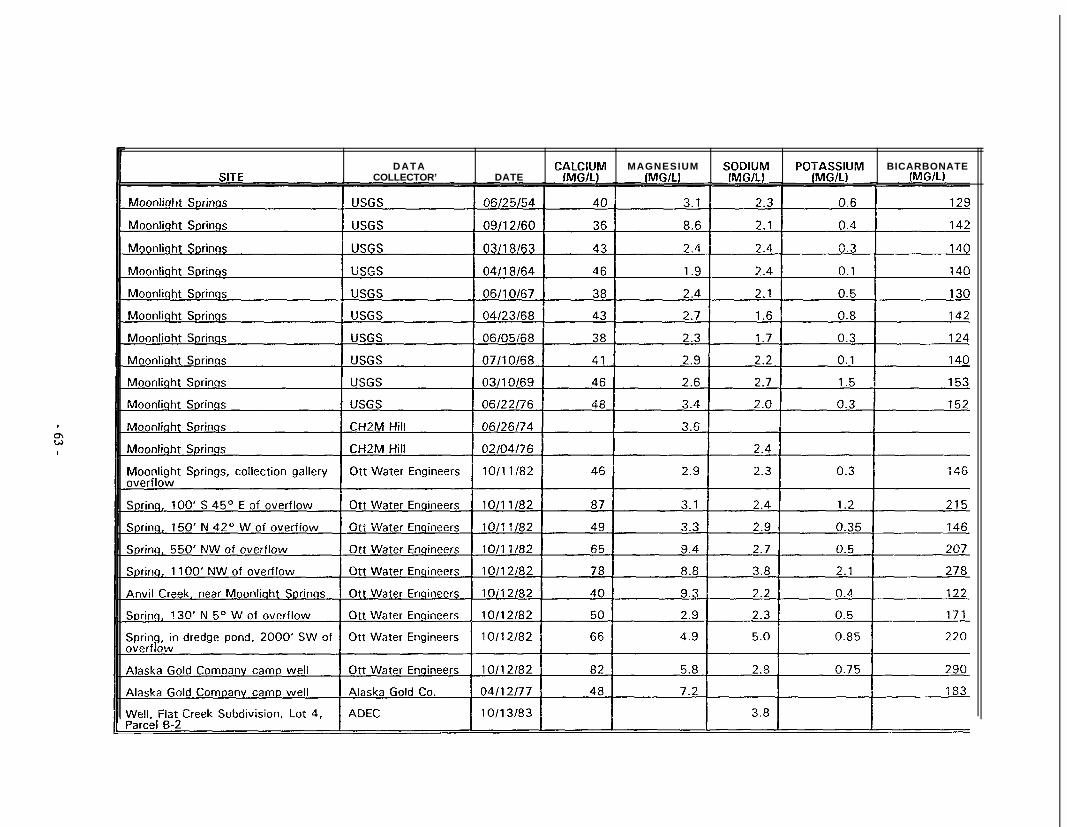
DATAS:TE COLLECTOR’ DATE c$%~~)M
MAGNESIUMIMGlLl %%:y
POTX;\UM BICARBONATE[MGILI
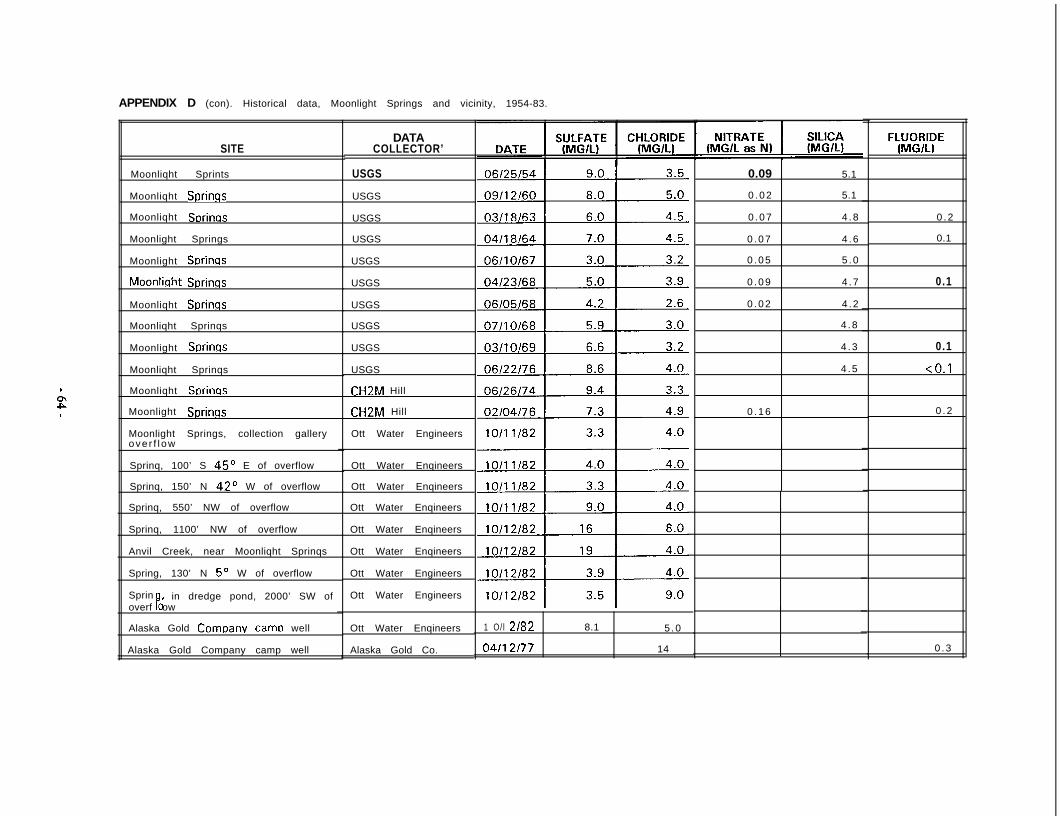
APPENDIX D (con). Historical data, Moonlight Springs and vicinity, 1954-83.
SITEDATA
COLLECTOR’
Moonliqht Sprints
Moonliqht Sprinqs
Moonliqht SDrinqs
Moonlight Springs
Moonlight Srxinqs
Moonlight Springs
Moonliqht Springs
Moonliqht Sprinqs
Moonlight SDrinqs
Moonliqht Sprinqs
Moonliqht SDrinqs
Moonlight Springs
Moonlight Springs, collection galleryove r f l ow
Sprinq, 100’ S 45O E of overflow
Sprinq, 150’ N 42O W of overflow
Sprinq, 550’ NW of overflow
Sprinq, 1100’ NW of overflow
Anvil Creek, near Moonliqht Sprinqs
Spring, 130’ N 5” W of overflow
SprinP
in dredge pond, 2000’ SW ofoverf ow
USGS
USGS
USGS
USGS
USGS
USGS
USGS
USGS
USGS
USGS
CH2M Hill
CH2M Hill
Ott Water Engineers
Ott Water Enqineers
Ott Water Enqineers
Ott Water Enqineers
Ott Water Enqineers
Ott Water Enqineers
Ott Water Engineers
Ott Water Engineers
Alaska Gold Company camp well Ott Water Enqineers 1 O/ l 2182 8.1 5 .0
Alaska Gold Company camp well Alaska Gold Co. 04/I 2177 14
0.09 5.1
0 .02 5.1
0 .07 4 .8
0 .07 4 .6
0 .05 5 .0
0 .09 4 .7
0 .02 4 .2
4 .8
4 .3
4 .5
0 .2
0.1
0.1
0.1
<O.l
0 .16 0 .2
0 .3
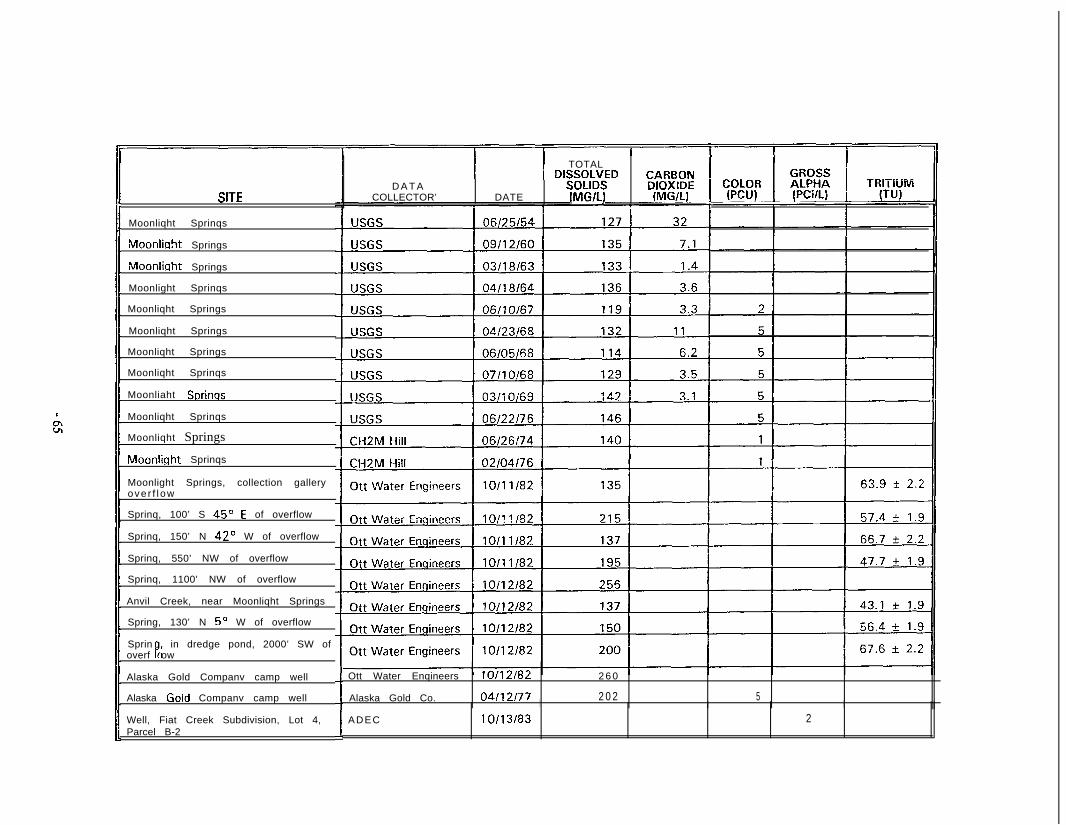
SITE
Moonliqht Sprinqs
Moonlight Springs
Moonlight Springs
Moonlight Sprinqs
Moonliqht Springs
Moonliqht Springs
Moonliqht Springs
Moonliqht Sprinqs
Moonliaht Sprints
Moonliqht Sprinqs
Moonliqht Springs
Moonlight Sprinqs
Moonlight Springs, collection galleryove r f l ow
Sprinq, 100’ S 45c E of overflow
Sprinq, 150’ N 42O W of overflow
Sprinq, 550’ NW of overflow
Sprinq, 1100’ NW of overflow
Anvil Creek, near Moonliqht Springs
Spring, 130’ N 5O W of overflow
SprinBr
in dredge pond, 2000’ SW ofoverf ow
Alaska Gold Companv camp well
Alaska Goid Companv camp well
Well, Fiat Creek Subdivision, Lot 4,Parcel B-2
I I TOTAL
D A T ADI%y;;;D
K%%!COLLECTOR’ DATE (MG/L) (MG/L)
Ott Water Enqineers 10/12/82 2 6 0
Alaska Gold Co. 04/l 2/77 2 0 2 5I I
ADEC i o/i 3183 2

APPENDIX D (con). Historical data, Moonlight Springs and vicinity, 1954-83.
[ SITE
Moonliqht Sprinqs
Moonliqht Sprints
Moonliqht Sprinqs
Well, Flat Creek Subdivision, Lot 4,Parcel B-2
DATACOLLECTOR’ DATE
USGS 06122176 1 <IO0 <lO <lO 2
CH2M Hill 06/26/74 4 5
CH2M Hil l 02/04/76 10 5 0 <5 <20
ADEC 10/13/83 1 3 0 <200 <2 <5
SITE
Moonliqht Sprinqs
Moonlight Sprints
Well, Flat Creek Subdivision, Lot 4,Parcel B-2
DATA SELENIUM ZINCCOLLECTOR’ DATE (pIGIL @GIL)
USGS 06122176 <l <l <lO
CH2M Hill 0210417 6 <I <IO <20
ADEC 1 O/l 3183 <l <2 <2
APPENDIX EWATER-USE RECORDS AND STATISTICS FOR NOME, ALASKA
(Quantities in gallons unless otherwise noted)
-67 -

WA~-US~ R]EcORDS AND STATISTICS FOR NOME, A-LAS=(Quantities in gallons unless otherwise noted)
FULL YEAR PERIOD OF RECORD
074M9 I zzlrn
,E
I
Eb” Hc.ln QPD
=
CF8
-tnax3
Ed. TOW w 1 I-EQ.N
CFS M Nan GPD CFS
am2 14- 41.42s CL746
0.826
0.794
a707
n7m
073,
0.7e-s
0810
0.727
0.718
0.o4.s ,4,,58750 47w%? 0.722
- 69 -