State of Alabama Ambient Air Monitoring 2015 Consolidated ... · Air Assessment Unit ... JCDH ......
68
State of Alabama Ambient Air Monitoring 2015 Consolidated Network Review
Transcript of State of Alabama Ambient Air Monitoring 2015 Consolidated ... · Air Assessment Unit ... JCDH ......

State of Alabama
Ambient Air Monitoring
2015 Consolidated Network Review

2015AmbientAirPlan.docx 7/23/2015
Page 2 of 68
Table of Contents
Table of Contents………………………………………………………………………….
Definitions and Acronyms
Introduction ..................................................................................................................................... 5 Public Review and Comment.......................................................................................................... 5
Overview of Alabama’s Air Monitoring Network.......................................................................... 6 Summary of findings of the network review .............................................................................. 6 Population and CBSA ............................................................................................................... 10
Types of Monitoring Stations ....................................................................................................... 15 PAMS ........................................................................................................................................ 15
SLAMS ..................................................................................................................................... 15 STN ........................................................................................................................................... 15
Supplemental Speciation ........................................................................................................... 15 NCore ........................................................................................................................................ 15 CASTNET................................................................................................................................. 15
Alabama’s SLAMS by Pollutant .................................................................................................. 16
Lead Network............................................................................................................................ 16 Carbon Monoxide (CO) Network ............................................................................................. 17 Nitrogen Dioxide (NO2) Network ............................................................................................. 18
Sulfur Dioxide (SO2) Network.................................................................................................. 19 PM10 Network ........................................................................................................................... 21
Ozone Network ......................................................................................................................... 23 Ozone Monitoring requirements for Alabama MSAs ........................................................... 25
PM2.5 Network .......................................................................................................................... 27
Quality Assurance ......................................................................................................................... 32
Monitoring Equipment Evaluation ............................................................................................... 32 NETWORK DESCRIPTIONS ..................................................................................................... 33
ADEM AIR MONITORING NETWORK DESCRIPTION .................................................... 34
PM10 ...................................................................................................................................... 35 Lead....................................................................................................................................... 35
PM 2.5 ................................................................................................................................... 36 PM 2.5 continued .................................................................................................................. 37 OZONE ................................................................................................................................. 38 SO2 ........................................................................................................................................ 39
JCDH AIR MONITORING NETWORK DESCRIPTION ...................................................... 40 Ozone .................................................................................................................................... 41 SO2 ........................................................................................................................................ 42
NOy ....................................................................................................................................... 43 NO2 ....................................................................................................................................... 43 Low Volume PM10 ................................................................................................................ 44 Continuous PM10 ................................................................................................................... 45
Lead....................................................................................................................................... 45 PM2.5 ..................................................................................................................................... 46 Continuous PM2.5 .................................................................................................................. 47
PM10 IMPROVE ................................................................................................................... 47

2015AmbientAirPlan.docx 7/23/2015
Page 3 of 68
PM2.5 IMPROVE Speciation................................................................................................. 48
PM2.5 STN Speciation ........................................................................................................... 48 RadNet .................................................................................................................................. 49 HUNTSVILLE AIR MONITORING NETWORK DESCRIPTION ................................... 50
APPENDIX A ............................................................................................................................... 51 Jefferson County Department Of Health (JCDH) ......................................................................... 51
Jefferson County Department Of Health (JCDH) ..................................................................... 52 Annual Air Monitoring Network Plan ...................................................................................... 52 Summary of Changes to the Network ....................................................................................... 52
Continuous PM2.5 SPM (Special Purpose Monitors) ............................................................ 54 Network Review Findings .................................................................................................... 59
APPENDIX B ............................................................................................................................... 60 Huntsville Department of Natural Resources and Environmental Management (HDNREM) . 60
NCore Ambient Air Monitoring Stations ..................................................................................... 61 SLAMS (State and Local Air Monitoring Stations) ..................................................................... 61
SPM (Special Purpose Monitors).................................................................................................. 63 Network Review Findings ............................................................................................................ 64
APPENDIX C ............................................................................................................................... 65 Maps .............................................................................................................................................. 65
ADEM Monitoring Sites ....................................................................................................... 66
Jefferson County ................................................................................................................... 67 City of Huntsville .................................................................................................................. 68
List of Tables Table 1 - 2014 Alabama Monitoring Network ............................................................................... 8
Table 2 – 2014 Estimated MSA Population ................................................................................. 10 Table 3- Alabama CBSAs ............................................................................................................. 12 Table 4 - JCDH CO Monitoring sites ........................................................................................... 17
Table 5 - CBSA’s PWEI and number of monitors required ......................................................... 20 Table 6 - APPENDIX D TO PART 58. PM10 MINIMUM MONITORING REQUIREMENTS
....................................................................................................................................................... 21 Table 7 - APPENDIX D TO PART 58. SLAMS MINIMUM O3 MONITORING
REQUIREMENTS ........................................................................................................................ 23
Table 8- Alabama MSAs with Ozone Monitoring Sites and current Design Value ..................... 24 Table 9 - APPENDIX D TO PART 58, PM2.5 MINIMUM MONITORING REQUIREMENTS
....................................................................................................................................................... 27 Table 10- MSAs with PM2.5 Monitoring Sites and current Design Value .................................... 28
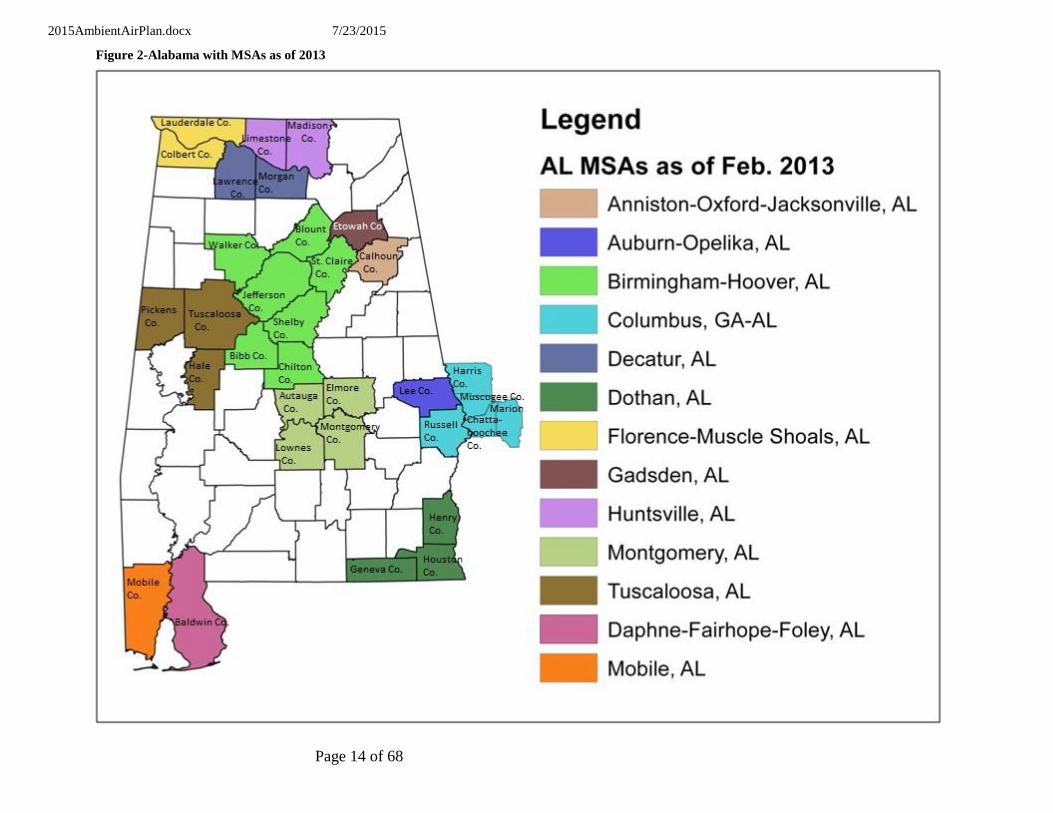
List of Figures Figure 1 – US CBSAs and Counties as of February 2013 ............................................................ 13 Figure 2-Alabama with MSAs as of 2013 .................................................................................... 14

2015AmbientAirPlan.docx 7/23/2015
Page 4 of 68
Definitions and Acronyms AAQM ambient air quality monitoring AAQMP Ambient Air Quality Monitoring Plan ADEM Alabama Department of Environmental Management Appendix D Volume 40, Code of Federal Regulations, part 58, Appendix D AQS air quality system Avg average Bham Birmingham CBSA Core Based Statistical Area CFR Code of Federal Regulations CO Carbon Monoxide CSA Consolidated Statistical Area EPA Environmental Protection Agency FEM Federal Equivalent Method FRM Federal Reference Method HDNREM Huntsville Division of Natural Resources and Environmental Management hr hour hi-vol high-volume PM10 sampler JCDH Jefferson County Department of Health Low-vol low-volume particulate sampler m3 cubic meter min minute ml milliliter MSA metropolitan statistical area NAAQS national ambient air quality standard NCore National core monitoring (multi-pollutant) O3 ozone PAMS photochemical air monitoring station Pb lead PM particulate matter PM2.5 particulate matter less than 2.5 micrometers diameter PM10 particulate matter less than 10 micrometer diameter
PM10-2.5 particulate matter less than 10 microns but greater than 2.5 microns
QA quality assurance QAPP Quality Assurance Project Plan QC quality control SLAMS state and local air monitoring station SO2 sulfur dioxide SPM special purpose monitor STN (PM2.5) Speciation Trends Network TEOM Tapered Element Oscillating Microbalance (Rupprecht and Patashnick Co.) TPY Tons per Year TSP total suspended particulate URG URG-3000N PM2.5 Speciation monitoring carbon-specific sampler USEPA United States Environmental Protection Agency
° C degree Celsius μg/m
3 micrograms (of pollutant) per cubic meter (of air sampled)

2015AmbientAirPlan.docx 7/23/2015
Page 5 of 68
Introduction
In October 2006, U.S.EPA issued final Federal Regulations (40 CFR 58) concerning state and
local agency ambient air monitoring networks. These regulations require states to submit an
annual monitoring network review to U.S.EPA. This network plan is required to provide the
framework for establishment and maintenance of an air quality surveillance system and to list
any changes that are proposed to take place to the current network during 2015.
Public Review and Comment
The annual monitoring network review must be made available for public inspection for thirty
(30) days prior to submission to U.S.EPA. For 2015, this document was placed on ADEM’s
website on June 2 to begin a 30 day public review period. This document can be accessed at the
following link:
http://www.adem.state.al.us/newsEvents/publicNotices.cnt
then choose this document.
Or by contacting: Michael E. Malaier, Chief
Air Assessment Unit Field Operations Division
Alabama Department of Environmental Management P.O. Box 301463, Montgomery, AL 36130-1463
(Street address: 1350 Coliseum Boulevard, Montgomery, AL 36110-2059) Or by e-mail at [email protected].

2015AmbientAirPlan.docx 7/23/2015
Page 6 of 68
Overview of Alabama’s Air Monitoring Network
Monitors in the state of Alabama are operated for a variety of monitoring objectives. These
objectives include determining whether areas of the state meet the National Ambient Air Quality
Standards (NAAQS), for public information (such as, participation in EPA's AirNow program),
Air Quality Index (AQI) reporting for larger Metropolitan Statistical Areas MSAs, for use in Air
Quality models and to provide data to Air Quality Researchers. Alabama monitors the six (6)
criteria pollutants which have NAAQS identified for them; CO, Lead, NO2, Ozone, particulate
matter (PM10 and PM2.5), and SO2. There are other non-criteria pollutants that are also monitored
for special purposes (such as PM2.5 speciated compounds). In addition meteorological data are
also collected to support the monitoring and aid in analysis of the data.
In Alabama the air quality surveillance system is operated by the state environmental agency and
two local programs. The agencies are the Alabama Department of Environmental Management
(ADEM), the Jefferson County Department of Health (JCDH), and the Huntsville Department of
Natural Resources and Environmental Management (HDNREM). Each of these agencies has
performed the required annual review of their portion of the current ambient air quality network
and developed a proposed network to be implemented during 2014. This document is a
compilation of the reports from each agency.
Currently, the Air Quality Index (AQI) is reported for Huntsville, Birmingham, Mobile,
Montgomery and Phenix City on the Internet at the sites listed below.
ADEM http://www.adem.state.al.us/programs/air/airquality/ozone/historical.cnt
JCDH http://www.jcdh.org/EH/AnR/AnR03.aspx
HDNREM http://www.hsvcity.com/NatRes/Pollen/polindex.htm#DAQ
An overview of the 2014 Alabama Monitoring Network can be seen in Table 1.
Summary of findings of the network review
A national review was conducted by the US EPA of the Chemical Speciation Network. During
this review the PM 2.5 speciation monitors in Montgomery and Huntsville were determined to be
of low value. EPA chose to discontinue funding these monitors. ADEM and Huntsville closed
these monitors in January of 2015.
ADEM
The owner of the building where the Pelham (AQS ID: 01-117-0006) PM 2.5 monitor is located
has asked ADEM to remove that monitor from the roof of their building. ADEM has been
unable to locate an acceptable site in the same vicinity so this site will be closed in June 2015.
This monitor is within the Birmingham MSA and has the lowest design value for the area. The
MSA will still meet the minimum required number of PM 2.5 monitors.

2015AmbientAirPlan.docx 7/23/2015
Page 7 of 68
In the 2014 Annual Monitoring Plan ADEM requested to discontinue PM 10 monitoring at the
WKRG site in Mobile, Al. ADEM closed this site as of December 29, 2014.
.
HDNREM
There are no changes planned for the Huntsville Air Monitoring Network.
JDCH
Summary of changes for JCDH in 2014
Addition of Near Road Monitoring Site at Arkadelphia Road
Discontinued monitoring for Low Vol PM10 at Tarrant, Fairfield, Sloss Shuttlesworth
and McAdory.
Proposed changes for 2015
Replacement of shelters at Wylam and Tarrant
Discontinuation of PM2.5 and CO at Sloss Shuttlesworth
Variance/Exclusion request from using the PM2.5 continuous FEM data at the North
Birmingham site for NAAQS purposes
2015AmbientAirPlan.docx 7/23/2015
Page 8 of 68
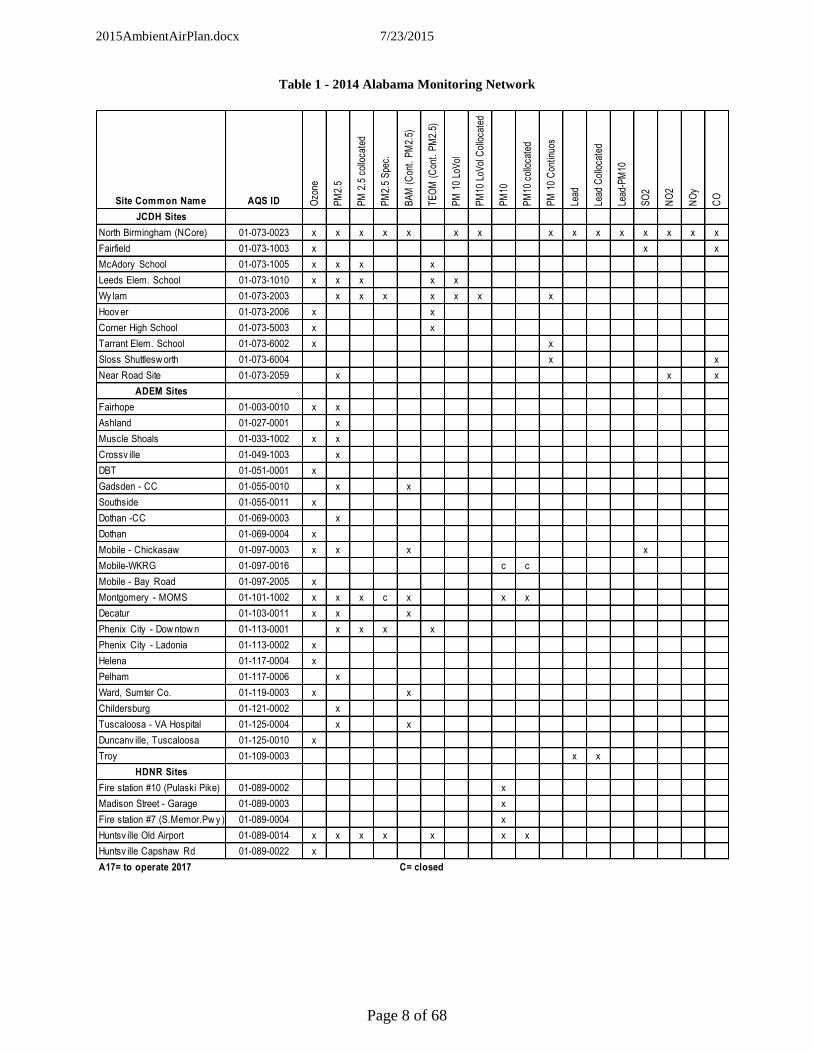
Table 1 - 2014 Alabama Monitoring Network
Site Common Name AQS ID Ozo
ne
PM
2.5
PM
2.5
col
loca
ted
PM
2.5
Spe
c.
BA
M (
Con
t. P
M2.
5)
TE
OM
(C
ont.
PM
2.5)
PM
10
LoV
ol
PM
10 L
oVol
Col
loca
ted
PM
10
PM
10 c
ollo
cate
d
PM
10
Con
tinuo
s
Lead
Lead
Col
loca
ted
Lead
-PM
10
SO
2
NO
2
NO
y
CO
JCDH Sites
North Birmingham (NCore) 01-073-0023 x x x x x x x x x x x x x x x
Fairfield 01-073-1003 x x x
McAdory School 01-073-1005 x x x x
Leeds Elem. School 01-073-1010 x x x x x
Wy lam 01-073-2003 x x x x x x x
Hoov er 01-073-2006 x x
Corner High School 01-073-5003 x x
Tarrant Elem. School 01-073-6002 x x
Sloss Shuttlesw orth 01-073-6004 x x
Near Road Site 01-073-2059 x x x
ADEM Sites
Fairhope 01-003-0010 x x
Ashland 01-027-0001 x
Muscle Shoals 01-033-1002 x x
Crossv ille 01-049-1003 x
DBT 01-051-0001 x
Gadsden - CC 01-055-0010 x x
Southside 01-055-0011 x
Dothan -CC 01-069-0003 x
Dothan 01-069-0004 x
Mobile - Chickasaw 01-097-0003 x x x x
Mobile-WKRG 01-097-0016 c c
Mobile - Bay Road 01-097-2005 x
Montgomery - MOMS 01-101-1002 x x x c x x x
Decatur 01-103-0011 x x x
Phenix City - Dow ntow n 01-113-0001 x x x x
Phenix City - Ladonia 01-113-0002 x
Helena 01-117-0004 x
Pelham 01-117-0006 x
Ward, Sumter Co. 01-119-0003 x x
Childersburg 01-121-0002 x
Tuscaloosa - VA Hospital 01-125-0004 x x
Duncanv ille, Tuscaloosa 01-125-0010 x
Troy 01-109-0003 x x
HDNR Sites
Fire station #10 (Pulaski Pike) 01-089-0002 x
Madison Street - Garage 01-089-0003 x
Fire station #7 (S.Memor.Pw y ) 01-089-0004 x
Huntsv ille Old Airport 01-089-0014 x x x x x x x
Huntsv ille Capshaw Rd 01-089-0022 x
A17= to operate 2017 C= closed

2015AmbientAirPlan.docx 7/23/2015
Page 9 of 68
Network Plan Description As per 40 CFR Part 58.10, an annual monitoring network plan which provides for the
establishment and maintenance of an air quality surveillance system consisting of the air quality
monitors in the state, is required to be submitted by all states to U.S.EPA.
Specifically §58.10 (a) requires for each existing and proposed monitoring site:
1. A statement of purpose for each monitor.
2. Evidence that siting and operation of each monitor meets the requirements of
appendices A, C, D, and E of 40 CFR Part 58, where applicable.
3. Proposals for any State and Local Air Monitoring station (SLAMS) network
modifications.
§58.10 (b) requires the plan must contain the following information for each existing and
proposed site:
1. The Air Quality System (AQS) site identification number.
2. The location, including street address and geographical coordinates.
3. The sampling and analysis method(s) for each measured parameter.
4. The operating schedules for each monitor.
5. Any proposals to remove or move a monitoring station within a period of 18 months following
plan submittal.
6. The monitoring objective and spatial scale of representativeness for each monitor.
7. The identification of any sites that are suitable and sites that are not suitable for comparison
against the annual PM2.5 NAAQS as described in §58.30.
8. The Metropolitan Statistical Area (MSA), Core Based Statistical Area (CBSA), Combined
Statistical Area (CSA) or other area represented by the monitor.
9. The designation of any Pb monitors as either source-oriented or non-source-oriented according
to Appendix D to 40 CFR part 58.
10. Any source-oriented monitors for which a waiver has been requested or granted by the
U.S.EPA Regional Administrator as allowed for under paragraph 4.5(a)(ii) of Appendix D to 40
CFR part 58.
11. Any source-oriented or non-source-oriented site for which a waiver has been requested or
granted by the U.S.EPA Regional Administrator for the use of Pb-PM10 monitoring in lieu of
Pb-TSP monitoring as allowed for under paragraph 2.10 of Appendix C to 40 CFR part 58.
Monitoring Requirements
Appendix A of 40 CFR Part 58 outlines the Quality Assurance Requirements for SLAMS,
SPMs, and PSD Air Monitoring. It details the calibration and auditing procedures used to collect
valid air quality data, the minimum number of collocated monitoring sites, the calculation used
for data quality assessments, and the reporting requirements. All sites in Alabama operate
following the requirements set forth in this appendix.

2015AmbientAirPlan.docx 7/23/2015
Page 10 of 68
Appendix C of 40 CFR Part 58 specifies the criteria pollutant monitoring methods which must
be used in SLAMS and NCore stations. All criteria pollutant monitoring in Alabama follows the
methods specified in this appendix.
Appendix D of 40 CFR Part 58 deals with the network design criteria for ambient air quality
monitoring. The overall design criteria, the minimum number of sites for each parameter, the
type of sites, the spatial scale of the sites, and the monitoring objectives of the sites are detailed.
In designing the air monitoring network for Alabama, the requirements of this appendix were
followed. The specifics for each pollutant network are in the their individual chapters.
Appendix E of 40 CFR Part 58 deals with the placement of the monitoring probe, it’s spacing
from obstructions and what materials the probe can be made of. All monitors operated in
Alabama meet Appendix E criteria.
Population and CBSA
Alabama has a population of 4,849,377 of which 3,813,080 is located in the 13 MSAs listed in
Table 2.
Table 2 – 2014 Estimated MSA Population
Metropolitan Statistical Areas
Anniston-Oxford, AL 115,916
Auburn-Opelika, AL 154,255
Birmingham-Hoover, AL 1,263,730
Columbus, GA-AL 314,005
Daphne-Fairhope-Foley, AL 200,111
Decatur, AL 153,084
Dothan, AL 148,095
Florence-Muscle Shoals, AL 147,639
Gadsden, AL 103,531
Huntsville, AL 441,086
Mobile, AL 415,123
Montgomery, AL 373,141
Tuscaloosa, AL 237,761
Minimum monitoring requirements vary for each pollutant and can be based on a combination of
factors such as population, the level of monitored pollutants and Core Based Statistical Area
(CBSA) boundaries as defined in the latest US Census information. The term "Core Based
Statistical Area" (CBSA) is a collective term for both Metropolitan Statistical Areas (MSA) and
Micropolitan Statistical Areas (µSA).
In February 2013 the Office of Management and Budget issued a Bulletin on the “Revised
Delineations of Metropolitan Statistical Areas, Micropolitan Statistical Areas, and Combined
Statistical Areas, and Guidance on Uses of the Delineations of These Areas”. Based on the 2010

2015AmbientAirPlan.docx 7/23/2015
Page 11 of 68
Census some changes were made to certain statistical areas listed above. The major changes that
affected Alabama were:
The Daphne-Fairhope-Foley, AL area was upgraded to a MSA from a µSA.
The boundary of the Tuscaloosa MSA changed. Pickens County was added and Greene
County was removed.
The Enterprise-Ozark, AL µSA was split into the Enterprise, AL µSA and Ozark, AL µSA.
Table 3 List the CBSAs in Alabama along with the names of the counties included in that area,
and the 2012 estimated population.. The Metropolitan Statistical Areas are listed first by highest
population, then Micropolitan Statistical Areas are listed by highest population.

2015AmbientAirPlan.docx 7/23/2015
Page 12 of 68
Table 3- Alabama CBSAs
CBSA Title Metropolitan/Micropolitan
Statistical Area County/County
Equivalent
2014 CBSA
Population Estimate
Anniston-Oxford-Jacksonville, AL Metropolitan Statistical Area Calhoun County 115916
Auburn-Opelika, AL Metropolitan Statistical Area Lee County 154255
Birmingham-Hoover, AL Metropolitan Statistical Area Bibb, Blount, Chilton, Jefferson, St. Clair,
Shelby, Walker 1263739
Columbus, GA-AL Metropolitan Statistical Area Russell, Chattahoochee GA, Harris GA, Marion
GA, Muscogee GA 314005
Daphne-Fairhope-Foley, AL Metropolitan Statistical Area Baldwin County 200111
Decatur, AL Metropolitan Statistical Area Lawrence, Morgan 153084
Dothan, AL Metropolitan Statistical Area Geneva, Henry, Houston 148095
Florence-Muscle Shoals, AL Metropolitan Statistical Area Colbert, Lauderdale 147639
Gadsden, AL Metropolitan Statistical Area Etowah County 103531
Mobile, AL Metropolitan Statistical Area Mobile County 415123
Huntsville, AL Metropolitan Statistical Area Limestone, Madison 441086
Montgomery, AL Metropolitan Statistical Area Autauga, Elmore,
Lowndes, Montgomery 373141
Talladega-Sylacauga, AL Micropolitan Statistical Area Coosa, Talladega 92208
Albertville, AL Micropolitan Statistical Area Marshall County 94636
Cullman, AL Micropolitan Statistical Area Cullman County 81289
Enterprise, AL Micropolitan Statistical Area Coffee County 50909
Ozark, AL Micropolitan Statistical Area Dale County 49484
Scottsboro, AL Micropolitan Statistical Area Jackson County 52665
Selma, AL Micropolitan Statistical Area Dallas County 41711
Tuscaloosa, AL Metropolitan Statistical Area Hale, Pickens, Tuscaloosa 237761
Troy, AL Micropolitan Statistical Area Pike County 33389

2015AmbientAirPlan.docx 7/23/2015
Page 13 of 68
Figure 1 – US CBSAs and Counties as of February 2013
2015AmbientAirPlan.docx 7/23/2015
Page 14 of 68
Figure 2-Alabama with MSAs as of 2013

2015AmbientAirPlan.docx 7/23/2015
Page 15 of 68
Types of Monitoring Stations
PAMS – Photochemical Assessment Monitoring Station: Sites established to obtain more
comprehensive data of areas with high levels of ozone pollution by also monitoring NOx and
VOCs. PAMS monitoring is not required in the state of Alabama.
SLAMS - State or Local Ambient Monitoring Station: The SLAMS make up the ambient air
quality monitoring sites that are primarily needed for NAAQS comparisons.
These will be described in detail by pollutant and Monitoring Agency later.
STN – PM2.5 Speciation Trends Network: A PM2.5 speciation station designated to be part of the
speciation trends network. This network provides chemical species data of fine particulates.
There is currently 1 STN site located in Alabama at the North Birmingham site (01-073-
0023).
Supplemental Speciation - Any PM2.5 speciation station that is used to gain supplemental
data and is not dedicated as part of the speciation trends network.
There are currently 2 PM2.5 supplemental speciation sites located in Alabama. These are at
Phenix City, and Wylam.
NCore – National Core multi-pollutant monitoring station: Sites that measure multiple
pollutants at trace levels in order to provide support to integrated air quality management data
needs. Each state is required to operate one NCore site. The NCore site for Alabama is located
in the Birmingham MSA at the North Birmingham site (01-073-0023) operated by JDCH.
Additional information concerning this site can be found in the JCDH portion of the
network description.
CASTNET – Clean Air Status and Trends Network: is a national air quality monitoring network
designed to provide data to assess trends in air quality, atmospheric deposition, and ecological
effects due to changes in air pollutant emissions. CASTNET provides long-term monitoring of
air quality in rural areas to determine trends in regional atmospheric nitrogen, sulfur, and ozone
concentrations and deposition fluxes of sulfur and nitrogen pollutants in order to evaluate the
effectiveness of national and regional air pollution control programs. Recently for Ozone
CASTNET upgraded its equipment and its procedures to meet the same requirements as
SLAMS. EPA-sponsored CASTNET ozone monitors have now become Part 58 compliant and
therefore the data can be used for regulatory purposes. CASTNET Ozone data are now reported
to AQS. There is one CASNET site in Alabama and it is operated by an EPA contractor. It is
Sand Mountain (AQS ID 01-049-9991) in De Kalb county.
2015AmbientAirPlan.docx 7/23/2015
Page 16 of 68
Alabama’s SLAMS by Pollutant
Lead Network
In 2008, the US EPA revised the National Ambient Air Quality Standard for lead. The lead
standard was lowered from 1.5 ug/m3 for a quarterly average to 0.15 ug/m
3 based on the highest
rolling 3 month average over a 3 year period. EPA set minimum monitoring requirements for
source and population oriented monitoring. Source oriented monitoring is required near sources
that have emissions greater than or equal to 1 ton per year. Population oriented monitoring is
required for CBSAs greater than 500,000. In December of 2010 EPA revised the lead rule to
include sources greater than ½ ton per year and stated that the Population oriented monitors
would be located at the NCore sites.
Based on current emissions data or modeling ADEM has identified 1 source (Sanders Lead Co.)
which emits greater than 1/2 ton of lead per year. ADEM has an existing monitor (AQS ID 01-
109-0003) near that source. This monitor appears to be sited in the proper location and ADEM
will continue to operate that monitor. To meet QA requirements, collocated Lead monitoring is
also occurring at this site.
Based on current emission data, JCDH and the City of Huntsville have no sources that would
require monitoring.
In addition, Pb monitoring is required at any NCore site in each CBSA with a population equal to
or greater than 500,000 people. For the Birmingham-Hoover MSA, this site is being operated by
JDCH and is located at the NCORE (North Birmingham AQS ID 01-073-0023) site and has been
collecting data since 12-29-2011.
In the 2010 rule revision (FR Vol. 75, No. 247, pg 81126-81138), EPA identified 15 airports
across the nation that had a potential for lead emissions that could lead to a violation of the Lead
NAAQS. At least one year of lead monitoring was required at each of these airports, and if the
results were greater than 50% of the Lead NAAQS then the monitor would continue to be
required. Alabama’s Pryor Field Regional was one of these airports. Subsequently, monitoring
was performed from 1/1/2013 through 12/31/2013. The results of this monitoring were less than
50% of the NAAQS so this site was closed after 2013.

2015AmbientAirPlan.docx 7/23/2015
Page 17 of 68
Carbon Monoxide (CO) Network
On August 12, 2011 EPA issued a final rule that retained the existing NAAQS for Carbon
Monoxide (CO) and made changes to the ambient air monitoring requirements for CO.
EPA revised the minimum requirements for CO monitoring by requiring CO monitors to be sited
near roads in certain urban areas.
40 CFR Part 58 Appendix D, 4.2 details the requirements for CO monitoring.
4.2.1 General Requirements. (a) Except as provided in subsection (b), one CO monitor is required to operate collocated with one required near-road NO2 monitor, as required in Section 4.3.2 of this part, in CBSAs having a population of 1,000,000 or more persons. If a CBSA has more than one required near-road NO2 monitor, only one CO monitor is required to be collocated with a near-road NO2 monitor within that CBSA.
(b) If a state provides quantitative evidence demonstrating that peak ambient CO concentrations would occur in a near-road location which meets microscale siting criteria in Appendix E of this part but is not a near-road NO2 monitoring site, then the EPA Regional Administrator may approve a request by a state to use such an alternate near-road location for a CO monitor in place of collocating a monitor at near-road NO2 monitoring site.
EPA is specifying that monitors required in CBSAs of 2.5 million or more persons are to be
operational by January 1, 2015. Those monitors required in CBSAs having 1 million or more
persons are required to be operational by January 1, 2017.
Based on this, one CO monitor would be required to be collocated with the near road NO2
monitoring road site in the Birmingham-Hover, AL CBSA and operational by January 1, 2017.
JDCH is currently operating a near-road NO2 monitoring site. JCDH has relocated the CO
monitor currently at East Thomas (AQS ID 01-073-0028) to this new site (AQS ID 01-073-2059)
to meet the new monitoring requirements. The East Thomas site was closed due to Alabama
Department of Transportation road expansion on Arkadelphia Road.
JCDH is proposing to discontinue monitoring for CO at the Sloss Shuttlesworth site due to low
concentrations and the facility shutdown of the source (in 1999), Walter Energy Mineral Wool
facility that was the primary contributor to and reason for monitoring CO at the Sloss
Shuttlesworth site. JCDH installed the CO monitor in 1996 as a fenceline site for the mineral
wool facility.
Currently CO is monitored at the following 4 sites :
Table 4 - JCDH CO Monitoring sites
AQS No. County Site Name Latitude Longitude Start Date Objective Scale Frequency
01-073-2059
Jefferson
Near Road Site
33.521427
-86.815000
1/1/2014
High Pop.
Exposure
Micro
Continuously
Year-round
01-073-1003
Jefferson
Fairfield, PFD
33.485556
-86.915062 12/11/74
High Pop. Exposure
Neighborhood
Continuously Year-round
01-073-6004
Jefferson
N. B’ham,
Sloss
33.565278
-86.796389
9/25/96
High
Conc.
Neighborhood
Continuously
Year-round
01-073-0023
Jefferson
N. B’ham, SR
33.553031
-86.814853 3/1/2000
High Pop. Exposure
Neighborhood
Continuously Year-round

2015AmbientAirPlan.docx 7/23/2015
Page 18 of 68
Nitrogen Dioxide (NO2) Network
On January 22, 2010 the US EPA finalized the monitoring rules for Nitrogen Dioxide. The new
rules include new requirements for the placement of new NO2 monitors in urban areas.
These include:
Near Road Monitoring
• At least one monitor must be located near a major road in each CBSA with a
population greater than or equal to 500,000 people. A second monitor is required near another
major road in areas with either:
(1) CBSA population greater than or equal to 2.5 million people, or
(2) one or more road segment with an annual average daily traffic (AADT) count
greater than or equal to 250,000 vehicles.
These NO2 monitors must be placed near those road segments ranked with the
highest traffic levels by AADT, with consideration given to fleet mix, congestion
patterns, terrain, geographic location, and meteorology in identifying locations
where the peak concentrations of NO2 are expected to occur. Monitors must be
placed no more than 50 meters (about 164 feet) away from the edge of the nearest
traffic lane.
For near road NO2 monitoring Birmingham-Hoover is the only CBSA in Alabama with a
population greater than 500,000. However, the population is less than 2.5 million and there are
no road segments with AADT greater than 250,000 vehicles. Therefore, one near road NO2
monitor is located in the Birmingham-Hoover CBSA. JCDH has established a site at Arkadelphia
Road (AQS ID 01-073-2059). The establishment of a permanent near-road NO2 monitoring site
met design and siting criteria as spelled out in 40 CFR Part 58 and was operational by January 1,
2014.
Community Wide Monitoring
• A minimum of one monitor must be placed in any urban area with a population
greater than or equal to 1 million people to assess community-wide concentrations.
• An additional 53 monitoring sites will be required to assess community-wide levels in
urban areas.
• Some NO2 monitors already in operation may meet the community-wide monitor
siting requirements.
For community wide monitoring, The Birmingham-Hoover is the only CBSA in Alabama with a
population greater than 1 million, so there will need to be one NO2 monitor located there. JDCH
added community wide NO2 sampling to the NCore site at North Birmingham (AQS ID 01-073-
0023) which began operation January 1, 2014.

2015AmbientAirPlan.docx 7/23/2015
Page 19 of 68
Sulfur Dioxide (SO2) Network
On June 2, 2010, EPA strengthened the primary National Ambient Air Quality Standard
(NAAQS) for sulfur dioxide (SO2). EPA is revising the primary SO2 standard by establishing a
new 1-hour standard at a level of 75 parts per billion (ppb).
According to EPA, for a short-term 1-hour SO2 standard, it is more technically appropriate,
efficient, and effective to use modeling as the principal means of assessing compliance for
medium to larger sources, and to rely more on monitoring for groups of smaller sources and
sources not as conducive to modeling. Such an approach is consistent with EPA’s historical
approach and longstanding guidance for SO2. EPA is setting specific minimum requirements that
inform states on where they are required to place SO2 monitors. The final monitoring regulations
require monitors to be placed in Core Based Statistical Areas (CBSAs) based on a Population
Weighted Emissions Index (PWEI) for the area. The final rule requires:
· 3 monitors in CBSAs with index values of 1,000,000 or more;
· 2 monitors in CBSAs with index values less than 1,000,000 but greater than 100,000; and
· 1 monitor in CBSAs with index values greater than 5,000.
Based on this the Birmingham-Hoover CBSA requires 2 SO2 monitors. JDCH has two sites at
North Birmingham (AQS ID 01-073-0023) and Fairfield (AQS ID 01-073-1003) with SO2
monitoring that fulfills the monitoring requirement.
The Huntsville CBSA has a PWEI less than 5,000 so no SO2 monitor is required.
Based on the latest PWEI 1 SO2 monitor is required in the Mobile, MSA. ADEM operates an
SO2 monitor at the Chickasaw site (AQS ID 01-097-0003) for the Mobile CBSA. This site
became operational on January 1st, 2013.

2015AmbientAirPlan.docx 7/23/2015
Page 20 of 68
Table 5 - CBSA’s PWEI and number of monitors required
Population Weighted Emissions Index (PWEI) Calcuations
May 2015 - Using 2014 Census Estimates & 2011 NEI
CBSA Name 2011 NEI so2 (tpy)
Population (2014)
PWEI in Million
persons-tpy
Required Monitors
Birmingham-Hoover, AL 119,145 1,263,739 150,568 2
Mobile, AL 20,673 415,123 8,582 1
Florence-Muscle Shoals, AL 19,441 147,639 2,870 0
Montgomery, AL 5,724 373,141 2,136 0
Columbus, GA-AL 3,787 314,005 1,189 0
Huntsville, AL 2,671 441,086 1,178 0
Decatur, AL 6,175 153,084 945 0
Tuscaloosa, AL 2,425 237,761 577 0
Talladega-Sylacauga, AL 6,154 92,208 567 0
Gadsden, AL 4,391 103,531 455 0
Scottsboro, AL 6,927 52,665 365 0
Troy, AL 8,211 33,389 274 0
Daphne-Fairhope-Foley, AL 627 200,111 125 0
Dothan, AL 777 148,095 115 0
Auburn-Opelika, AL 743 154,255 115 0
Anniston-Oxford, AL 848 115,916 98 0
Albertville, AL 1,015 94,636 96 0
Cullman, AL 590 81,289 48 0
Selma, AL 1,138 41,711 47 0
Enterprise-Ozark, AL 392 50,909 20 0
Ozark 168 49,484 8 0

2015AmbientAirPlan.docx 7/23/2015
Page 21 of 68
PM10 Network
PM10 has been a criteria pollutant since 1987. Since that time there has been widespread
monitoring of the PM10 levels in Alabama. In 2006 the US EPA modified the NAAQS for PM10
to revoke the annual standard. Currently, there is still a daily standard of 150 ug/m3 based on 3
years of data. All monitors in the state have recorded PM10 levels that meet the NAAQS. Table 7
shows the minimum monitoring requirements.
Table 6 - APPENDIX D TO PART 58. PM10 MINIMUM MONITORING REQUIREMENTS
TABLE D–4 OF APPENDIX D TO PART 58. PM10 MINIMUM MONITORING REQUIREMENTS
(NUMBER OF STATIONS PER MSA)1
Population category High concentration2 Medium concentration
3 Low concentration
4,5
>1,000,000 6–10 4–8 2–4 500,000–1,000,000 4–8 2–4 1–2 250,000–500,000 3–4 1–2 0–1 100,000–250,000 1–2 0–1 0
1 Selection of urban areas and actual numbers of stations per area within the ranges shown in this table will be jointly determined by EPA and the State Agency. 2 High concentration areas are those for which ambient PM10 data show ambient concentrations exceeding the PM10 NAAQS by 20 percent or more. 3 Medium concentration areas are those for which ambient PM10 data show ambient concentrations exceeding 80 percent of the PM10 NAAQS. 4 Low concentration areas are those for which ambient PM10 data show ambient concentrations less than 80 percent of the PM10 NAAQS. 5 These minimum monitoring requirements apply in the absence of a design value.
The Birmingham-Hoover MSA’s PM10 concentrations are greater than 80 percent of the PM10
National Ambient Air Quality Standards (NAAQS) but less than the level of the NAAQS. This
puts the Birminham MSA in the medium category. According to table 7 above, MSAs with
populations greater than 1,000,000 and medium concentrations, are required to operate between
4 and 8 sites. Based on the concentration of the MSA’s population and emissions being in
Jefferson County, and historical PM10 monitoring in Walker, Shelby, and Chilton Counties
indicating levels in the low concentration range, these required sites are located in Jefferson
County and operated by the JCDH. Currently JCDH operates low-volume PM10 monitors at four
sites located in the main industrial valley. The North Birmingham/NCore site operates on a 1 in 3
day schedule. Two sites, North Birmingham, and Wylam are collocated on the six day schedule.
Four of the PM10 sites, North Birmingham, Wylam, Sloss and Tarrant Elementary School, have
continuous PM10 monitors for quality assurance purposes. The collocated pair of PQ200s at the
NCore site will continue to be operated at local conditions for lead monitoring.
All other monitors in Alabama have indicated the PM10 levels to be in the low concentration
range. For MSAs less than 250,000 population zero PM10 monitors are required. Huntsville,
Mobile and Montgomery MSAs have populations between 250,000 and 500,000 and are required
to have 0 to 1 monitors. The Mobile MSA had 1 site at WKRG (01-097-0016) with two
monitors, one of them being the collocated monitor. Due to problems with the infrastructure at
the WKRG site and the expense of required to maintain the site, ADEM closed this site as of
December 29, 2014 as described in the 2014 Annual Network Plan.
2015AmbientAirPlan.docx 7/23/2015
Page 22 of 68
The Montgomery MSA has 1 site at MOMS (01-101-1002) with two monitors, one of them
being the collocated monitor.
The Huntsville MSA also falls in this size range and the City of Huntsville currently operates
four PM10 monitors and 1 collocated monitor at Huntsville Old Airport (AQS ID 01-089-0014).
The Columbus GA/AL MSA has a population of 310,531 and historically has had low PM10
concentration; the PM10 monitor operated by the State of Georgia was closed 12/31/2012.
2015AmbientAirPlan.docx 7/23/2015
Page 23 of 68
Ozone Network
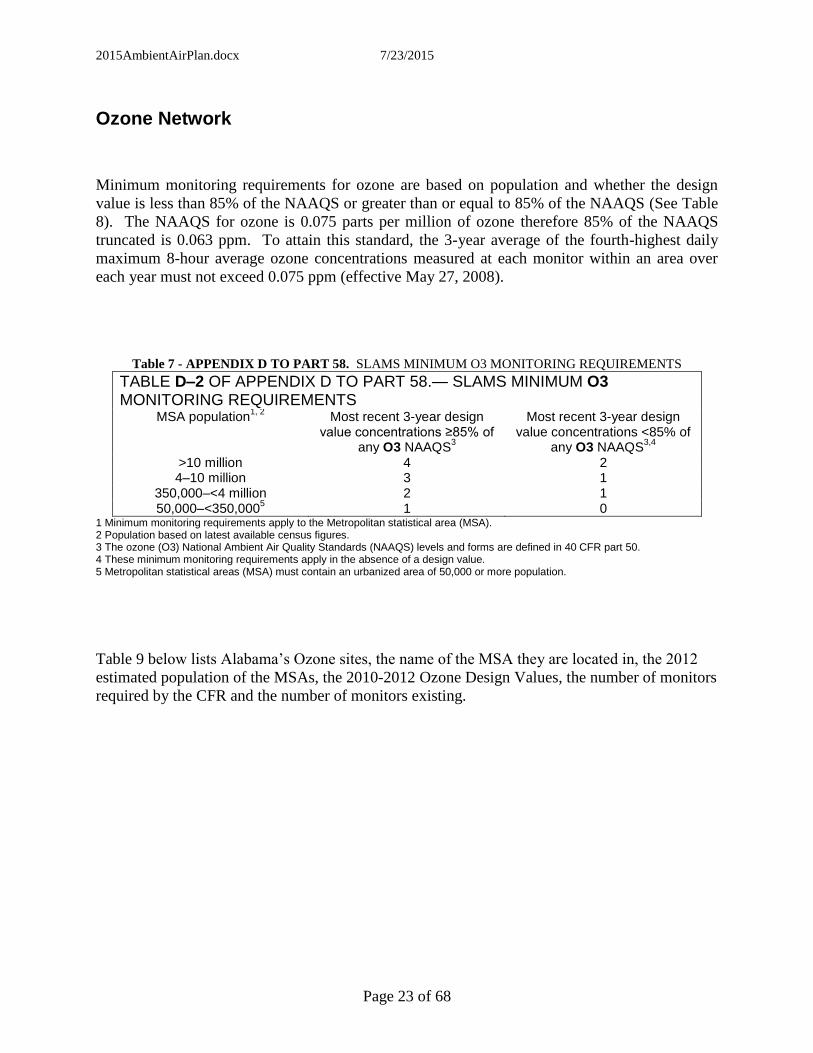
Minimum monitoring requirements for ozone are based on population and whether the design
value is less than 85% of the NAAQS or greater than or equal to 85% of the NAAQS (See Table
8). The NAAQS for ozone is 0.075 parts per million of ozone therefore 85% of the NAAQS
truncated is 0.063 ppm. To attain this standard, the 3-year average of the fourth-highest daily
maximum 8-hour average ozone concentrations measured at each monitor within an area over
each year must not exceed 0.075 ppm (effective May 27, 2008).
Table 7 - APPENDIX D TO PART 58. SLAMS MINIMUM O3 MONITORING REQUIREMENTS
TABLE D–2 OF APPENDIX D TO PART 58.— SLAMS MINIMUM O3 MONITORING REQUIREMENTS
MSA population1, 2
Most recent 3-year design value concentrations ≥85% of
any O3 NAAQS3
Most recent 3-year design value concentrations <85% of
any O3 NAAQS3,4
>10 million 4 2 4–10 million 3 1
350,000–<4 million 2 1 50,000–<350,000
5 1 0
1 Minimum monitoring requirements apply to the Metropolitan statistical area (MSA). 2 Population based on latest available census figures. 3 The ozone (O3) National Ambient Air Quality Standards (NAAQS) levels and forms are defined in 40 CFR part 50. 4 These minimum monitoring requirements apply in the absence of a design value. 5 Metropolitan statistical areas (MSA) must contain an urbanized area of 50,000 or more population.
Table 9 below lists Alabama’s Ozone sites, the name of the MSA they are located in, the 2012
estimated population of the MSAs, the 2010-2012 Ozone Design Values, the number of monitors
required by the CFR and the number of monitors existing.

2015AmbientAirPlan.docx 7/23/2015
Page 24 of 68
Table 8- Alabama MSAs with Ozone Monitoring Sites and current Design Value
Site Name AQS ID 2012-2014
Design Values MSA Est. 2014
Pop.
MSA Max DV
# of sites required per CFR
Current # of sites
North Birmingham 01-073-0023 0.067
Birmingham-Hover 1,263,739 0.070 2 8
Fairfield 01-073-1003 0.068
McAdory School 01-073-1005 0.068
Leeds Elem. School 01-073-1010 0.069
Hoover 01-073-2006 0.067
Corner High School 01-073-5003 0.065
Tarrant Elem. School 01-073-6002 0.070
Helena 01-117-0004 0.068
Phenix City - Ladonia 01-113-0002 0.062 Columbus, GA- Phenix City, AL
314,005 0.062 1 2* Columbus, GA, Airport 13-215-0008 0.062
Decatur 01-103-0011 0.065 Decatur 153,084 0.065 1 1
Dothan 01-069-0004 0.061 Dothan 148,095 0.061 1 1
Fairhope 01-003-0010 0.066 Daphne-Fairhope 200,111 0.066 1 1
Muscle Shoals 01-033-1002 0.063 Florence 147,639 0.063 1 1
Southside 01-055-0011 0.060 Gadsden 103,531 0.06 0 1
Huntsville Old Airport 01-089-0014 0.068 Huntsville 441,086 0.068 2 2
Huntsville Capshaw RD 01-089-0022 0.065
Mobile - Chickasaw 01-097-0003 0.065 Mobile 415,123 0.067 2 2
Mobile - Bay Road 01-097-2005 0.067
DBT 01-051-0001 0.062 Montgomery 373,141 0.063 2 2
Montgomery - MOMS 01-101-1002 0.063
Duncanville, Tuscaloosa 01-125-0010 0.058 Tuscaloosa 237,761 0.058 0 1
Sumter Co. (Background)** 01-119-0003 0.058 not in MSA NA 1
Sand Mtn. *** 01-049-9991 0.065 not in MSA NA
No monitor Anniston-Oxford 115,916 NA 0
No monitor Auburn-Opelika 154,255 NA 0
*1 in AL and 1 in GA DV ≥ 85% of the NAAQS ** Only 1 year of data (2013)
*** CASTNET site operated by EPA contractor.

2015AmbientAirPlan.docx 7/23/2015
Page 25 of 68
Ozone Monitoring requirements for Alabama MSAs
Birmingham-Hoover MSA
The Birmingham-Hoover MSA’s population is between 350,000 and 4,000,000 and the design
value is greater than 85% of the NAAQS. Two Ozone monitors are required for this MSA. There
are currently 8 Ozone sites in this MSA. One site is located in Shelby County and is operated by
ADEM. Seven sites, operated by the JCDH, are located in Jefferson County. Additional
information about these monitors is found in the JCDH Network description. No changes are
planned for this MSA.
Columbus, GA/AL MSA
The Columbus GA/AL MSA’s population is between 50,000 and 350,000 and the design value is
less than 85% of the NAAQS. No ozone monitor is required for this MSA. There is currently 1
site maintained by ADEM, west of Phenix City in Russell County and 1 site is located in Georgia
and operated by the State of Georgia. No changes are planned for this MSA.
Decatur MSA
The Decatur MSA’s population is between 50,000 and 350,000 and the design value is greater
than 85% of the NAAQS. One Ozone monitor is required for this MSA. There is currently one
site, and it will be retained.
Dothan MSA
The Dothan MSA’s population is between 50,000 and 350,000 and the design value is less than
85% of the NAAQS. No ozone monitor is required for this MSA. There is currently one site, and
it will be retained.
Daphne-Fairhope-Foley MSA
The population of the Daphne-Fairhope-Foley MSA is between 50,000 and 350,000 and the
design value is greater than 85% of the NAAQS. One Ozone monitor is required for this MSA.
There is currently one site, and it will be retained.
Florence-Muscle Shoals MSA
The Florence-Muscle Shoals MSA’s population is between 50,000 and 350,000 and the design
value is greater than 85% of the NAAQS. One Ozone monitor is required for this MSA. There is
currently one Ozone site in this MSA, and it will be retained.
Gadsden MSA
The Gadsden MSA’s population is between 50,000 and 350,000 and the design value is less than
85% of the NAAQS therefore no monitor is required for that area. There is currently one Ozone
monitor in this MSA, and it will be retained.
Huntsville MSA
The Huntsville MSA’s population is between 350,000 and 4,000,000 and the design value is
greater than 85% of the NAAQS. Two Ozone monitors are required for this MSA. There are
currently 2 Ozone sites operated by the City of Huntsville (HDNREM), and these will be
retained.

2015AmbientAirPlan.docx 7/23/2015
Page 26 of 68
Mobile MSA
The Mobile MSA’s population is between 350,000 and 4,000,000 and the design value is greater
than 85% of the NAAQS. Two Ozone monitors are required for this MSA. There are currently 2
Ozone sites, and these will be retained.
Montgomery MSA
The Montgomery MSA’s population is between 350,000 and 4,000,000 and the design value is
greater than 85% of the NAAQS. Two Ozone monitors are required for this MSA. There are
currently 2 Ozone sites, and these will be retained.
Tuscaloosa MSA
The Tuscaloosa MSA’s population is between 50,000 and 350,000 and the design value is less
than 85% of the NAAQS. Therefore no monitor is required for that area. There is currently one
Ozone monitor in this MSA, and it will be retained.
Auburn-Opelika and Anniston-Oxford MSAs
The MSAs of Auburn-Opelika and Anniston-Oxford were evaluated by ADEM. Both MSAs
have populations less than 150,000. It was determined that due to the close proximity of the
ozone monitors in the neighboring MSAs, additional monitors would not be needed. The
monitors in the adjacent MSAs provide adequate monitoring coverage. Since these areas do not
have design values, no Ozone monitors are required by Appendix D of 40 CFR 58.
Sites not located in an MSA
Sumter County represents rural, background ozone values for the state. After loss of the lease for
this site, ADEM relocated the site and re-started monitoring on 3/01/2013. The historical design
values for this monitor have been less than 85% of the NAAQS. The new AQS ID is 01-119-
0003 with the local site name of “Ward, Sumter Co.”
There is an Ozone monitor located at the CASNET site near Crossville in DeKalb county and it
is maintained by EPA. It is Sand Mountain (AQS ID 01-049-9991). The design value for this
site is greater than 85% of the NAAQS.
2015AmbientAirPlan.docx 7/23/2015
Page 27 of 68
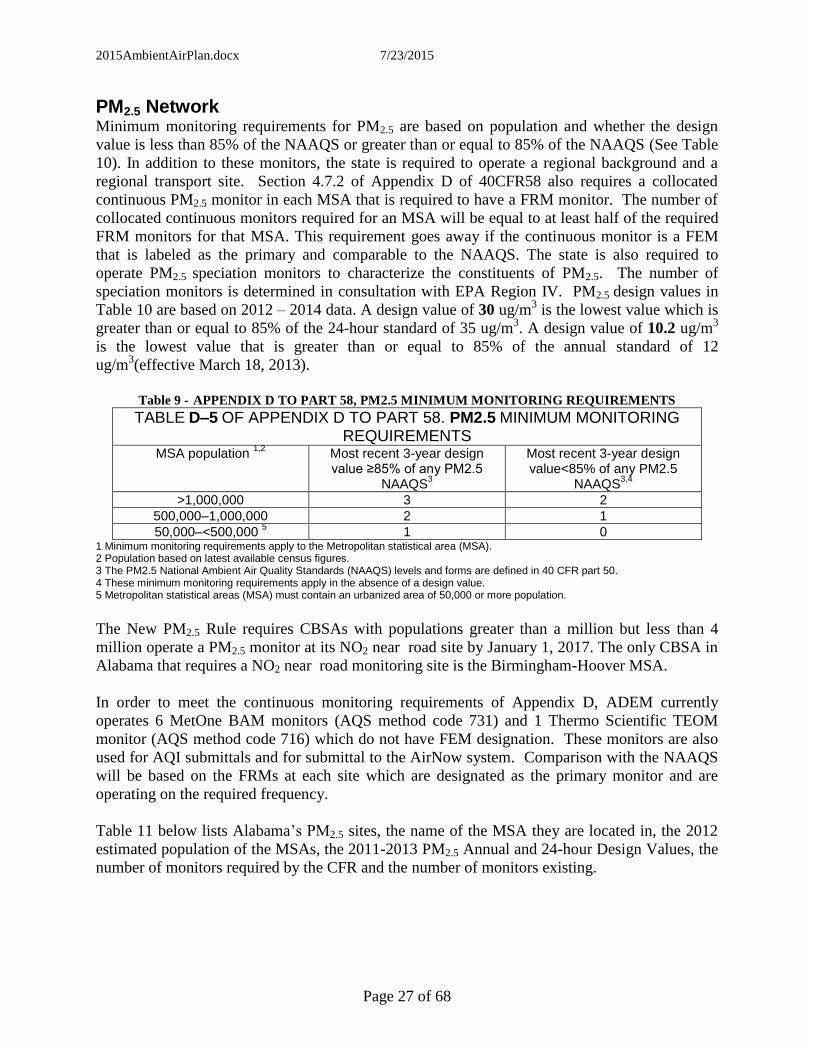
PM2.5 Network Minimum monitoring requirements for PM2.5 are based on population and whether the design
value is less than 85% of the NAAQS or greater than or equal to 85% of the NAAQS (See Table
10). In addition to these monitors, the state is required to operate a regional background and a
regional transport site. Section 4.7.2 of Appendix D of 40CFR58 also requires a collocated
continuous PM2.5 monitor in each MSA that is required to have a FRM monitor. The number of
collocated continuous monitors required for an MSA will be equal to at least half of the required
FRM monitors for that MSA. This requirement goes away if the continuous monitor is a FEM
that is labeled as the primary and comparable to the NAAQS. The state is also required to
operate PM2.5 speciation monitors to characterize the constituents of PM2.5. The number of
speciation monitors is determined in consultation with EPA Region IV. PM2.5 design values in
Table 10 are based on 2012 – 2014 data. A design value of 30 ug/m3 is the lowest value which is
greater than or equal to 85% of the 24-hour standard of 35 ug/m3. A design value of 10.2 ug/m
3
is the lowest value that is greater than or equal to 85% of the annual standard of 12
ug/m3(effective March 18, 2013).
Table 9 - APPENDIX D TO PART 58, PM2.5 MINIMUM MONITORING REQUIREMENTS
TABLE D–5 OF APPENDIX D TO PART 58. PM2.5 MINIMUM MONITORING REQUIREMENTS
MSA population 1,2
Most recent 3-year design value ≥85% of any PM2.5
NAAQS3
Most recent 3-year design value<85% of any PM2.5
NAAQS3,4
>1,000,000 3 2
500,000–1,000,000 2 1
50,000–<500,000 5 1 0
1 Minimum monitoring requirements apply to the Metropolitan statistical area (MSA). 2 Population based on latest available census figures. 3 The PM2.5 National Ambient Air Quality Standards (NAAQS) levels and forms are defined in 40 CFR part 50. 4 These minimum monitoring requirements apply in the absence of a design value. 5 Metropolitan statistical areas (MSA) must contain an urbanized area of 50,000 or more population.
The New PM2.5 Rule requires CBSAs with populations greater than a million but less than 4
million operate a PM2.5 monitor at its NO2 near road site by January 1, 2017. The only CBSA in
Alabama that requires a NO2 near road monitoring site is the Birmingham-Hoover MSA.
In order to meet the continuous monitoring requirements of Appendix D, ADEM currently
operates 6 MetOne BAM monitors (AQS method code 731) and 1 Thermo Scientific TEOM
monitor (AQS method code 716) which do not have FEM designation. These monitors are also
used for AQI submittals and for submittal to the AirNow system. Comparison with the NAAQS
will be based on the FRMs at each site which are designated as the primary monitor and are
operating on the required frequency.
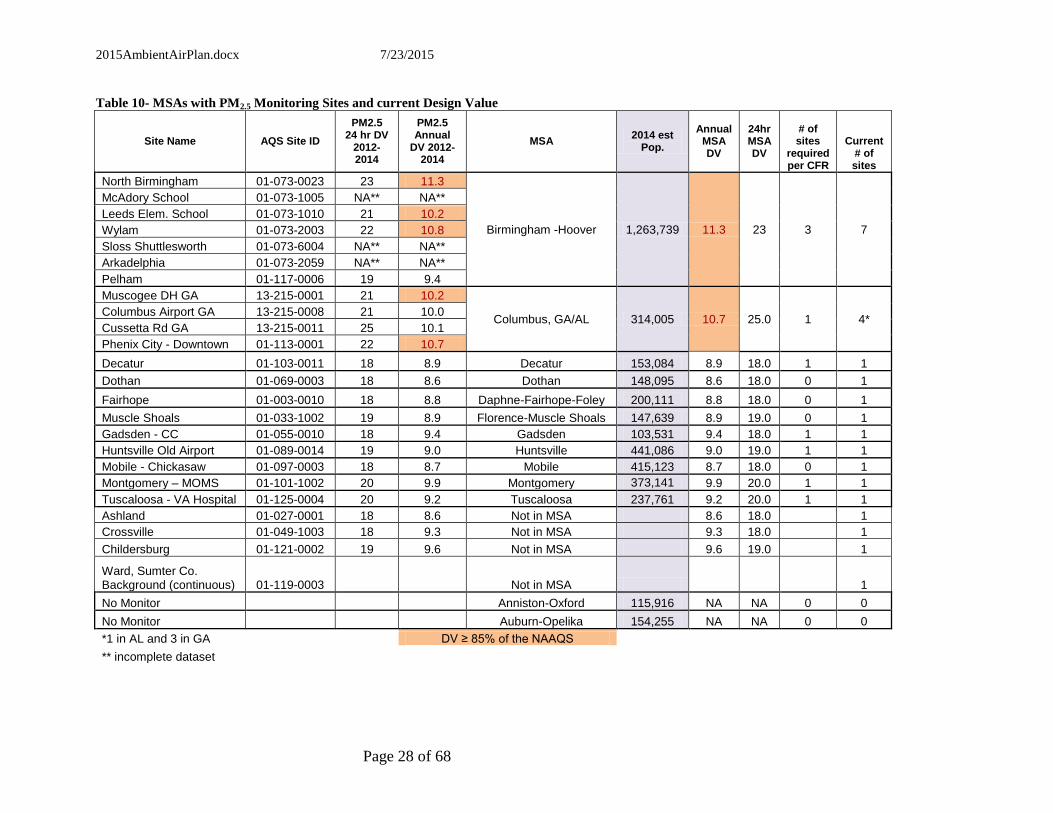
Table 11 below lists Alabama’s PM2.5 sites, the name of the MSA they are located in, the 2012
estimated population of the MSAs, the 2011-2013 PM2.5 Annual and 24-hour Design Values, the
number of monitors required by the CFR and the number of monitors existing.
2015AmbientAirPlan.docx 7/23/2015
Page 28 of 68
Table 10- MSAs with PM2.5 Monitoring Sites and current Design Value
Site Name AQS Site ID
PM2.5 24 hr DV
2012-2014
PM2.5 Annual
DV 2012-2014
MSA 2014 est
Pop.
Annual MSA DV
24hr MSA DV
# of sites
required per CFR
Current # of sites
North Birmingham 01-073-0023 23 11.3
Birmingham -Hoover 1,263,739 11.3 23 3 7
McAdory School 01-073-1005 NA** NA**
Leeds Elem. School 01-073-1010 21 10.2
Wylam 01-073-2003 22 10.8
Sloss Shuttlesworth 01-073-6004 NA** NA**
Arkadelphia 01-073-2059 NA** NA**
Pelham 01-117-0006 19 9.4
Muscogee DH GA 13-215-0001 21 10.2
Columbus, GA/AL 314,005 10.7 25.0 1 4* Columbus Airport GA 13-215-0008 21 10.0
Cussetta Rd GA 13-215-0011 25 10.1
Phenix City - Downtown 01-113-0001 22 10.7
Decatur 01-103-0011 18 8.9 Decatur 153,084 8.9 18.0 1 1
Dothan 01-069-0003 18 8.6 Dothan 148,095 8.6 18.0 0 1
Fairhope 01-003-0010 18 8.8 Daphne-Fairhope-Foley 200,111 8.8 18.0 0 1
Muscle Shoals 01-033-1002 19 8.9 Florence-Muscle Shoals 147,639 8.9 19.0 0 1
Gadsden - CC 01-055-0010 18 9.4 Gadsden 103,531 9.4 18.0 1 1
Huntsville Old Airport 01-089-0014 19 9.0 Huntsville 441,086 9.0 19.0 1 1
Mobile - Chickasaw 01-097-0003 18 8.7 Mobile 415,123 8.7 18.0 0 1
Montgomery – MOMS 01-101-1002 20 9.9 Montgomery 373,141 9.9 20.0 1 1
Tuscaloosa - VA Hospital 01-125-0004 20 9.2 Tuscaloosa 237,761 9.2 20.0 1 1
Ashland 01-027-0001 18 8.6 Not in MSA 8.6 18.0 1
Crossville 01-049-1003 18 9.3 Not in MSA 9.3 18.0 1
Childersburg 01-121-0002 19 9.6 Not in MSA 9.6 19.0 1
Ward, Sumter Co. Background (continuous) 01-119-0003 Not in MSA 1
No Monitor Anniston-Oxford 115,916 NA NA 0 0
No Monitor Auburn-Opelika 154,255 NA NA 0 0
*1 in AL and 3 in GA
DV ≥ 85% of the NAAQS
** incomplete dataset
2015AmbientAirPlan.docx 7/23/2015
Page 29 of 68
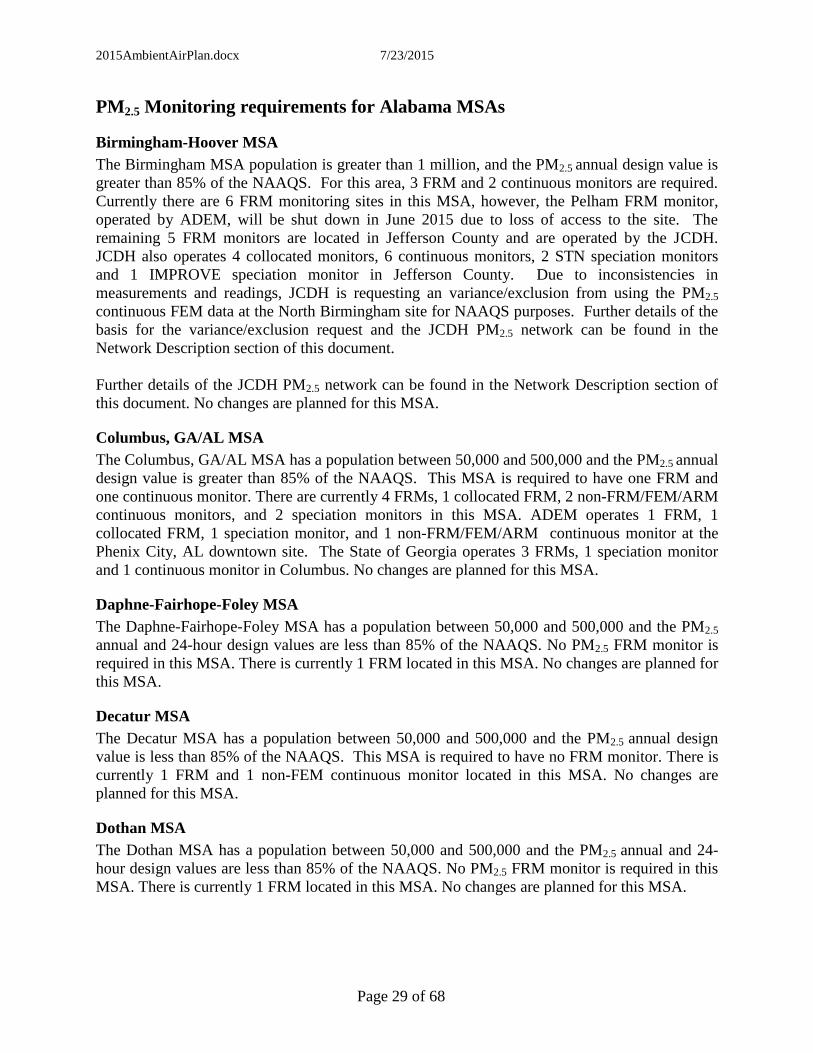
PM2.5 Monitoring requirements for Alabama MSAs
Birmingham-Hoover MSA
The Birmingham MSA population is greater than 1 million, and the PM2.5 annual design value is
greater than 85% of the NAAQS. For this area, 3 FRM and 2 continuous monitors are required.
Currently there are 6 FRM monitoring sites in this MSA, however, the Pelham FRM monitor,
operated by ADEM, will be shut down in June 2015 due to loss of access to the site. The
remaining 5 FRM monitors are located in Jefferson County and are operated by the JCDH.
JCDH also operates 4 collocated monitors, 6 continuous monitors, 2 STN speciation monitors
and 1 IMPROVE speciation monitor in Jefferson County. Due to inconsistencies in
measurements and readings, JCDH is requesting an variance/exclusion from using the PM2.5
continuous FEM data at the North Birmingham site for NAAQS purposes. Further details of the
basis for the variance/exclusion request and the JCDH PM2.5 network can be found in the
Network Description section of this document.
Further details of the JCDH PM2.5 network can be found in the Network Description section of
this document. No changes are planned for this MSA.
Columbus, GA/AL MSA
The Columbus, GA/AL MSA has a population between 50,000 and 500,000 and the PM2.5 annual
design value is greater than 85% of the NAAQS. This MSA is required to have one FRM and
one continuous monitor. There are currently 4 FRMs, 1 collocated FRM, 2 non-FRM/FEM/ARM
continuous monitors, and 2 speciation monitors in this MSA. ADEM operates 1 FRM, 1
collocated FRM, 1 speciation monitor, and 1 non-FRM/FEM/ARM continuous monitor at the
Phenix City, AL downtown site. The State of Georgia operates 3 FRMs, 1 speciation monitor
and 1 continuous monitor in Columbus. No changes are planned for this MSA.
Daphne-Fairhope-Foley MSA
The Daphne-Fairhope-Foley MSA has a population between 50,000 and 500,000 and the PM2.5
annual and 24-hour design values are less than 85% of the NAAQS. No PM2.5 FRM monitor is
required in this MSA. There is currently 1 FRM located in this MSA. No changes are planned for
this MSA.
Decatur MSA
The Decatur MSA has a population between 50,000 and 500,000 and the PM2.5 annual design
value is less than 85% of the NAAQS. This MSA is required to have no FRM monitor. There is
currently 1 FRM and 1 non-FEM continuous monitor located in this MSA. No changes are
planned for this MSA.
Dothan MSA
The Dothan MSA has a population between 50,000 and 500,000 and the PM2.5 annual and 24-
hour design values are less than 85% of the NAAQS. No PM2.5 FRM monitor is required in this
MSA. There is currently 1 FRM located in this MSA. No changes are planned for this MSA.

2015AmbientAirPlan.docx 7/23/2015
Page 30 of 68
Florence-Muscle Shoals MSA
The Florence-Muscle Shoals MSA has a population between 50,000 and 500,000 and the PM2.5
annual and 24-hour design values are less than 85% of the NAAQS. No PM2.5 FRM monitor is
required in this MSA. There is currently 1 FRM located in this MSA. No changes are planned for
this MSA.
Gadsden MSA
The Gadsden MSA has a population between 50,000 and 500,000 and the PM2.5 annual design
value is less than 85% of the NAAQS. This MSA is not required to have an FRM. There is
currently 1 FRM located in this MSA and 1 non-FEM continuous monitor at this site.
Huntsville MSA
The Huntsville MSA has a population between 50,000 and 500,000 and the PM2.5 annual design
value less than 85 % of the NAAQS. This MSAs is not required to have an FRM or continuous
monitor. Currently there is one FRM, one collocated FRM monitor, one speciation monitor and
one non-FRM/FEM/ARM continuous monitor located in this MSA operated by the City of
Huntsville (HDNREM). No changes are planned for this MSA.
Mobile MSA
The Mobile MSA has a population between 50,000 and 500,000 and the PM2.5 annual and 24-
hour design values are less than 85% of the NAAQS. No PM2.5 FRM monitor is required in this
MSA. There is currently 1 FRM, and 1 non-FEM continuous monitor located in this MSA. No
changes are planned for this MSA.
Montgomery MSA
The Montgomery MSA is between 50,000 and 500,000 and the PM2.5 annual design value is less
than 85 % of the NAAQS. No PM2.5 FRM monitor is required in this MSA. There is currently 1
FRM, 1 collocated FRM, 1 non-FEM continuous monitor located in this MSA.
Tuscaloosa MSA
The Tuscaloosa MSA has a population between 50,000 and 500,000 and the PM2.5 annual design
value is less than 85% of the NAAQS. This MSAs is not required to an FRM or continuous
monitor. There is currently 1 FRM located in this MSA and 1 non-FEM continuous monitor.
Auburn-Opelika and Anniston-Oxford MSAs
In 1999 when the PM2.5 monitoring program was implemented in Alabama, the MSAs of
Auburn-Opelika and Anniston-Oxford were evaluated to determine the need for monitors. Both
MSAs have populations less than 150,000. It was determined that due to the close proximity of
monitors in the neighboring MSAs with monitors, additional monitors would not be needed. The
monitors in the adjacent MSAs continue to provide adequate monitoring coverage. Since these
areas do not have design values, no FRM monitors are required by Appendix D of 40 CFR 58.

2015AmbientAirPlan.docx 7/23/2015
Page 31 of 68
Monitors not located in MSAs
Sumter County represents rural, background PM2.5 values for the west part of the state. ADEM
operated a FRM in Sumter County but closed it in 2006. A non-FEM continuous monitor is
being operated in Sumter County. ADEM intends to maintain this site.
The Micropolitan Statistical Area of Talladega-Sylacauga has a population of 92,728. It is
adjacent to the Anniston-Oxford and the Birmingham-Hoover MSAs. There is currently 1 FRM
located in Talladega County in Childersburg. The design value for this monitor is greater than
85% of the NAAQS. ADEM intends to maintain this site.
There is an FRM located near Ashland in Clay County to serve as a regional transport site in
between the large MSAs of Birmingham and Atlanta. The PM2.5 annual and 24-hour design
values are less than 85% of the NAAQS for this monitor. ADEM intends to maintain this site.
The Crossville site in De Kalb County is a rural background site in northeast Alabama. The
PM2.5 annual is less than 85% of the NAAQS. ADEM intends to maintain this site.

2015AmbientAirPlan.docx 7/23/2015
Page 32 of 68
Quality Assurance
Each of the three monitoring agencies have US EPA approved Quality Assurance Program Plans
that detail the activities used to control and document the quality of the data collected. Part of
the EPA required quality control program for particulate monitors is the use of collocated
particulate monitors. 40 CFR 58, appendix A requires a percentage of manual particulate
monitors to be collocated with FRM monitors so that quality statistics can be calculated.
Each agency network includes monitors for this purpose.
Monitoring Equipment Evaluation
An evaluation of the condition of ambient monitors and auxiliary equipment was performed by
each of the three monitoring agencies. The equipment was categorized as “good” or “poor”. As
resources allow equipment in “poor” condition will be replaced.

2015AmbientAirPlan.docx 7/23/2015
Page 33 of 68
NETWORK DESCRIPTIONS
A description of the ambient air monitoring networks for each air pollution agency will be
presented in this section.
Included will be:
AQS ID
Address
Latitude and Longitude
Scale
Type
Monitoring Objective
Beginning Sampling Date and Ending Sampling Date
Method
Operating Schedule
Is it comparible to the NAAQS?

2015AmbientAirPlan.docx 7/23/2015
Page 34 of 68
ADEM AIR MONITORING NETWORK DESCRIPTION
Abbreviations
Scale
N Neighborhood (0.5 – 4 Kilometers)
U Urban (overall citywide conditions, 4 -50 kilometers
R Regional (usually rural, with homogenous geography, tens to
hundreds of kilometers)
M Middle Scale
Type
CAS CASNET operated by EPA
S SLAMS
QA QA Collocated Monitor
SPM Special Purpose Monitor
Operating Schedule
C Continuous monitor
D Daily 24-hour samples
3 1 24-hour sample every 3 days (on national schedule)
6 1 24-hour sample every 6 days (on national schedule)
Methods
H Hi-volume SSI sampler
L Low Volume SSI
T TEOM continuous monitor
B BAM continuous monitor
U UV photometric ozone analyzer
P Pulsed Fluorescent
S Hi-Volume Total Suspended Particulate monitor
G Lead Analysis by FAAS
NAAQS1
Y,N Data suitable for comparison to NAAQS
1 Collocated monitors must be operated in the same manner as the federal reference method but 1 monitor at the site is designated as the main monitor for comparison to
the NAAQS.

2015AmbientAirPlan.docx 7/23/2015
Page 35 of 68
PM10
Site
common
name County AQS Site ID Address Latitude Longitude
S
C
A
L
E
T
Y
P
E
Monitoring
objective / CBSA
Date
Began
Date
Ended
M
E
T
H
O
D
S
C
H
E
D
U
L
E
N
A
A
Q
S Comment
Mobile –
WKRG MainMobile 01-097-0016
WKRG transmitting Stn,
Telegraph Rd. 30.72028 -88.05889
N S Population Exposure /
Mobile, AL1/1/1982 12/29/2014
H 6 Y
Mobile –
WKRG Mobile 01-097-0016
WKRG transmitting Stn,
Telegraph Rd.30.72028 -88.05889
N Q
A
Population Exposure/
Mobile, AL1/1/1982 12/29/2014
H 6 Ycollocated
Montgomery -
MOMSMontgomery 01-101-1002
1350 Coliseum Blvd,
Montgomery, AL32.412782 -86.263356
N S Population Exposure/
Montgomery, AL6/1/1993 active
H 6 Y
Montgomery -
MOMSMontgomery 01-101-1002
1350 Coliseum Blvd,
Montgomery, AL32.412782 -86.263356
N Q
A
Population Exposure/
Montgomery, AL1/1/2013 active
H 6 Ycollocated
Lead
Site
common
name County AQS Site ID Address Latitude Longitude
S
C
A
L
E
T
Y
P
E
Monitoring
objective / CBSA
Date
Began
Date
Ended
M
E
T
H
O
D
S
C
H
E
D
U
L
E
N
A
A
Q
S Comment
Troy Pike 01-109-0003Henderson Road, Troy,
AL31.790560 -85.979170 N
S
Highest Concentration
/ Troy,AL
1/1/2009 active
S
,
G
6 Y
Troy Pike 01-109-0003Henderson Road, Troy,
AL31.790560 -85.979170 N
Q
A Highest Concentration
/ Troy,AL
1/1/2009 active
S
,
G
6 Y collocated
2015AmbientAirPlan.docx 7/23/2015
Page 36 of 68
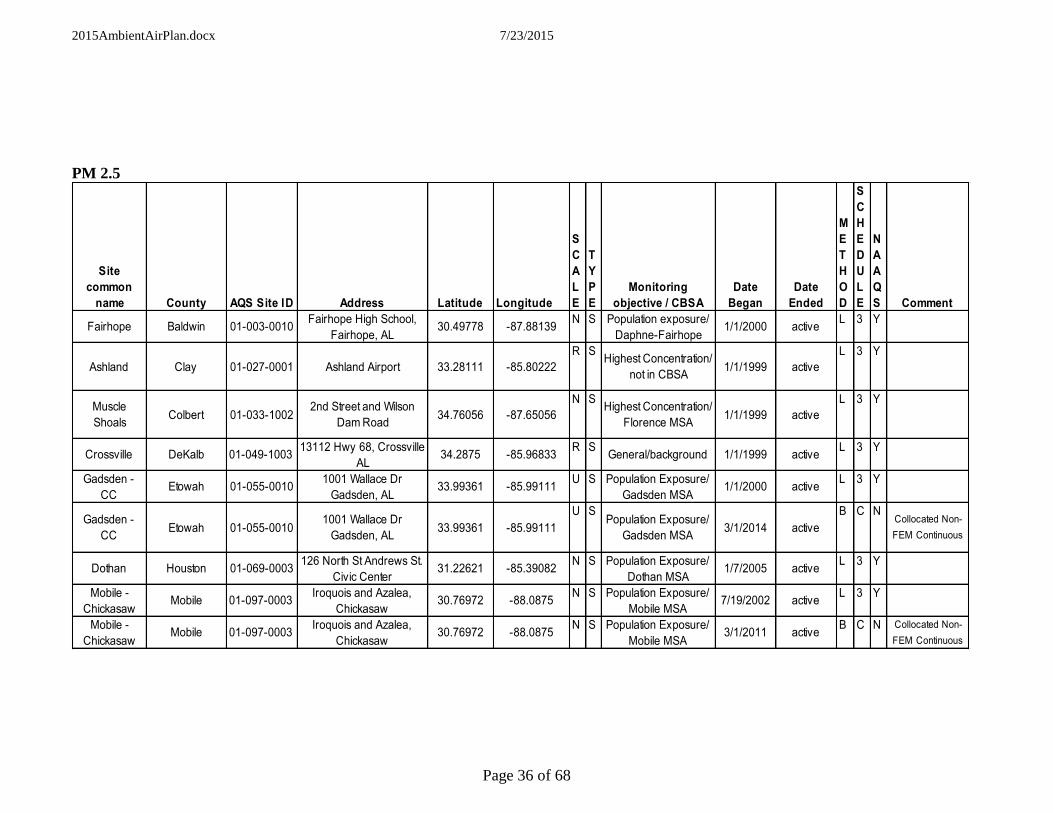
PM 2.5
Site
common
name County AQS Site ID Address Latitude Longitude
S
C
A
L
E
T
Y
P
E
Monitoring
objective / CBSA
Date
Began
Date
Ended
M
E
T
H
O
D
S
C
H
E
D
U
L
E
N
A
A
Q
S Comment
Fairhope Baldwin 01-003-0010Fairhope High School,
Fairhope, AL30.49778 -87.88139
N S Population exposure/
Daphne-Fairhope 1/1/2000 active
L 3 Y
Ashland Clay 01-027-0001 Ashland Airport 33.28111 -85.80222
R SHighest Concentration/
not in CBSA1/1/1999 active
L 3 Y
Muscle
ShoalsColbert 01-033-1002
2nd Street and Wilson
Dam Road34.76056 -87.65056
N SHighest Concentration/
Florence MSA1/1/1999 active
L 3 Y
Crossville DeKalb 01-049-100313112 Hwy 68, Crossville
AL34.2875 -85.96833
R SGeneral/background 1/1/1999 active
L 3 Y
Gadsden -
CCEtowah 01-055-0010
1001 Wallace Dr
Gadsden, AL33.99361 -85.99111
U S Population Exposure/
Gadsden MSA1/1/2000 active
L 3 Y
Gadsden -
CCEtowah 01-055-0010
1001 Wallace Dr
Gadsden, AL33.99361 -85.99111
U SPopulation Exposure/
Gadsden MSA3/1/2014 active
B C NCollocated Non-
FEM Continuous
Dothan Houston 01-069-0003126 North St Andrews St.
Civic Center31.22621 -85.39082
N S Population Exposure/
Dothan MSA1/7/2005 active
L 3 Y
Mobile -
ChickasawMobile 01-097-0003
Iroquois and Azalea,
Chickasaw 30.76972 -88.0875
N S Population Exposure/
Mobile MSA7/19/2002 active
L 3 Y
Mobile -
ChickasawMobile 01-097-0003
Iroquois and Azalea,
Chickasaw30.76972 -88.0875
N S Population Exposure/
Mobile MSA3/1/2011 active
B C N Collocated Non-
FEM Continuous

2015AmbientAirPlan.docx 7/23/2015
Page 37 of 68
PM 2.5 continued
Site common
name County AQS Site ID Address Latitude Longitude
S
C
A
L
E
T
Y
P
E
Monitoring objective /
CBSA Date Began Date Ended
M
E
T
H
O
D
S
C
H
E
D
U
L
E
N
A
A
Q
S Comment
Montgomery -
MOMSMontgomery 01-101-0002
1350 Coliseum Blv d,
Montgomery , AL32.412782 -86.263356
N S Population Ex posure/
Montgomery MSA1/16/2009 activ e
L 3 Y
Montgomery -
MOMSMontgomery 01-101-0002
1350 Coliseum Blv d,
Montgomery , AL32.412782 -86.263356
N Q
A
Population Ex posure/
Montgomery MSA1/16/2009 activ e
L 6 YCollocated
Montgomery -
MOMSMontgomery 01-101-0002
1350 Coliseum Blv d,
Montgomery , AL32.412782 -86.263356
N S Population Ex posure/
Montgomery MSA4/1/2009 activ e
B C N Collocated Non-
FEM Continuous
Decatur Morgan 01-103-0011 Wallace Ctr.Hw y 31, Decatur 34.51861 -86.97694M S Population Ex posure/
Decatur MSA8/7/2001 activ e
L 3 Y
Decatur Morgan 01-103-0011 Wallace Ctr.Hw y 31, Decatur 34.51861 -86.97694M S Population Ex posure/
Decatur MSA4/1/2009 activ e
B C N Collocated Non-
FEM Continuous
Phenix City -
Dow ntow nRussell 01-113-0001
St. Patrick’s Church, Phenix
City32.47639 -84.99917
N S Highest Concentration/
Columbus, GA-AL MSA1/1/1999 activ e
L 3 Y
Phenix City -
Dow ntow nRussell 01-113-0001
St. Patrick’s Church, Phenix
City32.47639 -84.99917
N Q
A
Highest Concentration/
Columbus, GA-AL MSA5/17/2004 activ e
L 3 Ycollocated
Phenix City -
Dow ntow nRussell 01-113-0001
St. Patrick’s Church, Phenix
City32.47639 -84.99917
N S Highest Concentration/
Columbus, GA-AL MSA1/25/2010 activ e
T C N Collocated Non-
FEM Continuous
Pelham Shebly 01-117-0006 Pelham High School 33.31278 -86.82111U S Highest Concentration/
Birmingham MSA1/1/1999 w ill close
L 3 Yend date 06/2015
Ward, Sumter
C0.Sumter 01-119-0003
NNE of Ward Post office,
Sumter Co., Alabama32.362706 -88.277954
R SBackground/General/
not in MSA3/1/2013 activ e
B C N Non-FEM
Continuous. For
Background.
Childersburg Talladega 01-121-0002300 1
st Street Southeast,
Childersburg, AL33.27944 -86.34944
N S Highest Concentration/
Talladega µSA1/1/1999 activ e
L 3 Y
VA, Tuscaloosa Tuscaloosa 01-125-0004 3701 Loop Road East 33.18903 -87.48421N S Population Ex posure/
Tuscaloosa MSA10/1/2002 activ e
L 3 Y
VA, Tuscaloosa Tuscaloosa 01-125-0004 3701 Loop Road East 33.18903 -87.48421N S Population Ex posure/
Tuscaloosa MSA3/1/2014 activ e
B 3 N Collocated Non-
FEM Continuous

2015AmbientAirPlan.docx 7/23/2015
Page 38 of 68
OZONE
Site common
name County AQS Site ID Address Latitude Longitude
S
C
A
L
E
T
Y
P
E
Monitoring objective /
CBSA Date Began Date Ended
M
E
T
H
O
D
S
C
H
E
D
U
L
E
N
A
A
Q
S Comment
Fairhope Baldw in 01-003-0010Fairhope High School,
Fairhope, AL30.49778 -87.88139
N S
P
M
Population Ex posure/
Mobile MSA3/1/2000 activ e
U C Y
Muscle Shoals Colbert 01-033-1002 Wilson Dam Rd And 2nd St. 34.76056 -87.65056
N S
P
M
Population Ex posure/
Decatur MSA3/1/2003 activ e
U C Y
DBT Elmore 01-051-0001 Dew berry Trail, Wetumpka 32.49833 -86.13667U S Highest Concentration/
Montgomery MSA3/1/1990 activ e
U C Y
Southside Etow ah 01-055-00111450 Parker Anderson Lane,
Southside, Al33.9039 -86.0539
N S Max Concentration/
Gadsden MSA4/26/2002 activ e
U C Y
Dothan Houston 01-069-0004 161 Buford Lane 31.19041 -85.42317N S Population Ex posure/
Dothan MSA3/14/2005 activ e
U C Y
Mobile -
ChickasawMobile 01-097-0003
Iroquois And Azalea
Chickasaw30.76972 -88.0875
N S Population Ex posure/
Mobile MSA3/2/1982 activ e
U C Y
Mobile - Bay
RoadMobile 01-097-2005 Bay Rd. ,Mobile AL 30.47444 -88.14111
U S Population Ex posure/
Mobile MSA3/1/1999 activ e
U C Y
Montgomery -
MOMSMontgomery 01-101-1002
1350 Coliseum Blv d,
Montgomery , AL32.412782 -86.263356
N S Population Ex posure/
Montgomery MSA6/2/1993 activ e
U C Y
Decatur Morgan 01-103-0011 Wallace Dev elopment Center 34.51861 -86.97694U S General/Background/
Decatur MSA4/1/2000 activ e
U C Y
Phenix City -
LadoniaRussell 01-113-0002
9 Woodland Driv e (School) ,
Ladonia, Al 32.46785 -85.0839
U S
P
M
Population Ex posure/
Columbus, GA-AL MSA3/1/2003 activ e
U C Y
Helena Shelby 01-117-0004 Helena, Bearden Farm 33.31694 -86.825U S Population Ex posure/
Birmingham MSA1/1/1983 activ e
U C Y
Ward, Sumter
Co.Sumter 01-119-0003
NNE of Ward Post Office,
Sumter Co., Alabama32.362706 -87.484217
R S
P
M
General/Background/
not in MSA3/1/2013 activ e
U C Y
Duncanv ille,
TuscaloosaTuscaloosa 01-125-0010
11690 Southfork Dr.
Duncanv ille, Al 33.08953 -87.45972
U S Population Ex posure/
Tuscaloosa MSA2/1/2001 activ e
U C Y
Sand Mountain Dekalb 01-049-9991Sand Mountain Agricultural
Ex per. Station Crossv ille, AL34.2888 -85.9698
R C
A
S
Highest Concentration/
Fort Pay ne µSA1/1/2011 activ e
U C N
operated by EPA

2015AmbientAirPlan.docx 7/23/2015
Page 39 of 68
SO2
Site common name County AQS Site ID Address Latitude Longitude
SCALE
TYPE
Monitoring objective / CBSA
Date Began
Date Ended
METHOD
SCHEDULE
NAAQS Comment
Mobile - Chickasaw
Mobile 01-097-0003 Iroquois And Azalea
Chickasaw 30.76972 -88.0875 N S
Population Exposure/ Mobile MSA
1/1/2013 active P C Y

2015AmbientAirPlan.docx 7/23/2015
Page 40 of 68
JCDH AIR MONITORING NETWORK DESCRIPTION
(As of June 2015)
Abbreviations
Scale
N Neighborhood (0.5 – 4 Kilometers)
U Urban (overall citywide conditions, 4 -50 kilometers
R Regional (usually rural, with homogenous geography, tens to
hundreds of kilometers)
MC Microscale
Type
CS Core SLAMS
NCS NCore SLAMS
S SLAMS
SPM Special Purpose Monitor
Operating Schedule
C Continuous monitor
D Daily 24-hour samples
3 1 24-hour sample every 3 days (on national schedule)
6 1 24-hour sample every 6 days (on national schedule)
Methods
H Hi-volume SSI sampler
L Low Volume SSI
T TEOM continuous monitor
U UV photometric ozone analyzer
S Hi-Volume Total Suspended Particulate monitor
G Lead Analysis by Graphite furnace
P Pulsed Fluorescent
I Non Dispersive Infrared
F Gas Filter Correlation
B Beta Attenuation
UP Chemiluminescence- photolytic
NAAQS2
Y,N Data suitable for comparison to NAAQS
2 Collocated monitors must be operated in the same manner as the Federal Reference Method; one monitor at the site is designated as the main monitor for comparison to
the NAAQS.

2015AmbientAirPlan.docx 7/23/2015
Page 41 of 68
Ozone
Site common
name AQS Site ID Address
Latitude
Longitude
S
C
A
L
E
Ty
pe Monitoring objective
Began
Sampling
Ended
Sampling
M
E
T
H
O
D
S
C
H
E
D
U
L
E
N
A
A
Q
S Comment
N. B’ham
NCore
01-073-0023 3009 28th
St. North 33.553.056
-86.815000 N N
C
S
Neighborhood 03/01/00 Active U C Y Year Round
Fairfield PFD 01-073-1003 5229 Court B 33.485556
-86.915000 N S High Population
Exposure
04/26/74 Active U C Y March -
October
McAdory
School
01-073-1005 4800 McAdory School
Rd.
33.331111
-87.003611 U S High Concentration 06/17/87 Active U C Y March -
October
Leeds Elem.
School
01-073-1010 201 Ashville Rd. 33.545278
-86.549167 N S High Population
Exposure
03/01/01 Active U C Y March -
October
Hoover 01-073-2006 3425 Tamassee Lane 33.386389
-86.816667
N
S High Population
Exposure
09/01/88 Active U C Y March -
October
Corner School 01-073-5003 1005 Corner School
Rd.
33.801667
-86.942500
U S Typical Population 03/01/00 Active U C Y March -
October
Tarrant Elem.
School
01-073-6002 1269 Portland St. 33.578333
-86.773889
N S High Population
Exposure
03/24/80 Active U C Y March -
October

2015AmbientAirPlan.docx 7/23/2015
Page 42 of 68
SO2
Site common
name AQS Site ID Address
Latitude
Longitude
S
C
A
L
E
Ty
pe Monitoring objective
Began
Sampling
Ended
Sampling
M
E
T
H
O
D
S
C
H
E
D
U
L
E
N
A
A
Q
S Comment
N. B’ham
NCore
01-073-0023 3009 28th
St. North 33.553.056
-86.815000 N N
C
S
High Population
Exposure
01/01/11 Active P C Y
Fairfield PFD 01-073-1003 5229 Court B 33.485556
-86.915000 N S High Population
Exposure
12/11/74 Active P C Y
CO
Site common
name AQS Site ID Address
Latitude
Longitude
S
C
A
L
E
Ty
pe Monitoring objective
Began
Sampling
Ended
Sampling
M
E
T
H
O
D
S
C
H
E
D
U
L
E
N
A
A
Q
S Comment
N. B’ham
NCore
01-073-0023 3009 28th
St. North 33.553.056
-86.815000 N N
C
S
Neighborhood 03/01/00 Active F C Y
Fairfield PFD 01-073-1003 5229 Court B 33.485556
-86.915000 N S High Population
Exposure
04/26/74 Active I C Y
N. Bham Sloss 01-073-6004 4113 Shuttlesworth Dr. 33.565278
-86.796389
N S High Population
Exposure
09/25/96 Active F C Y
Arkadelphia
(Near Road)
01-073-2059 1110 5th Street West
33.521427
-86.844112 N S Neighborhood 01/01/14 Active F C Y

2015AmbientAirPlan.docx 7/23/2015
Page 43 of 68
NOy
Site common
name AQS Site ID Address
Latitude
Longitude
S
C
A
L
E
Ty
pe Monitoring objective
Began
Sampling
Ended
Sampling
M
E
T
H
O
D
S
C
H
E
D
U
L
E
N
A
A
Q
S Comment
N. B’ham
NCore
01-073-0023 3009 28th
St. North 33.553.056
-86.815000 N N
C
S
High Population
Exposure
01/01/11 Active P C Y
NO2
Site common
name AQS Site ID Address
Latitude
Longitude
S
C
A
L
E
Ty
pe Monitoring objective
Began
Sampling
Ended
Sampling
M
E
T
H
O
D
S
C
H
E
D
U
L
E
N
A
A
Q
S Comment
N. B’ham
NCore
01-073-0023 3009 28th
St. North 33.553.056
-86.815000 N N
C
S
High Population
Exposure
01/01/14 Active UP C Y Began
January
2014
Arkadelphia
(Near Road)
01-073-2059 1110 5th Street West
33.521427
-86.844112 N S Neighborhood 01/01/14 Active UP C Y Began
January
2014

2015AmbientAirPlan.docx 7/23/2015
Page 44 of 68
Low Volume PM10
Site common
name AQS Site ID Address/ MSA
Latitude
Longitude
S
C
A
L
E
T
Y
P
E Monitoring objective
Began
Sampling
Ended
Sampling
M
E
T
H
O
D
S
C
H
E
D
U
L
E
N
A
A
Q
S Comment
N. B’ham
NCore
01-073-0023 3009 28th
St. North 33.553.056
-86.815000 N N
C
S
High Concentration 01/01/03 Active L 3 Y LC/Lead/STP
N. B’ham
NCore
01-073-0023 3009 28th
St. North 33.553.056
-86.815000 N N
C
S
Collocated Sampler 01/01/03 Active L 6 Y LC/Lead/STP
Wylam 01-073-2003 1242 Jersey St. 33.499722
-86.924167 N S High Population
Exposure
01/01/03 Active L 6 Y LC converted
to STP
Wylam 01-073-2003 1242 Jersey St. 33.499722
-86.924167 N S Collocated Sampler 01/01/03 Active L 6 Y LC converted
to STP Tarrant Elem.
School
01-073-6002 1269 Portland St. 33.578333
-86.773889
N S High Population
Exposure
01/01/13 Active L 6 Y LC converted
to STP Leeds Elem.
School
01-073-1010 201 Ashville Rd. 33.545278
-86.549167 N S Typical Population 01/01/04 Active L 6 Y LC converted
to STP

2015AmbientAirPlan.docx 7/23/2015
Page 45 of 68
Continuous PM10
Site common
name AQS Site ID Address/ MSA
Latitude
Longitude
S
C
A
L
E
T
Y
P
E Monitoring objective
Began
Sampling
Ended
Sampling
M
E
T
H
O
D
S
C
H
E
D
U
L
E
N
A
A
Q
S Comment
N. B’ham
NCore
01-073-0023 3009 28th
St. North 33.553.056
-86.815000 N S
P
M
High Concentration 02/01/13 Active B C N Began
February
2013
Wylam 01-073-2003 1242 Jersey St. 33.499722
-86.924167 N S
P
M
High Population
Exposure
07/13/01 Active T C Y
Tarrant Elem.
School
01-073-6002 1269 Portland St. 33.578333
-86.773889
N S High Population
Exposure
03/24/80 Active T C Y
N. Bham Sloss 01-073-6004 4113 Shuttlesworth Dr. 33.565278
-86.796389
N S High Population
Exposure
01/25/96 Active T C Y
Lead
Site common
name AQS Site ID Address
Latitude
Longitude
S
C
A
L
E
Ty
pe Monitoring objective
Began
Sampling
Ended
Sampling
M
E
T
H
O
D
S
C
H
E
D
U
L
E
N
A
A
Q
S Comment
N. B’ham
NCore
01-073-0023 3009 28th
St. North 33.553.056
-86.815000 N N
C
S
Neighborhood 01/01/11 Active L 3 Y XRF Analysis
N. B’ham
NCore
01-073-0023 3009 28th
St. North 33.553.056
-86.815000 N N
C
S
Collocated Sampler 01/01/11 Active L 6 Y XRF Analysis
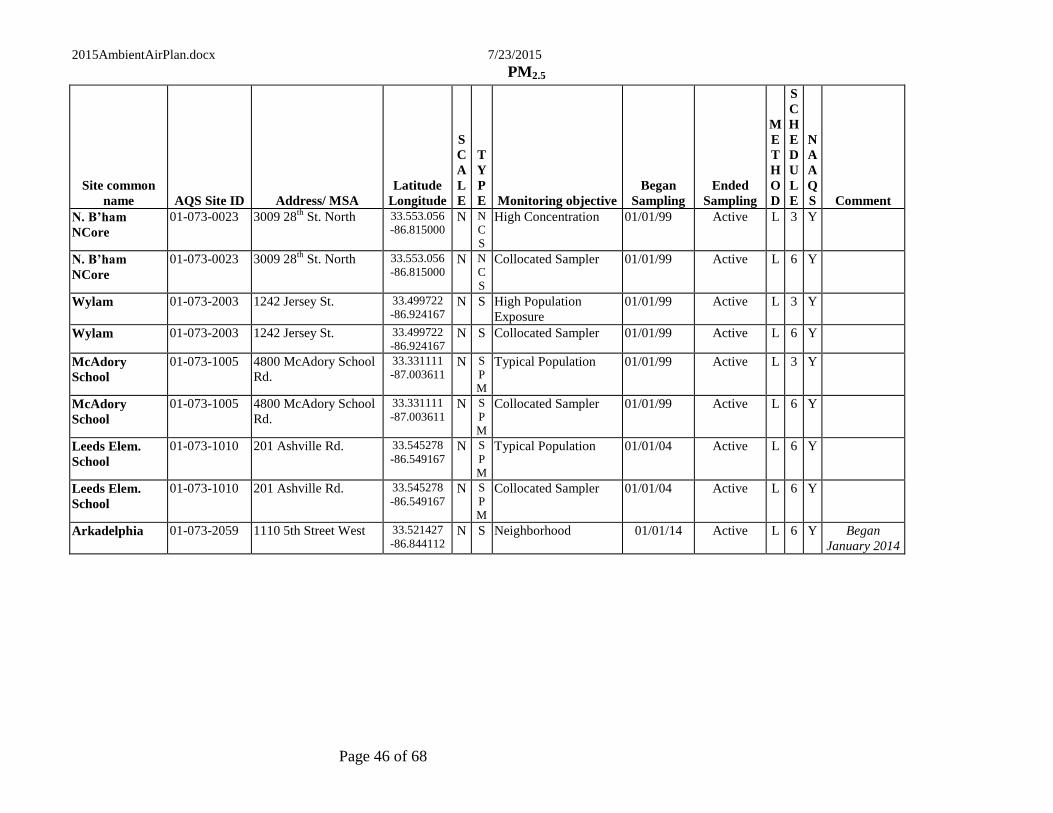
2015AmbientAirPlan.docx 7/23/2015
Page 46 of 68
PM2.5
Site common
name AQS Site ID Address/ MSA
Latitude
Longitude
S
C
A
L
E
T
Y
P
E Monitoring objective
Began
Sampling
Ended
Sampling
M
E
T
H
O
D
S
C
H
E
D
U
L
E
N
A
A
Q
S Comment
N. B’ham
NCore
01-073-0023 3009 28th
St. North 33.553.056
-86.815000 N N
C
S
High Concentration 01/01/99 Active L 3 Y
N. B’ham
NCore
01-073-0023 3009 28th
St. North 33.553.056
-86.815000 N N
C
S
Collocated Sampler 01/01/99 Active L 6 Y
Wylam 01-073-2003 1242 Jersey St. 33.499722
-86.924167 N S High Population
Exposure
01/01/99 Active L 3 Y
Wylam 01-073-2003 1242 Jersey St. 33.499722
-86.924167 N S Collocated Sampler 01/01/99 Active L 6 Y
McAdory
School
01-073-1005 4800 McAdory School
Rd.
33.331111
-87.003611 N S
P
M
Typical Population 01/01/99 Active L 3 Y
McAdory
School
01-073-1005 4800 McAdory School
Rd.
33.331111
-87.003611 N S
P
M
Collocated Sampler 01/01/99 Active L 6 Y
Leeds Elem.
School
01-073-1010 201 Ashville Rd. 33.545278
-86.549167 N S
P
M
Typical Population 01/01/04 Active L 6 Y
Leeds Elem.
School
01-073-1010 201 Ashville Rd. 33.545278
-86.549167 N S
P
M
Collocated Sampler 01/01/04 Active L 6 Y
Arkadelphia 01-073-2059 1110 5th Street West
33.521427
-86.844112 N S Neighborhood 01/01/14 Active L 6 Y Began
January 2014

2015AmbientAirPlan.docx 7/23/2015
Page 47 of 68
Continuous PM2.5
Site common
name AQS Site ID Address/ MSA
Latitude
Longitude
S
C
A
L
E
T
Y
P
E Monitoring objective
Began
Sampling
Ended
Sampling
M
E
T
H
O
D
S
C
H
E
D
U
L
E
N
A
A
Q
S Comment
N. B’ham
NCore
01-073-0023 3009 28th
St. North 33.553.056
-86.815000 N S
P
M
High Concentration 02/01/13 Active B C N Began
February
2013
McAdory
School
01-073-1005 4800 McAdory School
Rd.
33.331111
-87.003611 N S
P
M
Typical Population 01/01/99 Active T C N
Leeds Elem.
School
01-073-1010 201 Ashville Rd. 33.545278
-86.549167 N S
P
M
Typical Population 01/01/04 Active T C N
Wylam 01-073-2003 1242 Jersey St. 33.499722
-86.924167 N S
P
M
High Population
Exposure
07/13/01 Active T C N
Hoover 01-073-2006 3425 Tamassee Lane 33.386389
-86.816667
N
S
P
M
High Population
Exposure
07/25/01 Active T C N
Corner 01-073-5003 1005 Corner School
Rd.
33.801667
-86.942500
U S
P
M
Typical Population 07/22/01 Active T C N
PM10 IMPROVE
Site common
name AQS Site ID Address
Latitude
Longitude
S
C
A
L
E
Ty
pe Monitoring objective
Began
Sampling
Ended
Sampling
M
E
T
H
O
D
S
C
H
E
D
U
L
E
N
A
A
Q
S Comment
N. B’ham
NCore
01-073-0023 3009 28th
St. North 33.553.056
-86.815000 N N
C
S
High Concentration 04/21/04 Active 3 N

2015AmbientAirPlan.docx 7/23/2015
Page 48 of 68
PM2.5 IMPROVE Speciation
Site common
name AQS Site ID Address
Latitude
Longitude
S
C
A
L
E
Ty
pe Monitoring objective
Began
Sampling
Ended
Sampling
M
E
T
H
O
D
S
C
H
E
D
U
L
E
N
A
A
Q
S Comment
N. B’ham
NCore
01-073-0023 3009 28th
St. North 33.553.056
-86.815000 N N
C
S
High Concentration 04/21/04 Active 3 N
PM2.5 STN Speciation
Site common
name AQS Site ID Address
Latitude
Longitude
S
C
A
L
E
Ty
pe Monitoring objective
Began
Sampling
Ended
Sampling
M
E
T
H
O
D
S
C
H
E
D
U
L
E
N
A
A
Q
S Comment
N. B’ham
NCore
01-073-0023 3009 28th
St. North 33.553.056
-86.815000 N N
C
S
High Concentration 01/01/01 Active 3 N 1 in 3
Alternate
Schedule
Wylam 01-073-2003 1242 Jersey St. 33.499722
-86.924167 N S High Concentration 10/01/01 Active 6 N 1 in 3
Alternate
Schedule

2015AmbientAirPlan.docx 7/23/2015
Page 49 of 68
RadNet
Site common
name AQS Site ID Address
Latitude
Longitude
S
C
A
L
E
Ty
pe Monitoring objective
Began
Sampling
Ended
Sampling
M
E
T
H
O
D
S
C
H
E
D
U
L
E
N
A
A
Q
S Comment
N. B’ham
NCore
01-073-0023 3009 28th
St. North 33.553.056
-86.815000 N N
C
S
High Concentration 04/19/07 Active C N
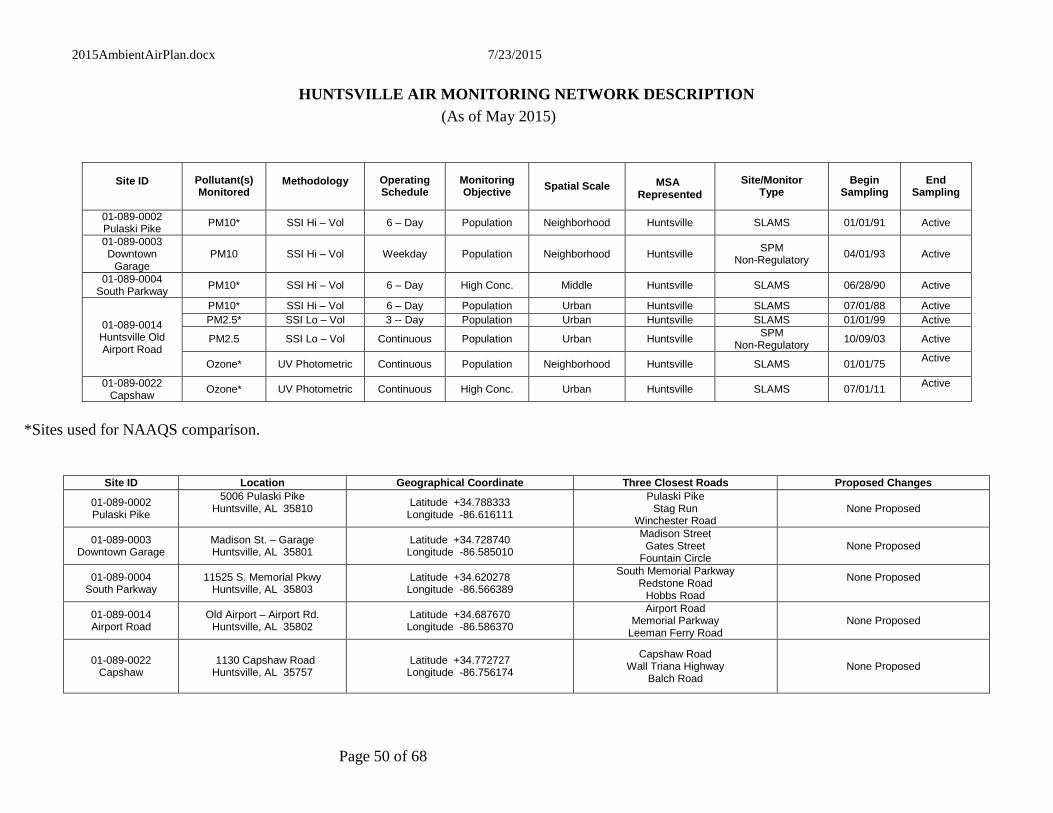
2015AmbientAirPlan.docx 7/23/2015
Page 50 of 68
HUNTSVILLE AIR MONITORING NETWORK DESCRIPTION
(As of May 2015)
Site ID
Pollutant(s) Monitored
Methodology Operating
Schedule Monitoring Objective
Spatial Scale
MSA Represented
Site/Monitor Type
Begin Sampling
End Sampling
01-089-0002 Pulaski Pike
PM10* SSI Hi – Vol 6 – Day Population Neighborhood Huntsville SLAMS 01/01/91 Active
01-089-0003 Downtown
Garage PM10 SSI Hi – Vol Weekday Population Neighborhood Huntsville
SPM Non-Regulatory
04/01/93 Active
01-089-0004 South Parkway
PM10* SSI Hi – Vol 6 – Day High Conc. Middle Huntsville SLAMS 06/28/90 Active
01-089-0014 Huntsville Old Airport Road
PM10* SSI Hi – Vol 6 – Day Population Urban Huntsville SLAMS 07/01/88 Active
PM2.5* SSI Lo – Vol 3 -- Day Population Urban Huntsville SLAMS 01/01/99 Active
PM2.5 SSI Lo – Vol Continuous Population Urban Huntsville SPM
Non-Regulatory 10/09/03 Active
Ozone* UV Photometric Continuous Population Neighborhood Huntsville SLAMS 01/01/75 Active
01-089-0022 Capshaw
Ozone* UV Photometric Continuous High Conc. Urban Huntsville SLAMS 07/01/11 Active
*Sites used for NAAQS comparison.
Site ID Location Geographical Coordinate Three Closest Roads Proposed Changes
01-089-0002 Pulaski Pike
5006 Pulaski Pike Huntsville, AL 35810
Latitude +34.788333 Longitude -86.616111
Pulaski Pike Stag Run
Winchester Road None Proposed
01-089-0003 Downtown Garage
Madison St. – Garage Huntsville, AL 35801
Latitude +34.728740 Longitude -86.585010
Madison Street Gates Street
Fountain Circle None Proposed
01-089-0004 South Parkway
11525 S. Memorial Pkwy Huntsville, AL 35803
Latitude +34.620278 Longitude -86.566389
South Memorial Parkway Redstone Road
Hobbs Road
None Proposed
01-089-0014 Airport Road
Old Airport – Airport Rd. Huntsville, AL 35802
Latitude +34.687670 Longitude -86.586370
Airport Road Memorial Parkway
Leeman Ferry Road None Proposed
01-089-0022 Capshaw
1130 Capshaw Road Huntsville, AL 35757
Latitude +34.772727 Longitude -86.756174
Capshaw Road Wall Triana Highway
Balch Road None Proposed
2015AmbientAirPlan.docx 7/23/2015
Page 51 of 68
APPENDIX A
Jefferson County Department Of Health (JCDH)
Annual Air Monitoring Network Plan

2015AmbientAirPlan.docx 7/23/2015
Page 52 of 68
Jefferson County Department Of Health (JCDH)
Annual Air Monitoring Network Plan
May 2015
Regulations codified at 40 CFR Part 58, Appendices D (Network Design Criteria for Ambient
Air Quality Monitoring) and E (Probe and Monitoring Path Siting Criteria for Ambient Air
Quality Monitoring) were reviewed to determine if modifications to the existing air monitoring
network are required.
Summary of Changes to the Network
Lead (Pb) monitoring is required in major urbanized areas where Pb levels have been shown or
are expected to be of concern due to the proximity of Pb point source emissions. According to
the new lead regulations, sources emitting a half ton or more of lead per year would be
candidates for lead ambient air monitoring. There are no longer any significant point sources of
lead emissions greater than the half ton threshold in Jefferson County. Therefore, based on past
monitoring and 2013 emissions inventory data, a lead source monitoring site is not required.
The EPA revised the NAAQS for Nitrogen Dioxide and it was promulgated in February 2010.
In this rule, EPA required changes to the monitoring network that will focus monitoring
resources to capture short-term NO2 concentrations near heavily trafficked roads, to assess area-
wide (or community-wide) NO2 concentrations, and to assess NO2 concentrations for vulnerable
and susceptible populations. Jefferson County will be required to have two NO2 monitors; one to
address community-wide NO2 and one to address near-road concentrations. Funding was
received and a turn-key near road site, which meets the design and siting criteria spelled out in
40 CFR Part 58, was purchased and installed in October 2013. The site became operational on
January 1, 2014. See following picture of physical building and site.

2015AmbientAirPlan.docx 7/23/2015
Page 53 of 68
Arkadelphia Near Road Site (01-073-2059)
NOy monitoring began at the NCore site January 1, 2011.
At the request of JCDH’s Environmental Health Director, the Department began sampling PM2.5
at the Sloss Shuttlesworth site. This PM2.5 monitor was operated as a special purpose monitor
for approximately one year to address community concerns. Sampling was completed and
compared to the concentrations at the North Birmingham site. Concentrations were relatively
similar. There are no plans to continue monitoring for PM2.5 at this site.
In 2011, JCDH’s Risk Management Division determined that all decks throughout the
monitoring network were unsafe for employees and recommended rebuilding the decks above
the shelters. The Department has successfully completed deck and building
renovation/replacements for all monitoring sites.

2015AmbientAirPlan.docx 7/23/2015
Page 54 of 68
Continuous PM2.5 SPM (Special Purpose Monitors)
Continuous PM2.5 monitoring is required in relation to the minimum SLAMS monitoring
requirement stated above; i.e., equal to at least one-half (round up) the minimum monitoring
requirement. Jefferson County is required to operate two continuous PM2.5 monitors. However,
six continuous PM2.5 monitors are actually operated in Jefferson County for the purpose of
AirNow mapping and to support our EMPACT website. Continuous PM2.5 monitors are
collocated with manual PM2.5 monitors at North Birmingham, Wylam, McAdory and Leeds for
quality assurance purposes.

2015AmbientAirPlan.docx 7/23/2015
Page 55 of 68
Application for Exclusion of PM2.5 Continuous FEM Data from Comparison to the NAAQS
Our monitoring program has historically operated PM2.5 continuous monitors primarily to support forecasting and reporting of the Air Quality Index (AQI). These monitors supply data every hour to update the AQI on our web site as well as on national web sites such as AIRNow (www.airnow.gov). We have been using these monitors since the early part of the last decade as we implemented the PM2.5 monitoring program. Over the last few years, a number of PM2.5 continuous monitors have been approved as Federal Equivalent Methods (FEMs). By utilizing an approved FEM, any subsequent data produced from the method may be eligible for comparison to EPA’s health based standard known as the NAAQS. The primary advantage of operating a PM2.5
continuous FEM is that it can support both the AQI, while also supplying data that are eligible for comparison to the NAAQS. Thus, a network utilizing PM2.5 continuous FEMs can minimize the number of filter-based FRMs operated in the network, which are primarily used for comparison to the NAAQS. These filter-based FRMs are resource intensive in that they require field operations as well as pre- and post-sampling laboratory analysis which results in data not being available for approximately 2-4 weeks after sample collection. Our monitoring program has been working with PM2.5 continuous FEMs including deployment at a few sites to evaluate their performance. Although the PM2.5 continuous FEMs are automated methods, these methods still require careful attention in their set-up, operation, and validation of data. Once we were able to collect enough data we began to evaluate the performance of these methods compared to collocated FRMs. That evaluation is explained further below and includes our recommendations on the use of the data from these methods. Request for Exclusion of PM2.5 Continuous FEM data from Comparison to the NAAQS: In accordance with the PM NAAQS rule published on January 15th, 2013 (78 FR 3086) and specific to the provisions detailed in §58.10 (b)(13) and §58.11 (e) we are requesting that data from the following monitors be set aside for comparison to the NAAQS. While our agency is working to optimize the monitoring instrumentation we use to meet all of our monitoring objectives, we are not yet at a point where the comparability of the PM2.5 continuous FEMs operated in our network (or a sub-set of our network) compared to collocated FRMs is acceptable such that we are comfortable using the continuous FEM data for comparison to the NAAQS. After assessing the comparability of the PM2.5 FEMs to the collocated FRMs for our network, we have determined that the sites listed below do not meet the comparability requirements. Detailed one-page assessments from which the information described below was obtained are included at the end of this section.

2015AmbientAirPlan.docx 7/23/2015
Page 56 of 68
Table – Request for Exclusion of PM2.5 Continuous FEM Data
Site Name City Site ID Cont POC
Method Descriptio
n
PM2.5
Cont. Begin Date
PM2.5
Cont End Date
Continuous/ FRM
Sampler pairs per season
Slope (m)
Intercept
(y) Meets
bias req
Correlation
(r)
Sites with PM2.5 continuous FEMs that are collocated with FRMs: North Birmingham
Birmingham 01-073-0023 3 Thermo Scientific 5014i
2/19/2013 12/31/2014 Winter = Spring = Summer = Fall = Total =
.903 1.612 yes .90638
Period of Exclusion of Data from the PM2.5 Continuous FEMs: The above table details the period of available data by monitor for which we are basing our recommendation to exclude PM2.5 continuous FEM data. Per EPA Regional Office approval, we will load or move as necessary these data to EPA’s AQS database in a manner where the data are only used for the appropriate monitoring objective(s) (i.e., use data for both the NAAQS and AQI, just the AQI, or neither the NAAQS or AQI). Additionally, we will continue to load any new data generated for the next 6 months (intended to represent the period until December 31 of 2015) in the same manner or until such time as we request and receive approval from the EPA Regional Office to change the monitoring objectives that the data from the PM2.5 continuous FEM can support. Please note that JCDH is concerned with the performance of the PM2.5 continuous FEM especially in 2014 as this represents the latest data set and indicates that the PM2.5 continuous FEM is not operating within an acceptable range to be used for the NAAQS. PM2.5 Continuous FEM data for Reporting the AQI: While we are requesting the monitors above not be used for comparison to the NAAQS, we do believe that the data are of sufficient comparability to collocated FRMs that they be used in AQI reporting. Therefore, with EPA Regional Office approval we will report these data on our web site and to AIRNow (www.airnow.gov). Additionally, we intend to store the data in EPA’s AQS database that is used for “acceptable AQI” reporting (i.e., parameter code 88502) so that data users will know that these data are appropriate for use in AQI calculations. Continued Operation of PM2.5 Monitors to Support NAAQS and AQI Reporting While we are requesting that data from the monitors listed above be set aside for comparison to the NAAQS, we will continue to operate PM2.5 FRMs to support the objective of comparison to the NAAQS. We will also operate our PM2.5 continuous monitors for use in AQI reporting. Each of these FRM and PM2.5 continuous monitors will be operated at the locations previously described in this plan and at the locations that meet the objectives of the Network Design Criteria for Ambient Air Quality Monitoring described in Appendix D to Part 58.
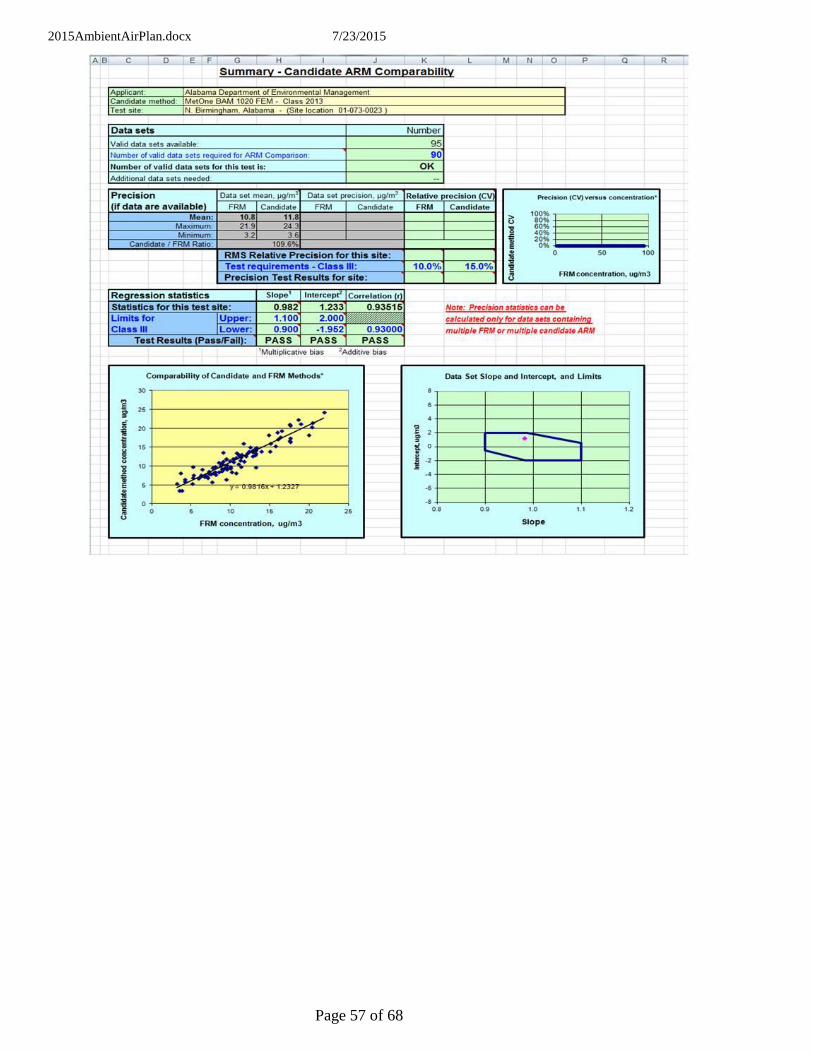
2015AmbientAirPlan.docx 7/23/2015
Page 57 of 68

2015AmbientAirPlan.docx 7/23/2015
Page 58 of 68

2015AmbientAirPlan.docx 7/23/2015
Page 59 of 68
Network Review Findings
The existing network as summarized in the attached Air Monitoring Network Description
complies with 40 CFR Part 58 requirements. The described network should adequately
characterize typical population exposure concentrations and compliance status with the NAAQS
for pollutants of concern.
The monitoring site location map can be found in the appendix.
2015AmbientAirPlan.docx 7/23/2015
Page 60 of 68
APPENDIX B
Huntsville Department of Natural Resources and Environmental Management (HDNREM)
Annual Air Monitoring Network Plan

2015AmbientAirPlan.docx 7/23/2015
Page 61 of 68
ANNUAL AIR MONITORING NETWORK PLAN
May 22, 2015
Regulations codified at 40 CFR Part 58, Appendices A (Quality Assurance Requirements for
SLAMS, SPMs and PSD Air Monitoring), C (Ambient Air Quality Monitoring Methodology), D
(Network Design Criteria for Ambient Air Quality Monitoring) and E (Probe and Monitoring
Path Siting Criteria for Ambient Air Quality Monitoring) were reviewed to determine if
modifications to the existing air monitoring network are required.
NCore Ambient Air Monitoring Stations
Each State is required to operate one NCore site (multipollutant). Huntsville was not selected for
the NCore site.
PAMS (Photochemical Assessment Monitoring Stations)
PAMS monitoring is required in areas classified as serious, severe, or extreme for the 8-hour
ozone standard. Huntsville is presently classified as an ozone attainment area. Consequently,
PAMS monitoring is not required.
SLAMS (State and Local Air Monitoring Stations)
The minimum ozone monitoring requirements are based on MSA (Metropolitan Statistical Area)
populations and 3-year design value concentrations. The Huntsville MSA population is 417,593
based on the 2010 decennial census population. Huntsville’s 3-year design value concentration
for 2012-2014 is .068 ppm. MSA’s with populations of 50,000 to less than 350,000 having a
design value >85% of the O3 NAAQS are required to operate one ozone site. MSA’s with
populations of 350,000 to less than 4,000,000 are required to operate two ozone sites. Huntsville
operates two ozone monitoring sites, as required.
There is a two-tier minimum nitrogen dioxide (NO2) monitoring requirement. Near-road
microscale monitoring is required in each CBSA (Core-based statistical area) with a population
of 500,000 or more. Area-wide high concentration monitoring is required in each CBSA with a
population of 1,000,000 or more. The Huntsville CBSA population is 417,593. Huntsville is not
required to operate a SLAMS NO2 monitor.
The minimum monitoring requirements for carbon monoxide (CO) require one monitor be
collocated with a near-road NO2 monitor in each CBSA with a population of 1,000,000 or more.
Huntsville is not required to operate a SLAMS CO monitor.

2015AmbientAirPlan.docx 7/23/2015
Page 62 of 68
The minimum sulfur dioxide (SO2) monitoring requirements are based on a Population Weighted
Emissions Index (PWEI), which is calculated by multiplying the population of the CBSA and the
total SO2 emissions (using the most recent published version of the National Emissions
Inventory) within the CBSA area. The resulting product is then divided by one million,
representing million persons-tons per year. Areas having a PWEI greater than 1,000,000 are
required to operate 3 monitors; areas having a PWEI equal to or greater than 100,000 but less
than 1,000,000 are required to operate 2 monitors; areas having a PWEI greater than 5,000 but
less than 100,000 are required to operate 1 monitor. The Huntsville PWEI is 135 (based on 2010
decennial census population and 2011 National Emissions Inventory, total SO2 emissions data
for the Huntsville CBSA). Huntsville is not required to operate a SLAMS SO2 monitor.
Lead monitoring (Pb) is required in areas where Pb levels have been shown or are expected to be
of concern due to the proximity of Pb point source emissions. Generally, industrial sources
emitting 0.5 ton or more of lead per year and airports emitting 1.0 ton or more per year would be
candidates for lead ambient air monitoring. There are no significant point sources of lead
emissions in Huntsville. Based on past monitoring and emissions inventory data, a SLAMS lead
site is not required.
Huntsville’s PM10 concentrations are less than 80 percent of the PM10 NAAQS (National
Ambient Air Quality Standards). Based on Huntsville’s MSA population being between
250,000-500,000 and low concentrations, Huntsville is required to operate 1 site. Huntsville
operates 3 PM10 sites located in south, central, and north Huntsville. These monitors can be
operated at very low cost and provide good spatial coverage within the city. Experience has
shown that members of the public want ambient air monitoring to be performed in their part of
the city, and the PM10 monitoring sites provide a monitoring presence at relatively low cost.
Furthermore, the PM10 data provide an indirect indication of PM2.5 spatial variability at a tiny
fraction of the cost of operating multiple PM2.5 sites.
The minimum PM2.5 monitoring requirements are based on MSA populations and 3-year design
value concentrations. Huntsville’s 3-year design value concentration for 2012-2014 is 19 µg/m3
for the 24-hour standard and 8.9 µg/m3 for the annual standard. MSA’s with populations of
50,000 to less than 500,000 having a design value ≥ 85% of the PM2.5 NAAQS are required to
operate one PM2.5 site on a 1 in 3 day sampling frequency. Huntsville operates one PM2.5 site on
a 1 in 3 day schedule to meet this requirement. Note: Operating frequency increases to daily
sampling when the 24-hour design value is within ± 5 percent of the 24-hour PM2.5 NAAQS (34,
35, and 36 µg/m3).
SLAMS sites were also evaluated to determine consistency of spatial scales with stated
monitoring objectives. Reference the attached monitoring network description. In addition to
the information listed below, the description also indicates site locations, monitoring
methodologies, and operational schedules.
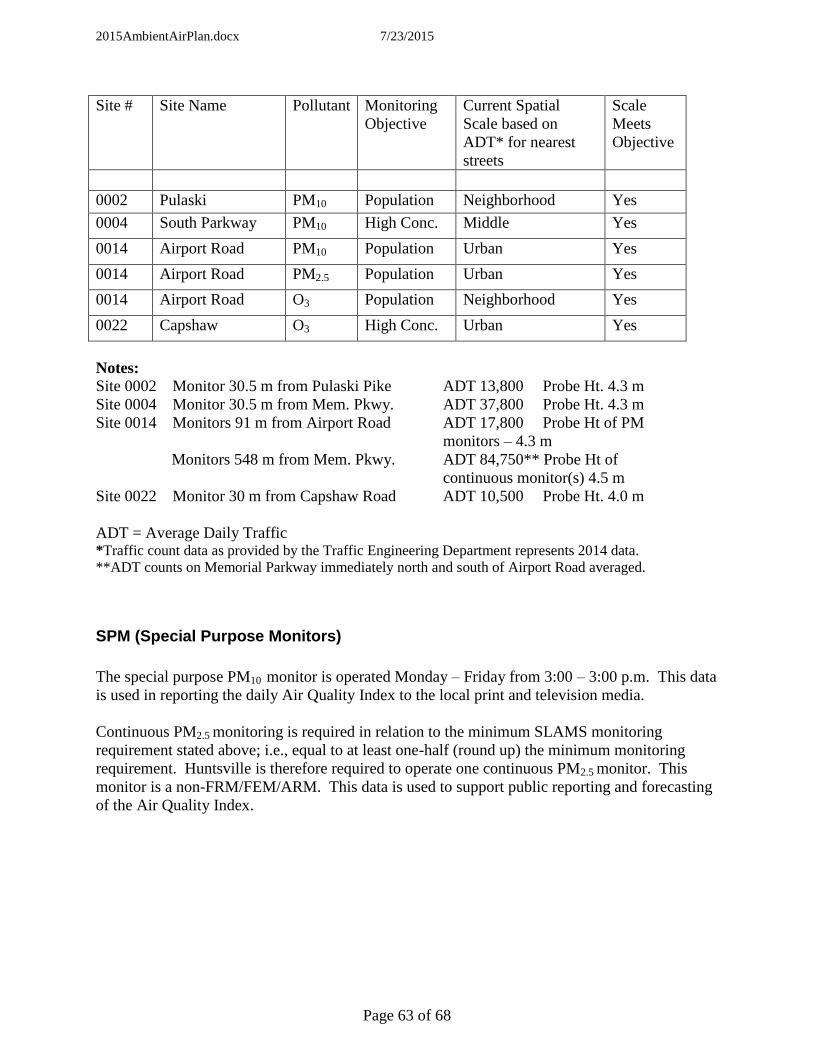
2015AmbientAirPlan.docx 7/23/2015
Page 63 of 68
Site # Site Name Pollutant Monitoring
Objective
Current Spatial
Scale based on
ADT* for nearest
streets
Scale
Meets
Objective
0002 Pulaski PM10 Population Neighborhood Yes
0004 South Parkway PM10 High Conc. Middle Yes
0014 Airport Road PM10 Population Urban Yes
0014 Airport Road PM2.5 Population Urban Yes
0014 Airport Road O3 Population Neighborhood Yes
0022 Capshaw O3 High Conc. Urban Yes
Notes:
Site 0002 Monitor 30.5 m from Pulaski Pike ADT 13,800 Probe Ht. 4.3 m
Site 0004 Monitor 30.5 m from Mem. Pkwy. ADT 37,800 Probe Ht. 4.3 m
Site 0014 Monitors 91 m from Airport Road ADT 17,800 Probe Ht of PM
monitors – 4.3 m
Monitors 548 m from Mem. Pkwy. ADT 84,750** Probe Ht of
continuous monitor(s) 4.5 m
Site 0022 Monitor 30 m from Capshaw Road ADT 10,500 Probe Ht. 4.0 m
ADT = Average Daily Traffic *Traffic count data as provided by the Traffic Engineering Department represents 2014 data.
**ADT counts on Memorial Parkway immediately north and south of Airport Road averaged.
SPM (Special Purpose Monitors)
The special purpose PM10 monitor is operated Monday – Friday from 3:00 – 3:00 p.m. This data
is used in reporting the daily Air Quality Index to the local print and television media.
Continuous PM2.5 monitoring is required in relation to the minimum SLAMS monitoring
requirement stated above; i.e., equal to at least one-half (round up) the minimum monitoring
requirement. Huntsville is therefore required to operate one continuous PM2.5 monitor. This
monitor is a non-FRM/FEM/ARM. This data is used to support public reporting and forecasting
of the Air Quality Index.
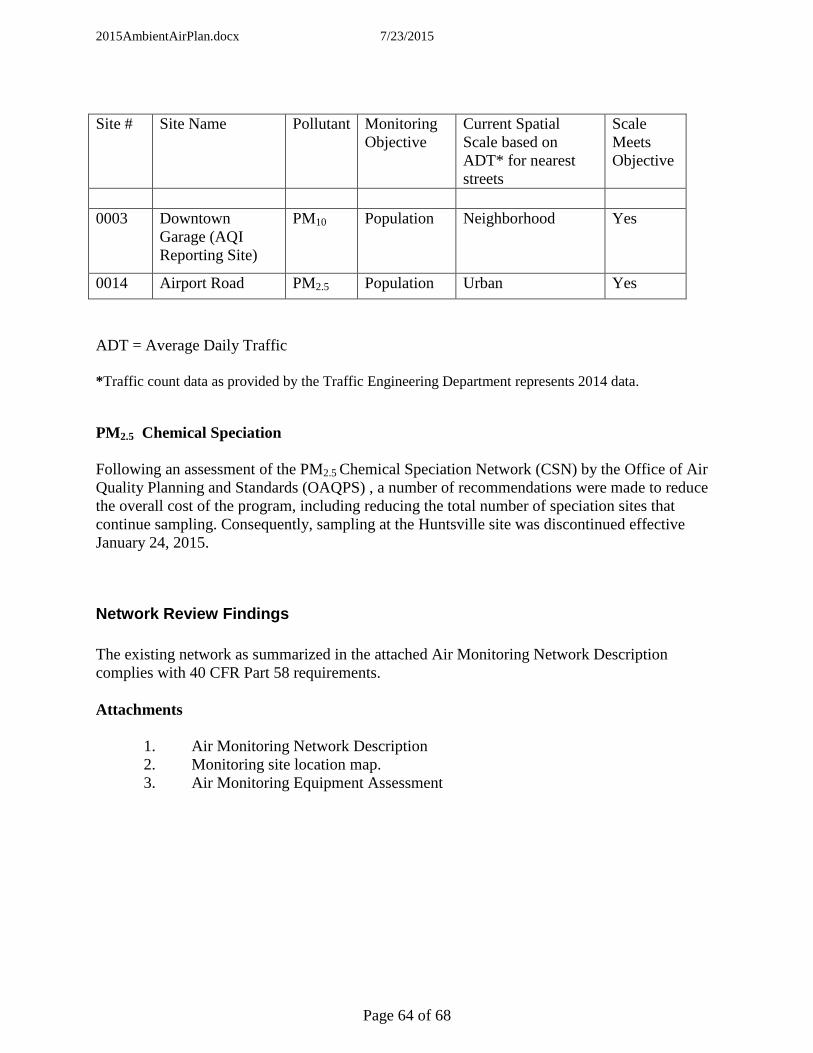
2015AmbientAirPlan.docx 7/23/2015
Page 64 of 68
Site # Site Name Pollutant Monitoring
Objective
Current Spatial
Scale based on
ADT* for nearest
streets
Scale
Meets
Objective
0003 Downtown
Garage (AQI
Reporting Site)
PM10 Population Neighborhood Yes
0014 Airport Road PM2.5 Population Urban Yes
ADT = Average Daily Traffic
*Traffic count data as provided by the Traffic Engineering Department represents 2014 data.
PM2.5 Chemical Speciation
Following an assessment of the PM2.5 Chemical Speciation Network (CSN) by the Office of Air
Quality Planning and Standards (OAQPS) , a number of recommendations were made to reduce
the overall cost of the program, including reducing the total number of speciation sites that
continue sampling. Consequently, sampling at the Huntsville site was discontinued effective
January 24, 2015.
Network Review Findings
The existing network as summarized in the attached Air Monitoring Network Description
complies with 40 CFR Part 58 requirements.
Attachments
1. Air Monitoring Network Description
2. Monitoring site location map.
3. Air Monitoring Equipment Assessment

2015AmbientAirPlan.docx 7/23/2015
Page 65 of 68
APPENDIX C
Maps

2015AmbientAirPlan.docx 7/23/2015
Page 66 of 68
ADEM Monitoring Sites
DBT
Troy
WKRGFairhope
O
Chickasaw
Bayroad
Dothan CC
Phenix City
La DonniaSumter
MGM adem
Childersburg
Ashland
VA Hospital
Tusc. Co.
Gadsden
Southside
Decatur
Muscle Shoals
Dothan O3
M
S
C2.5
Pb
10 10
25
O
M
M
Pb
Pb
O
O
25
C
M
O
O
O
O
O
O
O
25
C
C
C
C
25 25
25
M
M
S
S
25
M
M25
25
25
10
10
Helena
PelhamO
25
25
Crossville25
C
PM 2.5
PM 2.5 continuous
PM 2.5 speciation
PM 10
PM 10 continuous
Ozone
Meteorology (wind speed/direction)
Lead
SO2
O
25
M
O
25
S
10
S
C
C
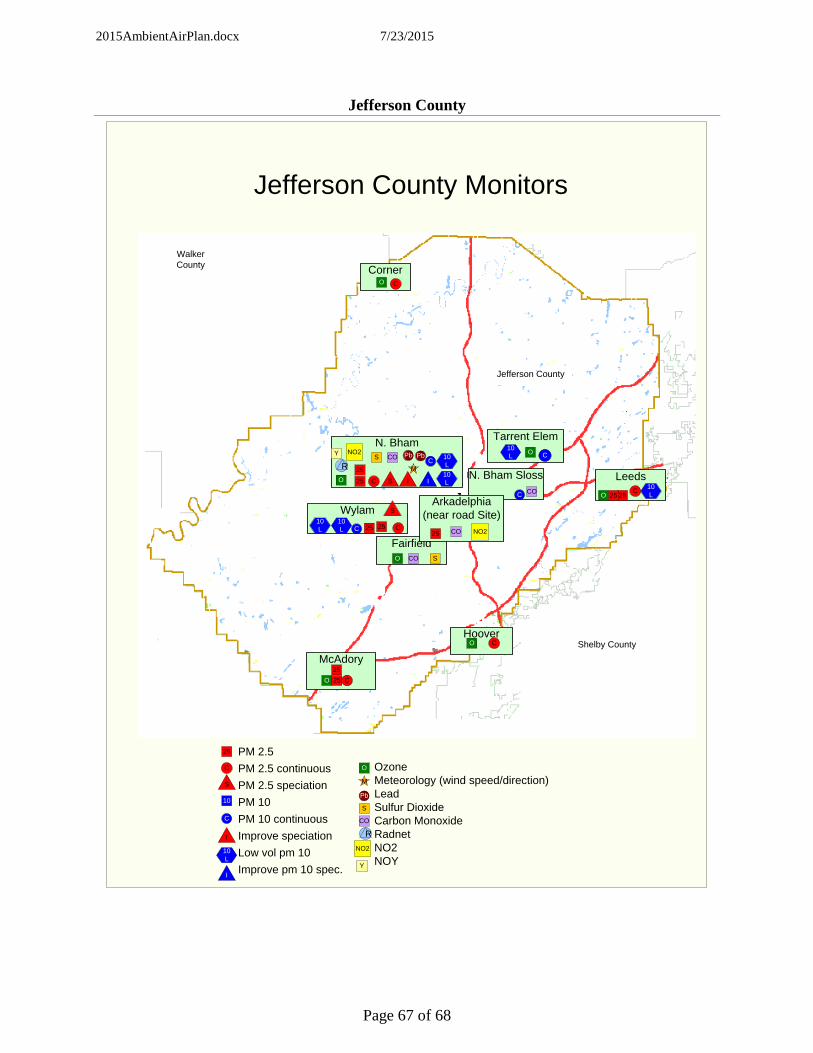
2015AmbientAirPlan.docx 7/23/2015
Page 67 of 68
Jefferson County
S
M
Pb
C O
S
10
C
Ozone
Meteorology (wind speed/direction)
Lead
Sulfur Dioxide
Carbon Monoxide
Radnet
NO2
NOY
I
10
L
I
CO
Fairfield
McAdory
Hoover
Corner
LeedsN. Bham Sloss
Wylam
Tarrent Elem
O
O
O
O
O
O
25
25
25
C
C
C
C
C
S
10
L
C
C
CCO
CO S
Jefferson County Monitors
10
L
10
L
N. Bham
O 25 C S I10
LI
C10
L25R
R
PM 2.5
PM 2.5 continuous
PM 2.5 speciation
PM 10
PM 10 continuous
Improve speciation
Low vol pm 10
Improve pm 10 spec.
25
PbCOS
M
Walker
County
Jefferson County
Shelby County
10
L
Arkadelphia
(near road Site)
NO2
Y
NO2
NO2
Y
CO
Pb
25
25
25
25
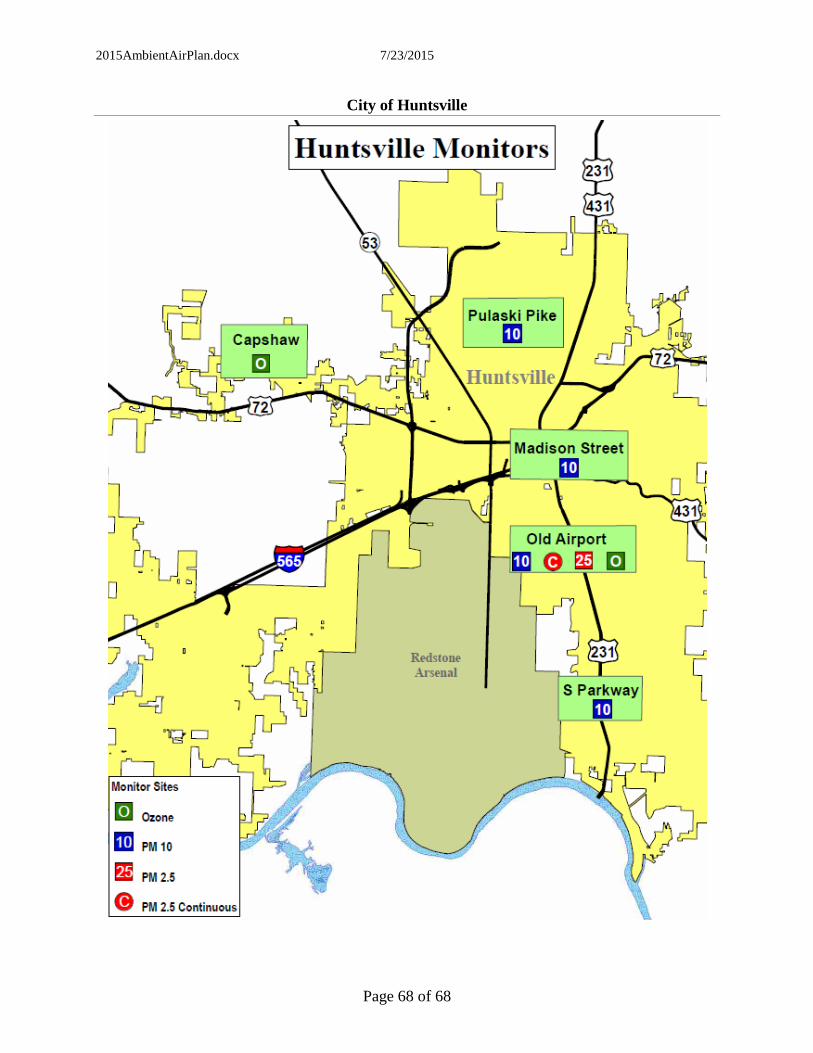
2015AmbientAirPlan.docx 7/23/2015
Page 68 of 68
City of Huntsville