State Finance and the Salary Shock
36
Finances of Karnataka: Fiscal Implications of Salary Hike Pinaki Chakraborty M Govinda Rao November 2006 National Institute of Public Finance and Policy New Delhi
Transcript of State Finance and the Salary Shock

Finances of Karnataka: Fiscal Implications of Salary Hike
Pinaki Chakraborty
M Govinda Rao
November 2006
National Institute of Public Finance and Policy
New Delhi

ii
Preface
This Study has been undertaken by the National Institute of Public Finance and Policy
at the instance of the Karnataka Fifth State Pay Commission.
The Study Team consists of Pinaki Chakraborty and M. Govinda Rao. The opinions and
analyses here are those of the authors. The members of the Governing Body of the National
Institute of Public Finance and Policy are in no way responsible for these.
November 2006 M. Govinda Rao
New Delhi Director
iii
Acknowledgements
The Study has been undertaken at the instance of the Karnataka Fifth State Pay
Commission. In connection with this study, during our visit to Bangalore, we have been
benefited from the discussions with the Chairman of the Pay Commission, Dr. C. Gopal Reddy.
We have been provided with the detailed data from the Commission to undertake this exercise.
Mr. K. R. Ramdurg and Mr. Nagendra compiled all the information in a short time and provide
to us. We thank them for their timely help.
At NIPFP, we thank Mr. Samik Chowdhury for his research assistance. We are also
thankful to Mr. Anurodh Sharma for formatting the Report.
July 2006 Pinaki Chakraborty
New Delhi M. Govinda Rao

iv
Table of Contents
Page No.
Preface i
Acknowledgements ii
I. Introduction 1
II. An Overview of Karnataka State Finances 3
III. Revenue Profile of the State 6
IV. Expenditure Profile of the State 9
V. The Fiscal Implications of Salary Hike: The Base Scenario 18
VI. The Fiscal Implications of Salary Hike: The Alternative Scenario 21
VII. Conclusions 27
References 31
List of Tables
Table 1: State Finances of Karnataka: An Overview 4
Table 2: Composition of States’ Own Tax Revenues 7
Table 3: Growth Rate of Tax Revenue 7
Table 4: Buoyancy of Taxes 8
Table 5: Composition of States’ Own Non-Tax Revenues 9
Table 6: Structure of Government Expenditure 10
Table 7: Expenditure Elasticity: Various Components 10
Table 8: Growth of Employment and Salary 12
Table 9: Annual Average Growth Rate of Employment 13
Table 10: Annual Average Growth Rate of Per Employee Salary Expenditure 13
Table 11: Incidence of Committed Expenditures on Revenue Budget: An
Interstate Comparison
15
Table 12: Pay Scales, Mean Basic Pay and Distribution of Employees: 2005-06 16
Table 13: Structure and growth of Employment by Scale 17
Table 14: Structure of Salary 18
Table 15: Fiscal Profile of Karnataka: The Base Scenario 20
Table 16: Fiscal Profile of Karnataka: The Alternative Scenario-I 24
Table 17: Fiscal Profile of Karnataka: The Alternative Scenario-II 27
List of Figures
Figure 1: Fiscal Deficit and Consolidated Fiscal Deficit to GSDP Ratio:
A Comparison
4
Figure 2: Percentage Composition of Salaries 6
Figure 3: Incidence of Committed Expenditure on Revenue Budget of the
State: 1970-71 to 2005-06
11

1
Finances of Karnataka: Fiscal Implications of Salary Hike
I. Introduction
Karnataka is a middle income State and one of the relatively better fiscally managed
States in the country. The per-capita State Domestic Product (SDP) in Karnataka at Rs. 20,703
is 1.22 times higher than the all-State average1. Although in the 1990s, in keeping with the
general trend, the State’s fiscal situation deteriorated as reflected in its rising revenue and fiscal
deficits during the 1990s, the period since 2001-02 has seen a turnaround. While in 2001-02,
Karnataka had a revenue deficit of Rs. 3296.33 crore, the revised estimates for 2005-06, shows
a surplus of Rs. 1187 crores and for 2006-07, the surplus is budgeted at Rs. 1534 crore.
Similarly, fiscal deficit improved from Rs. 5881.77 crores in 2001-02 to Rs. 4764.09 cores in
2005-06 (RE) and is budgeted at Rs. 5210.56 cores. This, by all accounts is a significant
improvement and in fact, way beyond that is envisaged under the fiscal restructuring plan by
the Twelfth Finance Commission (TFC). The TFC had envisaged that the State would phase
out its revenue deficit by the end of 2009-10. Nevertheless, the consolidated public sector
deficit of the State still remains a matter of concern, particularly the large power sector subsidy
and deficits thereon. The estimated budgetary subsidy to power sector in the year 2005-06 at
Rs. 1750 crore constituted 1.05 per cent of GSDP.
The marked improvement in the fiscal situation was possible due to the proactive
measures undertaken by the State towards fiscal correction. In the face of deteriorating fiscal
position during the 1990s, the State took a significant step towards fiscal reforms by bringing
out a White Paper on State Finances in March 2000 wherein issues relating to poor growth in
tax receipts, mounting expenditure and debt stock were highlighted. In this context, the State
has recognized that a year-on-year approach would be grossly insufficient to address the
problem of fiscal imbalance, which were more structural in nature and a Medium term
perspective was essential to correct the structural problems (Finance Department, 2005, p 4).
Karnataka was the first State to introduce the Karnataka Fiscal Responsibility Act (KFRA) in
1 The per capita income is an average of three years, i.e., from 1999-00 to 2002-03 based on the comparable GSDP
estimate provided by the twelfth Finance Commission Report.

2
the FY 2002-03. The KFRA mandated the elimination of revenue deficit by 2005-06 and
limiting of fiscal deficit to 3 per cent of GSDP by 2005-06. The KFR Act mandated the State
Government to place Medium Term Fiscal Plan (MTFP), which shall set forth the fiscal policy
of the State Government in the medium term (Finance Department, 2005, p 4). The State
undertook a significant fiscal restructuring programme under the World Bank sponsored
Structural Adjustment Lending (SAL) to the States. The SAL based fiscal consolidation started
in the State since 2000. The MTFP of 2005-09 laid out a path of fiscal correction for the period
until 2009 and has succeeded in its efforts so far in traversing in the path of fiscal consolidation
(Finance Department, 2005).
Although there has been a significant improvement in the fiscal situation in the State,
the important question is whether the improvement is structural, or is it merely due to some
immediate transitory measures taken. In other words, will the improving trend in the fiscal
situation continue and can the State withstand shocks like sudden expenditure spurt or an
unexpected revenue shortfall. It must be noted that even in the early and mid 1990s, there was a
perceptible improvement in the fiscal health of the State until the impact of the pay revision
which, sharply increased revenue and fiscal deficits. The improvements in the early 1990s in
the State happened despite declining share of central revenues due to its low buoyancy.
It is important to note that Karnataka does not strictly follow the central pay scales and
allowances and unlike many other States, the pay revision in 1997-98 was not as generous as
the central revision. It goes to the credit of the government and more particularly, the prudent
fiscal management practiced by the Finance department that the State has managed to minimise
the problems arising from the pay revision in the past by not succumbing to the populist
measure of following the central pay and allowances.
In keeping with the practice of undertaking pay revision based on its own Pay
Commission, the State government has appointed the Fifth Pay Commission. The Commission
has to decide on the extent to which the fiscal health of the State permits increases in pay and
allowances to the personnel without jeopardizing the targets set in the Fiscal Responsibility Act
(FRA) of the State. The Commission has to analyse and make judgment regarding the capacity

3
of the State to enhance pay and allowances while achieving fiscal consolidation and ensuring
allocative and technical efficiency in public spending. The Pay Commission has referred the
issue of the carrying capacity of the State to undertake pay revision to the National Institute of
Public Finance and Policy.
This study would examine the fiscal capacity of the State Government to undertake pay
revision in the state based on realistic assumptions on revenue growth, central transfers to the
State and medium term targets set by the FRA. In Section II, we give an overview of the fiscal
situation of the State. In section III and IV, we undertake an analysis of the revenue and
expenditure profile of the State and the growth of salary expenditure. A detailed analysis of the
salary expenditure and incidence of it on revenue budget of the State is also discussed in
section IV. We develop various alternative scenarios of hike in salary expenditures in Section
V to understand the possible impact of this hike on State’s fiscal situation. Section VI,
discusses the Medium Term Fiscal Plan (MTFP) of the State and develop the alternative fiscal
scenarios based on assumptions on salary hike and proposed MTFP targets. Section VII sums
up the findings and draws conclusions.
II. An Overview of Karnataka State Finances
An overview of the State finances of Karnataka is given in Table 1. It is seen that in
1993-94, the State government had generated a revenue surplus of 0.3 per cent of GSDP.
However in subsequent years, the fiscal health of the State steadily deteriorated and by 2001-
02, the State had all time high revenue deficit of 3 per cent of GSDP2. During this period, the
fiscal deficit to GSDP ratio increased from 3.1 to as high as 5.4 per cent. The State also
continued to have large primary deficits during this period, which implies that the prevailing
budgetary stance of the State government had added to State’s debt stock. The obvious
outcome of such a fiscal imbalance was a steady increase in the outstanding debt stock. The
increase in the outstanding debt to GSDP ratio was from 17.6 per cent in 1993-94 to 27.6 per
cent in 2003-04. However, the debt-GSDP ratio also showed a marginal decline during the last
2 During ten year period beginning the mid 1980’s, there was a slow but steady deterioration in the revenue
deficits of the States. Starting in 1997-98, however, this steady decline turned into a sharp deterioration (Finance
Department, 2005, p 2).

4
two years. If we look at the consolidated public sector deficits including the power sector
deficits vis-à-vis, the Government sector fiscal deficits, the divergence between them is
declining over the years and by the end of 2003-04 (RE) both were of almost equal magnitude
at around 4.2 per cent of GSDP (Figure 1).
Table 1: State Finance of Karnataka: An Overview
(percent to GSDP)
1993-94 1997-98 1998-99 1999-00 2000-01 2001-02 2002-03 2003-04 2004-05 2005-06
RE
2006-07
BE
Revenues 14.8 13.9 12.3 13.0 13.6 14.0 13.2 14.6 16.7 16.4 17.9
Own Revenues 10.5 9.9 9.1 9.3 9.7 10.0 9.5 10.7 12.6 12.5 12.9
Own Tax Revenues 9.3 8.8 7.9 8.2 8.6 9.0 8.7 9.5 10.8 11.7 12.1
Own Non Tax Revenues 1.2 1.1 1.2 1.1 1.0 1.0 0.8 1.2 1.8 0.8 0.9
Central Transfers 4.3 4.0 3.2 3.7 3.9 4.0 3.7 3.9 4.1 3.9 5.0
Share in Central Taxes 2.5 3.0 2.2 2.2 2.5 2.4 2.3 2.4 2.6 2.3 2.5
Grants 1.9 1.0 1.0 1.5 1.5 1.6 1.4 1.5 1.4 1.6 2.5
Expenditures 17.9 16.2 15.8 17.5 17.6 19.4 17.6 18.0 19.1 19.3 20.7
Revenue Expenditure 14.6 14.3 13.7 15.5 15.4 17.0 15.4 15.0 15.6 15.7 17.1
Interest Payment 1.7 1.9 1.8 2.1 2.3 2.5 2.7 2.8 2.6 2.3 2.3
Pension 1.1 1.2 1.2 1.7 1.5 1.5 1.6 1.4 1.5 1.4 1.4
Salary 4.7 4.6 4.3 4.8 4.4 4.6 4.1 4.0 3.6 3.5 3.8
Capital Expenditure 3.3 1.8 2.2 2.1 2.3 2.4 2.2 3.0 3.5 3.6 3.6
Capital Outlay 2.9 1.7 2.0 1.9 1.9 1.9 2.4 2.3 3.1 3.4 3.5
Net Lending 0.4 0.2 0.2 0.2 0.4 0.4 -0.3 0.7 0.4 0.2 0.1
Revenue Deficit -0.3 0.4 1.4 2.4 1.8 3.0 2.2 0.4 -1.1 -0.7 -0.8
Fiscal Deficit 3.1 2.2 3.5 4.5 4.0 5.4 4.4 3.4 2.4 2.8 2.8
Primary Deficit 1.3 0.3 1.7 2.4 1.8 2.9 1.7 0.6 -0.1 0.6 0.5
Outstanding Debt 17.6 17.7 17.5 19.7 21.2 24.9 26.2 27.6 31.4 30.7 30.3
Source (Basic Data): Finance Accounts and Karnataka Budget 2005-06
Figure 1: Fiscal Deficit and Consolidated Fiscal Deficit to GSDP Ratio:
A Comparison
0.00
1.00
2.00
3.00
4.00
5.00
6.00
7.00
8.00
1999-00(A/C) 2000-01(A/C) 2001-02(A/C) 2002-03(A/C) 2003-04(RE)
Years
Per
cen
t
FD Consld. FD (including power)

5
What explains the observed trend in fiscal imbalance can be understood from the
disaggregated profile of revenues and expenditures. The revenue profile of the State showed a
decline in the aggregate revenue-GSDP ratio from 14.8 in 1993-94 to 13.2 per cent in 2002-03.
Though there was significant improvement in revenue effort in subsequent years, the decline in
revenue effort during the nineties was particularly due to a marginal decline in both the non-tax
revenues as well as the central transfers. During this period own tax revenues remained
stagnant at around 8.2 per cent of GSDP. It has been highlighted that stagnant revenue effort
during the 1990’s was due to the insufficient tax effort and erosion of tax base due to the
granting of tax incentives to the industries (Finance Department, 2005, p 2). The improvement
in the revenue performance in recent years is particularly due to the significant revenue gain
out of own tax revenues. This may be attributed to the various revenue reform measures
initiated at the State level.
However, when we look at the expenditure side, increase in the revenue expenditure
remained unabated while the capital expenditure declined between 1993-94 and 2001-02.
During this period, interest payment and pension also has increased in relation to GSDP.
Increase in interest payment was due to the increase in debt stock and also due to the increase
in the average cost of debt. However some compression of revenue expenditure is observed in
later years with a corresponding increase in the capital expenditure. The capital expenditure as
a percentage of GSDP increased from 2.1 per cent in 1999-00 to 3.6 percent in 2005-06. One of
the principal reasons for the increase in revenue expenditure is attributed to the uncontrolled
recruitment and revision of salaries by the State Governments consequent to the Union
Government implementing Fifth Pay Commission award for its employees (Finance
Department, 2005, p 2). However as evident from the table 1, the aggregate salary expenditure
as a percentage of State GSDP did not show a sharp increase over the years mainly due to the
fact that the State government did not adopt central pay scales and allowances. Though it
declined from 4.7 to 4.3 per cent of GSDP between 1993-94 and 1998-99 it increased to 4.8 per
cent of GSDP in the year 1999-2000. Thereafter it started declining gradually, particularly due
to the steady decline in the growth of employment in recent years (See Section III). In 2005-06,
salary expenditure to GSDP ratio is estimated to be 3.5 per cent. Thus, if we look at it inter-
6
temporally, the salary expenditure to GSDP ratio declined by 1.2 percent during the period,
1993-94 to 2005-06.
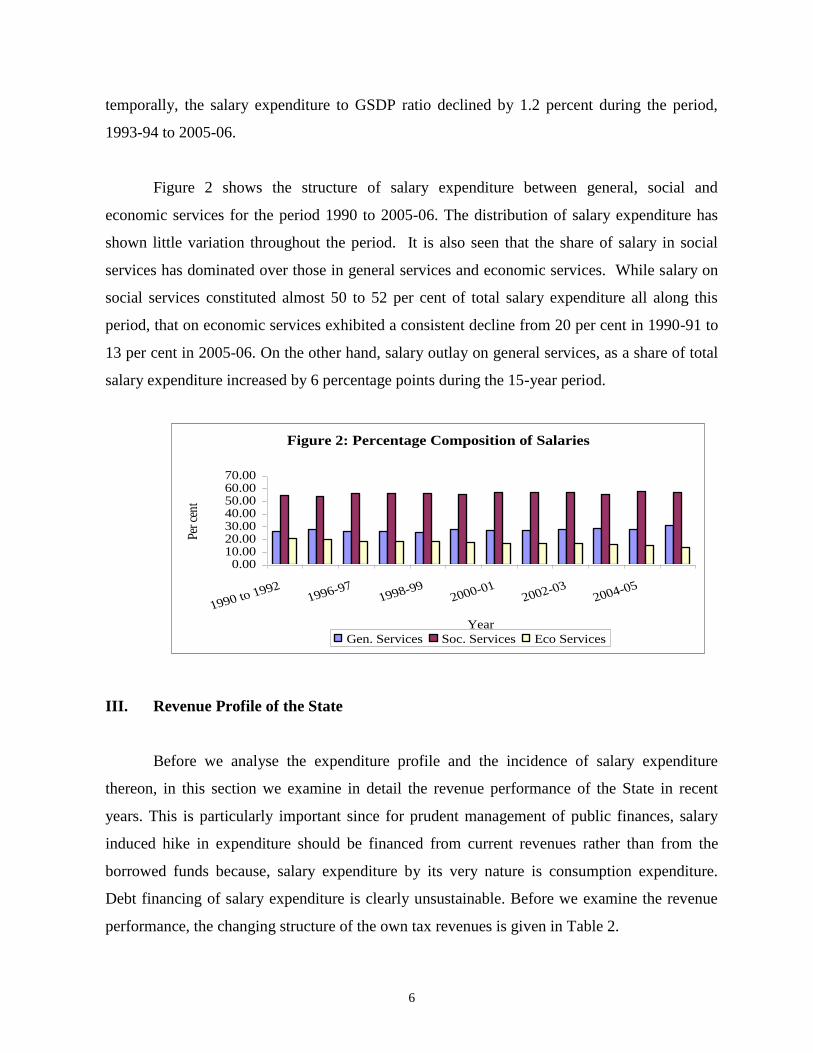
Figure 2 shows the structure of salary expenditure between general, social and
economic services for the period 1990 to 2005-06. The distribution of salary expenditure has
shown little variation throughout the period. It is also seen that the share of salary in social
services has dominated over those in general services and economic services. While salary on
social services constituted almost 50 to 52 per cent of total salary expenditure all along this
period, that on economic services exhibited a consistent decline from 20 per cent in 1990-91 to
13 per cent in 2005-06. On the other hand, salary outlay on general services, as a share of total
salary expenditure increased by 6 percentage points during the 15-year period.
III. Revenue Profile of the State
Before we analyse the expenditure profile and the incidence of salary expenditure
thereon, in this section we examine in detail the revenue performance of the State in recent
years. This is particularly important since for prudent management of public finances, salary
induced hike in expenditure should be financed from current revenues rather than from the
borrowed funds because, salary expenditure by its very nature is consumption expenditure.
Debt financing of salary expenditure is clearly unsustainable. Before we examine the revenue
performance, the changing structure of the own tax revenues is given in Table 2.
Figure 2: Percentage Composition of Salaries
0.0010.0020.0030.0040.0050.0060.0070.00
1990 to 19921996-97
1998-992000-01
2002-032004-05
Year
Per c
ent
Gen. Services Soc. Services Eco Services

7
As is well known, like in other States in India, the composition of own tax revenues is
dominated by the sales tax.3. The next major revenue source is State excise duties. Other
revenues of the State come from taxes on vehicle, stamp duties and registration fees and other
minor taxes. Although, the structure of taxes itself does not say much on the revenue
performance of a particular State, it gives a fair idea of the taxes that are having higher weights
in the total tax kitty. It is necessary to note that share of sales tax in total tax revenues of
Karnataka declined by 4.5 percent along with an increase of 4.9 percent in the share of stamp
duty and registration fee in the total tax revenues4 between 1993-94 and 2005-06.
Table 2: Composition of States' Own Tax Revenues (Per cent)
1993-94 1997-98 1999-00 2000-01 2001-02 2002-03 2003-04 2004-05 2005-06
RE
2006-07
BE
Own Tax Revenues 100.0 100.0 100.0 100.0 100.0 100.0 100.0 100 100 100
Sales Tax 59.8 59.7 60.5 59.6 53.5 52.4 52.9 54.1 55.3 55.2
State Excise Duties 16.8 13.5 15.7 16.8 20.1 20.1 18.6 17.5 17.2 18.0
Taxes on Vehicles 6.8 6.9 5.8 5.5 7.2 6.5 6.4 6.1 5.9 5.7
Stamp Duty Fees 6.3 9.5 7.3 7.1 8.7 10.7 10.8 10.9 11.2 11.5
Other Taxes 10.4 10.4 10.7 11.0 10.5 10.4 11.4 11.3 10.4 9.6
Source (Basic Data): http://fincomindia.nic.in/st_fprof_data/st_kar.pdf and Karnataka Budget 2005-06
If we look at the own tax revenue growth (Table 3), it has been particularly high during
2003-04 to 2005-06. The average rate of growth of own tax revenues was around 23 per cent
per annum during this period. This increase in own tax revenue growth was particularly due to
the higher buoyancy of sales tax, motor vehicle tax and stamp duty and registration fees.
Table 3: Growth Rate of Tax Revenues
1994-95 1997-98 1999-00 2000-01 2001-02 2002-03 2003-04 2004-05 2005-06
RE
2006-07
BE
State's Own Tax Revenues 12.5 11.2 11.5 16.8 9.0 6.0 20.4 27.9 21.4 15.5
Sales Tax 10.0 9.1 9.8 15.0 -2.2 3.9 21.5 30.8 24.1 15.2
State Excise Duties 11.6 2.3 20.9 25.3 29.8 5.9 11.4 20.2 19.3 21.3
Taxes on Vehicles 12.0 36.4 16.0 11.8 42.0 -5.1 18.4 22.9 17.8 11.0
Stamp Duty & Reg. Fees 54.7 25.0 3.2 12.8 34.0 30.4 21.5 29.8 23.9 18.6
Other Taxes 3.0 10.9 12.7 19.5 4.7 4.0 32.4 27.4 11.1 7.3
Source (Basic Data): http://fincomindia.nic.in/st_fprof_data/st_kar.pdf and Karnataka Budget 2005-06.
3 Sales tax has been replaced by the value-added tax in the year 2005-06.
4 Radical reforms initiated in Stamps and Registration, targeted to correct the existing situation of high tax rates
and undervalued tax base, have more than doubled the realisation in last three years. Revision of market value of
properties has been carried out to bring the guidance values in line with the actual market rates. After two years the
Central Valuation Committee has become functional and an exhaustive database of the properties is prepared
during the process of revision. But it is felt that even now the guidance values are low as compared to the market
rates. It is expected that only after several rounds of revision would the guidance values come at par with the
market rates (Finance Department, 2005, p 21)
8
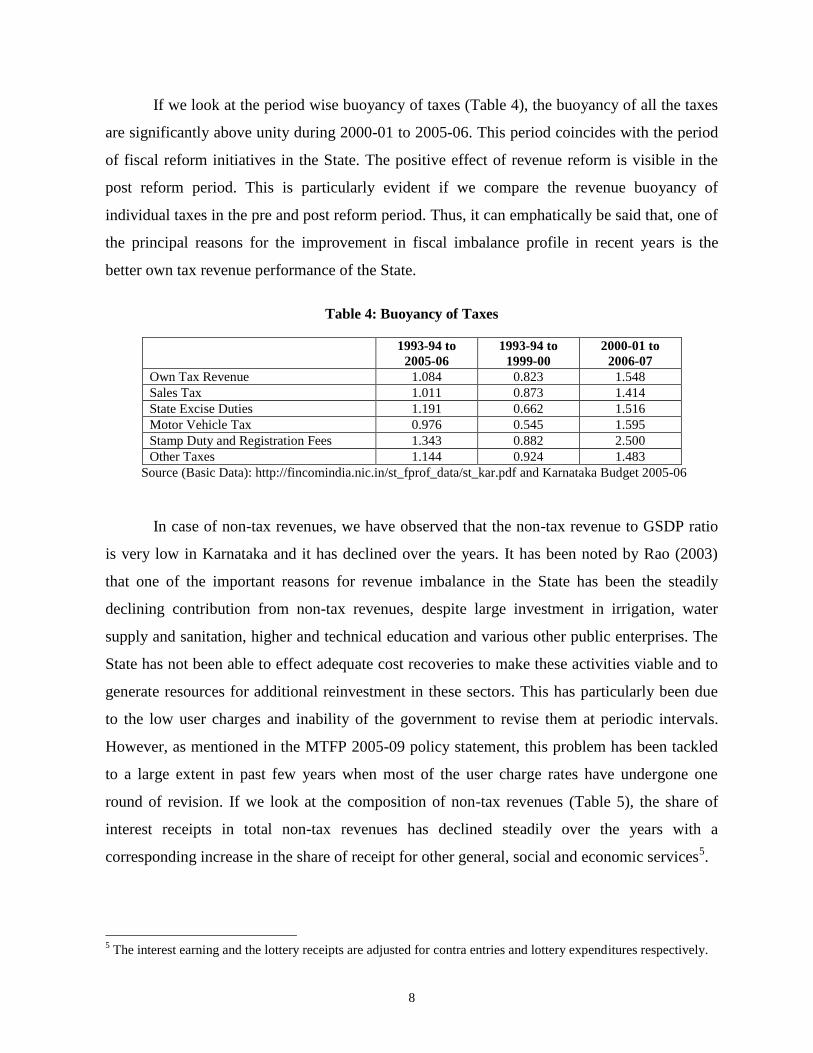
If we look at the period wise buoyancy of taxes (Table 4), the buoyancy of all the taxes
are significantly above unity during 2000-01 to 2005-06. This period coincides with the period
of fiscal reform initiatives in the State. The positive effect of revenue reform is visible in the
post reform period. This is particularly evident if we compare the revenue buoyancy of
individual taxes in the pre and post reform period. Thus, it can emphatically be said that, one of
the principal reasons for the improvement in fiscal imbalance profile in recent years is the
better own tax revenue performance of the State.
Table 4: Buoyancy of Taxes
1993-94 to
2005-06
1993-94 to
1999-00
2000-01 to
2006-07
Own Tax Revenue 1.084 0.823 1.548
Sales Tax 1.011 0.873 1.414
State Excise Duties 1.191 0.662 1.516
Motor Vehicle Tax 0.976 0.545 1.595
Stamp Duty and Registration Fees 1.343 0.882 2.500
Other Taxes 1.144 0.924 1.483
Source (Basic Data): http://fincomindia.nic.in/st_fprof_data/st_kar.pdf and Karnataka Budget 2005-06
In case of non-tax revenues, we have observed that the non-tax revenue to GSDP ratio
is very low in Karnataka and it has declined over the years. It has been noted by Rao (2003)
that one of the important reasons for revenue imbalance in the State has been the steadily
declining contribution from non-tax revenues, despite large investment in irrigation, water
supply and sanitation, higher and technical education and various other public enterprises. The
State has not been able to effect adequate cost recoveries to make these activities viable and to
generate resources for additional reinvestment in these sectors. This has particularly been due
to the low user charges and inability of the government to revise them at periodic intervals.
However, as mentioned in the MTFP 2005-09 policy statement, this problem has been tackled
to a large extent in past few years when most of the user charge rates have undergone one
round of revision. If we look at the composition of non-tax revenues (Table 5), the share of
interest receipts in total non-tax revenues has declined steadily over the years with a
corresponding increase in the share of receipt for other general, social and economic services5.
5 The interest earning and the lottery receipts are adjusted for contra entries and lottery expenditures respectively.

9
Table 5: Composition of States' Own Non-Tax Revenues
1993-94 1997-98 1999-00 2000-01 2001-02 2002-03 2003-04 2004-05
RE
2005-06
BE
2006-07
BE
Own Non Tax Revenues 100.0 100.0 100.0 100.0 100.0 100.0 100.0 100.0 100.0 100.0
Interest Receipts 47.2 45.8 51.4 44.2 13.4 3.0 7.2 5.3 6.5 10.2
Dividends 0.6 0.4 0.4 0.2 0.5 1.3 1.1 0.6 1.0 1.0
Royalty * 5.8 9.9 7.5 8.4 13.8 13.7 14.3 10.6 16.2 19.9
Forestry and Wild life 12.8 9.3 6.1 6.6 9.5 8.9 11.7 6.2 8.7 9.7
Irrigation(Major, Medium
& Minor)
2.0 1.6 1.1 1.3 2.2 2.1 1.0 0.6 2.6 2.7
Lottery( Net) 0.7 0.2 0.2 0.3 -0.2 0.6 7.3 3.5 -9.3 6.9
Other General Services 6.6 8.4 6.2 9.6 13.0 18.4 16.9 9.9 34.9 6.8
Other Social Services 7.4 13.1 6.9 7.5 13.5 16.2 8.0 5.4 10.9 7.6
Other Economic Services 16.9 11.3 20.2 21.9 34.3 35.7 32.5 58.0 28.4 35.3
Source (Basic Data): http://fincomindia.nic.in/st_fprof_data/st_kar.pdf and Karnataka Budget 2005-06
*Petroleum, Coal & Lignite and Metallurgical industries
IV. Expenditure Profile of the State
Having discussed the revenue side of the State budget, in this section we undertake a
disaggregated analysis of the State Government expenditure with a focus on growth and
incidence of salary expenditure on the revenue budget of the State. The structure of government
expenditure presented in Table 6 reveals that the share of revenue expenditure has increased
from 78.9 to 82.2 per cent between 1993-94 and 2005-06 primarily due to the increase in the
non-plan revenue expenditure driven by interest payment, pension and salaries. The interest
payment component of non-plan revenue expenditure increased sharply from 9.1 per cent in
1993-94 to 15.5 per cent in 2003-04 before showing signs of decline. During the same period,
the share of capital expenditure in total expenditure has declined from 21 to 18 per cent. Within
the revenue expenditure, the share of plan revenue expenditure remained as low as around 18
per cent and showed a marginal decline during this period. It may also be noted that aggregate
expenditure elasticity (Table 7) during the post fiscal reform period was higher than the period
before. However if we look at the primary expenditure excluding pension, the elasticity has
been 1.279 during the post reform period compared to 0.848 in the pre reform period. In other
words, the expenditure buoyancy for discretionary government expenditure has increased
during the post fiscal reform period in Karnataka. This is primarily due to the increase in
capital expenditure to GSDP ratio during the post reform period. This is also a sign of greater

10
fiscal space, possibly may be attributed to the greater revenue mobilization in the post fiscal
reform period.
Table 6: Structure of Government Expenditure (Per cent)
1993-94 1997-98 1999-00 2000-01 2001-02 2002-03 2003-04 2004-05 2005-06
RE
2006-07
BE
Revenue Expenditure 81.4 88.7 88.3 87.2 87.8 87.5 83.3 81.5 81.5 82.5
General Services 25.7 30.0 31.7 30.4 29.2 32.1 32.0 28.5 27.0 27.3
Interest Payment 9.8 11.8 12.1 12.9 12.7 15.6 15.6 13.4 11.9 11.3
Pension 5.9 7.2 9.7 8.8 7.9 9.1 8.0 7.6 7.2 6.9
Social Services 32.3 35.1 32.9 33.2 30.4 30.0 29.2 27.2 28.3 29.1
Education 16.9 18.0 17.6 18.5 16.2 16.5 15.4 15.1 14.9 13.7
Medical and Public Health 5.3 5.3 5.2 4.9 4.7 4.5 4.0 3.7 3.6 3.5
Economic Services 21.7 21.3 21.1 20.8 25.5 22.7 19.5 23.0 22.7 22.2
Compensation and Assignment to LBs
1.7 2.3 2.5 2.9 2.7 2.7 2.6 2.8 3.6 4.0
Capital Expenditure 18.6 11.3 11.7 12.8 12.2 12.5 16.7 18.5 18.5 17.5
Capital Outlay 16.2 10.3 10.7 10.6 9.9 13.9 12.7 16.5 17.5 17.0
Net Lending 2.5 1.0 1.0 2.2 2.3 -1.4 4.0 2.0 0.9 0.5
total Expenditure 100.0 100.0 100.0 100.0 100.0 100.0 100.0 100.0 100.0 100.0
Source (Basic Data): http://fincomindia.nic.in/st_fprof_data/st_kar.pdf and Karnataka Budget 2005-06
Table 7: Expenditure Elasticity: Various Components
1993-94 to
2005-06
1993-94 to
1999-00
2000-01 to
2005-06
Total Expenditure 1.098 0.922 1.194
Revenue Expenditure 1.084 1.003 1.058
Capital Expenditure 1.174 0.455 1.957
Primary Expenditure Excluding Pension 1.054 0.848 1.279
Primary Revenue Expenditure Excluding Pension 1.026 0.934 1.120
Source (Basic Data): Finance Accounts and Karnataka Budget 2005-06
In order to find out the impact of salary and other committed expenditures on the
revenue budgets of the State, we have estimated the share of committed expenditures in total
revenues and revenue expenditures of the State of Karnataka for the period between 1970-71
and 2005-06 based on the data obtained from the Fifth Pay Commission of Karnataka on salary
expenditure. The committed expenditure is defined as the spending on account of interest
payment, wages and salaries and pension which are largely beyond the control of the
government to compress during the budget year. This is particularly important, as the fiscal
space that is available to the State for a salary hike, one needs to examine the resources that
have to be set aside to meet commitments on interest payment, salary and pension from the
revenue budget of the State. As can be seen from the figure 3, the share of committed

11
expenditures as a percentage of revenue receipts and revenue expenditure has declined sharply
during the last couple of years after reaching an all time high of more than 65 per cent of
revenue receipts of the State during 1999-00. It is interesting to note that up to 1984-85, the
share of committed expenditure in revenue receipts was lower than the revenue expenditures
and it remained below 40 per cent of the total revenue receipts. However, the incidence of
committed expenditure increased sharply thereafter and reached its peak at the end of the
decade of 1990’s driven by the increase in salary expenditure and interest payment. As
mentioned earlier, increase in interest payment was not due to the large debt overhang but also
due to the higher cost of debt.
As our focus is the salary component of government expenditure, we examine how the
growth in government sector employment has contributed to salary expenditure. We have
presented average annual growth rates of employment and salary expenditure for ten year
periods, and the share of the latter on revenue receipts and revenue expenditure of the State of
Karnataka (Table 8) for corresponding period. It is evident that the rate of growth of
employment in government was the lowest during the nineties at 2.93 per cent compared to
3.55 and 3.57 during the seventies and the eighties respectively. Between 2000-01 and 2005-
06, yearly growth of employment was negative in all the years, except for 2002-03 and 2005-
06. If we look at the growth of salary expenditure also, it has particularly been lower during
Figure 3: Incidence of Committed Expenditures on Revenue
Budget of the State: 1970-71 to 2005-06
30.00
35.00
40.00
45.00
50.00
55.00
60.00
65.00
1970
-71
1972
-73
1974
-75
1976
-77
1978
-79
1980
-81
1982
-83
1984
-85
1986
-87
1988
-89
1990
-91
1992
-93
1994
-95
1996
-97
1998
-99
2000
-01
2002
-03
2004
-05R
E
(Per
cen
t)
Rev. Rec. Rev. Exp.

12
this period. If we look at the decadal rate of growth of salary expenditure, the growth was
particularly high during the eighties at 18.49 per cent compared to 14.69 per cent during the
nineties. Despite higher per-employee salary expenditure during the 1990’s, decline in the
growth of salary expenditure during this period can be attributed to the lower growth of
employment during the 1990’s.
Table 8: Growth of Employment and Salary (Per cent)
Annual
Growth of
Employment
Annual
Growth of
Salary
Expenditure
Salary as a percentage of
Revenue
Receipts
Revenue
Expenditure
1970-71 to 1979-80 3.55 13.90 28.91 31.41
1980-81 to 1989-90 3.57 18.49 31.65 31.48
1990-91 to 1999-00 2.93 14.69 32.04 30.19
2000-01 -1.94 1.19 31.24 27.75
2001-02 -0.27 7.45 32.47 26.74
2002-03 0.71 -0.69 30.56 26.26
2003-04 -0.07 7.73 25.64 25.01
2004-05 RE -1.65 3.89 21.84 22.29
2005-06 BE 2.28 11.56 21.11 21.75
1970-71 to 2005-06 2.70 14.63 28.67 27.27
Source: Karnataka Fifth Pay Commission
In order to have an idea of the employment and salary profile of Karnataka vis-à-vis
other States, we have used the data given in the Twelfth Finance Commission Report on salary
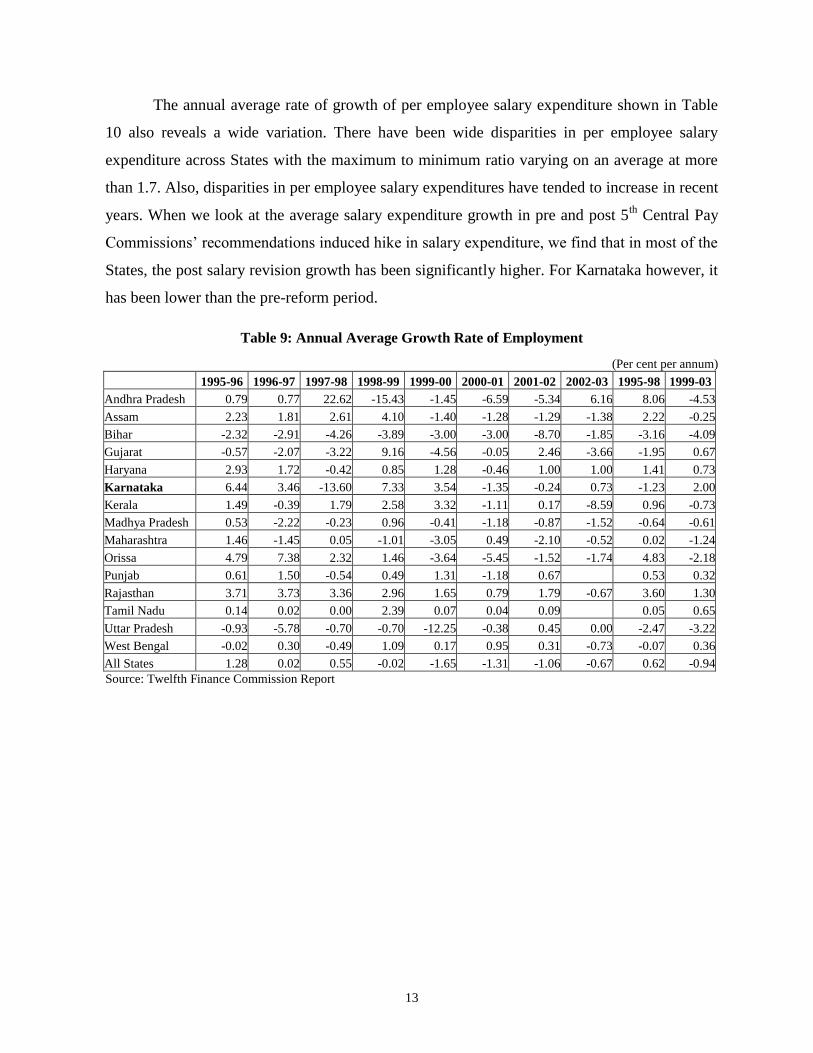
expenditure and employee profiles across States. It is evident from the Table 9, that there are
wide variations across States in the growth of employment during the period from 1993-94 to
2002-03. Secondly, if we look at the average growth of employment across States prior to and
after the implementation of the Central Fifth Pay Commission’s recommendation, we find that
in the later years, i.e., between 1999-00 and 2002-03, the average rate of growth of employment
was negative in many States, particularly in Andhra Pradesh, Bihar, Orissa and Uttar Pradesh,
the rates of growth of employment were –4.53, -4.09, -2.18 and –3.22 per cent respectively.
However in Karnataka, the rates of growth of employment during the same period was positive
at 2 per cent. The other States with positive rates of growth of employment during this period
were Gujarat, Haryana, Punjab, Rajasthan, Tamil Nadu and West Bengal.
13
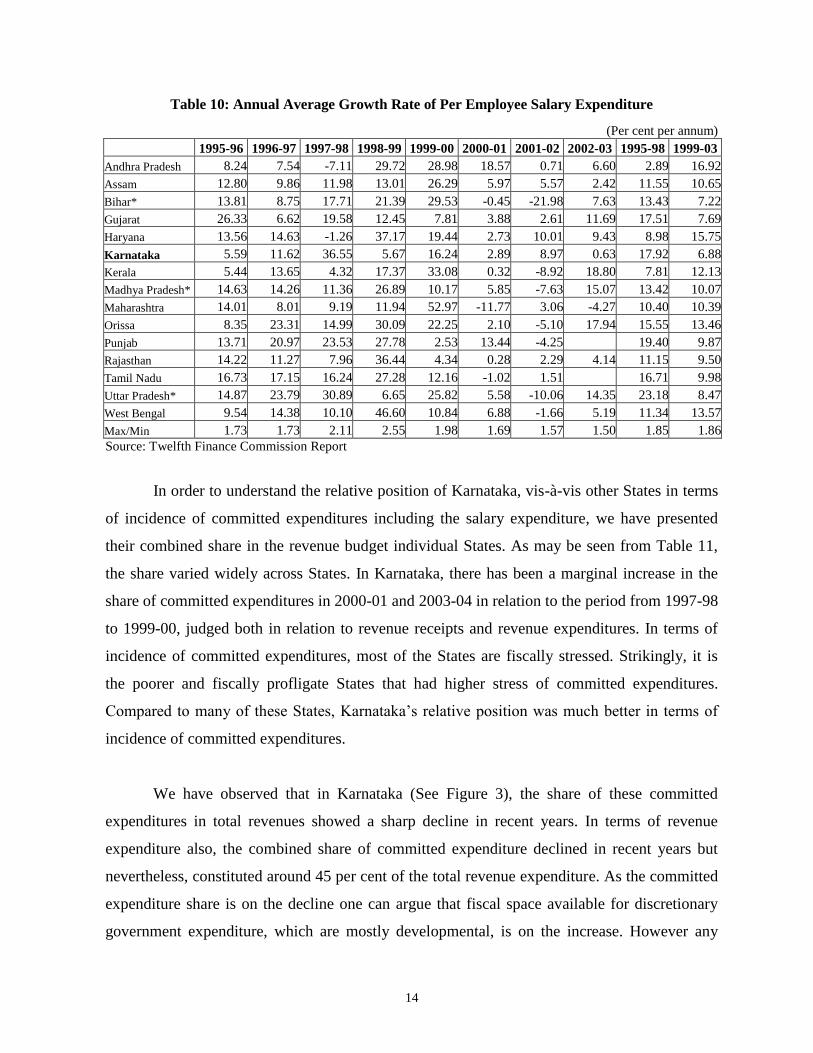
The annual average rate of growth of per employee salary expenditure shown in Table
10 also reveals a wide variation. There have been wide disparities in per employee salary
expenditure across States with the maximum to minimum ratio varying on an average at more
than 1.7. Also, disparities in per employee salary expenditures have tended to increase in recent
years. When we look at the average salary expenditure growth in pre and post 5th
Central Pay
Commissions’ recommendations induced hike in salary expenditure, we find that in most of the
States, the post salary revision growth has been significantly higher. For Karnataka however, it
has been lower than the pre-reform period.
Table 9: Annual Average Growth Rate of Employment
(Per cent per annum)
1995-96 1996-97 1997-98 1998-99 1999-00 2000-01 2001-02 2002-03 1995-98 1999-03
Andhra Pradesh 0.79 0.77 22.62 -15.43 -1.45 -6.59 -5.34 6.16 8.06 -4.53
Assam 2.23 1.81 2.61 4.10 -1.40 -1.28 -1.29 -1.38 2.22 -0.25
Bihar -2.32 -2.91 -4.26 -3.89 -3.00 -3.00 -8.70 -1.85 -3.16 -4.09
Gujarat -0.57 -2.07 -3.22 9.16 -4.56 -0.05 2.46 -3.66 -1.95 0.67
Haryana 2.93 1.72 -0.42 0.85 1.28 -0.46 1.00 1.00 1.41 0.73
Karnataka 6.44 3.46 -13.60 7.33 3.54 -1.35 -0.24 0.73 -1.23 2.00
Kerala 1.49 -0.39 1.79 2.58 3.32 -1.11 0.17 -8.59 0.96 -0.73
Madhya Pradesh 0.53 -2.22 -0.23 0.96 -0.41 -1.18 -0.87 -1.52 -0.64 -0.61
Maharashtra 1.46 -1.45 0.05 -1.01 -3.05 0.49 -2.10 -0.52 0.02 -1.24
Orissa 4.79 7.38 2.32 1.46 -3.64 -5.45 -1.52 -1.74 4.83 -2.18
Punjab 0.61 1.50 -0.54 0.49 1.31 -1.18 0.67 0.53 0.32
Rajasthan 3.71 3.73 3.36 2.96 1.65 0.79 1.79 -0.67 3.60 1.30
Tamil Nadu 0.14 0.02 0.00 2.39 0.07 0.04 0.09 0.05 0.65
Uttar Pradesh -0.93 -5.78 -0.70 -0.70 -12.25 -0.38 0.45 0.00 -2.47 -3.22
West Bengal -0.02 0.30 -0.49 1.09 0.17 0.95 0.31 -0.73 -0.07 0.36
All States 1.28 0.02 0.55 -0.02 -1.65 -1.31 -1.06 -0.67 0.62 -0.94
Source: Twelfth Finance Commission Report
14
Table 10: Annual Average Growth Rate of Per Employee Salary Expenditure
(Per cent per annum)
1995-96 1996-97 1997-98 1998-99 1999-00 2000-01 2001-02 2002-03 1995-98 1999-03
Andhra Pradesh 8.24 7.54 -7.11 29.72 28.98 18.57 0.71 6.60 2.89 16.92
Assam 12.80 9.86 11.98 13.01 26.29 5.97 5.57 2.42 11.55 10.65
Bihar* 13.81 8.75 17.71 21.39 29.53 -0.45 -21.98 7.63 13.43 7.22
Gujarat 26.33 6.62 19.58 12.45 7.81 3.88 2.61 11.69 17.51 7.69
Haryana 13.56 14.63 -1.26 37.17 19.44 2.73 10.01 9.43 8.98 15.75
Karnataka 5.59 11.62 36.55 5.67 16.24 2.89 8.97 0.63 17.92 6.88
Kerala 5.44 13.65 4.32 17.37 33.08 0.32 -8.92 18.80 7.81 12.13
Madhya Pradesh* 14.63 14.26 11.36 26.89 10.17 5.85 -7.63 15.07 13.42 10.07
Maharashtra 14.01 8.01 9.19 11.94 52.97 -11.77 3.06 -4.27 10.40 10.39
Orissa 8.35 23.31 14.99 30.09 22.25 2.10 -5.10 17.94 15.55 13.46
Punjab 13.71 20.97 23.53 27.78 2.53 13.44 -4.25 19.40 9.87
Rajasthan 14.22 11.27 7.96 36.44 4.34 0.28 2.29 4.14 11.15 9.50
Tamil Nadu 16.73 17.15 16.24 27.28 12.16 -1.02 1.51 16.71 9.98
Uttar Pradesh* 14.87 23.79 30.89 6.65 25.82 5.58 -10.06 14.35 23.18 8.47
West Bengal 9.54 14.38 10.10 46.60 10.84 6.88 -1.66 5.19 11.34 13.57
Max/Min 1.73 1.73 2.11 2.55 1.98 1.69 1.57 1.50 1.85 1.86
Source: Twelfth Finance Commission Report
In order to understand the relative position of Karnataka, vis-à-vis other States in terms
of incidence of committed expenditures including the salary expenditure, we have presented
their combined share in the revenue budget individual States. As may be seen from Table 11,
the share varied widely across States. In Karnataka, there has been a marginal increase in the
share of committed expenditures in 2000-01 and 2003-04 in relation to the period from 1997-98
to 1999-00, judged both in relation to revenue receipts and revenue expenditures. In terms of
incidence of committed expenditures, most of the States are fiscally stressed. Strikingly, it is
the poorer and fiscally profligate States that had higher stress of committed expenditures.
Compared to many of these States, Karnataka’s relative position was much better in terms of
incidence of committed expenditures.
We have observed that in Karnataka (See Figure 3), the share of these committed
expenditures in total revenues showed a sharp decline in recent years. In terms of revenue
expenditure also, the combined share of committed expenditure declined in recent years but
nevertheless, constituted around 45 per cent of the total revenue expenditure. As the committed
expenditure share is on the decline one can argue that fiscal space available for discretionary
government expenditure, which are mostly developmental, is on the increase. However any

15
salary hike without a corresponding revenue growth would mean a shrinking of fiscal space for
developmental spending. At the same time one needs to appreciate the concern of salary hike
with a reasonable growth of employment under various sectors within the government. In the
next subsection we will examine in further details the scale wise employment and salary
expenditure growth of the State government and the scope for increase thereon.
Table 11: Incidence of Committed Expenditures on Revenue Budget:
An Interstate Comparison
(In Per cent)
1994-95 to 1996-97 1997-98 to 1999-00 2000-01 to 2003-04
Committed Expenditure as a Percentage of Revenue Receipt
Andhra Pradesh 61.38 62.37 65.82
Assam 76.70 87.08 86.63
Bihar 86.43 95.85 95.38
Gujarat 34.76 41.24 46.50
Haryana 63.44 78.43 79.72
Karnataka 52.21 60.69 63.05
Kerala 75.05 86.99 93.39
Madhya Pradesh 53.01 61.63 72.94
Maharashtra 61.86 75.55 82.82
Orissa 77.04 102.53 97.76
Punjab 80.85 105.25 104.84
Rajasthan 67.49 91.21 89.43
Tamil Nadu 62.17 79.14 81.04
Uttar Pradesh 75.12 92.07 84.75
West Bengal 82.99 119.00 122.38
Committed Expenditure as a percentage of Revenue Expenditure
Andhra Pradesh 53.09 56.55 57.96
Assam 75.04 83.26 76.84
Bihar 77.02 77.39 84.20
Gujarat 34.04 34.47 36.11
Haryana 55.86 63.48 72.13
Karnataka 50.57 54.67 55.37
Kerala 68.84 66.49 69.99
Madhya Pradesh 49.06 52.44 59.61
Maharashtra 59.60 65.12 65.15
Orissa 65.39 74.26 75.77
Punjab 68.44 77.24 75.56
Rajasthan 61.42 71.82 70.81
Tamil Nadu 58.77 65.46 68.52
Uttar Pradesh 63.84 67.48 63.33
West Bengal 70.04 75.56 78.15
Source: Twelfth Finance Commission Report

16
Structure of Employment and Scale
As evident from the Table 12, the government of Karnataka currently has 20 different
scales, apart from the all India scales of IAS/IPS and temporary employees on consolidated
pay. The mean basic salary varies from Rs. 3175 in the lowest scale of Group-D employees to
Rs. 16, 840 for highest scale of Group-A employees. As evident from the table, the bulk of the
employment is in Group- C.
Table 12: Pay Scales, Mean Basic Pay and Distribution of
Employees: 2005-06
Pay Scales
Mean Basic Pay
(In Rs)
Scalewise
Employee
Distribution
(In Per cent)
Group-D
2500-50-2700-75-3450-100-3850 3175 7.65
2600-50-2700-75-3450-100-4350 3475 4.39
Group-C
2775-75-3450-100-4450-125-4950 3863 2.36
3000-75-3450-100-4450-125-5450 4225 19.72
3300-75-3450-100-4450-125-5700-150-6300 4800 11.80
3850-100-4450-125-5700-150-7050 5450 11.06
4150-100-4450-125-5700-150-7200-200-7800 5975 7.58
4575-125-5700-150-7200-200-8400 6488 6.90
5200-125-5700-150-7200-200-8800-260-9580 7390 4.01
Group-B
5575-125-5700-150-7200-200-8800-260-10620 8098 3.45
6000-150-7200-200-8800-260-10880-320-11200 8600 3.11
6300-150-7200-200-8800-260-10880-320-11840 9070 4.12
Group-A
7400-200-8800-260-10880-320-13120 10260 1.95
8000-200-8800-260-10880-320-13440 10720 0.54
9580-260-10880-320-13440-380-14200 11890 4.71
10620-260-10880-320-13440-380-14960 12790 0.11
11520-320-13440-380-14960-440-15840 13680 0.01
12800-320-13440-380-14960-440-16720 14760 0.05
13820-380-14960-440-16720-500-17220 15520 0.04
14960-440-16720-500-18720 16840 0.16
All India Scales (IAS, IPS & IFS) 0 0.09
Other Scales if any 0 6.09
Local Candidates(Consolidates Pay) 0 0.10
Source: Karnataka Fifth Pay Commission
17
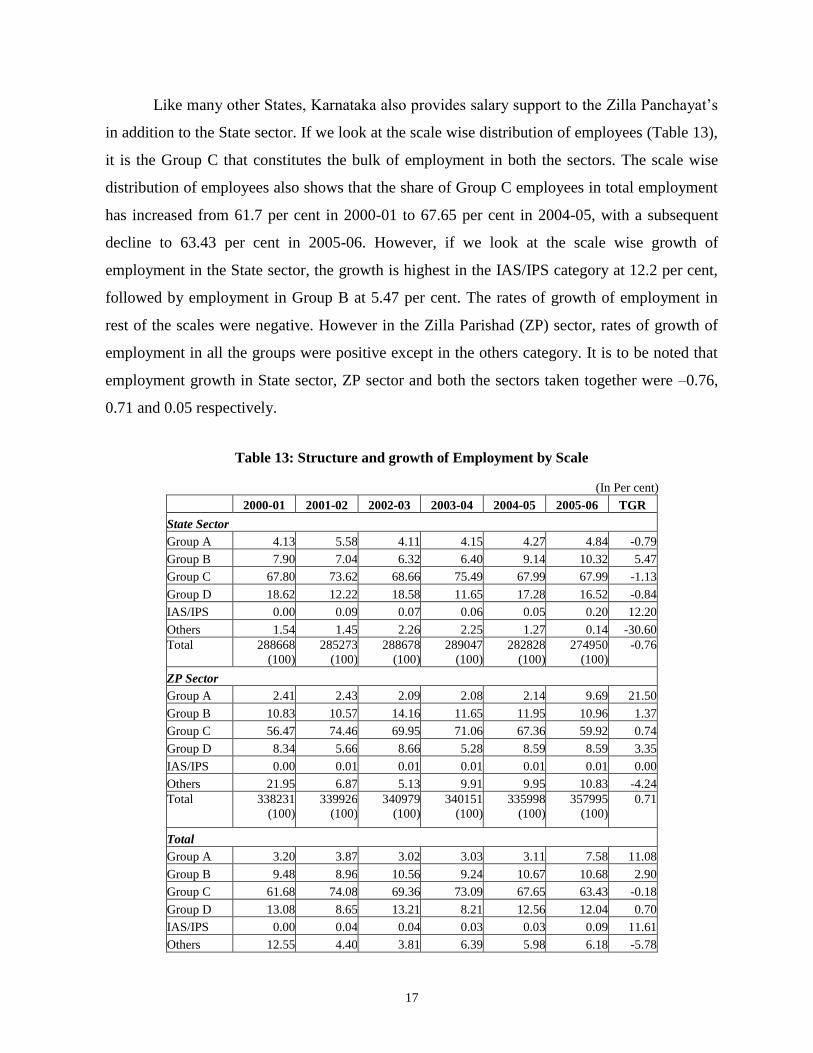
Like many other States, Karnataka also provides salary support to the Zilla Panchayat’s
in addition to the State sector. If we look at the scale wise distribution of employees (Table 13),
it is the Group C that constitutes the bulk of employment in both the sectors. The scale wise
distribution of employees also shows that the share of Group C employees in total employment
has increased from 61.7 per cent in 2000-01 to 67.65 per cent in 2004-05, with a subsequent
decline to 63.43 per cent in 2005-06. However, if we look at the scale wise growth of
employment in the State sector, the growth is highest in the IAS/IPS category at 12.2 per cent,
followed by employment in Group B at 5.47 per cent. The rates of growth of employment in
rest of the scales were negative. However in the Zilla Parishad (ZP) sector, rates of growth of
employment in all the groups were positive except in the others category. It is to be noted that
employment growth in State sector, ZP sector and both the sectors taken together were –0.76,
0.71 and 0.05 respectively.
Table 13: Structure and growth of Employment by Scale
(In Per cent)
2000-01 2001-02 2002-03 2003-04 2004-05 2005-06 TGR
State Sector
Group A 4.13 5.58 4.11 4.15 4.27 4.84 -0.79
Group B 7.90 7.04 6.32 6.40 9.14 10.32 5.47
Group C 67.80 73.62 68.66 75.49 67.99 67.99 -1.13
Group D 18.62 12.22 18.58 11.65 17.28 16.52 -0.84
IAS/IPS 0.00 0.09 0.07 0.06 0.05 0.20 12.20
Others 1.54 1.45 2.26 2.25 1.27 0.14 -30.60
Total 288668
(100)
285273
(100)
288678
(100)
289047
(100)
282828
(100)
274950
(100)
-0.76
ZP Sector
Group A 2.41 2.43 2.09 2.08 2.14 9.69 21.50
Group B 10.83 10.57 14.16 11.65 11.95 10.96 1.37
Group C 56.47 74.46 69.95 71.06 67.36 59.92 0.74
Group D 8.34 5.66 8.66 5.28 8.59 8.59 3.35
IAS/IPS 0.00 0.01 0.01 0.01 0.01 0.01 0.00
Others 21.95 6.87 5.13 9.91 9.95 10.83 -4.24
Total 338231
(100)
339926
(100)
340979
(100)
340151
(100)
335998
(100)
357995
(100)
0.71
Total
Group A 3.20 3.87 3.02 3.03 3.11 7.58 11.08
Group B 9.48 8.96 10.56 9.24 10.67 10.68 2.90
Group C 61.68 74.08 69.36 73.09 67.65 63.43 -0.18
Group D 13.08 8.65 13.21 8.21 12.56 12.04 0.70
IAS/IPS 0.00 0.04 0.04 0.03 0.03 0.09 11.61
Others 12.55 4.40 3.81 6.39 5.98 6.18 -5.78
18
Total 626899
(100)
625199
(100)
629657
(100)
629198
(100)
618826
(100)
632945
(100)
0.05
Source: Karnataka Fifth Pay Commission
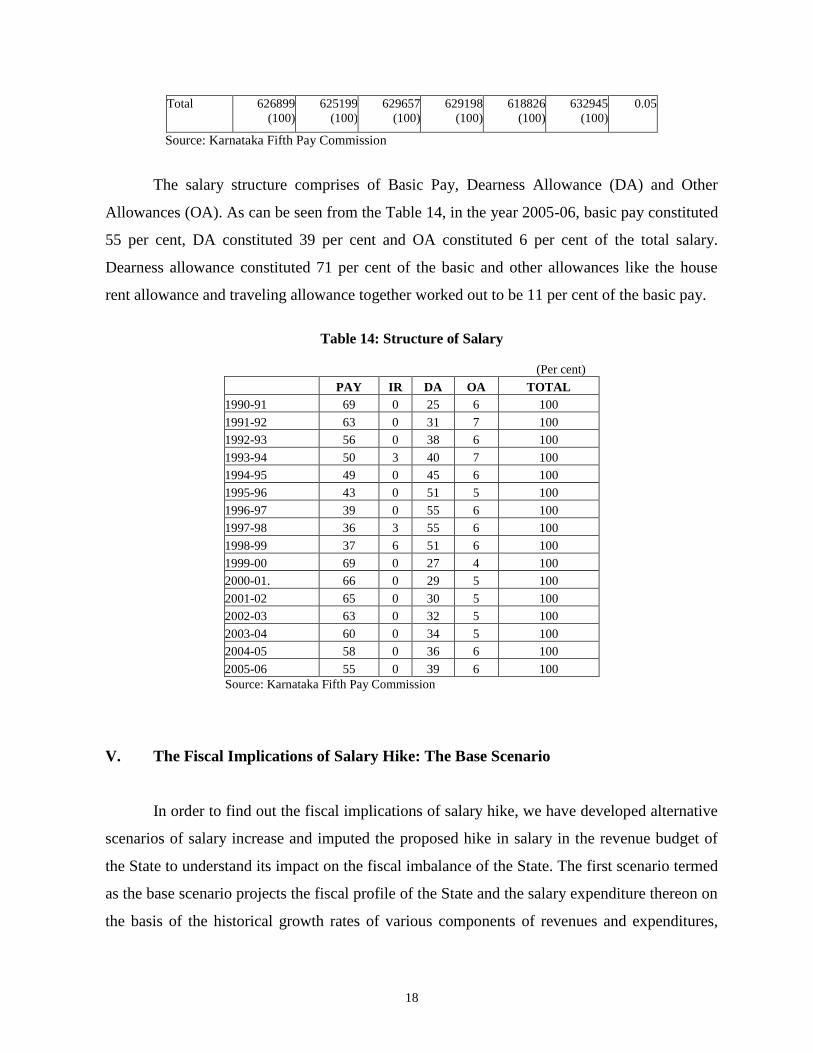
The salary structure comprises of Basic Pay, Dearness Allowance (DA) and Other
Allowances (OA). As can be seen from the Table 14, in the year 2005-06, basic pay constituted
55 per cent, DA constituted 39 per cent and OA constituted 6 per cent of the total salary.
Dearness allowance constituted 71 per cent of the basic and other allowances like the house
rent allowance and traveling allowance together worked out to be 11 per cent of the basic pay.
Table 14: Structure of Salary
(Per cent)
PAY IR DA OA TOTAL
1990-91 69 0 25 6 100
1991-92 63 0 31 7 100
1992-93 56 0 38 6 100
1993-94 50 3 40 7 100
1994-95 49 0 45 6 100
1995-96 43 0 51 5 100
1996-97 39 0 55 6 100
1997-98 36 3 55 6 100
1998-99 37 6 51 6 100
1999-00 69 0 27 4 100
2000-01. 66 0 29 5 100
2001-02 65 0 30 5 100
2002-03 63 0 32 5 100
2003-04 60 0 34 5 100
2004-05 58 0 36 6 100
2005-06 55 0 39 6 100
Source: Karnataka Fifth Pay Commission
V. The Fiscal Implications of Salary Hike: The Base Scenario
In order to find out the fiscal implications of salary hike, we have developed alternative
scenarios of salary increase and imputed the proposed hike in salary in the revenue budget of
the State to understand its impact on the fiscal imbalance of the State. The first scenario termed
as the base scenario projects the fiscal profile of the State and the salary expenditure thereon on
the basis of the historical growth rates of various components of revenues and expenditures,

19
including the salary expenditure. All the growth rates and the buoyancy estimates used in this
exercise are based on the data for the period from 1993-94 to 2005-06.
The revenue side projection in this scenario is developed on the basis of historical
buoyancies of major taxes and own non-tax revenues. The tax devolution and grants are
projected to grow at the historical rate of 10.8 and 13.5 per cent per annum respectively. The
historical trend rate of growth of aggregate salary expenditure was 9.91 per cent, though there
were inter-sectoral variations. For example, the growth of salary expenditure was 11.21 per
cent in the education sector and also 10.63 per cent in general services. In other sectors, the
growth has been around 9 per cent except in the case of economic services where the growth in
salary expenditure was 8.26 per cent during this period.
The historical buoyancy of taxes presented in Table 4 is used for own tax revenue
projections. Interest payment on the stock of debt is assumed to be charged at the base year
effective rate of interest of 11.01 per cent. Pension payment is expected to grow at the rate of
15.83 per cent per annum, the historical rate of pension growth observed between 1993-94 and
2005-06. Non-salary component of social and economic services is assumed to grow at their
historical rates.
Based on the assumptions delineated above, we have arrived at a fiscal profile of the
State for the period between 2006-07 and 2015-16. Ten-year projections of fiscal profile
seemed to be appropriate, given the periodicity of the appointment of Pay Commissions. Also a
reasonably long fiscal profile would help in bringing out the long run fiscal implications of a
salary-induced hike in revenue expenditure.
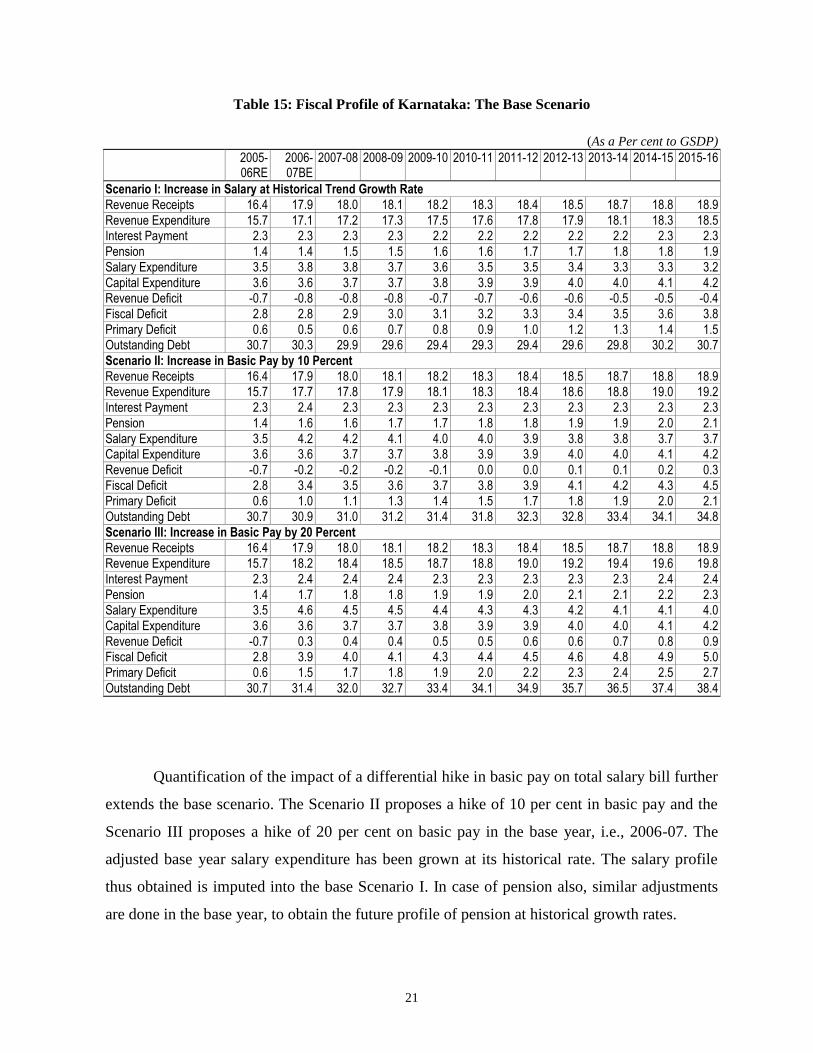
The base scenario as developed shows that between 2006-07 and 2015-16 revenue
receipts as a percentage of State GSDP will increase from 16 to 16.8 per cent. Revenue
expenditure, which was at 15.4 per cent of GSDP in the base year i.e., 2005-06, would increase
to 16.8 per cent. The salary expenditure as a percentage of GSDP would decline marginally
during this period. However the interest payment and pension, as a percentage of GSDP will
increase from 2.4 to 2.9 per cent and 1.5 to 2 per cent respectively. Capital expenditure would

20
also show a marginal increase during this period. The observed profile of revenue and
expenditures outcome is a fiscal imbalance profile, which shows an erosion of revenue surplus
from – 0.51 per cent of GSDP to – 0.04 per cent of GSDP. The fiscal deficit correspondingly
would increase from 2.82 to 3.68 per cent of GSDP during the same period, leading to a
gradual increase in the debt stock from 27.87 per cent to 30 per cent of GSDP. This is clearly
an unsustainable scenario, as the State would fail to adhere to the KFRA and the proposed
MTFP targets.
21
Table 15: Fiscal Profile of Karnataka: The Base Scenario
(As a Per cent to GSDP)
2005-06RE
2006-07BE
2007-08 2008-09 2009-10 2010-11 2011-12 2012-13 2013-14 2014-15 2015-16
Scenario I: Increase in Salary at Historical Trend Growth Rate
Revenue Receipts 16.4 17.9 18.0 18.1 18.2 18.3 18.4 18.5 18.7 18.8 18.9
Revenue Expenditure 15.7 17.1 17.2 17.3 17.5 17.6 17.8 17.9 18.1 18.3 18.5 Interest Payment 2.3 2.3 2.3 2.3 2.2 2.2 2.2 2.2 2.2 2.3 2.3
Pension 1.4 1.4 1.5 1.5 1.6 1.6 1.7 1.7 1.8 1.8 1.9
Salary Expenditure 3.5 3.8 3.8 3.7 3.6 3.5 3.5 3.4 3.3 3.3 3.2
Capital Expenditure 3.6 3.6 3.7 3.7 3.8 3.9 3.9 4.0 4.0 4.1 4.2 Revenue Deficit -0.7 -0.8 -0.8 -0.8 -0.7 -0.7 -0.6 -0.6 -0.5 -0.5 -0.4
Fiscal Deficit 2.8 2.8 2.9 3.0 3.1 3.2 3.3 3.4 3.5 3.6 3.8
Primary Deficit 0.6 0.5 0.6 0.7 0.8 0.9 1.0 1.2 1.3 1.4 1.5 Outstanding Debt 30.7 30.3 29.9 29.6 29.4 29.3 29.4 29.6 29.8 30.2 30.7
Scenario II: Increase in Basic Pay by 10 Percent
Revenue Receipts 16.4 17.9 18.0 18.1 18.2 18.3 18.4 18.5 18.7 18.8 18.9 Revenue Expenditure 15.7 17.7 17.8 17.9 18.1 18.3 18.4 18.6 18.8 19.0 19.2
Interest Payment 2.3 2.4 2.3 2.3 2.3 2.3 2.3 2.3 2.3 2.3 2.3
Pension 1.4 1.6 1.6 1.7 1.7 1.8 1.8 1.9 1.9 2.0 2.1
Salary Expenditure 3.5 4.2 4.2 4.1 4.0 4.0 3.9 3.8 3.8 3.7 3.7 Capital Expenditure 3.6 3.6 3.7 3.7 3.8 3.9 3.9 4.0 4.0 4.1 4.2
Revenue Deficit -0.7 -0.2 -0.2 -0.2 -0.1 0.0 0.0 0.1 0.1 0.2 0.3
Fiscal Deficit 2.8 3.4 3.5 3.6 3.7 3.8 3.9 4.1 4.2 4.3 4.5 Primary Deficit 0.6 1.0 1.1 1.3 1.4 1.5 1.7 1.8 1.9 2.0 2.1
Outstanding Debt 30.7 30.9 31.0 31.2 31.4 31.8 32.3 32.8 33.4 34.1 34.8
Scenario III: Increase in Basic Pay by 20 Percent
Revenue Receipts 16.4 17.9 18.0 18.1 18.2 18.3 18.4 18.5 18.7 18.8 18.9 Revenue Expenditure 15.7 18.2 18.4 18.5 18.7 18.8 19.0 19.2 19.4 19.6 19.8
Interest Payment 2.3 2.4 2.4 2.4 2.3 2.3 2.3 2.3 2.3 2.4 2.4
Pension 1.4 1.7 1.8 1.8 1.9 1.9 2.0 2.1 2.1 2.2 2.3 Salary Expenditure 3.5 4.6 4.5 4.5 4.4 4.3 4.3 4.2 4.1 4.1 4.0
Capital Expenditure 3.6 3.6 3.7 3.7 3.8 3.9 3.9 4.0 4.0 4.1 4.2
Revenue Deficit -0.7 0.3 0.4 0.4 0.5 0.5 0.6 0.6 0.7 0.8 0.9 Fiscal Deficit 2.8 3.9 4.0 4.1 4.3 4.4 4.5 4.6 4.8 4.9 5.0
Primary Deficit 0.6 1.5 1.7 1.8 1.9 2.0 2.2 2.3 2.4 2.5 2.7
Outstanding Debt 30.7 31.4 32.0 32.7 33.4 34.1 34.9 35.7 36.5 37.4 38.4
Quantification of the impact of a differential hike in basic pay on total salary bill further
extends the base scenario. The Scenario II proposes a hike of 10 per cent in basic pay and the
Scenario III proposes a hike of 20 per cent on basic pay in the base year, i.e., 2006-07. The
adjusted base year salary expenditure has been grown at its historical rate. The salary profile
thus obtained is imputed into the base Scenario I. In case of pension also, similar adjustments
are done in the base year, to obtain the future profile of pension at historical growth rates.

22
As can be seen from Table 15, in case of Scenario II, with a 10 per cent hike in salary
and pension, the State goes into revenue deficit of 0.07 per cent of GSDP in the base year itself.
The revenue deficit continues to grow and reaches at 0.53 per cent of GSDP by the end of
2015-16. The fiscal deficit and the outstanding debt also increase to 4.26 per cent and 33.55 per
cent of GSDP, by the terminal year of projections. In case of Scenario II, obviously the effect
of a 20 per cent salary hike is much more severe compared to Scenario I and Scenario II (See
Table 15).
The scenarios as developed reveal that the fiscal strain emanating due to a salary hike at
the historical growth rate is not sustainable. Thus, if a fiscally sustainable salary hike
compatible with MTFP and KFRA commitments have to be undertaken, apart from the key
fiscal parameters, one has to take into consideration the MTFP targets, particularly the target
set for salary expenditure. In the next section we discuss the MTFP targets and develop
alternative fiscal scenarios taking the MTFP norms and suggest measures for expenditure
restructuring and revenue enhancement so that the proposed hike does not disturb the fiscal
balance.
Section VI: Fiscal Implication of Salary Hike: The Alternative Scenario
The salient features of MTFP of 2005-09 are presented in Box 1. MTFP has assigned
prescriptive buoyancies to different taxes levied by the State. Expenditure projections reveal
significant compression of expenditure on salaries, pensions and subsidies. Some restructuring
seems imminent with an increase in expenditure allocations on major operation and
maintenance, viz., roads, buildings, irrigation, education, health, rural development, water
supply, agriculture and forestry. However, one of the major weaknesses of the MTFP is its
inability to contain power sector subsidy in the medium term. Power sector subsidy at Rs. 1750
crores constituted 6.2 per cent of the revenue expenditure in the year 2005-06. By the terminal
year of MTFP, i.e., 2008-09, in absolute volume it will be Rs. 2100 crores constituting 5.4 per
cent of the revenue expenditure. In this context it needs to be emphasised that even with a 20
per cent hike in salary expenditure in the base year, at historical growth rate the additional
expenditure requirement for the salary would be Rs. 1300 crores, which is well below the
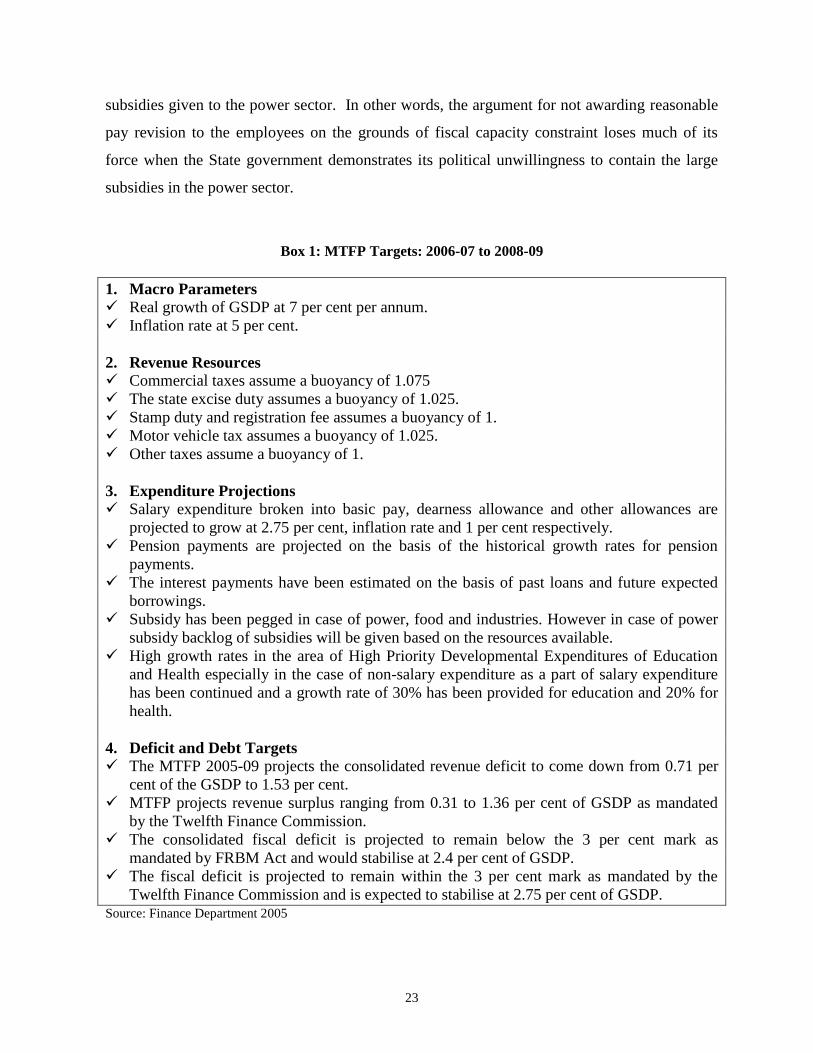
23
subsidies given to the power sector. In other words, the argument for not awarding reasonable
pay revision to the employees on the grounds of fiscal capacity constraint loses much of its
force when the State government demonstrates its political unwillingness to contain the large
subsidies in the power sector.
Box 1: MTFP Targets: 2006-07 to 2008-09
1. Macro Parameters
Real growth of GSDP at 7 per cent per annum.
Inflation rate at 5 per cent.
2. Revenue Resources
Commercial taxes assume a buoyancy of 1.075
The state excise duty assumes a buoyancy of 1.025.
Stamp duty and registration fee assumes a buoyancy of 1.
Motor vehicle tax assumes a buoyancy of 1.025.
Other taxes assume a buoyancy of 1.
3. Expenditure Projections
Salary expenditure broken into basic pay, dearness allowance and other allowances are
projected to grow at 2.75 per cent, inflation rate and 1 per cent respectively.
Pension payments are projected on the basis of the historical growth rates for pension
payments.
The interest payments have been estimated on the basis of past loans and future expected
borrowings.
Subsidy has been pegged in case of power, food and industries. However in case of power
subsidy backlog of subsidies will be given based on the resources available.
High growth rates in the area of High Priority Developmental Expenditures of Education
and Health especially in the case of non-salary expenditure as a part of salary expenditure
has been continued and a growth rate of 30% has been provided for education and 20% for
health.
4. Deficit and Debt Targets
The MTFP 2005-09 projects the consolidated revenue deficit to come down from 0.71 per
cent of the GSDP to 1.53 per cent.
MTFP projects revenue surplus ranging from 0.31 to 1.36 per cent of GSDP as mandated
by the Twelfth Finance Commission.
The consolidated fiscal deficit is projected to remain below the 3 per cent mark as
mandated by FRBM Act and would stabilise at 2.4 per cent of GSDP.
The fiscal deficit is projected to remain within the 3 per cent mark as mandated by the
Twelfth Finance Commission and is expected to stabilise at 2.75 per cent of GSDP. Source: Finance Department 2005

24
In order to examine the impact of salary expenditure on the proposed fiscal correction
targets, we have developed alternative fiscal scenarios based on the parameter values assigned
to key fiscal variables by MTFP, 2005-09. The Alternative Scenario I presented in Table 16
shows the fiscal impact of a salary increase at differential rates. Within the Alternative Scenario
I, the first case shows the impact of salary hike at implicit growth of salary assumed by MTFP,
2005-09. The growth rate of aggregate salary during 2006-07 to 2007-08 works out to be 5.81
per cent. This growth rate is applied to obtain the future profile of salary expenditure. As in the
case of Scenario I, there is no hike in the basic pay, the salary expenditure as a percentage of
GSDP declines from 3.7 to 2 per cent during 2005-06 to 2015-16. The revenue surplus
increases from 0.51 per cent to 1.47 per cent of GSDP, while the fiscal deficit to GSDP ratio
stabilizes at 2.75 per cent from 2008-09. The capital expenditure as a percentage of GSDP
shows a significant step up from 3.33 to 4.2 per cent of GSDP by the terminal year of
projection. The debt GSDP ratio stabilizes and shows a gradual decline. This can be termed as
a no pay revision scenario.
However, with an increase in the basic salary by 10 per cent (Scenario II) and
superannuation and retirement allowance by the same rate and by keeping DA and other
allowances at the existing level, the total increase in the pension and salary bill works out to be
Rs. 893 crores which puts the State into revenue deficit in the base year. With a salary
expenditure growth of 5.81 per cent, the profile of salary expenditure grows in such a manner
that the State generates revenue surplus in the next year and by the terminal year of projection
the revenue surplus works out to be 1.06 per cent. However, in this scenario the fiscal deficit
would exceed 3 per cent of GSDP, but will have to be limited to 3 per cent by compressing
capital expenditure to conform to the targets specified in the fiscal restructuring plan
recommended by the TFC. It may be noted that the according to the restructuring plan, the
State government will have to phase out revenue deficits and the fiscal deficit will have to be
contained at 3 per cent of GSDP by 2009-10. However, the State government will have to
amend the MTFP targets. The fiscal scenario would be worse if the basic pay, superannuation

25
and retirement allowance is increased by 20 per cent, but can still be made consistent with the
TFC fiscal restructuring targets (Scenario III).
Table 16: Fiscal Profile of Karnataka: The Alternative Scenario-I
(As a per cent to GSDP)
2005-06BE
2006-07 2007-08 2008-09 2009-10 2010-11 2011-12 2012-13 2013-14 2014-15 2015-16
Scenario I: Implicit Growth of Salary Assumed by MTFP 2006-10
Revenue Receipts 16.4 17.9 17.8 17.7 17.6 17.5 17.4 17.3 17.3 17.2 17.1 Revenue Expenditure 15.7 17.1 16.8 16.6 16.4 16.1 15.9 15.7 15.5 15.2 15.0
Interest Payment 2.3 2.3 2.4 2.3 2.3 2.3 2.2 2.2 2.2 2.1 2.1
Pension 1.4 1.4 1.4 1.5 1.5 1.5 1.5 1.5 1.5 1.5 1.5
Salary Expenditure 3.5 3.8 3.7 3.5 3.4 3.2 3.1 2.9 2.8 2.7 2.6 Capital Expenditure 3.6 3.6 3.8 3.8 4.0 4.1 4.3 4.4 4.5 4.7 4.8
Revenue Deficit -0.7 -0.8 -1.0 -1.1 -1.2 -1.4 -1.5 -1.6 -1.8 -1.9 -2.1
Fiscal Deficit 2.85 2.79 2.80 2.75 2.75 2.75 2.75 2.75 2.75 2.75 2.75 Primary Deficit 0.6 0.5 0.4 0.4 0.5 0.5 0.5 0.6 0.6 0.6 0.6
Outstanding Debt 30.7 30.3 29.8 29.3 28.8 28.4 28.1 27.8 27.5 27.2 27.0
Scenario II: Increase in Basic Pay by 10 per cent Revenue Receipts 16.4 17.9 17.8 17.7 17.6 17.5 17.4 17.3 17.3 17.2 17.1
Revenue Expenditure 15.7 17.7 17.4 17.1 16.9 16.6 16.4 16.2 15.9 15.7 15.5
Interest Payment 2.3 2.4 2.4 2.4 2.3 2.3 2.3 2.2 2.2 2.2 2.2
Pension 1.4 1.6 1.6 1.6 1.6 1.6 1.6 1.7 1.7 1.7 1.7 Salary Expenditure 3.5 4.2 4.0 3.9 3.7 3.5 3.4 3.2 3.1 2.9 2.8
Capital Expenditure 3.6 3.6 3.8 3.8 4.0 4.1 4.3 4.4 4.5 4.7 4.8
Revenue Deficit -0.7 -0.2 -0.4 -0.5 -0.7 -0.8 -1.0 -1.2 -1.3 -1.5 -1.6 Fiscal Deficit 2.85 3.37 3.36 3.29 3.28 3.26 3.25 3.24 3.22 3.21 3.20
Primary Deficit 0.6 1.0 0.9 0.9 0.9 1.0 1.0 1.0 1.0 1.0 1.0
Outstanding Debt 30.7 30.9 30.9 30.8 30.7 30.6 30.5 30.4 30.3 30.2 30.1
Scenario III: Increase in Basic Pay by 20 per cent Revenue Receipts 16.4 17.9 17.8 17.7 17.6 17.5 17.4 17.3 17.3 17.2 17.1 Revenue Expenditure 15.7 18.2 18.0 17.7 17.4 17.2 16.9 16.6 16.4 16.2 15.9
Interest Payment 2.3 2.4 2.5 2.4 2.4 2.3 2.3 2.3 2.2 2.2 2.2
Pension 1.4 1.7 1.7 1.7 1.8 1.8 1.8 1.8 1.8 1.8 1.9
Salary Expenditure 3.5 4.6 4.4 4.2 4.0 3.9 3.7 3.5 3.4 3.2 3.1 Capital Expenditure 3.6 3.6 3.8 3.8 4.0 4.1 4.3 4.4 4.5 4.7 4.8
Revenue Deficit -0.7 0.3 0.2 0.0 -0.2 -0.3 -0.5 -0.7 -0.8 -1.0 -1.2
Fiscal Deficit 2.85 3.94 3.92 3.84 3.80 3.77 3.75 3.72 3.69 3.67 3.65 Primary Deficit 0.6 1.5 1.5 1.4 1.4 1.4 1.4 1.4 1.4 1.4 1.4
Outstanding Debt 30.7 31.4 31.9 32.3 32.6 32.8 32.9 33.1 33.1 33.2 33.2
It is interesting to note that though a significant scaling down of the growth of salary
expenditure is proposed in MTFP 2005-09 (See Box 1), the future path of salary adjustment
envisages a much higher growth. As proposed by MTFP 2005-09, basic salary, DA and other
allowances are expected to grow at 2 per cent, inflation rate and 1 per cent respectively. The
scalewise salary breakup and within that the various components of salary data is used to

26
calculate the aggregate salary expenditure growth based on the targeted growth rates of each
component assumed in MTFP. The weighted average rate of growth of salary works out to be
3.45 per cent. Applying this growth rate on the base year with differential hikes in basic pay
and superannuation and retirement allowances, the Alternative Scenario II is developed and
presented in Table 17. In this case also, though the pay revision in Scenarios II and III create
difficulties in conforming to the MTFP targets, it is possible to make even 20 per cent revision
and still adhere to the fiscal restructuring plan of the TFC. In all these cases, however, the
FRA will have to be amended and MTFP targets will have to be revised.
The point to be noted here is that in both Alternative Scenario I and II, undertaking pay
revision and conforming to the fiscal restructuring targets set by the TFC would require
compressing the capital expenditure. According to the prevailing MTFP target, in the terminal
year capital expenditure increases to 3.7 per cent of GSDP in 2009-10. As mentioned above,
pay revision would require amending the targets downward for capital expenditures by about
0.5 percentage points to GSDP in the terminal year of the TFC award. Indeed given the
infrastructure bottlenecks in the State and the adverse growth implications of reducing capital
expenditure growth, this may not be a preferable option.
If the capital expenditure targets have to be retained and fiscal restructuring target of the
TFC has to be conformed, the most feasible option is either to improve the revenue productivity
of the tax system, increase non-tax revenues and/or phase out power sector subsidies. The
MTFP projection takes reasonably high buoyancy for the tax revenue projections and it is
unlikely that in the medium term it would be possible to enhance it further. As regards non-tax
revenues, although there is scope for improving the collections and is important for
accountability, the volume of revenues it would generate may not be large. The most feasible
option seems to be to phase out power sector subsidies. In fact, the State government should
present the case to the public that feasibility and extent of pay revision is dependent on the
phasing out power subsidies and carry out the necessary reform on that account. It can
augment explicit subsidy for rural electrification to some extent to make the reform
implementable.

27
An important unknown factor in the entire exercise is the central transfers. Although
the TFC recommendations will be in effect until 2009-10, there are uncertainties regarding the
plan grants. Given the emphasis on National Common Minimum Program of the United
Progressive Alliance government at the Centre, the grants for State plan purposes and for
Central sector and Centrally sponsored schemes may not be reduced in the medium term. More
importantly, if the revenue buoyancy of the Central tax revenues seen in the recent past
continues, the States’ fiscal position will be comfortable. It may be noted that the Central tax
revenues have grown at about 19 per cent per year since 2002-03 and continuation of this
growth will generate additional fiscal space to the State government. Much of the increase has
come about in the direct taxes of the Centre mainly due to strengthening of the information
system and with further strengthening of the Tax Information Network, one could expect that
the high revenue buoyancy will continue. However, it would be premature to expect this and it
would be safe to take that the buoyancy assumed by the TFC.

28
Table 17: Fiscal Profile of Karnataka: The Alternative Scenario-II
(As a per cent to GSDP)
2005-06BE
2006-07 2007-08 2008-09 2009-10 2010-11 2011-12 2012-13 2013-14 2014-15 2015-16
Scenario I: MTFP Proposed Targeted Growth of Salary Expenditure
Revenue Receipts 16.4 17.9 17.8 17.7 17.6 17.5 17.4 17.3 17.3 17.2 17.1 Revenue Expenditure 15.7 17.1 16.8 16.6 16.4 16.1 15.9 15.7 15.5 15.2 15.0
Interest Payment 2.3 2.3 2.4 2.3 2.3 2.3 2.2 2.2 2.2 2.1 2.1
Pension 1.4 1.4 1.4 1.5 1.5 1.5 1.5 1.5 1.5 1.5 1.5 Salary Expenditure 3.5 3.8 3.5 3.3 3.0 2.8 2.6 2.4 2.2 2.0 1.8
Capital Expenditure 3.6 3.6 3.8 3.8 4.0 4.1 4.3 4.4 4.5 4.7 4.8
Revenue Deficit -0.7 -0.8 -1.0 -1.1 -1.2 -1.4 -1.5 -1.6 -1.8 -1.9 -2.1 Fiscal Deficit 2.85 2.79 2.80 2.75 2.75 2.75 2.75 2.75 2.75 2.75 2.75
Primary Deficit 0.6 0.5 0.4 0.4 0.5 0.5 0.5 0.6 0.6 0.6 0.6
Outstanding Debt 30.7 30.3 29.8 29.3 28.8 28.4 28.1 27.8 27.5 27.2 27.0
Scenario II: Increase in Basic Pay by 10 Per cent Revenue Receipts 16.4 17.9 17.8 17.7 17.6 17.5 17.4 17.3 17.3 17.2 17.1
Revenue Expenditure 15.7 17.7 17.4 17.1 16.9 16.6 16.3 16.1 15.9 15.6 15.4
Interest Payment 2.3 2.4 2.4 2.4 2.3 2.3 2.3 2.2 2.2 2.2 2.2 Pension 1.4 1.6 1.6 1.6 1.6 1.6 1.6 1.7 1.7 1.7 1.7
Salary Expenditure 3.5 4.2 3.9 3.6 3.3 3.1 2.8 2.6 2.4 2.2 2.0
Capital Expenditure 3.6 3.6 3.8 3.8 4.0 4.1 4.3 4.4 4.5 4.7 4.8 Revenue Deficit -0.7 -0.2 -0.4 -0.6 -0.7 -0.9 -1.1 -1.2 -1.4 -1.6 -1.7
Fiscal Deficit 2.85 3.37 3.35 3.27 3.24 3.22 3.19 3.17 3.15 3.14 3.12
Primary Deficit 0.6 1.0 0.9 0.9 0.9 0.9 0.9 0.9 1.0 1.0 1.0
Outstanding Debt 30.7 30.9 30.8 30.7 30.6 30.5 30.4 30.2 30.1 29.9 29.8 Scenario III: Increase in Basic Pay by 20 per cent
Revenue Receipts 16.4 17.9 17.8 17.7 17.6 17.5 17.4 17.3 17.3 17.2 17.1
Revenue Expenditure 15.7 18.2 17.9 17.6 17.3 17.1 16.8 16.5 16.3 16.0 15.8 Interest Payment 2.3 2.4 2.5 2.4 2.4 2.3 2.3 2.3 2.2 2.2 2.2
Pension 1.4 1.7 1.7 1.7 1.8 1.8 1.8 1.8 1.8 1.8 1.9
Salary Expenditure 3.5 4.6 4.3 3.9 3.6 3.3 3.1 2.8 2.6 2.4 2.2
Capital Expenditure 3.6 3.6 3.8 3.8 4.0 4.1 4.3 4.4 4.5 4.7 4.8 Revenue Deficit -0.7 0.3 0.1 -0.1 -0.2 -0.4 -0.6 -0.8 -1.0 -1.2 -1.3
Fiscal Deficit 2.85 3.94 3.89 3.78 3.73 3.68 3.63 3.59 3.56 3.52 3.49
Primary Deficit 0.6 1.5 1.4 1.4 1.4 1.3 1.3 1.3 1.3 1.3 1.3 Outstanding Debt 30.7 31.4 31.9 32.2 32.4 32.5 32.6 32.7 32.6 32.6 32.5
VII. Conclusions
On the basis of the above analysis, the major findings of the study can be summarized
in the following line:
a. The fiscal situation of the State though worsened during the 1990s, there has been a
turnaround in recent years. The important reasons for the turnaround are lower
interest liability arising from the debt swap, improved buoyancy of State taxes,
higher buoyancy of central tax revenues and consequent larger tax devolution and
better fiscal management of the States following the fiscal responsibility legislation.

29
The State is expected to generate a revenue surplus of Rs. 854 crores in the current
fiscal years with a fiscal deficit of 2.8 per cent of GSDP.
b. An important cause of fiscal improvement in the State is the higher revenue
mobilization, particularly own tax revenues. The own tax revenue buoyancy for the
period between 2000-01 and 2005-06 estimated to be 1.548 compared to 0.823 for
the period between 1993-94 and 1999-00.
c. The improved fiscal health has provided larger fiscal space in the State. The
combined incidence of committed expenditures, viz., interest payment, salary and
pension in revenue budget of the State have declined significantly in recent years,
but still constitutes around 45 per cent of the total expenditure. An inter-state
comparison of incidence of committed expenditures shows that Karnataka’s relative
position is much better than in other States. However the consolidated public sector
deficit of the State still remains a matter of concern, particularly the large power
sector subsidy and deficits thereon.
d. The salary expenditure of the State declined from 4.7 to 4.3 per cent of GSDP
between 1993-94 and 1998-99 and then increased to 4.8 per cent in the year 1999-
00. Thereafter it started declining gradually, particularly due to steady decline in the
growth of employment. Currently the salary expenditure constitutes just 3.7 per cent
of GSDP, almost 0.6 percentage point lower than that existed before the last pay
revision. Thus, the State seems to have completely absorbed the impact of the last
pay revision by restructuring employment.
e. The decadal rate of growth of employment in government was the lowest during the
nineties at 2.93 per cent compared to 3.55 and 3.57 per cent during the seventies and
eighties respectively. Between 2000-01 and 2005-06, yearly growth of employment
was negative in all years, except for 2002-03 and 2005-06.
f. The analysis of the structure of employment and scale shows that the government of
Karnataka currently has 20 different scales, apart from the all India scales of
30
IAS/IPS and temporary employees on consolidated pay. The mean basic salary
varies from Rs. 3175 in the lowest scale of Group-D to Rs. 16, 840 for highest scale
of Group-A employees.
g. The scale wise distribution of employees reveal that it is the Group C that
constitutes more than two third of the total employment of the State.
In order to examine the impact of salary revision on fiscal balance, we have developed
alternative fiscal scenarios based on various assumptions regarding the future profile of key
fiscal variables. The base scenario shows that if the present fiscal profile is projected forward
with differential hikes in salary expenditure, States revenue surplus situation gets eroded and
fiscal deficit situation worsens depending on the extent of salary increase. The State gets into a
revenue deficit situation in the base year itself even with a 10 per cent hike in the basic pay and
superannuation and retirement allowances under the base scenario. However, the fiscal
parameters can be made consistent with those indicated in the restructuring plan by the TFC.
This would require amending the Fiscal Responsibility Act and reworking the MTFP targets to
accommodate compression of capital expenditures.
In the case of alternative scenarios, salary induced increase in fiscal imbalance is lower
than that in base scenario. However, when pay revision of 10 per cent and 20 per cent are taken
account of, the scenarios projected on the basis of MTFP assumptions would not conform to the
MTFP targets of revenue and fiscal deficit reductions. The targets will have to be amended to
be consistent with those indicated in the fiscal restructuring plan of the TFC. Specifically, the
capital expenditure projections forecasted at 3.7 per cent of GSDP in 2009-10, the terminal year
of the award of the TFC, will have to be revised lower by about 0.5 percentage points under the
assumption of 20 per cent pay revision. Given that the revenue surplus in the year is estimated
at 0.2 per cent of GSDP, and as fiscal deficit target according to the TFC targets are 3 per cent
of GSDP, the State can incur capital expenditure of 3.2 per cent of GSDP.
From the viewpoint of prudent fiscal management and ensuring allocative and technical
efficiency in government expenditure to accelerate growth in the State, it would be
inappropriate to compress capital expenditures to adhere to the MTFP targets. Rather, more

31
appropriate option is to phase out the implicit subsidy in the power sector. Power sector
subsidy in 2005-06 is estimated at Rs. 1750 crores and the State should take the opportunity
and pose the feasibility of pay revision conditional on phasing out power subsidy. .
Our analysis shows that it is feasible for the State government to undertake pay increase
even by 20 per cent. This would however, entail reworking of the MTFP targets to compress
capital expenditures or alternatively, phase out power sector deficit through rationalisation of
power tariff and improved working of the State Electricity Board. In addition to these, if the
State government generates additional resources through better revenue mobilization, it could
improve outlay on infrastructure spending.

32
References
Finance Department, 2005, “Medium Term Fiscal Plan for Karnataka 2005-09”, Government
of Karnataka.
Rao, Govinda M, 2003, Introduction, in Rao, Govinda M (eds.), “Volume and Composition of
Budgetary Subsidies in Karnataka”, Social and Economic Change Monographs 1, ISEC,
Bangalore.
Information on No. of Sanctioned Posts,Vacant Posts, Working Strenghth,
Salary & Grants-in -aid
(Rs.in crores)
Year No. of Sanctioned Posts
No. of Vacant Posts
Sanctioned to Vacant post Ratio
Working Strength
Salary Expenditure
*Grant- in-aid
Salary+ Grant-in-aid
1995-96 589462 84089 14.27 505373 2481 497 2978
1996-97 598037 89083 14.90 508954 2871 596 3467
1997-98 589298 91486 15.52 497812 3365 655 4020
1998-99 619753 93426 15.07 526327 3810 787 4597
1999-00 639331 94893 14.84 544438 4576 915 5491
2000-01 626899 95915 15.30 530984 4630 1136 5766
2001-02 625199 95254 15.24 529945 5030 1074 6104
2002-03 629657 100998 16.04 528659 4941 1069 6010
2003-04 629198 95751 15.22 533447 5323 1022 6345
2004-05 618826 90271 14.59 528555 5392 1122 6514
2005-06(R.E.) 598817 89035 14.87 509782 5932 1246 7178
2006-07(B.E.) 602121 89469 14.86 512652 7186 1352 8538
TGR 0.22 0.31 0.20 8.57 8.42 8.55
*Grant-in aid given to Educational Institutions for payment of Salary, it does not include grants given to Local Bodies as Devolution as per State Finance Commission's
Recommendations