STATE DEBT POLICY ADVISORY COMMISSION: Approved Report
85
R EPORT OF THE STATE DEBT POLICY ADVISORY COMMISSION 2012 Legislative Update January 10, 2012
-
Upload
statesman-journal -
Category
Documents
-
view
219 -
download
0
Transcript of STATE DEBT POLICY ADVISORY COMMISSION: Approved Report

8/3/2019 STATE DEBT POLICY ADVISORY COMMISSION: Approved Report
http://slidepdf.com/reader/full/state-debt-policy-advisory-commission-approved-report 1/85
R EPORT
OF THE
STATE DEBT POLICY
ADVISORY COMMISSION
2012
Legislative Update
January 10, 2012

8/3/2019 STATE DEBT POLICY ADVISORY COMMISSION: Approved Report
http://slidepdf.com/reader/full/state-debt-policy-advisory-commission-approved-report 2/85

8/3/2019 STATE DEBT POLICY ADVISORY COMMISSION: Approved Report
http://slidepdf.com/reader/full/state-debt-policy-advisory-commission-approved-report 3/85
TED WHEELER , Chair Oregon State Treasurer
Ex-Officio Member
TIMOTHY A. DUY PHIL BARNHART
Public Member Representative, District 11
Professor of Economics, House of Representatives Appointee
University of Oregon
RICHARD DEVLIN MICHAEL JORDAN
Senator, District 19 Director, Department of
Senate Appointee Administrative Services
Ex-Officio Member
STAFF
Debt Management Division
Office of the State Treasurer 350 Winter Street NE, Suite 100
Salem, Oregon 97301-3896Phone: (503) 378-4930
Facsimile: (503) 378-2870Email: [email protected]

8/3/2019 STATE DEBT POLICY ADVISORY COMMISSION: Approved Report
http://slidepdf.com/reader/full/state-debt-policy-advisory-commission-approved-report 4/85
This Page Intentionally Blank

8/3/2019 STATE DEBT POLICY ADVISORY COMMISSION: Approved Report
http://slidepdf.com/reader/full/state-debt-policy-advisory-commission-approved-report 5/85
G o v e r n o r
B u d g e t & B o n d i n g
P r o p o s a l
L e g i s l a t u
r e
C o n s i d e r s & A p p r o v e s
B o n d i n g B
i l l
S t a t e T r e a s u r e r
I s s u e s S t a t e B o n d s
C a p i t a
l M a r k e t s
U n d e r w r i
t e , B u y & S e l l
O r e g o n
S t a t e B o n d s
S t a t e A g
e n c i e s
B o n d P r
o g r a m
M a n a g e r s
R a t i n g A
g e n c i e s
M o o d y ' s , S
& P , F i t c h
C r e d i t A n a l y s i s
O r e g o n B o n d i n g P r o c e s s

8/3/2019 STATE DEBT POLICY ADVISORY COMMISSION: Approved Report
http://slidepdf.com/reader/full/state-debt-policy-advisory-commission-approved-report 6/85
This Page Intentionally Blank

8/3/2019 STATE DEBT POLICY ADVISORY COMMISSION: Approved Report
http://slidepdf.com/reader/full/state-debt-policy-advisory-commission-approved-report 7/85
Table of Contents
EXECUTIVE SUMMARY….........................................................................................................1
I. BONDING IN OREGON …...............................................................................................7
II. CURRENT DEBT PICTURE IN OREGON ………………..………………..…………17
III. GENERAL FUND SUPPPORTED DEBT CAPACITY … ..………………...…………25
IV. LOTTERY-BACKED DEBT CAPACITY........………… ………...…………..….…....33
V. NET TAX-SUPPORTED DEBT ……………………………………………………......41
VI. NON TAX-SUPPORTED DEBT ..............................................................................…...47
APPENDIX A – SUPPORTING CHARTS & TABLES

8/3/2019 STATE DEBT POLICY ADVISORY COMMISSION: Approved Report
http://slidepdf.com/reader/full/state-debt-policy-advisory-commission-approved-report 8/85
This Page Intentionally Blank
8/3/2019 STATE DEBT POLICY ADVISORY COMMISSION: Approved Report
http://slidepdf.com/reader/full/state-debt-policy-advisory-commission-approved-report 9/85
COMMISSIONER TED WHEELER, CHAIR
Oregon State Treasurer
COMMISSIONER TIMOTHY A DUY
Public Member
COMMISSIONER PHIL BARNHART
Representative, Oregon House of Representatives
COMMISSIONER RICHARD DEVLINSenator, Oregon Senate
COMMISSIONER MICHAEL JORDAN
Director, Department of Administrative Services
STATE DEBT POLICY
ADVISORY COMMISSION
January 10, 2012
Governor Kitzhaber and Members of the 2012 Oregon Legislature:
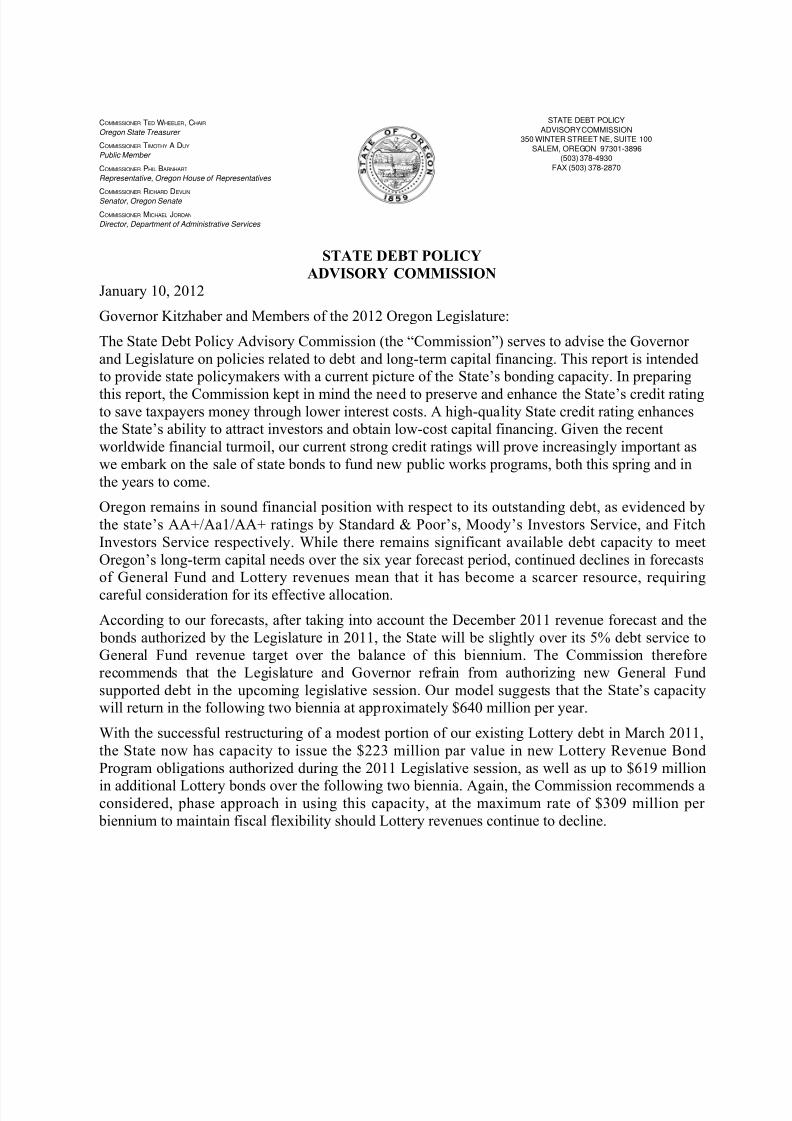
The State Debt Policy Advisory Commission (the “Commission”) serves to advise the Governor and Legislature on policies related to debt and long-term capital financing. This report is intendedto provide state policymakers with a current picture of the State’s bonding capacity. In preparing
this report, the Commission kept in mind the need to preserve and enhance the State’s credit ratingto save taxpayers money through lower interest costs. A high-quality State credit rating enhancesthe State’s ability to attract investors and obtain low-cost capital financing. Given the recentworldwide financial turmoil, our current strong credit ratings will prove increasingly important aswe embark on the sale of state bonds to fund new public works programs, both this spring and inthe years to come.
Oregon remains in sound financial position with respect to its outstanding debt, as evidenced bythe state’s AA+/Aa1/AA+ ratings by Standard & Poor’s, Moody’s Investors Service, and FitchInvestors Service respectively. While there remains significant available debt capacity to meetOregon’s long-term capital needs over the six year forecast period, continued declines in forecasts
of General Fund and Lottery revenues mean that it has become a scarcer resource, requiringcareful consideration for its effective allocation.
According to our forecasts, after taking into account the December 2011 revenue forecast and the bonds authorized by the Legislature in 2011, the State will be slightly over its 5% debt service toGeneral Fund revenue target over the balance of this biennium. The Commission thereforerecommends that the Legislature and Governor refrain from authorizing new General Fundsupported debt in the upcoming legislative session. Our model suggests that the State’s capacitywill return in the following two biennia at approximately $640 million per year.
With the successful restructuring of a modest portion of our existing Lottery debt in March 2011,the State now has capacity to issue the $223 million par value in new Lottery Revenue BondProgram obligations authorized during the 2011 Legislative session, as well as up to $619 millionin additional Lottery bonds over the following two biennia. Again, the Commission recommends aconsidered, phase approach in using this capacity, at the maximum rate of $309 million per biennium to maintain fiscal flexibility should Lottery revenues continue to decline.
STATE DEBT POLICY
ADVISORY COMMISSION
350 WINTER STREET NE, SUITE 100
SALEM, OREGON 97301-3896
(503) 378-4930
FAX (503) 378-2870

8/3/2019 STATE DEBT POLICY ADVISORY COMMISSION: Approved Report
http://slidepdf.com/reader/full/state-debt-policy-advisory-commission-approved-report 10/85
As you make decisions critical to Oregon’s long-term financial health, please consider theCommission and its staff as a financial resource available to you at any time.
Sincerely,
Ted Wheeler, State Treasurer Chair, State Debt Policy Advisory Commission
8/3/2019 STATE DEBT POLICY ADVISORY COMMISSION: Approved Report
http://slidepdf.com/reader/full/state-debt-policy-advisory-commission-approved-report 11/85
EXECUTIVE SUMMARY
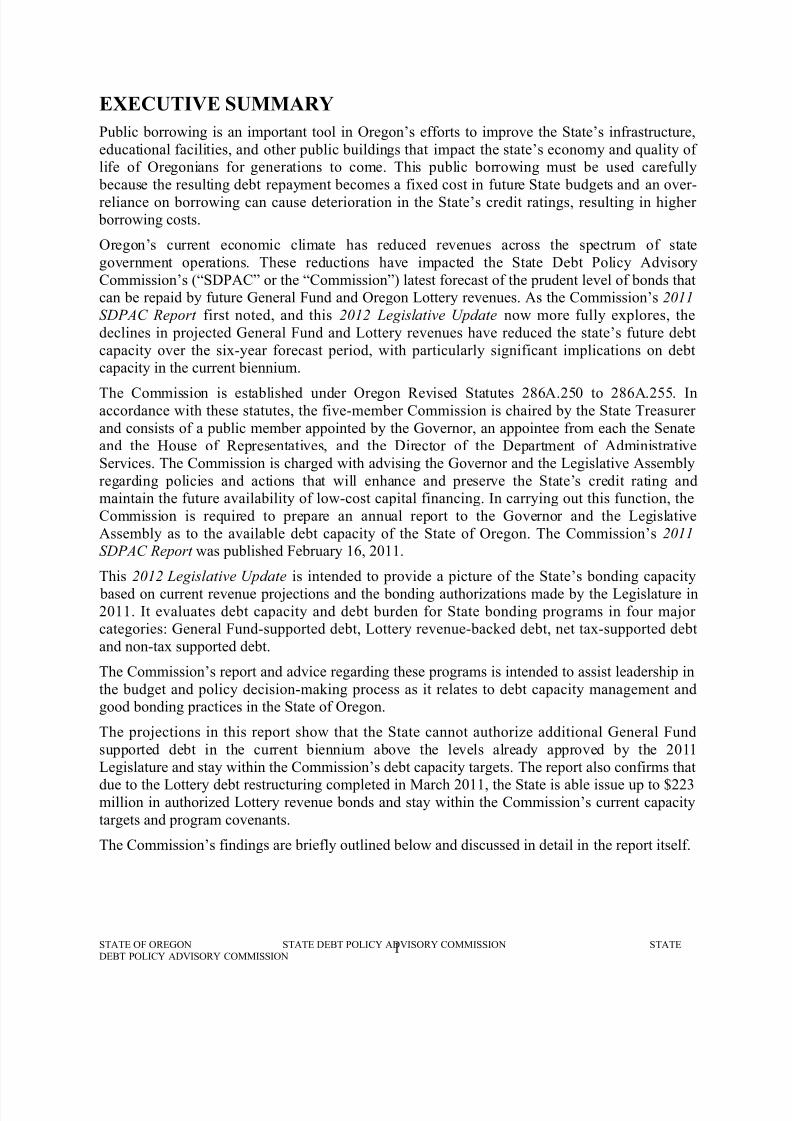
Public borrowing is an important tool in Oregon’s efforts to improve the State’s infrastructure,educational facilities, and other public buildings that impact the state’s economy and quality of life of Oregonians for generations to come. This public borrowing must be used carefully because the resulting debt repayment becomes a fixed cost in future State budgets and an over-reliance on borrowing can cause deterioration in the State’s credit ratings, resulting in higher borrowing costs.
Oregon’s current economic climate has reduced revenues across the spectrum of stategovernment operations. These reductions have impacted the State Debt Policy AdvisoryCommission’s (“SDPAC” or the “Commission”) latest forecast of the prudent level of bonds thatcan be repaid by future General Fund and Oregon Lottery revenues. As the Commission’s 2011
SDPAC Report first noted, and this 2012 Legislative Update now more fully explores, thedeclines in projected General Fund and Lottery revenues have reduced the state’s future debtcapacity over the six-year forecast period, with particularly significant implications on debtcapacity in the current biennium.
The Commission is established under Oregon Revised Statutes 286A.250 to 286A.255. Inaccordance with these statutes, the five-member Commission is chaired by the State Treasurer and consists of a public member appointed by the Governor, an appointee from each the Senateand the House of Representatives, and the Director of the Department of AdministrativeServices. The Commission is charged with advising the Governor and the Legislative Assemblyregarding policies and actions that will enhance and preserve the State’s credit rating andmaintain the future availability of low-cost capital financing. In carrying out this function, theCommission is required to prepare an annual report to the Governor and the LegislativeAssembly as to the available debt capacity of the State of Oregon. The Commission’s 2011
SDPAC Report was published February 16, 2011.
This 2012 Legislative Update is intended to provide a picture of the State’s bonding capacity based on current revenue projections and the bonding authorizations made by the Legislature in2011. It evaluates debt capacity and debt burden for State bonding programs in four major categories: General Fund-supported debt, Lottery revenue-backed debt, net tax-supported debtand non-tax supported debt.
The Commission’s report and advice regarding these programs is intended to assist leadership inthe budget and policy decision-making process as it relates to debt capacity management andgood bonding practices in the State of Oregon.
The projections in this report show that the State cannot authorize additional General Fundsupported debt in the current biennium above the levels already approved by the 2011Legislature and stay within the Commission’s debt capacity targets. The report also confirms thatdue to the Lottery debt restructuring completed in March 2011, the State is able issue up to $223million in authorized Lottery revenue bonds and stay within the Commission’s current capacitytargets and program covenants.
The Commission’s findings are briefly outlined below and discussed in detail in the report itself.
STATE OF OREGON STATE DEBT POLICY ADVISORY COMMISSION STATEDEBT POLICY ADVISORY COMMISSION
1

8/3/2019 STATE DEBT POLICY ADVISORY COMMISSION: Approved Report
http://slidepdf.com/reader/full/state-debt-policy-advisory-commission-approved-report 12/85
• Oregon’s combined long-term general obligation, appropriation and revenue bond debtoutstanding was $11.3 billion as of June 30, 2011.1 This is a decrease of about $61 millioncompared to the end of the 2010 fiscal year.
• For General Fund supported debt programs, the total debt outstanding as of June 30, 2011was $2.98 billion. This amount is expected to increase to approximately $3.15 billion by the
end of the 2011-2013 biennium based on the issuance of approximately $167 million in newGeneral Fund debt authorized by the 2011 Legislature. Based on the December 2011 revenueforecast, debt service as a percentage of General Fund revenues is expected to be 5.02% bythe end of the current biennium.
Using the maximum ratio of 5.0% of General Fund-supported debt to General Fundrevenues, the Commission estimates the State will have remaining debt capacity from FY2014 through FY 2017 of about $2.57 billion, but will slightly exceed the 5.0% debt servicetarget for the 2011-13 biennium. This projection assumes that all General Fund supported bonds authorized by the 2011 Legislature are issued over the balance of the next two years.The Commission therefore recommends that the Legislature and Governor not authorize any
additional General Fund supported debt in the current biennium.
Debt Capacity for
General Fund Supported Debt Programs
($ Millions)
Fiscal Year
Ending
June 30th
Annual Amount of Debt
That May be Issued
within Target Capacity
Total Debt Service as a
% of General Fund
Revenues
2012 - * 5.07%
2013 - * 5.02%
2014 $ 977 5.00%2015 750 5.00%
2016 468 5.00%
2017 373 5.00%
Total FY 2014-2017
General Fund Debt Capacity$2,568
* Assumes issuance of $167 million in General Fund supported bonds authorized by 2011 Legislature.
• For the Lottery Bond Program, the total debt outstanding was $1.2 billion as of June 30,2011. Since the publication of the 2011 SDPAC report, the six year forecast for Lotteryrevenues has dropped by an additional 3%, which reduced debt service coverage levels anddebt capacity proportionally.
Lottery revenue bond covenants require a minimum debt service coverage ratio of 4-timesunobligated net Lottery proceeds or revenues. Issuing $222.7 million of Lottery bonds duringthe remainder of the current biennium, as authorized by the 2011 Legislature, will bring theLottery debt service coverage ratio very close to this 4.0 minimum -- the Commission projects that by the end of FY 2013, this ratio will be at 4.3. This projection assumes that
1 Excludes conduit or “pass through” revenue bonds.
STATE OF OREGON STATE DEBT POLICY ADVISORY COMMISSION STATEDEBT POLICY ADVISORY COMMISSION
2

8/3/2019 STATE DEBT POLICY ADVISORY COMMISSION: Approved Report
http://slidepdf.com/reader/full/state-debt-policy-advisory-commission-approved-report 13/85
future Lottery bonds are sold with level debt service over a twenty year term; under this bondstructuring approach, the debt capacity for new Lottery bonds will be $85 million in FY 2014or $167 million for the 2013-15 biennium.
Debt Capacity for
Lottery Revenue Bond Program($ Millions)
Fiscal Year
Ending
June 30th
Annual Amount of Debt
That May be Issued within
Debt Service Coverage Ratios
Debt Ratio
Coverage
(Times)
2012 - * 4.0
2013 - * 4.3
2014 $85 4.0
2015 82 4.0
2016 325 4.0
2017 127 4.0
Total FY 2014-17
Lottery Debt Capacity$619
*Assumes issuance of $223 million in Lottery revenue bonds authorized by 2011 Legislature.
As proposed in last year’s report, a modest amount of outstanding Lottery debt was refundedand restructured in March 2011 to free up additional lottery debt capacity for the 2011-13 biennium. Additionally, Lottery bonds were sold concurrently for new projects and werestructured with delayed principal repayment to “levelize” the program’s overall debt servicerepayment pattern. While this refunding freed up lottery debt capacity this biennium, lotteryrevenues continue to decline, translating into less overall debt capacity than was projected inthe 2011 SDPAC report. Continued use of delayed principal repayment structuring may allowthe State to increase future Lottery debt capacity with minimal increased interest costs,however, further reductions in projected long-term Lottery revenues may offset theeffectiveness of this debt structuring technique.
The Commission acknowledges that capital projects funded by Lottery-backed bonds areextremely important to Oregon’s long-term economic health. Given the continuingreductions in projected Lottery revenues, we recommend that state decision-makers minimizethe authorization of any additional Lottery bonds during the 2011-13 biennium to only themost critical economic development projects and priorities of the State.
• The State’s Net Tax-Supported Debt (NTSD) has increased significantly during the past
few years. Prior to FY 2003, Oregon’s debt burden was well below the 50-state medians ascalculated by Moody’s Investor Service. However, in 2003 the state issued approximately $2 billion in pension obligation bonds and $432 million in appropriation bonds for budgetdeficit financing, which significantly increased the state’s net tax-supported debt. Since thattime, the State has continued to issue Lottery and Highway User Tax bonds, substantiallyadding to its NTSD debt burden and debt ratios.
STATE OF OREGON STATE DEBT POLICY ADVISORY COMMISSION STATEDEBT POLICY ADVISORY COMMISSION
3

8/3/2019 STATE DEBT POLICY ADVISORY COMMISSION: Approved Report
http://slidepdf.com/reader/full/state-debt-policy-advisory-commission-approved-report 14/85
8/3/2019 STATE DEBT POLICY ADVISORY COMMISSION: Approved Report
http://slidepdf.com/reader/full/state-debt-policy-advisory-commission-approved-report 15/85
The Commission is concerned, however, about the current financial status of the OregonDepartment of Energy (ODOE) Alternate Energy General Obligation Bond Program. This bond program was established in 1980 to provide low-interest loans through the Small ScaleEnergy Loan Program (SELP) to individuals, companies, state agencies, local governmentsand non-profits for a range of energy efficiency and renewable energy projects. The Office of
the State Treasurer, upon review of ODOE’s most recent projected cash flows of outstandingdebt, anticipated bonding plans and loan repayments, has concluded that the SELP programis financially stressed and may soon require General Fund support due the rapidly declininglevels of its loan loss reserves following the default and write off in 2009 of an $18 millionloan on an ethanol facility coupled with the growing number of other large, delinquent loansthat are 91 days or more past due. While ODOE is working on tightening its loanunderwriting standards and continues to aggressively pursue delinquent borrowers, ODOE’scash flow projections indicate that they will need General Fund cash infusions to cover their agency’s general obligation bond payments ranging from $2 to $5 million per year, beginning in FY 2015 and continuing through FY 2019, or up to $20 million overall based onthe current state of their loan portfolio.
Given this impending situation, the Commission recommends that the Legislature andGovernor step up their monitoring of the SELP program and put tighter parameters andrestriction on ODOE’s future loan commitments to assure that General Fund support of thishistorically “self-supporting” and “non-tax supported” general obligation bond program iskept to a minimum.
In summary, while the Commission projects that the State will have available debt capacity inthe years to come, it notes that this debt capacity must be balanced against the considerable backlog of pressing capital projects and transportation improvements for which the State willneed to tap the credit markets for funding. The Commission therefore continues to recommendthat the Legislature and Governor limit their bonding authorizations to only the highest priorityState capital projects in order to maintain the State’s strong credit ratings and overall healthyfinancial position.
STATE OF OREGON STATE DEBT POLICY ADVISORY COMMISSION STATEDEBT POLICY ADVISORY COMMISSION
5

8/3/2019 STATE DEBT POLICY ADVISORY COMMISSION: Approved Report
http://slidepdf.com/reader/full/state-debt-policy-advisory-commission-approved-report 16/85
This Page Intentionally Blank
STATE OF OREGON STATE DEBT POLICY ADVISORY COMMISSION STATEDEBT POLICY ADVISORY COMMISSION
6

8/3/2019 STATE DEBT POLICY ADVISORY COMMISSION: Approved Report
http://slidepdf.com/reader/full/state-debt-policy-advisory-commission-approved-report 17/85
I. BONDING IN OREGON
Oregon operates under a biennial debt review and authorization process. Under that model, eachindividual bonding program receives specific legislative authorization and is managed by agovernment agency. The Oregon State Treasury, as issuer of all State of Oregon bonds, ischarged with the responsibility to centrally oversee all long-term debt programs. The State uses
four primary types of long-term debt finance obligations: general obligation bonded debt, directrevenue bonded debt, appropriation credits, and conduit revenue bonds. General obligationauthorized limits are normally expressed as a percentage of statewide value of taxable property.Revenue bonds and appropriation credits are usually limited by the Legislature to a specificdollar amount.
A brief explanation of the bond authorization and issuance process and the debt obligation typesand associated State of Oregon bonding programs are provided below.
A. Authorization and Issuance Process
State Treasurer
The State Treasurer has been given broad responsibility and authority with respect to the sale andmanagement of State bonds. The State Treasurer has assigned day-to-day responsibility for thecoordinated issuance of all state obligations to the Debt Management Division of the OregonState Treasury. The Division reviews the structure and security features of each bond andappropriation credit and recommends issuance to the State Treasurer. In addition, the Divisioncoordinates the timing of the various agency bond sales, administers the issuance of bonds,secures credit ratings, prepares transcripts and other documents, provides for the delivery of bonds, assists with the signing and closing of bond issues, and coordinates Security andExchange Commission (SEC) disclosure issues. Also, Division staff provides advice to Stateagencies regarding market developments and makes debt policy and legislationrecommendations to the State Treasurer.
Biennial Legislative Limitations
In addition to constitutional and statutory authorities and limitations, Oregon follows alegislative practice of biennially approving bond volume limits. Prior to each biennium, theGovernor’s budget, in conjunction with advice from the State Treasurer, details programamounts recommended for bonding authority during the upcoming biennium. The budgetrecommendation takes into account requests by agencies for capital project needs, as well asgrant and loan program needs. The Legislature then conducts a program-by-program review process and approves what it determines to be an appropriate level of issuance. Although this process has been successful, increasing demand for financing state capital needs necessitates amore comprehensive and longer-range approach to capital financing. The purpose of this report
is to give the Governor and the Legislature additional advice when considering and approving biennial bond volume limits, as well as to make recommendations the Commission believeswould enhance the State’s bond ratings and maintain access to low-cost of capital financing.
STATE OF OREGON STATE DEBT POLICY ADVISORY COMMISSION STATEDEBT POLICY ADVISORY COMMISSION
7

8/3/2019 STATE DEBT POLICY ADVISORY COMMISSION: Approved Report
http://slidepdf.com/reader/full/state-debt-policy-advisory-commission-approved-report 18/85
B. State of Oregon Bonding Authorizations
General Obligation Bonds
General Obligation (GO) debt is secured by the full faith and credit of the participating issuer,for our purposes, the State of Oregon. Typically, GO debt necessitates constituency approval. In
the State’s case, each GO bond program was created by a constitutional amendment passed bystate voters. Therefore, the People of the State have unconditionally pledged to pay debt service(i.e. principal and interest) payments, over the life of each GO issue. This means that barring theexistence of other adequate repayment sources, all unrestricted public revenues must be used asneeded to support debt service payments. This may include the levy of a statewide property tax if necessary and allowed by law.
Article XI, Section 7 of the Constitution provides the State with the general authority to issuegeneral obligation debt. Currently there are 18 constitutionally authorized GO bond programs.4
While each of these programs has the potential for drawing on the State’s General Fund or other taxing authority, many of the programs are fully self-supporting and are repaid from programrevenues, gifts, grants, or other revenue streams.
The constitutionally authorized State of Oregon general obligation bond programs are listed below.5
• General Purpose Bonds – Article XI, Section 7
• State Highway Bonds – Article XI, Section 7
• Veterans Welfare Bonds – Article XI-A
• State Power Development Bonds – Article XI-D
• State Forest Rehabilitation Bonds – Article XI-E
•
Higher Education Building Bonds – Article XI-F(1)• Higher Education Facilities and Community College Bonds – Article XI-G6
• Pollution Control Bonds – Article XI-H
• Water Resources Bonds – Article XI-I(1)
• Elderly and Disabled Housing Bonds – Article XI-I(2)
• Alternate Energy Bonds – Article XI-J
• Oregon School Bond Guaranty Program – Article XI-K
•
Oregon Opportunity Bonds – Article XI-L4 General Purpose bonds and State Highway bonds are both provided constitutional bonding authority by Article XI,Section 7. Likewise, Article XI-G provides constitutional bonding authority for both Higher Education bonds andCommunity College bonds.5 State Highway Bonds, State Power Development bonds, State Forest Rehabilitation bonds, Water Resources bonds, and Oregon School Bond Guaranty Program bonds currently have no State debt outstanding.6 Higher Education Facilities bonds are issued by the Board of Higher Education whereas Community College bondsare issued by the Department of Education. Higher Education and Community College bond issuance are combinedand charged against the total debt authorized by the State Constitution Article XI-G.
STATE OF OREGON STATE DEBT POLICY ADVISORY COMMISSION STATEDEBT POLICY ADVISORY COMMISSION
8

8/3/2019 STATE DEBT POLICY ADVISORY COMMISSION: Approved Report
http://slidepdf.com/reader/full/state-debt-policy-advisory-commission-approved-report 19/85
• Seismic Rehabilitation of Public Education Buildings – Article XI-M
• Seismic Rehabilitation of Emergency Services Buildings – Article XI-N
• Pension Obligation Bonds – Article XI-O
•
Public School Facilities Bonds – Article XI-P• State General Purpose Bonds – Article XI-Q
Direct Revenue Bonds
Unlike GO bonds, direct revenue program debt is not secured by the State’s unlimited pledge tofund debt service with unrestricted public revenues or, where permitted, a statewide ad valorem property tax. Rather, funds to pay debt service are provided by a specific dedicated revenuestream, and normally program revenues are directly associated with the funded project(s).Further, revenue programs typically do not require a vote of the People, but must be authorized by the Legislative Assembly. The State Legislature at all times holds the right to refer programapproval to Oregon voters. For example, the 69th Legislative Assembly referred Measure 52,
proposing a Lottery-revenue backed bond program to finance education needs throughout thestate.
Oregon Revised Statutes provide for a variety of revenue bond programs. These programs areeach considered fully self-supporting, and have no general obligation backing from the State.However, if program revenues were to become insufficient to support debt service payments, thisdoes not preclude the State from providing a funding stream. Statutorily authorized directrevenue bond programs that are currently active are listed below.
• State Highway User Tax Bonds – ORS 367.620
• Oregon Transportation Infrastructure Fund Bonds – ORS 367.6307
• Lottery Revenue Bonds – ORS 286A.560 to 286A.585
• Oregon Bond Bank Revenue Bonds – ORS Chapter 285B
• Single-Family and Multifamily Revenue Bonds – ORS 456.661
Conduit Revenue Bonds
Conduit revenue bonds are securities that are issued by a governmental unit to finance a projectfor a third party. Debt service payments are the obligation of the third party borrower and do notconstitute a general obligation of the State or the issuing governmental agency. Economic andindustrial development revenue bonds are a common type of conduit revenue security.
The State has three authorized and active conduit or “pass-through” revenue bond programs:
• Oregon Facilities Authority (OFA) – ORS Chapter 289
• Industrial & Economic Development Revenue Bonds – ORS Chapter 285B
• Housing Development Revenue Bonds – ORS 456.692
71 Various legislative bills have authorized $50 million in Transportation Infrastructure Bonds; however, no bondshave been issued to date by this program.
STATE OF OREGON STATE DEBT POLICY ADVISORY COMMISSION STATEDEBT POLICY ADVISORY COMMISSION
9
8/3/2019 STATE DEBT POLICY ADVISORY COMMISSION: Approved Report
http://slidepdf.com/reader/full/state-debt-policy-advisory-commission-approved-report 20/85
Under these programs, the State is considered the issuer, but has no obligation to pay debtservice. Payments are made by the entities on whose behalf the bonds were issued.
Appropriation Credits
Similar to revenue program debt, appropriation credits are not secured by the State’s unlimited
pledge to fund debt service with unrestricted public revenues or, where permitted, a statewide advalorem property tax. The State has historically used two types of appropriation credits:
• Appropriation Bonds – SB 856 – 2003 Legislature
• Certificates of Participation (COPs) – ORS 283.085
These credits are special limited obligations of the State payable solely from funds appropriatedor otherwise made available by the State Legislative Assembly. The obligation of the State to provide appropriated moneys and to pay the bonds is subject to future appropriation by theLegislature for the fiscal period in which payments are due. As with State direct revenue bond programs, appropriation credits do not require a vote of the People, but must be authorized by theLegislative Assembly. With the passage of the Constitutional amendment in 2010 authorizing the
State to issue General Obligation Bonds for various State-owned office buildings, facilities andother capital projects, it is unlikely that the State will continue to issue Certificates of Participation in the future. Rather the types of projects that were traditionally funded throughCOPs will instead be financed through the issuance of lower cost State General Purpose ArticleXI-Q General Obligation bonds.
STATE OF OREGON STATE DEBT POLICY ADVISORY COMMISSION STATEDEBT POLICY ADVISORY COMMISSION
10
8/3/2019 STATE DEBT POLICY ADVISORY COMMISSION: Approved Report
http://slidepdf.com/reader/full/state-debt-policy-advisory-commission-approved-report 21/85
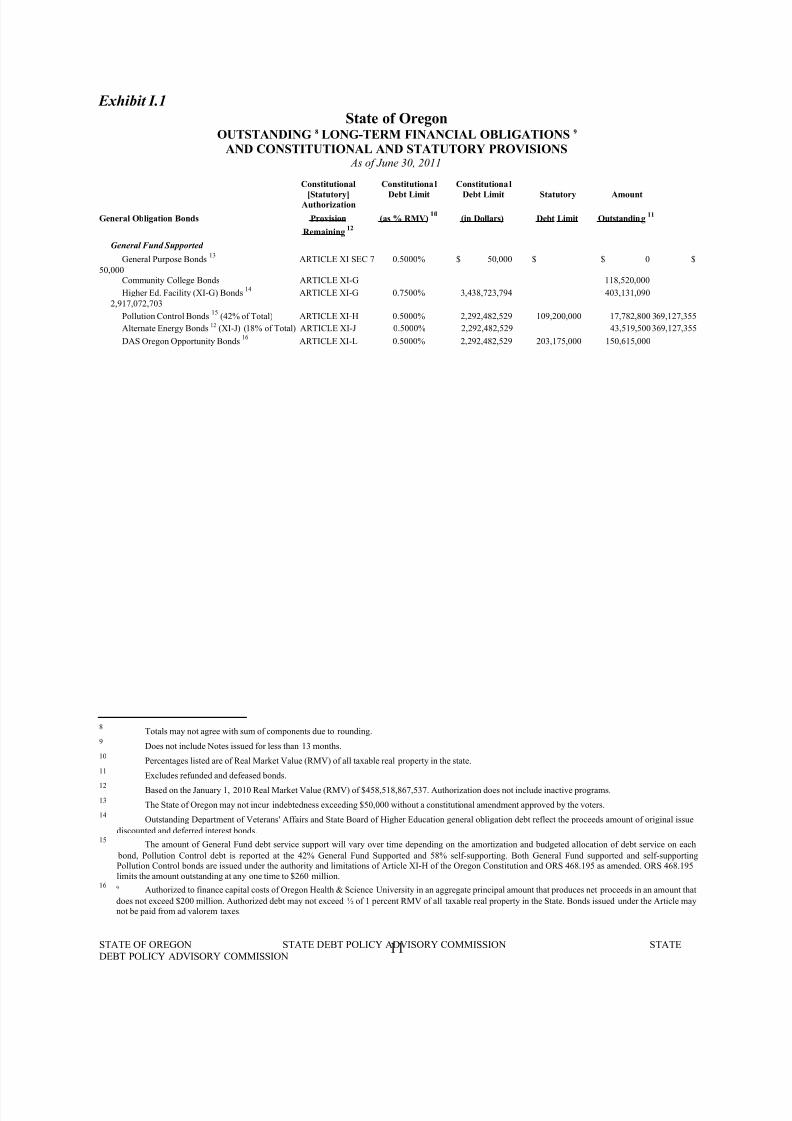
Exhibit I.1
State of OregonOUTSTANDING 8 LONG-TERM FINANCIAL OBLIGATIONS 9
AND CONSTITUTIONAL AND STATUTORY PROVISIONS As of June 30, 2011
Constitutional Constitutional Constitutional
[Statutory] Debt Limit Debt Limit Statutory AmountAuthorization
General Obligation Bonds Provision (as % RMV)10
(in Dollars) Debt Limit Outstanding 11
Remaining 12
General Fund Supported
General Purpose Bonds 13ARTICLE XI SEC 7 0.5000% $ 50,000 $ $ 0 $
50,000Community College Bonds ARTICLE XI-G 118,520,000
Higher Ed. Facility (XI-G) Bonds 14
ARTICLE XI-G 0.7500% 3,438,723,794 403,131,090
2,917,072,703
Pollution Control Bonds 15
(42% of Total) ARTICLE XI-H 0.5000% 2,292,482,529 109,200,000 17,782,800 369,127,355
Alternate Energy Bonds 12 (XI-J) (18% of Total) ARTICLE XI-J 0.5000% 2,292,482,529 43,519,500 369,127,355
DAS Oregon Opportunity Bonds 16
ARTICLE XI-L 0.5000% 2,292,482,529 203,175,000 150,615,000
8Totals may not agree with sum of components due to rounding.
9Does not include Notes issued for less than 13 months.
10Percentages listed are of Real Market Value (RMV) of all taxable real property in the state.
11
Excludes refunded and defeased bonds.12
Based on the January 1, 2010 Real Market Value (RMV) of $458,518,867,537. Authorization does not include inactive programs.13
The State of Oregon may not incur indebtedness exceeding $50,000 without a constitutional amendment approved by the voters.14
Outstanding Department of Veterans' Affairs and State Board of Higher Education general obligation debt reflect the proceeds amount of original issue
discounted and deferred interest bonds.15
The amount of General Fund debt service support will vary over time depending on the amortization and budgeted allocation of debt service on each
bond, Pollution Control debt is reported at the 42% General Fund Supported and 58% self-supporting. Both General Fund supported and self-supportingPollution Control bonds are issued under the authority and limitations of Article XI-H of the Oregon Constitution and ORS 468.195 as amended. ORS 468.195limits the amount outstanding at any one time to $260 million.
16 9 Authorized to finance capital costs of Oregon Health & Science University in an aggregate principal amount that produces net proceeds in an amount that
does not exceed $200 million. Authorized debt may not exceed ½ of 1 percent RMV of all taxable real property in the State. Bonds issued under the Article maynot be paid from ad valorem taxes.
STATE OF OREGON STATE DEBT POLICY ADVISORY COMMISSION STATEDEBT POLICY ADVISORY COMMISSION
11

8/3/2019 STATE DEBT POLICY ADVISORY COMMISSION: Approved Report
http://slidepdf.com/reader/full/state-debt-policy-advisory-commission-approved-report 22/85
Seismic Rehab – Public Education Bldgs ARTICLE XI-M 0.2000% 916,993,012 11,105,000 905,888,012Seismic Rehab – Emergency Service Bldgs ARTICLE XI-N 0.2000% 916,993,012 10,935,000 906,058,012
DAS Pension Obligation Bonds 17
(32% of Total) ARTICLE XI-O 1.0000% 4,584,965,058 645,491,200
State General Purpose18 (85% of total) ARTICLE XI-Q 1.0000% 4,584,965,058 257,652,0004,327,313,058
Total General Fund Supported $1,658,751,590Fully Self-Supporting
State Highway Bonds ARTICLE XI SEC 7 1.0000% 4,584,965,058 04,584,965,058
Veteran's Welfare Bonds 7 ARTICLE XI-A 8.0000% 36,679,720,467 374,730,00036,304,990,467
Higher Ed. XI-F Bonds7
ARTICLE XI-F(1) 0.7500% 3,438,723,794 1,130,713,003
2,308,010,791
Pollution Control Bonds8
(58% of Total) ARTICLE XI-H 0.5000% 2,292,482,529 150,800,000 24,557,200
Water Resources Bonds ARTICLE XI-I(1) 1.5000% 6,877,447,587 06,877,447,587
Elderly & Disabled Housing Bonds ARTICLE XI-I(2) 0.5000% 2,292,482,529 147,535,0002,144,947,529
Alternate Energy Project Bonds19
(82% of Total) ARTICLE XI-J 0.5000% 2,292,482,529 198,255,500
1,681,580,174
DAS Pension Obligation Bonds10 (68% of Total) ARTICLE XI-O 1.0000% 4,584,965,058 1,371,668,800
State General Purpose11
(15% of Total) ARTICLE XI-Q 1.0000% 4,584,965,058 45,468,000 4,539,497,05
Total Self-Supporting $3,292,927,503
Total General Obligation Bonds $4,951,679,093
Revenue Bonds
Direct Revenue Bonds
Lottery Revenue Bond Program(s) [ORS 286A.563-585] --- --- --- 1,192,080,000
Transportation Infrastructure Bank [ORS 367.030] --- --- 200,000,000 0 200,000,000
Highway User Tax [ORS 367.620] --- --- 3,240,000,000 2,199,465,000
Single & Multi-Family Housing Programs [ORS 456.661] --- --- 2,500,000,000 1,237,345,0001,262,655,000
Economic Development - Bond Bank [ORS Ch. 285B] --- --- --- 156,900,000
State Fair & Exposition Center [ORS Ch. 565] --- --- 10,000,000 0 10,000,000
Total Direct Revenue Bonds $4,785,790,000
17Approved by the voters September 16, 2003. Currently, 32% is General Fund supported, 68% is paid from non-General Fund sources.
18The amount of General Fund debt service will vary over time depending on the amortization and budgeted allocation of debt service on each bond. State
General Purpose debt is reported at 85% General Fund supported and 15% self-supporting.19
The amount of General Fund debt service support will vary over time depending on the amortization and budgeted allocation of each bond, Alternate Energy
debt is reported at 18% General Fund supported and 82% self-supporting. Both General Fund supported and self-supporting Alternate Energy bonds are issuedunder authority and limitations of Article XI-J of the Oregon Constitution.
STATE OF OREGON STATE DEBT POLICY ADVISORY COMMISSION STATEDEBT POLICY ADVISORY COMMISSION
12

8/3/2019 STATE DEBT POLICY ADVISORY COMMISSION: Approved Report
http://slidepdf.com/reader/full/state-debt-policy-advisory-commission-approved-report 23/85
Pass Through Revenue Bonds
Economic Development – Industrial Dev [ORS Ch. 285] --- --- --- $ 468,957,555Oregon Facilities Authority [ORS Ch. 289] --- --- --- 1,565,186,686Multi-family Housing Programs [ORS 456.692] --- --- --- 195,612,600
Total Pass Through Revenue Bonds $2,229,756,840
Appropriation Credits
Certificates of Participation (COP’s GF) [ORS Ch. 283.085] --- --- --- $ 1,161,571,750Certificates of Participation (COP’s Non-GF) [ORS Ch. 283.085] --- --- --- 204,983,250Oregon Appropriation Bonds [SB 856 – 2003 Legislature] --- 431,560,000 163,195,000
Total Appropriation Credits $1,529,750,000
The State of Oregon, Oregon State Treasury, acting on behalf of the Municipal Debt Advisory Commission (MDAC), maintains debt information to assistmunicipalities in debt related matters. The data is based on information obtained from sources believed to be reliable; however, its accuracy cannot be guaranteed. TheOregon State Treasury does not independently verify the information received from reporting municipalities. The State of Oregon is not responsible for the accuracy,completeness or timeliness of the information obtained and the data presented and disclaims any liability for or obligation to bond owners or others concerning theaccuracy, completeness or timeliness of the data and information presented.
STATE OF OREGON STATE DEBT POLICY ADVISORY COMMISSION STATEDEBT POLICY ADVISORY COMMISSION
13
8/3/2019 STATE DEBT POLICY ADVISORY COMMISSION: Approved Report
http://slidepdf.com/reader/full/state-debt-policy-advisory-commission-approved-report 24/85
C. General Fund Supported and Net Tax-Supported Debt
The municipal credit rating industry uses a number of different measurements and indicators toevaluate a government’s debt burden. Two of those measurements include “general fund
supported debt” and “net tax-supported debt.”
A significant proportion of the State’s overall long-term debt obligations are fully self-supportingwith the source of bond debt service payments coming from resources other than General Fundappropriations or other tax revenue. Bonding programs that do not require State appropriatedGeneral Fund support or other direct State tax revenue support would not be included in either General Fund or net tax-supported debt measurements. However, in keeping with rating agency practice, some programs in which debt service payments are made with dedicated funds or special-tax revenue sources may still be viewed as General Fund or net tax-supported debtdepending on the interpretation of the funding source(s).20 Examples of bond programs that donot require State tax revenues or General Fund appropriations to pay debt service include thegeneral obligation Veterans’ Welfare housing program, the Single and Multifamily Housingrevenue bond program and all conduit revenue bonds.
General Fund Supported Debt (GFSD) is classified as long-term obligations whose debt serviceis paid primarily from General Fund appropriations made by the State Legislature. Examplesinclude general obligation Higher Education Facility and Community College (Article XI-G) bonds, State General Purpose Bonds (Article XI-Q) bonds, and Certificates of Participation(COPs).
Net Tax-Supported Debt (NTSD) is, by definition, all debt serviced by tax revenues of the State.This would include all General Fund supported debt and other long-term obligations supported by specific State taxes. Highway User Tax Revenue bonds are an example of long-term debt thatis net tax-supported but receives no General Fund appropriations. These bonds do not constitutea general obligation of the State but are instead payable solely from revenues received fromhighway user taxes. Furthermore, in accordance with the Oregon Constitution, highway user taxrevenues must be used exclusively for public highways, roads, streets and rest areas of the stateand the retirement of bonds for which such revenues have been pledged.
The three national rating agencies, Fitch Ratings, Moody’s, and Standard & Poor's, differ somewhat in their assumptions and definitions of General Fund and net tax-supported debt withrespect to the State of Oregon. For purposes of this report, the Commission has chosen to followMoody’s model in determining both General Fund and net tax-supported debt. This decision was based primarily on Moody’s statistical gathering and publishing of key debt ratios for the fiftystates, and its recognition as an accepted model.
As part of the development of this report, staff of the Office of the State Treasurer and theDepartment of Administrative Services reviewed all outstanding debt of the state with the goal of
providing a more precise estimate of the amount of State debt that is actually supported bygeneral fund revenues. This review resulted in reductions in the percentage of debt that isdesignated as General Fund in relation to COPs and Article XI-Q State General Purpose bondsfor State capital projects to General Obligation bonds issued by the Department of Environmental Quality for Pollution Control, and to the General Obligation debt issued by the
20 State Fair and Exposition Center bonds for example.
STATE OF OREGON STATE DEBT POLICY ADVISORY COMMISSION STATEDEBT POLICY ADVISORY COMMISSION
14

8/3/2019 STATE DEBT POLICY ADVISORY COMMISSION: Approved Report
http://slidepdf.com/reader/full/state-debt-policy-advisory-commission-approved-report 25/85
Oregon Department of Energy. Based on these changes, this report includes (at 100% except asotherwise indicated) the following programs in its assumptions of General Fund supported debt:
• Higher Education Facility & Community College Bonds (Article XI-G);
• Forty-two percent of Pollution Control Bonds (Article XI-H);
• Water Resources Bonds (Article XI-I(1));
• Eighteen percent of Alternate Energy Bonds (Article XI-J);
• Oregon School Bond Guaranty Bonds21 (Article XI-K);
• Oregon Opportunity Bonds (Article XI-L);
• Thirty-two percent of State Pension Obligation Bonds (Article XI-O);
• Oregon Appropriation Bonds (SB 856 – 2003 Legislature);
• Seismic Rehabilitation Bonds for Public Education (Article XI-M) and Public SafetyBuildings (Article XI-N);
• Public School Facility Bonds (Article XI-P);
• Eighty-five percent of State General Purpose Bonds (Article XI-Q); and
• Eighty-five percent of Certificate of Participation Obligations (ORS 283.085 to 283.092).
Net tax-supported debt includes the above-listed General Fund supported programs in addition tothe following:
• Balance of Pension Obligation Bonds, State General Purpose Bonds, and Certificates of Participation
• Lottery Revenue Bonds (ORS 286A.560-585);
• State Highway Bonds (Article XI, Section 7);
• Highway User Tax Revenue Bonds (ORS 367.620); and
• Oregon Transportation Infrastructure Fund Bonds (ORS 367.630).22
Exhibit I.2 provides a comparison of total outstanding gross debt; General Fund supported debtand net tax-supported debt as of June 30, 2011.
21 The Oregon School Bond Guaranty Program (OSBG) allows the State to guaranty qualified bonds of eligibleschool districts, education service districts and community colleges. As of June 30, 2011 there are no outstandingState general obligation bonds that are guaranteed under this program. While the Oregon School Bond GuarantyProgram is technically part of the General Fund and net tax supported debt calculation, it is not directly built into themodel because the State has never issued any bonds to date for this program.22 No Transportation Infrastructure Fund bonds have ever been issued.
STATE OF OREGON STATE DEBT POLICY ADVISORY COMMISSION STATEDEBT POLICY ADVISORY COMMISSION
15

8/3/2019 STATE DEBT POLICY ADVISORY COMMISSION: Approved Report
http://slidepdf.com/reader/full/state-debt-policy-advisory-commission-approved-report 26/85
Exhibit I.2
STATE OF OREGON STATE DEBT POLICY ADVISORY COMMISSION STATEDEBT POLICY ADVISORY COMMISSION
Type & Purpose
General Fund
SupportedDebt
Net
Tax-SupportedDebt
Total
Gross DebtOutstanding
General Obligation Bonds
General Fund Supported
Community College Bonds 118,520,000$ 118,520,000$ 118,520,000$
Higher Education Facility (XI-G) Bonds 403,131,090 403,131,090 403,131,090 Pollution Control Bonds(42% of Total) 17,782,800 17,782,800 17,782,800 Alternate Energy Bonds (XI-J)(18% of Total) 43,519,500 43,519,500 43,519,500 DAS Oregon Opportunity Bonds 150,615,000 150,615,000 150,615,000 Seismic Rehab - Public Education Bldgs 11,105,000 11,105,000 11,105,000 Seismic Rehab - Emergency Service Bldgs 10,935,000 10,935,000 10,935,000 State General Purpose (XI-Q) Bonds (85% of total) 257,652,000 257,652,000 257,652,000 DAS Pension Obligation Bonds(32% of Total)* 645,491,200 645,491,200 645,491,200
Total General Fund Supported 1,658,751,590$ 1,658,751,590$ 1,658,751,590$
Fully Self-Supporting
Veterans' Welfare Bonds - - 374,730,000 Higher Education Facility (XI-F) Bonds - - 1,130,713,003 Pollution Control Bonds(58% of Total) - 24,557,200 24,557,200 Water Resources Bonds - - - Elderly & Disabled Housing Bonds - - 147,535,000 Alternate Energy Project Bonds(82% of Total) - - 198,255,500 State General Purpose (XI-Q) Bonds (15% of total) 45,468,000 45,468,000 DAS Pension Obligation Bonds(68% of Total)* - 1,371,668,800 1,371,668,800
Total Self-Supporting -$ 1,441,694,000$ 3,292,927,503$
Total General Obligation Bonds 1,658,751,590$ 3,100,445,590$ 4,951,679,093$
Revenue Bonds
Direct Revenue Bonds
Lottery Revenue Bond Program** - 1,192,080,000 1,192,080,000 Highway User Tax Revenue Bonds - 2,199,465,000 2,199,465,000 Single-Family & Multi-Family Housing - - 1,237,345,000 Economic Development - Bond Bank - - 156,900,000 State Fair & Exposition Center Bonds - - -
Total Direct Revenue Bonds -$ 3,391,545,000$ 4,785,790,000$
Conduit or Pass Through Revenue Bonds
Economic & Industrial Development - - 468,957,555 Oregon Facilities Authority - - 1,565,186,686 Multi-Family Housing Programs - - 195,612,600
Total Conduit or Pass Through Revenue Bonds -$ -$ 2,229,756,841$
Appropriation Credits Certificates of Participation (COP's)(85% GF) 1,161,571,750 1,366,555,000 1,366,555,000
Oregon Appropriation Bonds 163,195,000 163,195,000 163,195,000
Total Appropriation Credits 1,324,766,750$ 1,529,750,000$ 1,529,750,000$
Total Gross Debt $ 13,496,975,934
Total Debt - Less Conduit Revenue Bonds 2,983,518,340$ 8,021,740,590$ 11,267,219,093$
*To conform to rating agency methodologies, Pension Obligation Bonds are considered net tax-supported debt.
** Rating agencies recognize that these programs are supported by a dedicated Lottery revenue source.
State of Oregon
Comparison of Long-Term Debt Outstandingas of June 30, 2011
16

8/3/2019 STATE DEBT POLICY ADVISORY COMMISSION: Approved Report
http://slidepdf.com/reader/full/state-debt-policy-advisory-commission-approved-report 27/85
THIS PAGE INTENTIONALLY BLANK
STATE OF OREGON STATE DEBT POLICY ADVISORY COMMISSION STATEDEBT POLICY ADVISORY COMMISSION
17

8/3/2019 STATE DEBT POLICY ADVISORY COMMISSION: Approved Report
http://slidepdf.com/reader/full/state-debt-policy-advisory-commission-approved-report 28/85
II. CURRENT DEBT PICTURE IN OREGON
A. Outstanding Debt
Exhibit II-1 shows a 10-year history of the State’s total outstanding obligations by major category from fiscal years ending 2002 to 2011.23
Prior to the late 1990s, the majority of State debt outstanding was linked to the bonds issued bythe Department of Veterans’ Affairs for veteran’s mortgages. Since that time, the State’s debtfinancing has been increasingly employed as a vehicle to fund a variety of State infrastructureand programmatic needs, which has raised the overall level of outstanding indebtednesssubstantially. While indebtedness for veteran’s mortgage bonds continues to decline, debtissuance for state highway improvements and single and multifamily mortgage revenue bondshas grown substantially over the past decade, as has the amount of indebtedness linked toconstruction of state prisons, economic development, and higher education projects.
In 2003, the Legislature authorized several major new bonding programs, including $2.1 billionin pension obligation bonds to fund the State’s Public Employees Retirement System (PERS)liability, $432 million in appropriation deficit bonds, and $1.9 billion in new Oregon Department
of Transportation (ODOT) highway user tax bonds to address statewide bridge and highwaymodernization needs. The collective impact of these initiatives has been a sharp increase in theState’s net tax-supported debt since FY 2003, a trend which is expected to continue as the balance of ODOT’s bonds are issued.
While new debt issuance has been significant, the numbers also need to be considered in thecontext of the types of debt issued. The following exhibits reflect all outstanding generalobligation bonds, direct revenue bonds and appropriation credit obligations respectively, rather than solely General Fund and net tax-supported debt programs. The exhibits are provided to givea historical overview of the State’s overall debt position.
Exhibit II-1
$0
$2
$4
$6
$8
$10
$12
2002 2003 2004 2005 2006 2007 2008 2009 2010 2011
B i l l i o n s
Fiscal Year endingJune 30th
Oregon's BondedIndebtednessOver thePast Decade
POBs
Appropriation Credits
Direct RevenueBonds
All GODebt Except
POBs
23 Does not include conduit or pass through revenue bonds.
STATE OF OREGON STATE DEBT POLICY ADVISORY COMMISSION STATEDEBT POLICY ADVISORY COMMISSION
18

8/3/2019 STATE DEBT POLICY ADVISORY COMMISSION: Approved Report
http://slidepdf.com/reader/full/state-debt-policy-advisory-commission-approved-report 29/85

8/3/2019 STATE DEBT POLICY ADVISORY COMMISSION: Approved Report
http://slidepdf.com/reader/full/state-debt-policy-advisory-commission-approved-report 30/85
issued a greater volume of Lottery revenue bonds to fund various economic development programs and activities; and the authorization of Oregon Transportation Infrastructure Act(OTIA) led to the issuance of $2.4 billion in Highway User Tax bonds to fund criticaltransportation improvements around the state. Over the next several years, it is anticipated thatthe amount of outstanding Highway User Bonds will continue to increase with issuance of $840
million in Highway User Tax bonds to fund the Jobs and Transportation Act (JTA) congestionmanagement program.
Exhibit II-3
$0
$500
$1,000
$1,500
$2,000
$2,500
$3,000
$3,500
$4,000
$4,500
$5,000
2002 2003 2004 2005 2006 2007 2008 2009 2010 2011
M o n s
Fiscal Year ending June 30th
Direct Revenue Bonds Outstanding by Bond Program
EDD Bond Bank
Highway User
Bonds
Lottery Bonds
SF & MF
MortgageBonds
Appropriation obligations include both Certificates of Participation (COPs) and Appropriation bonds. The amount of appropriation obligation that can be issued is determined by the legislatureeach biennium. Exhibit II-4 illustrates appropriation credit issuance history through fiscal year ending June 30, 2011.
The significant increase in COP debt from about $191 million in FY 1995 to about $1.37 billionin FY 2011 was related to the passage of Ballot Measure 11 by Oregon voters in 1994 and to the
decision by the 2007 Legislature to replace the aging State Mental Hospital in Salem. Measure11 created mandatory minimum penalties for specified crimes and required that juvenilescharged with certain violent crimes be tried and sentenced as adults. The practical effect of Measure 11 was the considerable requirement for increased construction of adult and juvenile prisons and correctional facilities. COP obligations related to the operations of the State’s prisons, and the State’s responsibility for both the community corrections system and the State’s juvenile justice system currently represents about 39% of the total COP debt outstanding. The
STATE OF OREGON STATE DEBT POLICY ADVISORY COMMISSION STATEDEBT POLICY ADVISORY COMMISSION
20

8/3/2019 STATE DEBT POLICY ADVISORY COMMISSION: Approved Report
http://slidepdf.com/reader/full/state-debt-policy-advisory-commission-approved-report 31/85
replacement of the State Hospital will be completed in stages over the next 2 years, at an overall projected cost of approximately $509 million.
With the recent passage of the Constitutional amendment authorizing the issuance of lessexpensive General Obligation Article XI-Q bonds for the type of state office building, facility,and other capital projects previously financed with COPs, it is unlikely the state will issue COPs
in the future. It is anticipated that over time, as COPs become eligible, the State will sell ArticleXI-Q to refund all existing COPs, saving taxpayers tens of millions in interest costs over time.
The first and only authorized State of Oregon Appropriation Bonds was issued in April 2003 inthe amount of $431.6 million. The bonds were authorized by Senate Bill 856 (2003) and enacted by the 2003 Legislature Assembly for the purpose of financing a portion of the State’s budgetdeficit which occurred towards the end of the 2001-03 biennium. These bonds were structuredwith a ten year term and will be paid off in full on September 1, 2013.
Exhibit II-4
$0
$200
$400
$600
$800
$1,000
$1,200
$1,400
$1,600
$1,800
2002 2003 2004 2005 2006 2007 2008 2009 2010 2011
M i l l i o n s
Fiscal Year ending June 30th
Outstanding Appropriation Credits
Appropriation
Bonds
Certificates of
Participation
B. Unmet Capital Needs of the State of Oregon
While the State will reach its 5% General Fund debt capacity limit this biennium, with theretirement of outstanding Appropriation Deficit Bonds in September 2013, a significant amountof debt capacity will once again become available in FY 2014 and beyond. In the coming biennium, the Governor and Legislature will need to carefully evaluate the highest and best usesof future General Fund and Lottery debt capacity, as there remains a considerable need for
STATE OF OREGON STATE DEBT POLICY ADVISORY COMMISSION STATEDEBT POLICY ADVISORY COMMISSION
21

8/3/2019 STATE DEBT POLICY ADVISORY COMMISSION: Approved Report
http://slidepdf.com/reader/full/state-debt-policy-advisory-commission-approved-report 32/85
capital project funding throughout the state. Below is a list of some of the most pressing unmetcapital needs in Oregon:
Human Services
The State has been authorized to sell $62 million in Article XI-Q general obligation bonds for the
State Hospital Replacement Project during the 2011-13 biennium. This will allow for thecompletion of the Salem site and provide funding to continue some work on the Junction Citysite. Although final costs of the Junction City facility will depend on a variety of policy decisionsand economic conditions, current estimates indicate that completion of the Junction City site willrequire at least $80 million.
Achieving additional efficiencies in health care delivery may require further upgrades toinformation technology (IT) systems in the state. Approximately $9 million in XI-Q bonds for human services related IT systems was authorized this biennium. It is likely that a similar amount of funding will be required in future biennia to match significant federal commitments inthis area.
Public Safety
The need for further expansion of the State’s correctional facilities is dependent upon policychoices as well as projected population growth and demographic trends. At this time, theDepartment of Corrections (DOC) has identified the need for approximately $80 million infunding for the construction of the next phase of the Junction City minimum custody facility.The majority of this amount will likely be required in the 2013-15 biennium. In addition, bothDOC and the Oregon Youth Authority have significant backlogs of deferred maintenance ontheir facilities, totaling several million dollars; while some funding has been provided to addressthis in past biennia, no new funds were authorized for the 2011-13 budget cycle.
The Oregon Military Department (OMD) has identified a substantial need for both new
construction and maintenance/renovation projects at armories, readiness centers and other OMDfacilities throughout the state. OMD estimates a need for over $14 million in each of the next two biennia to address these needs. In addition, OMD manages the Seismic Rehabilitation grant program through its Office of Emergency Management; this program makes grants for seismicupgrade of public schools and public safety facilities around the state. The Legislative Assemblyauthorized the issuance of $7.6 million in Article XI-M Seismic Rehabilitation general obligation bonds in the 2011-13 biennium. It should be noted that based on the preliminary findings of theOregon Department of Geology and Mineral Industries (DOGAMI), there is a pressing need for seismic retrofit of a significant portion of Oregon’s public schools as well as public safetyfacilities estimated to cost in the many billions of dollars.
STATE OF OREGON STATE DEBT POLICY ADVISORY COMMISSION STATEDEBT POLICY ADVISORY COMMISSION
22

8/3/2019 STATE DEBT POLICY ADVISORY COMMISSION: Approved Report
http://slidepdf.com/reader/full/state-debt-policy-advisory-commission-approved-report 33/85
Education
The Oregon University System (OUS) has projected it still has significant projected capital needsthat include both new construction of classrooms, dorms, and other educational facilities, as well
as deferred maintenance at existing facilities around the state. While recent legislation has provided OUS greater autonomy, including the ability to issue its own revenue bonds, it is likelythat a portion of OUS’s significant future capital improvements will continue to be fundedthrough state general obligation and Lottery bonds.
In the 2009-11 biennium, approximately $190 million in OUS capital construction projects wereauthorized using bonds supported by General Fund or Lottery revenues. By contrast, during the2011-13 biennium, no new OUS capital construction projects financed with General Fundsupported bonds were authorized, although $112 million in new OUS capital construction projects financed with Lottery Bonds were approved. Given the State’s new goal that 40% of adult Oregonians will have completed a four-year college degree program by 2025, it is likelythat OUS facility needs to meet this goal will be significant.
The Department of Community College and Workforce Development has identified a number of construction projects throughout the state that local community colleges would like to undertakeif General Fund supported bond funding becomes available again. After providing almost $125million in General Fund supported Article XI-G bonds for community college construction projects in the preceding four years, no new projects were authorized by the Legislature in the2011-13 biennium.
Public Schools
In May 2010, the Oregon electorate adopted a constitutional amendment allowing for theissuance of State general obligation bonds as a match to local public school district funds for school capital projects (Article XI-P bonds). Given the State’s limited General Fund-supported
debt capacity relative to the enormous potential need for both school repair and new schoolconstruction, it is critical that the State invest in the development of a long-term master capital plan for this bonding program, including the establishment of formal funding criteria and amethodology for prioritizing allocations among the myriad of Oregon school capital needs for which these bonds can be issued.
Economic Development
The Oregon Business Development Department (OBDD) has traditionally used Lottery Bonds tore-capitalize its Infrastructure Bond Bank. This program makes low interest loans to localgovernments for infrastructure including drinking water and sewer improvements. In the 2011-13 biennium, the Legislature authorized $10 million in Lottery Bonds for this purpose. This amount
reflects a reduction from the approximately $17 million and $21 million authorized in the two preceding biennia. OBDD estimates there remains significant unmet capital needs in this areathroughout the state.
Transportation
In recognition of the need for an efficient and well-maintained transportation infrastructure, theLegislative Assembly approved HB 2001 (2009), “The Oregon Jobs and Transportation Act”
which increased issuance authority for Highway User Tax bonds by $840 million; the 2011
STATE OF OREGON STATE DEBT POLICY ADVISORY COMMISSION STATEDEBT POLICY ADVISORY COMMISSION
23

8/3/2019 STATE DEBT POLICY ADVISORY COMMISSION: Approved Report
http://slidepdf.com/reader/full/state-debt-policy-advisory-commission-approved-report 34/85

8/3/2019 STATE DEBT POLICY ADVISORY COMMISSION: Approved Report
http://slidepdf.com/reader/full/state-debt-policy-advisory-commission-approved-report 35/85

8/3/2019 STATE DEBT POLICY ADVISORY COMMISSION: Approved Report
http://slidepdf.com/reader/full/state-debt-policy-advisory-commission-approved-report 36/85

8/3/2019 STATE DEBT POLICY ADVISORY COMMISSION: Approved Report
http://slidepdf.com/reader/full/state-debt-policy-advisory-commission-approved-report 37/85
B. Inputs & Assumptions for General Fund Debt Capacity Model
As required by ORS 286A.555, the model projects debt capacity over a period of six years. Itdoes this for General Fund supported debt programs as a whole, intending for the Governor and
Legislature to determine what specific programs deserve funding within the capacity range. The February 16, 2011 Commission Report outlined capacity for the 2012 fiscal year through the2017 fiscal year. This 2012 Legislative Update provides a look at debt capacity for the 2013fiscal year through the 2017 fiscal year based on the December 2011 revenue forecast and the bonding authorizations by the Legislature in 2011.
The model is based on General Fund supported debt service as a percentage of General Fundrevenues. The Commission has chosen to use five percent as the model’s capacity target becauseit is the dividing point between a “green/available” capacity level and a “yellow/cautionary”target level as depicted above. It is acknowledged that this five percent target is not a strictcapacity limitation, but rather reflects an approach into the yellow or cautionary capacity range.The movement from one target level to the next should signal the need for a reevaluation of
existing debt authorization and future bonding priorities.
The model first solves for “overall capacity” to pay debt service on General Fund supported debtissuance. As noted earlier, upon a thorough review of all current outstanding state debt, thefollowing programs are considered General Fund-supported debt obligations for purposes of thisreport:
• Higher Education Facility & Community College Bonds (Article XI-G only);
• Pollution Control Bonds (42% of total outstanding as of June 30, 2011);
• Alternate Energy Bonds (18% of total outstanding as of June 30, 2011);
•
Oregon Opportunity Bonds (for OHSU projects);• Seismic Rehab – Public Education Buildings Bonds (Article XI-M)
• Seismic Rehab – Emergency Service Buildings Bonds (Article XI-N)
• State General Purpose Bonds (Article XI-Q) (85% of total outstanding as of June 30,2011);
• Pension Obligation Bonds (32% of total outstanding as of June 30, 2011);
• Certificate of Participation obligations (85% of total outstanding as of June 30, 2011);
• Appropriation Bonds
As shown in Table III.1, the model solves for overall debt capacity for fiscal years 2012 through2017 using the General Fund forecasts from the Oregon Office of Economic Analysis and five percent of General Fund revenues as the capacity target. Based on this target capacity, the modeldemonstrates that yearly dollars to pay debt service ranges from a low of $325 million in FY2012 to a high of $449 million in FY 2017.
STATE OF OREGON STATE DEBT POLICY ADVISORY COMMISSION STATEDEBT POLICY ADVISORY COMMISSION
27

8/3/2019 STATE DEBT POLICY ADVISORY COMMISSION: Approved Report
http://slidepdf.com/reader/full/state-debt-policy-advisory-commission-approved-report 38/85
Table III.1
General Fund Forecast
($ Millions)
Fiscal Year
EndingJune 30th
Estimated
General Fund Revenues24
Calculated Dollars to Pay
Annual Debt Service25
at 5% Capacity Target
2012 $6,747.1 $337.4
2013 7,007.9 350.4
2014 7,558.9 378.0
2015 8,108.4 405.4
2016 8,579.5 429.0
2017 8,980.2 449.0
After determining the yearly dollars available, it is necessary to resolve what portion isconsumed by debt service on currently outstanding, as well as “planned” General Fund supporteddebt obligations. For purposes of this report, the 2011 Legislature authorized $167 million inGeneral Fund supported debt that will be issued during the 2011-2013 biennium, including $18million in Higher Education Facility XI-G bonds, $24 million in Community College XI-G bonds, $27 million in Energy XI-J bonds for Higher Ed energy projects, $7 million in SeismicRehab – Public Education Buildings XI-M bonds, and approximately $91 million in GeneralPurpose General Obligation XI-Q bonds. Projected debt service needs for planned issuances are based on the following assumptions:
• Level debt service payments;
• An interest rate of 5.03 percent, based on a five-year average of the Bond Buyer 20-Bond
Index plus 50 basis points26 as of November 17, 2011;27 and
• Twenty year average maturity length for all General Fund supported debt obligations.
The model forecasts the remaining dollars available to pay debt service on future issuance andtherefore bonding capacity by introducing known annual debt service payments for debt that iscurrently outstanding and the projected debt service payments for planned issuance. This isshown below in Table III.2. A detailed outline of debt service requirements for each GeneralFund supported debt program is provided in Appendix A to this report.
24 General Fund revenues are shown as projected by the Oregon Office of Economic Analysis in the Oregon
Economic and Revenue Forecast for December 2011.25 Debt Service = principal and interest payments on outstanding issues26 Due to on-going credit market volatility, an additional 50 basis point was added to the 5-year average Bond Buyer 20-Bond Index typically used in the debt capacity model.27 The 20-Bond Index consists of 20 general obligation bonds that mature in 20 years. The average rating of the 20 bonds is roughly equivalent to Moody’s Investors Service’s Aa3 rating and Standard & Poor’s AA-minus rating.
STATE OF OREGON STATE DEBT POLICY ADVISORY COMMISSION STATEDEBT POLICY ADVISORY COMMISSION
28

8/3/2019 STATE DEBT POLICY ADVISORY COMMISSION: Approved Report
http://slidepdf.com/reader/full/state-debt-policy-advisory-commission-approved-report 39/85
Table III.2
Remaining General Fund Dollars Available for Future Debt Issuance
($ Millions)
1 2 3 4
Fiscal Year
Ending
June 30th
Calculated Dollars
to Pay Debt
Service
(5% target)
(From Table II.1)
(Less)
Annual Payments
for Debt Service
on General Fund
Supported Debt
Outstanding28
(Less)Projected Annual
Payments for Debt
Service on
“Planned” General
Fund Supported
Debt Issuance29
Remaining
Dollars Available
to Pay Debt
Service on Future
Debt Issuance
2012 $337.4 ($342.3) - ($5.0)
2013 350.4 (348.4) ($3.5) (1.5)
2014 378.0 (295.8) (3.5) 78.6
2015 405.4 (262.9) (3.5) 139.0
2016 429.0 (248.9) (3.5) 176.6
2017 449.0 (238.9) (3.5) 206.6
The overall dollars available to pay debt service as determined in Table III.1 is illustrated inTable III.2 column 1 above. Columns 2 and 3 are the principal and interest payment amounts for General Fund supported debt that is currently outstanding and for new authorized issuancesrespectively. The remaining dollars available to pay debt service (column 4) is determined bysubtracting the current outstanding and planned issuance debt service (columns 2 and 3) from theoverall calculated dollars available (column 1).
As outlined above, remaining dollars to pay debt service on future issuance varies over theforecast period as projected revenues change and as debt service requirements come due on debtobligations. We calculate that there is no remaining dollars available to pay debt service onfuture debt issuance for FY 2012 and FY 2013 debt issuance. The remaining General Funddollars are based on the previously discussed assumptions and maintaining a General Fundsupported debt service level below the targeted five percent of General Fund revenues. (SeeTable III.3.)
28 Total annual (fiscal year) debt service requirements on all General Fund supported debt issued through June 30,2011. See Appendix for detail.29 The 2011 Legislative Assembly authorized approximately $167 million in General Fund supported debt. Theissuance of the $123 million for FY 2012 is accounted for in Table III.2 column 3 and amortized annually as leveldebt service at $3.5 million.
STATE OF OREGON STATE DEBT POLICY ADVISORY COMMISSION STATEDEBT POLICY ADVISORY COMMISSION
29

8/3/2019 STATE DEBT POLICY ADVISORY COMMISSION: Approved Report
http://slidepdf.com/reader/full/state-debt-policy-advisory-commission-approved-report 40/85
Table III.3
General Fund Supported Debt Capacity Determination
($ Millions)
1 2 3 4 5
Fiscal Year
Ending
June 30th
Remaining
Dollars to Pay
Debt Service
Amount of
Additional
Debt that May
be Issued30
(Less)Debt Service on
Amount of
Additional Debt
that May be
Issued
Net Dollars
Remaining to
Pay Debt
Service
Total DebtService as a
% of
General
Fund
Revenues
2012 ($5.0) - - ($5.0) 5.07%
2013 (1.5) - - (1.5) 5.02%
2014 78.6 977.0 ($78.6) 0.0 5.00%
2015 60.4 750.3 (60.4) 0.0 5.00%
2016 37.6 467.6 (37.6) 0.0 5.00%
2017 30.0 372.8 (30.0) 0.0 5.00%
Total FY 2012-17
General Fund Debt Capacity
$2,567.8
Table III.3 above accounts for all issued and planned General Fund supported debt authorized bythe Legislature for the 2011-13 biennium. For FY 2012, total debt service as a percentage of General Fund revenue is projected to be approximately 5.07 percent (column 5), which is slightlyabove the target debt capacity of five percent. This, as previously noted, is a simple measure of
debt burden calculated as a percentage of General Fund supported debt service to General Fundrevenues. In FY 2012, the annual debt service costs are $342.3 million (Table III.2 column 2)and the General Fund revenue estimate is $6,747.1 million (Table III.1) yielding a debt burdenmeasure of 5.07 percent.
Based on the above analysis of available debt service dollar levels, the Commission concludesthat the General Fund supported debt issuance amounts illustrated in Table III.3 would allow theState to stay within the five percent capacity target. This determination concludes that there is noavailable capacity for new General Fund supported debt assuming the 5% capacity target this biennium, but there will be $2.6 billion in General Fund capacity from FY 2014 through FY2017. Issuing new General Fund supported debt in excess of these amounts may cause the debtservice ratios to exceed the target of five percent of General Fund revenues in a given fiscal year.
30 Table III.3 accounts for all $167 million in planned and issued General Fund supported debt as authorized by theLegislature for the 2011-13 biennium.
STATE OF OREGON STATE DEBT POLICY ADVISORY COMMISSION STATEDEBT POLICY ADVISORY COMMISSION
30

8/3/2019 STATE DEBT POLICY ADVISORY COMMISSION: Approved Report
http://slidepdf.com/reader/full/state-debt-policy-advisory-commission-approved-report 41/85
C. Capacity Considerations
The Commission cautions that decisions regarding funding for General Fund supported debt programs and projects, or for other State programs and projects are best made through the budgetary and legislative process.
The Commission emphasizes that while the State has the capacity to issue General Fundsupported debt in the amounts outlined in Table III.3 using the 5% capacity target, such issuancehas budgetary obligations that can extend for significant periods in the future. An increase inmonies used to finance General Fund supported debt service could result in a reduction of funding for other State-supported programs.
In addition, the Commission also cautions that while the State will have significant debt capacity beginning in FY 2014, there remains a very large backlog of unmet capital needs throughout thestate. The Commission recommends that the Governor and Legislature continue to carefullyevaluate the use of the State’s general fund bonding capacity and restrict borrowings to thehighest priority capital projects.
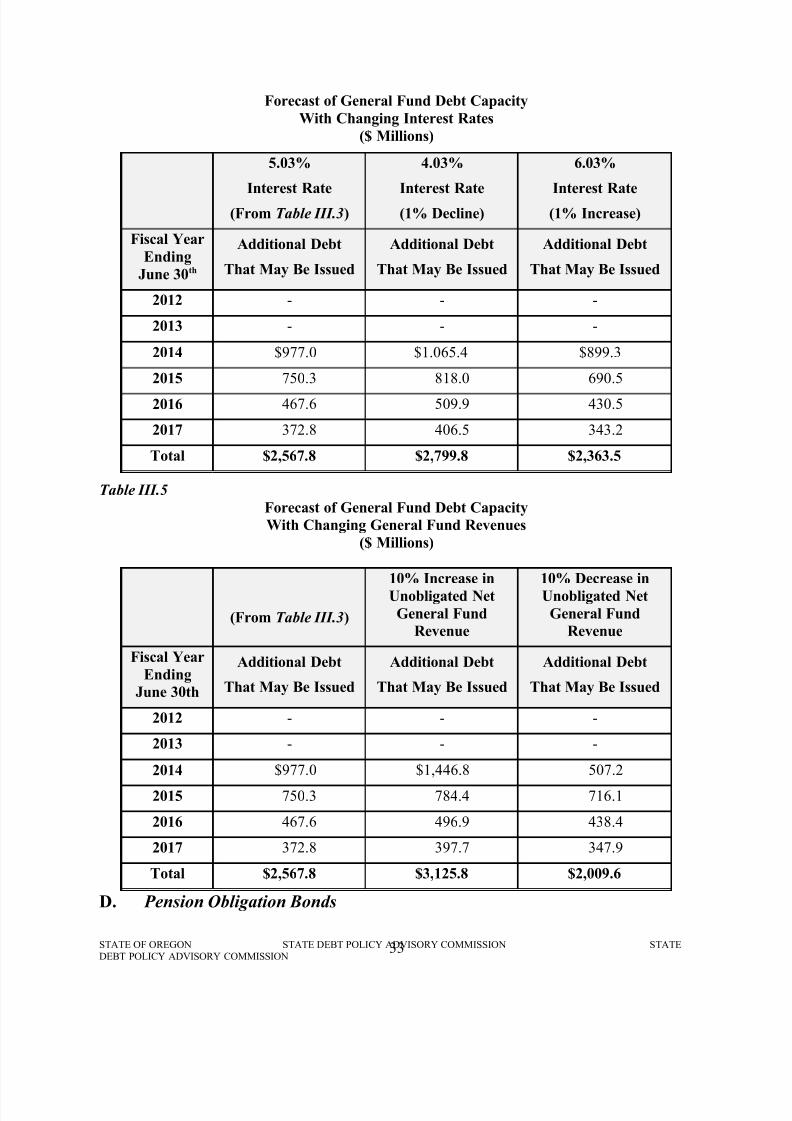
Table III.4 and Table III.5 below illustrate the potential impact of changing interest rates andrevenues on the forecast of the State’s General Fund debt capacity in future biennia. Based oncurrent planned debt issuances in 2011-13 and estimates of General Fund revenues for the sixyear forecast period, remaining General Fund debt capacity is $2.6 billion; a 1% increase in thelong-term interest rate would decrease future capacity by $204 million or $68 million per biennium (Table III.4). A 10% decline in revenue for the forecast period; however, woulddecrease future capacity by approximately $558 million, or $186 million per biennium. (TableIII.5).
STATE OF OREGON STATE DEBT POLICY ADVISORY COMMISSION STATEDEBT POLICY ADVISORY COMMISSION
31

8/3/2019 STATE DEBT POLICY ADVISORY COMMISSION: Approved Report
http://slidepdf.com/reader/full/state-debt-policy-advisory-commission-approved-report 42/85
Table III.4
STATE OF OREGON STATE DEBT POLICY ADVISORY COMMISSION STATEDEBT POLICY ADVISORY COMMISSION
32
8/3/2019 STATE DEBT POLICY ADVISORY COMMISSION: Approved Report
http://slidepdf.com/reader/full/state-debt-policy-advisory-commission-approved-report 43/85
Forecast of General Fund Debt Capacity
With Changing Interest Rates
($ Millions)
5.03%
Interest Rate(From Table III.3)
4.03%
Interest Rate(1% Decline)
6.03%
Interest Rate(1% Increase)
Fiscal Year
Ending
June 30th
Additional Debt
That May Be Issued
Additional Debt
That May Be Issued
Additional Debt
That May Be Issued
2012 - - -
2013 - - -
2014 $977.0 $1.065.4 $899.3
2015 750.3 818.0 690.5
2016 467.6 509.9 430.5
2017 372.8 406.5 343.2
Total $2,567.8 $2,799.8 $2,363.5
Table III.5
Forecast of General Fund Debt Capacity
With Changing General Fund Revenues
($ Millions)
(From Table III.3)
10% Increase inUnobligated Net
General Fund
Revenue
10% Decrease inUnobligated Net
General Fund
Revenue
Fiscal Year
Ending
June 30th
Additional Debt
That May Be Issued
Additional Debt
That May Be Issued
Additional Debt
That May Be Issued
2012 - - -
2013 - - -
2014 $977.0 $1,446.8 507.22015 750.3 784.4 716.1
2016 467.6 496.9 438.4
2017 372.8 397.7 347.9
Total $2,567.8 $3,125.8 $2,009.6
D. Pension Obligation Bonds
STATE OF OREGON STATE DEBT POLICY ADVISORY COMMISSION STATEDEBT POLICY ADVISORY COMMISSION
33

8/3/2019 STATE DEBT POLICY ADVISORY COMMISSION: Approved Report
http://slidepdf.com/reader/full/state-debt-policy-advisory-commission-approved-report 44/85
On September 16, 2003, the citizens of the State voted to approve the issuance of State GeneralObligation bonds to finance part of the State’s unfunded actuarial liability (“UAL”) to the PublicEmployees Retirement System (“PERS”). The UAL is the difference between the liability of PERS to retirees and the actuarially determined value of the assets available to pay the liability.Calculated at an actuarial assumed rate of 8%, the State’s portion of the pension liability was
estimated to be over $2 billion.In October 2003, with the interest rate environment at historic lows, the State issued $2 billion intaxable Pension Obligation Bonds (“POB”) through the Office of the State Treasurer. Becausethe POBs were sold at an average interest rate of 5.8%, 2.2% below the actuarially assumed rateof 8%, the State expects to realize significant budgetary savings over the life of these bonds.
The savings through the issuance of POBs depends on future asset returns. While the costs of thePOBs were known and fixed at the time of issuance, investment returns over the term of the bonds was not. Based on assumptions regarding the long-term rate of return of the PERS systemmade at the time of issuance, it was estimated that the POBs would provide nominal GeneralFund savings of approximately $900 million over the life of the bonds. The State Treasurer’soffice estimates that as of June 30, 2011, the net savings to the State of Oregon and taxpayersdue to the issuance of POBs has thus exceeded $211 million.
STATE OF OREGON STATE DEBT POLICY ADVISORY COMMISSION STATEDEBT POLICY ADVISORY COMMISSION
34

8/3/2019 STATE DEBT POLICY ADVISORY COMMISSION: Approved Report
http://slidepdf.com/reader/full/state-debt-policy-advisory-commission-approved-report 45/85
IV. LOTTERY-BACKED DEBT CAPACITY
Due to the importance of State Lottery revenues for funding various state programs andactivities, the Commission feels it is important to point out a few considerations with respect toLottery-backed bonds. True capacity to issue these bonds is based primarily on the prudentmanagement and sound fiscal position of the State Lottery program itself. Accordingly, for
purposes of determining capacity, the Commission has chosen to view the Lottery revenue bond program as distinct from both net tax-supported and General Fund supported debt programs.
A. Unobligated Net Lottery Proceeds
Article XV, Section 4 of the Oregon Constitution requires the Legislative Assembly toappropriate Unobligated Net Lottery Proceeds or revenues to first repay Lottery bonds, beforeappropriating the proceeds for any other purpose.
In each fiscal year, and prior to any use of such moneys for any other purpose, all unobligatednet Lottery revenues are deposited into the Debt Service Account until all scheduled debt servicefor the fiscal year has been provided for. The unobligated net Lottery proceeds consist of all
revenues derived from the operation of the State Lottery except for revenues used for the payment of prizes and expenses of the State Lottery.
Once Lottery-backed debt service is paid each year, the remaining State Lottery revenues aredistributed to fund the Education Stability Fund and the Parks and Natural Resources Fund asrequired by the Constitution and then allocated and applied to certain economic development andeducational purposes. The Education Stability Fund and the Parks and Natural Resources Fundare allocated 18% and 15% respectively of unobligated net proceeds. Also, an amount of not lessthan 1% of net Lottery proceeds is allocated to the Problem Gambling Treatment Fund, which isseparate and distinct from the General Fund. Article XV, Section 4 of the Oregon Constitutionand applicable Oregon law allocate any remaining amounts to various economic developmentand public education projects as authorized.
The forecast summary of Lottery revenues is presented in Table IV.1. Total available Lotteryresources are net of Lottery prizes and administration. Also shown is the projected debt servicefor outstanding Lottery bonds and the projected coverage ratio.
Table IV.1
FY
2012
FY
2013
FY
2014
FY
2015
FY
2016
FY
2017
Annual Unobligated Net LotteryRevenues31 541.0 558.2 582.6 607.6 638.7 664.4
Total Debt Service on Bonds32
134.8 127.4 121.0 120.6 102.1 98.4Projected Debt ServiceCoverage (Times)
4.0 4.4 4.8 5.0 6.3 6.8
31 Oregon Office of Economic Analysis, Oregon Economic and Revenue Forecast, December 201132 Includes Lottery bonds issued through June 30, 2011. This does not include debt service on $227 million inunissued Lottery bonds, as authorized by 2011 Legislature.
STATE OF OREGON STATE DEBT POLICY ADVISORY COMMISSION STATEDEBT POLICY ADVISORY COMMISSION
35

8/3/2019 STATE DEBT POLICY ADVISORY COMMISSION: Approved Report
http://slidepdf.com/reader/full/state-debt-policy-advisory-commission-approved-report 46/85
Exhibit IV.1 below graphically displays the amount of revenues consumed by debt service onoutstanding Lottery revenue bonds and the remaining proceeds available for other purposes.
Exhibit IV.1
$-
$100
$200
$300
$400
$500
$600
$700
$800
$900
2012 2013 2014 2015 2016 2017
I n M i l l i o n s
Fiscal Year
Annual Unobligated Net Lottery Revenues
Debt Service on Lottery Bonds Remaining Lottery Revenues
B. Lottery Capacity Determination and Coverage Ratios
The most appropriate means of determining capacity for this program is its legal debt servicecoverage requirements. This type of analysis compares expected debt service requirements to theavailable revenues pledged to repay this debt service. The extent to which the available revenuesare forecasted to exceed debt service requirements is referred to as the coverage ratio. For example, if available program revenues were expected to be $100 million annually, and debtservice requirements were expected to be $10 million annually, the expected coverage ratiowould be 10.0 times ($100 million divided by $10 million).
The Commission’s current lottery bond capacity policy is that existing and proposed lottery debtservice not exceed four-times coverage or no more than 25% of net unobligated lottery revenues.The four-times coverage ratio, viewed by rating agencies as a conservative yet realistic level, is
incorporated in the State’s Lottery Revenue bond indenture as a general bond covenant. Thismeans that in order for the State to issue additional Lottery-backed bonds unobligated net Lotteryrevenues must be at least four times of the maximum annual debt service on all outstanding bonds, with the newly sought bonds treated as outstanding.
Table IV.1 above shows that the annual debt service for Lottery-backed revenue bonds in FY2012 will be approximately $134.8 million with a coverage ratio of 4.0 if no other bonds wereissued prior to the end of FY 2012. Debt service decreases slightly, on average, ranging from$134.8 million to $98.4 million in FYs 2012 through 2017 with the coverage ratios ranging from
STATE OF OREGON STATE DEBT POLICY ADVISORY COMMISSION STATEDEBT POLICY ADVISORY COMMISSION
36
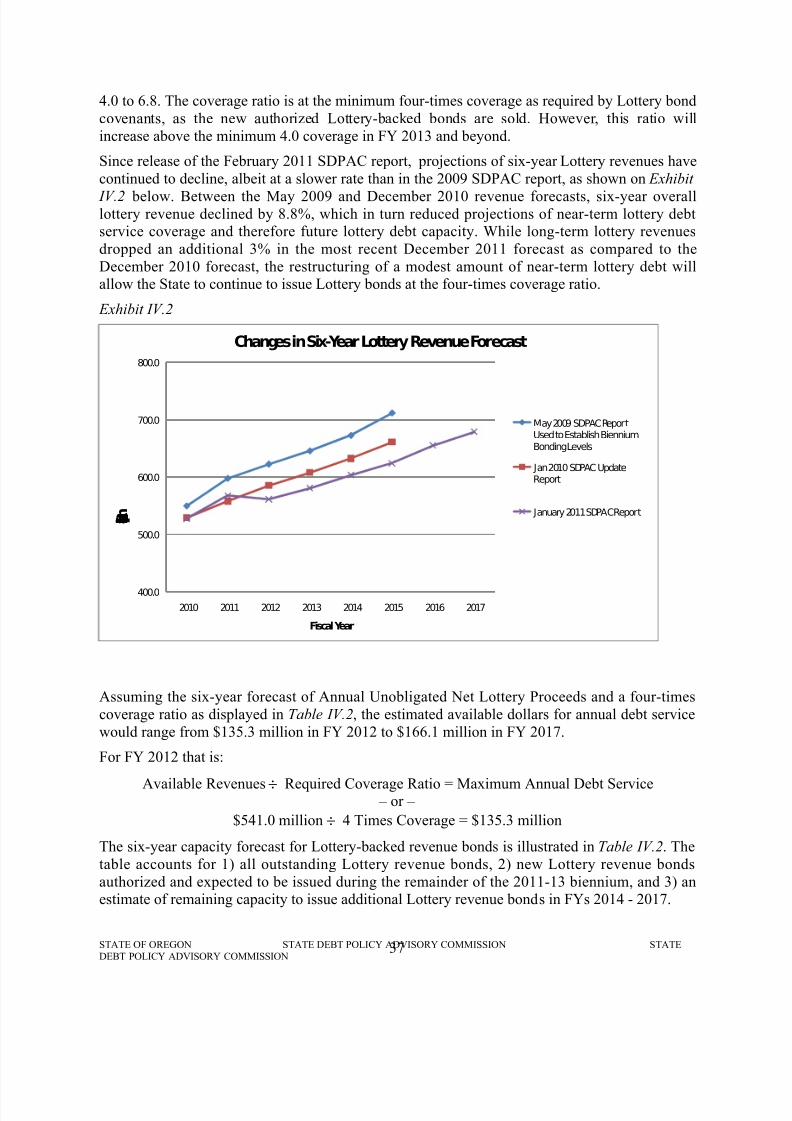
8/3/2019 STATE DEBT POLICY ADVISORY COMMISSION: Approved Report
http://slidepdf.com/reader/full/state-debt-policy-advisory-commission-approved-report 47/85
4.0 to 6.8. The coverage ratio is at the minimum four-times coverage as required by Lottery bondcovenants, as the new authorized Lottery-backed bonds are sold. However, this ratio willincrease above the minimum 4.0 coverage in FY 2013 and beyond.
Since release of the February 2011 SDPAC report, projections of six-year Lottery revenues havecontinued to decline, albeit at a slower rate than in the 2009 SDPAC report, as shown on Exhibit
IV.2 below. Between the May 2009 and December 2010 revenue forecasts, six-year overalllottery revenue declined by 8.8%, which in turn reduced projections of near-term lottery debtservice coverage and therefore future lottery debt capacity. While long-term lottery revenuesdropped an additional 3% in the most recent December 2011 forecast as compared to theDecember 2010 forecast, the restructuring of a modest amount of near-term lottery debt willallow the State to continue to issue Lottery bonds at the four-times coverage ratio.
Exhibit IV.2
400.0
500.0
600.0
700.0
800.0
2010 2011 2012 2013 2014 2015 2016 2017
R e v e n u e ( i n m i l l i o n s )
Fiscal Year
Changes in Six-Year Lottery Revenue Forecast
May 2009 SDPAC ReportUsed to Establish BienniumBonding Levels
Jan 2010 SDPAC UpdateReport
January 2011 SDPAC Report
Assuming the six-year forecast of Annual Unobligated Net Lottery Proceeds and a four-timescoverage ratio as displayed in Table IV.2, the estimated available dollars for annual debt servicewould range from $135.3 million in FY 2012 to $166.1 million in FY 2017.
For FY 2012 that is:
Available Revenues ÷ Required Coverage Ratio = Maximum Annual Debt Service – or –
$541.0 million ÷ 4 Times Coverage = $135.3 million
The six-year capacity forecast for Lottery-backed revenue bonds is illustrated in Table IV.2. Thetable accounts for 1) all outstanding Lottery revenue bonds, 2) new Lottery revenue bondsauthorized and expected to be issued during the remainder of the 2011-13 biennium, and 3) anestimate of remaining capacity to issue additional Lottery revenue bonds in FYs 2014 - 2017.
STATE OF OREGON STATE DEBT POLICY ADVISORY COMMISSION STATEDEBT POLICY ADVISORY COMMISSION
37

8/3/2019 STATE DEBT POLICY ADVISORY COMMISSION: Approved Report
http://slidepdf.com/reader/full/state-debt-policy-advisory-commission-approved-report 48/85
Projected net unobligated Lottery revenues available to pay Lottery bond debt service aredisplayed in Table IV.2 column 1. The Lottery revenue bond debt service, as presented in Table
IV.2 column 2, accounts for existing debt service, as of June 30, 2011, and the planned FY 2012and FY 2013 issuance, as authorized by the 2011 Legislature in the amount of $222.7 million.Assuming the additional $222.7 million is split between sales of $30.3 million in FY 2012 and
$192.4 million in FY 2013, there will be an increase in debt service payments by about $17.9million per year. This assumes level debt service payments at an interest rate of 5.03 percent 33
and a 20-year maturity.34 Table IV.2 column 4 shows projected debt service for FY 2014-17resulting from the issuance of the additional Lottery revenue bonds. Lastly, column 5 illustratesthat as more debt is issued, the debt service coverage ratios decrease to the minimum requiredcoverage of 4-times unobligated net Lottery proceeds or revenues.
Assuming that the current amount of authorized yet unissued Lottery revenue bonds, $222.7million, are sold in FY 2012 and FY 2013, the projected capacity to issue new debt at the start of FY 2014 is calculated to be $84.5 million. Further issuing the entire projected $84.5 millioncapacity in FY 2014 would increase annual debt service payments to approximately $6.8 million per year and the projected capacity to issue new debt in FY 2015 would be $82 million. This
projected $82 million capacity, available in FY 2015, factors in the amortization of prior bondissuances as well as additional forecast Lottery revenues.
Table IV.2
Capacity for Lottery Revenue Bond Programs
($ Millions)
1 2 3 4 5
Fiscal
YearEndin
g June
30th
Lottery
RevenuesAvailable to
Pay Debt
Service
Debt Service on
Bonds Outstanding
And “Planned” FY2012 Issuance
As of
June 30, 2011
Annual Amount of
Additional Debt
That May be Issued AndRemain Within Authorized
Debt Service Coverage
Ratios
Debt Service
on
Current&
Additional
Issuance
Debt
Service
CoverageRatio
(Times)
2012 135.3 ($134.8) 4.0
2013 139.5 (129.8) 4.3
2014 145.6 (138.9) 84.5 ($6.8) 4.0
2015 151.9 (138.5) 82.0 (6.6) 4.0
2016 159.7 (120.0) 325.7 (26.2) 4.0
2017 166.1 (116.3) 126.8 (10.2) 4.0
Total FY 2014-17 Lottery Debt Capacity $619.0
33 Five-year average of the Bond Buyer 20-Bond Index through November 17, 2011 plus 50 basis points.34 Lottery bonds sold prior to December 31, 2004 were structured with 15-year maturities. New Lottery bonds arestructured with 20-year maturities.
STATE OF OREGON STATE DEBT POLICY ADVISORY COMMISSION STATEDEBT POLICY ADVISORY COMMISSION
38

8/3/2019 STATE DEBT POLICY ADVISORY COMMISSION: Approved Report
http://slidepdf.com/reader/full/state-debt-policy-advisory-commission-approved-report 49/85

8/3/2019 STATE DEBT POLICY ADVISORY COMMISSION: Approved Report
http://slidepdf.com/reader/full/state-debt-policy-advisory-commission-approved-report 50/85
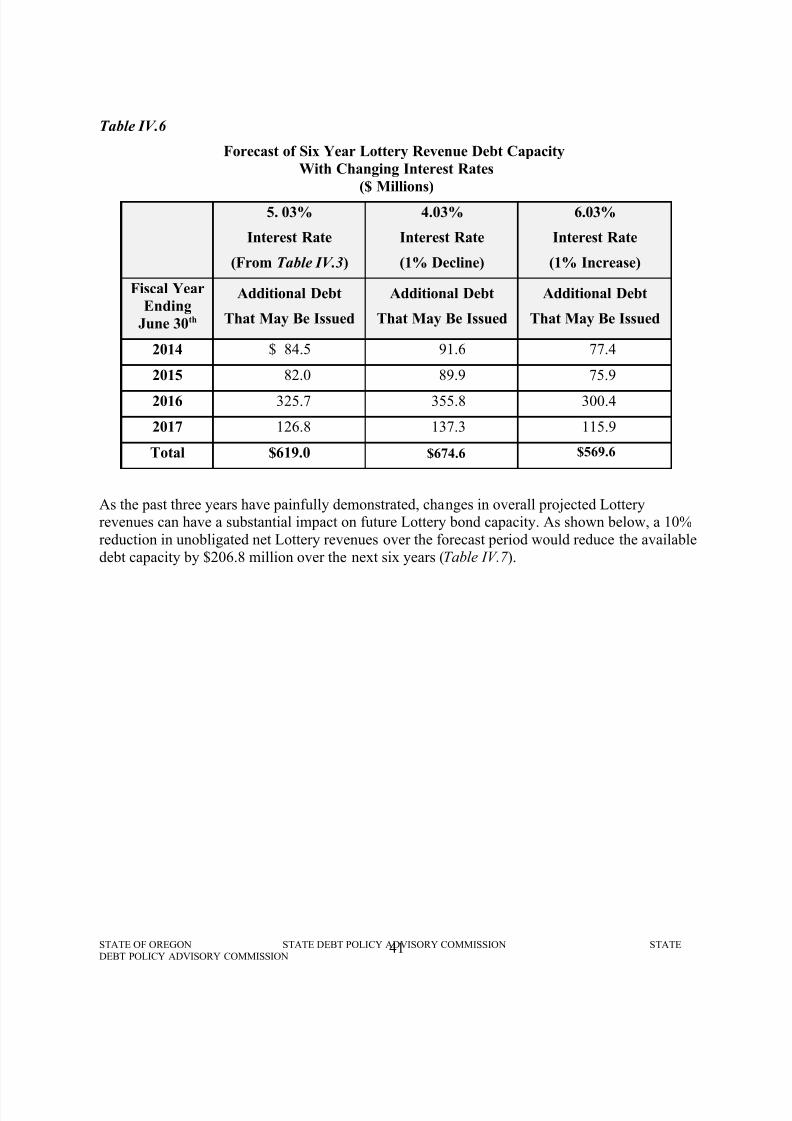
8/3/2019 STATE DEBT POLICY ADVISORY COMMISSION: Approved Report
http://slidepdf.com/reader/full/state-debt-policy-advisory-commission-approved-report 51/85
Table IV.6
Forecast of Six Year Lottery Revenue Debt Capacity
With Changing Interest Rates
($ Millions)5. 03%
Interest Rate
(From Table IV.3)
4.03%
Interest Rate
(1% Decline)
6.03%
Interest Rate
(1% Increase)
Fiscal Year
Ending
June 30th
Additional Debt
That May Be Issued
Additional Debt
That May Be Issued
Additional Debt
That May Be Issued
2014 $ 84.5 91.6 77.4
2015 82.0 89.9 75.9
2016 325.7 355.8 300.4
2017 126.8 137.3 115.9
Total $619.0 $674.6 $569.6
As the past three years have painfully demonstrated, changes in overall projected Lotteryrevenues can have a substantial impact on future Lottery bond capacity. As shown below, a 10%reduction in unobligated net Lottery revenues over the forecast period would reduce the availabledebt capacity by $206.8 million over the next six years (Table IV.7 ).
STATE OF OREGON STATE DEBT POLICY ADVISORY COMMISSION STATEDEBT POLICY ADVISORY COMMISSION
41

8/3/2019 STATE DEBT POLICY ADVISORY COMMISSION: Approved Report
http://slidepdf.com/reader/full/state-debt-policy-advisory-commission-approved-report 52/85
Table IV.7
Forecast of Lottery Revenue Debt Capacity
With Changing Lottery Revenues
($ Millions)
Current LotteryRevenue Projections
(From Table IV.3)
10% Increase inUnobligated Net
Lottery Revenue
10% Decrease inUnobligated Net
Lottery Revenue
Fiscal Year
Ending
June 30th
Additional Debt
That May Be Issued
Additional Debt
That May Be Issued
Additional Debt
That May Be Issued
2014 84.5 265.0 -
2015 82.0 90.3 -
2016 325.7 336.0 294.2
2017 126.8 133.9 118.0
Total $619.0 $825.2 $412.2
STATE OF OREGON STATE DEBT POLICY ADVISORY COMMISSION STATEDEBT POLICY ADVISORY COMMISSION
42
8/3/2019 STATE DEBT POLICY ADVISORY COMMISSION: Approved Report
http://slidepdf.com/reader/full/state-debt-policy-advisory-commission-approved-report 53/85
V. NET TAX-SUPPORTED DEBT
Net tax-supported debt (NTSD) is, by definition, all debt serviced by tax revenues of the State.Following rating agency models this includes all General Fund supported debt, Lottery revenue program bonds and State Highway bonds. Exhibit I.2 in the section titled “Bonding in Oregon”, provided a comparison of the State’s total outstanding gross debt, General Fund supported debt,
and net tax-supported debt as of June 30, 2011. The State’s net tax supported debt, as of June 30,2011, was $8.0 billion.
Lottery revenue bonds are included in the calculation of net tax-supported debt even though theyare special obligations of the State with debt service for the bonds coming from non-taxresources, that is, discretionary lottery purchases. However, because Lottery bonds are alsosecured by a “moral obligation” pledge of the state and a statutory commitment to requestappropriated funds for any deficiencies in reserves or inability to pay debt service, these bondsare considered tax-supported and included in rating agency calculations of net tax-supporteddebt.
Given the importance of Lottery revenue bonds to the State’s overall capital planning process,
Lottery revenue bond capacity is discussed separately in the previous section of this report.
Net tax-supported debt does omit a variety of self-supporting debt obligations issued by the Statethat are directly or indirectly supported by the State’s credit. The Veterans’ Welfare Housing program, the Oregon Housing and Community Services Department’s Elderly and Disabledgeneral obligations, and Single and Multifamily Housing revenue bond programs and all conduitrevenue bonds are examples of debt issued by the State but excluded from NTSD calculations.While revenue and self-supporting general obligation bond debt programs are included on theState’s gross debt balance sheet, they are fully self-supported from non-tax revenue resourcesand there is no practicable expectation that bond debt service payments will come from State taxresources.
Table V.1 lists new 2011-13 biennium net tax-supported debt authorizations approved by the2011 Legislative Assembly. For purposes of this 2012 Legislative Update, the legislatureauthorized $1.1 billion that continues to be issued during the 2011-13 biennium. Highway User Tax bonds, General Purpose General Obligation bonds, and Lottery revenue bonds make up thelargest share of the new authorizations and actual issuance.
STATE OF OREGON STATE DEBT POLICY ADVISORY COMMISSION STATEDEBT POLICY ADVISORY COMMISSION
43

8/3/2019 STATE DEBT POLICY ADVISORY COMMISSION: Approved Report
http://slidepdf.com/reader/full/state-debt-policy-advisory-commission-approved-report 54/85

8/3/2019 STATE DEBT POLICY ADVISORY COMMISSION: Approved Report
http://slidepdf.com/reader/full/state-debt-policy-advisory-commission-approved-report 55/85
more recently, the sale of over $2.4 billion in Highway User Tax revenue bonds for OTIA projects has led to further increases in the state’s NTSD ratios.
As Table V.2 illustrates, at the end of FY 2011 net tax-supported debt totaled $8.0 billion withdebt ratios of $2,080 per capita and 5.46% of personal income. Based on the issuance of the debtauthorized via the 2011 Legislature, we estimate that by the end of FY 2013, the State’s net tax-
supported will increase to about $8.3 billion.
Table V.2
Net Tax-Supported Debt Ratios
Fiscal Year Ending June 30th
FY
2010
(Actual)
FY
2011
(Actual)
FY
2012
(Estimated)
FY
2013
(Estimated)
Net Tax-Supported Debt (Millions) $7,838 $8,022 $8,218 $8,301Population* 3,844,200 3,856,800 3,887,000 3,923,500
Personal Income (Millions)* $142,400 $146,800 $152,300 $159,000
NTSD Per Capita $2,039 $2,080 $2,114 $2,140
NTSD as a % of Personal Income 5.50% 5.46% 5.39% 5.28%
Pension Obligation Bonds Excluded
NTSD Per Capita $1,507 $1,557 $1,603 $1,645
NTSD as a % of Personal Income 4.07% 4.09% 4.09% 4.06%
*Source: 2011-13 population and personal income forecasts – Oregon Office of Economic Analysis December 2011
Rating agencies typically calculate total net tax-supported debt both with and without pensionobligation bonds. In this way, they do not penalize states that issue POBs in comparison to other states that may have a relatively low debt burden and have not issued POBs yet have sizableunfunded pension liabilities. For Oregon, if pension obligation bonds are excluded from the NTSD calculation shown above in Table V.2, the estimated FY 2012 debt burden would decreaseto $1,603 per capita and 4.09% of personal income.
Debt Ratio ComparisonsAt the time of this report, Oregon’s general obligation debt was rated by Moody’s as Aa1, andAA+ by both Standard & Poor’s and Fitch Investors Service. Exhibits V.1a & V.1b compareOregon’s net supported debt ratios over the past decade with the median ratios of all 50 states.Prior to FY 2003, Oregon’s debt ratios compared favorably to the national averages, with Oregongenerally having lower ratios than states with higher credit ratings. Since that time, the State hasissued a substantial amount of new debt to address unfunded pension liabilities, operatingdeficits, economic development, highway modernization and public safety needs. As the charts
STATE OF OREGON STATE DEBT POLICY ADVISORY COMMISSION STATEDEBT POLICY ADVISORY COMMISSION
45

8/3/2019 STATE DEBT POLICY ADVISORY COMMISSION: Approved Report
http://slidepdf.com/reader/full/state-debt-policy-advisory-commission-approved-report 56/85

8/3/2019 STATE DEBT POLICY ADVISORY COMMISSION: Approved Report
http://slidepdf.com/reader/full/state-debt-policy-advisory-commission-approved-report 57/85

8/3/2019 STATE DEBT POLICY ADVISORY COMMISSION: Approved Report
http://slidepdf.com/reader/full/state-debt-policy-advisory-commission-approved-report 58/85
This Page Intentionally Blank
STATE OF OREGON STATE DEBT POLICY ADVISORY COMMISSION STATEDEBT POLICY ADVISORY COMMISSION
48

8/3/2019 STATE DEBT POLICY ADVISORY COMMISSION: Approved Report
http://slidepdf.com/reader/full/state-debt-policy-advisory-commission-approved-report 59/85
VI. NON TAX-SUPPORTED DEBT
Several of the State’s largest bonding programs do not fall under the definition of either GeneralFund supported debt or net tax-supported as used in this report. These programs currentlyinclude:
• Veterans’ Welfare Bonds (Article XI-A);• Higher Education Building Project Bonds (Article XI-F(1));
• OHCSD36 Elderly & Disabled Housing Project Bonds (Article XI-1(2));
• OHCSD Single-Family & Insured Multi-Family Revenue Bonds (ORS 456.661);
• Alternate Energy Project Bonds (Article XI-J);
• Oregon School Bond Guaranty Program (Article XI-K);
• Economic Development Bond Bank and Safe Drinking Water Project Bonds; and
• Conduit or “Pass Through” Revenue Bond Programs.
These programs are fully self-supporting from enterprise revenues or loan repayments and do notconstitute a draw on General Fund or special tax revenues. Therefore, it is not meaningful todiscuss their capacity in the same terms with which we discuss net tax-supported or GeneralFund supported debt programs. However, it is understandable that these programs cannot issuedebt unconditionally without consequence because, with the exception of conduit revenue bonds,they represent an exposure to the financial resources and reputation of the State. Capacity for these programs is more appropriately judged by reflecting the need for sound management andlending practices, as well as careful consideration of the economic circumstances unique to each program. The Commission proposes that capacity for these programs is more appropriately basedon ongoing review of constitutional and statutory limitations, program needs, sound program
management practices, and biennial review and approval of debt program issuance rather than aspecific dollar limit capacity.
Each of these non-tax supported programs is expanded on below.
A. Veterans’ Welfare Bond Program
As noted earlier the Department of Veterans’ Affairs (DVA) is authorized to issue bonds tofinance mortgage loans to eligible veterans. Although bonds outstanding under this program arefully self-supporting, this was not always the perception by bond market participants. In the late1970s and early 1980s, the Department faced considerable difficulties due to the effects of thenationwide recession, aggressive lending practices, and poorly structured bond issues. Revenuesfrom the mortgage portfolio were insufficient to cover operating expenses and an increased
number of foreclosure losses. At the same time, management practices allowed for anextraordinary volume of bond issuance, resulting in over $6 billion outstanding in the DVA program alone at one point in 1985. These fiscal decisions were, in part, responsible for aneventual ratings downgrade that led to increased interest costs to the State.
Over the last twenty years the State and the Department have made excellent progress in creatinga sound, well-structured Veterans’ loan program. The Department issued no debt between 1987
36 Oregon Housing and Community Services Department.
STATE OF OREGON STATE DEBT POLICY ADVISORY COMMISSION STATEDEBT POLICY ADVISORY COMMISSION
49

8/3/2019 STATE DEBT POLICY ADVISORY COMMISSION: Approved Report
http://slidepdf.com/reader/full/state-debt-policy-advisory-commission-approved-report 60/85
and 1995, and made no mortgage loans between 1987 and 1991. The restructured program beganlending mortgage monies again in 1992. Current financial strategies of the Department include:exercise bond call options for high cost debt where opportunity exists; close monitoring of administrative expenses; working to achieve maximum spread permitted under Federal law onnew bond sales; and structuring new bonds similar to proven single family mortgage revenue
bond programs nationwide.In addition, requirements for participation in the Mortgage Loan Program are now much morestringent. Individual applicants and properties must generally meet Federal National MortgageAssociation (FNMA or Fannie Mae) underwriting standards, which include but are not limitedto: adequate income, verification of stable employment, acceptable credit history, and sufficientfunds to pay the down-payment and closing costs. A private mortgage insurer must also insureloans that exceed eighty percent of the value of the underlying security.
The Department makes annual cash flow forecasts to assess future ability to meet debt serviceand related operating expenses. In addition to these cash flow projections, the Department projects for future bond issuance requirements based on demand for program services. While theDepartment, or any State program, cannot issue bonds without restraint, its debt capacity is areflection of continuing sound management practices and awareness of demand for programservices.
B. Higher Education Building Project Bond Program
The Department of Higher Education has the authority to issue bonds under two constitutional provisions, Article XI-F(1) and Article XI-G. Debt issued under Article XI-G is considered tax-supported debt for purposes of this report, and is accounted for in the General Fund capacitymodel and net tax-supported debt ratio calculations. Debt issued under Article XI-F(1), Higher Education Building Projects, is not included in either model.
Again, the basis for a discussion of capacity surrounding this program must focus on sound
management practices. The Department of Higher Education administers the Oregon UniversitySystem, which consists of Oregon’s seven public four-year universities, the Oregon Center for Advanced Technology Education (OCATE) and the affiliated Oregon Health & ScienceUniversity (OHSU) in Portland. The Department, along with the Higher Education Board,continually assesses facility and equipment throughout the Higher Education System. Requestsfor facilities and related equipment are programmed into a six-year capital improvement planthat is reviewed and approved by the Board. The plan establishes priorities for projects and isupdated regularly. Further, the plan is submitted to the Department of Administrative Servicesand the Legislature biennially for budgeting and approval.
The Department has set Internal Management Directives that require debt service on Article XI-F(1) bonded debt to be paid solely out of revenues associated with the bond financed facilities,
such as student building fees, gifts, grants and other similar funds. Under program requirements,the Department must set rates for the use of dormitories, cafeterias, parking structures and other self-liquidating auxiliary enterprises sufficient to produce revenues to fund all operation andmaintenance costs, as well as to meet debt service requirements.
As required by Article XI-F(1), these bonds must be fully self-supporting from non-GeneralFund resources. The Board has defined these terms in the following manner. A bond-supported project is self-supporting when its gross revenues are sufficient to pay all operation and
STATE OF OREGON STATE DEBT POLICY ADVISORY COMMISSION STATEDEBT POLICY ADVISORY COMMISSION
50

8/3/2019 STATE DEBT POLICY ADVISORY COMMISSION: Approved Report
http://slidepdf.com/reader/full/state-debt-policy-advisory-commission-approved-report 61/85

8/3/2019 STATE DEBT POLICY ADVISORY COMMISSION: Approved Report
http://slidepdf.com/reader/full/state-debt-policy-advisory-commission-approved-report 62/85
8/3/2019 STATE DEBT POLICY ADVISORY COMMISSION: Approved Report
http://slidepdf.com/reader/full/state-debt-policy-advisory-commission-approved-report 63/85
given the impending situation, the Legislature and Governor step up their monitoring of SELP’sexisting loan portfolio and put tighter parameters on SELP’s future loan commitments to assurethat the aforementioned General Fund support of this “non-tax supported” general obligation bond program is kept to a minimum.
E. Oregon Business Development Department Bond Bank Program
The Oregon Business Development Department (OBDD) administers both the Bond Bank andSafe Drinking Water bond programs. Legislative changes made during the 1997 Session resultedin treatment of bonds issued through these programs as parity bonds to be issued under theOregon Bond Bank program name.
The Bond Bank was created by the consolidation of the Water Program, which authorizes loansto municipalities to finance safe drinking water projects and waste water system improvement projects, and the Special Public Works Fund program (SPWF), which provides loans tomunicipalities for construction, improvement and repair of infrastructure.
Loans made under both programs are typically full faith and credit obligations of the borrowingmunicipality’s payable from the municipalities’ General Funds. Under both programs, OBDDmay request the State to withhold any amounts otherwise due to the municipality, from the Stateof Oregon, and to pay such amounts to OBDD in the event that a municipality defaults on itsloan payments. Again, capacity to issue these bonds is based on sound management, continued prudent lending practices, and awareness of underlying borrowers’ ability to repay loans.
F. Conduit Revenue Bond Programs
The State of Oregon has three operating conduit revenue bond programs. These programsoperate under the cognizance of the Oregon Facilities Authority, the Oregon BusinessDevelopment Department and the Oregon Housing and Community Services Department.
Conduit revenue programs are viewed uniquely when discussing capacity concepts. These
programs, although issued by the State Treasurer, constitute no draw or contingent liability onany State of Oregon revenues. Debt service on these bonds is paid solely from revenuesgenerated by the projects being financed or from other sources available to the conduit borrower.In no case is the credit of the State loaned or used for payment of any of the bonds. Further, theState is not responsible for expenses or costs incurred in connection with the issuance of the bonds. Therefore, capacity judgments should be reflected more in terms of market impact, beneficial interests of the State and prudent evaluation of participating conduit borrowers’ abilityto repay debt obligations.
G. Oregon School Bond Guaranty Program
The Oregon Legislature passed the School Bond Guaranty Act in 1997, which was subsequently
approved by voters via a constitutional amendment the following year that allows the State toguaranty voter-approved General Obligation (GO) bonds of qualifying Oregon educationdistricts. Participation in the program is voluntary and is open to public school districts,education service districts, and community college districts.
The Oregon School Bond Guaranty (OSBG) program is administered by the State Treasurer’soffice, which established administrative rules prescribing application procedures andqualification guidelines. Upon determination of a district’s eligibility, the State Treasurer issues a
STATE OF OREGON STATE DEBT POLICY ADVISORY COMMISSION STATEDEBT POLICY ADVISORY COMMISSION
53

8/3/2019 STATE DEBT POLICY ADVISORY COMMISSION: Approved Report
http://slidepdf.com/reader/full/state-debt-policy-advisory-commission-approved-report 64/85
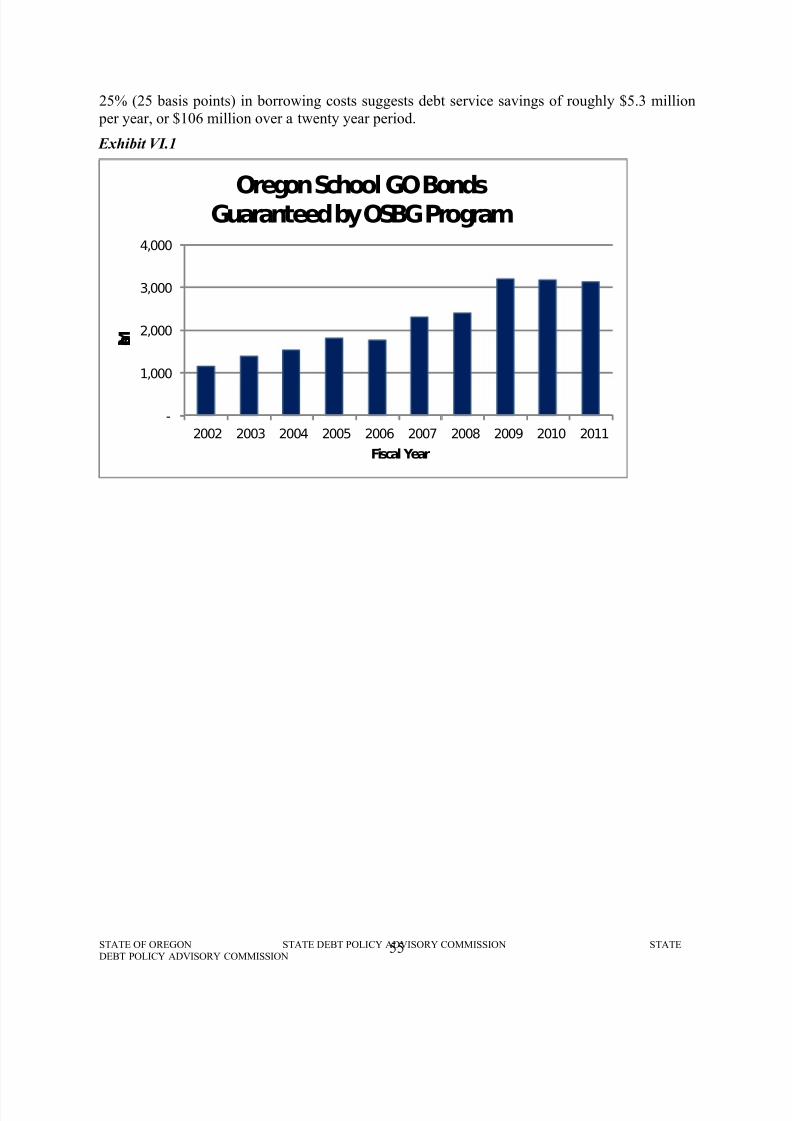
8/3/2019 STATE DEBT POLICY ADVISORY COMMISSION: Approved Report
http://slidepdf.com/reader/full/state-debt-policy-advisory-commission-approved-report 65/85
25% (25 basis points) in borrowing costs suggests debt service savings of roughly $5.3 million per year, or $106 million over a twenty year period.
Exhibit VI.1
-
1,000
2,000
3,000
4,000
2002 2003 2004 2005 2006 2007 2008 2009 2010 2011
M i l l i o n s
Fiscal Year
Oregon School GO BondsGuaranteed by OSBG Program
STATE OF OREGON STATE DEBT POLICY ADVISORY COMMISSION STATEDEBT POLICY ADVISORY COMMISSION
55

8/3/2019 STATE DEBT POLICY ADVISORY COMMISSION: Approved Report
http://slidepdf.com/reader/full/state-debt-policy-advisory-commission-approved-report 66/85
Exhibit VI.2
0.00
50.00
100.00
150.00
200.00
250.00
300.00
350.00
400.00
2 0 1 2 2 0 1 4 2 0 1 6 2 0 1 8 2 0 2 0 2 0 2 2 2 0 2 4 2 0 2 6 2 0 2 8 2 0 3 0 2 0 3 2 2 0 3 4 2 0 3 6 2 0 3 8 2 0 4 0 2 0 4 2 2 0 4 4 2 0 4 6
M i l l i o n s
Fiscal Year
OSBG Guaranteed Debt Serviceby Fiscal Year
Interest
Principal
Policy Considerations
To date, no participating Oregon school district or college has requested that the State of Oregonmake a debt service payment on its behalf. While OSBG guaranties are a contingent liability of
the State, this long track record of positive district financial management has meant that to datethe rating agencies do not consider this debt as part of the State’s overall General Fund or nettax-supported debt.
While the OSBG program has been successful in terms of lowering the borrowing costs of participating jurisdictions throughout the State, a number of factors now exist which suggest thatthe scope and emphasis of the OSBG program needs to be rethought going forward. In May2010, Oregon voters approved the passage of a new Constitutional amendment authorizing theState to sell General Obligation bonds to fund projects in those K-12 school districts who provide a cash match (XI-P bonds), similar to the type of bond programs already in place for Oregon’s higher education institutions and community colleges (XI-G bonds). Similar to theexisting XI-G bond programs, it is anticipated that these new XI-P bonds will be repaid from
General Fund resources. Given the huge unmet capital needs of Oregon’s school districts, itseems likely that this new bonding program will grow substantially in the years to come.
Given the significant contingent liability represented by the current OSBG program with itsannual debt service guaranty at 5.2% of General Fund revenues, the Commission recommendsthat the Governor and Legislature re-examine the use of both the OSBG program and other StateAid intercepts going forward, in order to ensure that the overall exposure of the State’s GeneralFund to local school bond debt service remains within financially prudent limits.
STATE OF OREGON STATE DEBT POLICY ADVISORY COMMISSION STATEDEBT POLICY ADVISORY COMMISSION
56

8/3/2019 STATE DEBT POLICY ADVISORY COMMISSION: Approved Report
http://slidepdf.com/reader/full/state-debt-policy-advisory-commission-approved-report 67/85
Table VI.3
Debt Issuance Considerations for Non Tax-Supported Programs
NON TAX-SUPPORTED DEBT PROGRAM BASED ON:
Veterans’ Welfare Bonds
Article XI-A
• Demand for loan program services;
• Annual cash flow projections;
• Legal limitations (8% of State Real MarketValue) (RMV);
• Governor’s budgetary review;
• Biennial Legislative Authorization; and
• Central debt management review.
Higher Education Building Project Bonds
Article XI-F(1)
• Need for capital building projects;
• Revenue producing capacity of desired projects;
• Projects self-supporting and self-liquidating;
• Legal limitations (.75% of State RMV);
• Governor’s budgetary review;
• Biennial Legislative Authorization; and
• Central debt management review.
Alternate Energy Project Bonds
Article XI-J
• Local community/region energy needs;
• Applicant screening;
• Thorough technical review;
• Legal limitations (.5% of State RMV);
• Governor’s budgetary review;
• Biennial Legislative Authorization; and
• Central debt management review.
Oregon School Bond Guaranty Program
Article XI-K
• Maybe triggered if state has to pay district debtservice;
• State-Aid maybe intercepted for debt service payments;
• May levy a statewide property tax or district property tax
• States full faith in credit; and
• Legal Limitation (.50% of State RMV).
Business Development Bond Bank
Program Bonds
ORS Chapter 285B
• Municipality Water System needs;
• Municipality infrastructure needs;
• Legal limitations (.5% of State RMV);
• Governor’s budgetary review;
• Biennial Legislative Authorization; and
• Central debt management review.
STATE OF OREGON STATE DEBT POLICY ADVISORY COMMISSION STATEDEBT POLICY ADVISORY COMMISSION
57

8/3/2019 STATE DEBT POLICY ADVISORY COMMISSION: Approved Report
http://slidepdf.com/reader/full/state-debt-policy-advisory-commission-approved-report 68/85
Elderly & Disabled Housing Project
Bonds
Article XI-I(2)
andSingle-Family & Multi-Family Revenue
Bonds
ORS 456.661
• Demand for mortgage program services;
• Continued strict applicant screening and
eligibility requirements;
• Annual cash flow review;
• Legal limitations;
Elderly & Disabled (.5% of State RMV) Single & Multifamily ($2 billion)
• Governor’s budgetary review;
• Biennial Legislative Authorization; and
• Central debt management review.
Conduit Programs
Oregon Facilities Authority Bonds Industrial Development Revenue Bonds
Housing Development Revenue Bonds
• Conduit borrower’s ability to pay debt service on
intended projects;
• Evaluation of market impact of conduit issues onother State issues;
• Biennial Legislative Authorization; and
• Central debt management review.
STATE OF OREGON STATE DEBT POLICY ADVISORY COMMISSION STATEDEBT POLICY ADVISORY COMMISSION
58

8/3/2019 STATE DEBT POLICY ADVISORY COMMISSION: Approved Report
http://slidepdf.com/reader/full/state-debt-policy-advisory-commission-approved-report 69/85

8/3/2019 STATE DEBT POLICY ADVISORY COMMISSION: Approved Report
http://slidepdf.com/reader/full/state-debt-policy-advisory-commission-approved-report 70/85
This Page Intentionally Blank

8/3/2019 STATE DEBT POLICY ADVISORY COMMISSION: Approved Report
http://slidepdf.com/reader/full/state-debt-policy-advisory-commission-approved-report 71/85

8/3/2019 STATE DEBT POLICY ADVISORY COMMISSION: Approved Report
http://slidepdf.com/reader/full/state-debt-policy-advisory-commission-approved-report 72/85

8/3/2019 STATE DEBT POLICY ADVISORY COMMISSION: Approved Report
http://slidepdf.com/reader/full/state-debt-policy-advisory-commission-approved-report 73/85

8/3/2019 STATE DEBT POLICY ADVISORY COMMISSION: Approved Report
http://slidepdf.com/reader/full/state-debt-policy-advisory-commission-approved-report 74/85

8/3/2019 STATE DEBT POLICY ADVISORY COMMISSION: Approved Report
http://slidepdf.com/reader/full/state-debt-policy-advisory-commission-approved-report 75/85
2038 - - 16,213,059
2039 - - 12,905,811
2040 - - 6,339,625
2041 - - 3,663,500
2042 - - 3,659,250
Progra
m
Totals
$22,610,734 $60,508,174 $4,567,252,836
Note: May not foot due to rounding.
STATE OF OREGON APPENDIX A-5 STATE DEBT POLICY
ADVISORY COMMISSION

8/3/2019 STATE DEBT POLICY ADVISORY COMMISSION: Approved Report
http://slidepdf.com/reader/full/state-debt-policy-advisory-commission-approved-report 76/85

8/3/2019 STATE DEBT POLICY ADVISORY COMMISSION: Approved Report
http://slidepdf.com/reader/full/state-debt-policy-advisory-commission-approved-report 77/85
Total $2,983,518,340 $1,583,734,496 $4,567,252,836
Note: May not foot due to rounding.
STATE OF OREGON APPENDIX A-6
STATE DEBT POLICY ADVISORY COMMISSION

8/3/2019 STATE DEBT POLICY ADVISORY COMMISSION: Approved Report
http://slidepdf.com/reader/full/state-debt-policy-advisory-commission-approved-report 78/85
Table A-5
Net Tax-Supported Debt
Annual Debt Service Requirements46
Fiscal
Year
(ending
June
30th)
State
Appropriatio
n Budget
Deficit Bonds
Certificates
of
Participation
Community
College Bonds
(XI-G)
Higher
Education
Facilities Bonds
(XI-G)
Oregon
Opportunity
Bonds
(OHSU)
Pension
Obligation
Bonds
(XI-O)
Pollution
Control
Bonds
(Gen Fund
Supported
portion)
Highway
User Tax
Revenue Bonds
Lottery
Revenue Bonds
Energy Bonds
(GF
Supported
portion)
2012 $71 ,602 ,415 $169 ,695 ,320 $7,949,588 $28,632,636 $15,784,769 $148,769,082 $5,653,725 $154,260,059 $134,784,798 $5,485,552
2013 73,035,935 167,452,716 7,943,458 30,930,642 15,783,519 155,090,876 6,025,572 154,297,510 127,377,130 4,571,336
2014 28,890,905 147,193,457 7,953,608 30,988,672 15,789,469 161,681,978 4,926,470 154,281,735 120,959,289 4,312,564
2015 - 139,740,839 7,946,183 30,988,672 15,783,319 168,555,022 4,627,141 154,277,655 120,574,511 4,631,420
2016 - 121,334,243 7,941,320 30,969,765 15,785,919 175,719,621 4,609,064 154,260,264 102,112,705 4,496,938
2017 - 114,436,165 7,947,595 30,988,160 15,790,869 183,188,600 3,995,713 154,299,505 98,413,402 3,998,113
2018 - 107,067,273 7,953,683 30,990,936 15,783,969 190,970,172 3,932,493 154,394,345 98,409,741 3,521,815
2019 - 107,074,885 7,938,961 30,968,333 15,788,753 199,086,967 3,440,679 154,532,204 91,748,850 3,453,831
2020 - 106,147,201 7,943,359 30,140,322 15,789,181 207,548,485 3,122,395 154,671,801 89,240,519 3,793,228
2021 - 94,798,428 7,938,141 30,077,551 15,788,488 216,370,191 2,953,645 154,944,411 89,240,759 3,632,499
2022 - 80,716,109 7,946,829 29,115,737 15,788,563 225,567,942 1,625,048 155,172,127 89,246,418 2,684,695
2023 - 80,409,403 7,942,911 29,102,869 15,786,325 235,152,696 1,629,451 155,382,544 89,243,629 2,249,196
2024 - 75,637,200 7,950,941 29,107,281 8,394,725 245,145,513 1,483,657 155,587,786 89,239,005 2,037,310
2025 - 59,779,848 7,947,639 29,032,764 - 255,567,300 1,193,905 155,825,698 89,240,723 1,924,731
2026 - 59,543,950 7,945,839 29,008,571 - 266,429,051 1,202,294 156,043,370 89,241,055 1,918,976
2027 -58,559,746
7,946,93928,315,563
- 277,749,4211,203,044 156,362,908
79,325,5431,732,005
2028 - 57,758,025 7,952,654 28,288,018 - - 1,201,525 156,203,218 59,493,950 1,745,398
2029 - 55,021,544 7,949,435 26,597,689 - - 503,688 155,715,549 45,828,650 1,652,162
2030 - 50,135,695 7,521,947 24,249,703 - - 505,575 154,988,191 29,745,650 1,230,720
2031 - 41,964,356 7,526,700 22,090,796 - - - 154,231,415 19,829,525 945,165
2032 - 35,321,537 7,523,813 20,365,376 - - - 153,240,579 - 490,521
2033 - 30,957,927 7,510,875 19,822,515 - - - 151,453,891 - -
2034 - 23,542,426 7,519,391 16,479,731 - - - 148,797,399 - -
2035 - 20,537,717 4,048,500 16,466,726 - - - - - -
2036 - 3,755,100 4,043,000 13,817,519 - - - - - -
46 Includes annual fiscal year debt service requirements on all Net Tax-Supported debt issued through June 30, 2011.STATE OF OREGON APPENDIX A-6 STATE DEBT POLICY
ADVISORY COMMISSION

8/3/2019 STATE DEBT POLICY ADVISORY COMMISSION: Approved Report
http://slidepdf.com/reader/full/state-debt-policy-advisory-commission-approved-report 79/85
2037 - 3,754,450 1,552,000 13,814,817 - - - - - -
2038 - 3,755,400 1,558,000 12,306,188 - - - - - -
2039 - 3,757,425 - 11,462,969 - - - - - -
2040 - - - 9,712,000 - - - - - -
2041 - - - 3,663,500 - - - - -
2042 - - - 3,659,250 - - - - - -
Program
Totals$173,529,255 $2,019,848,381 $191,843,306 $697,506,224 $197,837,866 $3,312,592,917 $53,835,082 $3,709,491,580 $1,753,295,848 $60,508,174
Note: May not foot due to rounding.
Table A-5 (Continued)
Net Tax-Supported Debt
Annual Debt Service Requirements47
Fiscal
Year
(ending
June
30th)
State General
Purpose Bonds
(Article XI-Q)
(GF Supported
Portion)
Seismic Rehab
Public Ed Blgs.
(XI-M)
Seismic Rehab
Emergency
Services Bldgs.
(XI-N)
Total
Net Tax-
Supported Debt
2012 $20,274,463 $718,803 $712,415 $764,323,626
2013 23,753,150 719,163 707,863 767,688,868
2014 32,386,350 721,213 710,013 710,795,722
2015 32,362,450 721,013 709,913 680,899,229
2016 31,675,950 721,813 710,863 650,356,858
2017 24,927,600 717,163 706,363 639,412,022
2018 24,924,900 719,713 709,063 639,355,497
2019 17,510,150 721,713 711,213 632,148,526
2020 17,522,350 723,163 707,813 637,287,044
2021 25,727,050 719,063 709,013 641,937,422
2022 23,238,750 719,563 709,663 632,518,575
2023 23,240,750 722,013 712,263 641,578,460
2024 23,231,250 721,138 711,544 639,172,833
2025 23,233,750 722,025 707,594 625,151,783
47 Includes annual fiscal year debt service requirements on all Net Tax-Supported debt issued through June 30, 2011.STATE OF OREGON APPENDIX A-7 STATE DEBT POLICY
ADVISORY COMMISSION

8/3/2019 STATE DEBT POLICY ADVISORY COMMISSION: Approved Report
http://slidepdf.com/reader/full/state-debt-policy-advisory-commission-approved-report 80/85
2026 23,240,750 721,688 712,619 635,315,153
2027 12,075,000 720,475 711,594 624,579,201
2028 12,078,000 718,375 709,688 324,618,212
2029 12,077,000 722,875 709,388 304,917,662
2030 12,066,250 721,375 708,288 280,441,843
2031 11,470,250 723,850 711,175 258,524,588
2032 11,472,250 720,075 707,825 230,289,950
2033 11,462,750 722,500 710,700 221,085,062
2034 11,466,250 721,275 709,925 211,879,883
2035 11,471,000 721,500 710,600 200,104,234
2036 11,460,750 245,575 235,125 33,554,367
2037 - - - 17,612,638
2038 - - - 16,776,369
2039 - - - 13,469,425
2040 - - - 6,339,625
2041 - - - 3,663,500
2042 - - - 3,659,250
Program
Totals
$484,349,163 $71,547,115 $17,272,515 $12,689,457,427
Note: May not foot due to rounding.
STATE OF OREGON APPENDIX A-8 STATE DEBT POLICY
ADVISORY COMMISSION

8/3/2019 STATE DEBT POLICY ADVISORY COMMISSION: Approved Report
http://slidepdf.com/reader/full/state-debt-policy-advisory-commission-approved-report 81/85
Table A-6
Net Tax-Supported Debt
Total Principal and Interest Debt ServiceRequirements 48
FiscalYear
(ending
June
30th)
Principal Interest Total
2012 $369,720,739 $394,602,888 $764,323,626
2013 387,269,991 380,418,877 767,688,868
2014 346,713,502 364,082,220 710,795,722
2015 332,520,925 348,378,304 680,899,229
2016 317,348,603 333,008,256 650,356,858
2017 321,441,892 317,970,130 639,412,0222018 337,447,818 301,907,679 639,355,497
2019 348,069,982 284,078,544 632,148,526
2020 370,269,886 267,017,159 637,287,044
2021 394,112,700 247,824,722 641,937,422
2022 403,548,454 228,970,121 632,518,575
2023 433,192,800 208,385,660 641,578,460
2024 452,608,300 186,564,533 639,172,833
2025 461,638,300 163,513,483 625,151,783
2026 495,937,200 139,377,953 635,315,153
2027 511,382,900 113,196,301 624,579,201
2028 238,669,800 85,948,412 324,618,212
2029 230,618,200 74,299,462 304,917,6622030 217,728,200 62,713,643 280,441,843
2031 206,955,600 51,568,988 258,524,588
2032 189,234,800 41,055,150 230,289,950
2033 189,770,000 31,315,062 221,085,062
2034 190,755,000 21,124,883 211,879,883
2035 189,720,000 10,384,234 200,104,234
2036 29,665,000 3,889,367 33,554,367
2037 15,125,000 2,487,638 17,612,638
2038 15,040,000 1,736,369 16,776,369
2039 12,420,000 1,049,425 13,469,425
2040 5,845,000 494,625 6,339,625
2041 3,400,000 263,500 3,663,500
2042 3,570,000 89,250 3,659,250
Totals $8,021,740,590 $4,667,716,837 $12,689,457,427
Note: May not foot due to rounding
48 Includes annual fiscal year debt service requirements on all Net Tax-Supported debt issued through June 30, 2011.
STATE OF OREGON APPENDIX A-8
STATE DEBT POLICY ADVISORY COMMISSION

8/3/2019 STATE DEBT POLICY ADVISORY COMMISSION: Approved Report
http://slidepdf.com/reader/full/state-debt-policy-advisory-commission-approved-report 82/85
Table A-7 49
Annual Debt Service Requirements for Lottery Bonds Outstanding
Fiscal Year
(ending
June 30th)
$6,545,000
1998 Series B
State
Drinking
Water
Projects
$155,410,000
1999 Series B
Local
Infrastructure
Facilities,
Schools,
Oregon Garden
and State Fair
Projects
$33,875,000
2000 Series A
Local
Infrastructure
Facilities
and
State Fair
Projects
$33,275,000
2001 Series A
Local
Infrastructure &
Economic
Development,
Education
and Natural Gas
Pipeline
$5,560,000
2001 Series B
Local
Government
and
Community
Loans &
Grants
$48,635,000
2002 Series A
Local
Infrastructure
&Economic
Development
and
Other Combined
Programs
$11,070,000
2002 Series B
Local
Infrastructure
&Economic
Development
and
Other Combined
Programs
$45,140,000
2002 Series C
Local
Infrastructure
& Economic
Development,
Public
Broadcasting &
Joseph Branch
Railway
$38,765,000
2003 Series A
Local
Infrastructure &
Economic
Development,
Southern
OregonUniversity
&
State Fair
$44,570,000
2003 Series B
Local
Infrastructure
&Economic
Development,
Southern
OregonUniversity
&
State Fair
$128,800,000
2004 Series A
Refunding
Bonds
$39,925,0
2004 Series
Columbi
River Chan
&
Rail Projec
$
20
In
2012 - - 2,220,750 2,575,925 577,075 3,442,475 1,173,683 3,839,355 3,687,018 4,258,705 31,247,698 3,717,
2013 - - - - 576,150 158,963 1,176,058 3,837,605 3,684,468 4,256,535 34,908,298 3,715,
2014 - - - - 578,250 15,713 1,172,858 572,180 1,325,593 4,257,670 38,283,578 3,718,
2015 - - - - 578,250 - 1,171,333 3,957,180 3,799,938 4,261,270 10,833,815 3,714,
2016 - - - - 575,100 - 1,176,150 3,958,550 3,798,438 4,257,510 7,290,490 3,713,
2017 - - - - - - 1,171,645 3,957,950 3,799,188 4,261,390 4,165,090 3,716,
2018 - - - - - - 1,173,150 3,956,750 3,801,688 4,257,220 4,163,250 3,715,
2019 - - - - - - - - - - - 3,717,
2020 - - - - - - - - - - -
2021 - - - - - - - - - - -
2022 - - - - - - - - - - -
2023 - - - - - - - - - - -
2024 - - - - - - - - - - -
2025 - - - - - - - - - - -
2026 - - - - - - - - - - -
2027 - - - - - - - - - - -
2028 - - - - - - - - - - -
2029 - - - - - - - - - - -
2030 - - - - - - - - - - -
2031 - - - - - - - - - - -
2032 - - - - - - - - - - -
2033 - - - - - - - - - - -
2034 - - - - - - - - - - -
2035 - - - - - - - - - - -
2036 - - - - - - - - - - -
2037 - - - - - - - - - - -
Totals -$ -$ 2,220,750$ 2,575,925$ 2,884,825$ 3,617,150$ 8,214,875$ 24,079,570 23,896,328 29,810,300 130,892,218 29,726,9
Note: May not foot due to rounding.
49 Includes annual fiscal year debt service requirements on all Lottery debt issued through June 30, 2011.
STATE OF OREGON APPENDIX A-9 STATE DEBT POLICY
ADVISORY COMMISSION

8/3/2019 STATE DEBT POLICY ADVISORY COMMISSION: Approved Report
http://slidepdf.com/reader/full/state-debt-policy-advisory-commission-approved-report 83/85
Table A-7 50(Continued)
Annual Debt Service Requirements for Lottery Bonds Outstanding
Fiscal Year
(ending
June 30th)
$120,505,000
2007 Series A
ODOT Multi-
Modal, South
Metro, OUS
Def. Maint.
$33,050,000
2007 Series B
ODOT Multi-
Modal &
Shovel Ready
Sites
$23,940,000
2007 Series C
SWOregon
Region AP &
OUS Deferred
Maintenance
$55,850,000
2008 Series A
OPB, Housing
Plus, OUS
Deferred
Maintenance,
Transportation,
Economic
Development
$14,005,000
2008 Series B
OUS Deferred
Maintenance &
Intermodal
Transportation
$440,345,000
2009 Series A
PortlandLight
Rail Project,
Connect
Oregon II,
Oregon Street
Car Project,
Hillsboro
ParkingProject, OUS
Deferred
Maintenance
$23,095,000
2009 Sereies B
Grants &Loans
for
Infrastructure
Projects
$27,125,000
2009 Series C
Refunding
Bonds
(Refunds
Series 1999 A)
$40,825,000
2009 Series D
Port of
Newport -
NOAAFleet,
Gilchrist
Forest, Low-
Income
Housing,
UmatillaAquafier
$34,195,000
2010 Series A
Port of
Morrow, Port
of Tillamook,
Port of Coos
Bay, Pendleton
Round-Up,
Construction
&MaintainCourt
Facilities, Blue
Mountain
$9,2454,000
2010 Series B
Manufactured
Home Dwelling
Park, Low-
Income
Housing,
Energy
Efficiency &
SustainableTechnology
Loan Program
$1
201
DA
T
D
C
C
De
Dep
O
2012 5,727,788 6,627,201 1,894,095 2,429,199 2,112,123 19,789,726 16,783,474 449,850 3,364,650 1,471,350 1,827,178
2013 5,727,788 6,625,152 1,896,939 2,429,199 2,113,903 30,649,726 3,290,928 120,250 3,370,050 1,471,350 1,829,156
2014 7,027,788 5,324,922 1,893,333 3,689,199 853,387 28,695,976 - 2,525,250 3,369,750 1,471,350 1,831,456
2015 12,353,388 - 1,892,633 18,853,799 - 36,910,126 - - 3,362,500 1,471,350 1,828,036
2016 12,351,388 - 1,895,453 3,938,149 - 36,910,181 - - 3,366,750 1,471,350 1,828,446
2017 12,350,638 - 1,896,608 3,938,524 - 36,910,113 - - 3,366,750 3,106,350 191,846
2018 12,354,438 - 1,896,098 3,939,324 - 36,905,788 - - 3,367,500 3,302,300 -
2019 12,354,438 - 1,893,923 3,936,324 - 36,909,538 - - 3,368,750 3,300,900 -
2020 12,352,813 - 1,894,423 3,939,524 - 36,907,988 - - 3,370,250 3,300,050 -
2021 12,354,563 - 1,894,623 3,938,524 - 36,906,906 - - 3,366,750 3,299,900 -
2022 12,355,313 - 1,892,623 3,938,324 - 36,906,606 - - 3,368,250 3,298,400 -
2023 12,354,063 - 1,893,423 3,935,074 - 36,906,638 - - 3,369,250 3,298,550 -
2024 12,354,813 - 1,894,898 3,936,118 - 36,906,288 - - 3,364,500 3,301,650 -
2025 12,351,313 - 1,892,488 3,939,618 - 36,910,413 - - 3,369,000 3,298,900 -
2026 12,352,563 - 1,896,513 3,936,438 - 36,908,938 - - 3,367,000 3,300,400 -
2027 12,352,063 - 1,897,350 3,935,188 - 36,905,250 - - 3,368,500 3,300,650 -
2028 - - - 3,935,438 - 36,906,250 - - 3,368,000 3,299,400 -
2029 - - - - - 36,907,500 - - 3,365,250 3,301,400 -
2030 - - - - - - - - - 3,301,150 -
2031 - - - - - - - - - - -
2032 - - - - - - - - - - -
2033 - - - - - - - - - - -
2034 - - - - - - - - - - -
2035 - - - - - - - - - - -
2036 - - - - - - - - - - -
2037 - - - - - - - - - - -
Totals 179,075,150 18,577,275 30,315,416 78,587,958 5,079,412 632,753,949 20,074,402 3,095,350 60,613,450 53,366,750 9,336,118 2
Note: May not foot due to rounding
50 Includes annual fiscal year debt service requirements on all Lottery debt issued through June 30, 2011.
STATE OF OREGON APPENDIX A-10 STATE DEBT POLICY
ADVISORY COMMISSION

8/3/2019 STATE DEBT POLICY ADVISORY COMMISSION: Approved Report
http://slidepdf.com/reader/full/state-debt-policy-advisory-commission-approved-report 84/85
Table A-8
Lottery Revenue Debt
Total Principal and Interest Debt Service Requirements51
Fiscal Year
(ending
June 30th)
Principal Interest Total
2012 $77,635,000 $57,149,798 $134,784,798
2013 73,655,000 53,722,130 127,377,130
2014 70,555,000 50,404,289 120,959,289
2015 73,585,000 46,989,511 120,574,511
2016 58,410,000 43,702,705 102,112,705
2017 57,445,000 40,968,402 98,413,402
2018 60,100,000 38,309,741 98,409,741
2019 56,250,000 35,498,850 91,748,850
2020 56,315,000 32,925,519 89,240,519
2021 58,960,000 30,280,759 89,240,759
2022 61,725,000 27,521,418 89,246,418
2023 64,665,000 24,578,629 89,243,629
2024 67,825,000 21,414,005 89,239,005
2025 71,285,000 17,955,723 89,240,723
2026 74,900,000 14,341,055 89,241,055
2027 68,810,000 10,515,543 79,325,543
2028 52,410,000 7,083,950 59,493,950
2029 41,360,000 4,468,650 45,828,650
2030 27,345,000 2,400,650 29,745,650
2031 18,845,000 984,525 19,829,525Total $1,192,080,000 $561,215,848 $1,753,295,848
Note: May not foot due to rounding.
51 Includes annual fiscal year debt service requirements on all Lottery revenue debt issued through June 30, 2011.
STATE OF OREGON APPENDIX A-11
STATE DEBT POLICY ADVISORY COMMISSION

8/3/2019 STATE DEBT POLICY ADVISORY COMMISSION: Approved Report
http://slidepdf.com/reader/full/state-debt-policy-advisory-commission-approved-report 85/85
This Page Intentionally Blank