State-County Functions Working Group...
173
A Report to the Governor and the Legislature of the State of Hawai‘i THE AUDITOR STATE OF HAWAI‘I December 2015 State-County Functions Working Group Report Prepared by The Auditor, State of Hawai‘i and Belt Collins Hawaii LLC
Transcript of State-County Functions Working Group...

A Report to the Governor and the Legislature of the State of Hawai‘i
THE AUDITORSTATE OF HAWAI‘I
December 2015
State-County Functions Working Group Report
Prepared by The Auditor,State of Hawai‘i andBelt Collins Hawaii LLC

i
Table of Contents Foreword Message from the Chair State-County Functions Working Group Members Executive Summary ........................................................................................................................... ES-1 Chapter 1 Introduction ............................................................................................................................................. 1-1 State-County Functions Working Group Composition, Responsibilities, and Meetings ................................................................................................................................. 1-1 Background on Hawai‘i’s Transient Accommodations Tax ................................................. 1-3 Transient Accommodations Tax Rate .................................................................................... 1-3 Transient Accommodations Tax Distribution .................................................................... 1-4 State-County Functions Working Group Study Approach, Timetable, and Reporting ................................................................................................................................... 1-10 Funding and Consultant Services ......................................................................................... 1-10 Belt Collins Hawaii LLC Team Key Personnel .......................................................... 1-11 Consultant’s Scope and Methodology ................................................................................. 1-12 Working Group Interim and Final Reports ...................................................................... 1-12
Chapter 2 Introduction ............................................................................................................................................. 2-1 Evaluate the Division of Duties and Responsibilities Between the State and Counties Relating to the Provision of Public Services ........................................................ 2-2 Establishment and Assignment of Investigative Groups Pursuant to Sunshine Law ................................................................................................................................ 2-3 State and Counties Comprehensive Annual Financial Report Expenditure Categories Reflect Public Services Provided ................................................................... 2-4 Working Group Observations Based on Investigative Group Work ......................... 2-5 Investigative Group Report Summaries ............................................................................... 2-6 County Duties and Responsibilities Investigative Group....................................... 2-6 State Duties and Responsibilities Investigative Group ........................................ 2-11 Visitor Industry Investigative Group ........................................................................... 2-12

ii
Further Analysis of Public Service Expenditures .......................................................... 2-14 Public Testimony on Allocations .......................................................................................... 2-16
Chapter 3 Submit a Recommendation to the Legislature on the Appropriate Allocation of Transient Accommodations Tax Revenues ....................................................................... 3-1 Allocation Models Investigative Group ........................................................................................ 3-1 Consideration of Models in Relation to Potential TAT Revenues, to 2025 ................... 3-2 Scenarios Prepared for Review by the Working Group ................................................. 3-2 Models Considered by the Working Group ................................................................................ 3-6 1. Simple Shares Model, TAT revenues divided into three shares ........................... 3-7 2. Simple Shares Model, alternative shares ........................................................................ 3-7 3. Shares Model, with TSF protected against downturns ............................................. 3-7 4. Shares Model, with existing special funds increasing with inflation .................. 3-7 5. Current Distribution ................................................................................................................ 3-8 6. “Historic Intent” Model devised by Allocation Models Investigative Group ... 3-8 7. Three-Stage Model Presented by Allocation Models Investigative Group ....... 3-9 8. Three-Stage Model Variant ................................................................................................... 3-9 9. “Lessons Learned” Model ................................................................................................... 3-10 Implications of the Models Under Growth and Recession Scenarios ................... 3-10 Recommendations .............................................................................................................................. 3-11 Points of General Agreement or Consensus in Working Group Discussions ..... 3-11 Support for the visitor industry via TSF ..................................................................... 3-11 Removal of caps on allocations ...................................................................................... 3-12 Recognition of key principles for allocation ............................................................. 3-12 Model Recommended by the Working Group to the Legislature ........................... 3-12 Additional Considerations .............................................................................................................. 3-15 Obligation to Support the Employer-Union Trust Fund ............................................. 3-15 Potential Changes in Demand for and Supply of Hawai‘i Visitor Lodgings ........ 3-15
Chapter 4 Findings and Purposes Statement Investigative Group and Proposed Legislation .. 4-1

iii
Appendices Appendix A Act 174, Session Laws of Hawai‘i 2014 Appendix B “Sharing TAT Revenues in Hawai‘i: A Background Paper” by Dr. James Mak Appendix C County Duties and Responsibilities Investigative Group Report Appendix D State Duties and Responsibilities Investigative Group Report Appendix E Visitor Industry Investigative Group Report Appendix F Additional Expenditures Analyses Appendix G Allocation Models Investigative Group Report Appendix H Impacts of Models Under Growth and Recessionary Conditions, to 2025 List of Exhibits Exhibit 1-1 TAT Rate Changes and Effective Dates, Inception to Present ............... 1-3 Exhibit 1-2 TAT Collections and Rates, FY1987 to FY2015 ........................................... 1-4 Exhibit 1-3 TAT Distributions, FY1987 to FY2015 ......................................................... 1-10 Exhibit 2-1 County and State CAFR Expenditure Categories, FY2013 and FY2014 ................................................................................................................. 2-4 Exhibit 2-2 County Total Expenditures and Expenditures on Visitors (FY2014) and Visitor to Resident Ratio (FY2013) .................................... 2-7 Exhibit 2-3 County Expenditures on Visitors as a Share of Total County Operating Expenditures, FY2014 ...................................................... 2-8 Exhibit 2-4 Each County’s Expenditures to All County Expenditures, FY2014 ..... 2-8 Exhibit 2-5 County Expenditures on Visitors in Relation to Total County Expenditures Statewide on Visitors, FY2014 ............................................... 2-9 Exhibit 2-6 County TAT Allocations, FY2014 ....................................................................... 2-9 Exhibit 2-7 County Shares of Total TAT After Allocations for Legislative Appropriations, FY2014 ..................................................................................... 2-10 Exhibit 2-8 TAT Allocations Among Counties and County Expenditures on Visitors to Total County Expenditures Statewide on Visitors, FY2014 ....................................................................................................................... 2-10 Exhibit 2-9 County Expenditures on Visitors and TAT Allocations to Counties, FY2014 (in millions) ........................................................................ 2-11 Exhibit 2-10 Expenditures on Visitors to State Total Expenditures, FY2014 (in thousands) ...................................................................................... 2-11 Exhibit 2-11 Visitor Industry Priority Categories and Focus Areas ........................... 2-13

iv
Exhibit 2-12 State’s and Counties’ Expenditures ............................................................... 2-14 Exhibit 3-1 Changes in the Historical TAT Tax Base, 2000 to 2015 ........................... 3-4 Exhibit 3-2 Potential Statewide Annual TAT/TOT Collections, FY2015–FY2025 ....................................................................................................... 3-5 Exhibit 3-3 Model Recommended by the Working Group to the State Legislature .................................................................................................... 3-14 Acronyms and Abbreviations
CAFR comprehensive annual financial report CPI Consumer Price Index (calculated by federal Bureau of Labor Statistics) CPI-U Honolulu Consumer Price Index for Urban Consumers DBEDT Hawai‘i State Department of Business, Economic Development and Tourism DLNR Hawai‘i State Department of Land and Natural Resources EUTF Employer-Union Health Benefits Trust Fund FY fiscal year GET General Excise Tax HA Hospitality Advisors LLC HTA Hawai‘i Tourism Authority IVU individual vacation unit LRB Legislative Reference Bureau SLH Session Laws of Hawai‘i TAT transient accommodations tax TOT transient occupancy tax (on use of timeshare units; comparable to TAT) TSF Tourism Special Fund

Foreword
The 2014 Legislature, through Act 174, Session Laws of Hawai‘i 2014, created the State-County Functions Working Group. Charged with (1) evaluating the division of duties and responsibilities between the State and counties relating to the provision of public services, and (2) submitting a recommendation to the Legislature on the appropriate allocation of the transient accommodations tax revenues between the State and counties that properly reflects the division of duties and responsibilities relating to the provision of public services, the Working Group submits its findings and recommendations in this report. On behalf of the State-County Functions Working Group as well as my office, we wish to express our appreciation for the cooperation and help of the many individuals who contributed to this report. We also want to thank our consultant, Belt Collins Hawaii LLC, for its assistance and commitment to this project. Jan K. Yamane Acting State Auditor


Message from the Chair
Aloha oukou, The transient accommodations tax (TAT) is tied to the State's premier industry, tourism. In that regard, the viability of the tourism industry, the reimbursement of tourism-related expenditures to affected jurisdictions, and the appropriate allocation of TAT as a source of revenue for the State and the county governments were fundamental issues considered by us. Our State-County Functions Working Group (WG) established in 2014 by Act 174 was mandated to evaluate public service functions as between the state and the counties and to recommend an allocation of TAT revenues between the state and the counties reflective of the provision of public services. The permanency of any of the WG's recommendations lies in its persuasiveness. I believe we have attempted an approach that, among other things, is flexible in that it largely reflects the availability of tax revenue, equitable in that any increase or reduction in revenue is shared among the State and counties, and predictive in that the allocations are premised on definite shares. The WG consisted of representatives from the State, the counties, and the tourism industry who have a wide array of experience and expertise in finance, the legislative process, government budgeting, the visitor industry, and business. Over the past year the members have respectfully considered all points of view, studied the issues in depth and ultimately reached a consensus on our recommendations to the Legislature as set forth in our attached report. It has truly been a privilege to be a part of the WG and to have worked with such committed members. We thank the Acting State Auditor Jan K. Yamane and her staff at the Office of the Auditor for their invaluable guidance and support. We also are appreciative of the consultant work of John Kirkpatrick and the Belt Collins Hawaii Team. We hope our efforts will contribute to further progress in this area. Sincerely, Simeon R. Acoba, Jr., Associate Justice (ret.) Chair


State-County Functions Working Group Members
Simeon R. Acoba, Jr., Chair Associate Justice (retired) Sananda Baz Budget Director County of Maui Edward E. Case Senior Vice President and Chief Legal Officer Outrigger Enterprises Group Mary Alice Evans Deputy Director Department of Business, Economic Development and Tourism Steven Hunt Tax Manager County of Kaua‘i George Kam Ambassador of AlohA Quiksilver Neal Miyahira Administrator Budget Program Planning and Management Division Department of Budget and Finance Deanna Sako Finance Director County of Hawai‘i
Ray Soon Chief of Staff City and County of Honolulu Jesse Souki Deputy to the Chair Board of Land and Natural Resources (until December 2014) Of Counsel Imanaka Asato LLC (from January 2015) George D. Szigeti President and CEO Hawai‘i Lodging & Tourism Association (Resigned from Working Group in June 2015) Ronald K. Williams President and CEO Atlantis Adventures, LLC Tina Yamaki Director of Business Support PBS Hawaii (Appointed to Working Group in June 2015) Kerry Yoneshige Business Management Officer Department of Accounting and General Services


ES-1
FINAL REPORT TO THE LEGISLATURE OF THE STATE OF HAWAI‘I
BY THE STATE-COUNTY FUNCTIONS WORKING GROUP (TAT)
Summary The State-County Functions Working Group was established by Act 174, Session Laws of Hawai‘i (SLH) 2014, to consider the distribution of duties and responsibilities for public services between the State and the counties, and to recommend to the Legislature a model for allocation of transient accommodations tax (TAT) revenues in future years that properly reflects the division of those duties and responsibilities. (Those revenues include both TAT and transient occupancy tax [TOT] collections for timeshare properties.) A 13-person Working Group was established, with members appointed by the President of the Senate, the Speaker of the House of Representatives, the four county mayors and the governor, and with a Chair selected by the Chief Justice of the Hawai‘i Supreme Court. The Working Group’s initial meeting was on October 22, 2014. The Working Group met regularly in the following year, and reached a unanimous decision to recommend a model for allocating TAT revenues at its meeting of October 21, 2015. The group subsequently reviewed and refined this report. The Working Group examined the cost of public services provided by the State and counties. It considered expenditures grouped in the broad functional categories used in comprehensive annual financial reports (CAFR) and more fine-grained analyses of county expenditures, to learn both the relative size of total public service expenditures and the ratio of tourism-related expenditures by the State and counties. While no one analysis provided the definitive answer to the Legislature’s question, the Working Group found that the key responsibilities of the State and the counties were distributed in a 55 percent (for the State) and 45 percent (for the counties) ratio. The Working Group identified key principles for allocation of TAT moneys, including fairness, predictability, simplicity and flexibility or resilience in changing circumstances. The Working Group saw the TAT revenue stream as important to the work of the Hawai‘i Tourism Authority (HTA), the counties and the State, and sought an approach that reflects both public service provision and the need for these organizations to be able to budget and plan work supported by TAT allocations.

ES-2
Recommendation The Working Group considered several models for the allocation of TAT revenues on an ongoing basis. The Working Group recommends that: • The Tourism Special Fund (TSF) receive $82 million in fiscal year (FY) 2015 and FY2016, and amounts changing in line with the Consumer Price Index for Urban Consumers (Honolulu) in subsequent years; • Existing appropriations for the Convention Center, Turtle Bay, and the Special Land Development Fund, totaling $31 million, continue at the same level in future years; and • The remainder of the TAT revenues be allocated to the State and counties, with the State receiving 55 percent of the remainder, and the counties receiving 45 percent.1 The recommendation followed on study of both a growth scenario, drawing on available information about likely developments in visitor spending on accommodations, and a “what if” recessionary scenario. The Working Group sought to find an allocation strategy that could be found to be equitable in both good times and bad. Allocation models were assessed in light of projected distributions under both growth and recessionary conditions. The distribution of revenues to the four counties has followed an allocation established in 1990, which has not changed in later years (44.1 percent to the City and County of Honolulu, 22.8 percent to Maui County, 18.6 percent to Hawai‘i County, and 14.5 percent to Kaua‘i County). The Working Group did not recommend a change in that distribution. The revenues allocated to the counties would continue to be allocated without any further provision that the money be spent for particular purposes. The Working Group decided to recognize as continuing in future years the existing appropriations from TAT revenues (specified in Act 174, and in Acts 117 and 121, SLH 2015), but found that any future special appropriations should come from the share of the jurisdiction (State or counties) that made the actual appropriation. If, for example, the Legislature appropriates funds above the amount currently set aside for the Convention Center, that amount would come from the State’s 55 percent share of revenues, and not be considered as an obligation preceding the 55 percent/45 percent split. Again, should any of the existing obligations be met and no longer be needed, the amount set aside for those obligations would be reduced accordingly.
1 See page 2-16 for more on this recommendation.

ES-3
Starting in FY2019, if the counties do not set aside enough funds to cover their annual obligations to the Employer-Union Trust Fund (EUTF) for health care, the difference between their obligations and their contributions will be taken from their TAT allocations. This contingency is expected to be met by the counties, and is not part of the model considered by the Working Group. The report provides additional information concerning the history of the TAT; public expenditures, including expenditures directly or indirectly related to tourism; principles for developing models of allocation of the TAT revenues; models for allocation; forecasts for estimating future revenues; and issues that could affect the amounts to be allocated. Draft legislation incorporating the Working Group recommendations is included as Chapter Four.

This page intentionally left blank

1-1
Chapter 1
Introduction Hawai‘i’s transient accommodations tax (TAT) was enacted in 1986 as a tax upon room revenues derived from transient accommodations and imposed upon every operator of such accommodations.1 Since that time, the Legislature adjusted the TAT by both raising the TAT rate and changing the distribution of TAT revenues. In 2014, the Legislature indicated it would consider permanently establishing TAT revenue allocations between the State and the counties. In light of this, it established the State-County Functions Working Group (Working Group) and directed it to: • Conduct a study to evaluate the division of duties and responsibilities between the State and counties relating to the provision of public services and • Submit a recommendation to the Legislature on the appropriate allocation of the TAT revenues between the State and counties that properly reflects the division of duties and responsibilities relating to the provision of public services. This final report of the Working Group addresses these objectives2 and includes draft legislation in a form suitable for introduction during the 2016 Regular Session.
State-County Functions Working Group Composition, Responsibilities, and Meetings The Working Group is composed of 13 members and is administratively placed within the Office of the Auditor. As directed by Act 174, Session Laws of Hawai‘i (SLH) 2014, the members of the Working Group were appointed by the Governor, Chief Justice of the State of Hawai‘i, the President of the Senate, the Speaker of the House of Representatives, and each of the county mayors. Members appointed by the Chief Justice, President, and Speaker could not be State or county employees. Working Group members are listed below, along with their affiliation and appointing authorities.
1 Act 340 (Session Laws of Hawai‘i 1986). 2 Act 174 (SLH 2014).

1-2
Working Group Member Affiliation Appointing Authority Simeon R. Acoba, Jr., Chair Associate Justice (retired) Chief Justice Sananda Baz Budget Director Mayor, County of Maui Edward E. Case Senior Vice President and Chief Legal Officer Outrigger Enterprises Group House Speaker Mary Alice Evans Deputy Director Department of Business, Economic Development and Tourism Governor
Steven Hunt Tax Manager Mayor, County of Kaua‘i George Kam Ambassador of AlohA Quiksilver Senate President Neal Miyahira Administrator Budget Program Planning and Management Division Department of Budget and Finance Governor
Deanna Sako Finance Director Mayor, County of Hawai‘i Ray Soon Chief of Staff Mayor, City and County of Honolulu Jesse Souki Deputy to the Chair Board of Land and Natural Resources (until December 2014) Of Counsel Imanaka Asato LLC (from January 2015)
Governor
George D. Szigeti President and CEO Hawai‘i Lodging & Tourism Association House Speaker (Resigned from Working Group in June 2015) Ronald K. Williams President and CEO Atlantis Adventures, LLC Senate President Tina Yamaki Director of Business Support PBS Hawaii House Speaker (Appointed to Working Group in June 2015) Kerry Yoneshige Business Management Officer Department of Accounting and General Services Governor Working Group meetings were held once or twice monthly from October 2014 through December 2015 and were subject to the State’s sunshine law, Chapter 92, Hawai‘i Revised Statutes. Agendas and minutes, as well as meeting materials,
1-3
information, and resources, are available at the Office of the Auditor’s website: http://auditor.hawaii.gov/task-forceworking-group/. The Office of the Auditor provided staff support for the Working Group. Background on Hawai‘i’s Transient Accommodations Tax The TAT took effect on January 1, 1987, and levied a 5 percent tax on the gross income or gross proceeds derived from furnishing transient accommodations. The Legislature sought to tax the tourism industry for the benefit of the state, while at the same time limiting the impact of the tax on the industry by excluding general excise taxes (GET) collected from calculation of gross income or gross proceeds.
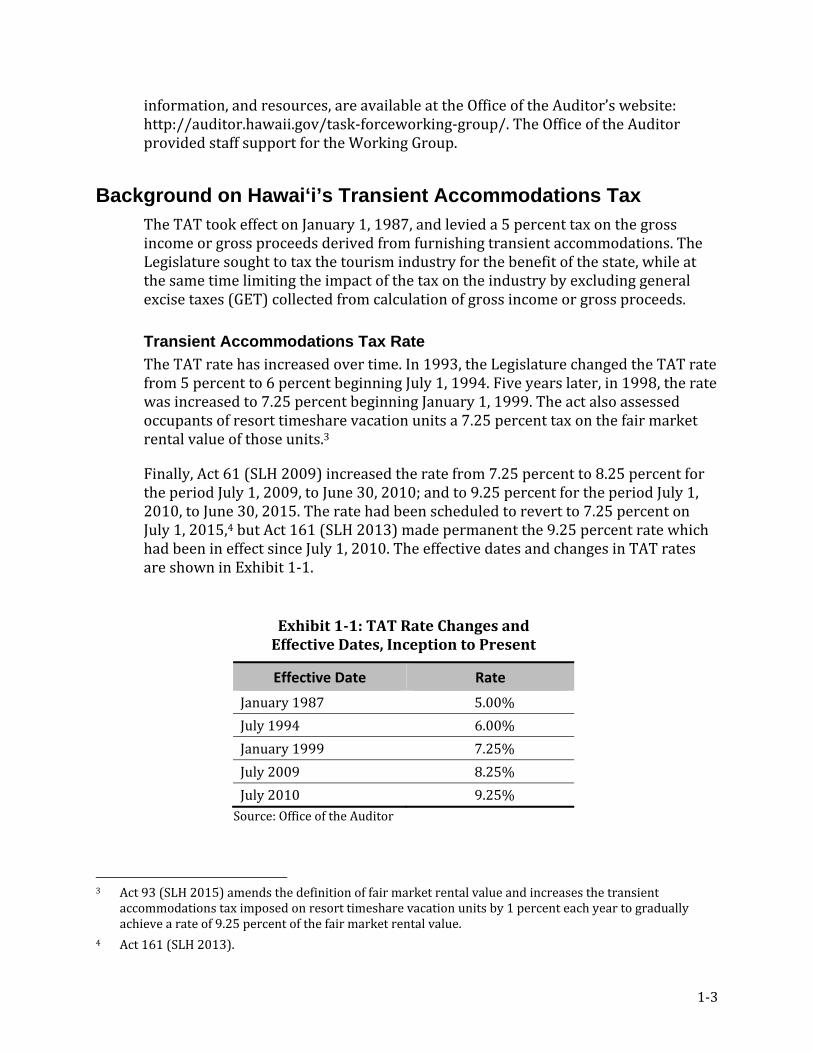
Transient Accommodations Tax Rate The TAT rate has increased over time. In 1993, the Legislature changed the TAT rate from 5 percent to 6 percent beginning July 1, 1994. Five years later, in 1998, the rate was increased to 7.25 percent beginning January 1, 1999. The act also assessed occupants of resort timeshare vacation units a 7.25 percent tax on the fair market rental value of those units.3 Finally, Act 61 (SLH 2009) increased the rate from 7.25 percent to 8.25 percent for the period July 1, 2009, to June 30, 2010; and to 9.25 percent for the period July 1, 2010, to June 30, 2015. The rate had been scheduled to revert to 7.25 percent on July 1, 2015,4 but Act 161 (SLH 2013) made permanent the 9.25 percent rate which had been in effect since July 1, 2010. The effective dates and changes in TAT rates are shown in Exhibit 1-1. Exhibit 1-1: TAT Rate Changes and
Effective Dates, Inception to Present
Effective Date Rate January 1987 5.00% July 1994 6.00% January 1999 7.25% July 2009 8.25% July 2010 9.25% Source: Office of the Auditor 3 Act 93 (SLH 2015) amends the definition of fair market rental value and increases the transient accommodations tax imposed on resort timeshare vacation units by 1 percent each year to gradually achieve a rate of 9.25 percent of the fair market rental value. 4 Act 161 (SLH 2013).

1-4
Exhibit 1-2 shows TAT collections and rates for FY1987 to FY2015. 5 Exhibit 1-2: TAT Collections and Rates, FY1987 to FY2015
Source: Hawai‘i Department of Taxation and Office of the Auditor Transient Accommodations Tax Distribution Although the TAT took effect in 1987, it was not until 1990 that a portion of the TAT collected was distributed to the counties. Thereafter, the distribution rate changed more than a dozen times over the next two decades. Act 185 (SLH 1990) began distributing TAT funds to the State and various counties as follows:
• 5 percent of the revenues collected was retained by the State for TAT-related administrative purposes; • Of the remaining 95 percent of TAT collected:
14.5 percent was to be distributed to Kaua‘i County; 18.6 percent was to be distributed to Hawai‘i County; 22.8 percent was to be distributed to Maui County; and 44.1 percent was to be distributed to the City and County of Honolulu.
5 The historical discussion deals with the transient accommodations tax; the transient occupancy tax on timeshares occupied by owners or timeshare program participants is calculated differently, and its rate has changed at different times. The current rate is 9.25 percent of “fair market value.” For computation of “fair market value,” see Hawai‘i State Department of Taxation, Tax Facts 98-4 Transient Accommodations Tax on Time Share Occupancy, 1998, at http://files.hawaii.gov/tax/legal/taxfacts/tf98-04.pdf.
0
50
100
150
200
250
300
350
400
450
1987
1988
1989
1990
1991
1992
1993
1994
1995
1996
1997
1998
1999
2000
2001
2002
2003
2004
2005
2006
2007
2008
2009
2010
2011
2012
2013
2014
2015
$ M
illio
ns
Fiscal Year
5%
8.25%
9.25%
6%
7.25%

1-5
In 1993, the distribution was changed beginning July 1994, by increasing the State’s portion for deposits to the Convention Center Capital and Operations Special Fund.6 Distribution to the counties remained the same as in 1990; thus: • 5 percent of the revenues collected was retained by the State for TAT-related administrative purposes; • One-sixth (1/6) of the revenues collected was deposited into the Convention Center Capital and Operations Special Fund; and • The remaining TAT collected was distributed to the counties in the same proportional share as in prior years. The 1998 Legislature amended the TAT by assessing and collecting taxes on resort timeshare vacation units.7 Additionally, the measure increased the distribution to the Convention Center Capital Special Fund, included a distribution to the Tourism Special Fund (TSF), and divided the remaining TAT collected among the counties so that: • 17.3 percent of the revenues collected was deposited into the Convention Center Capital Special Fund; • 37.9 percent was deposited into the TSF; and • 44.8 percent was distributed to the counties in the same proportional share as in prior years. In 2002,8 the Legislature for the first time limited TAT distributions to the TSF (capped at almost $62.3 million, and lowered the percentage deposited to the fund from 37.9 percent to 32.6 percent, effective July 2002). It also limited TAT distributions to the Convention Center Enterprise Special Fund by capping these at $31 million, with any excess revenues deposited into the general fund, effective January 2002.9 If the deposit to the tourism fund exceeded its cap, then of the remaining overage, $1 million would be deposited in the following proportional shares—90 percent to the State Parks Special Fund and 10 percent to the Statewide Trail and Access Program—but not more than $1 million in any fiscal year (FY).
6 The Legislature later changed the Convention Center Capital and Operations Special Fund to the Convention Center Capital Special Fund through Act 124 (SLH 1997). 7 Act 156 (SLH 1998). 8 Act 250 (SLH 2002). 9 Act 253 (SLH 2002).

1-6
Finally, the Legislature deposited 5.3 percent into the newly established Transient Accommodations Tax Trust Fund.10 Over the next few years—2005 to 2008—the Legislature continued adjusting TAT revenue distribution by removing caps,11 increasing and changing distribution,12 and establishing and funding new funds.13 In 2009, the Legislature began exploring different avenues for increasing revenues to replace record shortfalls in the State budget, due to what was later called the Great Recession. A veto by the Governor was overridden by the Legislature and the TAT bill was later enacted as Act 61 (SLH 2009); it increased the TAT rate and required that the additional revenues collected be deposited to the general fund. Thus, the 2009 TAT rate of 7.25 percent was increased to 8.25 percent from July 2009 to June 2010; and to 9.25 percent from July 2010 to June 2015. In 2011, the Legislature continued to address budget shortfalls by increasing revenues from the TAT to the State. To accomplish this, the Legislature passed a measure that limited TAT revenues deposited into the TSF to no more than $69 million, and capped TAT revenues to the counties at $93 million.14 In its Conference Committee Report,15 the Legislature stated that the measure was intended to temporarily increase and preserve the amount of state revenues derived from the TAT, calling it a necessary component of the package of legislation aimed at addressing the State’s extended economic crisis. By 2012, the State’s focus returned to growing travel and tourism. Leveraging an executive order by President Obama in January 2012 that announced new initiatives to significantly increase travel and tourism in the United States, the Legislature sought to grow TAT deposits in the TSF to $71 million (from $69 million) to take advantage of the increased access to Hawai‘i for international visitors.16 10 The Legislature later repealed the Transient Accommodations Tax Trust Fund through Act 235 (SLH 2005). 11 Act 235 (SLH 2005) removed the cap and increased the allocation of TAT revenues to the TSF; repealed the Transient Accommodations Tax Trust Fund; revised the allocation of TAT revenue for the State Parks Special Fund and the Special Land Development Fund; and directed excess revenues to be deposited into the general fund. 12 Act 209 (SLH 2006) increased the ceiling of TAT revenues deposited into the Convention Center Enterprise Special Fund and directed excess revenues to be deposited into the general fund. 13 Act 201 (SLH 2007) established and funded the Tourism Emergency Trust Fund. 14 Act 103 (SLH 2011). 15 Conference Committee Report No. 139 on Senate Bill 1186, Senate Draft 2, House Draft 1, Conference Draft 1, dated April 29, 2011. 16 Act 171 (SLH 2012).

1-7
In 2013, the Legislature made permanent the 9.25 percent TAT rate and the caps on TAT distribution to the TSF and the counties.17 Versions of the measure—for example, Senate Bill 1194, Senate Draft 2, proposed House Draft 1—were hotly debated among stakeholders in legislative committees. The State director of finance testified that reducing the 9.25 percent TAT charge to 7.25 percent would repeal an important revenue source for FY2014 and FY2015. Hawai‘i Lodging and Tourism Association and Hawai‘i Tourism Authority (HTA) representatives advocated a reduction of the TAT to 7.25 percent as a means of keeping Hawai‘i’s visitor industry competitive and maintaining the positive momentum of the industry and long-term positioning of the Hawaiian Islands in the world-wide market. The counties—the City and County of Honolulu and the counties of Hawai‘i, Maui, and Kaua‘i—espoused the need for the TAT to support services for residents and visitors alike, including ocean safety, park maintenance, police protection, fire protection, bus services, and infrastructure repair and maintenance. For some counties, TAT distributions are the second largest source of county revenue, making it important that the distributions increase as visitor counts increase. The Legislature ultimately decided that allowing the TAT rate to revert to 7.25 percent would deprive the general fund of needed tax revenues. Retention of the 9.25 percent tax rate was seen as key to ensuring that the State’s general fund remains balanced beyond the fiscal biennium 2013 to 2015.18 The 9.25 percent cap was made permanent, and the distribution of revenue was set as follows: • $33 million was allocated to the Convention Center Enterprise Special Fund (rather than 17.3 percent); • $82 million was allocated to the TSF (rather than 34.2 percent), $1 million of which is allocated to operate a Hawaiian center and the Museum of Hawaiian Music and Dance at the Hawai‘i Convention Center; • The $1 million allocation to the State Parks Special Fund and Special Land Development Fund was repealed; • $93 million was allocated to the counties (rather than 44.8 percent) and the $93 million cap for the period beginning on July 1, 2011, and ending on June 30, 2015, was repealed; and • $3 million of the excess TAT revenues was deposited into the general fund for natural resources important to the visitor industry, facilities, and public lands connected with enhancing the visitor experience, to be expended by
17 Act 161 (SLH 2013). 18 Conference Committee Report No. 146 on Senate Bill 1194, Senate Draft 2, House Draft 1, Conference Draft 1, dated April 26, 2013.

1-8
mutual agreement of the Board of Land and Natural Resources and the HTA Board of Directors.19 The Legislature also added in 2013 the required use of a portion of the TAT revenues to supplement deficient county public employer contribution amounts commencing with FY2019.20 Recognizing the need to reduce the unfunded liability of the State’s Employer-Union Health Benefits Trust Fund (EUTF), the Legislature directed the use of GET and TAT revenues to supplement deficit payments by state and county public employers, respectively. In 2014, the Legislature again changed TAT allocations to the counties and established the Working Group to evaluate the division of duties and responsibilities between the State and counties and to recommend the appropriate TAT allocations to the counties.21 One legislative committee noted that TAT had been the subject of considerable discussion and debate among policymakers regarding its effect as a significant revenue generator and funding source in the State.22 Stakeholder testimonies alluded to myriad impacts if the cap was lifted or retained, citing general fund tax losses if the cap was removed;23 that county annual tourism-related expenditures far exceeded the counties’ capped portion of the TAT;24 and that the imposed cap was always understood to be a temporary measure;25 among others. In conference, the Legislature raised the TAT revenues allocated to the counties to $103 million for FY2015 and FY2016, but reduced the allocation to $93 million thereafter. Before the Legislature considered permanently establishing the TAT revenue allocations between the State and counties, it directed this Working Group to conduct a study to evaluate the division of duties and responsibilities between the State and counties relating to the provision of public services; and to submit a recommendation to the Legislature on the appropriate allocation of the transient accommodations tax revenues between the State and counties that 19 According to the Department of Land and Natural Resources, the $3 million was not accessible to the department for FY2015 because there was no appropriation. This issue has since been corrected for FY2016. 20 Act 268 (SLH 2013). 21 Act 174 (SLH 2014). 22 House Committee on Finance, Standing Committee Report No. 764-14 on House Bill 1671, House Draft 1, dated February 28, 2014. 23 Testimony by Kalbert Young, State Director of Finance, dated March 28, 2014, to the Senate Committee on Ways and Means on House Bill No. 1671, House Draft 1, Senate Draft 1. 24 Testimony of Kirk Caldwell, Mayor of the City and County of Honolulu, dated March 28, 2014, to the Senate Committee on Ways and Means on House Bill No. 1671, House Draft 1, Senate Draft 1. 25 Testimony of William P. Kenoi, Mayor of the County of Hawai‘i, dated March 28, 2014, to the Senate Committee on Ways and Means on House Bill No. 1671, House Draft 1, Senate Draft 1.

1-9
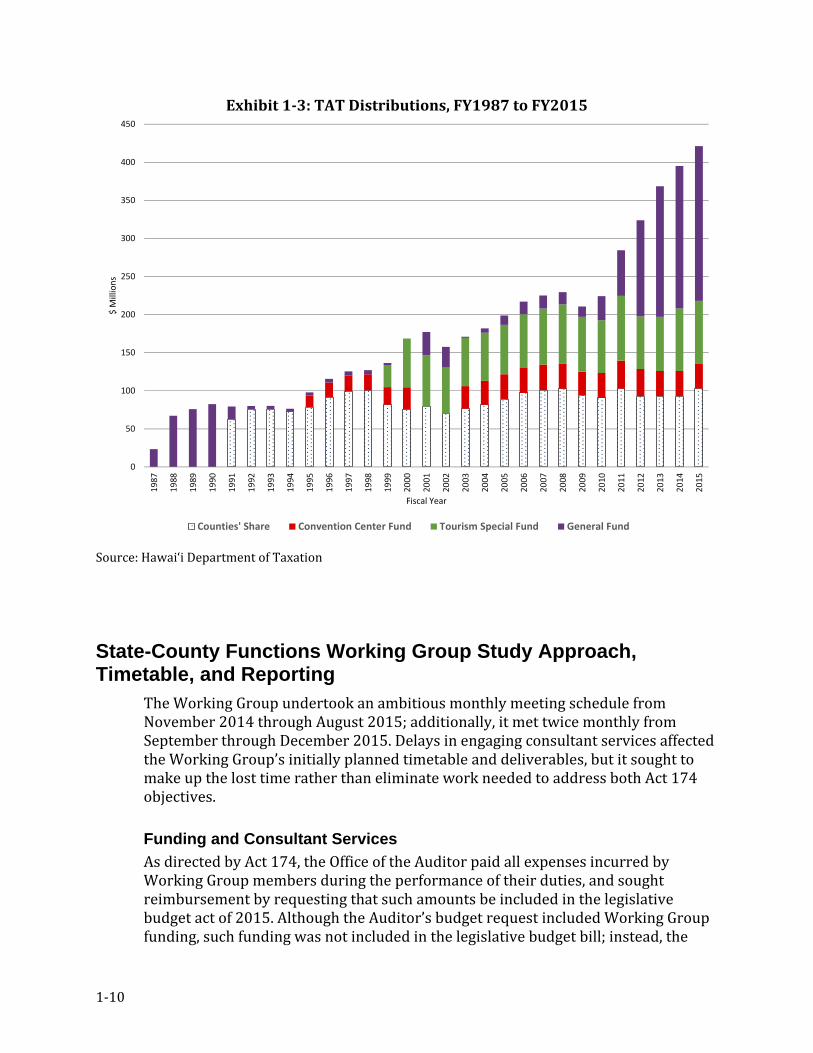
properly reflects the division of duties and responsibilities relating to the provision of public services. (Act 174 is attached to this report as Appendix A.) In 2015, the Legislature again introduced numerous measures to amend distribution of the TAT even as the Working Group continued to meet. The Working Group offered comments on all such measures, suggesting that the Legislature resist amending the distribution rate until after the group completed its work and issued its final report to the 2016 Legislature. Nevertheless, the Legislature passed two measures that changed the distribution priority and rate, and which were signed by the Governor as Acts 117 and 121, SLH 2015. As amended, the law now distributes TAT revenues in the following priority and rate structure:26 1. $1.5 million to the Turtle Bay conservation easement; 2. $26.5 million to the Convention Center Enterprise Special Fund; 3. $82 million to the TSF; 4. $103 million for each of FY2015 and FY2016;27 and $93 million for each fiscal year thereafter to the counties; and 5. $3 million to the Special Land and Development Fund to be expended according to the Hawai‘i Tourism Authority Strategic Plan for protection, preservation, maintenance, and enhancement of natural resources, including beaches, among other purposes. Exhibit 1-3 shows TAT distributions to the various funds—counties’ share, Convention Center Enterprise Special Fund, TSF, and the general fund—for FY1987 through FY2015.
26 Act 121 (SLH 2015). 27 Act 134 (SLH 2015) specifies that funds appropriated to the State-County Functions Working Group—$165,000—shall come from the TAT revenues allocated to the counties for FY2015–FY2016.
1-10
Exhibit 1-3: TAT Distributions, FY1987 to FY2015
Source: Hawai‘i Department of Taxation State-County Functions Working Group Study Approach, Timetable, and Reporting The Working Group undertook an ambitious monthly meeting schedule from November 2014 through August 2015; additionally, it met twice monthly from September through December 2015. Delays in engaging consultant services affected the Working Group’s initially planned timetable and deliverables, but it sought to make up the lost time rather than eliminate work needed to address both Act 174 objectives.
Funding and Consultant Services As directed by Act 174, the Office of the Auditor paid all expenses incurred by Working Group members during the performance of their duties, and sought reimbursement by requesting that such amounts be included in the legislative budget act of 2015. Although the Auditor’s budget request included Working Group funding, such funding was not included in the legislative budget bill; instead, the
0
50
100
150
200
250
300
350
400
450
1987
1988
1989
1990
1991
1992
1993
1994
1995
1996
1997
1998
1999
2000
2001
2002
2003
2004
2005
2006
2007
2008
2009
2010
2011
2012
2013
2014
2015
$ M
illio
ns
Fiscal Year
Counties' Share Convention Center Fund Tourism Special Fund General Fund

1-11
Legislature introduced two bills—one each in the House28 and Senate29—requesting $165,000 for the Working Group ($150,000 for consultant services and $15,000 for actual expenses). The 2015 Legislature passed the House bill,30 with funding of $165,000 to be appropriated out of the $103 million of TAT revenues allocated to the counties pursuant to Section 237D-6.5(b)(3), Hawai‘i Revised Statutes. The bill was signed by the Governor as Act 134, SLH 2015, on June 19, 2015. The Working Group determined at its November 5, 2014, meeting that it would request $150,000 to engage a consultant to assist the group with carrying out its roles and responsibilities and in preparing the final report. Although Working Group members possess specialized knowledge of county and state government and the tourism industry, collectively they lack background in tax policy and the skill set needed to develop methodologies, formulas, and calculations to determine an appropriate allocation of the TAT. The Working Group envisioned that the consultant would conduct research, attend meetings, and present reports, analyses, and information to the Working Group at its monthly meetings, in addition to assisting the Working Group with presentations and briefings to the 2016 Legislature on the Working Group’s TAT recommendations. On August 19, 2015, the Working Group engaged the services of a consultant, Belt Collins Hawaii LLC, to assist with compilation of references and resources, data analysis, development of allocation models integrating data on resident and tourist populations, use of major public facilities and infrastructure, and the cost of operations and expansion of infrastructure, especially facilities on which visitor satisfaction depends. Belt Collins would also assist with final report development, among other tasks.31 Belt Collins Hawaii LLC Team Key Personnel Belt Collins has been a Hawai‘i planning and engineering firm since 1953. Key personnel on the Belt Collins team managed the work flow, conducted fiscal analyses of net costs of infrastructure, and produced documents and slides with the assistance of Belt Collins graphics staff. These key personnel brought years of experience in tax policy development, economic analysis of tourism, project management, long-range planning, infrastructure development and growth, among other specialties, and included:
James Mak, Ph.D. Dr. Mak has been active in Hawai‘i state policy development and the economic analysis of tourism since the 1970s. He wrote 28 House Bill 1214, 2015 Regular Session. 29 Senate Bill 1359, 2015 Regular Session. 30 House Bill 1214, House Draft 1, Senate Draft 1, Conference Draft 1, 2015 Regular Session. 31 The consultant was procured via a request for proposals (RFP) with moneys appropriated by Act 134, SLH 2015.

1-12
the definitive account of tourism policy in Hawai‘i and has made pioneering studies of the transient accommodations tax. Joseph Toy, CPA. Mr. Toy’s experience combines research and hands-on experience. He has advised private clients, the Hawai‘i Tourism Authority, and State and county agencies on visitor industry issues and trends. With more than 30 years in management consulting and public accounting on an international basis, he is the President and CEO of Hospitality Advisors LLC, which is based in Honolulu, Hawai‘i. Cheryl Palesh, P.E. Ms. Palesh served as the Principal-in-Charge and has extensive project management experience. With a varied background working on engineering, master planning and environmental studies as well as design and construction projects, Ms. Palesh has an understanding of community infrastructure requirements, long-range planning, and the counties’ capital improvements programming. John Kirkpatrick, Ph.D. Dr. Kirkpatrick served as the Project Manager. Dr. Kirkpatrick has contributed to analyses of existing and new development in relation to transportation impact fees, and has worked with county agencies and developers to project demand from resident and visitors for infrastructure and public services. He has also addressed policy implications of transient visitor units on Maui, drawing on real property data and a resident survey.
Consultant’s Scope and Methodology The Belt Collins team provided a series of memos to help the Working Group in its deliberations. Dr. Mak brought principles for taxation to the Working Group’s attention, and provided current examples of State/county allocations in other jurisdictions. (His report is provided in Appendix C.) The team conducted working sessions on the impacts of different models over time, and provided forecasts of allocations in both a growth period and a recessionary one. Additional research helped refine the forecasts to incorporate both TAT and transient occupancy tax (timeshare) revenues in the analysis. The model analysis was revised to show various model alternatives for consideration by the Working Group. The Belt Collins team helped draft this report. Working Group Interim and Final Reports The Working Group’s interim report was delivered in December 2014 to the 2015 Legislature, governor, and each county mayor and council. This final report of the Working Group is being submitted to the 2016 Legislature, governor, and each county mayor and council, in December 2015 by the required deadline of 20 days prior to the convening of the 2016 regular session. It includes a summary of

1-13
Working Group discussions, analyses, and work undertaken by the Belt Collins team, as well as the Working Group’s conclusions, and recommendations. The Legislative Reference Bureau (LRB) assisted with drafting legislation, which is included in this report in a form suitable for introduction during the 2016 legislative session. The Working Group intends to meet during the 2016 legislative session in order to monitor and respond to legislative inquiries on the Working Group’s proposed legislation. The Working Group’s Chair, Associate Justice Simeon Acoba (retired), and the Office of the Auditor will testify in support of the proposed legislation on behalf of the Working Group. Other Working Group members may testify on the proposal either in each member’s capacity as a Working Group member or, alternatively, in each member’s capacity as a county or State official, or as a representative of the tourism industry. The Belt Collins team will be available for testimony and technical expertise. The Working Group looks forward to opportunities to explain its proposal to the Legislature’s committees in informational briefings, upon the Legislature’s request. The Working Group will cease to exist upon adjournment of the 2016 Regular Session, as directed by Act 174, SLH 2014.

This page intentionally left blank

2-1
Chapter 2
Introduction Over the years, the transient accommodations tax (TAT) has been the subject of considerable discussion and debate among policymakers regarding its effect as a significant revenue generator and funding source in the State. The economic downturn and slow periods of economic growth in recent years greatly lowered the amount of TAT and other tax revenues generated by the State, thus affecting the provision of government services to the community. Subsequently, the Legislature in 20091 increased the TAT and required that the additional revenues collected be deposited into the general fund. In 2011,2 the Legislature placed a temporary cap on the counties’ share of TAT revenues. In 2014, the Legislature introduced House Bill 1671 (later signed into law as Act 174, Session Laws of Hawai‘i [SLH] 2014), which removed the $93 million cap on TAT revenues allocated to the counties and establish the distribution of these revenues as a percentage of TAT collected.3 The purpose of the measure was to assist the counties financially so they could better support and enhance tourism and tourism-related services by ensuring that tax revenues derived from guest visits to the different islands of Hawai‘i would help offset the costs of providing services that guests use while visiting the islands.4 The Legislature recognized that much of the cost associated with tourism is carried by the counties, including the ever-increasing costs of providing county services to these visitors. Counties maintain roads and parks and provide law enforcement officers and first responders who serve residents and visitors.5 Further, counties have faced financial challenges in providing these county services since the cap on TAT revenues distributed to the counties was put in place in 2011.6 While county testimony “characterize[ed] the cap as having been ‘imposed’ on the counties,” the Legislature noted, “that in placing the $93 million cap into effect in 2011, the State 1 Act 61, SLH 2009. 2 Act 103, SLH 2011. 3 House Bill 1671, 2014 Regular Session. 4 Committees on Tourism and Public Safety, Intergovernmental and Military Affairs, Standing Committee Report No. 3063 on House Bill No. 1671, House Draft 1, Senate Draft 1, dated March 21, 2014, Regular Session of 2014, pp. 1–2. 5 Committees on Tourism and Public Safety, Intergovernmental and Military Affairs, Standing Committee Report No. 3063 on House Bill No. 1671, House Draft 1, Senate Draft 1, dated March 21, 2014, Regular Session of 2014, pp. 1–2. 6 Standing Committee Report No. 160-14, House Committee on Tourism, on House Bill No. 1671, House Draft 1, dated February 5, 2014, pp. 1–2.

2-2
effectively guaranteed the counties a historically high share of revenues.”7 The net effect of the cap, however, was to prevent the counties from sharing in the additional TAT revenues that accrued with the growth in tourism. After deliberation, the Legislature agreed that increasing the maximum amount of TAT revenues allocated to the counties would allow the counties to better provide for public safety, parks, road maintenance, and visitor-related services. However, it also believed that a study to determine the appropriate division of duties and responsibilities to provide public services should be conducted before permanently establishing TAT revenue allocations between the State and counties. In light of this belief, the measure was amended to change the amount of TAT revenues to be allocated to the counties to $103 million for fiscal years (FYs) 2015 and 2016, and $93 million for each fiscal year thereafter; to establish a working group to evaluate the division of duties and responsibilities between the State and counties relating to the provision of public services and to recommend the appropriate amount of TAT revenues to be allocated to the counties.8 Signed into law as Act 174, SLH 2014, the measure established and directed the work of the State-County Functions Working Group (Working Group). This Working Group final report addresses both objectives of the act: 1. Evaluate the division of duties and responsibilities between the State and counties relating to the provision of public services; and 2. Submit a recommendation to the Legislature on the appropriate allocation of TAT revenues between the State and counties that properly reflects the division of duties and responsibilities relating to the provision of public services. Evaluate the Division of Duties and Responsibilities Between the State and Counties Relating to the Provision of Public Services During the Working Group’s initial meetings in 2014, a broad array of foundational topics and issues related to its work on the division of duties and responsibilities between the State and counties was discussed. The Working Group researched and gained an in-depth understanding of the relevant legislative history and acts relating to TAT, including the TAT rate and distribution of TAT revenues. It also 7 Committees on Tourism and Public Safety, Intergovernmental and Military Affairs, Standing Committee Report No. 3063 on House Bill No. 1671, House Draft 1, Senate Draft 1, dated March 21, 2014, Regular Session of 2014, pp. 1–2. 8 Conference Committee Report No. 145-14 on House Bill No. 1671, House Draft 1, Senate Draft 1, Conference Draft 1, dated April 25, 2015, pp. 1–2.

2-3
sought to determine and understand what are public services, as referred to in Act 174, and the possible ways of measuring what these services are. Looking at various resources and guides to county and state government, the Working Group reviewed the division of public services as articulated in the Constitution of the State of Hawai‘i and the Revised Charter of Honolulu and Maui County, Kaua‘i County, and Hawai‘i County Charters. Related to this, the group sought to understand both the division of public services between the State and the counties, and such division with respect to tourism. It gathered county and State data and sought to apply different formulas, standards, and guidelines to the topics and issues. It assessed the desirability, rationality, and objectivity of formulas, standards, and guidelines. Ultimately, the Working Group agreed it would be reasonable to use the State and county comprehensive annual financial reports (CAFRs) as a starting point for discussion and analysis as CAFR categories reflect public services provided by government. The Working Group noted that there are some differences between State and county CAFR categories, but that such differences could be clarified and their corresponding expenditures normalized for comparison.9 The group also cautioned, however, that this work was not a scientific analysis, but intended to provide a general idea as to expenditures by county and State governments. Establishment and Assignment of Investigative Groups Pursuant to Sunshine Law At its March 4, 2015 meeting, the Working Group established investigative groups permitted under the sunshine law to identify the duties and responsibilities between the State and counties relating to public services and to identify visitor-related needs for State and county services. The investigative groups are: 1. County Duties and Responsibilities Investigative Group; 2. State Duties and Responsibilities Investigative Group; and 3. Visitor Industry Investigative Group.10 Five to six Working Group members were assigned to each investigative group. The County Duties and Responsibilities Investigative Group’s and the State Duties and Responsibilities Investigative Group’s scope of investigation was to develop (1) a common template for the counties and State to evaluate the duties and responsibilities, considering CAFR data; and (2) allocation(s) based on tourism factors, including population. The Visitor Industry Investigative Group’s scope of
9 For example, Maui includes public works in its highways and streets category. Kaua‘i reports transportation and bus service in public welfare. 10 Two additional investigative groups were established at later meetings.

2-4
investigation was to review and summarize visitor industry and other views on visitor-related needs for State and county services. Investigative group final reports were accepted by the Working Group. All investigate group final reports are summarized below and can be found in the appendices. State and Counties Comprehensive Annual Financial Report Expenditure Categories Reflect Public Services Provided The State and County Investigative Groups determined that the State and county CAFR categories related to public services and have some nexus to tourism, except for the State categories of interest expense, unemployment compensation, and nonmajor proprietary fund. Exhibit 2-1 lists the State and county CAFR expenditure categories.
Exhibit 2-1: County and State CAFR Expenditure Categories, FY2013 and FY2014
County CAFR Expenditure Categories State CAFR Expenditure Categories General government General government Public safety Public safety Public works Highways Highways and streets Conservation of natural resources Sanitation Health Human services Welfare Culture and recreation Lower education Public welfare Higher education Utilities/Transportation Other education Debt service Culture and recreation Miscellaneous Urban redevelopment and housing Net transfer Economic development and assistance Capital outlay Interest expense* Proprietary funds Airports Harbors Unemployment compensation* Nonmajor proprietary fund* * The State Duties and Responsibilities Investigate Group determined that there was no nexus to tourism for these categories. Source: Office of the Auditor based on County Duties and Responsibilities Investigative Group and State Duties and Responsibilities Investigative Group final reports

2-5
Some Working Group members noted limitations to reviewing expenditures alone and encouraged the group to review revenues. For example, county members noted that county revenues are related to tourism when they come from real property taxes, specifically those paid by hotels and resorts. However, the Department of Taxation Tax Research and Planning Officer, who had been invited to speak at the April 1, 2015, Working Group meeting, said that it would be difficult to earmark TAT revenues for public services that benefit tourists, even though there may be some nexus between tax revenue and tourism. He also noted that the 1988 Tax Review Commission Report stated that 53 percent of costs for tourism are paid by the counties.11 That report also addressed how tax responsibility and responsibilities for providing services should be divided between the State and counties, and provided a breakout as to how much of the public outlays that directly support tourism is from the counties and the State.12 Working Group Observations Based on Investigative Group Work General observations were made by the Working Group during presentations by investigative groups of their findings and final reports. These observations compare, contrast, and draw conclusions based on information provided by the three investigative groups formed to evaluate the division of duties and responsibilities between the State and counties. Total county and State expenditures on tourism far exceed revenue collected by the TAT. Overall, county expenditures on tourism compared to all county expenditures are generally much higher than State expenditures on tourism compared to all State expenditures (City and County of Honolulu, 5.77 percent; Maui, 10.62 percent; Hawai‘i, 7.99 percent; Kaua‘i, 19.06 percent; State, 4.4 percent). In fact, if the State’s welfare, lower education, and higher education categories are removed from the State’s list, the percentage of expenditures on visitors by the State and counties is roughly 53 percent to 47 percent. The allocation of tourism-related expenditures is not a precise number, however, and could be approximately closer to a 60/40 split, depending on the methodology used. The present allocation of $93 million of TAT revenues to the counties does not cover county total expenditures on visitors of almost $236 million. In fact, $93 million falls short of the City and County of Honolulu’s tourism-related expenditures of almost $116 million. The visitor industry is particularly important for Kaua‘i and Maui counties, where on any given day one in four persons is a visitor. Current allocation of TAT revenues among the counties is not tied to population, even though TAT legislative history reflects reliance on population. Rather, current distribution correlates roughly with visitor arrivals per county.
11 1988 Tax Review Commission Report, Advisory Commission on Intergovernmental Relations, p. 300, Hawai‘i Tax Review Commission (1988). 12 See id., p. 301, Table VIII.1 Public Services With Direct Benefits for Visitors, Fiscal Year 1987, Hawai‘i Tax Review Commission (1988).

2-6
County Working Group members seek retention of the current TAT distribution rate among the counties. Current allocation of TAT revenues among the counties (City and County of Honolulu, 44.10 percent; Maui, 22.80 percent; Hawai‘i, 18.60 percent; Kaua‘i, 14.50 percent) is almost the same as the individual county expenditures on visitors to all counties’ expenditures on visitors (City and County of Honolulu, 49.05 percent; Maui, 25.09 percent; Hawai‘i, 13.10 percent; Kaua‘i, 12.75 percent). Finally, most of Hawai‘i’s visitors are leisure travelers as compared to other destinations with a higher percentage of business travelers. The consensus among Working Group members is that general tourism marketing and promotion of Hawai‘i is a high priority. The visitor industry identified three priority categories of visitor-related needs for State and county services: (1) transportation and parks and recreation, including airports, highways and roads, public transportation, harbors, and state and county parks; (2) public safety and housing, including police presence and addressing homelessness; and (3) culture, education, sanitation, and individually advertised units. Investigative Group Report Summaries
County Duties and Responsibilities Investigative Group The County Duties and Responsibilities Investigative Group performed a line-item by line-item review of each county’s 2014 CAFR, identifying both total costs and those with a nexus to the visitor industry. CAFR category expenditures reflected the cost of public services provided by category. Each county normalized its CAFR reporting for consistency and to enable comparison, with some exceptions.13 To calculate the visitor allocation of each county CAFR category expenditure, each expenditure was multiplied by the degree of visitor nexus as determined by the county group as high, applying a factor of 1.00, moderate of 0.50, low of 0.25, or none of 0.00. Both County and State Duties and Responsibilities Investigative Groups applied the same methodology for determining the visitor allocation on expenditures based on nexus, but carried out their work and analyses separately in their respective groups. The county investigative group also relied on the 2013 Hawai‘i Tourism Authority (HTA) visitor-day data14 and 2013 Department of Business, Economic Development and Tourism (DBEDT) resident data15 to determine the ratio of visitors to residents, 13 For example, Maui County includes public works in its highways and streets category; thus, Maui did not report in the public works category. On Kaua‘i, the public welfare category includes transportation and bus service; thus, Kaua‘i did not report in the utilities/transportation category. See Appendix C for details of each county’s normalized CAFR values. 14 By dividing the total visitor days on each county by 365, the investigative group converted visitor days to a de-facto resident population: City and County of Honolulu (96,054 visitors), Maui County (54.233), Hawai‘i County (29,255), and Kaua‘i County(23,334). 15 City and County of Honolulu (983,429 residents), Maui County (160,292), Hawai‘i County (190,821), and Kaua‘i County (69,512).

2-7
visitor expenditures to total expenditures, and visitor expenditures statewide, among other analyses. Exhibit 2-2 shows FY2014 total expenditures, visitor expenditures, and FY2013 visitor to resident ratio, by county. Exhibit 2-2: County Total Expenditures and Expenditures on Visitors (FY2014) and
Visitor to Resident Ratio (FY2013)
County Total Expenditures
Expenditures on Visitors
Visitor to Resident (%) City and County of Honolulu $ 2,004,574,421 $ 115,670,580 8.90 Maui County $ 557,071,759 $ 59,170,783 25.28 Hawai‘i County $ 386,564,579 $ 30,888,669 13.29 Kaua‘i County $ 157,769,811 $ 30,076,408 25.13
Total $ 3,105,980,570 $ 235,806,440 12.63 Source: County Duties and Responsibilities Investigative Group’s final report (Appendix C) The county investigative group reported on five major areas: 1. County expenditures on visitors to total operating expenditures; 2. Individual county expenditures to aggregate expenditures of all counties; 3. Individual county expenditures on visitors to total county expenditures statewide on visitors; 4. Percentage of total county TAT allocation; and 5. Percentage of each county’s portion of total TAT after allocations for debt service and HTA. The county investigative group’s report is in Appendix C.16 The report provides dollar amounts and other data used in calculating reported percentages.
County expenditures on visitors to total operating expenditures. Each county determined its total operating expenditures for visitors, not including capital improvement projects and divided it by the total operating expenditures for each county, as shown in Exhibit 2-3. Overall, the exhibit highlights how important the visitor industry is for Maui and Kaua‘i counties by showing the amount of expenditures allocated to the industry, as compared with the City and County of Honolulu and Hawai‘i County. 16 Additional information and Working Group discussion can be found in the April 1, May 6, and June 3, 2015 meeting minutes. Available at http://auditor.hawaii.gov/task-forceworking-group/.

2-8
Exhibit 2-3: County Expenditures on Visitors as a Share of Total County Operating Expenditures, FY2014
County County Expenditures on
Visitors as a Share of Total Operating Expenditures (%) City and County of Honolulu 5.77 Maui County 10.62 Hawai‘i County 7.99 Kaua‘i County 19.06 All Counties combined 7.59 Source: County Duties and Responsibilities Investigative Group’s final report
Individual county expenditures to aggregate expenditures of all counties. Each county determined its total operating expenditures, divided by total operating expenditures of all four counties, as shown in Exhibit 2-4. Exhibit 2-4: Each County’s Expenditures to All County
Expenditures, FY2014
County County Expenditures to All Counties’ Expenditures (%) City and County of Honolulu 64.54 Maui County 17.94 Hawai‘i County 12.45 Kaua‘i County 5.08
Total 100.00 Source: County Duties and Responsibilities Investigative Group’s final report Individual county expenditures on visitors to the total county expenditures statewide on visitors. Total operating expenditures for visitors in each county were divided by the operating expenditures for total visitors for all four counties, as shown in Exhibit 2-5.

2-9
Exhibit 2-5: County Expenditures on Visitors in Relation to Total County Expenditures Statewide on
Visitors, FY2014
County
County Expenditures on Visitors to Total County
Expenditures Statewide on Visitors (%) City and County of Honolulu 49.05 Maui County 25.09 Hawai‘i County 13.10 Kaua‘i County 12.75
Total 100.00 Source: County Duties and Responsibilities Investigative Group’s final report Percentage of total County TAT allocation. Exhibit 2-6 reflects the FY2014 allocation rate among the counties:
Exhibit 2-6: County TAT Allocations, FY2014
County County TAT Allocation to All
Counties’ TAT Allocations (%) City and County of Honolulu 44.10 Maui County 22.80 Hawai‘i County 18.60 Kaua‘i County 14.50
Total 100.00 Source: County Duties and Responsibilities Investigative Group’s final report Percentage of each County’s portion of total TAT. Exhibit 2-7 shows each county’s portion of the total TAT after allocations to the Convention Center Enterprise Special Fund and Tourism Special Fund (TSF) for HTA.

2-10
Exhibit 2-7: County Shares of Total TAT After Allocations for Legislative Appropriations, FY2014
County County’s Share of Total TAT After Debt Service and HTA
Allocations (%) City and County of Honolulu 19.76 Maui County 10.21 Hawai‘i County 8.33 Kaua‘i County 6.50 Total 44.80 Source: County Duties and Responsibilities Investigative Group’s final report The County Investigative Group also observed that the existing TAT allocation distribution among the counties is very similar to the percentage of each county’s expenditures on visitors to the aggregate counties’ expenditures on visitors, as shown in Exhibit 2-8.
Exhibit 2-8: TAT Allocations Among Counties and County Expenditures on Visitors to Total County Expenditures Statewide on Visitors, FY2014
County TAT Allocations Among Counties (%)
County Expenditures on Visitors to Total County Expenditures Statewide
on Visitors (%) City and County of Honolulu 44.10 49.05 Maui County 22.80 25.09 Hawai‘i County 18.60 13.10 Kaua‘i County 14.50 12.75 Total 100.00 100.00 Source: County Duties and Responsibilities Investigative Group’s final report Finally, the Working Group observed that the current $93 million of TAT allocations to the counties falls short of funding needed for all counties’ expenditures on visitors as shown in Exhibit 2-9; in fact, $93 million does not cover the City and County of Honolulu’s expenditures on visitors. However, the county group pointed

2-11
out that the counties also generate revenues through real property taxes, including those levied on hotels and resorts. Exhibit 2-9: County Expenditures on Visitors and TAT Allocations to
Counties, FY2014 (in millions)
County County Expenditures on Visitors TAT Allocations City and County of Honolulu $116 $41.01 Maui County $59 $21.20 Hawai‘i County $31 $17.30 Kaua‘i County $30 $13.49
Total $236 $93.00 Source: County Duties and Responsibilities Investigative Group’s final report State Duties and Responsibilities Investigative Group The State Duties and Responsibilities Investigative Group performed a review of the State’s 2014 CAFR. The State analysis dealt with functional categories (not the more specific line items used by the County Investigative Group). Utilizing much the same methodology as the county group, the State group identified both total costs and those with a nexus to the visitor industry. To calculate the visitor allocation of the CAFR expenditure, the expenditure was multiplied by the degree of visitor nexus, as determined by the State group as high and applying a factor of 1.00, moderate of 0.50, low of 0.25, or none of 0.00. Exhibit 2-10 shows FY2014 total State expenditures and visitor expenditures. For the State group’s final report, see Appendix D.17
Exhibit 2-10: Expenditures on Visitors to State Total Expenditures, FY2014 (in thousands)
Total Expenditures
Expenditures on Visitors
Expenditures on Visitors to Total Expenditures
(%) State of Hawai‘i $10,302,377 $453,152 4.4 Source: State Duties and Responsibilities Investigative Group final report (Appendix D) 17 Additional information and Working Group discussion can be found in the April 1, May 6, and June 3, 2015 meeting minutes. Available http://auditor.hawaii.gov/task-forceworking-group/.

2-12
The State group raised three questions for the State-County Functions Working Group to address when determining TAT allocations: 1. Act 61 (SLH 2009) increased the TAT rate by 2 percent—from 7.25 percent to 9.25 percent—and required all additional revenues collected to be deposited to the State general fund. Question: Should the additional 2 percent in TAT revenues be excluded from the Working Group’s shtatudy and analysis and allocation recommendations? 2. The TAT allocation can be based on tourism-related services or general government services provided. Question: Should the Working Group’s final report provide information on both allocation methods—tourism-related and general government services provided—so the Legislature has information to make an informed decision? 3. Question: Should TAT allocations be based on expenditures or on both expenditures and revenues related to visitors? The Working Group discussed but did not reach final decision or consensus on these three issues at its May 6, 2015, meeting. Instead, it deferred the issues, agreeing to consider them later as part of its allocation deliberations.18
Visitor Industry Investigative Group The Visitor Industry Investigative Group members reached out to each member’s contacts with a common and open-ended request to identify priority visitor-related needs for State and county services. Contact groups included Outrigger Enterprises employees at 31 properties on four islands; members and others on the mailing lists of the Hawai‘i Lodging and Tourism Association and the Waikiki Improvement Association; HTA and other organizations focused on the tourist industry; and visitor industry retail and other partners, among others. Outreach was conducted online and through surveys on the neighbor islands. Members reviewed the outreach results and compared them against each member’s own anecdotal information and overall view of the visitor industry. Finally, members agreed on an overall summary of the results organized generally according to State and county CAFR expense categories. In general, visitor industry and other views on visitor-related needs for State and county services break down into three priority categories: 18 While no formal decisions were taken on these questions, they were raised again in evaluating various allocation models, and the Working Group’s selection of an allocation model incorporated its members’ shared views on these topics.
2-13
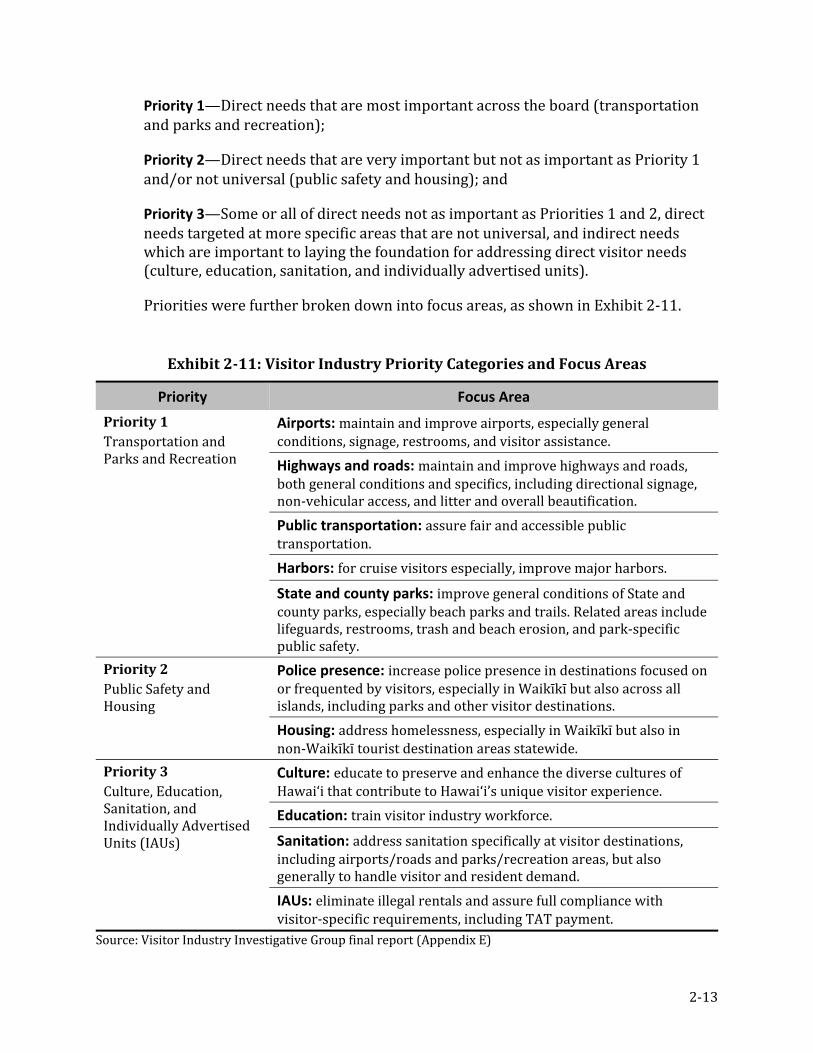
Priority 1—Direct needs that are most important across the board (transportation and parks and recreation); Priority 2—Direct needs that are very important but not as important as Priority 1 and/or not universal (public safety and housing); and Priority 3—Some or all of direct needs not as important as Priorities 1 and 2, direct needs targeted at more specific areas that are not universal, and indirect needs which are important to laying the foundation for addressing direct visitor needs (culture, education, sanitation, and individually advertised units). Priorities were further broken down into focus areas, as shown in Exhibit 2-11.
Exhibit 2-11: Visitor Industry Priority Categories and Focus Areas
Priority Focus Area Priority 1 Transportation and Parks and Recreation Airports: maintain and improve airports, especially general conditions, signage, restrooms, and visitor assistance.
Highways and roads: maintain and improve highways and roads, both general conditions and specifics, including directional signage, non-vehicular access, and litter and overall beautification. Public transportation: assure fair and accessible public transportation. Harbors: for cruise visitors especially, improve major harbors. State and county parks: improve general conditions of State and county parks, especially beach parks and trails. Related areas include lifeguards, restrooms, trash and beach erosion, and park-specific public safety.
Priority 2 Public Safety and Housing Police presence: increase police presence in destinations focused on or frequented by visitors, especially in Waikīkī but also across all islands, including parks and other visitor destinations. Housing: address homelessness, especially in Waikīkī but also in non-Waikīkī tourist destination areas statewide.
Priority 3 Culture, Education, Sanitation, and Individually Advertised Units (IAUs) Culture: educate to preserve and enhance the diverse cultures of Hawai‘i that contribute to Hawai‘i’s unique visitor experience. Education: train visitor industry workforce. Sanitation: address sanitation specifically at visitor destinations, including airports/roads and parks/recreation areas, but also generally to handle visitor and resident demand. IAUs: eliminate illegal rentals and assure full compliance with visitor-specific requirements, including TAT payment. Source: Visitor Industry Investigative Group final report (Appendix E)
2-14
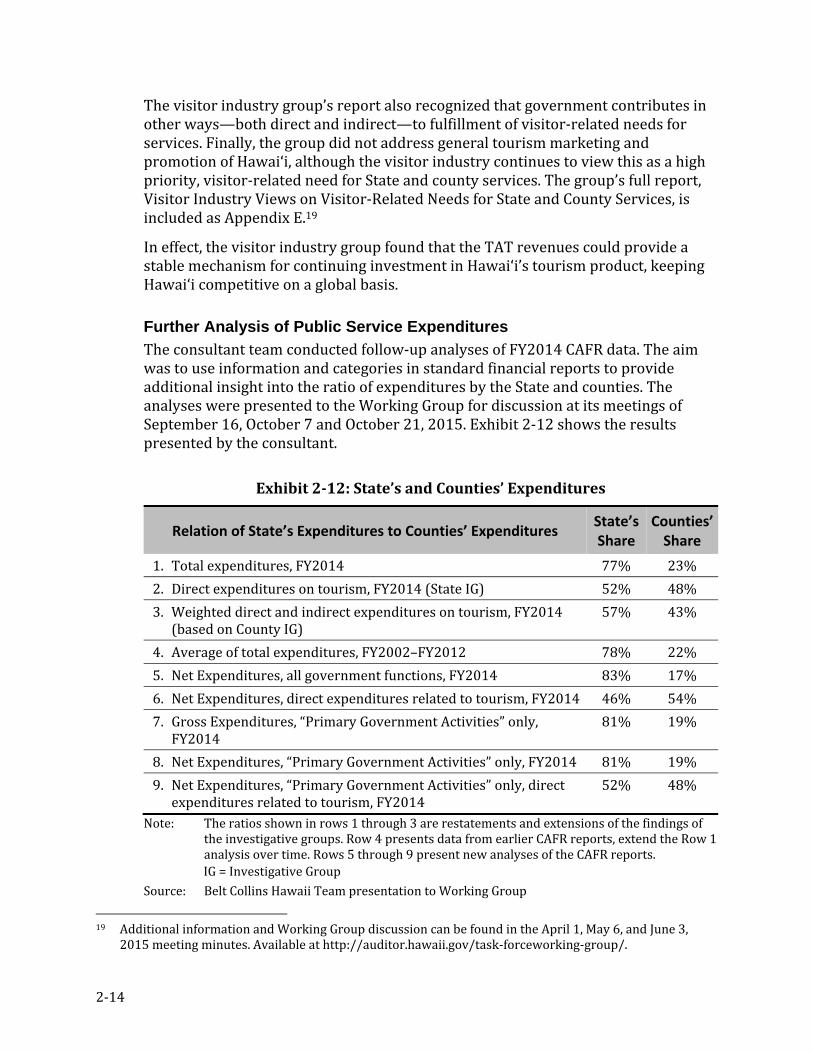
The visitor industry group’s report also recognized that government contributes in other ways—both direct and indirect—to fulfillment of visitor-related needs for services. Finally, the group did not address general tourism marketing and promotion of Hawai‘i, although the visitor industry continues to view this as a high priority, visitor-related need for State and county services. The group’s full report, Visitor Industry Views on Visitor-Related Needs for State and County Services, is included as Appendix E.19 In effect, the visitor industry group found that the TAT revenues could provide a stable mechanism for continuing investment in Hawai‘i’s tourism product, keeping Hawai‘i competitive on a global basis. Further Analysis of Public Service Expenditures The consultant team conducted follow-up analyses of FY2014 CAFR data. The aim was to use information and categories in standard financial reports to provide additional insight into the ratio of expenditures by the State and counties. The analyses were presented to the Working Group for discussion at its meetings of September 16, October 7 and October 21, 2015. Exhibit 2-12 shows the results presented by the consultant.
Exhibit 2-12: State’s and Counties’ Expenditures
Relation of State’s Expenditures to Counties’ Expenditures State’s Share
Counties’ Share 1. Total expenditures, FY2014 77% 23% 2. Direct expenditures on tourism, FY2014 (State IG) 52% 48% 3. Weighted direct and indirect expenditures on tourism, FY2014 (based on County IG) 57% 43% 4. Average of total expenditures, FY2002–FY2012 78% 22% 5. Net Expenditures, all government functions, FY2014 83% 17% 6. Net Expenditures, direct expenditures related to tourism, FY2014 46% 54% 7. Gross Expenditures, “Primary Government Activities” only, FY2014 81% 19% 8. Net Expenditures, “Primary Government Activities” only, FY2014 81% 19% 9. Net Expenditures, “Primary Government Activities” only, direct expenditures related to tourism, FY2014 52% 48%
Note: The ratios shown in rows 1 through 3 are restatements and extensions of the findings of the investigative groups. Row 4 presents data from earlier CAFR reports, extend the Row 1 analysis over time. Rows 5 through 9 present new analyses of the CAFR reports. IG = Investigative Group Source: Belt Collins Hawaii Team presentation to Working Group 19 Additional information and Working Group discussion can be found in the April 1, May 6, and June 3, 2015 meeting minutes. Available at http://auditor.hawaii.gov/task-forceworking-group/.

2-15
The analysis draws on CAFR tables prepared by the State and counties for FY2014.20 Those tables group activities of each jurisdiction into three areas: • Primary government: This grouping covers general government plus many services (including public safety, highways, education, welfare and human services, conservation of natural resources, sanitation, and interest on long-term debt). • Business-type activities: Each jurisdiction includes somewhat different activitites under this heading, depending on its administrative structure. State business-type activities include airports, harbors, unemployment compensation and nonmajor proprietary funds. The City and County of Honolulu considers housing, sewer, solid waste and public transportation to be business-type activities. Maui County lists housing, the municipal golf course, and the Department of Water Supply as business-type activities. Hawai‘i County includes health, education, and welfare in this grouping, while Kaua‘i County includes housing, sewer, and golf. • Component units: These are semi-autonomous agencies. For the State, component units include the University of Hawai‘i, the Hawai‘i Housing Finance and Development Corporation, the Hawai‘i Public Housing Authority, the Hawai‘i Health Systems Corporation, HTA, the Hawai‘i Community Development Authority, and the Hawai‘i Hurricane Relief Fund. County component units include water (for all counties except Maui) and the Honolulu Authority for Rapid Transportation.21 The CAFR reports include columns of program expenses for functional categories (e.g., highways, health), followed by tallies of program revenues. The net expenditures are expenses minus revenues, as shown in the CAFR reports. (The reports tabulate net amounts as net revenues (expenses); since the Working Group’s concern is with expenditures, the expenses are shown as positive numbers in Appendix F, and net revenues as negative.) The net expenditure analyses shown in rows 5, 6, 8, and 9 of Exhibit 2-12 draw on the net revenues (expenses) columns of the CAFR tables. Again, the “Primary Government Activities” in rows 7 to 9 of that exhibit are from the reports. The sorting of some functional categories as “direct” expenditures related to tourism follows the division of functional categories presented by the State Duties and Responsibilities Investigative Group (in Appendix D).
20 State CAFR for FY2014, page 32; Honolulu CAFR, pp. 36-37, Maui CAFR, p. 40, Hawai‘i County CAFR, p. 26, and Kaua‘i CAR, p. 30. 21 In Appendix F, the Maui Department of Water Supply is treated as a component unit, to be comparable with the other counties.

2-16
While the investigative groups analyzed some government expenditures as indirectly related to tourism, the consultant team found the methodologies of those groups to vary, so that a third-party analysis comparing State and county indirect expenditures would involve developing a definitive methodology. The consultant team did not find that task possible in the time available. The consultant team did not find that any single analysis provides a definitive account of the public service expenditures of the State and counties. The Working Group reviewed a range of indices. The Allocation Models Investigative Group considered a 60/40 division between the State and counties as a reasonable approximation for use in one model. After reviewing the Investigative Group reports and the consultant’s analyses (in Appendix F), the Working Group derived a judgment-based evaluation that a 55/45 division appropriately represented the division of duties and responsibilities between the State and counties. Public Testimony on Allocations Testimony was provided by Jim Howe (Ocean Safety Division, Department of Emergency Management, City and County of Honolulu), Margaret Wille (Member, Hawai‘i County Council) and Mike White (Chair, Maui County Council) as private citizens.22
• Mr. Howe emphasized the importance of ocean safety for visitors and residents. He noted that the funds available for lifeguards and emergency medical services left many beaches in Hawai‘i without much-needed ocean safety services. • Ms. Wille pointed to the historical distribution, whereby the counties received 44.8 percent of TAT collections until 2008. She understood legislators to promise to reinstate the 44.8 percent share as soon as economic conditions improved. • Mr. White presented comparative data on lodging taxes in various United States jurisdictions, drawing on the 2014 HVS Lodging Tax Report, showing that the average share of lodging revenues going to local governments was 9.08 percent (versus 2.26 percent to Hawai‘i counties). He argued that the cost of services such as police and fire protection has increased far more than TAT revenues to Maui County have. Mr. White argued that allocation of 50 percent of TAT revenues to the counties would be justified. The result would still be a smaller share of lodging costs than the share accruing to the average local government in the report’s national sample.
22 See Working Group minutes for April 1, May 6, July 1, August 5, October 7 and October 21, 2015. Available at http://auditor.hawaii.gov/task-forceworking-group/

3-1
Chapter 3
Submit a Recommendation to the Legislature on the Appropriate Allocation of Transient Accommodations Tax Revenues The second objective of the Working Group was to submit a recommendation to the Legislature on the appropriate allocation of transient accommodations tax (TAT) revenues between the State and counties that properly reflects the division of duties and responsibilities relating to the provision of public services. The Working Group reached its recommendation through input from an investigative group, presentation of forecasts, scenarios and models by the consultant team, and group discussion of models, along with principles for forecasting and allocation. Allocation Models Investigative Group At the May 6, 2015 meeting, the Working Group established the Allocation Models Investigative Group to consider various models for allocating the TAT revenues. The five-member group was asked to identify a range of models, assess the advantages and disadvantages of different models, and contribute to the discussion of models. The investigative group met and developed a report on progress to date, shared with the Working Group at the June 3, 2015 meeting. The investigative group’s findings were presented as a basis for considering allocation issues, not as the only recommendation its members would consider. The Allocation Models Investigative Group suggested that the group would work with the consultant on developing and further refining models. Appendix G is the investigative group’s report. The investigative group reported on four procedures for allocation: 1. Allot TAT funds according to the proportionate share of tourism expenses incurred by the State and counties; 2. Allot TAT funds according to the historical intent of TAT legislation passed over the years; 3. Use the current allocations as a guide, and account for the political reality that the State Legislature will seek to fund other programs with TAT revenues; and 4. Instead of developing allocation models, the Legislature could grant the counties, as well as the State, authority to tax visitors.

3-2
The investigative group identified parameters for an allocation model that it recommended to the Working Group for further discussion: 1. Allocate the first $82 million of TAT revenues to the Hawai‘i Tourism Authority (HTA). This first-priority allocation would give the visitor industry assurance that its taxes go to a body over which it has some control. This would assure predictability for budgeting of tourism marketing and other HTA activities. 2. Allocate 90 percent of the remaining revenues to be split between the State and counties, with 60 percent of that amount going to the State and 40 percent to the counties, but in either case, the amount would be no less than $100 million. The 60/40 division emerged from discussions of State and county expenditures related to tourism; it was proposed as a point of convergence for the various expenditure analyses considered to date. 3. Leave the remaining funds for the Legislature’s discretion, with the recommendation that these funds be allocated for visitor-related expenditures. Should the TAT revenues amount only to $282 million in a given year, the allocation would then be $82 million for HTA, and $100 million each for the State and counties. No funds would then remain for discretionary spending. Should the total be even smaller, the allocation for HTA would not change, and the remaining funds would still be divided on a 60/40 basis between the State and counties. (The TAT total would have exceeded $282 million as of 2011, given the current 9.25 percent collection rate.) Consideration of Models in Relation to Potential TAT Revenues, to 2025
Scenarios Prepared for Review by the Working Group In order for the Working Group to consider the implications of allocation models over several years, the consultant team developed scenarios of annual TAT revenues under different economic conditions. In discussions with the Working Group, a ten-year horizon was identified as useful. Potential annual TAT revenues were estimated for fiscal years (FYs) 2016 through 2025.1 1 Dr. Mak notes that these estimates are properly termed simulations, not forecasts. Tests of models under different economic conditions, rather than predictions, are at issue. In this report, the term “forecast” is retained for the analysis derived from the Hospitality Advisors LLC account of the visitor industry, while the recessionary estimate is termed a “scenario.”

3-3
• A growth forecast was developed to take into consideration the current level of combined TAT and transient occupancy tax (TOT) revenues, the range of accommodations and lodging prices, and anticipated changes to the visitor plant inventory.2 The forecast builds on the information collected by Hospitality Advisors LLC (HA) and Smith Travel Research.3 It yields estimates of TAT revenues from hotels, condominiums, individual visitor units and timeshare units, as well as TOT revenues from timeshare properties. The growth forecast was viewed by some members of the Working Group as aggressive. However, it combines the effect of changes in room rates, occupancy, and the overall visitor plant, not just revenues from existing properties. Also, the forecast revenues increase on average by 4.9 percent annually over ten years, while the historical tax base increased by much the same amount from 2005 to 2015, and by 4.6 percent on average annually from 2000 through 2015. • A recession scenario was developed using the historical changes in the estimated TAT tax base over the period 2005–2015. (Changes in the tax base are independent of the specific TAT rate in any given year.) The scenario starts from the actual FY2015 revenues, then the TAT revenues are assumed to change by the same annual rates of change as in the historical period. This procedure created a “what if” model of the impact of a recession on TAT allocations. The changes in the historical tax base are shown in Exhibit 3-1.
2 State Department of Taxation reports deal with the combined TAT/TOT revenues, rather than two distinct revenue streams. References to the TAT tax base and to revenue scenarios similarly deal with the combined revenues. 3 The HA/Smith Travel Research information combines data on rates and occupancy collected at weekly intervals with information collected on a calendar-year basis. For this report, HA developed estimates of TAT revenues from the types of property included in its surveys, along with the timeshare occupancy that leads to TOT revenue—an item not included in the surveys. Forecasts of average daily rates and occupancy were based on HA’s knowledge of the market and in-house information rather than a new market survey. The forecast of revenues was next converted to fiscal years. The forecast is meant to provide a basis for policy consideration, rather than budgeting.

3-4
Exhibit 3-1: Changes in the Historical TAT Tax Base, 2000 to 2015
Note: Annual tax base is in millions of current dollars. Source: Adapted from J. Mak, Sharing TAT Revenues in Hawai‘i: A Background Paper (2015), included in this report as Appendix B The annual TAT/TOT revenues under the two scenarios are shown in Exhibit 3-2.4 Future revenues are calculated in current dollars (dollars gathered in future years), rather than being stated as constant dollars (future revenues computed in values equivalent to dollars at a given past time, such as 2000 dollars). The scenarios deal with statewide revenue collections. As members of the Working Group noted, conditions could be much more extreme, especially in a recession, for particular areas or islands. 4 Scenario amounts and rates of change in this report differ slightly from ones considered during Working Group meetings. First, the HA forecast was presented in draft form, with the aim of refining it in light of information from the Department of Taxation. However, the department was not able to provide data requested on TOT, as distinct from, TAT collections, so this information was inferred. Next, the annual rates of change in the recessionary scenario were revised to reflect current, not constant, values in the historical tax base. Also, the historical period used to generate the recessionary scenario was changed from 2004–2014 to 2005–2015.
$0
$500
$1,000
$1,500
$2,000
$2,500
$3,000
$3,500
$4,000
$4,500
$5,000M
illio
ns ($
)
TAT Tax Base
Annual Change in Tax Base

3-5
Exhibit 3-2: Potential Statewide Annual TAT/TOT Collections, FY2015–FY2025
Fiscal Year TAT Revenues ($ millions) Annual Change
HA Forecast
Recession Scenario
HA Forecast
Recession Scenario 2015 $ 421 $ 421 — — 2016 $ 450 $ 460 6.8% 9.2% 2017 $ 474 $ 476 5.4% 3.6% 2018 $ 497 $ 486 4.9% 2.0% 2019 $ 520 $ 417 4.6% -14.2% 2020 $ 543 $ 393 4.5% -5.6% 2021 $ 568 $ 472 4.5% 20.0% 2022 $ 592 $ 538 4.2% 13.8% 2023 $ 623 $ 612 5.2% 13.8% 2024 $ 649 $ 656 4.3% 7.2% 2025 $ 678 $ 699 4.4% 6.5%
TOTAL 2016–2015 $ 5,594 $ 5,208 — — Source: Belt Collins Hawaii LLC To consider the potential impacts of inflation over the forecast period, changes in the Consumer Price Index for Urban Consumers (CPI-U) in Honolulu were extrapolated from the “Outlook for the Economy” forecast provided by the State Department of Business, Economic Development and Tourism (DBEDT).5 That forecast extends only a few years into the future. For the remainder of the forecast period, the annual change in CPI-U was held to continue as a 2.7 percent increase per annum. The same CPI-U assumptions were used with the growth and recession scenarios. Members of the Working Group noted that rates of inflation change in different economic conditions, and the current assumptions are part of a growth forecast. The point was recognized, but no basis for alternative inflation assumptions was evident. 5 “Outlook on the Economy” in the Quarterly Statistical and Economic Report for the Third Quarter 2015, issued in August 2015. Available at http://dbedt.hawaii.gov/economic/qser/.

3-6
Alternative scenarios considered but not used for evaluation in this report included: • The State’s long term forecast for overall economic growth and for visitor spending.6 This forecast is provided in constant dollars, and avoids consideration of inflation. Furthermore, it estimates total visitor spending, not spending on accommodations alone. Accordingly, it is too general for use in the current study. • The federal guidance for assessing the value of future spending in light of anticipated changes in the value of Treasury bills. This guidance is presented for both current and constant dollars, so the difference between the anticipated value of Treasury bills (in current or “nominal” dollars) and the “real” value in constant dollars provides an estimate of inflation over the period of study. The most recent version of the guidance, issued in December 2014 for use in 2015, anticipates even lower average annual inflation than the estimates used for this study.7 • In presentations to the Working Group, versions of the recession scenario based on the historical tax base in constant year 2000 dollars were considered. This approach combined the impacts of the recessionary period with an assumption that lodging revenues would not increase with inflation. This could be considered an extreme stress test. The Working Group discussed additional factors that could affect the visitor industry and TAT revenues in the coming years. These are described below, after considering the Working Group’s recommendations.
Models Considered by the Working Group The consultant team compiled a list of models discussed by the Working Group, to which it added variants responsive to members’ requests to review allocations with fixed numbers (from year to year) and ones changing with inflation. The models can be summarized and arranged in terms of their complexity. The models and their variants are provided in Appendix H. 6 DBEDT, Population and Economic Projections for the State of Hawai‘i to 2040. March 2012. http://dbedt.hawaii.gov/economic/economic-forecast/2040-long-range-forecast/ 7 The current federal guidance allows for inflation below two percent per year for periods up to 30 years. Office of Management and Budget, Circular A-94, Appendix C: discount rates for cost-effectiveness, lease
purchase, and related analyses. Revised version issued in December 2014. https://www.whitehouse.gov/omb/circulars_a094/a94_appx-c.

3-7
1. Simple Shares Model, TAT revenues divided into three shares 20% Tourism Special Fund (TSF) 32% Counties 48% State of Hawai‘i All shares would grow or contract along with revenues. Existing legislative appropriations other than the TSF would come from the State share. This allocation incorporates the 60/40 ratio that members of the Working Group found reasonable as a basic division between the State and counties, since the ratio of State and counties shares in the model—48 percent to 32 percent—is also a 3:2 ratio. 2. Simple Shares Model, alternative shares 20% TSF 35% Counties 45% State of Hawai‘i This allocation was developed by the consultant as a simple alternative without any further discussion of the appropriate ratio of State to county allocations. 3. Shares Model, with TSF protected against downturns 1. TSF amount set by Legislature ($82 million for FY2015, per Act 121, SLH 2015). 2. Remainder split by State and counties on a 60/40 basis. Two versions of this model were considered: (1) the TSF amount was a fixed amount through 2025; (2) the TSF amount changing over time with anticipated annual inflation. 4. Shares Model, with existing special funds increasing with inflation 1. Special funds protected (with FY2015 amounts shown): $82.0 million TSF, starting at $82 million and changing with inflation $26.5 million Convention Center Enterprise Special Fund $1.5 million Turtle Bay Conservation Easement Special Fund $3.0 million Special Land Development Fund (DLNR) $113.0 million in FY2015 DLNR = Hawaii Department of Business, Economic Development and Tourism

3-8
2. Shares of remainder of TAT funds 40% Counties 60% State of Hawai‘i At the October 7, 2015 meeting, a version of this model with all special funds indexed to inflation was considered. For the October 21, 2015 meeting, the Working Group considered versions without indexing, and with indexing of the TSF and the DLNR Special Land Development Fund. (The remaining special funds were viewed as set obligations of the State, not changing from year to year.) 5. Current Distribution 1. Legislative appropriations: $1.5 million Turtle Bay Conservation Easement Special Fund $26.5 million Convention Center Enterprise Special Fund $82.0 million TSF (with some $1.4 million directed to specific ends) 2. Counties: $103 million for FY2015, FY2016; $93 million for later years. 3. Remainder to State, with $3 million allocated to Special Land Development Fund. 6. “Historic Intent” Model devised by Allocation Models Investigative
Group This model was developed to follow the allocations made at various times by the Legislature. 8 1. Assuming the TAT rate is 9.25 percent, allot the first 5 percent of TAT collections (i.e., 54.054 percent of total revenues) as follows: 95% to the counties 5% to the State (administration) 2. Take the next 2.25 percent (24.324 percent of revenues) and allocate it to amortization of Convention Center and to HTA. 8 The Allocation Model Investigative Group memo, dated May 29, 2015, identified shares of 5%, 2.5% and 2%—totaling 9.5 percent, not the 9.25 percent rate of the TAT. The second share has been revised here to match the sequence of increases in the TAT over time.

3-9
3. Allocate remaining 2 percent (21.622 percent of revenues) to the State. 7. Three-Stage Model Presented by Allocation Models Investigative
Group 1. Guaranteed to TSF: $82 million; 2. 90 percent of remainder divided 60/40 for State and counties, of which $100 million each would be guaranteed for the State and the counties; and 3. 10 percent of remainder reserved for legislative discretion, with recommendation that funds spent on visitor-related expenditures. Existing appropriations for the Convention Center Enterprise Special Fund, the Turtle Bay Special Fund and the Special Land Development Fund would be allocated from the State’s Stage 2 share (i.e., the 60 percent of 90 percent above). Should TAT revenues available to be divided 60/40 in Stage 2 amount to less than amount needed to cover anticipated needs of the State and counties, the difference would be made up from (a) the legislative discretionary Stage 3. And, if necessary, the State’s and counties’ Stage 2 amounts (with the 60/40 share perpetuated between them). Indexing of the TSF share and of the floors for the State and counties was considered but not used in the Allocation Models Investigative Group’s original version of this model. 8. Three-Stage Model Variant 1. Guaranteed to TSF: $82 million plus growth with inflation. 2. 90 percent of remainder divided 60/40 for State and counties respectively, of which $100 million each would be guaranteed (i.e., the State share or the counties’ share would not drop below $100 million). 3. 10 percent of remainder for legislative appropriations, to include set-asides for Turtle Bay, Convention Center, Special Land Development Fund, and the remainder for legislative appropriations as of 2015 or later. If the 10 percent is not enough to cover the existing legislative appropriations, the State and counties would cover these from their Stage 2 moneys.

3-10
This model was considered in versions with no indexing, with the TSF amount indexed, and with both the TSF and the minima for the State and counties indexed. 9. “Lessons Learned” Model 1. Baseline distributions (set amounts for FY2015, changing over time with inflation): $82 million TSF $103 million Counties $103 million State a. If TAT revenues exceed 120 percent of the Stage 1 baseline distributions, distribute next 20 percent in much the same proportions: 28.50% TSF 35.75% Counties 35.75% State b. If TAT revenues do not exceed 120 percent of the Stage 1 baseline, all of this increment goes to State. This model was developed by the consultant in an attempt (a) to insure predictability, even in recessionary economic circumstances and (b) to use baseline figures derived from the current allocation. The Working Group viewed it as too cumbersome to consider further. Implications of the Models Under Growth and Recession Scenarios At the October 7 and October 21, 2015 meetings, the Working Group reviewed allocations based on the above models, combined with growth and recession scenarios. At the October 7, 2015 meeting, the consultant team introduced the possibility that some amounts or floors would be indexed to vary annually with changes in the cost of goods. At both meetings, members of the Working Group suggested alternative shares for consideration. The set of models selected for the October 21, 2015 meeting is in Appendix H.9 This appendix incorporates refinements in the scenarios that were completed after that date; the scenario values and allocations are not quite the same as the ones debated at the meeting. A key difference is that the allocations for FY2015 and FY2016 are now shown as set by Acts 174 (SLH 2014), Act 117 (SLH 2015), and Act 121 (SLH
9 The model discussed on October 21, 2015 is available as part of the handout for that meeting, http://files.hawaii.gov/auditor/agendas/TATHandout10-21-15.pdf.

3-11
2015), since the 2016 Legislature will be concerned with budgets for FY2017 and later years. Allocations set by those acts are highlighted in the appendix tables. Recommendations
Points of General Agreement or Consensus in Working Group Discussions The Working Group had wide-ranging discussions of allocation strategies, along with the advantages and disadvantages of various models. While members had distinct points of view, the Working Group as a whole appeared to reach general agreement on several issues. This account makes explicit perspectives that support the Working Group’s final recommendation, but were not the subject of formal votes. Three points emerged from the debate: (1) support for the visitor industry through TSF, (2) removal of caps on allocations, and (3) key principles for allocation between the State and counties. Support for the visitor industry via TSF TAT affects Hawai‘i’s visitor industry’s competitive stance in relation to other visitor destinations around the world. TAT revenues should be allocated in part to support the visitor industry (through marketing and infrastructure). That allocation should be predictable, so that the industry and its advocates at HTA can plan and budget activities to effectively support Hawai‘i as a destination.10 Support for the visitor industry should be assured in times of recession as well as economic growth, so marketing efforts can help to reboot visitor arrivals and spending. The allocation should be sufficient to support a continuing work program. Since the costs of marketing and similar activities change over time, the allocation cannot be a set dollar amount, continuing from year to year, but should vary with changes in the price of goods and services. The Working Group decided to use the CPI-U as the basis for annual adjustments in the funds allocated to the Tourism Special Fund. The Working Group considered models in which tourism funding was determined as a share of total TAT revenues. This approach was found unacceptable for two reasons: (1) tourism funding is most needed at times when TAT revenues decline; and (2) the amount of tourism funding should be related to HTA expenditures, not TAT revenues.
10 The Allocation Models Investigative Group identified tourism moneys as going to the Hawai‘i Tourism Authority. In subsequent models, the consultant team presented these as contributions to the Tourism Special Fund. This represents a change which did not occasion comment by members of the Working Group.

3-12
Removal of caps on allocations In recent years, allocations to the counties have been “capped,” i.e., limited to specific dollar amounts. The Working Group appreciated that recipients would benefit from a predictable allocation strategy, but that allocations should be capped only where they reflect past commitments by the Legislature. Dollar caps are not appropriate for allocations to the counties. The counties should share with the State in increased revenues due to growth in tourism. Should the Legislature find it appropriate to allocate additional revenues for either existing initiatives such as the Convention Center or new initiatives, the new allocation would be part of the State’s share of TAT funds, not an amount to be guaranteed year after year before any division of revenues between the State and the counties. Recognition of key principles for allocation The Working Group sought an allocation strategy that could be approved by the Legislature and then stand unchanged for many years. The recommended strategy would be:
• Fair: Allocations should equitably reflect increases and reductions in TAT revenues and expenditures of the State and counties, and be perceived to be fair; • Predictable: Allocations should provide a predictable stream of revenues to facilitate budgeting; • Simple: Allocations should be simple to understand and administer; and • Flexible or Resilient in Changing Circumstances: Allocations should be acceptable to multiple agencies and constituencies. To be acceptable, an allocation strategy must be able to accommodate legislative and agency responses to pressing issues that arise from time to time. In order to encourage resilience, the Working Group assessed allocation models in relation to both growth and recessionary scenarios. The Working Group recognized that these principles could be difficult to align with each other, but all of them deserved to be considered in developing a long-term allocation model.
Model Recommended by the Working Group to the Legislature The Working Group unanimously agreed to propose a version of the shares model (Model 4): • The TSF allocation would begin at $82 million, and then (as of FY2017) be indexed to the CPI-U;

3-13
• Existing allocations for Turtle Bay, the Convention Center, and the Special Land Development Fund would be recognized as continuing obligations; • The remaining revenues would be split between the State and counties. After discussion, the Working Group derived a judgment-based evaluation that a 55/45 division appropriately represented the division of duties and responsibilities between the State and counties. • The recommended model provides both the counties and the visitor industry with predictability for budgeting and planning purposes. Exhibit 3-3 shows possible allocations with this model under the two scenarios. In choosing this model, the Working Group recognized the Legislature’s existing decisions to fund the TSF and specific tourism-related funds from TAT revenues while dividing the remainder of those revenues in proportions judged to correspond with the division of duties and responsibilities of the State and counties.

3-14
Exhibit 3-3: Model Recommended by the Working Group to the State Legislature
Source: Belt Collins Hawaii LLC
C1 TSF only Indexed AGGREGATEHA FORECAST 2015 2016 2017 2018 2019 2020 2021 2022 2023 2024 2025 2016-2025
Total (million) $421 $450 $474 $497 $520 $543 $568 $592 $623 $649 $678 $5,594TSF (+ CPI-U) $82 $82 $83 $85 $87 $89 $92 $94 $97 $99 $102 $909Other Existing Appropriations
Turtle Bay $1.5 $1.5 $1.5 $1.5 $1.5 $1.5 $1.5 $1.5 $1.5 $1.5 $1.5 $15Convention Center $26.5 $26.5 $26.5 $26.5 $26.5 $26.5 $26.5 $26.5 $26.5 $26.5 $26.5 $265Special Land Fund $3.0 $3.0 $3.0 $3.0 $3.0 $3.0 $3.0 $3.0 $3.0 $3.0 $3.0 $30
Remainder $308 $337 $360 $381 $402 $423 $445 $467 $495 $519 $545Counties (45% of Remainder) $103 $103 $162 $172 $181 $190 $200 $210 $223 $234 $245 $1,920State (55% of Remainder) $205 $234 $198 $210 $221 $233 $245 $257 $272 $286 $300 $2,455
RECESSION SCENARIO RS 2015 RS 2016 RS 2017 RS 2018 RS 2019 RS 2020 RS 2021 RS 2022 RS 2023 RS 2024 RS 2025 2016-2025Total (million) $421 $460 $476 $486 $417 $393 $472 $538 $612 $656 $699 $5,208TSF (+ CPI-U) $82 $82 $83 $85 $87 $89 $92 $94 $97 $99 $102 $909Other Existing Appropriations
Turtle Bay $1.5 $1.5 $1.5 $1.5 $1.5 $1.5 $1.5 $1.5 $1.5 $1.5 $1.5 $15Convention Center $26.5 $26.5 $26.5 $26.5 $26.5 $26.5 $26.5 $26.5 $26.5 $26.5 $26.5 $265Special Land Fund $3.0 $3.0 $3.0 $3.0 $3.0 $3.0 $3.0 $3.0 $3.0 $3.0 $3.0 $30
Remainder $308 $347 $362 $370 $299 $273 $350 $413 $484 $526 $566Counties (45% of Remainder) $103 $103 $163 $167 $134 $123 $157 $186 $218 $237 $255 $1,742State (55% of Remainder) $205 $244 $199 $204 $164 $150 $192 $227 $266 $289 $311 $2,247
NOTE: This model has been viewed with 60/40, 54/46. and 55/45 splits between the State and counties. The last (55/45) was chosen by the Working Group. Allocations for FY 2015 and 2016 are assumed to be as directed in Act 174, SLH 2014 and Acts 117 and 121, SLH 2015. Special Land Development Fund moneys for the years before FY2015 are actually General Fund appropriations.
$0
$50
$100
$150
$200
$250
$300
$350
$400
$450
2015 2016 2017 2018 2019 2020 2021 2022 2023 2024 2025
C1: Shares Model, with TSF only Indexed
TSF Counties State of Hawai‘i Other Existing Appropriations
$0
$50
$100
$150
$200
$250
$300
$350
$400
$450
RS 2015 RS 2016 RS 2017 RS 2018 RS 2019 RS 2020 RS 2021 RS 2022 RS 2023 RS 2024 RS 2025
C1: Shares Model, TSF Indexed, Recession Scenario
TSF Counties State of Hawai‘i Other Existing Appropriations

3-15
Additional Considerations
Obligation to Support the Employer-Union Trust Fund Act 268, SLH 2013, stipulates that the counties’ share of TAT revenues could be reduced to cover unmet annual minimal obligations to the Employer-Union Trust Fund (EUTF) as of FY2019. The counties have time to plan for this provision, and to avoid reductions in TAT funds due to underpayment of EUTF obligations. They are already taking steps to do so. Consequently, this provision is recognized as an integral part of the TAT statute, but has not been incorporated in the models considered by the Working Group. While some members of the Working Group proposed that the counties’ EUTF obligation no longer be tied to TAT revenues, the group as a whole did not take a position on this issue. Potential Changes in Demand for and Supply of Hawai‘i Visitor Lodgings The forecast developed for this report by HA includes anticipated changes in the visitor plant inventory. The TAT/TOT revenues are associated with known unit types:11 Hotels and condo hotels approximately 84 percent of combined TAT/TOT revenues Timeshare units leased as hotel units (subject to TAT) approximately 4 percent Individual vacation units (IVUs) approximately 6 percent Timeshare units subject to TOT approximately 6 percent The forecast anticipates some changes in the relative shares of these types with the introduction of new units and conversions of older units, but no great change in the distribution. The Working Group and its consultants are aware of ongoing trends that could challenge the assumptions used for the forecast. Both consumers and property owners have been increasingly involved with Airbnb, vacation rental by owner (VRBO) and similar companies. These companies provide the owner of a bed, room, condo, or house an opportunity to market their property over the Internet to vacationers. These companies typically provide vacationers photos and descriptions of the property, comments by earlier visitors, information about the owners and some assurance that the owners will provide a welcome as well as lodging. Most
11 Unit types are defined in the Hawai‘i Tourism Authority 2014 Visitor Plant Inventory, 2015. Available at http://www.hawaiitourismauthority.org/default/assets/File/reports/accommodations/2014%20Visitor%20Plant%20Inventory%20Report%20(FINAL).pdf.

3-16
units are less expensive than hotel units of similar size. One recent study estimates that these and other Individual Vacation Units (IVUs) account for as much as 25 percent of the supply of units for visitors.12 The impact of these arrangements is far from certain. On the one hand: • Both the availability and visitors’ use of IVUs could increase significantly; • If these units account for a much larger share of the market than they do now, occupancy levels in luxury condos and the like could be depressed; • The anticipated TAT revenues could be less than forecast, due to the increase in moderately priced units and to consequent price reductions in condos and hotels to compete with the new units. However, rentals of transient vacation units outside of resort areas in many cases violate zoning codes, and owners may be subject to sanction by the counties. Also, it is not clear whether this segment of the market will continue to grow: it is simply too new and changing too quickly to be sure. While a more competitive environment could pose challenges for hoteliers and condominium operators, the impact on TAT revenues is uncertain. The level of compliance with tax laws is not well known. State and county agencies are increasingly demanding that owners, operators, or local agents be identified in all vacation rental advertising. Airbnb recognizes that its owners (“hosts”) are subject to occupancy taxes in many areas. It is collecting such taxes and remitting them to local authorities in a few places. (Given the questionable legal status of many Airbnb units, it is in the company’s interest if the company and hosts gain legitimacy by being recognized as tax-paying members in jurisdictions such as San Francisco.) Website listings for transient rentals are also evolving. Airbnb has developed methods to encourage its participants to be hosts as well as guests, increasing its reach. Other firms are entering this market, and will no doubt introduce new products, amenities, and marketing strategies. In one future alternative, illegal vacation rentals, many of which are not tax-compliant, could multiply. In a second, the number of these rentals would be sharply constrained by government monitoring and fines. In a third, these rentals could multiply but become compliant, increasing GET and TAT revenues on visitor lodgings. The Working Group and its consultants are aware of this volatile market, but are not ready to offer any opinion as to its long-term implications.
12 SMS Research and Marketing Services, Inc. Individually Advertised Units in Hawai‘i (Vacation Rentals), prepared for the Hawai‘i Tourism Authority. 2014. Available at http://www.hawaiitourismauthority.org/default/assets/File/research/accommodations%20studies/Individually%20Advertised%20Units%20in%20Hawaii%20%28Vacation%20Rentals%29.pdf

4-1
Chapter 4
Findings and Purposes Statement Investigative Group and Proposed Legislation The Findings and Purposes investigative group drafted findings and purposes sections to be included in the Working Group’s proposed legislation. The Legislative Reference Bureau (LRB) assisted the Working Group with drafting the proposed legislation. The proposed legislation begins on page 4-2.

LRB 16-0223-1 State-County Functions Working Group.doc 1
*LRB 16-0223-1 State-County Functions Working Group.doc* *LRB 16-0223-1 State-County Functions Working Group.doc*
B. NO.
TWENTY-EIGHTH LEGISLATURE, 2016 STATE OF HAWAII
A BILL FOR AN ACT RELATING TO TRANSIENT ACCOMMODATIONS TAX.
BE IT ENACTED BY THE LEGISLATURE OF THE STATE OF HAWAII:
PART I 1
SECTION 1. (a) The legislature finds that: 2
(1) Pursuant to Act 174, Session Laws of Hawaii 2014, the 3
state-county functions working group was convened to 4
evaluate the division of duties and responsibilities 5
between the State and counties relating to the 6
provision of public services and to recommend an 7
appropriate allocation of the transient accommodations 8
tax revenues between the State and counties that 9
properly reflects the division of duties and 10
responsibilities relating to the provision of public 11
services; 12
(2) Though the transient accommodations tax has evolved to 13
meet the needs and purposes of the times, its 14
structure and frequent amendment, combined with the 15
cyclical nature of the visitor industry and the tax 16
revenues it generates, has resulted in ongoing 17
4-2

Page 2 B. NO.
LRB 16-0223-1 State-County Functions Working Group.doc 2
*LRB 16-0223-1 State-County Functions Working Group.doc* *LRB 16-0223-1 State-County Functions Working Group.doc*
discussions among the various stakeholders, including 1
the State, the counties, the visitor industry, the 2
Hawaii tourism authority, and other recipients or 3
potential recipients of transient accommodations tax 4
revenues; 5
(3) The state-county functions working group, composed of 6
state, county, and visitor industry representatives 7
and other knowledgeable and concerned citizens, and 8
which has been aided by experts, considered the 9
legislature's assignment for over a year and delivered 10
to the legislature its final unanimous report, 11
inclusive of analysis, findings, conclusions, and 12
recommendations; 13
(4) In particular, the state-county functions working 14
group found and concluded that: 15
(A) The application of the transient accommodations 16
tax and the allocation of its revenues should be 17
simplified and stabilized so as to be clear, 18
consistent, and predictable over time, in view of 19
the need to invest in tourism as a premier 20
industry; 21
4-3

Page 3 B. NO.
LRB 16-0223-1 State-County Functions Working Group.doc 3
*LRB 16-0223-1 State-County Functions Working Group.doc* *LRB 16-0223-1 State-County Functions Working Group.doc*
(B) The tourism special fund should be provided a 1
priority distribution of the transient 2
accommodations tax revenues at an assured minimum 3
level, adjusted for inflation, and regardless of 4
overall transient accommodations tax collections; 5
(C) After the priority distribution of the transient 6
accommodations tax revenues to the tourism 7
special fund, existing allocations to the Turtle 8
Bay conservation easement special fund, 9
convention center enterprise special fund, and 10
special land and development fund should be 11
maintained at their current levels, with any 12
additional state funding of these efforts made 13
out of state general funds by separate 14
appropriation; 15
(D) Based on a review of state and county functions, 16
including tourism expenditures, an appropriate 17
allocation of the remaining transient 18
accommodations tax revenues is fifty-five per 19
cent to the state general fund and forty-five per 20
cent to the counties; and 21
4-4

Page 4 B. NO.
LRB 16-0223-1 State-County Functions Working Group.doc 4
*LRB 16-0223-1 State-County Functions Working Group.doc* *LRB 16-0223-1 State-County Functions Working Group.doc*
(E) There should be no fixed dollar amounts, caps, 1
floors, or similar restrictions on allocations to 2
the State and counties of the remaining revenues; 3
instead, both the State and the county 4
allocations should increase or decrease 5
proportionately with increasing or decreasing 6
transient accommodations tax revenues; and 7
(5) The state-county functions working group 8
recommendations reflect a fair, balanced, and 9
reasonable compromise of competing needs for scarce 10
resources and provide a sound policy base for the 11
further administration of the transient accommodations 12
tax and its revenues. 13
(b) The purpose of this Act is to: 14
(1) Provide a fair, consistent, and predictable priority 15
allocation of transient accommodations tax revenues, 16
of an assured minimum amount, to the tourism special 17
fund; 18
(2) Maintain allocation of transient accommodations tax 19
revenues to existing obligations at present levels; 20
4-5

Page 5 B. NO.
LRB 16-0223-1 State-County Functions Working Group.doc 5
*LRB 16-0223-1 State-County Functions Working Group.doc* *LRB 16-0223-1 State-County Functions Working Group.doc*
(3) Provide a fair, consistent, and predictable allocation 1
of the balance of the transient accommodations tax 2
revenues between the State and the counties, and 3
(4) Provide flexibility to the tourism special fund, 4
State, and counties in the utilization of their 5
respective allocations. 6
PART II 7
SECTION 2. Section 237D-6.5, Hawaii Revised Statutes, is 8
amended by amending subsection (b) to read as follows: 9
"(b) Revenues collected under this chapter shall be 10
distributed in the following priority, with the excess revenues 11
to be deposited into the general fund: 12
[(1) $1,500,000 shall be allocated to the Turtle Bay 13
conservation easement special fund beginning July 1, 14
2015, for the reimbursement to the state general fund 15
of debt service on reimbursable general obligation 16
bonds, including ongoing expenses related to the 17
issuance of the bonds, the proceeds of which were used 18
to acquire the conservation easement and other real 19
property interests in Turtle Bay, Oahu, for the 20
protection, preservation, and enhancement of natural 21
4-6
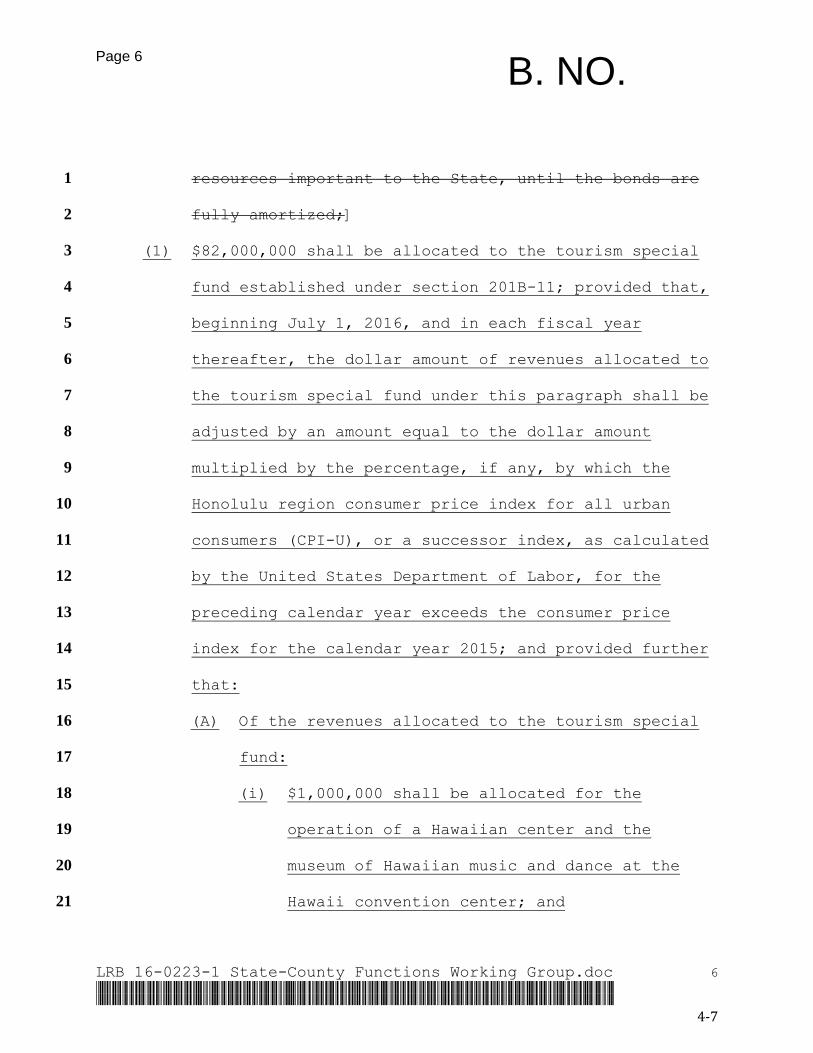
Page 6 B. NO.
LRB 16-0223-1 State-County Functions Working Group.doc 6
*LRB 16-0223-1 State-County Functions Working Group.doc* *LRB 16-0223-1 State-County Functions Working Group.doc*
resources important to the State, until the bonds are 1
fully amortized;] 2
(1) $82,000,000 shall be allocated to the tourism special 3
fund established under section 201B-11; provided that, 4
beginning July 1, 2016, and in each fiscal year 5
thereafter, the dollar amount of revenues allocated to 6
the tourism special fund under this paragraph shall be 7
adjusted by an amount equal to the dollar amount 8
multiplied by the percentage, if any, by which the 9
Honolulu region consumer price index for all urban 10
consumers (CPI-U), or a successor index, as calculated 11
by the United States Department of Labor, for the 12
preceding calendar year exceeds the consumer price 13
index for the calendar year 2015; and provided further 14
that: 15
(A) Of the revenues allocated to the tourism special 16
fund: 17
(i) $1,000,000 shall be allocated for the 18
operation of a Hawaiian center and the 19
museum of Hawaiian music and dance at the 20
Hawaii convention center; and 21
4-7
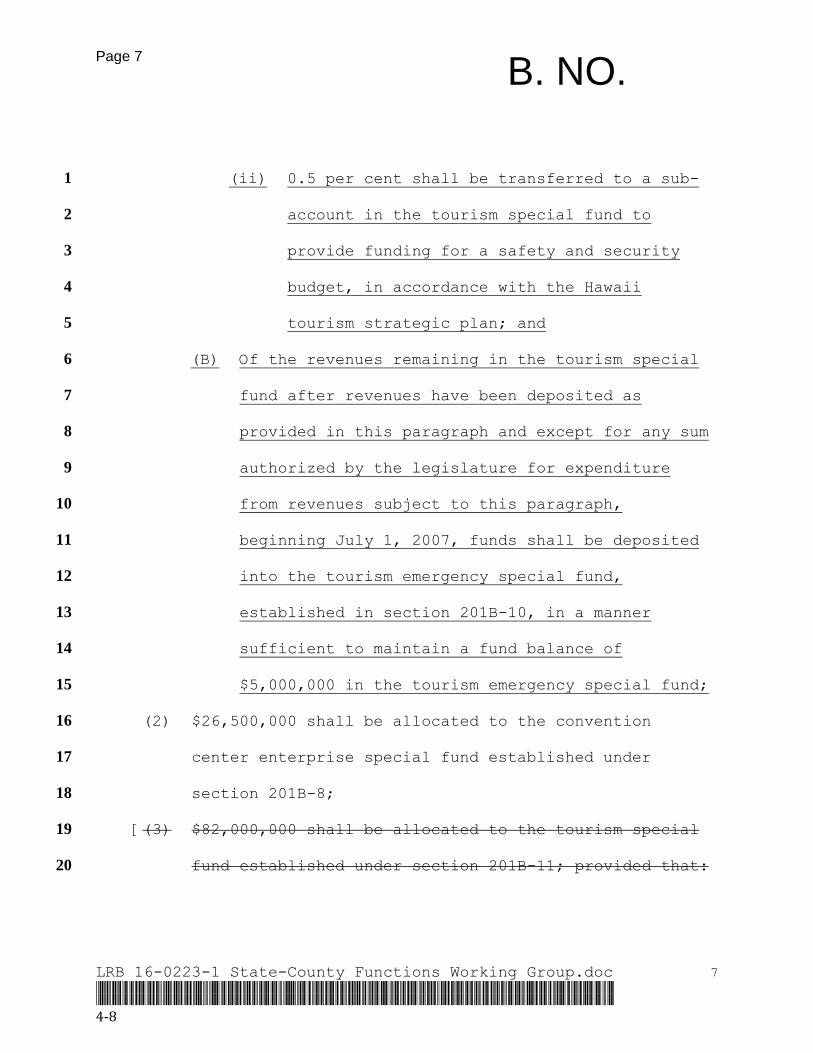
Page 7 B. NO.
LRB 16-0223-1 State-County Functions Working Group.doc 7
*LRB 16-0223-1 State-County Functions Working Group.doc* *LRB 16-0223-1 State-County Functions Working Group.doc*
(ii) 0.5 per cent shall be transferred to a sub-1
account in the tourism special fund to 2
provide funding for a safety and security 3
budget, in accordance with the Hawaii 4
tourism strategic plan; and 5
(B) Of the revenues remaining in the tourism special 6
fund after revenues have been deposited as 7
provided in this paragraph and except for any sum 8
authorized by the legislature for expenditure 9
from revenues subject to this paragraph, 10
beginning July 1, 2007, funds shall be deposited 11
into the tourism emergency special fund, 12
established in section 201B-10, in a manner 13
sufficient to maintain a fund balance of 14
$5,000,000 in the tourism emergency special fund; 15
(2) $26,500,000 shall be allocated to the convention 16
center enterprise special fund established under 17
section 201B-8; 18
[(3) $82,000,000 shall be allocated to the tourism special 19
fund established under section 201B-11; provided that: 20
4-8

Page 8 B. NO.
LRB 16-0223-1 State-County Functions Working Group.doc 8
*LRB 16-0223-1 State-County Functions Working Group.doc* *LRB 16-0223-1 State-County Functions Working Group.doc*
(A) Beginning on July 1, 2012, and ending on June 30, 1
2015, $2,000,000 shall be expended from the 2
tourism special fund for development and 3
implementation of initiatives to take advantage 4
of expanded visa programs and increased travel 5
opportunities for international visitors to 6
Hawaii; 7
(B) Of the $82,000,000 allocated: 8
(i) $1,000,000 shall be allocated for the 9
operation of a Hawaiian center and the 10
museum of Hawaiian music and dance at the 11
Hawaii convention center; and 12
(ii) 0.5 per cent of the $82,000,000 shall be 13
transferred to a sub-account in the tourism 14
special fund to provide funding for a safety 15
and security budget, in accordance with the 16
Hawaii tourism strategic plan 2005-2015; and 17
(C) Of the revenues remaining in the tourism special 18
fund after revenues have been deposited as 19
provided in this paragraph and except for any sum 20
authorized by the legislature for expenditure 21
4-9

Page 9 B. NO.
LRB 16-0223-1 State-County Functions Working Group.doc 9
*LRB 16-0223-1 State-County Functions Working Group.doc* *LRB 16-0223-1 State-County Functions Working Group.doc*
from revenues subject to this paragraph, 1
beginning July 1, 2007, funds shall be deposited 2
into the tourism emergency special fund, 3
established in section 201B-10, in a manner 4
sufficient to maintain a fund balance of 5
$5,000,000 in the tourism emergency special 6
fund;] 7
(3) $3,000,000 shall be allocated to the special land and 8
development fund established under section 171-19; 9
provided that the allocation shall be expended in 10
accordance with the Hawaii tourism authority strategic 11
plan for: 12
(A) The protection, preservation, maintenance, and 13
enhancement of natural resources, including 14
beaches, important to the visitor industry; 15
(B) Planning, construction, and repair of facilities; 16
and 17
(C) Operation and maintenance costs of public lands, 18
including beaches, connected with enhancing the 19
visitor experience; 20
4-10

Page 10 B. NO.
LRB 16-0223-1 State-County Functions Working Group.doc 10
*LRB 16-0223-1 State-County Functions Working Group.doc* *LRB 16-0223-1 State-County Functions Working Group.doc*
(4) $1,500,000 shall be allocated to the Turtle Bay 1
conservation easement special fund beginning July 1, 2
2015, for the reimbursement to the state general fund 3
of debt service on reimbursable general obligation 4
bonds, including ongoing expenses related to the 5
issuance of the bonds, the proceeds of which were used 6
to acquire the conservation easement and other real 7
property interests in Turtle Bay, Oahu, for the 8
protection, preservation, and enhancement of natural 9
resources important to the State, until the bonds are 10
fully amortized; and 11
[(4)] (5) [$103,000,000 for fiscal year 2014-2015, 12
$103,000,000 for fiscal year 2015-2016, and 13
$93,000,000 for each fiscal year thereafter] Of the 14
remaining revenues collected under this chapter, 15
forty-five per cent shall be allocated to the counties 16
and shall be distibuted as follows: Kauai county 17
shall receive 14.5 per cent, Hawaii county shall 18
receive 18.6 per cent, city and county of Honolulu 19
shall receive 44.1 per cent, and Maui county shall 20
receive 22.8 per cent; provided that commencing with 21
4-11

Page 11 B. NO.
LRB 16-0223-1 State-County Functions Working Group.doc 11
*LRB 16-0223-1 State-County Functions Working Group.doc* *LRB 16-0223-1 State-County Functions Working Group.doc*
fiscal year 2018-2019, a sum that represents the 1
difference between a county public employer's annual 2
required contribution for the separate trust fund 3
established under section 87A-42 and the amount of the 4
county public employer's contributions into that trust 5
fund shall be retained by the state director of 6
finance and deposited to the credit of the county 7
public employer's annual required contribution into 8
that trust fund in each fiscal year, as provided in 9
section 87A-42, if the respective county fails to 10
remit the total amount of the county's required annual 11
contributions, as required under section 87A-43[; and 12
(5) $3,000,000 shall be allocated to the special land and 13
development fund established under section 171-19; 14
provided that the allocation shall be expended in 15
accordance with the Hawaii tourism authority strategic 16
plan for: 17
(A) The protection, preservation, maintenance, and 18
enhancement of natural resources, including 19
beaches, important to the visitor industry; 20
4-12

Page 12 B. NO.
LRB 16-0223-1 State-County Functions Working Group.doc 12
*LRB 16-0223-1 State-County Functions Working Group.doc* *LRB 16-0223-1 State-County Functions Working Group.doc*
(B) Planning, construction, and repair of facilities; 1
and 2
(C) Operation and maintenance costs of public lands, 3
including beaches, connected with enhancing the 4
visitor experience]. 5
All transient accommodations taxes shall be paid into the 6
state treasury each month within ten days after collection and 7
shall be kept by the state director of finance in special 8
accounts for distribution as provided in this subsection. 9
As used in this subsection, "fiscal year" means the twelve-10
month period beginning on July 1 of a calendar year and ending 11
on June 30 of the following calendar year." 12
PART III 13
SECTION 3. Section 87A-42, Hawaii Revised Statutes, is 14
amended by amending subsection (d) to read as follows: 15
"(d) In any fiscal year subsequent to the 2017-2018 fiscal 16
year in which a county public employer's contributions into the 17
fund are less than the amount of the annual required 18
contribution, the amount that represents the excess of the 19
annual required contribution over the county public employer's 20
contributions shall be deposited into the fund from a portion of 21
4-13

Page 13 B. NO.
LRB 16-0223-1 State-County Functions Working Group.doc 13
*LRB 16-0223-1 State-County Functions Working Group.doc* *LRB 16-0223-1 State-County Functions Working Group.doc*
all transient accommodations tax revenues collected by the 1
department of taxation under section [237D-6.5(b)(4).] 237D-2
6.5(b)(5). The director of finance shall deduct the amount 3
necessary to meet the county public employer's annual required 4
contribution from the revenues derived under section [237D-5
6.5(b)(4)] 237D-6.5(b)(5) and transfer the amount to the board 6
for deposit into the appropriate account of the separate trust 7
fund." 8
SECTION 4. Section 171-19, Hawaii Revised Statutes, is 9
amended by amending subsection (a) to read as follows: 10
"(a) There is created in the department a special fund to 11
be designated as the "special land and development fund". 12
Subject to the Hawaiian Homes Commission Act of 1920, as 13
amended, and section 5(f) of the Admission Act of 1959, all 14
proceeds of sale of public lands, including interest on deferred 15
payments; all moneys collected under section 171-58 for mineral 16
and water rights; all rents from leases, licenses, and permits 17
derived from public lands; all moneys collected from lessees of 18
public lands within industrial parks; all fees, fines, and other 19
administrative charges collected under this chapter and chapter 20
183C; a portion of the highway fuel tax collected under chapter 21
4-14

Page 14 B. NO.
LRB 16-0223-1 State-County Functions Working Group.doc 14
*LRB 16-0223-1 State-County Functions Working Group.doc* *LRB 16-0223-1 State-County Functions Working Group.doc*
243; all moneys collected by the department for the commercial 1
use of public trails and trail accesses under the jurisdiction 2
of the department; transient accommodations tax revenues 3
collected pursuant to section [237D-6.5(b)(5);] 237D-6.5(b)(3); 4
and private contributions for the management, maintenance, and 5
development of trails and accesses shall be set apart in the 6
fund and shall be used only as authorized by the legislature for 7
the following purposes: 8
(1) To reimburse the general fund of the State for 9
advances made that are required to be reimbursed from 10
the proceeds derived from sales, leases, licenses, or 11
permits of public lands; 12
(2) For the planning, development, management, operations, 13
or maintenance of all lands and improvements under the 14
control and management of the board pursuant to title 15
12, including but not limited to permanent or 16
temporary staff positions who may be appointed without 17
regard to chapter 76; provided that transient 18
accommodations tax revenues allocated to the fund 19
shall be expended as provided in section [237D-20
6.5(b)(5);] 237D-6.5(b)(3); 21
4-15

Page 15 B. NO.
LRB 16-0223-1 State-County Functions Working Group.doc 15
*LRB 16-0223-1 State-County Functions Working Group.doc* *LRB 16-0223-1 State-County Functions Working Group.doc*
(3) To repurchase any land, including improvements, in the 1
exercise by the board of any right of repurchase 2
specifically reserved in any patent, deed, lease, or 3
other documents or as provided by law; 4
(4) For the payment of all appraisal fees; provided that 5
all fees reimbursed to the board shall be deposited in 6
the fund; 7
(5) For the payment of publication notices as required 8
under this chapter; provided that all or a portion of 9
the expenditures may be charged to the purchaser or 10
lessee of public lands or any interest therein under 11
rules adopted by the board; 12
(6) For the management, maintenance, and development of 13
trails and trail accesses under the jurisdiction of 14
the department; 15
(7) For the payment to private land developers who have 16
contracted with the board for development of public 17
lands under section 171-60; 18
(8) For the payment of debt service on revenue bonds 19
issued by the department, and the establishment of 20
4-16

Page 16 B. NO.
LRB 16-0223-1 State-County Functions Working Group.doc 16
*LRB 16-0223-1 State-County Functions Working Group.doc* *LRB 16-0223-1 State-County Functions Working Group.doc*
debt service and other reserves deemed necessary by 1
the board; 2
(9) To reimburse the general fund for debt service on 3
general obligation bonds issued to finance 4
departmental projects, where the bonds are designated 5
to be reimbursed from the special land and development 6
fund; 7
(10) For the protection, planning, management, and 8
regulation of water resources under chapter 174C; and 9
(11) For other purposes of this chapter." 10
PART IV 11
SECTION 5. Statutory material to be repealed is bracketed 12
and stricken. New statutory material is underscored. 13
SECTION 6. This Act shall take effect on July 1, 2016. 14
15
INTRODUCED BY: _____________________________
4-17

B. NO.
LRB 16-0223-1 State-County Functions Working Group.doc
*LRB 16-0223-1 State-County Functions Working Group.doc* *LRB 16-0223-1 State-County Functions Working Group.doc*
Report Title:
State-County Functions Working Group; Transient Accommodations
Tax; Allocation; Tourism Special Fund; Counties
Description:
Adjusts allocation of transient accommodations tax revenues to
the tourism special fund for inflation. Adjusts allocation to
the counties to equal 45% of the amount of revenues remaining
after all other allocations are made.
The summary description of legislation appearing on this page is for informational purposes only and is not legislation or evidence of legislative intent.
4-18

Appendix A Act 174, Session Laws of Hawai‘i 2014


Approved by the Governor
on JUL 1 Mg HOUSE OF REPRESENTATIVES TWENTY-SEVENTH LEGISLATURE, 2014 STATE OF IHAV4M1
p.
ACT 17 4 H.B. NO.
1671 HD. 1 S.D. 1 C.D. 1
A BILL FOR AN ACT RELATING TO TRANSIENT ACCOMMODATIONS TAX.
BE IT ENACTED BY THE LEGISLATURE OF THE STATE OF HAWAII:
1 SECTION 1. Section 237D-6.5, Hawaii Revised Statutes, is
amended by amending subsection (b) to read as follows:
3 "(b) Revenues collected under this chapter shall be
4 distributed as follows, with the excess revenues to be deposited
5 into the general fund:
6 (1) $33,000,000 shall be allocated to the convention
7 center enterprise special fund established under
8 section 201B-8;
9 (2) $82,000,000 shall be allocated to the tourism special
10 fund established under section 2018-11; provided that:
11 (A) Beginning on July 1, 2012, and ending on June 30,
12 2015, $2,000,000 shall be expended from the
13 tourism special fund for development and
14 implementation of initiatives to take advantage
15 of expanded visa programs and increased travel
16 opportunities for international visitors to
17 Hawaii; • .
18- (B) Of the $82,000,000 allocated:
HB1671 CD1 LRB 14-2554.doc
111111111111111111111111M1

Page 2
H.B. NO 1671 H.D. 1
• S.D. 1 C.D. 1
1 (i) $1,000,000 shall be allocated for the
2 operation of a Hawaiian center and the
3 museum of Hawaiian music and dance at the
4 Hawaii convention center; and
5 (ii) 0.5 per cent of the $82,000,000 shall be
6 transferred to a sub-account in the tourism
7 special fund to provide funding for a safety
8 and security budget, in accordance with the
9 Hawaii tourism strategic plan 2005-2015; and
10 (C) Of the revenues remaining in the tourism special
11 fund after revenues have been deposited as
12 provided in this paragraph and except for any sum
13 authorized by the legislature for expenditure
14 from revenues subject to this paragraph,
15 beginning July 1, 2007, funds shall be deposited
16 into the tourism emergency trust fund,
17 established in section 201B-10, in a manner
18 sufficient to maintain a fund balance of
19 $5,000,000 in the tourism emergency trust fund;
20 (3) [C93,000,000] $103,000,000 for fiscal year 2014-2015,
21 $103,000,000 for fiscal year 2015-2016, and
22 $93,000,000 for each fiscal year thereafter shall be
HB1671 CD1 LRB 14-2554.doc
11111111111111111111111111111

Page 3 H.B. NO.• 1671 S.D. 1 C.D. 1
1 allocated as follows: Kauai county shall receive 14.5
2 per cent, Hawaii county shall receive 18.6 per cent,
3 city and county of Honolulu shall receive 44.1 per
4 cent, and Maui county shall receive 22.8 per cent;
5 provided that commencing with fiscal year 2018-2019, a
6 sum that represents the difference between a county
7 public employer's annual required contribution for the
8 separate trust fund established under section 87A-42
9 and the amount of the county public employer's
10 contributions into that trust fund shall be retained
11 by the state director of finance and deposited to the
12 credit of the county public employer's annual required
13 contribution into that trust fund in each fiscal year,
14 as provided in section 87A-42, if the respective
15 county fails to remit the total amount of the county's
16 required annual contributions, as required under
17 section 87A-43; and
18 (4) Of the excess revenues deposited into the general fund
19 pursuant to this subsection, $3,000,000 shall be
20 allocated subject to the mutual agreement of the board
21 of land and natural resources and the board of
22 directors of the Hawaii tourism authority in
HB1671 CDT LRB 14-2554.doc
1111111111111111111101111111

Page 4
H.B. NO 1671 RD. 1 S.D. 1 CD. 1
1
accordance with the Hawaii tourism authority strategic
2
plan for:
3
(A) The protection, preservation, and enhancement of
4
natural resources important to the visitor
5
industry;
6
(B) Planning, construction, and repair of facilities;
7
and
8
(C) Operation and maintenance costs of public lands
9
connected with enhancing the visitor experience.
10
All transient accommodations taxes shall be paid into the
11 state treasury each month within ten days after collection and
12 shall be kept by the state director of finance in special
13 accounts for distribution as provided in this subsection.
14 As used in this subsection, "fiscal year" means the twelve-
15 month period beginning on July 1 of a calendar year and ending
16 on June 30 of the following calendar year."
17 SECTION 2. (a) There is established a state-county
18 functions working group that shall:
19 (1) Evaluate the division of duties and responsibilities
20 between the state and counties relating to the
21 provision of public services; and
HB1671 CD1 LRB 14-2554.doc
1•1111111111111111111111111

Page5 H.B. NO. 1671 11.0. 1 S.D. 1 C.D. 1
1
(2) Submit a recommendation to the legislature on the
2
appropriate allocation of the transient accommodations
3
tax revenues between the State and counties that
4 properly reflects the division of duties and
5
responsibilities relating to the provision of public
6 services.
7
(b) The working group shall be composed of thirteen
8 members appointed, without regard to section 26-34, Hawaii
9 Revised Statutes, as follows:
10 (1) Four members, each of whom shall be appointed by a
11 different county mayor;
12 (2) Four members appointed by the governor;
13 (3) Two members appointed by the president of the senate;
14 (4) Two members appointed by the speaker of the house of
15 representatives; and
16 (5) One member appointed by the chief justice, who shall
17 serve as the chair of the working group.
18 The members appointed under paragraphs (3), (4), and (5) shall
19 not be currently employed by the State or any county.
20 (c) The working group shall be administratively placed in
21 the office of the auditor. The auditor shall initiate the
22 organization of and provide staff support for the working group.
iIlIulIuHhIIIulIIIIOhIuII
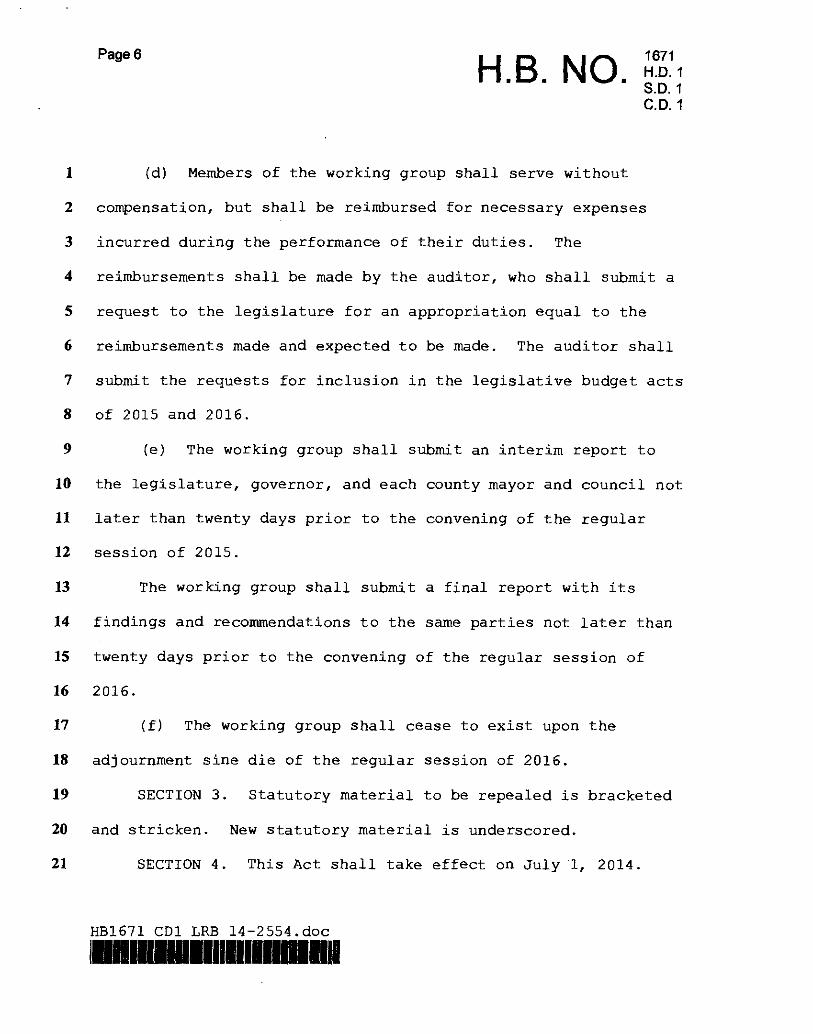
Page 6
H.B. NO. 1671 H.D. 1 S.D. 1 C.D. 1
1 (d) Members of the working group shall serve without
2 compensation, but shall be reimbursed for necessary expenses
3 incurred during the performance of their duties. The
4 reimbursements shall be made by the auditor, who shall submit a
5 request to the legislature for an appropriation equal to the
6 reimbursements made and expected to be made. The auditor shall
7 submit the requests for inclusion in the legislative budget acts
8 of 2015 and 2016.
9 (e) The working group shall submit an interim report to
10 the legislature, governor, and each county mayor and council not
11 later than twenty days prior to the convening of the regular
12 session of 2015.
13 The working group shall submit a final report with its
14 findings and recommendations to the same parties not later than
15 twenty days prior to the convening of the regular session of
16 2016.
17 (f) The working group shall cease to exist upon the
18 adjournment sine die of the regular session of 2016.
19 SECTION 3. Statutory material to be repealed is bracketed
20 and stricken. New statutory material is underscored.
21 SECTION 4. This Act shall take effect on July 1, 2014.
HB1671 CD1 LRB 14-2554.doc
1111111111111111111111111111

1671 H.D. 1 S.D. 1
H.B. NO.
APPROVED this 1 day of JUL , 2014
GOVERNOR OF THE STATE OF HAWAII


Appendix B “Sharing TAT Revenues In Hawai‘i:
A Background Paper”
by Dr. James Mak


Appendix B-1
Sharing TAT Revenues in Hawaii: A Background Paper James Mak October 10, 2015
I. Introduction
Section 2 of Act 174, SLH 2014 passed by the Hawaii State Legislature establishes a 13-member Working Group (WG) to:
(1) Evaluate the division of duties and responsibilities between state government and counties (City and County of Honolulu, and Counties of Hawai‘i, Kauai, and Maui) relating to the provision of public services; and
(2) Submit a recommendation to the Legislature on the appropriate allocation of the transient accommodations tax (TAT) revenues between the State and counties that properly reflects the division of duties and responsibilities relating to the provision of public services.
The Working Group comprises of members appointed by county mayors (4), the Governor (4), President of the Senate (2), Speaker of the House (2), the Chief Justice of the Hawaii Supreme Court (who would chair the working group) (1) to review and provide recommendation to the 2016 Legislature on how best to allocate TAT revenues between the State and the counties.1 Between October 22, 2014 and October 7, 2015 the Working Group met 14 times as a whole and a lot of information and data have been gathered and distributed.2
The following report provides some background research that examines the TAT allocation issue from a bigger picture perspective. It also integrates some of the handouts into a coherent story. The paper may be helpful when the final report is written for the Legislature.
At the outset, it is noteworthy that Act 174 does not mention the parallel tax on timeshare occupancy—the timeshare occupancy tax (TOT). Currently, timeshare units that are rented for money are subject to the TAT and those that are occupied through exchange are subject to the TOT. If revenues from the TOT are not included in the allocation project, it would be an unfortunate omission.
II. Background: State Aid to Local Governments in the U.S.
State aid to local governments is an important feature of state-local public finance in the U.S. Historically, state aid has been provided in three ways. First, state governments can directly assume responsibilities to provide specific public services. Second, states can authorize local governments to impose a variety of taxes, fees and user charges. Third, states can provide direct grant-in-aid to provide partial funding for public services that are of mutual concern or to enhance intergovernmental fiscal equity within a particular state. In 2009-2010, California sent 66.4% of its own-source revenue to local 1 Two of the members from among those appointed by the Senate, House of Representatives and the Supreme
Court cannot currently be employed by the State or any of the counties. The two turned out to be from the visitor industry.
2 See http://auditor.hawaii.gov/task-forceworking-group/

Appendix B-2
governments;3 the corresponding number was 3.2% for Hawaii (the lowest amongst the 50 States). The average for all 50 States was 48.2%. State grant-in-aid accounted for 32.6% of local government general revenue in California while in Hawaii it was only 7.1%. The national average was 29.2%. Vermont led all States at 60.8%.4 The latest U.S. Census of state and local government finances shows that in FY2013 local governments in the U.S. received $469 billion in intergovernmental aid from state governments. In FY2013, local governments in Hawaii received $237 million from the Hawaii State government.5 State aid to Hawaii’s four county governments represented 7.2% of their aggregate general revenue.
The use of grant-in-aid money can either be restricted or unrestricted. Obviously, if the objective of aid is to induce recipient governments to spend more on a particular public service, restrictions should be imposed to achieve the intended outcome. If the purpose is to provide general government assistance, it should be unrestricted.6 Most of the state aid to local governments in the U.S. is conditional/restricted aid. Local school districts are the largest recipients of state aid. Not in Hawaii. In Hawaii, the provision of K-12 public education is a state responsibility unlike in the other 49 states. Not surprisingly, a study of state to local aid programs in 1999 by the Tennessee Tax Review Commission revealed that unrestricted aid as a percentage of total state aid to local governments was highest in Hawaii—74%.7
The U.S. Advisory Commission on Intergovernmental Relation (ACIR) defines unrestricted money as “revenue sharing.”8 According to the ACIR, “State-local revenue sharing can be defined as money given to localities…to be spent on purposes determined by the localities themselves. The amount and method of allocating aid is determined by the state legislature… This definition of state-local revenue sharing excludes categorical aids to all local governments and most payments to school districts and special districts since such districts generally must spend all aid in their particular functional area. The definition of state-local sharing also excludes piggyback taxes where there is a local option to tax or to determine the local tax rate.” A Congressional Research Service study defines general revenue sharing simply as “General revenue that can be used for any purpose not expressly prohibited by federal or state law and is not limited to narrowly defined activities.”9
Fisher and Bristle note that only about half of the states provide “true” revenue sharing which they define, more restrictively, as aid that redistributes revenues amongst local governments and their use is unrestricted to local governments.10 In the U.S. such grants account for only a small percentage of local government revenue. Only 10 states provide (“true”) revenue-sharing grants to local governments that exceed 10% of local revenues.11
3 An explanation for this high percentage is Proposition 13 which has crippled the ability of California local
governments to raise money from the local property tax to fund schools. 4 National Conference of State Legislatures (NCLS), State Aid to Local Governments, 2015. 5 U.S. Census Bureau, State and Local Government Finances, 2013 at http://www.census.gov/govs/local/. Local
governments in Hawaii also received nearly $388 million in aid from the federal government. 6 ACIR, 1989, p. 150. 7 The Tennessee Advisory Commission on Intergovernmental Relations (TACIR), 2004, p. 7. 8 ACIR, 1980, p. 2. 9 Dilger, 2015, p. 2. 10 Hence, they would not consider it “true” revenue sharing where there are centralized revenue collection
agreements in which the state collects tax revenues for the local governments and sends the revenues collected to the local governments.
11 Fisher and Bristle, 2012, p. 239.

Appendix B-3
State aid to local governments is distributed in four ways.12 First, is situs or origin based distribution. Revenue is distributed to local governments according to where it is generated. Hence, there is no revenue redistribution among the local governments. Second, as a reimbursement to offset local revenue losses due to state mandated expenditures, tax relief programs or state tax exemptions. For example, in Hawaii, public utility companies are exempt from paying local property taxes and instead pay an in lieu tax—the public company service tax—to the State. Third, population or per capita based distribution. Population or per capita based distribution is the most common and simplest method of distribution. It is also perceived to be “fair” in that every person is treated the same (horizontal equity). Population is also generally regarded as the best indicator of “need” in general purpose intergovernmental aid.13 Typically, the more narrowly defined the goals of the program, the more likely “need” is measured by something other than population.14 Fourth, equalization (and need based) distribution. Equalizing (or “need” based) aid tries to account for the fact that “fiscal capacities” among localities differ--i.e. costs are higher and resources are lower in some areas than in others-- and to attempt to offset these disparities. Recently, (August, 2015), the North Carolina State Senate passed a bill to change the way the state distributes state sales tax revenues from origin based distribution to one where half the revenue would stay with the county where the goods are sold and the other half distributed to counties based on their population. The purpose of the change is to aid rural counties “that aren’t growing and are losing population.” In response to complaints from urban counties that stood to lose revenue, one senator responded, “We’re trying to change a system so that we can become one North Carolina.”15
According to the Tennessee Tax Modernization and Reform Commission (TTMRC), an “equitable method of distribution should be related to the needs of the local governments, as estimated from various economic and demographic indicators, for example, population, income, area, and miles of road. In this way, more aid should be distributed to those government units in which the estimated needs are greater.” In addition, the TTMRC suggested that consideration also be given to the ability of local governments to raise their own revenue and their actual tax effort.16 For example, the well-known Federal Government General Revenue Sharing (GRS) program that existed between 1972 through 1986 distributed a set annual amount of federal funds to nearly 39,000 general purpose local governments (and all 50 states) to spend as they wished.17 Funds were distributed to local governments based on population, income, and tax effort. The formula gave more, on a per capita basis, to local governments in lower income areas and those that helped themselves with greater tax effort.18
A government’s fiscal capacity can change over time as a result of long-run economic (e.g. slowing down of tourism growth in Hawaii) and demographic changes (e.g. population growth or aging).19 Hence, allocation formulae developed to address existing fiscal disparities need to be reviewed periodically and, perhaps, amended. This would also apply to any formula adopted to allocate Hawaii’s TAT revenues.
State revenue-sharing programs to support the general operations of local governments vary widely across the country. They can differ in which revenue streams are shared and how they are 12 See TACIR, 2004, pp. 3-4. 13 Michigan Department of Treasury; also ACIR, 1980. 14 Bradbury et al, 1984, pp. 152-53. 15 Campbell, August 10, 2015. 16 TACIR, 2004, p. 24. 17 This was in addition to categorical grants. Federal general revenue sharing with the states ended in 1981. 18 TACIR, 2004, pp. 27-28. 19 See, for example, Fisher, 2010.

Appendix B-4
distributed. Some are more complicated than others. In sum, there is not one single model that describes all of them. Indeed, the variation among such programs raises the question, “Which allocation methods or formulae are ‘better’”? Presumably the goal of state general revenue-sharing programs is either direct substitution of state tax systems for local tax systems to take advantage of economies of scale in collection or redistribute resources among the local governments.20 Obviously, if the purpose of general revenue-sharing is to take advantage of economies of scale in tax collection, the most appropriate distribution formula should be based on origin (i.e. where tax revenues are generated).21 If the objective of general revenue sharing is revenue redistribution, then needs-based factors are more appropriate.
South Carolina distributes money from a broad based fund, the State’s general fund. A broad based fund is likely to be less volatile than a stream of revenues from a single tax. Since 1991, South Carolina law, entitled State Aid to Subdivisions Act, has set the amount to be given to local governments (the Local Government Fund) at 4.5% of the State’s last completed fiscal year’s general fund. Amounts received by county and municipal governments depend solely on their population. Section 6-27-30 further stipulates that the amount is not subject to mid-year cuts except by a majority vote of the entire State Budget and Control Board. Even then cuts are permitted only if counties and municipalities do not receive less funding than in the immediate preceding fiscal year. (A bill introduced in the Legislature this year would delete both provisions. Instead, language in the bill allows appropriations to the state aid fund to be increased by 2% when the State’s general fund is projected to grow by at least 4%.22)
In Michigan, the State shares a portion of its 4% state sales tax with local governments. Since 1947, the Michigan Constitution requires the state to share sales tax revenues with the state’s local governments. Michigan’s unusual revenue sharing program is composed of two parts, one established by the State Constitution and the other by statute. An amendment to the Constitution in 1963 apportions 15% of the gross collections from the 4% state sales tax to be distributed to local governments on a per capita basis. The statutory portion apportions 21.3% of the 4% state sales tax to local governments.23 For many years the level of constitutionally mandated revenue sharing has remained fairly stable. In contrast, statutory revenue sharing has decreased sizably as a result of severe economic problems in Michigan since 2003.24 New revenue sharing programs adopted since 2011 have further cut funds to local governments. Business economist Martin Lavelle notes that in Michigan “economic downturns…added volatility and uncertainty into the revenue relationship between state and local governments.”
Cuts in state aid to local governments have occurred in many states. Indeed, as a result of the Great Recession (2007-2009), nominal state-local tax revenues were lower in 2009 than in the previous two years. The recession hit state governments harder than local governments because states do not have the (more) stable property tax.25 As a result, many states made discretionary aid cuts to their local governments. In hard times, states often suspend their statutory formulae and adopt ad hoc distribution arrangements, at least temporarily. In 2009, 22 states provided less nominal aid to their local governments than in the previous year. In 2010, 27 states provided less aid than in 2009.26 One challenge facing Hawaii’s current effort to apportion the TAT between the State and the four county governments is how 20 Fisher and Bristle, 2012, p. 240. 21 The rail tax surcharge is one such example in Hawaii. 22 State Aid to Subdivisions Act, South Carolina General Assembly, 121st Session, 2015-2016. 23 For details on how the money is distributed among the local governments, see Michigan Department of
Treasury. 24 Lavelle, 2014, p.2. 25 Fisher, 2010, p. 9. 26 Nguyen-Hoang and Hou, 2013, p. 1.

Appendix B-5
to design a revenue sharing system that minimizes harm to local governments when the economy is in recession.
III. Brief Profile of Hawaii’s State and County Governments and Revenue Sharing
In 2012 there were 38,910 general purpose local governments in the U.S.; they include 3,031 counties, 19,519 municipalities, and 16,369 townships. Hawaii, by contrast, has a very simple government structure. Government in Hawaii is highly centralized with the state government being the dominant player. Local governments in Hawaii comprise essentially of four county governments: Hawaii County, Maui County, Kauai County, and the City and County of Honolulu. Hawaii State Constitution assigns responsibility for a number of important service functions to the state government that elsewhere is assigned to local governments. The most notable such service responsibility is K-12 public education.
Local governments in Hawaii also have less revenue authority than similar institutions in most states.27 Hawaii’s state government guards its taxing power jealously. Hawaii has 17 separate tax laws of which 14 are administered by the State; the counties administer only the local property tax, the motor vehicle weight tax, and the public utility franchise tax.28 Counties in Hawaii were not even authorized to set their own property tax rates until 1989. In 2013, local property tax revenues represented 68.2% of local government tax revenues in Hawaii and nearly half (49.5%) of local own source revenues. (Own source revenues are revenues generated by local governments from their own resources—e.g. taxes, user charges, fees, etc.—and exclude intergovernmental revenues/grants.) As seen in Table 1, the State government in Hawaii accounts for over three-fourth of state and local government revenues and direct expenditures in 2012; the comparable percentages are significantly lower for all U.S. state governments.29
Table 1 State Government’s Share in State and Local Finance in Hawaii and the U.S.: FY2013
Hawaii U.S. State Gov’t Share of State-Local General Revenues 77.9% 62.7% State Gov’t Share of State-Local Own Source Revenues 76.0% 55.0% State Gov’t Share of State-Local Taxes 75.8% 58.2% State Gov’t Share of State-Local Direct Expenditures 77.2% 47.4% State Gov’t Share of State-Local Current Operating Expenditures 79.0% 43.2%
Source: U.S. Census Bureau, Survey of State and Local Government Finances, 2013 at http://www.census.gov/govs/local/
Table 1 also shows that state governments in the U.S., on average, collect more revenue than required by their spending responsibilities. On average state governments generated about 63% of total state and local general revenues but accounted for only 47% of total state and local government direct expenditures. The vertical fiscal gap is 15 percentage points, i.e. money that can be used to fund aid to
27 ACIR, 1989. 28 Mak, 2008, p. 80. 29 The ACIR estimated that in FY 1987 the Hawaii State Government received 82 percent of total State and
county own-source revenues while the counties received the remaining 18 percent. ACIR, 1989, p. 154.

Appendix B-6
local governments.30 However, there is a lot of variation among the states, which helps to explain the observed differences in the importance of state aid to local governments.31 In Hawaii, the State’s share of total state-local general revenues was 77.9%; by comparison, State direct spending (that excludes intergovernmental transfers but includes both capital and current operations expenditures) as a percentage of total state-local government direct spending was 77.2%. This suggests that Hawaii’s state government has less financial wiggle room to provide fiscal aid to its local governments. In FY2013, the $237 million of state aid distributed to the four county governments represented 2.2% of State’s general revenues but 7.2% of the counties’ general revenues. Statistically, state aid to the counties is more important to the counties (as a percent of their general revenues) than is the revenue loss to the State.
Hawaii’s state government has a lengthy history of sharing its revenues with the counties. Between 1947 and 1965 portions from the yield of the general excise tax (GET) (and the modest public company service tax) were distributed to the counties by formula.32 According to Lowell Kalapa of the Tax Foundation of Hawaii, for many years Hawaii’s counties received about 40% of the GET revenues.33 Of the amounts distributed, Honolulu received 55%; Hawaii County, 20%; Maui County, 15%; and Kauai County 10%.34 Beginning in 1965, GET revenue sharing was replaced by a system of grants-in-aid (Act 155, SLH 1965). Distribution of Act 155 fiscal aid money was based on how much effort each county made to raise property tax revenues.35 A parade of county mayors to the Legislature to lobby for additional State aid is held every year. Grants-in-aid to the counties increased annually from $9.363 million in FY 1966 to a peak of $19.5 million by FY 1972.36 The counties could spend the money any way they wished.
In October 1972 the Federal Government (under Republican President Richard Nixon) initiated a program of General Revenue Sharing (GRS) with state and county governments in the U.S. The program was terminated during the presidency of Ronald Reagan in October 1986. (Reagan feared that the Federal Government was getting too big.) In Hawaii 69.1% of the GRS local government money was distributed to the City and County of Honolulu, 9.9% to Maui, 14.9% to Hawaii County, and 6.1% to Kauai County.37 In order to receive revenue from the program, a state government “must maintain the amount of aid to local units at a level not less than the amount of aid given by the state in fiscal year 1972…”38 If Hawaii’s state government could not reduce aid to the counties without losing federal general revenue sharing money, it was not obliged to increase it either. And it did not. 39 Act 155 grants-in-aid were terminated around the time the Federal GRS ended.
In 1986, the Hawaii Legislature enacted legislation (Act 340) to tax occupancy of transient accommodations (widely referred to as a hotel room tax or TAT) beginning January 1, 1987. The tax rate 30 The gap was 20 percentage points before the Great Recession. Fisher and Bristle, 2012, pp. 215-231. 31 See, for example, Fisher and Bristle, 2012, pp. 215-231. 32 ACIR, 1989, p. 149. 33 Kalapa, 1992, p. 42. GET revenues increased from $17.8 million in FY 1949 to $54 million in FY 1965.
Schmitt, 1977, p. 637. 34 ACIR, 1989, p. 154. 35 Kalapa, 2013. 36 Schmitt, Historical Statistics of Hawaii, 1977, p. 154. 37 ACIR, 1989, p. 151. 38 ACIR,1974, p. 2. Over this period, the Federal Government distributed about $83 billion to state and local
governments. General revenue sharing with state governments ended in 1981. 39 Kalapa, 1992, p. 49.

Appendix B-7
was set at 5%.40 In FY 1987 (January 1 to June 30, 1987 only), the Department of Taxation (DOTAX) collected $23.5 million from the TAT; for the first full fiscal year in 1988, DOTAX collected $67.3 million. Initially, money collected from the TAT was not allocated to the counties directly as a replacement for Act 155 fiscal aid but was allocated, instead, to the State’s General Fund. Pursuant to Act 345 (SLH 1986), the State distributed grants-in-aid to the counties for “infrastructure/or tourism related activities.” The State distributed $12 million to the counties in FY 1987; the amount was raised to $20 million in FY 1989.41 The money came from the General Fund. Since 1990 the counties have received some portion of the TAT revenues each year as general revenue sharing.
IV. History of the TAT in Hawaii
The lodging/hotel room tax (known as the transient accommodation tax in Hawaii) is the most widely employed tourist tax in the world. In the U.S the lodging tax—separate from local sales taxes levied on tourist lodgings42—is levied by both state and local governments, but most frequently at the local government level. Only five states, including Hawaii, do not allow local/municipal governments to levy a separate lodging tax.43
Although the TAT in Hawaii is imposed on (the gross rental receipts of) lodging suppliers (e.g. hoteliers), it is essentially passed on to consumers; thus it is a consumption tax.44 Since most of the consumers are non-resident visitors, the burden of Hawaii’s TAT is largely exported. Research by several University of Hawaii economics professors found that Hawaii’s 5% TAT of 1987 had no negative revenue impact on lodging suppliers.45 Since 1987 the tax rate has been raised several times to the current rate of 9.25%.46 Table 2 displays TAT rate changes and the corresponding effective dates since 1987.
Table 2 TAT Rate Changes and Effective Dates, 1987–Current
Effect Date Rate January 1, 1987 5.0%
July 1, 1994 6.0% January 1, 1999 7.25%
July 1, 2009 8.25% July 1, 2010 9.25%
Source: State-County WG (TAT) Interim Report DRAFT 11/28/2014 40 This was in addition to the 4% GET. 41 ACIR, 1989, p. 154. 42 Hawaii also imposes its 4% GET on transient accommodation rentals. Hawaii’s prolific GET is not a “tourist
tax” as most of its revenues are generated from local residents. (See Miklius, Moncur, and Leung, 1989.) Although virtually all the taxes in Hawaii are, in varying degrees, partly shifted to tourists, the only Hawaii tax that generates most of its revenues from tourists is the TAT.
43 Michel, 2012. The other four states are: Connecticut, Delaware, Maine, and New Hampshire. 44 By comparison, recent research suggests that property taxes levied on hotels and resorts in Hawaii are not as
easily passed on to tourists. Mak, 2015. Miklius, Moncur and Leung (1989) estimated that in 1988, 97% of the TAT was paid by tourists compared to 8.67% of county (overall) property taxes. They also determined that nearly 22% of the GET was paid by tourists in that year.
45 Bonham et al, 1992. 46 No study has been done to ascertain whether the lodging sector has been harmed at the higher tax rates.
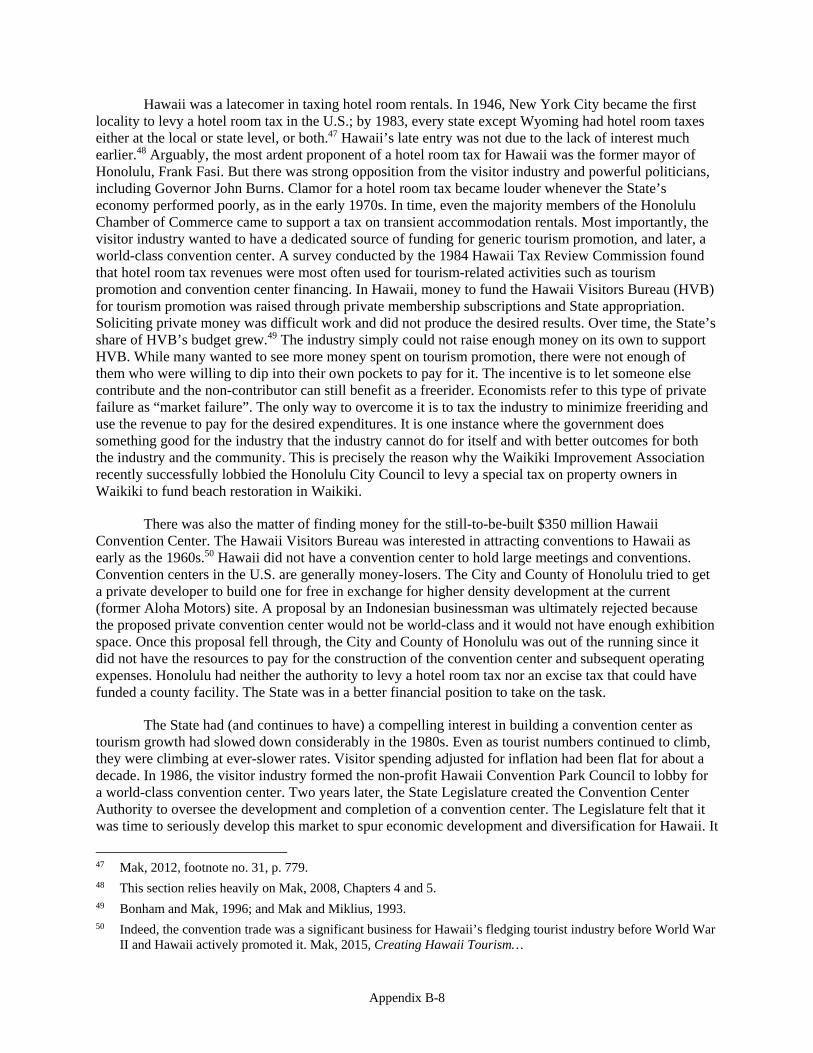
Appendix B-8
Hawaii was a latecomer in taxing hotel room rentals. In 1946, New York City became the first locality to levy a hotel room tax in the U.S.; by 1983, every state except Wyoming had hotel room taxes either at the local or state level, or both.47 Hawaii’s late entry was not due to the lack of interest much earlier.48 Arguably, the most ardent proponent of a hotel room tax for Hawaii was the former mayor of Honolulu, Frank Fasi. But there was strong opposition from the visitor industry and powerful politicians, including Governor John Burns. Clamor for a hotel room tax became louder whenever the State’s economy performed poorly, as in the early 1970s. In time, even the majority members of the Honolulu Chamber of Commerce came to support a tax on transient accommodation rentals. Most importantly, the visitor industry wanted to have a dedicated source of funding for generic tourism promotion, and later, a world-class convention center. A survey conducted by the 1984 Hawaii Tax Review Commission found that hotel room tax revenues were most often used for tourism-related activities such as tourism promotion and convention center financing. In Hawaii, money to fund the Hawaii Visitors Bureau (HVB) for tourism promotion was raised through private membership subscriptions and State appropriation. Soliciting private money was difficult work and did not produce the desired results. Over time, the State’s share of HVB’s budget grew.49 The industry simply could not raise enough money on its own to support HVB. While many wanted to see more money spent on tourism promotion, there were not enough of them who were willing to dip into their own pockets to pay for it. The incentive is to let someone else contribute and the non-contributor can still benefit as a freerider. Economists refer to this type of private failure as “market failure”. The only way to overcome it is to tax the industry to minimize freeriding and use the revenue to pay for the desired expenditures. It is one instance where the government does something good for the industry that the industry cannot do for itself and with better outcomes for both the industry and the community. This is precisely the reason why the Waikiki Improvement Association recently successfully lobbied the Honolulu City Council to levy a special tax on property owners in Waikiki to fund beach restoration in Waikiki.
There was also the matter of finding money for the still-to-be-built $350 million Hawaii Convention Center. The Hawaii Visitors Bureau was interested in attracting conventions to Hawaii as early as the 1960s.50 Hawaii did not have a convention center to hold large meetings and conventions. Convention centers in the U.S. are generally money-losers. The City and County of Honolulu tried to get a private developer to build one for free in exchange for higher density development at the current (former Aloha Motors) site. A proposal by an Indonesian businessman was ultimately rejected because the proposed private convention center would not be world-class and it would not have enough exhibition space. Once this proposal fell through, the City and County of Honolulu was out of the running since it did not have the resources to pay for the construction of the convention center and subsequent operating expenses. Honolulu had neither the authority to levy a hotel room tax nor an excise tax that could have funded a county facility. The State was in a better financial position to take on the task.
The State had (and continues to have) a compelling interest in building a convention center as tourism growth had slowed down considerably in the 1980s. Even as tourist numbers continued to climb, they were climbing at ever-slower rates. Visitor spending adjusted for inflation had been flat for about a decade. In 1986, the visitor industry formed the non-profit Hawaii Convention Park Council to lobby for a world-class convention center. Two years later, the State Legislature created the Convention Center Authority to oversee the development and completion of a convention center. The Legislature felt that it was time to seriously develop this market to spur economic development and diversification for Hawaii. It 47 Mak, 2012, footnote no. 31, p. 779. 48 This section relies heavily on Mak, 2008, Chapters 4 and 5. 49 Bonham and Mak, 1996; and Mak and Miklius, 1993. 50 Indeed, the convention trade was a significant business for Hawaii’s fledging tourist industry before World War
II and Hawaii actively promoted it. Mak, 2015, Creating Hawaii Tourism…

Appendix B-9
would be diversification within an existing industry, one in which Hawaii had already demonstrated considerable competitive advantage. Although the convention center would be located in Honolulu, it was argued that delegates would be enticed to visit the Neighbor Islands before and/or after their meetings; this would persuade the Neighbor Islands to support a statewide hotel room tax. It was a case of mutual interest.
However, when Hawaii’s statewide transient accommodation tax was first implemented in 1987, State lawmakers did not (and likely could not) immediately dedicate revenues from the 5% TAT to Hawaii Visitors Bureau, a private entity.51 The Hawaii Convention Center—a State property—was still not close to being built in 1987; it would be completed 10 years later in October, 1997. In 1990, the Legislature decided to allocate 95% of the revenues from the TAT to the counties, retaining the remaining 5% to defray “TAT-related administrative purposes”. The counties received the following shares: 44.1% to the City and County of Honolulu, 22.8% to Maui County, 18.6% to Hawaii County, and 14.5% to Kauai County.52 The overall distribution rate to the counties would be changed many times over the next two decades.53
As the convention center approached completion, there was no more money to pay for it unless the Legislature took back the TAT revenues from the counties. Instead, the Legislature raised the 5% TAT rate to 6% in 1994 to gain a head start in raising revenue for the convention center, and raised it again to 7.25% in 1999. Raising the TAT rate and dedicating some of it for tourism promotion was one of the recommendations of Governor Ben Cayetano’s Economic Revitalization Task Force in the late 1990s.54 Timeshare units that were rented were now subject to the TAT. TAT money was now divided into 3 pools. The Convention Center Capital Special Fund received 17.3% of the proceeds, the Tourism Special Fund (for marketing) received 37.9%, and the counties received the remaining 44.8%.
General (macro-) economic conditions in the State dictated how the State distributed the TAT revenues. The State Legislature acted more generously in good times; in bad times, the State diverted some of the TAT money for itself. In recent years, capping existing distributions and diverting any excess revenues to the State’s General Fund was one way the State dipped into the TAT revenue pool.55 In lieu of a fixed percentage of the TAT (44.8%), the 2011 Legislature capped the amount of TAT revenue going to the counties at $93 million. In a Conference Committee Report, the Legislature explained that it was part of a package of measures intended to increase and preserve State revenues derived from the TAT because of the State’s extended economic crisis.56
51 No problem. Act 156 signed into law by Governor Ben Cayetano on July 9, 1998, established the public Hawaii
Tourism Authority (HTA) to oversee tourism marketing. 52 The Conference Committee Report on the bill that introduced the county allocations noted that both houses of
the Legislature also considered other taxes as potential candidates for revenue-sharing, including a portion of the public service company tax, animal fines, and unadjudicated traffic and parking fines and forfeitures to the counties, but the Conference Committee argued that “administrative costs and burdens of distributing revenues from several smaller sources will be considerably greater than the costs of distributing from one large source.” The Committee recommended that money should be distributed to the counties in proportion to their population. (The Department of Taxation Presentation handouts—April 1, 2015.) It did not turn out to be that way.
53 State-County WG (TAT) Interim Report DRAFT 11/28/2014, p. 6. at http://auditor.hawaii.gov/task-forceworking-group/
54 Grandy, 2002, Chapter 6. 55 For additional details see State-County WG (TAT) Interim Report DRAFT 11/28/2014 11:44 a.m. at
http://auditor.hawaii.gov/task-forceworking-group/ 56 See State-County WG (TAT) Interim Report DRAFT 11/28/2014, p. 9.

Appendix B-10
U.S. census data show that both Hawaii State and county governments cut their direct spending on current operations between FY2009 and FY2010 and between FY2010 and FY2011 for the counties only (Table 3).
Table 3 State and County Government Direct Spending on Current Operations: 2008–2013
Fiscal Year State Expenditures County Expenditures
(billions of $) % Change (billions of $) % Change 2008 $8.216 — $2.152 — 2009 $8.156 +3.7% $2.246 +4.4% 2010 $8.249 -3.1 $2.235 -0.5 2011 $8.412 +2.0 $2.150 -4.0 2012 $8.435 +0.3 $2.200 +2.3 2013 $8.492 +0.7 $2.258 +2.6
Source: U.S. Census Bureau, Survey of State and Local Government Finances, 2008–2013 at http://www.census.gov/govs/local/
County spending on current operations was 4.9% higher in FY2013 than in FY2008 in current year dollars; State spending on current operations was 3.4% higher. (By comparison, the Honolulu CPI-U was 12.9% higher in FY2013 than in FY2008.)57
Another measure to bolster the State’s treasury (following the Great Recession) was to raise the lodging tax rate and allocate the additional money generated to the State’s General Fund. The TAT tax rate was raised to 8.25% effective July 1, 2009 and to 9.25% temporarily in 2010 (till 2015) but in 2013 the Legislature made it permanent. The new law allocated $93 million to the counties (instead of 44.8% of TAT revenues) but removed the cap. The Convention Center Enterprise Special Fund received $33 million instead of 17.3%, and the Tourism Special Fund received $82 million instead of 34.2%.58 The State kept what was left for itself.
Act 174 (H.B. No. 1671) enacted in 2013 to take effect on July 1, 2014 allocated $103 million to the counties in FY 2014-15, the same amount in FY 2015-16, and (back down to) $93 million for each fiscal year thereafter. The City and County of Honolulu would receive 44.1%; Maui County, 22.8%; Hawaii County, 18.6%; and Kauai County, 14.5%, the same shares as in 1990.59
Through all of the above changes, nominal TAT revenues collected by the State increased by more than six-fold, from $67.3 million in FY1988 to $421 million in FY2015.60 During those 28 years, 57 Looking at general revenues, general revenues declined for the State between FY2008 and FY2009 (-3.2%) and
again between FY2011 and FY2012 (-1.9%); general revenues declined for the counties (as a whole) between FY2011 and FY2012 (-.5%). General revenues were 16.4% higher in FY2013 than in FY2008 for the State and 25.6% higher for the counties.
58 See State-County WG (TAT) Interim Report DRAFT 11/28/2014, p. 11. 59 Twenty-Seventh State Legislature, Second Special Session of 2013. Act 174, p. 613. In 2015, a bill was
introduced in the Senate (SB408) that would again change the amounts allocated to the counties from a specific sum to a percentage of the revenues collected. The WG asked the Legislature to defer a decision until it finished its work mandated by Act 174.
60 Department of Taxation Presentation handout, April 1, 2015.

Appendix B-11
and through some trying times, collections declined in only four of those years, 1991, 1994, 2002, and 2009. The largest percentage decline in a single year was in FY2002 at 11.1%, followed by FY2009 at 8.2%.
Adjusted for inflation, TAT collections increased by 2.7 fold from $99.6 million to $270.7 million in (constant) year 2000 dollars.61 Inflation-adjusted (real) TAT revenues declined during 7 fiscal years, 1991, 1993–1994, 2002, and 2007–2009. The increase in TAT revenues was in part fueled by several tax rate increases. A useful metric is the implied tax base that measures the lodging industry’s taxable gross income.62 It provides some indication of the financial health of the lodging industry. Table 3 displays TAT collections and the associated tax bases in both nominal and constant (year 2000) dollars for FY2000 to FY2015. FY2000 was chosen as the starting point because the State claimed almost none of the TAT revenues for its General Fund in that year.
Table 4 Nominal and Real TAT Revenues and Bases, FY2000–FY2015
(Millions of $)
Fiscal Year TAT Collections Implied Tax Base
Nominal Real Nominal Real 2000 $168.6 $168.6 $2,326 $2,326 2001 $$177.2 174.8 2,444 2,410 2002 $157.6 153.6 2,174 2,119 2003 $170.9 164.5 2,357 2,269 2004 $181.9 176.4 2,509 2,434 2005 $198.8 $192.6 2,742 2,657 2006 $217.0 $194.4 2,993 2,571 2007 $224.9 $183.4 3,102 2,530 2008 $229.4 $178.4 3,164 2,460 2009 210.6 160.6 2,714 2,070 2010 224.3 167.0 2,563 1,908 2011 284.5 204.2 3,076 2,208 2012 323.9 229.4 3,502 2,480 2013 368.6 253.9 3,985 2,744 2014 395.2 270.7 4,272 2,926 2015 421.0 284.8 4,551 3,079
Note: “Real” is measured in year 2000 dollars. Source: Department of Taxation (DOTAX) and author’s calculations.
61 Although imperfect, I used the Honolulu CPI-U as the deflator. Since the TAT revenue data are for fiscal years,
I converted the annual CPI-U to a fiscal year basis. For example, for FY1987, I averaged the first half CPI-U for 1987 and the second half CPI-U for 1986, and so on. CPI-U data came from the 2014 State of Hawaii Data Book.
62 This is done by dividing the annual TAT revenues by the applicable tax rate. Tax Revenue=Tax Base × Tax Rate.

Appendix B-12
Table 4 shows that Hawaii now collects about $421 million in TAT revenues from taxable lodging industry room revenues of nearly $4.6 billion. The lodging industry faced tough times during the second half of the 2000-decade as real TAT tax base declined every year between 2005 and 2010. Typically, in the private sector, falling demand leads to lower prices. In Hawaii, lower demand for lodging led to higher tax rates on lodging (in 2009 and 2010).
V. Allocating TAT Revenues between the State and the Counties
The allocation of TAT revenues between the State and the counties involves two tasks: (1) Determining the share of total TAT revenues that goes to the counties and the share that goes to the State; (2) determine the division of the county shares among the 4 counties. We begin with task (2).
In deciding how best to allocate TAT revenues, several guiding principles might be helpful. The final allocation model should:
1. Comply with enabling statute.
2. Strive to achieve the goals established for the TAT.63
3. Provide a predictable stream of revenues to facilitate budgeting.
4. Be (perceived to be) fair.
5. Strive to achieve economic efficiency.64
6. Be simple (low cost) to administer.65
7. Be politically accepted.
V.1 Dividing Counties’ Share of TAT Revenues Among the Four Counties
The task of dividing the counties’ share of TAT revenues among the four counties likens to playing a zero sum game. If one county gets more, the others must get less. During the 1980s there were several proposals on how best to allocate appropriated state aid among Hawaii’s counties. A 1984 proposal by the City and County of Honolulu for a state revenue sharing program suggested the following distribution: Honolulu, 43.6%; Maui, 18.3%; Hawaii, 20.7%; and Kauai, 17.4%.66 In 1987, the Hawaii State Association of Counties proposed the following formula: 50% to Honolulu, 17.5% to Maui, 18.5% to Hawaii, and 14% to Kauai.67 In 1989 the Governor proposed to allocate tobacco and liquor tax collections and $20 million in TAT appropriation as follows: City and County of Honolulu, 46.5%; Maui County, 23%; Hawaii County, 16.3%, and Kauai County, 14.2%. Actual distributions of state aid to the counties in FY1987 were 37.2% to Honolulu; 24.3% to Maui; 25.1% to Hawaii, and 13.3% to Kauai. In FY 1989, Honolulu’s share rose to 42.6%; Maui declined to 16.5%; Hawaii declined to 23.8%; and Kauai 63 Thus, if the intent of the TAT is to fund tourism marketing and a convention center, then both should be
adequately funded. 64 This implies generating the greatest social good for the community. 65 Principles 4 and 5 may conflict, and compromise may be necessarily. 66 ACIR, 1989, p. 151. 67 ACIR, 1989, p. 151.

Appendix B-13
increased to 17.1%. How these percentages were determined is a mystery.68 Obviously, none of the above proposals employed population as the principal method of distribution. In 1980 the City and County of Honolulu had 79% of the State’s total resident population; Maui County, 7.4%; Hawaii County, 9.5%; and Kauai County, 4.1%.69 Allocation from the TAT to the counties began in FY 1991 ($62.8 million), to the convention center in FY 1996 ($19.3 million) and to tourism promotion in FY 1999 ($29 million).70 The current distribution of TAT revenues among the four counties is as follows: 44.1% to the City and County of Honolulu, 22.8% to Maui County, 18.6% to Hawaii County, and 14.5% to Kauai County.
There was some sentiment among the Working Group members that the current formula is a fair formula and that the Working Group should leave it alone and, instead, focus on the division of TAT revenues between the State and the counties as a group. Arguably, there is some empirical evidence to support that. Table 5 displays the current distribution among the four counties and the shares of selected population and fiscal variables for the four counties.
Table 5 Current County Shares of TAT vs Shares of Selected County Variables: 2014
Honolulu Maui Hawaii Kauai Current TAT Distribution 41.1% 22.8% 18.6% 14.5% Individual County Shares of the Total for all Counties By:
Resident Population 69.9% 11.5% 13.7% 5.0% De Facto Population* 66.8% 13.5% 13.5% 5.8% Total Operating Expenditures 69.4% 11.7% 13.4% 5.5% Daily Visitor Census 46.7% 27.2% 14.6% 11.5% Visitor Plant Inventory 48.7% 25.4% 14.5% 11.5% Situs (Source of TAT Revenue) 48.9% 29.3% 12.5% 9.3% County Expenditures on Visitors 49.1% 25.1% 13.1% 12.8%
Note: (*) De facto population includes the number of visitors present and subtracts the number of residents who are temporarily away from the State. The percentages do not always add up to 100% due to rounding. Sources: Population (resident, de facto and tourist) data from State of Hawaii 2014 Data Book; visitor plant inventory from HTA 2014 Visitor Plant Inventory; TAT revenue by county of generation from Department of Taxation; and county operating expenditures (total and on visitors) from WG handout dated 6-3-15.
In Table 5, the county variables that appear to most closely correlate with the current distribution of the TAT among the four counties are the visitor daily census and the visitor plant inventory. Both variables, not surprisingly, are also highly correlated with each other. Also both variables are highly correlated with where TAT revenues are actually generated and county expenditures on visitors. More tourists (and more lodging units) mean more total spending on lodging and, thus more TAT revenues are generated. Likewise, more tourists mean higher demand for public services. Total population (resident or de facto) is not highly correlated with the current TAT distribution formula but it is highly correlated with total county government operating expenditures. Again, not surprising. More people means greater 68 ACIR, 1989, p. 151. 69 State of Hawaii Data Book for 2014, Table 1.01. 70 Department of Taxation Presentation to the WG handout—April 1, 2015. The amount allocated to tourism
increased to $63.9 million in FY 2000.

Appendix B-14
demand for total public services. Thus “population” is a good proxy variable for total public service “needs”. The daily visitor census and visitor plant inventory are good proxy variable for tourist demand for lodging and public service needs of visitors. To the extent that the current TAT revenue distribution formula approximately mirrors where revenues are actually generated and spent can understandably be judged as a “fair” distribution. Thus, leaving the current distribution formula unchanged may not be a poor decision.
Finally, a comparison of the distribution by situs with the current TAT distribution formula indicates that there is still some revenue redistribution going on among the counties. Revenues are still being diverted from Honolulu and Maui to Hawaii and Kauai, but not by much. The current (percentage) division of TAT revenues is the same as that in 1990, but around 1990 Honolulu generated 60% of total TAT revenues; Maui, 23%; Hawaii, 9%; and Kauai, 8%.71
V.2 TAT Revenue Sharing Between the State and the Counties
Table 6 shows the amount of TAT revenues divided among four pools: the counties, the convention center, tourism, and the State’s General (G-) Fund between FY2000 and FY2014. The numbers in ( ) are the percentages of allocated money in each pool, which add up to 100%. The current process of allocating TAT money to the four pools is best described in Act 174 as follows: The State Legislature first appropriates money to the counties, the convention center, and tourism; the difference between what is collected and the amounts allocated to the first three pools is distributed to the General Fund. The amounts allocated to the counties, the convention center and tourism for the next few fiscal years are already known; the amounts going into the G-Fund are not known.
Table 6 shows that from virtually nothing in FY2000, the State now controls almost 50 percent—indeed, the largest pool--of total TAT revenues. By comparison, the counties’ share of total TAT revenues has declined from 44.7% in FY2000 to less than 25% (24.5%) in FY2015. If the State’s current allocation policy remains unchanged, and total TAT collections continue to rise, the gap between the counties’ and the State’s shares will widen further.
For the counties, nominal TAT revenues climbed steadily between FY2000 and FY2015, except in 2002 and in 2009. In FY2015, the counties received nearly $28 million more than they did in FY2000, but not in constant dollars (Table 6).
71 Kalapa, 1992, p 42.

Appendix B-15
Table 6 Distribution of TAT Revenues: FY2000-FY2017
(Millions of current dollars)
Fiscal Year Counties Convention
Center Tourism G-Fund Total
2000 $75.4 $29.2 $63.9 $0.2 $168.6 (44.7%) (17.0%) (21.3%) (0.1%) (100%)
2001 $79.4 0 $67.1 $30.7 $177.2 (44.8) (0) (37.9) (17.3) (100)
2002 $70.6 0 $59.7 $27.3 $157.6 (44.8) (0) (37.9) (17.3) (100)
2003 $76.5 $29.6 $63.3 $1.5 $170.9 (44.8) (17.3) (37.0) (0.9) (100)
2004 $81.4 $31.5 $63.3 $5.6 $181.9 (44.8) (17.3) (34.8) (3.1) (100)
2005 $89.1 $32.5 $64.8 $12.4 $198.8 (44.8) (16.4) (32.6) (6.2) (100)
2006 $97.2 $32.7 $70.7 $16.4 $217.0 (44.8) (15.1) (32.6) (7.6) (100)
2007 $100.8 $33.8 $73.3 $17.1 $224.9 (44.8) (15.0) (32.6) (7.6) (100)
2008 $102.8 $32.5 $78.2 $15.9 $229.4 (44.8) (14.1) (34.1) (7.0) (100)
2009 $94.4 $30.7 $72.0 $13.6 $210.6 (44.8) (14.6) (34.2) (6.4) (100)
2010 $90.6 $32.8 $69.1 $31.7 $224.3 (40.4) (14.6) (30.8) (14.1) (100)
2011 $102.9 $36.8 $85.0 $59.8 $284.5 (36.2) (12.9) (29.9) (21.0) (100)
2012 $93.0 $35.6 $69.0 $126.3 $323.9 (28.7) (11.0) (21.3) (39.0) (100)
2013 $93.0 $33.0 $71.0 $171.6 $368.6 (25.2) (9.0) (19.3) (46.6) (100)
2014 $93.0 $33.0 $82.0 $187.2 $395.2 (23.5) (8.4) (20.7) (47.4) (100)
2015 $103.0 $33.0 $82.0 $203.0 $421.0 (24.5) (7.8) (19.5) (48.2) (100)
2016 $103.0 $33.0 $82.0 2017 $93.0 $33.0 $82.0
Note: The numbers in ( ) represent % of the total TAT revenues in that year. Sources: Department of Taxation (DOTAX) and Act 174.

Appendix B-16
Table 7 presents TAT revenues received by the counties in constant (year 2000) dollars between FY2000 and FY2015. The data show long-run erosion in the purchasing power of TAT revenues received by the counties. The counties’ TAT revenues were nearly $6 million less in FY2015 than in FY2000, after adjusting for inflation, and $22 million less than in 2005.
Table 7 County TAT Revenues in Constant (Year 2000) Dollars: FY2000–FY2015
(Millions of $)
Year Amount Year Amount 2000 $75.4 2008 $79.9 2001 $78.3 2009 $72.0 2002 $68.8 2010 $67.5 2003 $73.6 2011 $73.9 2004 $79.0 2012 $65.9 2005 $86.3 2013 $64.0 2006 $83.5 2014 $63.7 2007 $82.2 2015 $69.7
Source: Author’s calculations
In enacting Act 174, State lawmakers seek recommendation on how best to allocate TAT revenues between the State and the counties in a manner “that properly reflects the division of duties and responsibilities relating to the provision of public services taking into account their respective spending responsibilities in providing public services.” The legislative language can be interpreted in several ways. The following three scenarios appear to comply with its mandate:
Scenario A: A simple split of 25% for the counties and 75% for the State as reflected in their respective spending responsibilities (Table 1). (The counties’ share is roughly the same as the actual split in FY2014—i.e. 23.5%). The State would be responsible for all expenditures related to the convention center and tourism promotion. If Scenario A were in place in FY2014, the counties would have received $98.8 million instead of the $93 million actually received. Hawaii’s own data for FY2014 indicate that the counties accounted for 22% of total State and county operating expenditures implying that county TAT revenues would have been $86.9 million, or less than what was actually received.
Scenario B: In this scenario, the counties’ share of total TAT revenues would be permitted to grow to cover costs due to increased workload and inflation, but not to cover the additional costs of new programs and/or improvements in quality and/or scope of existing programs. This is accomplished by applying the growth in de facto population (a proxy variable for work-load) and an inflation factor to TAT revenues in a base year to determine future county TAT revenues. For new expenditure initiatives, the counties would have to go to the Legislature and request additional funding.
The base year selected is (again) FY2000 when the State’s share was virtually zero. Between FY2000 and FY2014, Hawaii’s de facto population increased by 16.7 percent and prices (Honolulu CPI-U) increased by 46%. By adjusting for changes in the work-load and inflation, the counties’ share of TAT revenues would have risen from $75.4 million in FY2000 to $122.7 million in FY2014, or 31.0% of the actual total amount collected in FY2014.

Appendix B-17
Scenario C. This scenario is the same as Scenario B except it replaces de facto population by the average daily census of visitors.72 It assumes that TAT revenues are intended to defray county expenditures on tourism related expenses.73 Under Scenario C, the counties’ share of TAT revenues would have been $126.4 million in FY2014, or about 32% of total collections in that year.
The Investigative Committee of the Working Group has offered its own recommendation.74 It suggests that the amount for tourism marketing should first be subtracted from total TAT collections. Then take 90% of the balance and allocate 60% to the State and 40% to the counties, but in either case, no less than $100 million each.75 The State would be responsible for expenses related to the convention center and all other State spending initiatives. The Committee explained that, instead of a flat sum, this formula allows the counties to share in future increases in (total) TAT collections. If this formula were in place in FY2014, the counties would have received $112.75 million or 28.5 % of total TAT collections.
Finally, since expenditure priorities/responsibilities change over time with changing consumer demand for public services, periodic review of existing allocation formula should be conducted.
72 Between 2000 and 2014, the average daily census of visitors increased by 13.1% in the City and County of
Honolulu, 27.3% in Maui County, 30.8% in Kauai County, and 37.5% in Hawaii County. (From the 2000 and 2014 Annual Visitor Research Report at http://dbedt.hawaii.gov/visitor/visitor-research/) I calculated a weighted average increase for the 4 counties using the average daily census figures for each county in 2014 as weights.
73 They are not. TAT revenues have historically been used by the counties and the State as they wished. It is noteworthy that the counties also derive other revenues from tourism besides their share of TAT revenues. In FY2014, the counties collectively generated property taxes of $196.168 million from hotels/resorts, $19.246 million from vacation rentals, and $23.067 million from timeshares for a total of $238.481million.(https://www.realpropertyhonolulu.com/portal/rpadcms/Reports?parent=REPORTS) These figures do not include property taxes collected on other tourism related businesses such as restaurants, gift shops, commercial visitor attractions, and so on. By comparison, the four counties spent a total of $235.806 million on tourism in FY2014. At the State level, tourism accounted for 18.7% of total general excise tax (GET) revenues collected in 2014 (A special tabulation by State chief economist, Eugene Tian at the author’s request.), or about $528 million. Indeed, almost all taxes levied in Hawaii are in varying degrees passed on to tourists (Miklius, Moncur and Leung, 1989). In calendar year (CY) 2014, spending by tourists directly generated more than $1 billion in total taxes for the State treasury, and nearly $1.3 billion if we include “indirect” taxes. By contrast, the State spent—directly and “indirectly”--$453.2 million on tourism in FY2014. If the expenditure figures are accurate, tourists and the tourism industry pay far more taxes to the State and the counties (not counting the TAT revenues) than amounts spent on them. Thus, TAT allocation is not really exclusively about generating revenue to defray the cost of government spending on tourism.
74 Memo to Chair Acoba, Members, State-County Functions Working Group (TAT) from Ray Soon, Members of the Allocation Models Investigative Group, ”Report on our Progress to Date,” dated May 29, 2015, p. 3 (WG handout on 6-3-2015)
75 The 40-60 split is very roughly based on the ratio of the counties’ operating expenditures on tourism and the State’s operating expenditures on tourism. In FY2014, the counties were estimated to have spent $235.8 million on tourism (34.2%) while the State spent an estimated $453.2 million (65.8%).

Appendix B-18
References
Advisory Commission on Intergovernmental Relations (ACIR). 1989. “Intergovernmental Fiscal Relations in Hawaii,” Tax Review Commission Working Papers and Consultant Studies,” Volume 2, Honolulu: Tax Review Commission, December, pp. 139-152.
Advisory Commission on Intergovernmental Relations (ACIR). 1980. The State of State-Local Revenue Sharing, M-121. Washington D.C.: USGPO.
Advisory Commission on Intergovernmental Relations. (ACIR). 1977. The States and Intergovernmental Aids. A-59. Washington D.C.: ACIR, February).
Advisory Commission on Intergovernmental Relations. (ACIR). 1974. General Revenue Sharing, an ACIR re-evaluation. A-48. Washington D.C.: USGPO: October.
Bonham, Carl and James Mak. 1996. “Private versus Public Financing of State Destination Promotion,” Journal of Travel Research, 35 (2), pp. 3-10.
Bonham, Carl, Edwin Fujii, Eric Im and James Mak. 1992. "The Impact of the Hotel Room Tax: An Interrupted Time Series Analysis," National Tax Journal, December, 45 (4), pp.433-442.
Bradbury, Katharine L., Helen F. Ladd, Mark Perrault , Andrew Reschovsky, and John Yinger. 1984. “State Aid to Offset Fiscal Disparities Across Communities,” National Tax Journal, Vol. XXXVII, No. 2, pp. 151-170.
Campbell, Colin. 2015. “North Carolina Senate backs job incentives, sales tax distribution change.” The News & Observer, August 10 at http://www.newsobserver.com/news/politics-government/state-politics/article30664695.html (Accessed on August 22, 2015).
Dilger, Robert Jay. 2015. Federal Grants to State and Local Governments: A Historical Perspective on Contemporary Issues. Washington D.C.: Congressional Research Service, March 5.
Fisher, Ronald C. 2010. “The State of State and Local Government Finance,” Regional Economic Development, Federal Reserve Bank of St. Louis, 6 (1), pp. 4-22.
Fisher, Ronald C. and Andrew Bristle. 2012. “State Intergovernmental Grant Programs,” in Robert D. Ebel and John E. Petersen. The Oxford Handbook of State and Local Government Finance, New York: Oxford University Press.
Grandy, Christopher. 2002. Hawaii Becalmed: Economic Lessons of the 1990s. Honolulu: University of Hawaii Press.
Kalapa, Lowell L. 2013. Weekly Commentary: Share Loss of TAT Could Spell Increased TAT, November 3, Honolulu: Tax Foundation of Hawaii.
Kalapa, Lowell L. 1992. “ Why is it that the State seems to ‘bully’ the counties?” in Randall W. Roth, (ed.). The Price of Paradise, Volume 1, Honolulu: Mutual Publishing, pp. 47-51.
Kalapa, Lowell L. 1992. “Do neighbor islanders get their fair share of benefits from the State?” in Randall W. Roth, (ed.). The Price of Paradise. Volume 1, Honolulu: Mutual Publishing, pp. 41-45.

Appendix B-19
Lavelle, Martin. 2014. “Understanding trends in state revenue sharing with local governments in Michigan.” Chicago Fed Letter, No. 329, December.
Mak, James. 2008. Developing a Dream Destination: Tourism and Tourism Policy Planning in Hawaii. Honolulu: University of Hawaii Press.
Mak, James. 2012. “What Should Be the Appropriate Tax Base for OTC’s Hotel Room Sales?” State Tax Notes, September 17, pp. 775-786.
Mak, James. 2015. “Are hotel property taxes fully passed on to hotel guests? Implications from recent research on property tax incidence,” Tourism Economics, 21(4), pp. 899-905.
Mak, James. 2015. Creating “Paradise of the Pacific”: How Tourism Began in Hawaii, University of Hawaii Economic Research Organization (UHERO) Working Paper No. 2015-1. Honolulu: February 17.
Mak, James and Walter Miklius. 1993. “Why can’t the tourist industry pay for travel promotion and a convention center?” in Randall W. Roth, (ed.). The Price of Paradise, Volume II, Honolulu: Mutual Publishing, pp. 95-99.
Michel, Erica. 2012. “State Lodging Taxes. Legisbrief. National Conference of State Legislatures, Vol. 20, No. 14, Denver: April.
Michigan Department of Treasury, Michigan State Revenue Sharing at http://www.michigan.gov/treasury/0,4679,7-121-1751_2197-5658--,00.html (Accessed on 8/23/15
Miklius, Walter, James E. T. Moncur and PingSun Leung. 1989. “Distribution of State and Local Tax Burden by Income Class,” Tax Review Commission Working Papers and Consultant Studies,” Volume 2, Honolulu: Tax Review Commission, December, pp. 7-20.
National Conference of State Legislatures (NCLS). 2015. State Aid to Local Governments. At http://www.ncsl.org/research/fiscal-policy/state-aid-to-local-government-update.aspx (Accessed 9/1/2015)
Nguyen-Hoang, Phuong, and Yilin Hou. 2003. “Local Fiscal Responses to Procyclical Changes in State Aid,” Publius: The Journal of Federalism, doi:10.1093/publius/pjt039, pp. 1-22.
Schmitt, Robert. 1977. Historical Statistics of Hawaii. Honolulu: University Press of Hawaii.
Tennessee Advisory Commission on Intergovernmental Relations (TACIR). 2004. State Tax Sharing, Fairness, and Local Government Finance in Tennessee. Nashville: TACIR, January.
U.S. Census Bureau, Local Government Finances by Type of Government, 2012. Local governments in Hawaii also received $279 million in aid from the Federal Government. At: http://factfinder.census.gov/faces/tableservices/jsf/pages/productview.xhtml?src=bkmk
U.S. Census Bureau, Survey of State and Local Government Finances, 2008-2013. At http://www.census.gov/govs/local/


Appendix C County Duties And Responsibilities
Investigative Group Report


Appendix D State Duties And Responsibilities
Investigative Group Report


Appendix E Visitor Industry
Investigative Group Report


Appendix F Additional Expenditures Analyses


Appendix F-1
EXHIBIT 1: NET EXPENDITURES, STATE AND COUNTIES, FY 2014
Directly Related to Tourism
Indirectly Related to Tourism,
but Essential
Support to Line
Agencies
Not Related to Tourism
TOTAL SPENDINGHonolulu City&County $475,104 $278,903 $85,774 $839,781Maui County $128,735 $123,341 $13,977 $266,053Hawai‘i County $159,536 $58,898 $12,911 $231,346Kaua‘i County $105,873 $26,204 $5,389 $137,465All Counties $869,249 $487,345 $118,051 $1,474,645State of Hawai‘i $958,798 $4,936,414 $239,760 $6,134,972Total Spending $1,828,047 $5,423,759 $357,811 $7,609,617
% State of Hawai‘i 52% 91% 67% 81%% All Counties 48% 9% 33% 19%Honolulu City&County $565,988 $272,685 $85,774 $817,644Maui County $129,996 $123,341 $13,163 $263,586Hawai‘i County $159,536 $58,798 $12,911 $226,941Kaua‘i County $101,745 $26,204 $5,612 $130,335All Counties $957,265 $481,027 $117,461 $1,438,507State of Hawai‘i $805,041 $4,936,414 $100,926 $6,841,045Total Spending $1,762,306 $5,417,441 $218,387 $8,279,552% State of Hawai‘i 46% 91% 46% 83%% All Counties 54% 9% 54% 17%NOTES: Expenditures are shown as positive, revenues as negative. All dollar valuesare thsouands of current dollars. Totals used to generate ratios in Table 1 are in boldface. * For "All Activities," Total Spending column includes component units aswell as primary government and business-type activities.
GOVERNMENT ACTIVITIES ONLY
ALL ACTIVITIES *
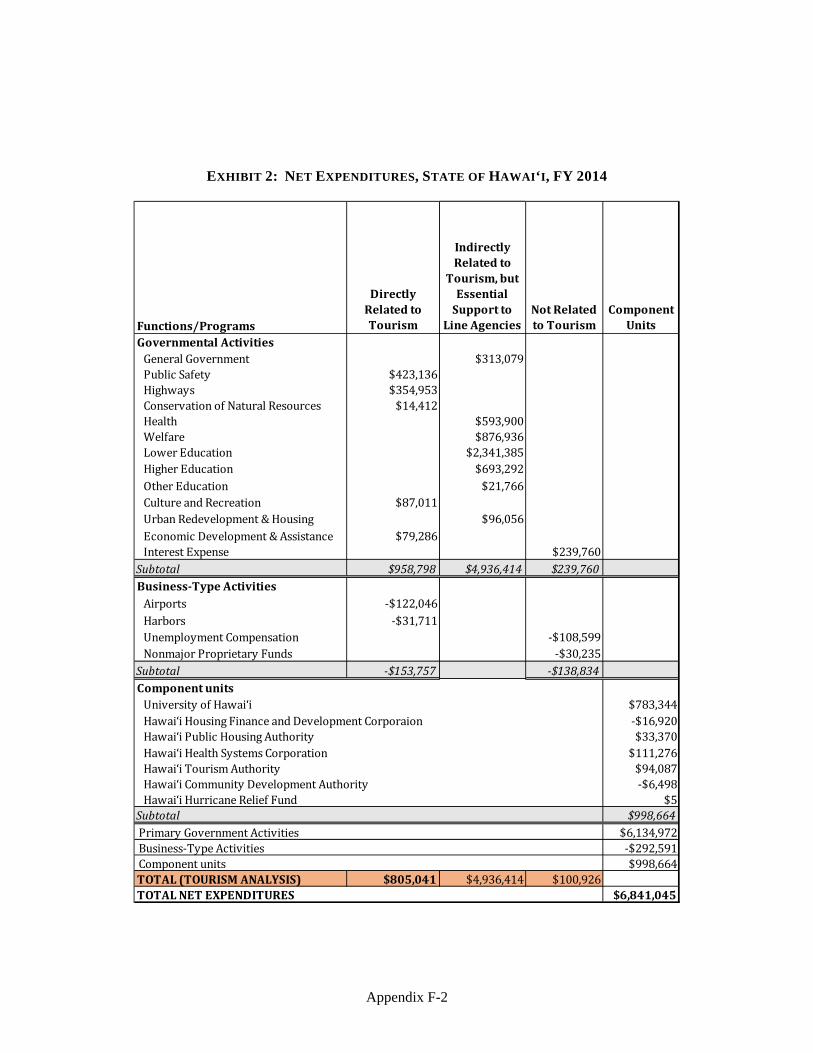
Appendix F-2
EXHIBIT 2: NET EXPENDITURES, STATE OF HAWAI‘I, FY 2014
Functions/Programs
Directly Related to Tourism
Indirectly Related to
Tourism, but Essential
Support to Line Agencies
Not Related to Tourism
Component Units
Governmental ActivitiesGeneral Government $313,079Public Safety $423,136Highways $354,953Conservation of Natural Resources $14,412Health $593,900Welfare $876,936Lower Education $2,341,385Higher Education $693,292Other Education $21,766Culture and Recreation $87,011Urban Redevelopment & Housing $96,056Economic Development & Assistance $79,286Interest Expense $239,760Subtotal $958,798 $4,936,414 $239,760Business-Type ActivitiesAirports -$122,046Harbors -$31,711Unemployment Compensation -$108,599Nonmajor Proprietary Funds -$30,235Subtotal -$153,757 -$138,834Component unitsUniversity of Hawai‘i $783,344Hawai‘i Housing Finance and Development Corporaion -$16,920Hawai‘i Public Housing Authority $33,370Hawai‘i Health Systems Corporation $111,276Hawai‘i Tourism Authority $94,087Hawai‘i Community Development Authority -$6,498Hawai‘i Hurricane Relief Fund $5Subtotal $998,664 Primary Government Activities $6,134,972 Business-Type Activities -$292,591 Component units $998,664TOTAL (TOURISM ANALYSIS) $805,041 $4,936,414 $100,926TOTAL NET EXPENDITURES $6,841,045

Appendix F-3
EXHIBIT 3: NET EXPENDITURES, CITY AND COUNTY OF HONOLULU, FY 2014
Functions/Programs
Directly Related to Tourism
Indirectly Related to Tourism,
but Essential
Support to Line
Agencies
Not Related to Tourism
Component Units
Governmental ActivitiesGeneral Government $280,220Public Safety $357,331Highways and Streets $38,768Sanitation $3,724Human Services $2,675Culture and Recreation $75,281Utilities or Other Enterprises -$3,992Interest $85,774Subtotal $475,104 $278,903 $85,774Business-Type ActivitiesHousing -$6,218Sewer -$118,881Solid Waste $63,949Public Transportation $145,816Subtotal $90,884 -$6,218 $0Component unitsBoard of Water Supply -$18,327HART -$88,476Subtotal -$106,803 Primary Governmental Activities $839,781 Business-Type Activities $84,666 Component Units -$106,803TOTAL (TOURISM ANALYSIS) $565,988 $272,685 $85,774TOTAL NET EXPENDITURES $817,644

Appendix F-4
EXHIBIT 4: NET EXPENDITURES, MAUI COUNTY, FY 2014
Functions/Programs
Directly Related to Tourism
Indirectly Related to Tourism,
but Essential Support to Line
Agencies
Not Related to Tourism
Component Units
Governmental ActivitiesGeneral Government $101,786Public Safety $78,335Highway and Streets $14,086Sanitation $3,795Social Welfare $21,555Culture and Recreation $32,519Legislative $5,995Interest on long-term debt $7,982Total $128,735 $123,341 $13,977Business-Type ActivitiesHousing, Funds -$814Municipal Golf Course $1,260Total $1,260 $0 -$814Component Unit *Department of Water Supply -$2,913 Primary Government Activities $266,053 Business-Type Activities $447 Component Units -$2,913TOTAL (TOURISM ANALYSIS) $129,996 $123,341 $13,163TOTAL NET EXPENDITURES $263,586NOTE: * The Maui County CAFR lists the Department of Water Supply as a Business-typeactivity. It is treated here as a Component Unit in line with the practice for otherjurisdictions in Hawai‘i.

Appendix F-5
EXHIBIT 5: NET EXPENDITURES, HAWAI‘I COUNTY, FY 2014
Functions/Programs
Directly Related
to Tourism
Indirectly Related to Tourism,
but Essential
Support to Line
Agencies
Not Related to Tourism
Component Units
Governmental ActivitiesGeneral Government $49,350Public Safety $138,157Highway and Streets -$25,298Health, Education, and Welfare $9,549Culture and Recreation $15,114Sanitation $31,564Interest on long-term debt $12,911Total $159,536 $58,898 $12,911Business-Type ActivitiesHealth, Education, and Welfare -$100Total $0 -$100 $0Component UnitWater -$4,304 Primary Government Activities $231,346 Business-Type Activities -$100 Component Units -$4,304TOTAL (TOURISM ANALYSIS) $159,536 $58,798 $12,911TOTAL NET EXPENDITURES $226,941

Appendix F-6
EXHIBIT 6: NET EXPENDITURES, KAUA‘I COUNTY, FY 2014
Functions/Programs
Directly Related to Tourism
Indirectly Related to Tourism,
but Essential
Support to Line
Agencies
Not Related to Tourism
Component Units
Governmental ActivitiesGeneral Government $21,711Public Safety $51,428Public Works $10,473Highways and Streets $14,096Sanitation $17,397Culture and Recreation $12,480Public Welfare $4,492Interest on long-term debt $5,389Total $105,873 $26,204 $5,389Business-Type ActivitiesHousing Programs $223Sewer -$4,991Golf $864Total -$4,128 $0 $223
Component UnitWater -$3,226 Primary Government Activities $137,465 Business-Type Activities -$3,904 Component Units -$3,226TOTAL (TOURISM ANALYSIS) $101,745 $26,204 $5,612TOTAL NET EXPENDITURES $130,335

Appendix G Allocation Models
Investigative Group Report


May 29, 2015
Memorandum
TO: Chair Acoba
From: Members, State County Functions Working Group (TAT) Ray Soon
Re: Members of the Allocation Models Investigative Group Report on our Progress to Date
Your investigative group met on Thursday, May 215t. Present were Sandy Baz, Mary Alice Evans, Ed Case
and Ray Soon. We enjoyed a spirited and informative discussion. We centered our discussion around the following optional allocation models:
1. Allot the TAT funds according to the proportionate share of tourism expenses incurred by the Counties and the State
The basic concept is to figure out the total public expenditures (operating) and the proportionate share of that total attributable to the State and to the Counties. We would then allocate all TAT by those percentages.
The primary strengths of this approach are that it is simple and that it appears to be the logical extension of the instructions of the legislation setting up the TAT working group; so is, therefore, probably most acceptable. The primary weakness lies in the difficulty in estimating the expenditures in both the County and the State. The exercise that we just completed is characterized by gross estimates, which, if they are truly to determine the proportions, demand more precision than we can give them in the remaining time we have available.
2. Allot the TAT funds according to the historical intent of the TAT legislation passed over the years
The basic concept is the revisit the Legislative intent from the TAT's beginnings. Where the intent is unclear; we would make assumptions. Using this approach, the model could look something like:
A. Using 9.25% as the total TAT charge, take the first 5.0 percentage points each year and allocate 95% of it to the Counties and 5% to the State as originally legislated in Act 185 in 1990, the first year in which an allocation was envisioned.
B. Take the next 2.5 percentage points each year and allocate it to the amortization of the Convention Center and to the HTA for expenses as it appears to be envisioned in subsequent legislation, notably Act 156 in 199.8.
C. Take the final 2.0 percentage points each year and allocate it to the State in its entirety as envisioned by Act 5 in 2009.

Memo to the State-County Functions Working Group May 29, 2015 Page 2
The primary strength of this approach is that it honors the evolutionary history of the tax. A significant weakness lies in the gaps in intent and in the reality that, intent changes over time. Another weakness is that the historical model is not responsive to the Legislative mandate for the working group.
3. Use the current allotments as a guide, and account for the political reality that the State Legislature will want to fund other uses out of the TAT.
The basic approach is to lock in a set amount of funds for the Counties, the Convention Center, the HTA and the DLNR (each year add inflation). There would be an implied commitment that these allotments would never go down. Set aside an additional 2% to the State to cover the costs of collection, management and distribution. Take the remainder and leave it in the pot for the Legislature to appropriate according to the needs of the current time.
The primary strengths of this approach is that it gives certainty to the Counties, the HTA and the DLNR and that it reflects the political reality that the Legislature will always want to use parts of the TAT for other expenses. The primary weakness is that during growth periods, the Counties would have to accept that they would be locked in to a set amount; no upside.
4. The final basic model we looked at was not to mess with allocation models, but simply to disperse to the Counties the authority to tax the visitors.
The basic concept is to have the State and the County both tax the industry, much like both currently collect a fuel tax.
The primary strengths of the approach are that it fosters a greater sense of "home rule" and that it removes the annual petitioning by the Counties to the Legislature. The primary weaknesses are that the industry will have five legislative bodies with which to deal on TAT matters and the tax can be applied inconsistently, leading to confusion.
Each of these models have multiple variations which can lead to different results. In addition, the group did not conclude from which pot the current non-County, non-State set asides should get their funds. The closest we came to agreement was that 1) HTA expenses benefitted all Counties and the State as a whole and therefore should be covered by everyone, 2) the Convention Center expenses did not directly benefit the Neighbor Islands and they should not be required to pay for it, and 3) the DLNR set asides were State expenses and should come from that pot.

Memo to the State-County Functions Working Group May 29, 2015 Page 3
RECOMMENDATION
After much discussion, the investigative group decided that they would prefer to make a recommendation to the full Working Group. This was not a required outcome when the group was formed, but we felt it was a natural culmination to our discussion. The recommended model is a hybrid of the models we discussed and its basic features would be:
1. Take the first $83 million and allocate it to the HTA for their purposes. This gives the industry some certainly that their taxes will go directly to a body over which they have some control.
2. Take 90% ofthe balance and allocate it 60% to the State and 40% to the Counties, but in either case, no less than $100 million. This would give the Counties the opportunity to enjoy any upside, with some certainty that the downside will be limited and certain. The funds for the Convention Center and for any Legislative set asides (e.g. those to DLNR) would come from the State pot.
3. Take the remaining funds and leave it for Legislative discretion, with the recommendation that it be spent on visitor related expenditures. This reflects the political reality the problems that cannot be anticipated arise and that the Legislature will go to the TAT to help solve those problems.
The primary weakness of this model lies in the allocation of 60-40 State and County. The split should probably be calculated from the expenditure data that the State and Counties are currently gathering.
Our feeling was that it was fair, but it probably requires more discipline and precision to be defensible,
and we would leave that calculation to the consultants.
The investigative group adjourned without the intention of meeting again, and instructed the discussion
leader to prepare these notes for the broader body's consideration. We sincerely hope that this is just
the start of a more in-depth conversation at the Working Group level.
jayna
Text Box
Note: The reference to $83 million should be $82 million.


Appendix H Impacts of Models Under Growth And
Recessionary Conditions, to 2025


Appendix H-1
MODELS IN THIS APPENDIX
Model
Number Indexing Model Runs in Chapter 3 TSF Floors Land Fund
A Shares 1 B1 Shares, with TSF Floor 3 x B2 Shares, with TSF Floor 3 x x C1 Shares with TSF Indexed 4 x C2 Shares with TSF, Land Fund Indexed 4 x x D1 Three-Stage, no Index 7 D2 Three-State: TSF and Floors Indexed 7 x x D3 Three-Stage: TSF only Index 7 x E1 Three-Stage Variant: TSF Indexed 8 x E2 Three-Stage Variant: no index 8 E3 Three-Stage Variant: TSF and Floor Indexed 8 x x
The model runs in this Appendix correspond to ones requested by and presented to the Working Group in meetings in October 2015. The letter identifiers (A, B, C, D, E) were developed for the October 7 meeting; the more specific identifiers such as B1 and B2 were used in the handout for the October 21 meeting. In this appendix, model definitions are summarized and identified with both the initial letter identifier and the numerical identifier found in Chapter 3 of the report (e.g., 1(A) and 3(B)). All models are run for both a growth forecast, derived from the Hospitality Advisors LLC analysis of visitor lodging revenues, and a recession scenario. Aggregate totals for a ten year period are shown for those rows which list revenues to be transferred to particular parties, rather than steps in the calculations. Future revenues are shown as current dollars, i.e., dollars gathered in future years, rather than being stated as constant dollars (future revenues computed in values equivalent to dollars at a given past time, such as 2000 dollars). The final versions of the model runs in this appendix differs from earlier ones considered by the Working Group in that (a) FY 2015 and FY 2016 allocations are shown as mandated by recent Acts and are highlighted; (b) Recessionary scenarios are based on a corrected analysis of the 2005 to 2015 TAT tax base, as discussed in the report. For the October 7 meeting, revenues dedicated to several existing appropriations (Convention Center, Turtle Bay, and the State Special Land Fund) were indexed to changes in the CPI. Per the Working Group's discussions, revenues for the Convention Center and Turtle Bay are held constant at their 2015 values for all models.

Appendix H-2
1 (A) Simple Shares Model. Revenues divided into three shares:20% Tourism Special Fund32% Counties 48% State of Hawai‘i
> All shares would grow or contract along with revenues. Any existing set-asides (including the Convention Center Special Fund) would come from the State share.
> This allocation divides allocations for the State and counties on a 60/40 basis (after TSF share).
A. Simple Shares Model. Revenues divided into three shares:AGGREGATE
Hospitality Advisors (HA) FORECAST 2015 2016 2017 2018 2019 2020 2021 2022 2023 2024 2025 2016-2025Total (million) $421 $450 $474 $497 $520 $543 $568 $592 $623 $649 $678 $5,594
20% TSF $82 $82 $95 $99 $104 $109 $114 $118 $125 $130 $136 $1,11132% Counties $103 $103 $152 $159 $166 $174 $182 $189 $199 $208 $217 $1,74948% State of Hawai‘i $236 $265 $228 $239 $250 $261 $273 $284 $299 $312 $326 $2,734
NOTES: Model A involves shares, not set amounts, so no indexing needs to be considered. Allocations for FY 2015 and 2016 are assumed to be as directed in Act 174, SLH 2014.
$0
$50
$100
$150
$200
$250
$300
$350
$400
$450
2015 2016 2017 2018 2019 2020 2021 2022 2023 2024 2025
A. Simple Shares Model
TSF Counties State of Hawai‘i

Appendix H-3
A. Simple Shares Model. Revenues divided into three shares: AGGREGATERECESSION SCENARIO RS 2015 RS 2016 RS 2017 RS 2018 RS 2019 RS 2020 RS 2021 RS 2022 RS 2023 RS 2024 RS 2025 2016-2025
Total (million) $421 $460 $476 $486 $417 $393 $472 $538 $612 $656 $699 $5,20820% TSF $82 $82 $95 $97 $83 $79 $94 $108 $122 $131 $140 $1,03232% Counties $103 $103 $152 $155 $133 $126 $151 $172 $196 $210 $224 $1,62248% State of Hawai‘i $236 $275 $229 $233 $200 $189 $227 $258 $294 $315 $335 $2,554
$0
$50
$100
$150
$200
$250
$300
$350
$400
$450
RS 2015 RS 2016 RS 2017 RS 2018 RS 2019 RS 2020 RS 2021 RS 2022 RS 2023 RS 2024 RS 2025
A. Simple Shares Model, Recession Scenario
TSF Counties State of Hawai‘i

Appendix H-4
3 (B) Shares Model, with Tourism Special Fund Protected against DownturnsTourism Special Fund, amount set by Legislature ($82 million for FY 2015).Remainder split by State and Counties on a 60/40 basis
B Shares Model, with Tourism Special Fund Protected against DownturnsB1 HA FORECAST, NO CPI AGGREGATE
2015 2016 2017 2018 2019 2020 2021 2022 2023 2024 2025 2016-2025Total (million) $421 $450 $474 $497 $520 $543 $568 $592 $623 $649 $678 $5,594
20% TSF Share $84 $90 $95 $99 $104 $109 $114 $118 $125 $130 $136TSF Floor ($82) $82 $82 $82 $82 $82 $82 $82 $82 $82 $82 $82TSF Allocation $82 $82 $95 $99 $104 $109 $114 $118 $125 $130 $136 $1,111
Remainder (Total - TSF) $339 $368 $379 $398 $416 $435 $454 $473 $498 $520 $543Counties (40% of Remainder) $103 $103 $152 $159 $166 $174 $182 $189 $199 $208 $217 $1,749State (60% of Remainder) $236 $265 $228 $239 $250 $261 $273 $284 $299 $312 $326 $2,734
NOTE: Allocations for FY 2015 and 2016 are assumed to be as directed in Act 174, SLH 2014.
$0
$50
$100
$150
$200
$250
$300
$350
$400
$450
2015 2016 2017 2018 2019 2020 2021 2022 2023 2024 2025
B1: Shares Model, TSF Protected, no CPI
TSF Counties State of Hawai‘i

Appendix H-5
B1 RECESSION SCENARIO, NO CPI AGGREGATERS 2015 RS 2016 RS 2017 RS 2018 RS 2019 RS 2020 RS 2021 RS 2022 RS 2023 RS 2024 RS 2025 2016-2025
Total (million) $421 $460 $476 $486 $417 $393 $472 $538 $612 $656 $699 $5,20820% TSF Share $84 $92 $95 $97 $83 $79 $94 $108 $122 $131 $140
TSF Floor ($82) $82 $82 $82 $82 $82 $82 $82 $82 $82 $82 $82TSF Allocation $82 $82 $95 $97 $83 $82 $94 $108 $122 $131 $140 $1,035
Remainder (Total - TSF) $339 $378 $381 $389 $333 $311 $378 $430 $489 $525 $559Counties (40% of Remainder) $103 $103 $152 $155 $133 $125 $151 $172 $196 $210 $224 $1,621State (60% of Remainder) $236 $275 $229 $233 $200 $187 $227 $258 $294 $315 $335 $2,552
Allocations for FY 2015 and 2016 are assumed to be as directed in Act 174, SLH 2014.
$0
$50
$100
$150
$200
$250
$300
$350
$400
$450
RS 2015 RS 2016 RS 2017 RS 2018 RS 2019 RS 2020 RS 2021 RS 2022 RS 2023 RS 2024 RS 2025
B1: Shares Model, TSF Protected, Recession Scenario
TSF Counties State of Hawai‘i

Appendix H-6
B2 HA FORECAST, CPI INCREASE AGGREGATE2015 2016 2017 2018 2019 2020 2021 2022 2023 2024 2025 2016-2025
Total (million) $421 $450 $474 $497 $520 $543 $568 $592 $623 $649 $678 $5,59420% TSF Share $84 $90 $95 $99 $104 $109 $114 $118 $125 $130 $136
TSF Floor ($82 + CPI) $82 $82 $83 $85 $87 $89 $92 $94 $97 $99 $102TSF Allocation $82 $82 $95 $99 $104 $109 $114 $118 $125 $130 $136 $1,111
Remainder (Total - TSF) $339 $368 $379 $398 $416 $435 $454 $473 $498 $520 $543Counties (40% of Remainder) $103 $103 $152 $159 $166 $174 $182 $189 $199 $208 $217 $1,749State (60% of Remainder) $236 $265 $228 $239 $250 $261 $273 $284 $299 $312 $326 $2,734
NOTE: For Model B,the Tourism Special Fund (TSF) is protected from reductions by a floor. Indexing may affect the floor (in model B2). Allocations for FY 2015 and 2016 are assumed to be as directed in Act 174, SLH 2014.
$0
$50
$100
$150
$200
$250
$300
$350
$400
$450
2015 2016 2017 2018 2019 2020 2021 2022 2023 2024 2025
B2: Shares Model, TSF Protected, Indexed
TSF Counties State of Hawai‘i

Appendix H-7
B2 RECESSION SCENARIO, WITH CPI AGGREGATERS 2015 RS 2016 RS 2017 RS 2018 RS 2019 RS 2020 RS 2021 RS 2022 RS 2023 RS 2024 RS 2025 2016-2025
Total (million) $421 $460 $476 $486 $417 $393 $472 $538 $612 $656 $699 $5,20820% TSF Share $84 $92 $95 $97 $83 $79 $94 $108 $122 $131 $140
TSF Floor ($82 + CPI) $82 $82 $83 $85 $87 $89 $92 $94 $97 $99 $102TSF Allocation $82 $82 $95 $97 $87 $89 $94 $108 $122 $131 $140 $1,046
Remainder (Total - TSF) $339 $378 $381 $389 $330 $304 $378 $430 $489 $525 $559Counties (40% of Remainder) $103 $103 $152 $155 $132 $122 $151 $172 $196 $210 $224 $1,617State (60% of Remainder) $236 $275 $229 $233 $198 $183 $227 $258 $294 $315 $335 $2,545
Allocations for FY 2015 and 2016 are assumed to be as directed in Act 174, SLH 2014.
$0
$50
$100
$150
$200
$250
$300
$350
$400
$450
RS 2015 RS 2016 RS 2017 RS 2018 RS 2019 RS 2020 RS 2021 RS 2022 RS 2023 RS 2024 RS 2025
B2: Shares Model, TSF Protected, Indexed, Recession Scenario
TSF Counties State of Hawai‘i

Appendix H-8
4 (C ) Shares Model, with Existing Special Funds Protected against Downturns1 Guaranteed amount:
$82.0 TSF, starting at $82 million and changing with inflation IN $26.5 Convention Center Enterprise Special Fund
$1.5 Turtle Bay Special Fund $3.0 Special Land Development Fund (DLNR) (Indexed to inflation in version C2)$113 million in FY 2015
2 Shares of remainder of TAT funds:45% Counties 55% State of Hawai‘i
NOTE: Shares of remainder considered at different percentage allocations; this distribution is the one chosen by the Working Group.

Appendix H-9
C1 TSF only Indexed AGGREGATEHA FORECAST 2015 2016 2017 2018 2019 2020 2021 2022 2023 2024 2025 2016-2025
Total (million) $421 $450 $474 $497 $520 $543 $568 $592 $623 $649 $678 $5,594TSF (+ CPI) $82 $82 $83 $85 $87 $89 $92 $94 $97 $99 $102 $909Other Existing Appropriations
Turtle Bay $1.5 $1.5 $1.5 $1.5 $1.5 $1.5 $1.5 $1.5 $1.5 $1.5 $1.5 $15Convention Center $26.5 $26.5 $26.5 $26.5 $26.5 $26.5 $26.5 $26.5 $26.5 $26.5 $26.5 $265Special Land Fund $3.0 $3.0 $3.0 $3.0 $3.0 $3.0 $3.0 $3.0 $3.0 $3.0 $3.0 $30
Remainder $308 $337 $360 $381 $402 $423 $445 $467 $495 $519 $545Counties (45% of Remainder) $103 $103 $162 $172 $181 $190 $200 $210 $223 $234 $245 $1,920State (55% of Remainder) $205 $234 $198 $210 $221 $233 $245 $257 $272 $286 $300 $2,455
NOTE: This model has been viewed with 60/40, 54/46. and 55/45 splits between the State and counties. The last (55/45) was chosen by the Working Group. Allocations for FY 2015 and 2016 are assumed to be as directed in Act 174, SLH 2014 and Acts 117 and 121, SLH 2015. Special Land Development Fund moneys for the years before FY2015 are actually General Fund appropriations.
$0
$50
$100
$150
$200
$250
$300
$350
$400
$450
2015 2016 2017 2018 2019 2020 2021 2022 2023 2024 2025
C1: Shares Model, with TSF only Indexed
TSF Counties State of Hawai‘i Other Existing Appropriations

Appendix H-10
C1 TSF only Indexed AGGREGATERECESSION SCENARIO RS 2015 RS 2016 RS 2017 RS 2018 RS 2019 RS 2020 RS 2021 RS 2022 RS 2023 RS 2024 RS 2025 2016-2025
Total (million) $421 $460 $476 $486 $417 $393 $472 $538 $612 $656 $699 $5,208TSF (+ CPI) $82 $82 $83 $85 $87 $89 $92 $94 $97 $99 $102 $909Other Existing Appropriations
Turtle Bay $1.5 $1.5 $1.5 $1.5 $1.5 $1.5 $1.5 $1.5 $1.5 $1.5 $1.5 $15Convention Center $26.5 $26.5 $26.5 $26.5 $26.5 $26.5 $26.5 $26.5 $26.5 $26.5 $26.5 $265Special Land Fund $3.0 $3.0 $3.0 $3.0 $3.0 $3.0 $3.0 $3.0 $3.0 $3.0 $3.0 $30
Remainder $308 $347 $362 $370 $299 $273 $350 $413 $484 $526 $566Counties (45% of Remainder) $103 $103 $163 $167 $134 $123 $157 $186 $218 $237 $255 $1,742State (55% of Remainder) $205 $244 $199 $204 $164 $150 $192 $227 $266 $289 $311 $2,247
NOTE: This model has been viewed with 60/40, 54/46. and 55/45 splits between the State and counties. The last (55/45) was chosen by the Working Group. Allocations for FY 2015 and 2016 are assumed to be as directed in Act 174, SLH 2014 and Acts 117 and 121, SLH 2015. Special Land Development Fund moneys for the years before FY2015 are actually General Fund appropriations.
$0
$50
$100
$150
$200
$250
$300
$350
$400
$450
RS 2015 RS 2016 RS 2017 RS 2018 RS 2019 RS 2020 RS 2021 RS 2022 RS 2023 RS 2024 RS 2025
C1: Shares Model, TSF Indexed, Recession Scenario
TSF Counties State of Hawai‘i Other Existing Appropriations

Appendix H-11
C2 TSF and Land Fund indexed AGGREGATEHA FORECAST 2015 2016 2017 2018 2019 2020 2021 2022 2023 2024 2025 2016-2025
Total (million) $421 $450 $474 $497 $520 $543 $568 $592 $623 $649 $678 $5,594TSF (+ CPI) $82 $82 $83 $85 $87 $89 $92 $94 $97 $99 $102 $909Other Existing Appropriations
Turtle Bay $1.5 $1.5 $1.5 $1.5 $1.5 $1.5 $1.5 $1.5 $1.5 $1.5 $1.5 $15Convention Center $26.5 $26.5 $26.5 $26.5 $26.5 $26.5 $26.5 $26.5 $26.5 $26.5 $26.5 $265Special Land Fund (+ CPI) $3.0 $3.0 $3.0 $3.1 $3.2 $3.3 $3.4 $3.4 $3.5 $3.6 $3.7 $33
Remainder $308 $337 $360 $381 $402 $423 $445 $466 $495 $519 $545Counties (40% of Remainder) $103 $103 $144 $153 $161 $169 $178 $186 $198 $207 $218 $1,717State (60% of Remainder) $205 $234 $216 $229 $241 $254 $267 $280 $297 $311 $327 $2,655
Allocations for FY 2015 and 2016 are assumed to be as directed in Act 174, SLH 2014 and Acts 117 and 121, SLH 2015. Special Land Development Fund moneys for the years before FY2015 are actually General Fund appropriations.
$0
$50
$100
$150
$200
$250
$300
$350
$400
$450
2015 2016 2017 2018 2019 2020 2021 2022 2023 2024 2025
C2: Shares Model, TSF and Land Fund Indexed
TSF Counties State of Hawai‘i Other Existing Appropriations

Appendix H-12
C2 TSF and Land Fund indexedAGGREGATE
RECESSION SCENARIO RS 2015 RS 2016 RS 2017 RS 2018 RS 2019 RS 2020 RS 2021 RS 2022 RS 2023 RS 2024 RS 2025 2016-2025Total (million) $421 $460 $476 $486 $417 $393 $472 $538 $612 $656 $699 $5,208TSF (+ CPI) $82 $82 $83 $85 $87 $89 $92 $94 $97 $99 $102 $909Other Existing Appropriations
Turtle Bay $1.5 $1.5 $1.5 $1.5 $1.5 $1.5 $1.5 $1.5 $1.5 $1.5 $1.5 $15Convention Center $26.5 $26.5 $26.5 $26.5 $26.5 $26.5 $26.5 $26.5 $26.5 $26.5 $26.5 $265Special Land Fund (+ CPI) $3.0 $3.0 $3.0 $3.1 $3.2 $3.3 $3.4 $3.4 $3.5 $3.6 $3.7 $33
Remainder $308 $347 $362 $370 $299 $273 $349 $412 $484 $525 $565Counties (40% of Remainder) $103 $103 $145 $148 $119 $109 $140 $165 $193 $210 $226 $1,559State (60% of Remainder) $205 $244 $217 $222 $179 $164 $210 $247 $290 $315 $339 $2,427
Allocations for FY 2015 and 2016 are assumed to be as directed in Act 174, SLH 2014 and Acts 117 and 121, SLH 2015. Special Land Development Fund moneys for the years before FY2015 are actually General Fund appropriations.
$0
$50
$100
$150
$200
$250
$300
$350
$400
$450
RS 2015 RS 2016 RS 2017 RS 2018 RS 2019 RS 2020 RS 2021 RS 2022 RS 2023 RS 2024 RS 2025
C2: Shares, TSF and Land Fund Indexed, Recession Scenario
TSF Counties State of Hawai‘i Other Existing Appropriations

Appendix H-13
7 (D) Three-stage Model Presented by Allocation Models Investigative Group1. Guaranteed to TSF: $82 million plus growth with inflation 2. 90% of remainder: 60/40 State and Counties
Guaranteed for State and Counties, for existing expenditures:$100 million each, guaranteed for State and Counties
3. 10% of remainderLegislative discretion, with recommendation that funds spent on visitor related expenses

Appendix H-14
D1 Original Three-Stage Model: no indexingAGGREGATE
HA FORECAST 2015 2016 2017 2018 2019 2020 2021 2022 2023 2024 2025 2016-2025Total $421 $450 $474 $497 $520 $543 $568 $592 $623 $649 $678 $5,594
Stage 1TSF $82 $82 $82 $82 $82 $82 $82 $82 $82 $82 $82 $820
Stage 290% of remainder $353 $374 $394 $415 $437 $459 $487 $511 $537
Counties 40% $103 $103 $141 $149 $158 $166 $175 $184 $195 $204 $215State 60% $236 $265 $212 $224 $236 $249 $262 $275 $292 $306 $322
"Floor" for counties or State $100 $100 $100 $100 $101 $101 $100 $100 $102 $102 $100Stage 2 Allocation (larger of share or floor)
Counties $103 $103 $141 $149 $158 $166 $175 $184 $195 $204 $215State $236 $265 $212 $224 $236 $249 $262 $275 $292 $306 $322
Stage 3 Legislative Appropriation Remaining after Stages 1, 2 $0 $0 $39 $42 $44 $46 $49 $51 $54 $57 $60
Appropriation $0 $0 $39 $42 $44 $46 $49 $51 $54 $57 $60 $441Reduction, Stage 2 $0 $0 $0 $0 $0 $0 $0 $0 $0 $0 $0
Adjusted Stage 2 County amount $103 $103 $141 $149 $158 $166 $175 $184 $195 $204 $215 $1,689Adjusted Stage 2 State amount $236 $265 $212 $224 $236 $249 $262 $275 $292 $306 $322 $2,644Total State (Stage 2 + Appropriation) $236 $265 $251 $266 $280 $295 $311 $326 $346 $363 $382 $3,085
NOTE: The model presented for discussion by the Allocation Models Investigative Group begins with allocation of a set amount for the TSF. The remaining funds are split, with90% to be allocated between the State and counties on a 60/40 basis, and 10% for the Legislature to appropriate, preferably for tourism-related expenditures. Allocations for FY 2015 and 2016 are assumed to be as directed in Act 174, SLH 2014.
$0
$50
$100
$150
$200
$250
$300
$350
$400
$450
2015 2016 2017 2018 2019 2020 2021 2022 2023 2024 2025
D1: Three-Stage Model, no Index
TSF Counties State of Hawai‘i Legislative Appropriation

Appendix H-15
D1 Original Three-Stage Model: no indexingAGGREGATE
RECESSION SCENARIO RS 2015 RS 2016 RS 2017 RS 2018 RS 2019 RS 2020 RS 2021 RS 2022 RS 2023 RS 2024 RS 2025 2016-2025Total $421 $460 $476 $486 $417 $393 $472 $538 $612 $656 $699 $5,208
Stage 1TSF $82 $82 $82 $82 $82 $82 $82 $82 $82 $82 $82 $820
Stage 290% of remainder $355 $363 $301 $280 $351 $410 $477 $516 $555
Counties 40% $103 $103 $142 $145 $120 $112 $140 $164 $191 $207 $222State 60% $236 $275 $213 $218 $181 $168 $211 $246 $286 $310 $333
"Floor" for counties or State $100 $100 $100 $100 $100 $100 $100 $100 $100Stage 2 Allocation (larger of share or floor)
Counties $103 $103 $142 $145 $120 $112 $140 $164 $191 $207 $222State $236 $275 $213 $218 $181 $168 $211 $246 $286 $310 $333
Stage 3 Legislative Appropriation Remaining after Stages 1, 2 $0 $0 $39 $40 $33 $31 $39 $46 $53 $57 $62
Appropriation $0 $0 $39 $40 $33 $31 $39 $46 $53 $57 $62 $401Reduction, Stage 2 $0 $0 $0 $0 $0 $0 $0 $0 $0 $0 $0
Adjusted Stage 2 County amount $103 $103 $142 $145 $120 $112 $140 $164 $191 $207 $222 $1,547Adjusted Stage 2 State amount $236 $275 $213 $218 $181 $168 $211 $246 $286 $310 $333 $2,440Total State (Stage 2 + Appropriation) $236 $275 $252 $258 $214 $199 $250 $292 $339 $367 $395 $2,841
Allocations for FY 2015 and 2016 are assumed to be as directed in Act 174, SLH 2014.
$0
$50
$100
$150
$200
$250
$300
$350
$400
$450
RS 2015 RS 2016 RS 2017 RS 2018 RS 2019 RS 2020 RS 2021 RS 2022 RS 2023 RS 2024 RS 2025
D1: Three-Stage Model, No Indexing, Recession Scenario
TSF Counties State of Hawai‘i Legislative Appropriation

Appendix H-16
D2: Three-Stage Model, with Indexing of TSF and floorsAGGREGATE
HA FORECAST 2015 2016 2017 2018 2019 2020 2021 2022 2023 2024 2025 2016-2025Total $421 $450 $474 $497 $520 $543 $568 $592 $623 $649 $678 $5,594
Stage 1TSF Indexed $82 $82 $83 $85 $87 $89 $92 $94 $97 $99 $102 $909
Stage 290% of remainder $352 $371 $390 $409 $429 $448 $473 $495 $519
Counties 40% $103 $103 $141 $148 $156 $164 $171 $179 $189 $198 $207State 60% $236 $265 $211 $223 $234 $245 $257 $269 $284 $297 $311
"Floor" for counties or State $101 $103 $107 $110 $112 $115 $120 $123 $124Stage 2 Allocation (larger of share or floor)
Counties $103 $103 $141 $148 $156 $164 $171 $179 $189 $198 $207State $236 $265 $211 $223 $234 $245 $257 $269 $284 $297 $311
Stage 3 Legislative Appropriation Remaining after Stages 1, 2 $0 $0 $39 $41 $43 $45 $48 $50 $53 $55 $58
Appropriation $0 $0 $39 $41 $43 $45 $48 $50 $53 $55 $58 $432Reduction, Stage 2 $0 $0 $0 $0 $0 $0 $0 $0 $0 $0 $0
Adjusted Stage 2 County amount $103 $103 $141 $148 $156 $164 $171 $179 $189 $198 $207 $1,657Adjusted Stage 2 State amount $236 $265 $211 $223 $234 $245 $257 $269 $284 $297 $311 $2,596Total State (Stage 2 + Appropriation) $236 $265 $250 $264 $277 $291 $305 $319 $337 $352 $369 $3,028
Allocations for FY 2015 and 2016 are assumed to be as directed in Act 174, SLH 2014.
$0
$50
$100
$150
$200
$250
$300
$350
$400
$450
2015 2016 2017 2018 2019 2020 2021 2022 2023 2024 2025
D2: Three-Stage Model with Indexing of TSF and Floors
TSF Counties State of Hawai‘i Legislative Appropriation

Appendix H-17
D2: Three-Stage Model, with Indexing of TSF and floorsAGGREGATE
RECESSION SCENARIO RS 2015 RS 2016 RS 2017 RS 2018 RS 2019 RS 2020 RS 2021 RS 2022 RS 2023 RS 2024 RS 2025 2016-2025Total $421 $460 $476 $486 $417 $393 $472 $538 $612 $656 $699 $5,208
Stage 1TSF $82 $82 $83 $85 $87 $89 $92 $94 $97 $99 $102 $909
Stage 290% of remainder $354 $361 $297 $274 $343 $399 $464 $501 $537
Counties 40% $103 $103 $142 $144 $119 $110 $137 $160 $185 $200 $215State 60% $236 $275 $212 $217 $178 $164 $206 $240 $278 $301 $322
"Floor" for counties or State $101 $103 $106 $109 $112 $115 $118 $121 $124Stage 2 Allocation (larger of share or floor)
Counties $103 $103 $142 $144 $119 $110 $137 $160 $185 $200 $215State $236 $275 $101 $103 $178 $164 $206 $240 $278 $301 $322
Stage 3 Legislative Appropriation Remaining after Stages 1, 2 $0 $0 $151 $153 $33 $30 $38 $44 $52 $56 $60
Appropriation $0 $0 $151 $153 $33 $30 $38 $44 $52 $56 $60 $617Reduction, Stage 2 $0 $0 $0 $0 $0 $0 $0 $0 $0 $0 $0
Adjusted Stage 2 County amount $103 $103 $142 $144 $119 $110 $137 $160 $185 $200 $215 $1,515Adjusted Stage 2 State amount $236 $275 $101 $103 $178 $164 $206 $240 $278 $301 $322 $2,167Total State (Stage 2 + Appropriation) $236 $275 $252 $257 $211 $195 $244 $284 $330 $356 $382 $2,784
Allocations for FY 2015 and 2016 are assumed to be as directed in Act 174, SLH 2014.
$0
$50
$100
$150
$200
$250
$300
$350
$400
$450
RS 2015 RS 2016 RS 2017 RS 2018 RS 2019 RS 2020 RS 2021 RS 2022 RS 2023 RS 2024 RS 2025
D2: Three-Stage Model, with TSF and Floors Indexed, Recession Scenario
TSF Counties State of Hawai‘i Legislative Appropriation

Appendix H-18
D3 Three-Stage Model, with Indexing of TSF only AGGREGATE
HA FORECAST 2015 2016 2017 2018 2019 2020 2021 2022 2023 2024 2025 2016-2025Total $421 $450 $474 $497 $520 $543 $568 $592 $623 $649 $678 $5,594
Stage 1TSF Indexed $82 $82 $83 $85 $87 $89 $92 $94 $97 $99 $102 $909
Stage 290% of remainder $352 $371 $390 $409 $429 $448 $473 $495 $519
Counties 40% $103 $103 $141 $148 $156 $164 $171 $179 $189 $198 $207State 60% $236 $265 $211 $223 $234 $245 $257 $269 $284 $297 $311
"Floor" for counties or State $100 $100 $100 $100 $100 $100 $100 $100 $100Stage 2 Allocation (larger of share or floor)
Counties $103 $103 $141 $148 $156 $164 $171 $179 $189 $198 $207State $236 $265 $211 $223 $234 $245 $257 $269 $284 $297 $311
Stage 3 Legislative Appropriation Remaining after Stages 1, 2 $0 $0 $39 $41 $43 $45 $48 $50 $53 $55 $58
Appropriation $0 $0 $39 $41 $43 $45 $48 $50 $53 $55 $58 $432Reduction, Stage 2 $0 $0 $0 $0 $0 $0 $0 $0 $0 $0 $0
Adjusted Stage 2 County amount $103 $103 $141 $148 $156 $164 $171 $179 $189 $198 $207 $1,657Adjusted Stage 2 State amount $236 $265 $211 $223 $234 $245 $257 $269 $284 $297 $311 $2,596Total State (Stage 2 + Appropriation) $236 $265 $250 $264 $277 $291 $305 $319 $337 $352 $369 $3,028
Allocations for FY 2015 and 2016 are assumed to be as directed in Act 174, SLH 2014.
$0
$50
$100
$150
$200
$250
$300
$350
$400
$450
2015 2016 2017 2018 2019 2020 2021 2022 2023 2024 2025
D3: Three-Stage Model, TSF Indexed
TSF Counties State of Hawai‘i Legislative Appropriation

Appendix H-19
D3 Three-Stage Model, with Indexing of TSF only AGGREGATE
RECESSION SCENARIO RS 2015 RS 2016 RS 2017 RS 2018 RS 2019 RS 2020 RS 2021 RS 2022 RS 2023 RS 2024 RS 2025 2016-2025Total $421 $460 $476 $486 $417 $393 $472 $538 $612 $656 $699 $5,208
Stage 1TSF Indexed $82 $82 $83 $85 $87 $89 $92 $94 $97 $99 $102 $909
Stage 290% of remainder $354 $361 $297 $274 $343 $399 $464 $501 $537
Counties 40% $103 $103 $142 $144 $119 $110 $137 $160 $185 $200 $215State 60% $236 $275 $212 $217 $178 $164 $206 $240 $278 $301 $322
"Floor" for counties or State $100 $100 $100 $100 $100 $100 $100 $100 $100Stage 2 Allocation (larger of share or floor)
Counties $103 $103 $142 $144 $119 $110 $137 $160 $185 $200 $215State $236 $275 $212 $217 $178 $164 $206 $240 $278 $301 $322
Stage 3 Legislative Appropriation Remaining after Stages 1, 2 $0 $0 $39 $40 $33 $30 $38 $44 $52 $56 $60
Appropriation $0 $0 $39 $40 $33 $30 $38 $44 $52 $56 $60 $392Reduction, Stage 2 $0 $0 $0 $0 $0 $0 $0 $0 $0 $0 $0
Adjusted Stage 2 County amount $103 $103 $142 $144 $119 $110 $137 $160 $185 $200 $215 $1,515Adjusted Stage 2 State amount $236 $275 $212 $217 $178 $164 $206 $240 $278 $301 $322 $2,392Total State (Stage 2 + Appropriation) $236 $275 $252 $257 $211 $195 $244 $284 $330 $356 $382 $2,784
Allocations for FY 2015 and 2016 are assumed to be as directed in Act 174, SLH 2014.
$0
$50
$100
$150
$200
$250
$300
$350
$400
$450
RS 2015 RS 2016 RS 2017 RS 2018 RS 2019 RS 2020 RS 2021 RS 2022 RS 2023 RS 2024 RS 2025
D3: Three-Stage Model, TSF Indexed, Recession Scenario
TSF Counties State of Hawaii Legislative Appropriation

Appendix H-20
8 (E) Variant of Three-Stage Model1. Guaranteed to TSF: $82 million plus growth with inflation 2. 90% of remainder: 60/40 State and Counties
Guaranteed for State and Counties, for existing expenditures:$100 million each, guaranteed for State and Counties
3. 10% of remainder to State, to include set-asides for Turtle Bay, Convention Center, Special Land Development Fund, remainder forLegislative appropriations as of 2015 or later
If the 10% is not enough to cover the existing set-asides, the State and Counties would cover these from their Stage 2 moneys.
E1 Variant Three-Stage Model, with TSF only indexedAGGREGATE
HA FORECAST 2015 2016 2017 2018 2019 2020 2021 2022 2023 2024 2025 2016-2025Total $421 $450 $474 $497 $520 $543 $568 $592 $623 $649 $678 $5,594
Stage 1TSF Indexed $82 $82 $83 $85 $87 $89 $92 $94 $97 $99 $102 $909
Stage 290% of remainder $352 $371 $390 $409 $429 $448 $473 $495 $519
Counties 40% $103 $103 $141 $148 $156 $164 $171 $179 $189 $198 $207State 60% $205 $234 $211 $223 $234 $245 $257 $269 $284 $297 $311"Floor" for counties or State $100 $100 $100 $100 $100 $100 $100 $100 $100
Stage 2 Allocation (larger of share or floor)Counties $103 $103 $141 $148 $156 $164 $171 $179 $189 $198 $207 $1,657State $205 $234 $211 $223 $234 $245 $257 $269 $284 $297 $311 $2,565
Stage 3 Legislative Appropriation Remaining after Stages 1, 2 $31 $31 $39 $41 $43 $45 $48 $50 $53 $55 $58
Existing Appropriations -- Anticipated Turtle Bay $1.5 $1.5 $1.5 $1.5 $1.5 $1.5 $1.5 $1.5 $1.5 $1.5 $1.5Convention Center $26.5 $26.5 $26.5 $26.5 $26.5 $26.5 $26.5 $26.5 $26.5 $26.5 $26.5Special Land Fund $3.0 $3.0 $3.0 $3.0 $3.0 $3.0 $3.0 $3.0 $3.0 $3.0 $3.0Total Anticipated Appropriations $31.0 $31.0 $31.0 $31.0 $31.0 $31.0 $31.0 $31.0 $31.0 $31.0 $31.0Existing Appropriations: Anticipated or, if Remaining after Stages 1,2 smaller, share of RemainingTurtle Bay $1.5 $1.5 $1.5 $1.5 $1.5 $1.5 $1.5 $1.5 $1.5 $1.5 $1.5 $15Convention Center $26.5 $26.5 $26.5 $26.5 $26.5 $26.5 $26.5 $26.5 $26.5 $26.5 $26.5 $265Special Land Fund (+ CPI) $3.0 $3.0 $3.0 $3.0 $3.0 $3.0 $3.0 $3.0 $3.0 $3.0 $3.0 $30New Appropriations $0 $0 $8 $10 $12 $14 $17 $19 $22 $24 $27 $153
Total State (Stage 2 + Appropriations) $236 $265 $250 $264 $277 $291 $305 $319 $337 $352 $369 $3,028

Appendix H-21
NOTES: In this model, the existing appropriations are treated as part of the "Legislative Appropriations" share (10% of funds remaining after Stage 1 allocation of TSF). The Existing Appropriations and New Appropriations columns are included within the Legislative Appropriation total. Allocations for FY 2015 and 2016 are assumed to be as directed in Act 174, SLH 2014 and Acts 117 and 121, SLH 2015. Special Land Development Fund moneys for the years before FY 2015 are actually General Fund appropriations.
$0
$50
$100
$150
$200
$250
$300
$350
$400
$450
2015 2016 2017 2018 2019 2020 2021 2022 2023 2024 2025
E1: Variant Three-Stage Model, TSF Indexed
TSF Counties State of Hawaii Legislative Appropriation Existing Approp. New Approp.

Appendix H-22
E1 Variant Three-Stage Model, with TSF only indexedAGGREGATE
RECESSION SCENARIO RS 2015 RS 2016 RS 2017 RS 2018 RS 2019 RS 2020 RS 2021 RS 2022 RS 2023 RS 2024 RS 2025 2016-2025Total $421 $460 $476 $486 $417 $393 $472 $538 $612 $656 $699 $5,208
Stage 1TSF Indexed $82 $82 $83 $85 $87 $89 $92 $94 $97 $99 $102 $909
Stage 290% of remainder $354 $361 $297 $274 $343 $399 $464 $501 $537
Counties 40% $103 $103 $142 $144 $119 $110 $137 $160 $185 $200 $215State 60% $205 $244 $212 $217 $178 $164 $206 $240 $278 $301 $322"Floor" for counties or State $100 $100 $100 $100 $100 $100 $100 $100 $100 $100 $100
Stage 2 Allocation (larger of share or floor)Counties $103 $103 $142 $144 $119 $110 $137 $160 $185 $200 $215 $1,515State $205 $244 $212 $217 $178 $164 $206 $240 $278 $301 $322 $2,361
Stage 3 Legislative Appropriation Remaining after Stages 1, 2 $31 $31 $39 $40 $33 $30 $38 $44 $52 $56 $60
Existing Appropriations -- Anticipated Turtle Bay $1.5 $1.5 $1.5 $1.5 $1.5 $1.5 $1.5 $1.5 $1.5 $1.5 $1.5Convention Center $26.5 $26.5 $26.5 $26.5 $26.5 $26.5 $26.5 $26.5 $26.5 $26.5 $26.5Special Land Fund (+ CPI) $3.0 $3.0 $3.0 $3.0 $3.0 $3.0 $3.0 $3.0 $3.0 $3.0 $3.0Total Anticipated Appropriations $31.0 $31.0 $31.0 $31.0 $31.0 $31.0 $31.0 $31.0 $31.0 $31.0 $31.0Existing Appropriations: Anticipated or, if Remaining after Stages 1,2 smaller, share of RemainingTurtle Bay $1.5 $1.5 $1.5 $1.5 $1.5 $1.5 $1.5 $1.5 $1.5 $1.5 $1.5 $15Convention Center $26.5 $26.5 $26.5 $26.5 $26.5 $26.0 $26.5 $26.5 $26.5 $26.5 $26.5 $265Special Land Fund (+ CPI) $3.0 $3.0 $3.0 $3.0 $3.0 $2.9 $3.0 $3.0 $3.0 $3.0 $3.0 $30New Appropriations $0 $0 $8 $9 $2 $0 $7 $13 $21 $25 $29 $114
Total State (Stage 2 + Appropriations) $236 $275 $252 $257 $211 $195 $244 $284 $330 $356 $382 $2,784

Appendix H-23
NOTES: Allocations for FY 2015 and 2016 are assumed to be as directed in Act 174, SLH 2014 and Acts 117 and 121, SLH 2015. Special Land Development Fund moneys for the years before FY 2015 are actually General Fund appropriations.

Appendix H-24
E2: Variant Three-Stage Model, with no items indexed AGGREGATE
HA FORECAST 2015 2016 2017 2018 2019 2020 2021 2022 2023 2024 2025 2016-2025Total $421 $450 $474 $497 $520 $543 $568 $592 $623 $649 $678 $5,594
Stage 1TSF $82 $82 $82 $82 $82 $82 $82 $82 $82 $82 $82 $820
Stage 290% of remainder $353 $374 $394 $415 $437 $459 $487 $511 $537
Counties 40% $103 $103 $141 $149 $158 $166 $175 $184 $195 $204 $215State 60% $205 $234 $212 $224 $236 $249 $262 $275 $292 $306 $322"Floor" for counties or State $100 $100 $100 $100 $100 $100 $100 $100 $100
Stage 2 Allocation (larger of share or floor)Counties $103 $103 $141 $149 $158 $166 $175 $184 $195 $204 $215 $1,689State $205 $234 $212 $224 $236 $249 $262 $275 $292 $306 $322 $2,613
Stage 3 Legislative Appropriation Remaining after Stages 1, 2 $31 $31 $39 $42 $44 $46 $49 $51 $54 $57 $60
Existing Appropriations -- Anticipated Turtle Bay $1.5 $1.5 $1.5 $1.5 $1.5 $1.5 $1.5 $1.5 $1.5 $1.5 $1.5Convention Center $26.5 $26.5 $26.5 $26.5 $26.5 $26.5 $26.5 $26.5 $26.5 $26.5 $26.5Special Land Fund (+ CPI) $3.0 $3.0 $3.0 $3.0 $3.0 $3.0 $3.0 $3.0 $3.0 $3.0 $3.0Total Anticipated Appropriations $31.0 $31.0 $31.0 $31.0 $31.0 $31.0 $31.0 $31.0 $31.0 $31.0 $31.0Existing Appropriations: Anticipated or, if Remaining after Stages 1,2 smaller, share of RemainingTurtle Bay $1.5 $1.5 $1.5 $1.5 $1.5 $1.5 $1.5 $1.5 $1.5 $1.5 $1.5 $15Convention Center $26.5 $26.5 $26.5 $26.5 $26.5 $26.5 $26.5 $26.5 $26.5 $26.5 $26.5 $265Special Land Fund (+ CPI) $3.0 $3.0 $3.0 $3.0 $3.0 $3.0 $3.0 $3.0 $3.0 $3.0 $3.0 $30New Appropriations $0 $0 $8 $11 $13 $15 $18 $20 $23 $26 $29 $162
Total State (Stage 2 + Appropriations) $236 $265 $251 $266 $280 $295 $311 $326 $346 $363 $382 $3,085

Appendix H-25
NOTES: If total = or > $282. no reduction is needed to Stage 2 allocations. Allocations for FY 2015 and 2016 are assumed to be as directed in Act 174, SLH 2014 and Acts 117 and 121, SLH 2015. Special Land Development Fund moneys for the years before FY 2015 are actually General Fund appropriations.

Appendix H-26
E2: Variant Three-Stage Model, with no items indexed AGGREGATE
RECESSION SCENARIO RS 2015 RS 2016 RS 2017 RS 2018 RS 2019 RS 2020 RS 2021 RS 2022 RS 2023 RS 2024 RS 2025 2016-2025Total $421 $460 $476 $486 $417 $393 $472 $538 $612 $656 $699 $5,208
Stage 1TSF $82 $82 $82 $82 $82 $82 $82 $82 $82 $82 $82 $820
Stage 290% of remainder $355 $363 $301 $280 $351 $410 $477 $516 $555
Counties 40% $103 $103 $142 $145 $120 $112 $140 $164 $191 $207 $222State 60% $205 $244 $213 $218 $181 $168 $211 $246 $286 $310 $333"Floor" for counties or State $100 $100 $100 $100 $100 $100 $100 $100 $100 $100 $100
Stage 2 Allocation (larger of share or floor)Counties $103 $103 $142 $145 $120 $112 $140 $164 $191 $207 $222 $1,547State $205 $244 $213 $218 $181 $168 $211 $246 $286 $310 $333 $2,409
Stage 3 Legislative Appropriation Remaining after Stages 1, 2 $31 $31 $39 $40 $33 $31 $39 $46 $53 $57 $62
Existing Appropriations -- Anticipated Turtle Bay $1.5 $1.5 $1.5 $1.5 $1.5 $1.5 $1.5 $1.5 $1.5 $1.5 $1.5Convention Center $26.5 $26.5 $26.5 $26.5 $26.5 $26.5 $26.5 $26.5 $26.5 $26.5 $26.5Special Land Fund (+ CPI) $3.0 $3.0 $3.0 $3.0 $3.0 $3.0 $3.0 $3.0 $3.0 $3.0 $3.0Total Anticipated Appropriations $31.0 $31.0 $31.0 $31.0 $31.0 $31.0 $31.0 $31.0 $31.0 $31.0 $31.0Existing Appropriations: Anticipated or, if Remaining after Stages 1,2 smaller, share of RemainingTurtle Bay $1.5 $1.5 $1.5 $1.5 $1.5 $1.5 $1.5 $1.5 $1.5 $1.5 $1.5 $15Convention Center $26.5 $26.5 $26.5 $26.5 $26.5 $26.5 $26.5 $26.5 $26.5 $26.5 $26.5 $265Special Land Fund (+ CPI) $3.0 $3.0 $3.0 $3.0 $3.0 $3.0 $3.0 $3.0 $3.0 $3.0 $3.0 $30New Appropriations $0 $0 $8 $9 $2 $0 $8 $15 $22 $26 $31 $122
Total State (Stage 2 + Appropriations) $236 $275 $252 $258 $214 $199 $250 $292 $339 $367 $395 $2,841

Appendix H-27
NOTES: If total TAT revenue = or > $282. no reduction is needed to Stage 2 allocations. Allocations for FY 2015 and 2016 are assumed to be as directed in Act 174, SLH 2014 and Acts 117 and 121, SLH 2015. Special Land Development Fund moneys for the years before FY 2015 are actually General Fund appropriations.

Appendix H-28
E3: Variant Three-Stage Model, TSF, Floor Indexed (not Existing Appropriations) AGGREGATEHA FORECAST 2015 2016 2017 2018 2019 2020 2021 2022 2023 2024 2025 2016-2025
Total $421 $450 $474 $497 $520 $543 $568 $592 $623 $649 $678 $5,594Stage 1
TSF Indexed $82 $82 $83 $85 $87 $89 $92 $94 $97 $99 $102 $909Stage 2
90% of remainder $352 $371 $390 $409 $429 $448 $473 $495 $519Counties 40% $103 $103 $141 $148 $156 $164 $171 $179 $189 $198 $207State 60% $205 $234 $211 $223 $234 $245 $257 $269 $284 $297 $311"Floor" for counties or State - Indexed $101 $103 $106 $109 $112 $115 $118 $121 $124
Stage 2 Allocation (larger of share or floor)Counties $103 $103 $141 $148 $156 $164 $171 $179 $189 $198 $207State $205 $234 $211 $223 $234 $245 $257 $269 $284 $297 $311
Stage 3 Legislative Appropriation Remaining after Stages 1, 2 $31 $31 $39 $41 $43 $45 $48 $50 $53 $55 $58
Existing Appropriations -- Anticipated Turtle Bay $1.5 $1.5 $1.5 $1.5 $1.5 $1.5 $1.5 $1.5 $1.5 $1.5 $1.5Convention Center $26.5 $26.5 $26.5 $26.5 $26.5 $26.5 $26.5 $26.5 $26.5 $26.5 $26.5Special Land Fund (+ CPI) $3.0 $3.0 $3.0 $3.0 $3.0 $3.0 $3.0 $3.0 $3.0 $3.0 $3.0Total Anticipated Appropriations $31.0 $31.0 $31.0 $31.0 $31.0 $31.0 $31.0 $31.0 $31.0 $31.0 $31.0Existing Appropriations: Anticipated or, if Remaining after Stages 1,2 smaller, share of RemainingTurtle Bay $1.5 $1.5 $1.5 $1.5 $1.5 $1.5 $1.5 $1.5 $1.5 $1.5 $1.5 $15Convention Center $26.5 $26.5 $26.5 $26.5 $26.5 $26.5 $26.5 $26.5 $26.5 $26.5 $26.5 $265Special Land Fund (+ CPI) $3.0 $3.0 $3.0 $3.0 $3.0 $3.0 $3.0 $3.0 $3.0 $3.0 $3.0 $30
Remainder of Stage 3 $0 $0 $8 $10 $12 $14 $17 $19 $22 $24 $27 $153New Appropriations $0 $0 $8 $10 $12 $14 $17 $19 $22 $24 $27Reductions of Stage 2 $0 $0 $0 $0 $0 $0 $0 $0 $0 $0 $0
Adjusted Stage 2 County amount $103 $103 $141 $148 $156 $164 $171 $179 $189 $198 $207 $1,657Adjusted Stage 2 State amount $205 $234 $211 $223 $234 $245 $257 $269 $284 $297 $311 $2,565Total State (Stage 2 + Appropriation) $236 $265 $250 $264 $277 $291 $305 $319 $337 $352 $369 $3,028

Appendix H-29
NOTES: Allocations for FY 2015 and 2016 are assumed to be as directed in Act 174, SLH 2014 and Acts 117 and 121, SLH 2015. Special Land Development Fund moneys for the years before FY 2015 are actually General Fund appropriations.

Appendix H-30
E3: Variant Three-Stage Model, TSF, Floor indexed (not Existing Appropriations) AGGREGATERECESSION SCENARIO RS 2015 RS 2016 RS 2017 RS 2018 RS 2019 RS 2020 RS 2021 RS 2022 RS 2023 RS 2024 RS 2025 2016-2025
Total $421 $460 $476 $486 $417 $393 $472 $538 $612 $656 $699 $5,208Stage 1
TSF Indexed $82 $82 $83 $85 $87 $89 $92 $94 $97 $99 $102 $909Stage 2
90% of remainder $354 $361 $297 $274 $343 $399 $464 $501 $537Counties 40% $103 $103 $142 $144 $119 $110 $137 $160 $185 $200 $215State 60% $205 $244 $212 $217 $178 $164 $206 $240 $278 $301 $322"Floor" for counties or State - Indexed $101 $103 $106 $109 $112 $115 $118 $121 $124
Stage 2 Allocation (larger of share or floor)Counties $103 $103 $142 $144 $119 $110 $137 $160 $185 $200 $215State $205 $244 $212 $217 $178 $164 $206 $240 $278 $301 $322
Stage 3 Legislative Appropriation Remaining after Stages 1, 2 $31 $31 $39 $40 $33 $30.4 $38 $44 $52 $56 $60
Existing Appropriations -- Anticipated Turtle Bay $1.5 $1.5 $1.5 $1.5 $1.5 $1.5 $1.5 $1.5 $1.5 $1.5 $1.5Convention Center $26.5 $26.5 $26.5 $26.5 $26.5 $26.5 $26.5 $26.5 $26.5 $26.5 $26.5Special Land Fund (+ CPI) $3.0 $3.0 $3.0 $3.0 $3.0 $3.0 $3.0 $3.0 $3.0 $3.0 $3.0Total Anticipated Appropriations $31.0 $31.0 $31.0 $31.0 $31.0 $31.0 $31.0 $31.0 $31.0 $31.0 $31.0Existing Appropriations: Anticipated or, if Remaining after Stages 1,2 smaller, share of RemainingTurtle Bay $1.5 $1.5 $1.5 $1.5 $1.5 $1.47 $1.5 $1.5 $1.5 $1.5 $1.5 $15Convention Center $26.5 $26.5 $26.5 $26.5 $26.5 $26.01 $26.5 $26.5 $26.5 $26.5 $26.5 $265Special Land Fund (+ CPI) $3.0 $3.0 $3.0 $3.0 $3.0 $2.94 $3.0 $3.0 $3.0 $3.0 $3.0 $30
Remainder of Stage 3 $0 $0 $8 $9 $2 $0 $7 $13 $21 $25 $29New Appropriations $0 $0 $8 $9 $2 $0 $7 $13 $21 $25 $29 $114Reductions of Stage 2 $0 $0 $0 $0 $0 $0 $0 $0 $0 $0 $0
Adjusted Stage 2 County amount $103 $103 $142 $144 $119 $110 $137 $160 $185 $200 $215 $1,515Adjusted Stage 2 State amount $205 $244 $212 $217 $178 $164 $206 $240 $278 $301 $322 $2,361Total State (Stage 2 + Appropriation) $236 $275 $252 $257 $211 $195 $244 $284 $330 $356 $382 $2,784

Appendix H-31
NOTES: Because "floor" for State and counties varies with inflation, funds remaining after initial Stage 2 calculation could be negative. In that case, no money goes to Stage 3 and the shortfall is deducted from State 2 moneys for the State and Counties (in 60/40 proportion). Allocations for FY 2015 and 2016 are assumed to be as directed in Act 174, SLH 2014 and Acts 117 and 121, SLH 2015. Special Land Development Fund moneys for the years before FY 2015 are actually General Fund appropriations.