State Budget 2012-13 Service Delivery Statements
72
State Budget 2012-13 Service Delivery Statements Department of Education, Training and Employment
Transcript of State Budget 2012-13 Service Delivery Statements

State Budget 2012-13
Service Delivery StatementsDepartment of Education, Training and Employment

2012–13 State Budget Papers1. Budget Speech
2. Budget Strategy and Outlook
3. Capital Statement
4. Budget Measures
5. Service Delivery Statements
Appropriation Bills
The suite of Budget Papers is similar to that published in 2011-12.
In April 2012, machinery-of-Government changes saw the creation of 20 departments with each department reporting directly to one Minister.
These new arrangements have required minor changes to how information is presented in some Budget Papers. The 2012-13 Budget Papers provide continuity of information between the previous departmental structure and the new arrangements.
The Budget Papers are available online at www.budget.qld.gov.au
© Crown copyright All rights reservedQueensland Government 2012
Excerpts from this publication may be reproduced, with appropriate acknowledgement, as permitted under the Copyright Act.
Service Delivery Statements
ISSN 1445-4890 (Print)ISSN 1445-4904 (Online)

2012-13 Queensland State Budget – Service Delivery Statements – Minister for Education, Training and Employment
Department of Education, Training and Employment
Summary of portfolio budgets1
Page Agency
2011-12 Adjusted
Budget $’000
2011-12 Est. Actual
$’000
2012-13 Estimate
$’000
3 Department of Education, Training and Employment – controlled 8,146,871 8,171,699 8,446,751
Department of Education, Training and
Employment - administered 2,440,018 2,409,925 2,611,159 39 Gold Coast Institute of TAFE 68,019 77,076 70,863 47 Queensland Studies Authority 44,975 43,958 39,746 55 Southbank Institute of Technology 108,822 116,592 105,921 Note: 1. Explanations of variances are provided in the financial statements

This page has been left blank.
2012-13 Queensland State Budget – Service Delivery Statements – Minister for Education, Training and Employment 1
PORTFOLIO OVERVIEW
Ministerial and portfolio responsibilities The Education, Training and Employment portfolio benefits Queenslanders by providing the following services:
Department of Education, Training and Employment:
Early Childhood Education and Care: Providing children with access to quality early childhood education and care through establishing and funding kindergarten and integrated early years services as well as a range of parent and family support programs, and regulating, approving and quality assessing early childhood services. For more information: http://deta.qld.gov.au/earlychildhood/
School Education: Delivering Prep to Year 12 in Queensland state schools to prepare young people for successful transitions into further education, training and/or work and administering funding for Queensland non-state schools. For more information: http://education.qld.gov.au/
Training, Tertiary Education and Employment: Supporting the skilling needs of Queensland through the funding, delivery and quality assurance of vocational education and training and providing information, advice and support to higher education providers, employers, apprentices and trainees to support workforce participation. For more information: http://training.qld.gov.au/ and http://www.employment.qld.gov.au/
For more information: http://deta.qld.gov.au/
Gold Coast Institute of TAFE:
To deliver high quality training, equipping graduates with relevant skills and knowledge to enter the workforce or go on to further tertiary study. For more information: http://gcit.edu.au/
Queensland Studies Authority:
To support all Queensland education communities by providing quality, innovative and future-focused syllabuses, and assessment, certification and tertiary entrance services. For more information: http://www.qsa.qld.edu.au/
Southbank Institute of Technology:
To contribute to the Government’s objective to grow a four pillar economy by delivering world-class education and training, providing educational development pathways and enhanced skills for a global market. For more information: http://www.southbank.edu.au

2012-13 Queensland State Budget – Service Delivery Statements – Minister for Education, Training and Employment 2
Portfolio Structure and Services
Minister for Education, Training and Employment The Honourable John-Paul Langbroek MP
Assistant Minister for Technical and Further Education Ms Saxon Rice MP
Department for Education, Training and Employment Director General: Julie Grantham
Service Area 1: Early Childhood Education and Care
Service Area 2: School Education
Service Area 3: Training, Tertiary Education and Employment
Gold Coast Institute of TAFE Board Chair: Trina Hockley
Chief Executive Officer: Aaron Devine
Objective: To deliver high quality training, equipping graduates with relevant skills and knowledge to enter the workforce or go on to further tertiary study.
Queensland Studies Authority Board Chair: Bob McHugh
Director: Peter Luxton
Objective: To support all Queensland education communities by providing quality, innovative and future-focused syllabuses, and assessment, certification and tertiary entrance services.
Southbank Institute of Technology Board Chair: Warren Tapp
Chief Executive Officer: Dr Pim Borren
Objective: To contribute to the Government’s objective to grow a four pillar economy by delivering world-class education and training, providing educational development pathways and enhanced skills for a global market.
2012-13 Queensland State Budget - Service Delivery Statements – Department of Education, Training and Employment 3
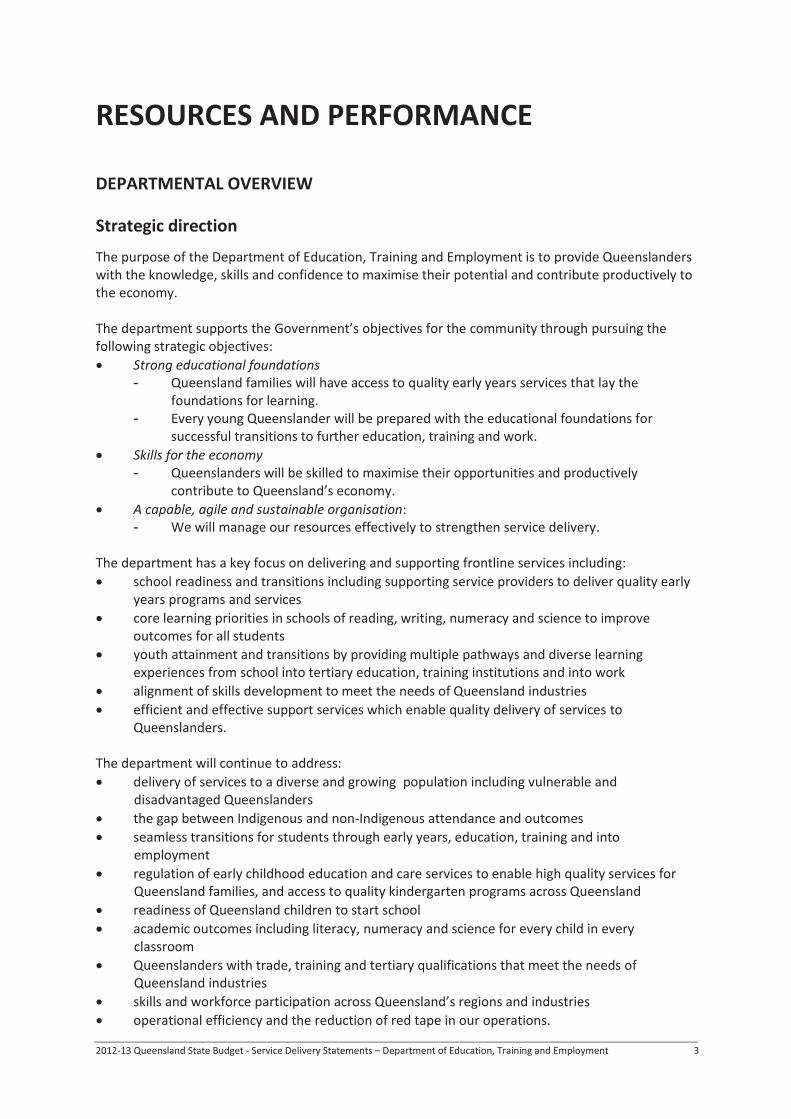
RESOURCES AND PERFORMANCE
DEPARTMENTAL OVERVIEW
Strategic direction
The purpose of the Department of Education, Training and Employment is to provide Queenslanders with the knowledge, skills and confidence to maximise their potential and contribute productively to the economy. The department supports the Government’s objectives for the community through pursuing the following strategic objectives:
Strong educational foundations - Queensland families will have access to quality early years services that lay the
foundations for learning. - Every young Queenslander will be prepared with the educational foundations for
successful transitions to further education, training and work. Skills for the economy - Queenslanders will be skilled to maximise their opportunities and productively
contribute to Queensland’s economy. A capable, agile and sustainable organisation: - We will manage our resources effectively to strengthen service delivery.
The department has a key focus on delivering and supporting frontline services including:
school readiness and transitions including supporting service providers to deliver quality early years programs and services core learning priorities in schools of reading, writing, numeracy and science to improve outcomes for all students youth attainment and transitions by providing multiple pathways and diverse learning experiences from school into tertiary education, training institutions and into work alignment of skills development to meet the needs of Queensland industries efficient and effective support services which enable quality delivery of services to Queenslanders.
The department will continue to address:
delivery of services to a diverse and growing population including vulnerable and disadvantaged Queenslanders the gap between Indigenous and non-Indigenous attendance and outcomes seamless transitions for students through early years, education, training and into employment regulation of early childhood education and care services to enable high quality services for Queensland families, and access to quality kindergarten programs across Queensland readiness of Queensland children to start school academic outcomes including literacy, numeracy and science for every child in every classroom Queenslanders with trade, training and tertiary qualifications that meet the needs of Queensland industries skills and workforce participation across Queensland’s regions and industries operational efficiency and the reduction of red tape in our operations.

2012-13 Queensland State Budget - Service Delivery Statements – Department of Education, Training and Employment 4
The department’s key strategies also support the Council of Australian Government’s initiatives including national agreements and partnerships. The department has an extensive capital program including:
establishing kindergarten services on state school sites buying land, building new schools in high growth areas to meet enrolment growth, providing additional classrooms or upgrading and maintaining existing classrooms preparing for the transition of Year 7 to be the first year of secondary from 2015 expanding and/or refurbishing TAFE facilities.
Key highlights in 2012-13 include:
Early Childhood Education and Care establishing extra kindergarten services in areas of need with a total of 129 services to be established on state and non-state school sites by the end of 2014 with 105 of these already open investing $4 million over four years in additional funding to implement the Step Up into Education program to better prepare children for school, particularly those children in areas of disadvantage implementing the National Quality Framework for Early Childhood Education and Care, including commencing assessment and rating of quality standards, and streamlined regulatory requirements.
School Education
providing education services during the 2012 school year across 1239 Queensland state schools to: - over 315,000 students in state primary schools; - over 175,000 students in state secondary schools; - including more than 2,500 students participating in distance education; and - more than 3,600 students in state special schools. up to 270 additional teachers, teacher aides and support staff to support enrolment growth and students with special needs in Queensland State Schools investing $6.5 million to state and non-state schools as part of additional funding of $26 million over four years commitment to implement Preparing our Children for Future Success – Getting the basics right to enable principals to select tailored literacy and numeracy programs that are matched to the needs of their students investing up to $4.9 million as part of additional funding of $53.6 million over four years to roll out the equivalent of a full-time teacher aide to an additional 150 Prep classes each year in areas of greatest need. From 2013, the funding for state schools will support an additional 2,341 teacher aide hours a week and by 2015-16 it will support up to 9,000 extra teacher aide hours per week implementing the Australian Curriculum in English, maths and science from 2012 and history from 2013 including the development of curriculum plans, resources and professional development to teachers across the State investing $3 million as part of additional funding of $21 million over four years for 120 state schools to participate in the Independent Public Schools initiative, with the first 30 schools to be identified in 2012-13 investing $1.4 million as part of additional funding of $10.9 million over four years to expand support for students with disability in state and non-state schools. This funding will support an additional 30 speech-language pathologists in Queensland state schools to assist students facing learning challenges

2012-13 Queensland State Budget - Service Delivery Statements – Department of Education, Training and Employment 5
investing $3.5 million to provide every State Special School with 20 tablets for their students use and up to 10 tablets to each state or non-state school offering a special education program investing $2 million as part of $4 million over three years to establish the Queensland Schools Plan Commission which will streamline and coordinate the processes for the planning, establishment and expansion of government and non-government schools across Queensland implementing the Australian Government’s Investing in Focus Schools initiative to support Aboriginal and Torres Strait Islander students in identified state schools providing additional funding of $1 million over four years to support Queensland schools with access to chaplaincy services providing $1 million over four years to develop a school education program for all Queensland schools to arm children with knowledge to protect themselves and encourage reports of suspected abuses including implementation of the Daniel Morcombe Child Safety Curriculum providing $1 million over three years to sponsor delegations of Queensland high school students to travel to ANZAC Day ceremonies at Gallipoli and the Western Front from 2013 to 2015.
Training, Tertiary Education and Employment
delivering services to over 288,000 students enrolled in vocational education and training leading to over 81,000 students completing their qualifications at the highly valued levels of Certificate III and above through the TAFE and statutory TAFE institute network and government funded training at private registered training organisations (as at 30 June 2012) working with the Skills and Training Taskforce to reform the Vocational Education and Training (VET) system with a focus on developing skilled, job-ready Queenslanders through a demand driven training system investing up to $86 million over six years to support 10,000 additional apprentices to help meet skill shortages investing $10 million to fund 500 university scholarships for women of up to $20,000 over four years in traditionally male dominated fields or in areas experiencing skills shortages administered by Skills Queensland supporting growth in the four pillar economy based on tourism, agriculture, resources and construction through working with industry to support training investment, skills alignment and improved pathways working with industry to develop workforce strategies that meet skills and labour needs to contribute to the government objectives of growing the economy and reducing unemployment.

2012-13 Queensland State Budget - Service Delivery Statements – Department of Education, Training and Employment 6
Departmental Budget Summary
The table below shows the total resources available in 2012-13 from all sources and summarises how resources will be applied by service area and by controlled and administered classifications.
Department of Education, Training and Employment
2011-12 Adjusted Budget
$’000
2011-12 Est. Actual
$’000
2012-13 Estimate
$’000 CONTROLLED Income Appropriation for services1, 2 Deferred from previous year/s 115,190 (77,304) 183,215 Balance of service appropriation 7,393,391 7,466,904 7,479,287 Other revenue 638,290 782,099 784,249 Total income 8,146,871 8,171,699 8,446,751 Expenses Early Childhood Education and Care 237,685 157,155 332,197 School Education 6,487,248 6,607,752 6,786,542 Training, Tertiary Education and Employment 1,421,938 1,406,792 1,328,012 Total expenses 8,146,871 8,171,699 8,446,751 Operating surplus/deficit .. .. .. Net assets 18,926,755 17,726,079 18,010,551 ADMINISTERED Revenue Commonwealth revenue 1,761,870 1,734,014 1,899,662 Appropriation of administered items 2,440,018 2,409,925 2,611,159 Other administered revenue .. 3,621 8,000 Total revenue 4,201,888 4,147,560 4,518,821 Expenses Transfers to government 1,761,870 1,737,635 1,907,662 Administered expenses 2,440,018 2,409,925 2,611,159 Total expenses 4,201,888 4,147,560 4,518,821 Operating surplus/deficit .. .. .. Net assets 285 285 285 APPROPRIATIONS 1 Controlled Items Departmental services1,2 7,491,677 7,425,300 7,626,802 Equity adjustment (16,661) (79,714) (107,222) Administered items2 2,438,103 2,409,922 2,611,162 VOTE TOTAL3 9,913,119 9,755,508 10,130,742
2012-13 Queensland State Budget - Service Delivery Statements – Department of Education, Training and Employment 7
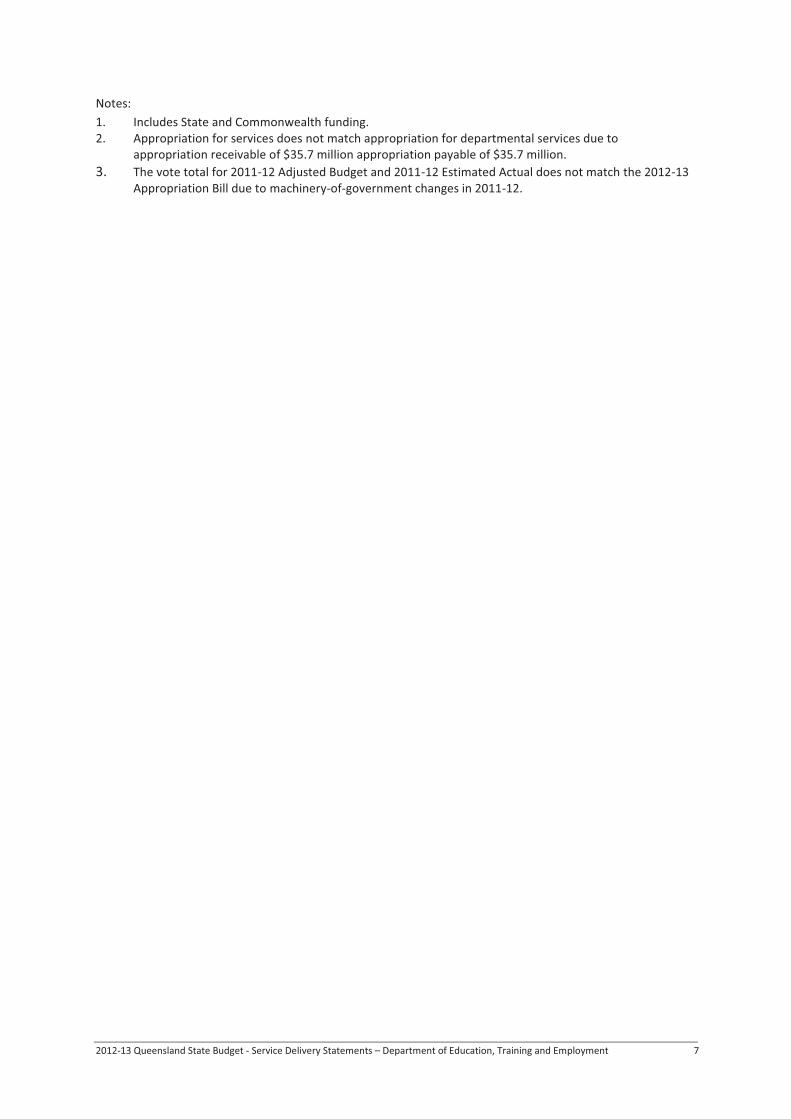
Notes: 1. Includes State and Commonwealth funding. 2. Appropriation for services does not match appropriation for departmental services due to
appropriation receivable of $35.7 million appropriation payable of $35.7 million. 3. The vote total for 2011-12 Adjusted Budget and 2011-12 Estimated Actual does not match the 2012-13
Appropriation Bill due to machinery-of-government changes in 2011-12.
2012-13 Queensland State Budget - Service Delivery Statements – Department of Education, Training and Employment 8
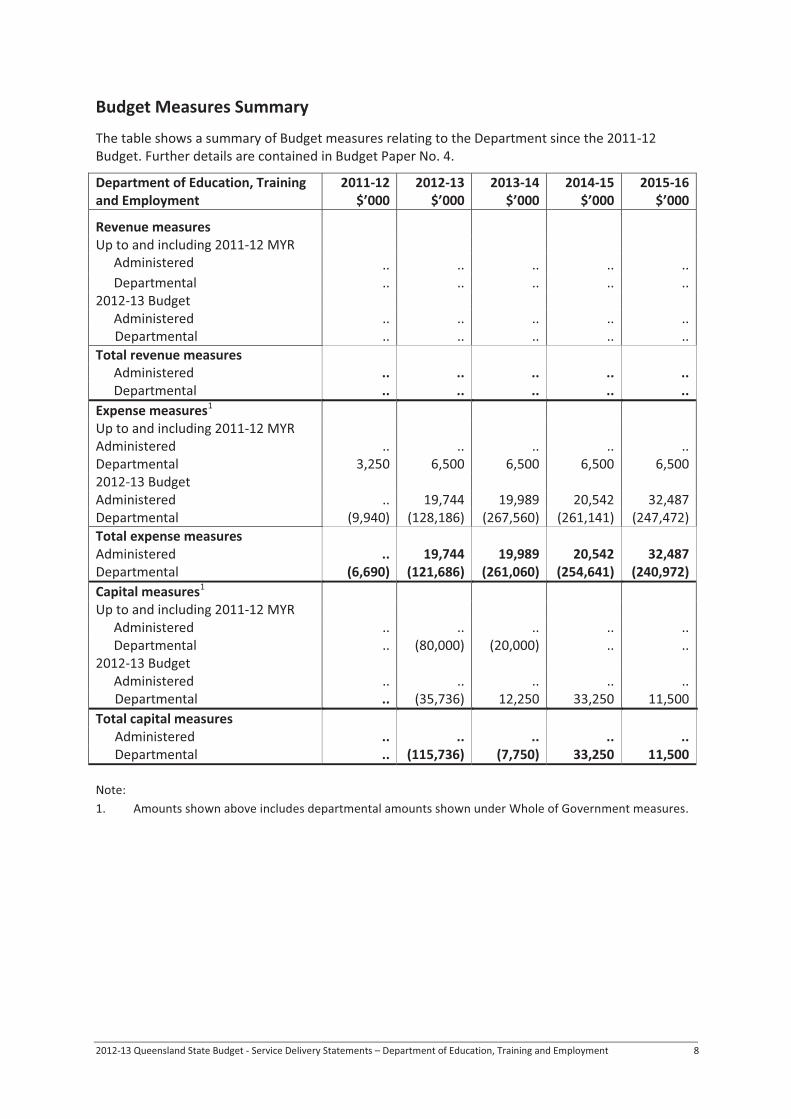
Budget Measures Summary
The table shows a summary of Budget measures relating to the Department since the 2011-12 Budget. Further details are contained in Budget Paper No. 4.
Department of Education, Training and Employment
2011-12 $’000
2012-13 $’000
2013-14 $’000
2014-15 $’000
2015-16 $’000
Revenue measures Up to and including 2011-12 MYR Administered .. .. .. .. .. Departmental .. .. .. .. .. 2012-13 Budget Administered .. .. .. .. .. Departmental .. .. .. .. .. Total revenue measures Administered .. .. .. .. .. Departmental .. .. .. .. .. Expense measures1 Up to and including 2011-12 MYR Administered .. .. .. .. .. Departmental 3,250 6,500 6,500 6,500 6,500 2012-13 Budget Administered .. 19,744 19,989 20,542 32,487 Departmental (9,940) (128,186) (267,560) (261,141) (247,472) Total expense measures Administered .. 19,744 19,989 20,542 32,487 Departmental (6,690) (121,686) (261,060) (254,641) (240,972) Capital measures1 Up to and including 2011-12 MYR Administered .. .. .. .. .. Departmental .. (80,000) (20,000) .. .. 2012-13 Budget Administered .. .. .. .. .. Departmental .. (35,736) 12,250 33,250 11,500 Total capital measures Administered .. .. .. .. .. Departmental .. (115,736) (7,750) 33,250 11,500 Note: 1. Amounts shown above includes departmental amounts shown under Whole of Government measures.

2012-13 Queensland State Budget - Service Delivery Statements – Department of Education, Training and Employment 9
Staffing1
Notes
2011-12 Adjusted
Budget
2011-12
Est. Actual
2012-13
Estimate2 TOTAL 65,873 66,701 66,204 Notes: 1. Full-Time Equivalent (FTE) are at end of March (Q1) 2011 MOHRI for 11-12 Adjusted Budget and
Q1 2012 MOHRI for 11-12 Estimated Actual and may include staff which are funded through other sources, for example, Commonwealth programs.
2. The 2012-13 estimates are based on the impact of election commitments, forecast enrolment growth and planned savings measures.
2012-13 Queensland State Budget - Service Delivery Statements – Department of Education, Training and Employment 10
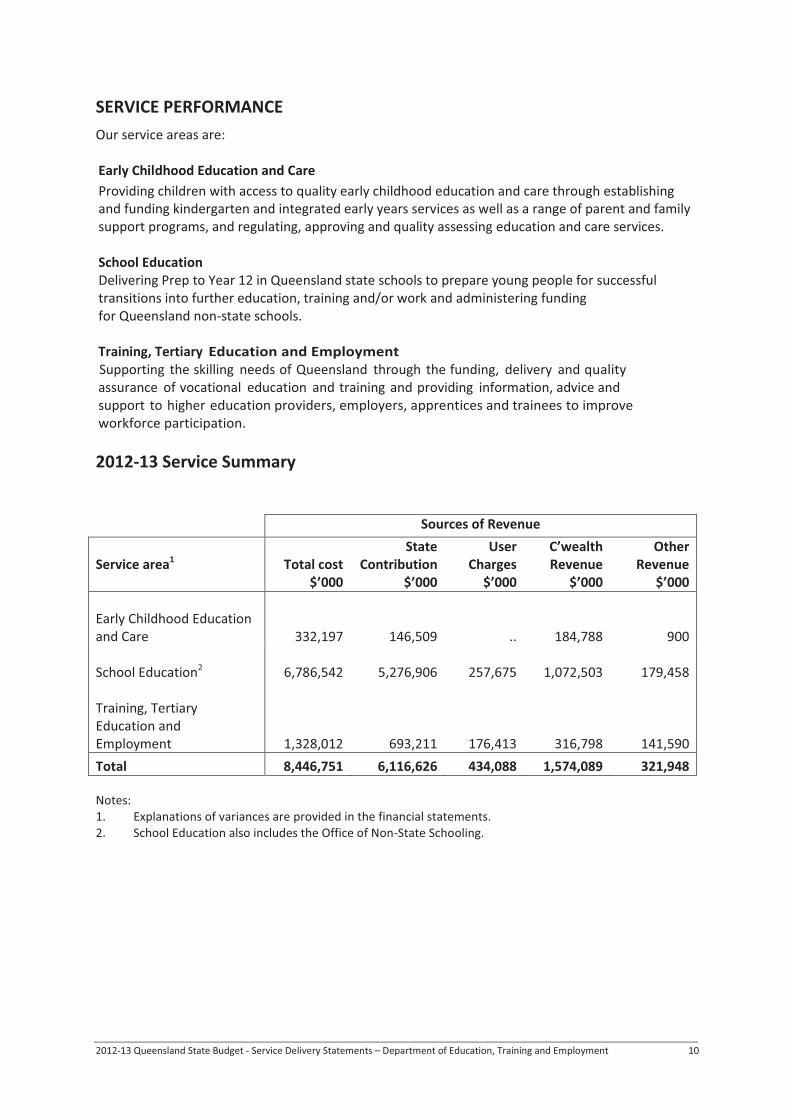
SERVICE PERFORMANCE Our service areas are: Early Childhood Education and Care Providing children with access to quality early childhood education and care through establishing and funding kindergarten and integrated early years services as well as a range of parent and family support programs, and regulating, approving and quality assessing education and care services. School Education Delivering Prep to Year 12 in Queensland state schools to prepare young people for successful transitions into further education, training and/or work and administering funding for Queensland non-state schools. Training, Tertiary Education and Employment Supporting the skilling needs of Queensland through the funding, delivery and quality assurance of vocational education and training and providing information, advice and support to higher education providers, employers, apprentices and trainees to improve workforce participation. 2012-13 Service Summary
Sources of Revenue
Service area1 Total cost$’000
State Contribution
$’000
User Charges
$’000
C’wealth Revenue
$’000
Other Revenue
$’000 Early Childhood Education and Care 332,197 146,509 .. 184,788 900 School Education2 6,786,542 5,276,906 257,675 1,072,503 179,458 Training, Tertiary Education and Employment 1,328,012 693,211 176,413 316,798 141,590 Total 8,446,751 6,116,626 434,088 1,574,089 321,948 Notes: 1. Explanations of variances are provided in the financial statements. 2. School Education also includes the Office of Non-State Schooling.
2012-13 Queensland State Budget - Service Delivery Statements – Department of Education, Training and Employment 11
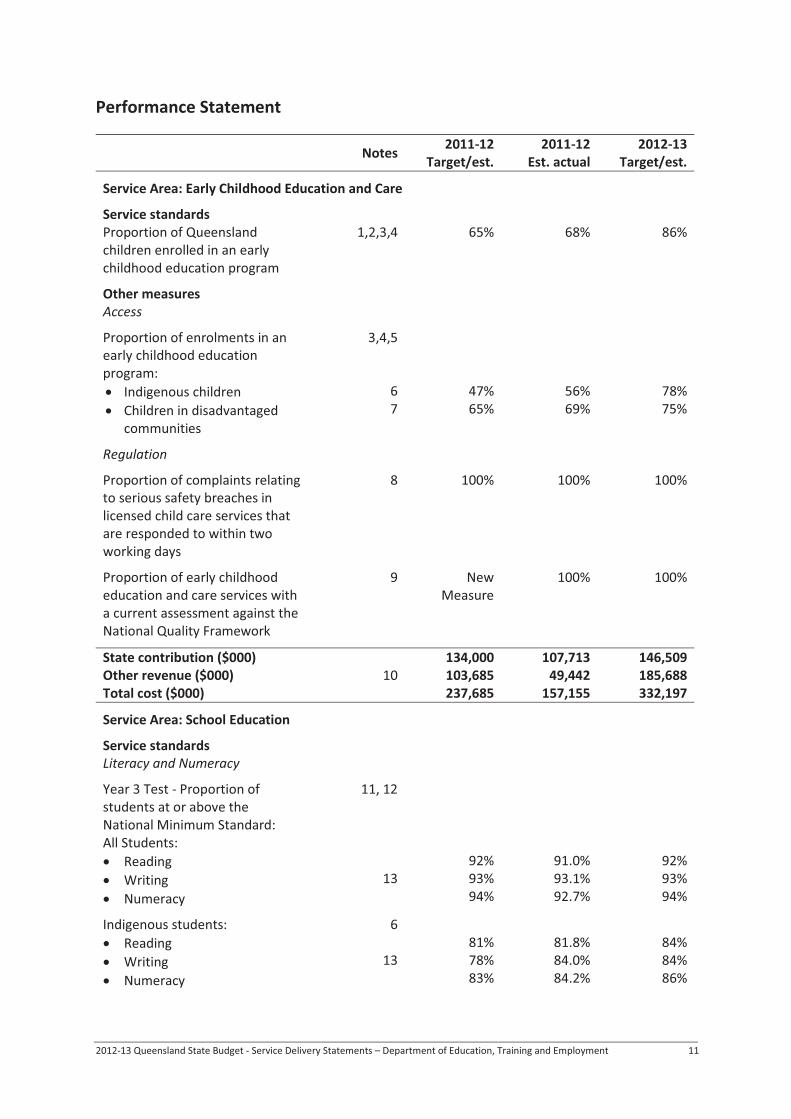
Performance Statement
Notes 2011-12 Target/est.
2011-12 Est. actual
2012-13 Target/est.
Service Area: Early Childhood Education and Care
Service standards Proportion of Queensland children enrolled in an early childhood education program
1,2,3,4
65%
68%
86%
Other measures Access
Proportion of enrolments in an early childhood education program:
Indigenous children Children in disadvantaged communities
3,4,5
6 7
47% 65%
56% 69%
78% 75%
Regulation Proportion of complaints relating to serious safety breaches in licensed child care services that are responded to within two working days
8 100% 100% 100%
Proportion of early childhood education and care services with a current assessment against the National Quality Framework
9 New Measure
100% 100%
State contribution ($000) Other revenue ($000) Total cost ($000)
10
134,000 103,685 237,685
107,713 49,442
157,155
146,509 185,688 332,197
Service Area: School Education
Service standards Literacy and Numeracy Year 3 Test - Proportion of students at or above the National Minimum Standard: All Students:
Reading Writing Numeracy
11, 12
13
92% 93% 94%
91.0% 93.1% 92.7%
92% 93% 94%
Indigenous students: Reading Writing Numeracy
6
13
81% 78% 83%
81.8% 84.0% 84.2%
84% 84% 86%

2012-13 Queensland State Budget - Service Delivery Statements – Department of Education, Training and Employment 12
Notes 2011-12 Target/est.
2011-12 Est. actual
2012-13 Target/est.
Year 5 Test - Proportion of students at or above the National Minimum Standard: All Students:
Reading Writing Numeracy
11, 12
13
88% 90% 93%
83.6% 85.8% 89.7%
88% 90% 93%
Indigenous: Reading Writing Numeracy
6
13
66% 72% 78%
65.1% 68.7% 75.0%
67% 72% 78%
Year 7 Test - Proportion of students at or above the National Minimum Standard: All Students:
Reading Writing Numeracy
11,12
13
94% 92% 95%
93.4% 89.7% 93.2%
94% 92% 95%
Indigenous: Reading Writing Numeracy
6
13
80% 78% 85%
83.3% 74.5% 81.8%
85% 78% 85%
Year 9 Test - Proportion of students at or above the National Minimum Standard: All Students:
Reading Writing Numeracy
11,12
13
90% 86% 94%
88.4% 78.0% 90.8%
90% 86% 94%
Indigenous: Reading Writing Numeracy
6
13
72% 69% 82%
72.6% 56.4% 76.1%
75% 69% 82%
Attainment outcomes
Proportion of Year 12 students awarded a QCE
14 76% 79.5% 80%
Proportion of Year 12 students who are completing or have completed a SAT or were awarded one or more of: QCE, IBD or VET qualification
14 92% 93.0% 93%
Proportion of OP/IBD students who received an OP 1 to 15 or an IBD
70% 70.4% 70%

2012-13 Queensland State Budget - Service Delivery Statements – Department of Education, Training and Employment 13
Notes 2011-12 Target/est.
2011-12 Est. actual
2012-13 Target/est.
Number of students awarded a Queensland Certificate of Individual Achievement (QCIA)
15 500 589 550
Number of students with disabilities who have completed 12 years of schooling
16 1180 1252 1400
Post schooling destinations
Proportion of students who, six months after completing Year 12, are participating in education, training or employment
17 88% 85.8% 88%
Cost and satisfaction Average cost of service per student:
Primary (Prep - Year 7) Secondary (Year 8 - Year 12) Students with Disabilities
$10,957 $13,399 $27,631
$10,997 $13,620 $27,720
$11,082 $13,816 $27,785
Proportion of parents satisfied with their child's school
18,19 84% 84.5% 84%
State contribution ($000) Other revenue ($000) Total cost ($000)
5,206,716 1,280,532 6,487,248
5,260,351 1,347,401 6,607,752
5,276,906 1,509,636 6,786,542
Service Area: Training, Tertiary Education and Employment
Service standards VET outcomes
Proportion of all attempted competencies successfully completed
89% 91.0% 89%
Proportion of Queenslanders with higher qualifications
19,20,21 55% 55.3% 56%
Proportion of graduates in employment or further study
19, 22 87% 85.1% 87%
Cost and satisfaction Proportion of graduates satisfied with the overall quality of their training
19,22 89% 89.3% 89%
Proportion of employers satisfied with graduates of:
nationally accredited training apprenticeships and traineeships
19,23
83%
84%
91.0%
78.6%
83%
83%
2012-13 Queensland State Budget - Service Delivery Statements – Department of Education, Training and Employment 14
Notes 2011-12 Target/est.
2011-12 Est. actual
2012-13 Target/est.
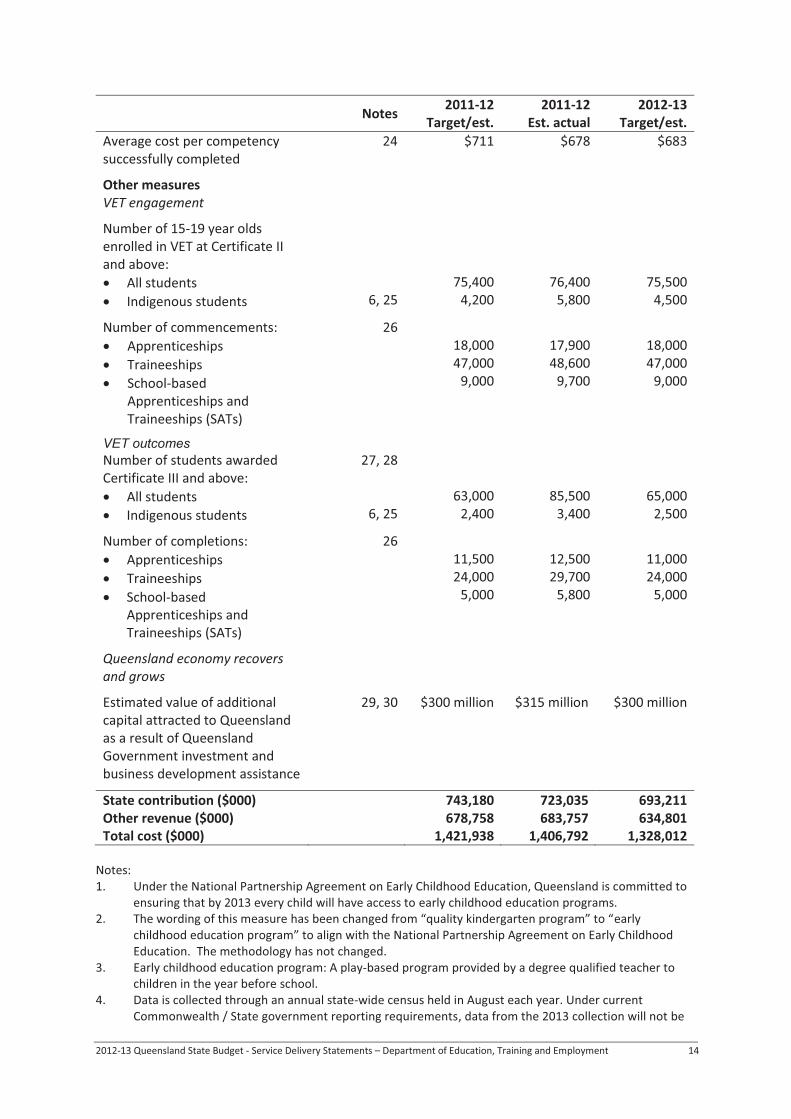
Average cost per competency successfully completed
24 $711 $678 $683
Other measures VET engagement
Number of 15-19 year olds enrolled in VET at Certificate II and above:
All students Indigenous students
6, 25
75,400 4,200
76,400 5,800
75,500 4,500
Number of commencements: Apprenticeships Traineeships School-based Apprenticeships and Traineeships (SATs)
26
18,000 47,000
9,000
17,900 48,600
9,700
18,000 47,000
9,000
VET outcomes
Number of students awarded Certificate III and above:
All students Indigenous students
27, 28
6, 25
63,000 2,400
85,500 3,400
65,000 2,500
Number of completions: Apprenticeships Traineeships School-based Apprenticeships and Traineeships (SATs)
26
11,500 24,000
5,000
12,500 29,700
5,800
11,000 24,000
5,000
Queensland economy recovers and grows
Estimated value of additional capital attracted to Queensland as a result of Queensland Government investment and business development assistance
29, 30 $300 million $315 million $300 million
State contribution ($000) Other revenue ($000) Total cost ($000)
743,180 678,758
1,421,938
723,035 683,757
1,406,792
693,211 634,801
1,328,012 Notes: 1. Under the National Partnership Agreement on Early Childhood Education, Queensland is committed to
ensuring that by 2013 every child will have access to early childhood education programs. 2. The wording of this measure has been changed from “quality kindergarten program” to “early
childhood education program” to align with the National Partnership Agreement on Early Childhood Education. The methodology has not changed.
3. Early childhood education program: A play-based program provided by a degree qualified teacher to children in the year before school.
4. Data is collected through an annual state-wide census held in August each year. Under current Commonwealth / State government reporting requirements, data from the 2013 collection will not be
2012-13 Queensland State Budget - Service Delivery Statements – Department of Education, Training and Employment 15
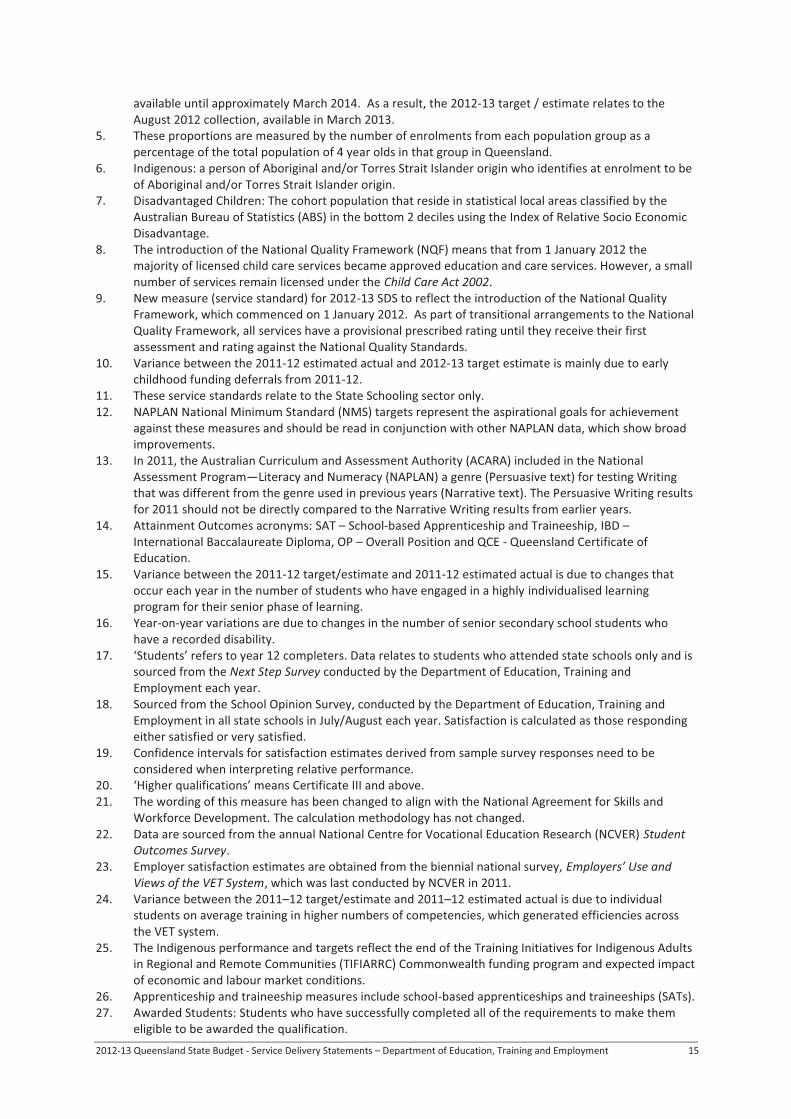
available until approximately March 2014. As a result, the 2012-13 target / estimate relates to the August 2012 collection, available in March 2013.
5. These proportions are measured by the number of enrolments from each population group as a percentage of the total population of 4 year olds in that group in Queensland.
6. Indigenous: a person of Aboriginal and/or Torres Strait Islander origin who identifies at enrolment to be of Aboriginal and/or Torres Strait Islander origin.
7. Disadvantaged Children: The cohort population that reside in statistical local areas classified by the Australian Bureau of Statistics (ABS) in the bottom 2 deciles using the Index of Relative Socio Economic Disadvantage.
8. The introduction of the National Quality Framework (NQF) means that from 1 January 2012 the majority of licensed child care services became approved education and care services. However, a small number of services remain licensed under the Child Care Act 2002.
9. New measure (service standard) for 2012-13 SDS to reflect the introduction of the National Quality Framework, which commenced on 1 January 2012. As part of transitional arrangements to the National Quality Framework, all services have a provisional prescribed rating until they receive their first assessment and rating against the National Quality Standards.
10. Variance between the 2011-12 estimated actual and 2012-13 target estimate is mainly due to early childhood funding deferrals from 2011-12.
11. These service standards relate to the State Schooling sector only. 12. NAPLAN National Minimum Standard (NMS) targets represent the aspirational goals for achievement
against these measures and should be read in conjunction with other NAPLAN data, which show broad improvements.
13. In 2011, the Australian Curriculum and Assessment Authority (ACARA) included in the National Assessment Program—Literacy and Numeracy (NAPLAN) a genre (Persuasive text) for testing Writing that was different from the genre used in previous years (Narrative text). The Persuasive Writing results for 2011 should not be directly compared to the Narrative Writing results from earlier years.
14. Attainment Outcomes acronyms: SAT – School-based Apprenticeship and Traineeship, IBD – International Baccalaureate Diploma, OP – Overall Position and QCE - Queensland Certificate of Education.
15. Variance between the 2011-12 target/estimate and 2011-12 estimated actual is due to changes that occur each year in the number of students who have engaged in a highly individualised learning program for their senior phase of learning.
16. Year-on-year variations are due to changes in the number of senior secondary school students who have a recorded disability.
17. ‘Students’ refers to year 12 completers. Data relates to students who attended state schools only and is sourced from the Next Step Survey conducted by the Department of Education, Training and Employment each year.
18. Sourced from the School Opinion Survey, conducted by the Department of Education, Training and Employment in all state schools in July/August each year. Satisfaction is calculated as those responding either satisfied or very satisfied.
19. Confidence intervals for satisfaction estimates derived from sample survey responses need to be considered when interpreting relative performance.
20. ‘Higher qualifications’ means Certificate III and above. 21. The wording of this measure has been changed to align with the National Agreement for Skills and
Workforce Development. The calculation methodology has not changed. 22. Data are sourced from the annual National Centre for Vocational Education Research (NCVER) Student
Outcomes Survey. 23. Employer satisfaction estimates are obtained from the biennial national survey, Employers’ Use and
Views of the VET System, which was last conducted by NCVER in 2011. 24. Variance between the 2011–12 target/estimate and 2011–12 estimated actual is due to individual
students on average training in higher numbers of competencies, which generated efficiencies across the VET system.
25. The Indigenous performance and targets reflect the end of the Training Initiatives for Indigenous Adults in Regional and Remote Communities (TIFIARRC) Commonwealth funding program and expected impact of economic and labour market conditions.
26. Apprenticeship and traineeship measures include school-based apprenticeships and traineeships (SATs). 27. Awarded Students: Students who have successfully completed all of the requirements to make them
eligible to be awarded the qualification.
2012-13 Queensland State Budget - Service Delivery Statements – Department of Education, Training and Employment 16
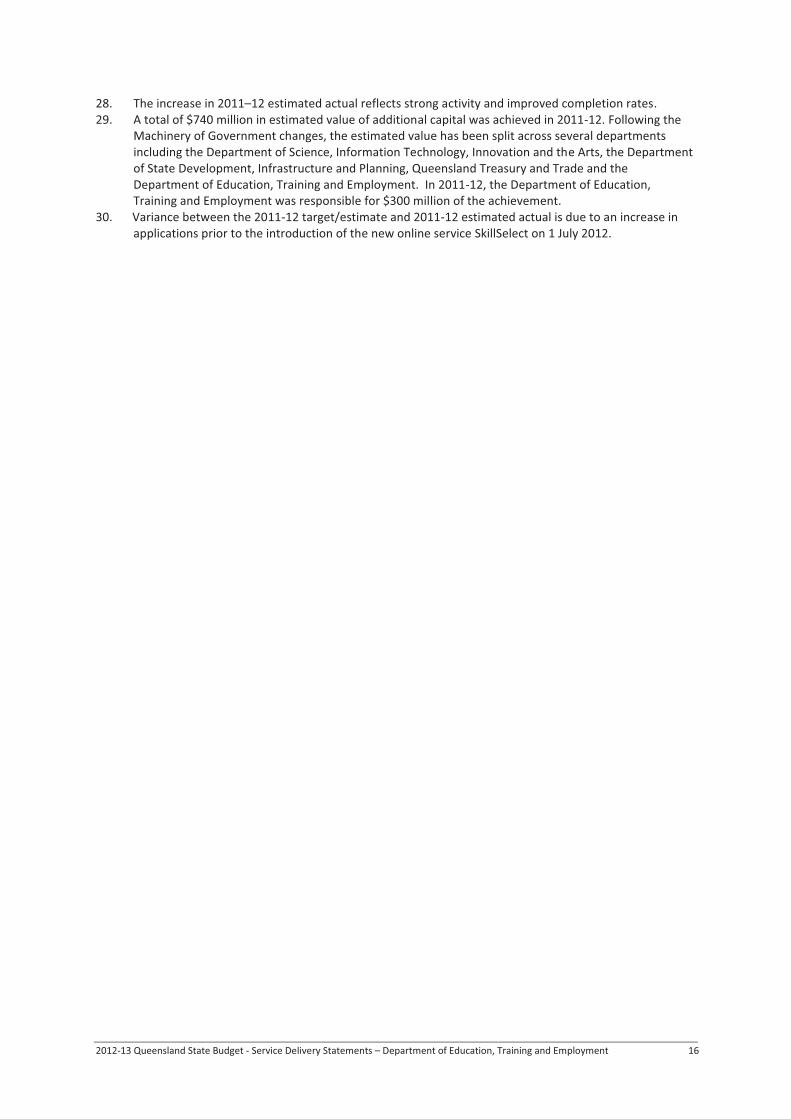
28. The increase in 2011–12 estimated actual reflects strong activity and improved completion rates. 29. A total of $740 million in estimated value of additional capital was achieved in 2011-12. Following the
Machinery of Government changes, the estimated value has been split across several departments including the Department of Science, Information Technology, Innovation and the Arts, the Department of State Development, Infrastructure and Planning, Queensland Treasury and Trade and the Department of Education, Training and Employment. In 2011-12, the Department of Education, Training and Employment was responsible for $300 million of the achievement.
30. Variance between the 2011-12 target/estimate and 2011-12 estimated actual is due to an increase in applications prior to the introduction of the new online service SkillSelect on 1 July 2012.

2012-13 Queensland State Budget - Service Delivery Statements – Department of Education, Training and Employment 17
Discontinued Measures Performance measures included in the 2011-12 Service Delivery Statements that have been discontinued or replaced by better measures are reported in the following table.
Notes 2011-12
Target/est. 2011-12
Est. actual 2012-13
Target/est.
Service Area: Training, Tertiary Education and Employment
Higher education 1
Proportion of stakeholders satisfied with:
departmental management of approval processes
80% .. Discontinued
departmental contribution to quality improvement in the higher education sector
90% .. Discontinued
Queensland has an available, skilled and sustainable workforce
2
Percentage of Queensland children aged under 15 years living in a household without a working parent
12.75% 15.80% Discontinued
People who are in employment or training 12 months after receiving assistance
3 65% 69.0% Discontinued
Indigenous people who are in employment or training 12 months after receiving culturally appropriate mentoring and support
3 70% 82.0% Discontinued
Subsidised apprentices and trainees who are in employment or training 12 months after receiving assistance
3 80% 86.3% Discontinued
Average cost per funded participant of the employment assistance package required to make participants job ready
3,4 $4,600 $4,695 Discontinued
Linking individuals to increased workforce participation and improve labour supply
2
People assisted 3 19,000 23,016 Discontinued
Apprentices and trainees supported
3 5,000
4,602 Discontinued

2012-13 Queensland State Budget - Service Delivery Statements – Department of Education, Training and Employment 18
Notes: 1. On 30 January 2012 the regulatory function for higher education was assumed by the Tertiary Education
Quality and Standards Agency (TEQSA). Due to the transition to the new Commonwealth entity, surveys were not conducted.
2. The performance measures for this objective have been discontinued due to a change in government policy.
3. This performance measure was transferred from the Employment and Economic Development service area of the (former) Department of Employment, Economic Development and Innovation.
4. The increased 2011-12 estimated actual is a result of the redirection of funds to higher cost intensive programs required under the Jobs and Skills Package.

2012-13 Queensland State Budget - Service Delivery Statements – Department of Education, Training and Employment 19
Administered Items
Administered activities are those undertaken by departments on behalf of the Government. The Department of Education, Training and Employment administers funds on behalf of the State, which includes financial assistance to non-state schools for both capital and recurrent purposes. In 2012-13 a total of $610.1 million in State-funded recurrent and capital grants will be directed to non-state schools. The department also administers Australian Government funds received for non-state schools in Queensland. In addition, the Department of Education, Training and Employment administers funds on behalf of the State including
$0.3 million in financial support to student hostels $3.7 million to community organisations for the provision of specialist support for students with special needs $9.6 million to Skills Queensland which was established to provide industry with leadership for skills and workforce development.
Financial statements and variance explanations in relation to Administered Items appear in the Departmental Financial Statements.

2012-13 Queensland State Budget - Service Delivery Statements – Department of Education, Training and Employment 20
ADMINISTERED ITEMS STATEMENT
Department of Education, Training and Employment Notes
2011-12 Adjusted
Budget $’000
2011-12 Est. act.
$’000
2012-13
Estimate $’000
STATE FUNDING Assistance to non-state sector
Assistance to non-state schools
Recurrent funding for non-state schools
General recurrent grants 5, 11 516,597 516,045 517,888 Grammar school endowments 164 164 164 School Transport 4,870 4,907 5,055 Total recurrent funding for non-state schools 521,631 521,116 523,107
Capital assistance for non-state schools
Capital assistance 45,982 45,982 45,982 External Infrastructure 5,393 5,393 5,393 Transition of Year 7 to Secondary 1, 6, 12 1,505 .. 16,849 Building Queensland Schools of the future 7, 13 .. .. 18,750
Total capital assistance for non-state schools 52,880 51,375 86,974 Total assistance for non-state schools 574,511 572,491 610,081 Assistance to other non-state sector Student Hostels Recurrent 2 238 178 189 Capital 2 100 65 100 Total Student Hostels 338 243 289 Living away from home allowances 8,14 6,492 6,202 7,253 Textbook and resource allowances 8,14 17,586 17,704 19,178 Weekend and vacation travel 44 42 44 Community Organisations 3,561 3,588 3,696 Non-state Accreditation Board 54 54 54 Total Assistance to other non-state sector 28,075 27,833 30,514 Total Assistance to non-state sector 602,586 600,324 640,595 Other Textbook and resource allowance - state 28,496 28,879 28,450 Queensland Studies Authority 33,437 33,640 32,758 Skills Queensland 9,942 9,640 9,594 Employment-Western Cape Communities 3, 9,15 1,915 3,398 .. Other 1,772 30 100 TOTAL STATE FUNDING 678,148 675,911 711,497

2012-13 Queensland State Budget - Service Delivery Statements – Department of Education, Training and Employment 21
Department of Education, Training and Employment Notes
2011-12 Adjusted
Budget $’000
2011-12 Est. act.
$’000
2012-13
Estimate $’000
AUSTRALIAN GOVERNMENT ASSISTANCE TO NON-STATE EDUCATION 4, 10, 16 1,761,870 1,734,014 1,899,662 TOTAL ADMINISTERED ITEMS 2,440,018 2,409,925 2,611,159
Notes: Major variations between 2011-12 Adjusted Budget and 2011-12 Estimated Actual include: 1. Decrease due to the deferral of funding for Transition of Year 7 to Secondary program from 2011-12 to
2012-13. 2. Change due to the net impacts of student enrolment movement and CPI indexation. 3. Increase due to the payment of the additional funds to the Western Cape Communities in 2011-12. 4. Decrease due to Australian Government funding to non-state schools, including deferred funding from
2011-12 to 2012-13. Major variations between 2011-12 Adjusted Budget and 2012-13 Estimate include: 5. Increase due to funding for Government election commitments (School Chaplains, Literacy and
Numeracy, Supporting Queenslanders with a Disability, Strengthening Queensland Families – Protecting our Children, Boosting Teacher Aide Hours for Prep Year, Tablet Technology for Special Needs Students), offset partially by the flow on impact of Whole of Government savings measures.
6. Increase due to capital grant funding for Transition of Year 7 to Secondary deferred from 2011-12 to 2012-13.
7. Increase due to funding for new Government election commitment – Building Queensland Schools of the future (for more detail on the commitments, refer to Budget Paper 4).
8. Increase due to the net impacts of student enrolment movement and CPI indexation. 9. Decrease due to the transfer of funding for the Western Cape Communities to the Department of
Aboriginal and Torres Strait Islander and Multicultural Affairs from 2012-13. 10. Increase associated with Australian Government funding for non-state schools. Major variations between 2011-12 Estimated Actual and 2012-13 Estimate include: 11. Increase due to funding for Government election commitments (School Chaplains, Literacy and
Numeracy, Supporting Queenslanders with a Disability, Strengthening Queensland Families – Protecting our Children, Boosting Teacher Aide Hours for Prep Year, Tablet Technology for Special Needs Students), offset partially by the flow on impact of Whole of Government savings measures.
12. Increase due to capital grant funding for Transition of Year 7 to Secondary deferred from 2011-12 to 2012-13.
13. Increase due to funding for new Government election commitment – Building Queensland Schools of the future (for more detail on the commitments, refer to Budget Paper 4).
14. Increase due to the net impacts of student enrolment movement and CPI indexation. 15. Decrease due to the transfer of funding for the Western Cape Communities to the Department of
Aboriginal and Torres Strait Islander and Multicultural Affairs from 2012-13. 16. Increase associated with Australian Government funding for non-state schools.

2012-13 Queensland State Budget - Service Delivery Statements – Department of Education, Training and Employment 22
CAPITAL
Capital program The Department of Education, Training and Employment has an extensive capital program across the entire continuum of learning. In 2012-13, key highlights of the department’s capital program will include: Early Childhood
investing $5.5 million to establish four kindergarten services on state school sites to open in 2012-13 extending the capacity of integrated early childhood services for families with children from birth to eight years, by investing capital funding of $2.4 million to establish an Early Years Centre in Coomera Springs as part of the total funding commitment of $32 million investing $11.5 million to construct four children and family centres to cater for the needs of Indigenous children from birth to eight years at Logan, Mackay, Palm Island and Rockhampton, as part of a joint initiative with the Australian Government.
School Education
investing $148.2 million to build two new secondary schools at Northern Mackay and Pimpama to meet enrolment growth demand, relocate Valkyrie State School, undertake staged work at ten schools, buy land and provide additional classrooms in growth areas throughout the State investing $62.1 million to continue the implementation of the introduction of Year 7 as the first year of secondary from 2015 continuing the South East Queensland (SEQ) Schools Public Private Partnership (PPP) project to build, operate and maintain seven new schools in high growth areas within South East Queensland to deliver Stage two at Augusta State School at Augustine Heights, Coomera Rivers State School at East Coomera and WoodLinks State School at Collingwood Park investing $51.9 million to replace and enhance facilities at existing state schools including $5.3 million to complete the enhancements of Tully State High School as a result of Cyclone Yasi investing $5.8 million to acquire new employee housing and to refurbish and maintain existing housing assets investing $43.2 million of Australian Government funding to upgrade or build new training facilities for schools under the Trade Training Centres in Schools Program in Queensland investing $115 million over four years to the state and non-state school sector as part of Building Queensland School of the Future program to provide better infrastructure and planning for Queensland schools commencing the planning of Highfields State High School in preparation for opening in 2015 $4.3 million to build a new sports hall at The Gap State High School $2.6 million to build a new two-storey classroom building to replace existing relocatable buildings at Ashgrove State School.
Training $24.1 million to continue the development of the Central Queensland major trade and technical skills campus at Mackay $3.3 million to continue the redevelopment of the Bracken Ridge and Eagle Farm campuses of SkillsTech Australia $1.8 million to complete the QUT library facility at the Caboolture Campus of the Brisbane North Institute of TAFE.

2012-13 Queensland State Budget - Service Delivery Statements – Department of Education, Training and Employment 23
Capital budget statement
Department of Education, Training and Employment Notes
2011-12 Adjusted
Budget $’000
2011-12
Est. Actual $’000
2012-13
Estimate $’000
Capital Purchases1 Total land, buildings and infrastructure 2 478,589 426,081 394,608 Total plant and equipment 3 33,407 46,012 55,928 Total other capital .. .. .. Total Capital Purchases 4 511,996 472,093 450,536 Notes: 1. For more detail on the agency’s capital acquisitions please refer to Budget Paper 3. 2. Differences between the years reflect the roll out of the Kindergarten infrastructure and Child and
Family Centres, and the finalisation of initiatives under the Queensland Skills Plan. 3. Total plant and equipment includes information, communication and technology associated with
Training services. 4. Total Capital Purchases does not include capital grants.
2012-13 Queensland State Budget - Service Delivery Statements – Department of Education, Training and Employment 24
BUDGETED FINANCIAL STATEMENTS
Analysis of budgeted financial statements
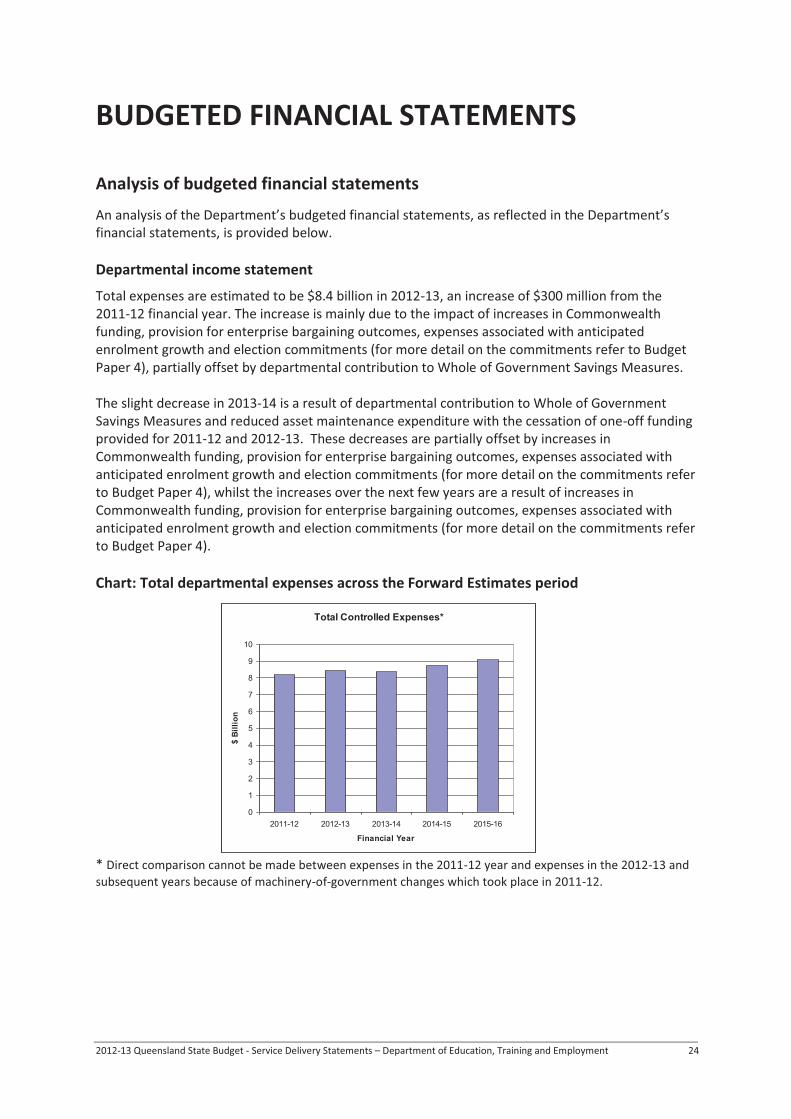
An analysis of the Department’s budgeted financial statements, as reflected in the Department’s financial statements, is provided below. Departmental income statement
Total expenses are estimated to be $8.4 billion in 2012-13, an increase of $300 million from the 2011-12 financial year. The increase is mainly due to the impact of increases in Commonwealth funding, provision for enterprise bargaining outcomes, expenses associated with anticipated enrolment growth and election commitments (for more detail on the commitments refer to Budget Paper 4), partially offset by departmental contribution to Whole of Government Savings Measures. The slight decrease in 2013-14 is a result of departmental contribution to Whole of Government Savings Measures and reduced asset maintenance expenditure with the cessation of one-off funding provided for 2011-12 and 2012-13. These decreases are partially offset by increases in Commonwealth funding, provision for enterprise bargaining outcomes, expenses associated with anticipated enrolment growth and election commitments (for more detail on the commitments refer to Budget Paper 4), whilst the increases over the next few years are a result of increases in Commonwealth funding, provision for enterprise bargaining outcomes, expenses associated with anticipated enrolment growth and election commitments (for more detail on the commitments refer to Budget Paper 4). Chart: Total departmental expenses across the Forward Estimates period
Total Controlled Expenses*
0
1
2
3
4
5
6
7
8
9
10
2011-12 2012-13 2013-14 2014-15 2015-16
Financial Year
$ Bi
llion
* Direct comparison cannot be made between expenses in the 2011-12 year and expenses in the 2012-13 and subsequent years because of machinery-of-government changes which took place in 2011-12.

2012-13 Queensland State Budget - Service Delivery Statements – Department of Education, Training and Employment 25
Departmental balance sheet
The Department’s major assets are in property, plant and equipment, which includes land and buildings ($18 billion) and intangibles ($90 million) and these categories are expected to increase by approximately 2% per annum respectively over the next three years, as a result of investment in the department’s capital program and the impact of anticipated asset revaluations over this period. The Department’s main liabilities relate to payables and finance lease liabilities, with total departmental liabilities estimated to increase by $113 million (or 11%) by 2015-16.

2012-13 Queensland State Budget - Service Delivery Statements – Department of Education, Training and Employment 26
INCOME STATEMENT
Department of Education, Training and Employment Notes
2011-12 Adjusted
Budget $’000
2011-12
Est. Act. $’000
2012-13
Estimate $’000
Income Service revenue 1,10,19 7,508,581 7,389,600 7,662,502 User charges 2,11 185,968 430,910 434,088 Grants and other contributions 3,12 316,850 188,890 181,089 Other revenue 4,13 135,500 161,332 169,072 Gains on sale/revaluation of property, plant and equipment and investments (28) 967 ..
Total income 8,146,871 8,171,699 8,446,751 Expenses
Employee expenses 5,14,20 5,550,270 5,683,061 5,809,301 Supplies and services 6,15,21 1,557,754 1,510,159 1,537,851 Grants and subsidies 7,16,22 398,510 331,790 488,529 Depreciation and amortisation 8,17,23 519,511 483,811 505,728 Finance/borrowing costs 41,212 39,449 41,556 Other expenses 59,621 55,157 63,786 Losses on sale/revaluation of property, plant and equipment and investments 9,18,24
19,993 68,272 ..
Total expenses 8,146,871 8,171,699 8,446,751 OPERATING SURPLUS/(DEFICIT) .. .. ..
STATEMENT OF CHANGES IN EQUITY
Department of Education, Training and Employment Notes
2011-12 Adjusted
Budget $’000
2011-12 Est. act.
$’000
2012-13
Estimate $’000
Net effect of the changes in accounting policies and prior year adjustments .. .. .. Increase/(decrease) in asset revaluation reserve 25,28 389,566 110,722 427,886 Net amount of all revenue and expense adjustments direct to equity not disclosed above (22,116) .. .. Net income recognised directly in equity 367,450 110,722 427,886 Surplus/(deficit) for the period .. .. .. Total recognised income and expense for the period 367,450 110,722 427,886 Equity injection/(withdrawal) 26,27,29 (16,756) (44,109) (143,414) Equity adjustments (MoG transfers) 1,614 14,064 .. Total movement in equity for period 352,308 80,677 284,472

2012-13 Queensland State Budget - Service Delivery Statements – Department of Education, Training and Employment 27
BALANCE SHEET
Department of Education, Training and Employment Notes
2011-12 Adjusted
Budget $’000
2011-12 Est. act.
$’000
2012-13
Estimate $’000
CURRENT ASSETS Cash assets 30,40,50 379,376 228,746 251,140 Receivables 31,41,51 144,384 216,193 180,493 Other financial assets .. .. .. Inventories 2,777 4,024 4,024 Other 32,42 35,053 107,461 100,147 Non-financial assets held for sale 33,43 81,930 48,768 48,768
Total current assets 643,520 605,192 584,572 NON-CURRENT ASSETS
Receivables .. .. .. Other financial assets .. .. .. Property, plant and equipment 34,44,52 19,353,784 18,033,058 18,317,995 Intangibles 35,45 22,763 90,422 83,878 Other .. .. ..
Total non-current assets 19,376,547 18,123,480 18,401,873
TOTAL ASSETS 20,020,067 18,728,672 18,986,445 CURRENT LIABILITIES
Payables 36,46,53 430,319 424,294 388,594 Accrued employee benefits 37,47 86,589 23,949 27,190 Interest-bearing liabilities and derivatives 12,660 15,114 16,082 Provisions 613 .. .. Other 38,48 72,125 57,363 57,363
Total current liabilities 602,306 520,720 489,229 NON-CURRENT LIABILITIES
Payables .. .. .. Accrued employee benefits .. .. .. Interest-bearing liabilities and derivatives 490,729 481,557 486,349 Provisions 277 316 316 Other .. .. ..
Total non-current liabilities 491,006 481,873 486,665
TOTAL LIABILITIES 1,093,312 1,002,593 975,894
NET ASSETS/(LIABILITIES) 18,926,755 17,726,079 18,010,551 EQUITY
Capital/contributed equity 39,49,54 5,020,019 5,040,968 4,897,554 Accumulated surplus/(accumulated deficit) 19,609 42,905 42,905 Reserves:
- Asset revaluation surplus 13,887,127 12,642,206 13,070,092 - Other (specify) .. .. ..
TOTAL EQUITY 18,926,755 17,726,079 18,010,551
2012-13 Queensland State Budget - Service Delivery Statements – Department of Education, Training and Employment 28
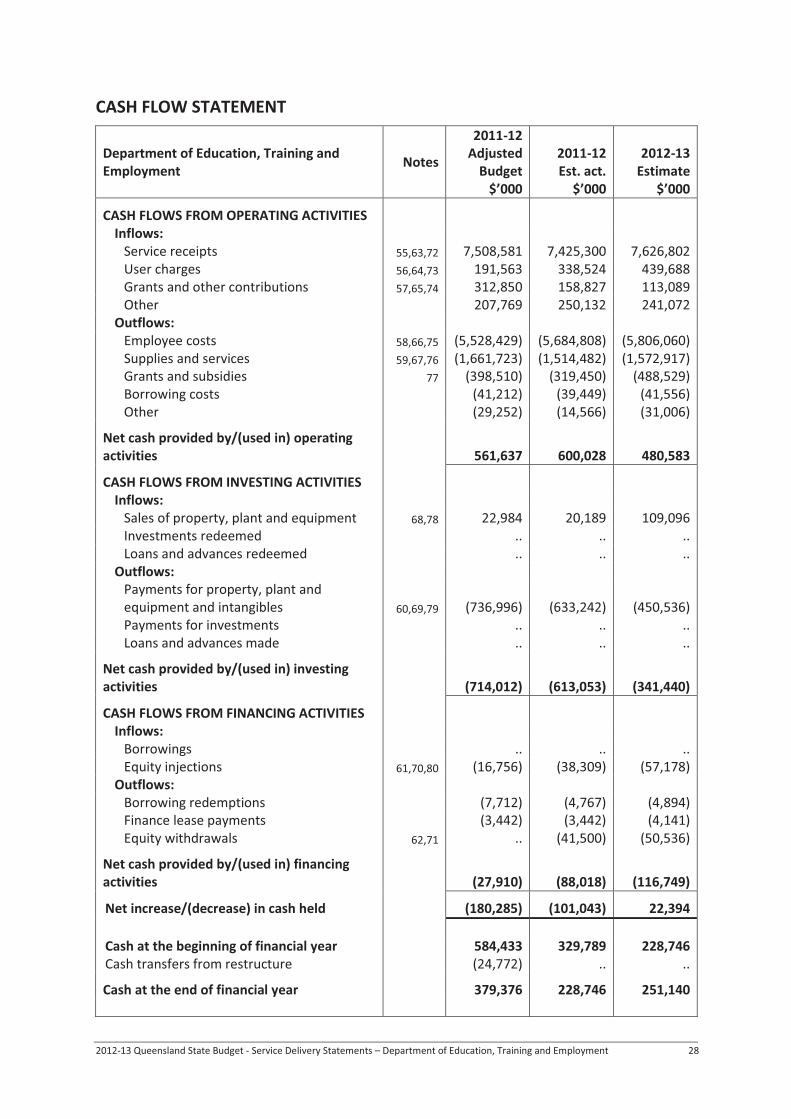
CASH FLOW STATEMENT
Department of Education, Training and Employment Notes
2011-12 Adjusted
Budget $’000
2011-12 Est. act.
$’000
2012-13
Estimate $’000
CASH FLOWS FROM OPERATING ACTIVITIES Inflows:
Service receipts 55,63,72 7,508,581 7,425,300 7,626,802 User charges 56,64,73 191,563 338,524 439,688 Grants and other contributions 57,65,74 312,850 158,827 113,089 Other 207,769 250,132 241,072
Outflows: Employee costs 58,66,75 (5,528,429) (5,684,808) (5,806,060) Supplies and services 59,67,76 (1,661,723) (1,514,482) (1,572,917) Grants and subsidies 77 (398,510) (319,450) (488,529) Borrowing costs (41,212) (39,449) (41,556) Other (29,252) (14,566) (31,006)
Net cash provided by/(used in) operating activities 561,637 600,028 480,583
CASH FLOWS FROM INVESTING ACTIVITIES Inflows:
Sales of property, plant and equipment 68,78 22,984 20,189 109,096 Investments redeemed .. .. .. Loans and advances redeemed .. .. ..
Outflows: Payments for property, plant and equipment and intangibles 60,69,79 (736,996) (633,242) (450,536) Payments for investments .. .. .. Loans and advances made .. .. ..
Net cash provided by/(used in) investing activities (714,012) (613,053) (341,440)
CASH FLOWS FROM FINANCING ACTIVITIES Inflows:
Borrowings .. .. .. Equity injections 61,70,80 (16,756) (38,309) (57,178)
Outflows: Borrowing redemptions (7,712) (4,767) (4,894) Finance lease payments (3,442) (3,442) (4,141) Equity withdrawals 62,71 .. (41,500) (50,536)
Net cash provided by/(used in) financing activities (27,910) (88,018) (116,749)
Net increase/(decrease) in cash held (180,285) (101,043) 22,394 Cash at the beginning of financial year 584,433 329,789 228,746 Cash transfers from restructure (24,772) .. ..
Cash at the end of financial year 379,376 228,746 251,140

2012-13 Queensland State Budget - Service Delivery Statements – Department of Education, Training and Employment 29
ADMINISTERED INCOME STATEMENT
Department of Education, Training and Employment Notes
2011-12 Adjusted
Budget $’000
2011-12 Est. act.
$’000
2012-13
Estimate $’000
Revenues Commonwealth grants 81,83,85 1,761,870 1,734,014 1,899,662 Taxes, fees and fines .. .. .. Royalties, property income and other territorial revenue .. .. .. Interest .. .. .. Administered revenue 82,84,86 2,440,018 2,409,925 2,611,159 Other .. 3,621 8,000
Total revenues 4,201,888 4,147,560 4,518,821 Expenses
Supplies and services 23 11 23 Depreciation and amortisation .. .. .. Grants and subsidies 82,84,86 2,439,255 2,409,251 2,610,261 Benefit payments 740 663 875 Borrowing costs .. .. .. Other .. .. ..
Total expenses 2,440,018 2,409,925 2,611,159 Net surplus or deficit before transfers to Government 1,761,870 1,737,635 1,907,662 Transfers of administered revenue to Government 1,761,870 1,737,635 1,907,662 OPERATING SURPLUS/(DEFICIT) .. .. ..

2012-13 Queensland State Budget - Service Delivery Statements – Department of Education, Training and Employment 30
ADMINISTERED BALANCE SHEET
Department of Education, Training and Employment Notes
2011-12 Adjusted
Budget $’000
2011-12 Est. act.
$’000
2012-13
Estimate $’000
CURRENT ASSETS Cash assets 87,90 285 10,731 285 Receivables .. 122 .. Inventories Other .. .. .. Non-financial assets held for sale .. .. ..
Total current assets 285 10,853 285 NON-CURRENT ASSETS
Receivables .. .. .. Other financial assets .. .. .. Property, plant and equipment .. .. .. Intangibles .. .. .. Other .. .. ..
Total non-current assets .. .. .. TOTAL ADMINISTERED ASSETS 285 10,853 285 CURRENT LIABILITIES
Payables 88,91 .. 6,983 .. Transfers to Government payable 89,92 .. 3,585 .. Interest-bearing liabilities .. .. .. Other .. .. ..
Total current liabilities .. 10,568 .. NON-CURRENT LIABILITIES
Payables .. .. .. Interest-bearing liabilities .. .. .. Other .. .. ..
Total non-current liabilities .. .. .. TOTAL ADMINISTERED LIABILITIES .. 10,568 .. ADMINISTERED NET ASSETS/(LIABILITIES) 285 285 285 EQUITY
Capital/Contributed equity .. .. .. Accumulated surplus/(Accumulated deficit) 285 285 285 Reserves: .. .. ..
- Asset revaluation surplus .. .. .. - Other (specify) .. .. ..
TOTAL ADMINISTERED EQUITY 285 285 285

2012-13 Queensland State Budget - Service Delivery Statements – Department of Education, Training and Employment 31
ADMINISTERED CASHFLOW STATEMENT
Department of Education, Training and Employment Notes
2011-12 Adjusted
Budget $’000
2011-12 Est. act.
$’000
2012-13
Estimate $’000
CASH FLOWS FROM OPERATING ACTIVITIES Inflows:
Administered item receipts 93,96,99 2,440,018 2,409,922 2,611,162 Grants and other contributions 94,97,100 1,761,870 1,737,635 1,907,662 Taxes, fees and fines .. .. .. Royalties, property income and other territorial revenues .. .. .. Other .. 94 119
Outflows: Transfers to Government 94,97,100 (1,761,870) (1,734,050) (1,911,247) Grants and subsidies 93,96,99 (2,439,995) (2,402,931) (2,618,119) Supplies and services (23) (17) (23) Borrowing costs .. .. .. Other .. .. ..
Net cash provided by/(used in) operating activities 95,98 .. 10,653 (10,446)
CASH FLOWS FROM INVESTING ACTIVITIES Inflows:
Sales of property, plant and equipment .. .. .. Investments redeemed .. .. .. Loans and advances redeemed .. .. ..
Outflows: Payments for property, plant and equipment and intangibles .. .. .. Payments for investments .. .. .. Loans and advances made .. .. ..
Net cash provided by/(used in) investing activities .. .. .. CASH FLOWS FROM FINANCING ACTIVITIES
Inflows:
Borrowings .. .. .. Equity injections .. .. ..
Outflows: Borrowing redemptions .. .. .. Finance lease payments Equity withdrawals .. .. ..
Net cash provided by/(used in) financing activities .. .. .. Net increase/(decrease) in cash held .. 10,653 (10,446)
Administered cash at beginning of financial year 285 78 10,731
Cash transfers from restructure .. .. .. Administered cash at end of financial year 285 10,731 285
2012-13 Queensland State Budget - Service Delivery Statements – Department of Education, Training and Employment 32
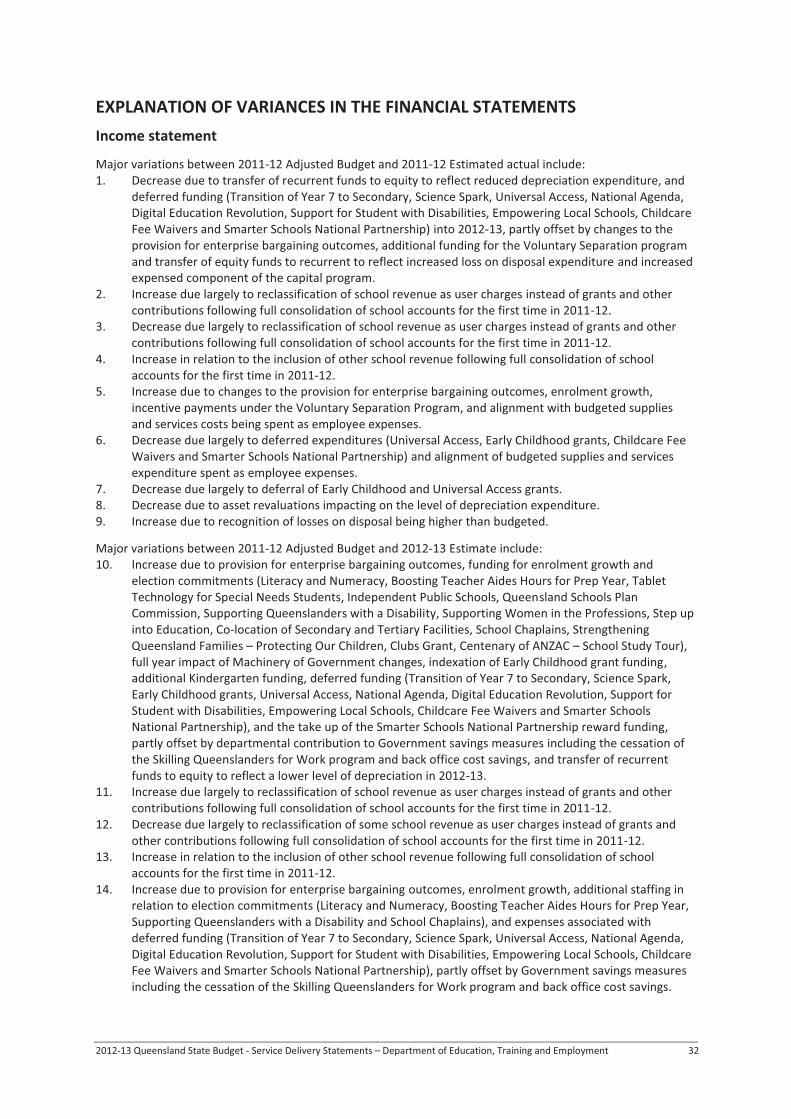
EXPLANATION OF VARIANCES IN THE FINANCIAL STATEMENTS Income statement
Major variations between 2011-12 Adjusted Budget and 2011-12 Estimated actual include: 1. Decrease due to transfer of recurrent funds to equity to reflect reduced depreciation expenditure, and
deferred funding (Transition of Year 7 to Secondary, Science Spark, Universal Access, National Agenda, Digital Education Revolution, Support for Student with Disabilities, Empowering Local Schools, Childcare Fee Waivers and Smarter Schools National Partnership) into 2012-13, partly offset by changes to the provision for enterprise bargaining outcomes, additional funding for the Voluntary Separation program and transfer of equity funds to recurrent to reflect increased loss on disposal expenditure and increased expensed component of the capital program.
2. Increase due largely to reclassification of school revenue as user charges instead of grants and other contributions following full consolidation of school accounts for the first time in 2011-12.
3. Decrease due largely to reclassification of school revenue as user charges instead of grants and other contributions following full consolidation of school accounts for the first time in 2011-12.
4. Increase in relation to the inclusion of other school revenue following full consolidation of school accounts for the first time in 2011-12.
5. Increase due to changes to the provision for enterprise bargaining outcomes, enrolment growth, incentive payments under the Voluntary Separation Program, and alignment with budgeted supplies and services costs being spent as employee expenses.
6. Decrease due largely to deferred expenditures (Universal Access, Early Childhood grants, Childcare Fee Waivers and Smarter Schools National Partnership) and alignment of budgeted supplies and services expenditure spent as employee expenses.
7. Decrease due largely to deferral of Early Childhood and Universal Access grants. 8. Decrease due to asset revaluations impacting on the level of depreciation expenditure. 9. Increase due to recognition of losses on disposal being higher than budgeted.
Major variations between 2011-12 Adjusted Budget and 2012-13 Estimate include: 10. Increase due to provision for enterprise bargaining outcomes, funding for enrolment growth and
election commitments (Literacy and Numeracy, Boosting Teacher Aides Hours for Prep Year, Tablet Technology for Special Needs Students, Independent Public Schools, Queensland Schools Plan Commission, Supporting Queenslanders with a Disability, Supporting Women in the Professions, Step up into Education, Co-location of Secondary and Tertiary Facilities, School Chaplains, Strengthening Queensland Families – Protecting Our Children, Clubs Grant, Centenary of ANZAC – School Study Tour), full year impact of Machinery of Government changes, indexation of Early Childhood grant funding, additional Kindergarten funding, deferred funding (Transition of Year 7 to Secondary, Science Spark, Early Childhood grants, Universal Access, National Agenda, Digital Education Revolution, Support for Student with Disabilities, Empowering Local Schools, Childcare Fee Waivers and Smarter Schools National Partnership), and the take up of the Smarter Schools National Partnership reward funding, partly offset by departmental contribution to Government savings measures including the cessation of the Skilling Queenslanders for Work program and back office cost savings, and transfer of recurrent funds to equity to reflect a lower level of depreciation in 2012-13.
11. Increase due largely to reclassification of school revenue as user charges instead of grants and other contributions following full consolidation of school accounts for the first time in 2011-12.
12. Decrease due largely to reclassification of some school revenue as user charges instead of grants and other contributions following full consolidation of school accounts for the first time in 2011-12.
13. Increase in relation to the inclusion of other school revenue following full consolidation of school accounts for the first time in 2011-12.
14. Increase due to provision for enterprise bargaining outcomes, enrolment growth, additional staffing in relation to election commitments (Literacy and Numeracy, Boosting Teacher Aides Hours for Prep Year, Supporting Queenslanders with a Disability and School Chaplains), and expenses associated with deferred funding (Transition of Year 7 to Secondary, Science Spark, Universal Access, National Agenda, Digital Education Revolution, Support for Student with Disabilities, Empowering Local Schools, Childcare Fee Waivers and Smarter Schools National Partnership), partly offset by Government savings measures including the cessation of the Skilling Queenslanders for Work program and back office cost savings.
2012-13 Queensland State Budget - Service Delivery Statements – Department of Education, Training and Employment 33
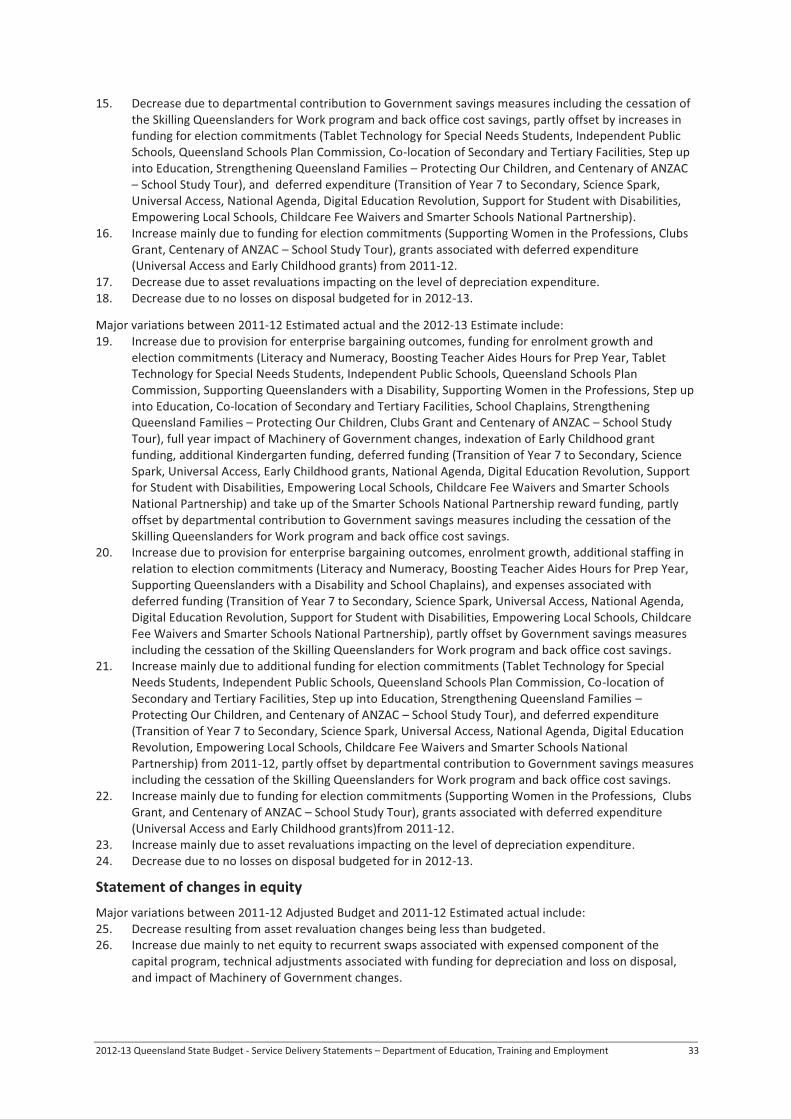
15. Decrease due to departmental contribution to Government savings measures including the cessation of the Skilling Queenslanders for Work program and back office cost savings, partly offset by increases in funding for election commitments (Tablet Technology for Special Needs Students, Independent Public Schools, Queensland Schools Plan Commission, Co-location of Secondary and Tertiary Facilities, Step up into Education, Strengthening Queensland Families – Protecting Our Children, and Centenary of ANZAC – School Study Tour), and deferred expenditure (Transition of Year 7 to Secondary, Science Spark, Universal Access, National Agenda, Digital Education Revolution, Support for Student with Disabilities, Empowering Local Schools, Childcare Fee Waivers and Smarter Schools National Partnership).
16. Increase mainly due to funding for election commitments (Supporting Women in the Professions, Clubs Grant, Centenary of ANZAC – School Study Tour), grants associated with deferred expenditure (Universal Access and Early Childhood grants) from 2011-12.
17. Decrease due to asset revaluations impacting on the level of depreciation expenditure. 18. Decrease due to no losses on disposal budgeted for in 2012-13.
Major variations between 2011-12 Estimated actual and the 2012-13 Estimate include: 19. Increase due to provision for enterprise bargaining outcomes, funding for enrolment growth and
election commitments (Literacy and Numeracy, Boosting Teacher Aides Hours for Prep Year, Tablet Technology for Special Needs Students, Independent Public Schools, Queensland Schools Plan Commission, Supporting Queenslanders with a Disability, Supporting Women in the Professions, Step up into Education, Co-location of Secondary and Tertiary Facilities, School Chaplains, Strengthening Queensland Families – Protecting Our Children, Clubs Grant and Centenary of ANZAC – School Study Tour), full year impact of Machinery of Government changes, indexation of Early Childhood grant funding, additional Kindergarten funding, deferred funding (Transition of Year 7 to Secondary, Science Spark, Universal Access, Early Childhood grants, National Agenda, Digital Education Revolution, Support for Student with Disabilities, Empowering Local Schools, Childcare Fee Waivers and Smarter Schools National Partnership) and take up of the Smarter Schools National Partnership reward funding, partly offset by departmental contribution to Government savings measures including the cessation of the Skilling Queenslanders for Work program and back office cost savings.
20. Increase due to provision for enterprise bargaining outcomes, enrolment growth, additional staffing in relation to election commitments (Literacy and Numeracy, Boosting Teacher Aides Hours for Prep Year, Supporting Queenslanders with a Disability and School Chaplains), and expenses associated with deferred funding (Transition of Year 7 to Secondary, Science Spark, Universal Access, National Agenda, Digital Education Revolution, Support for Student with Disabilities, Empowering Local Schools, Childcare Fee Waivers and Smarter Schools National Partnership), partly offset by Government savings measures including the cessation of the Skilling Queenslanders for Work program and back office cost savings.
21. Increase mainly due to additional funding for election commitments (Tablet Technology for Special Needs Students, Independent Public Schools, Queensland Schools Plan Commission, Co-location of Secondary and Tertiary Facilities, Step up into Education, Strengthening Queensland Families – Protecting Our Children, and Centenary of ANZAC – School Study Tour), and deferred expenditure (Transition of Year 7 to Secondary, Science Spark, Universal Access, National Agenda, Digital Education Revolution, Empowering Local Schools, Childcare Fee Waivers and Smarter Schools National Partnership) from 2011-12, partly offset by departmental contribution to Government savings measures including the cessation of the Skilling Queenslanders for Work program and back office cost savings.
22. Increase mainly due to funding for election commitments (Supporting Women in the Professions, Clubs Grant, and Centenary of ANZAC – School Study Tour), grants associated with deferred expenditure (Universal Access and Early Childhood grants)from 2011-12.
23. Increase mainly due to asset revaluations impacting on the level of depreciation expenditure. 24. Decrease due to no losses on disposal budgeted for in 2012-13.
Statement of changes in equity
Major variations between 2011-12 Adjusted Budget and 2011-12 Estimated actual include: 25. Decrease resulting from asset revaluation changes being less than budgeted. 26. Increase due mainly to net equity to recurrent swaps associated with expensed component of the
capital program, technical adjustments associated with funding for depreciation and loss on disposal, and impact of Machinery of Government changes.

2012-13 Queensland State Budget - Service Delivery Statements – Department of Education, Training and Employment 34
Major variations between 2011-12 Adjusted Budget and 2012-13 Estimate include: 27. Reflects return of surplus equity funding, including equity associated with disposal of surplus land assets
and funding associated with kindergarten infrastructure, partially offset by equity injection for election commitments (Building Queensland Schools of the Future, The Gap State high School Sports Hall, Ashgrove State School, and Highfields State High School) and technical adjustments associated with funding for depreciation and loss on disposal.
Major variations between 2011-12 Estimated actual and the 2012-13 Estimate include: 28. Increase due to provision for asset revaluation. 29. Reflects return funds associated with kindergarten infrastructure and disposal of surplus land assets,
partly offset by net increases from equity to recurrent swaps associated with expensed component of the capital program, technical adjustments associated with funding for depreciation and loss on disposal, and funding for election commitments (Building Queensland Schools of the Future, The Gap State high School Sports Hall, Ashgrove State School, and Highfields State High School).
Balance sheet
Major variations between 2011-12 Adjusted Budget and 2011-12 Estimated actual include: 30. Decrease in cash resulting mainly from reduction in capital payables, various prepayments and funding
deferrals. 31. Reflects higher levels of debtors than forecast, as a result of school receivables being recognised for the
first time. 32. Reflects higher levels of prepaid expenses than forecast. 33. Reflects reduction in number of properties categorised as assets held for sale. 34. Reflects lower level of assets being capitalised, as well as impact of asset revaluations. 35. Reflects completion and recognition of new software assets. 36. Reflects lower level of capital payables mainly due to the completion of the Australian Government
Building the Education Revolution (BER) program, offset by end of year appropriation payable in 2011-12.
37. Reflects lower levels of employee benefits accrued compared to forecast, due to timing of when payments were made.
38. Reflects lower levels of unearned revenue than forecast. 39. Increase due mainly to net equity to recurrent swaps associated with expensed component of the
capital program, technical adjustments associated with funding for depreciation and loss on disposal, and impact of Machinery of Government changes.
Major variations between 2011-12 Adjusted Budget and 2012-13 Estimate include: 40. Decrease reflects cash forecast for 2012-13 being aligned with 2011-12 closing balances. 41. Increase reflects forecast debtors for 2012-13 being aligned with 2011-12 closing balances. 42. Increase reflects forecast other current assets for 2012-13 being aligned with 2011-12 closing balances. 43. Reflects lower asset values based on 2011-12 closing balances. 44. Reflects impact of asset revaluations and the level of capital acquisitions for 2012-13. 45. Increase reflects forecast for 2012-13 being aligned to 2011-12 closing balances. 46. Reflects lower forecast payables for 2012-13, including end of year appropriation adjustment in 2011-12
not anticipated for 2012-13. 47. Reflects lower forecast accrued employee benefits for 2012-13 based on 2011-12 closing balances. 48. Reflects lower level of unearned revenue based on 2011-12 closing balances. 49. Reflects return of equity funding, including equity associated with disposal of surplus land assets and
funding associated with kindergarten infrastructure, partially offset by equity injection for election commitments (Building Queensland Schools of the Future, The Gap State high School Sports Hall, Ashgrove State School, and Highfields State High School) and technical adjustments associated with funding for depreciation and loss on disposal.
Major variations between 2011-12 Estimated actual and the 2012-13 Estimate include: 50. Increase due to higher level of cash anticipated resulting from reduced debtor levels in 2012-13. 51. Decrease reflecting anticipated movement in debtor levels in 2012-13. 52. Increase associated with new capital acquisitions and the anticipated impact of asset revaluations. 53. Reflects lower forecast payables for 2012-13, including end of year appropriation adjustment in 2011-12
not anticipated for 2012-13.

2012-13 Queensland State Budget - Service Delivery Statements – Department of Education, Training and Employment 35
54. Reflects return funds associated with kindergarten infrastructure and disposal of surplus land assets, partly offset by net increases from equity to recurrent swaps associated with expensed component of the capital program, technical adjustments associated with funding for depreciation and loss on disposal, and funding for election commitments (Building Queensland Schools of the Future, The Gap State high School Sports Hall, Ashgrove State School, and Highfields State High School).
Cash flow statement
Major variations between 2011-12 Adjusted Budget and 2011-12 Estimated actual include: 55. Decrease due to transfer of recurrent funds to equity to reflect reduced depreciation expenditure, and
deferred funding (Transition of Year 7 to Secondary, Science Spark, Universal Access, National Agenda, Digital Education Revolution, Support for Student with Disabilities, Empowering Local Schools, Childcare Fee Waivers and Smarter Schools National Partnership), partly offset by changes to the provision for enterprise bargaining outcomes, additional funding for the Voluntary Separation program and transfer of equity funds to recurrent to reflect increased loss on disposal expenditure and increased expensed component of the capital program.
56. Increase due largely to reclassification of school revenue as user charges instead of grants and other contributions following full consolidation of school accounts for the first time in 2011-12.
57. Decrease due largely to reclassification of school revenue as user charges instead of grants and other contributions following full consolidation of school accounts for the first time in 2011-12.
58. Increase due to changes to the provision for enterprise bargaining outcomes, enrolment growth, incentive payments under the Voluntary Separation Program, and alignment with budgeted supplies and services costs being spent as employee expenses.
59. Decrease due largely to deferred expenditures (Universal Access, Early Childhood grants, Childcare Fee Waivers and Smarter Schools National Partnership) and alignment of budgeted supplies and services expenditure spent as employee expenses.
60. Reflects lower level of capital acquisitions. 61. Relates largely to transfer of funds to recurrent to account for the expensed component of the capital
program as required under accounting principles. 62. Reflects equity to recurrent swap to cater for loss on disposal expenditure.
Major variations between 2011-12 Adjusted Budget and 2012-13 Estimate include: 63. Increase due to provision for enterprise bargaining outcomes, funding for enrolment growth and
election commitments (Literacy and Numeracy, Boosting Teacher Aides Hours for Prep Year, Tablet Technology for Special Needs Students, Independent Public Schools, Queensland Schools Plan Commission, Supporting Queenslanders with a Disability, Supporting Women in the Professions, Step up into Education, Co-location of Secondary and Tertiary Facilities, School Chaplains, Strengthening Queensland Families – Protecting Our Children, Clubs Grant, Centenary of ANZAC – School Study Tour), full year impact of Machinery of Government changes, indexation of Early Childhood grant funding, additional Kindergarten funding, deferred funding (Transition of Year 7 to Secondary, Science Spark, Early Childhood grants, Universal Access, National Agenda, Digital Education Revolution, Support for Student with Disabilities, Empowering Local Schools, Childcare Fee Waivers and Smarter Schools National Partnership), and the take up of the Smarter Schools National Partnership reward funding, partly offset by departmental contribution to Government savings measures including the cessation of the Skilling Queenslanders for Work program and back office cost savings, and transfer of recurrent funds to equity to reflect a lower level of depreciation in 2012-13.
64. Increase due largely to reclassification of school revenue as user charges instead of grants and other contributions following full consolidation of school accounts for the first time in 2011-12.
65. Decrease due largely to reclassification of school revenue as user charges instead of grants and other contributions following full consolidation of school accounts for the first time in 2011-12.
66. Increase due to provision for enterprise bargaining outcomes, enrolment growth, additional staffing in relation to election commitments (Literacy and Numeracy, Boosting Teacher Aides Hours for Prep Year, Supporting Queenslanders with a Disability and School Chaplains), and expenses associated with deferred funding (Transition of Year 7 to Secondary, Science Spark, Universal Access, National Agenda, Digital Education Revolution, Support for Student with Disabilities, Empowering Local Schools, Childcare Fee Waivers and Smarter Schools National Partnership), partly offset by Government savings measures including the cessation of the Skilling Queenslanders for Work program and back office cost savings.

2012-13 Queensland State Budget - Service Delivery Statements – Department of Education, Training and Employment 36
67. Decrease due to departmental contribution to Government savings measures including the cessation of the Skilling Queenslanders for Work program and back office cost savings, partly offset by increases in funding for election commitments (Tablet Technology for Special Needs Students, Independent Public Schools, Queensland Schools Plan Commission, Co-location of Secondary and Tertiary Facilities, Step up into Education, Strengthening Queensland Families – Protecting Our Children, and Centenary of ANZAC – School Study Tour), and deferred expenditure (Transition of Year 7 to Secondary, Science Spark, Universal Access, National Agenda, Digital Education Revolution, Support for Student with Disabilities, Empowering Local Schools, Childcare Fee Waivers and Smarter Schools National Partnerships)from 2011-12.
68. Reflects higher disposal program based on Government approval to dispose of land surplus to department’s requirements.
69. Reflects lower capital acquisitions following cessation of funding for special capital programs. 70. Relates mainly to return of funds including funding associated with Kindergarten infrastructure, partially
offset by deferred capital expenditure and funding for election commitments (Building Queensland Schools of the Future, The Gap State high School Sports Hall, Ashgrove State School, and Highfields State High School).
71. Relates to equity withdrawal associated with disposal of land assets.
Major variations between 2011-12 Estimated actual and the 2012-13 Estimate include: 72. Increase due to provision for enterprise bargaining outcomes, funding for enrolment growth and
election commitments (Literacy and Numeracy, Boosting Teacher Aides Hours for Prep Year, Tablet Technology for Special Needs Students, Independent Public Schools, Queensland Schools Plan Commission, Supporting Queenslanders with a Disability, Supporting Women in the Professions, Step up into Education, Co-location of Secondary and Tertiary Facilities, School Chaplains, Strengthening Queensland Families – Protecting Our Children, Clubs Grant, Centenary of ANZAC – School Study Tour), full year impact of Machinery of Government changes, indexation of Early Childhood grant funding, additional Kindergarten funding, deferred funding (Transition of Year 7 to Secondary, Science Spark, Universal Access, Early Childhood grants, National Agenda, Digital Education Revolution, Support for Student with Disabilities, Empowering Local Schools, Childcare Fee Waivers and Smarter Schools National Partnership) and take up of the Smarter Schools National Partnership reward funding, partly offset by departmental contribution to Government savings measures including the cessation of the Skilling Queenslanders for Work program and back office cost savings.
73. Reflects higher user charge revenue and user charges revenue receivable anticipated in 2012-13. 74. Reflects largely the reduced level of Commonwealth funding to be received directly by the department. 75. Increase due to provision for enterprise bargaining outcomes, enrolment growth, additional staffing in
relation to election commitments (Literacy and Numeracy, Boosting Teacher Aides Hours for Prep Year, Supporting Queenslanders with a Disability and School Chaplains), and expenses associated with deferred funding (Universal Access, National Agenda, Digital Education Revolution, Support for Student with Disabilities, Empowering Local Schools, Childcare Fee Waivers and Smarter Schools National Partnership), partly offset by Government savings measures including the cessation of the Skilling Queenslanders for Work program and back office cost savings.
76. Increase mainly due to additional funding for election commitments (Tablet Technology for Special Needs Students, Independent Public Schools, Queensland Schools Plan Commission, Co-location of Secondary and Tertiary Facilities, Step up into Education, Strengthening Queensland Families – Protecting Our Children, and Centenary of ANZAC – School Study Tour), and deferred expenditure (Transition of Year 7 to Secondary, Science Spark, Universal Access, National Agenda, Digital Education Revolution, Empowering Local Schools, Childcare Fee Waivers and Smarter Schools National Partnership), partly offset by departmental contribution to Government savings measures including the cessation of the Skilling Queenslanders for Work program and back office cost savings.
77. Increase mainly due to funding for election commitments (Supporting Women in the Professions, Clubs Grant, and Centenary of ANZAC – School Study Tour), grants associated with deferred expenditure (Universal Access and Early Childhood grants) and grant funding under the Smarter Schools National Partnership.
78. Reflects higher disposal program based on Government approval to dispose of land surplus to department’s requirements.
79. Reflects lower capital acquisitions following cessation of funding for special capital programs.

2012-13 Queensland State Budget - Service Delivery Statements – Department of Education, Training and Employment 37
80. Relates mainly to return of funds including funding associated with Kindergarten infrastructure, partially offset by deferred capital expenditure and funding for election commitments (Building Queensland Schools of the Future, The Gap State high School Sports Hall, Ashgrove State School, and Highfields State High School).
Administered income statement Major variations between 2011-12 Adjusted Budget and 2011-12 Estimated actual include: 81. Reflects decrease in Australian Government grants assistance to non-state schools, including deferred
funding into 2012-13. 82. Reflects reduced level of Australian Government grants assistance to non-state schools and carryover of
Transition of Year 7 to Secondary Capital Grant funding, partly offset by increase in grant funding for the Western Cape Communities.
Major variations between 2011-12 Adjusted Budget and 2012-13 Estimate include: 83. Reflects increase in Australian Government assistance to non-state schools, including deferred funding
from 2011-12. 84. Reflects increases in Australian Government assistance to non-state schools, Transition of Year 7 to
Secondary capital grants and election commitment funding for School Chaplains, Literacy and Numeracy, Supporting Queenslanders with a Disability, Strengthening Queensland Families – Protecting our Children, Boosting Teacher Aide Hours for Prep Year, Tablet Technology for Special Needs Students and Building Queensland Schools of the Future, partly offset by the transfer of funding for Western Cape Communities to the Department of Aboriginal and Torres Strait Islander and Multicultural Affairs from 2012-13.
Major variations between 2011-12 Estimated actual and the 2012-13 Estimate include: 85. Reflects increase in Australian Government assistance to non-state schools, including deferred funding
from 2011-12 to 2012-13. 86. Reflects increases in Australian Government assistance to non-state schools, Transition of Year 7 to
Secondary capital grants and election commitment funding for School Chaplains, Literacy and Numeracy, Supporting Queenslanders with a Disability, Strengthening Queensland Families – Protecting our Children, Boosting Teacher Aide Hours for Prep Year, Tablet Technology for Special Needs Students and Building Queensland Schools of the Future, partly offset by the transfer of funding for Western Cape Communities to the Department of Aboriginal and Torres Strait Islander and Multicultural Affairs from 2012-13.
Administered balance sheet Major variations between 2011-12 Adjusted Budget and 2011-12 Estimated actual include: 87. Reflects higher cash balances as at June 2012, due to higher levels of accrued expenses. 88. Reflects higher levels of accrued grant expenditure as at June 2012. 89. Reflects higher levels of accrued transfers to Government as at June 2012.
Major variations between 2011-12 Estimated Actual and 2012-13 Estimate include: 90. Reflects higher cash balances as at June 2012 compared to forecast end of June 2013 cash balances. 91. Reflects higher levels of accrued grant expenditure as at June 2012 compared to forecast end of June
2013 accrued expenditure. 92. Reflects higher levels of accrued transfers to Government as at June 2012 compared to forecast end of
June 2013 transfers to Government payments.
Administered cash flow statement
Major variations between 2011-12 Adjusted Budget and 2011-12 Estimated actual include: 93. Reflects reduced level of Australian Government assistance to non-state schools and carryover of
Transition of Year 7 to Secondary Capital Grants, partly offset by increase in funding for the Western Cape Communities.
94. Reflects decrease in Australian Government assistance to non-state schools, including deferred funding into 2012-13.
95. Reflects unbudgeted grants payable and transfers to Government payable as at year end.
2012-13 Queensland State Budget - Service Delivery Statements – Department of Education, Training and Employment 38
Major variations between 2011-12 Adjusted Budget and 2012-13 Estimate include: 96. Reflects increases in Australian Government assistance to non-state schools, Transition of Year 7 to
Secondary capital grants and election commitment funding for School Chaplains, Literacy and Numeracy, Supporting Queenslanders with a Disability, Strengthening Queensland Families – Protecting our Children, Boosting Teacher Aide Hours for Prep Year, Tablet Technology for Special Needs Students and Building Queensland Schools of the Future, partly offset by the transfer of funding for Western Cape Communities to the Department of Aboriginal and Torres Strait Islander and Multicultural Affairs from 2012-13.
97. Reflects increase in Australian Government grants assistance to non-state schools, including funding deferred from 2011-12.
98. Reflects payment of year end accrued grant funding and transfers to Government payable from 2011-12.
Major variations between 2011-12 Estimated actual and the 2012-13 Estimate include: 99. Reflects increases in Australian Government assistance to non-state schools, Transition of Year 7 to
Secondary capital grants and election commitment funding for School Chaplains, Literacy and Numeracy, Supporting Queenslanders with a Disability, Strengthening Queensland Families – Protecting our Children, Boosting Teacher Aide Hours for Prep Year, Tablet Technology for Special Needs Students and Building Queensland Schools of the Future, partly offset by the transfer of funding for Western Cape Communities to the Department of Aboriginal and Torres Strait Islander and Multicultural Affairs from 2012-13.
100. Reflects increase in Australian Government assistance to non-state schools, including deferred funding from 2011-12 to 2012-13.
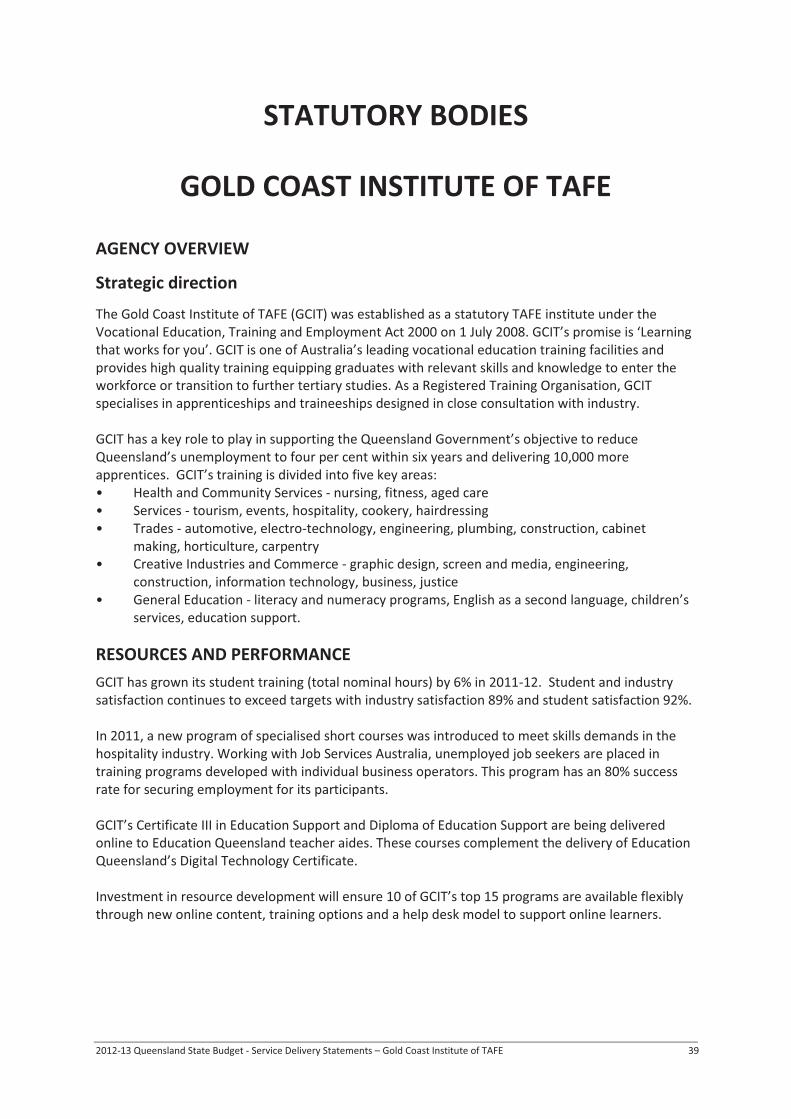
2012-13 Queensland State Budget - Service Delivery Statements – Gold Coast Institute of TAFE 39
STATUTORY BODIES
GOLD COAST INSTITUTE OF TAFE
AGENCY OVERVIEW
Strategic direction
The Gold Coast Institute of TAFE (GCIT) was established as a statutory TAFE institute under the Vocational Education, Training and Employment Act 2000 on 1 July 2008. GCIT’s promise is ‘Learning that works for you’. GCIT is one of Australia’s leading vocational education training facilities and provides high quality training equipping graduates with relevant skills and knowledge to enter the workforce or transition to further tertiary studies. As a Registered Training Organisation, GCIT specialises in apprenticeships and traineeships designed in close consultation with industry. GCIT has a key role to play in supporting the Queensland Government’s objective to reduce Queensland’s unemployment to four per cent within six years and delivering 10,000 more apprentices. GCIT’s training is divided into five key areas: • Health and Community Services - nursing, fitness, aged care • Services - tourism, events, hospitality, cookery, hairdressing • Trades - automotive, electro-technology, engineering, plumbing, construction, cabinet
making, horticulture, carpentry • Creative Industries and Commerce - graphic design, screen and media, engineering,
construction, information technology, business, justice • General Education - literacy and numeracy programs, English as a second language, children’s
services, education support.
RESOURCES AND PERFORMANCE GCIT has grown its student training (total nominal hours) by 6% in 2011-12. Student and industry satisfaction continues to exceed targets with industry satisfaction 89% and student satisfaction 92%. In 2011, a new program of specialised short courses was introduced to meet skills demands in the hospitality industry. Working with Job Services Australia, unemployed job seekers are placed in training programs developed with individual business operators. This program has an 80% success rate for securing employment for its participants. GCIT’s Certificate III in Education Support and Diploma of Education Support are being delivered online to Education Queensland teacher aides. These courses complement the delivery of Education Queensland’s Digital Technology Certificate. Investment in resource development will ensure 10 of GCIT’s top 15 programs are available flexibly through new online content, training options and a help desk model to support online learners.

2012-13 Queensland State Budget - Service Delivery Statements – Gold Coast Institute of TAFE 40
STATEMENTS
Staffing1
Gold Coast Institute of TAFE Notes 2011-12 Budget
2011-12 Est. actual
2012-13 Estimate
2,3 22 20 25
Notes: 1. Full-time equivalents (FTEs) as at 30 June.2. Staffing numbers reflect staff directly engaged by the Institute and do not include staff employed by
the Department of Education, Training and Employment (DETE). As at 30 June 2012, GCIT utilised 590 FTE DETE staff and 20 directly engaged staff.
3. As at 30 June 2013, GCIT expects to have utilised 573 FTE DETE staff and an estimated 25 directly engaged staff to provide increased flexibility to meet commercial business arrangements.
Performance Statement
Gold Coast Institute of TAFE Notes 2011-12 Target/est.
2011-12 Est. actual
2012-13 Target/Est.
Service standards
Proportion of all attempted competencies successfully completed
88% 88% 86%
Student post training outcome (employed or in further study after training) 1,2 84% 86% 84% Proportion of graduates satisfied with the overall quality of their training 1,2 84% 92% 85% Proportion of employers satisfied with graduates of the Institute 1,3 85% 89% 85% Average cost per competency successfully completed ($) 4,5 $602 $581 $616 Other measures Number of students awarded Certificate III and above 6 4,000 5,500 4,150
Notes: 1. Confidence intervals for satisfaction estimates derived from sample survey responses need to be
considered when interpreting relative performance. 2. Data are sourced from the annual National Centre for Vocational Education Research (NCVER) Student
Outcomes Survey. 3. Employer satisfaction estimates are obtained from the biennial national survey, Employers’ Use and
Views of the VET System, which was last conducted by NCVER in 2011. 4. Students under the Productivity Places Program achieved better than expected competency results in
2011-12, which lowered the average cost per competency for the financial year. The cost per competency in the 2011-12 Estimated Actual calculation does not include non-current asset impairments and devaluations.

2012-13 Queensland State Budget - Service Delivery Statements – Gold Coast Institute of TAFE 41
5. In 2012-13, the Institute is investing in teacher capability, improved customer service and equipment, and teaching resources for staff and students resulting in a higher operating expense for the financial year.
6. The 2011-12 Estimated Actual result was boosted by the impact of the one-off Productivity Places Program.
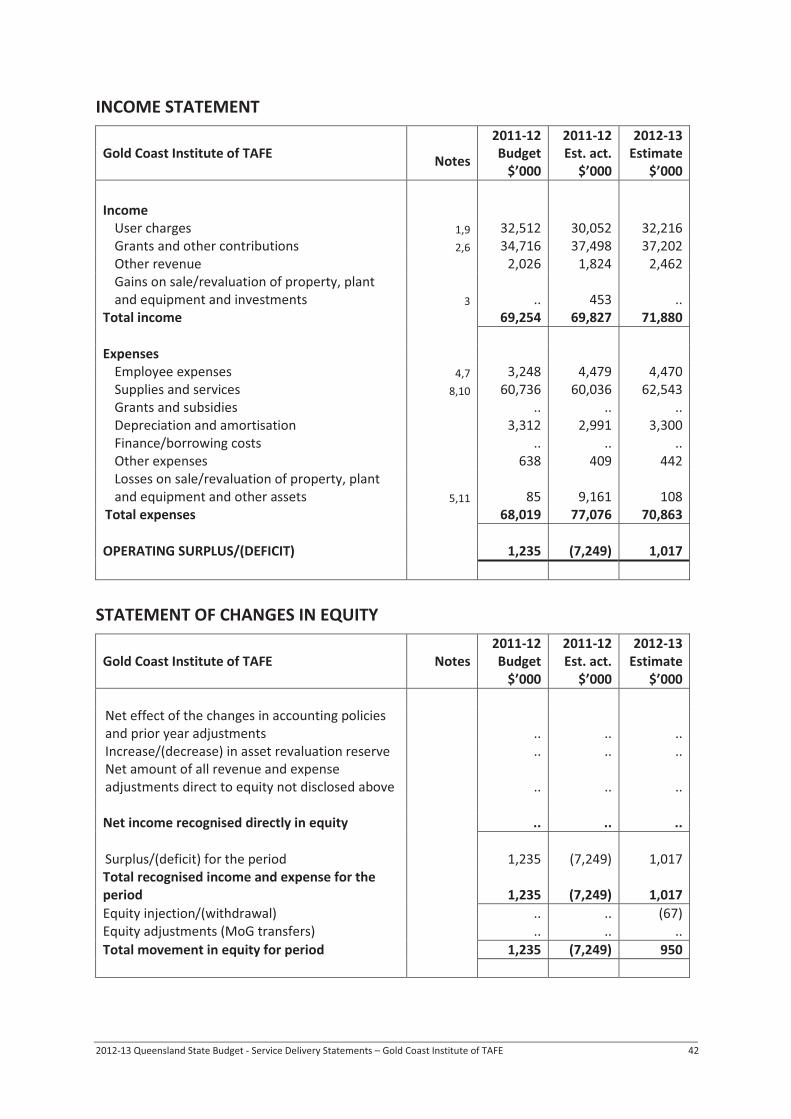
2012-13 Queensland State Budget - Service Delivery Statements – Gold Coast Institute of TAFE 42
INCOME STATEMENT
Gold Coast Institute of TAFE Notes
2011-12 Budget
$’000
2011-12 Est. act.
$’000
2012-13 Estimate
$’000 Income
User charges 1,9 32,512 30,052 32,216 Grants and other contributions 2,6 34,716 37,498 37,202 Other revenue 2,026 1,824 2,462 Gains on sale/revaluation of property, plant and equipment and investments 3 .. 453 ..
Total income 69,254 69,827 71,880 Expenses
Employee expenses 4,7 3,248 4,479 4,470 Supplies and services 8,10 60,736 60,036 62,543 Grants and subsidies .. .. .. Depreciation and amortisation 3,312 2,991 3,300 Finance/borrowing costs .. .. .. Other expenses 638 409 442 Losses on sale/revaluation of property, plant and equipment and other assets 5,11 85 9,161 108
Total expenses 68,019 77,076 70,863 OPERATING SURPLUS/(DEFICIT) 1,235 (7,249) 1,017
STATEMENT OF CHANGES IN EQUITY
Gold Coast Institute of TAFE Notes 2011-12 Budget
$’000
2011-12 Est. act.
$’000
2012-13 Estimate
$’000
Net effect of the changes in accounting policies and prior year adjustments .. .. .. Increase/(decrease) in asset revaluation reserve .. .. .. Net amount of all revenue and expense adjustments direct to equity not disclosed above .. .. .. Net income recognised directly in equity .. .. .. Surplus/(deficit) for the period 1,235 (7,249) 1,017 Total recognised income and expense for the period 1,235 (7,249) 1,017 Equity injection/(withdrawal) .. .. (67) Equity adjustments (MoG transfers) .. .. .. Total movement in equity for period 1,235 (7,249) 950
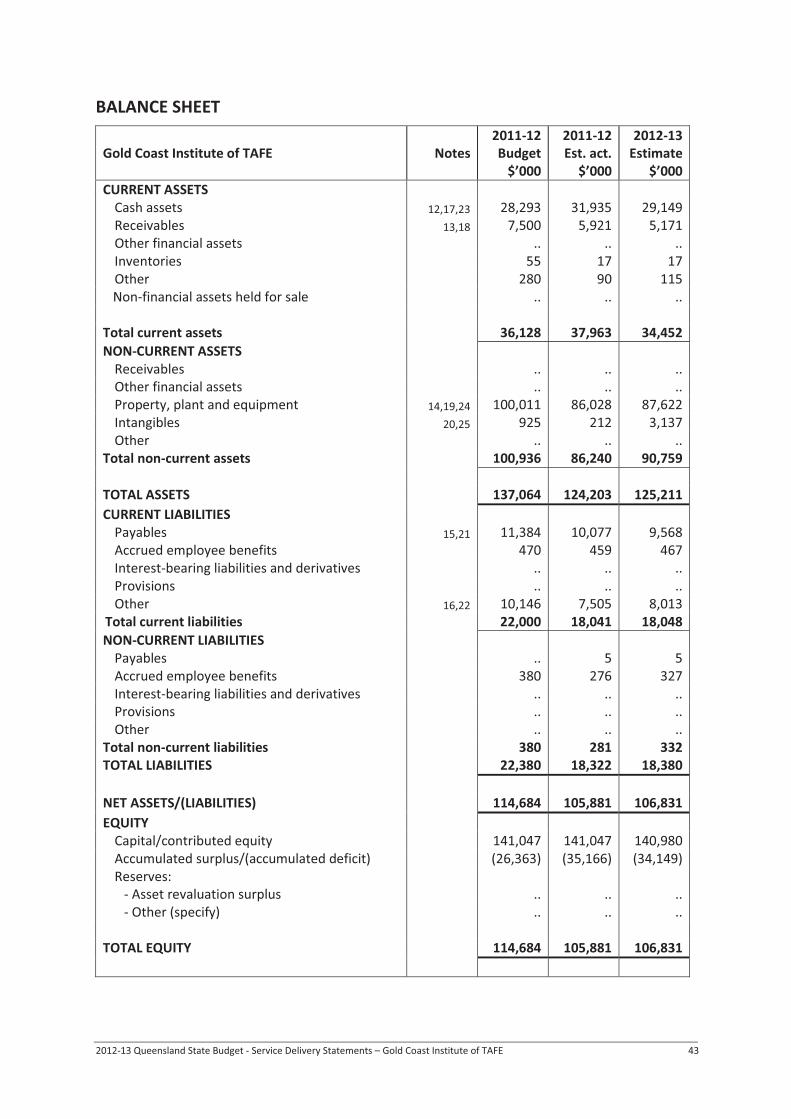
2012-13 Queensland State Budget - Service Delivery Statements – Gold Coast Institute of TAFE 43
BALANCE SHEET
Gold Coast Institute of TAFE Notes 2011-12 Budget
$’000
2011-12 Est. act.
$’000
2012-13 Estimate
$’000 CURRENT ASSETS
Cash assets 12,17,23 28,293 31,935 29,149 Receivables 13,18 7,500 5,921 5,171 Other financial assets .. .. .. Inventories 55 17 17 Other 280 90 115
Non-financial assets held for sale .. .. .. Total current assets 36,128 37,963 34,452 NON-CURRENT ASSETS
Receivables .. .. .. Other financial assets .. .. .. Property, plant and equipment 14,19,24 100,011 86,028 87,622 Intangibles 20,25 925 212 3,137 Other .. .. ..
Total non-current assets 100,936 86,240 90,759 TOTAL ASSETS 137,064 124,203 125,211 CURRENT LIABILITIES
Payables 15,21 11,384 10,077 9,568 Accrued employee benefits 470 459 467 Interest-bearing liabilities and derivatives .. .. .. Provisions .. .. .. Other 16,22 10,146 7,505 8,013
Total current liabilities 22,000 18,041 18,048 NON-CURRENT LIABILITIES
Payables .. 5 5 Accrued employee benefits 380 276 327 Interest-bearing liabilities and derivatives .. .. .. Provisions .. .. .. Other .. .. ..
Total non-current liabilities 380 281 332 TOTAL LIABILITIES 22,380 18,322 18,380 NET ASSETS/(LIABILITIES) 114,684 105,881 106,831 EQUITY
Capital/contributed equity 141,047 141,047 140,980 Accumulated surplus/(accumulated deficit) (26,363) (35,166) (34,149) Reserves:
- Asset revaluation surplus .. .. .. - Other (specify) .. .. ..
TOTAL EQUITY 114,684 105,881 106,831

2012-13 Queensland State Budget - Service Delivery Statements – Gold Coast Institute of TAFE 44
CASH FLOW STATEMENT
Gold Coast Institute of TAFE Notes 2011-12 Budget
$’000
2011-12 Est. act.
$’000
2012-13 Estimate
$’000 CASH FLOWS FROM OPERATING ACTIVITIES
Inflows: User charges 29,35 31,927 31,849 33,366 Grants and other contributions 26,30 34,716 37,498 37,202 Other 3,043 3,317 3,531
Outflows: Employee costs 27,31 (3,088) (4,496) (4,411) Supplies and services 32,36 (60,396) (60,844) (63,077) Grants and subsidies .. (7) .. Borrowing costs .. .. .. Other (1,655) 155 (1,511)
Net cash provided by/(used in) operating activities 4,547 7,472 5,100 CASH FLOWS FROM INVESTING ACTIVITIES
Inflows: Sales of property, plant and equipment .. 5 .. Investments redeemed .. .. .. Loans and advances redeemed .. .. ..
Outflows: Payments for property, plant and equipment and intangibles 28,33,37 (2,853) (1,351) (7,819) Payments for investments .. .. .. Loans and advances made .. .. ..
Net cash provided by/(used in) investing activities (2,853) (1,346) (7,819) CASH FLOWS FROM FINANCING ACTIVITIES
Inflows: Borrowings .. .. .. Equity injections .. .. ..
Outflows: Borrowing redemptions .. .. .. Finance lease payments .. .. .. Equity returned 34 .. .. (67)
Net cash provided by/(used in) financing activities .. .. (67)
Net increase/(decrease) in cash held 1,694 6,126 (2,786) Cash at the beginning of financial year 26,599 25,809 31,935 Cash transfers from restructure .. .. .. Cash at the end of financial year 28,293 31,935 29,149

2012-13 Queensland State Budget - Service Delivery Statements – Gold Coast Institute of TAFE 45
EXPLANATION OF VARIANCES IN THE FINANCIAL STATEMENTS
Income statement Major variations between 2011-12 Budget and 2011-12 Estimated actual include: 1. Decrease due to shortfall in international student numbers as a result of changes in visa regulations and
currency movements. 2. Increase due to strong demand for government subsidised places and funding adjustment for DETE
Corporate Service User charges 3. Increase due to revaluation increments on campus buildings using indexation allowances provided by
State Valuation Services in accordance with Treasury non-current asset accounting policy. 4. Increase due to revision to calculation to include associated on-costs eg. training and recruitment. 5. Increase due to revaluation decrements on land using indexation allowances provided by State
Valuation Services in accordance with Treasury non-current asset accounting policy and impairment losses on one campus building which has been vacated by the Institute.
Major variations between 2011-12 Budget and 2012-13 Estimate include: 6. Increase due to strong demand for government subsidised places and funding adjustment for DETE
Corporate Service user charges. 7. Increase due to revision to calculation to include associated on-costs eg. training and recruitment. 8. Increase due to investment in teacher capability, improved customer service and focus on improved
equipment and teaching resources for staff and students. Major variations between 2011-12 Estimated actual and the 2012-13 Estimate include: 9. Increase due to growth in VET FEE-HELP and targeting of offshore delivery to grow international
revenues 10. Increase due to investment in teacher capability, improved customer service and focus on improved
equipment and teaching resources for staff and students. 11. Decrease due to no assumption of revaluation decrements and impairment losses on land and
buildings.
Balance sheet Major variations between 2011-12 Budget and 2011-12 Estimated actual include: 12. Increase due to improved collections of amounts owed to the Institute and lower than expected capital
expenditure. 13. Decrease due to improved collections of amounts owed to the Institute. 14. Decrease due to revaluation decrements in 2010-11 and 2011-12 and impairment losses on land and
buildings in 2011-12 and lower than expected capital expenditure. 15. Decrease due to level of accruals and timing differences on payments of amounts owed by the Institute. 16. Decrease due to moving a number of students to Semester based enrolments versus whole course
enrolment and lower level of international revenues. Major variations between 2011-12 Budget and 2012-13 Estimate include: 17. Increase due to improved collections of amounts owed to the Institute. 18. Decrease due to improved collections of amounts owed to the Institute. 19. Decrease due to revaluation decrements in 2010-11 and 2011-12 and impairment losses on land and
buildings in 2011-12 partially offset by additional investment in plant and equipment for staff and students in 2012-13.
20. Increase due to investment in developing new course offerings for students that meet the criteria for capitalisation under Treasury non-current asset accounting policy.
21. Decrease due to level of accruals and timing differences on payments of amounts owed by the Institute. 22. Decrease due to moving a number of students to Semester based enrolments versus whole course
enrolment and lower level of international revenues.

2012-13 Queensland State Budget - Service Delivery Statements – Gold Coast Institute of TAFE 46
Major variations between 2011-12 Estimated actual and the 2012-13 Estimate include: 23. Decrease due to higher level of capital expenditure on new course offerings for students that meet the
criteria for capitalisation under Treasury non-current asset policy and additional plant and equipment for staff and students.
24. Increase due to higher level of capital expenditure on additional plant and equipment for staff and students.
25. Increase due to investment in developing new course offerings for students that meet the criteria for capitalisation under Treasury non-current asset accounting policy.
Cash flow statement Major variations between 2011-12 Budget and 2011-12 Estimated actual include: 26. Increase due to strong demand for government subsidised places and funding adjustment for DETE
Corporate Service user charges. 27. Increase due to revision to calculation to include associated on-costs eg. training and recruitment. 28. Decrease due to lower than expected intangible asset expenditure. Major variations between 2011-12 Budget and 2012-13 Estimate include: 29. Increase due to growth in VET FEE-HELP. 30. Increase due to strong demand for government subsidised places and funding adjustment for DETE
Corporate Service user charges. 31. Increase due to revision to calculation to include associated on-costs eg. training and recruitment. 32. Increase due to investment in teacher capability, improved customer service and focus on improved
equipment and teaching resources for staff and students. 33. Increase due to investment in developing new course offerings for students that meet the criteria for
capitalisation under Treasury non-current asset accounting policy and additional investment in plant and equipment for staff and students.
34. Efficiency savings to be returned to the Department of Education, Training and Employment. Major variations between 2011-12 Estimated actual and the 2012-13 Estimate include: 35. Increase due to growth in VET FEE-HELP. 36. Increase due to investment in teacher capability, improved customer service and focus on improved
equipment and teaching resources for staff and students. 37. Increase due to investment in developing new course offerings for students that meet the criteria for
capitalisation under Treasury non-current asset accounting policy and additional investment in plant and equipment for staff and students.
2012-13 Queensland State Budget – Service Delivery Statements – Queensland Studies Authority 47
QUEENSLAND STUDIES AUTHORITY
AGENCY OVERVIEW
Strategic direction
The Queensland Studies Authority (QSA) is a statutory authority established in 2002 under the Education (Queensland Studies Authority) Act 2002. Its vision is to provide quality, innovative and future-focused products and services to assist all Queensland education communities. The QSA provides Kindergarten to Year 12 syllabuses and guidelines, assessment, reporting, testing, accreditation, certification and tertiary entrance services for Queensland schools. The QSA supports the Queensland Government’s objective to revitalise front line services for families by assisting teachers to develop high-quality curriculum for the classroom. Influenced by educational change at both the state and national levels, the QSA’s strategic objectives focus on providing: • innovative syllabuses and supporting products that assist schools to prepare young people for
life and work in the 21st century • assessments and other resources that enable students to demonstrate achievement and
provide useful information for teachers, parents and other stakeholders • efficient and effective delivery of its products and services.
RESOURCES AND PERFORMANCE The QSA will continue to work with its education partners to provide schools with resources and support to enable teachers to confidently implement the Australian Curriculum. A comprehensive state-wide professional development program has been delivered in addition to the development of over 350 online resources to support the new curriculum in schools. The Queensland kindergarten learning guideline (QKLG) was developed by the QSA, based on the Australian Government’s Early Years Learning Framework for Australia. The QSA will continue to provide resources and support to assist implementation of the QKLG in childcare centres. In Queensland, the 2012 National Assessment Program – Literacy and Numeracy (NAPLAN) was administered to approximately 218,700 Years 3, 5, 7 and 9 students. The QSA’s online collection of assessment resources continued to grow, with over 1,200 items in its Assessment Bank, and 245 sample assessment instruments and 150 annotated student responses available to support effective assessment of senior students. The QSA supported implementation of the Queensland Comparable Assessment Tasks (QCATs) in Years 4, 6 and 9 in 2011 and developed the final tasks for 2012. In 2011, the QSA issued 47,209 Senior Education Profiles to Year 12 Queensland students, 39,582 (84%) of whom also received a Queensland Certificate of Education (QCE) — up from 80% in 2010. Queensland Certificates of Individual Achievement (QCIA) were awarded to 660 students, and 26,815 students received Tertiary Entrance Statements. The QSA will continue to work with schools and education stakeholders to increase eligibility for a QCE and Year 12 completion rates. An upgrade to its information and communication technology infrastructure will ensure efficient delivery of its certification and tertiary entrance functions.

2012-13 Queensland State Budget – Service Delivery Statements – Queensland Studies Authority 48
STATEMENTS
Staffing1
Queensland Studies Authority Notes 2011-12 Budget
2011-12 Est. actual
2012-13 Estimate
2, 3 242 247 217
Notes: 1. Full-time equivalents (FTEs) as at 30 June.2. The majority of the QSA's FTE staff are based at the South Brisbane office, with the remainder
located at 11 district offices across Queensland. The figures include permanent and temporary funded positions.
3. The 2011-12 Estimated Actual includes some temporary FTEs engaged for short term projects which are not expected to continue into 2012-13.
Performance Statement
Queensland Studies Authority Notes 2011-12 Target/est.
2011-12 Est. actual
2012-13 Target/Est.
Service standards
Percentage of stakeholders surveyed who consider the syllabuses and support materials developed by the authority to be satisfactory 1 86% 93% 93%
Quality of certification processes: the percentage of all learners whose Queensland Certificate of Education (QCE) eligibility status changed following request for verification or review of information 2 0.2% 0.4% 0.2%
Quality of certification processes: the percentage of all OP eligible Year 12 students whose OP changed following request for verification or review of information 3 0.03% 0.01% 0.01%
Percentage of principals rating the communication and test preparation material for National Assessment Program – Literacy and Numeracy (NAPLAN) as good or very good 4 90% 94% 94%
Average cost per school of external audit as a Registered Training Organisation 5, 6 $7,270 $13,942 $13,200
Average cost per syllabus revision 7 $93,181 $78,317 $79,691
Average cost per student of developing and issuing Senior Education Profiles 8 $254 $273 $276
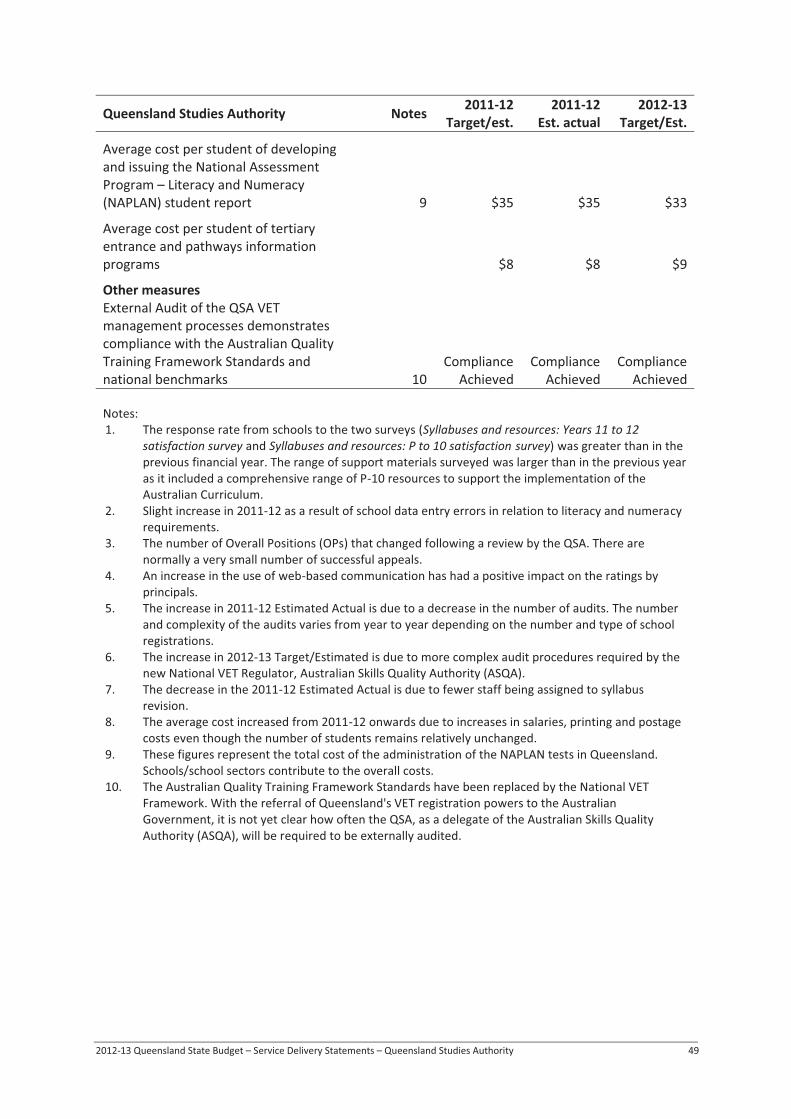
2012-13 Queensland State Budget – Service Delivery Statements – Queensland Studies Authority 49
Queensland Studies Authority Notes 2011-12 Target/est.
2011-12 Est. actual
2012-13 Target/Est.
Average cost per student of developing and issuing the National Assessment Program – Literacy and Numeracy (NAPLAN) student report 9 $35 $35 $33
Average cost per student of tertiary entrance and pathways information programs $8 $8 $9
Other measures External Audit of the QSA VET management processes demonstrates compliance with the Australian Quality Training Framework Standards and national benchmarks 10
Compliance Achieved
Compliance Achieved
Compliance Achieved
Notes: 1. The response rate from schools to the two surveys (Syllabuses and resources: Years 11 to 12
satisfaction survey and Syllabuses and resources: P to 10 satisfaction survey) was greater than in the previous financial year. The range of support materials surveyed was larger than in the previous year as it included a comprehensive range of P-10 resources to support the implementation of the Australian Curriculum.
2. Slight increase in 2011-12 as a result of school data entry errors in relation to literacy and numeracy requirements.
3. The number of Overall Positions (OPs) that changed following a review by the QSA. There are normally a very small number of successful appeals.
4. An increase in the use of web-based communication has had a positive impact on the ratings by principals.
5. The increase in 2011-12 Estimated Actual is due to a decrease in the number of audits. The number and complexity of the audits varies from year to year depending on the number and type of school registrations.
6. The increase in 2012-13 Target/Estimated is due to more complex audit procedures required by the new National VET Regulator, Australian Skills Quality Authority (ASQA).
7. The decrease in the 2011-12 Estimated Actual is due to fewer staff being assigned to syllabus revision.
8. The average cost increased from 2011-12 onwards due to increases in salaries, printing and postage costs even though the number of students remains relatively unchanged.
9. These figures represent the total cost of the administration of the NAPLAN tests in Queensland. Schools/school sectors contribute to the overall costs.
10. The Australian Quality Training Framework Standards have been replaced by the National VET Framework. With the referral of Queensland's VET registration powers to the Australian Government, it is not yet clear how often the QSA, as a delegate of the Australian Skills Quality Authority (ASQA), will be required to be externally audited.
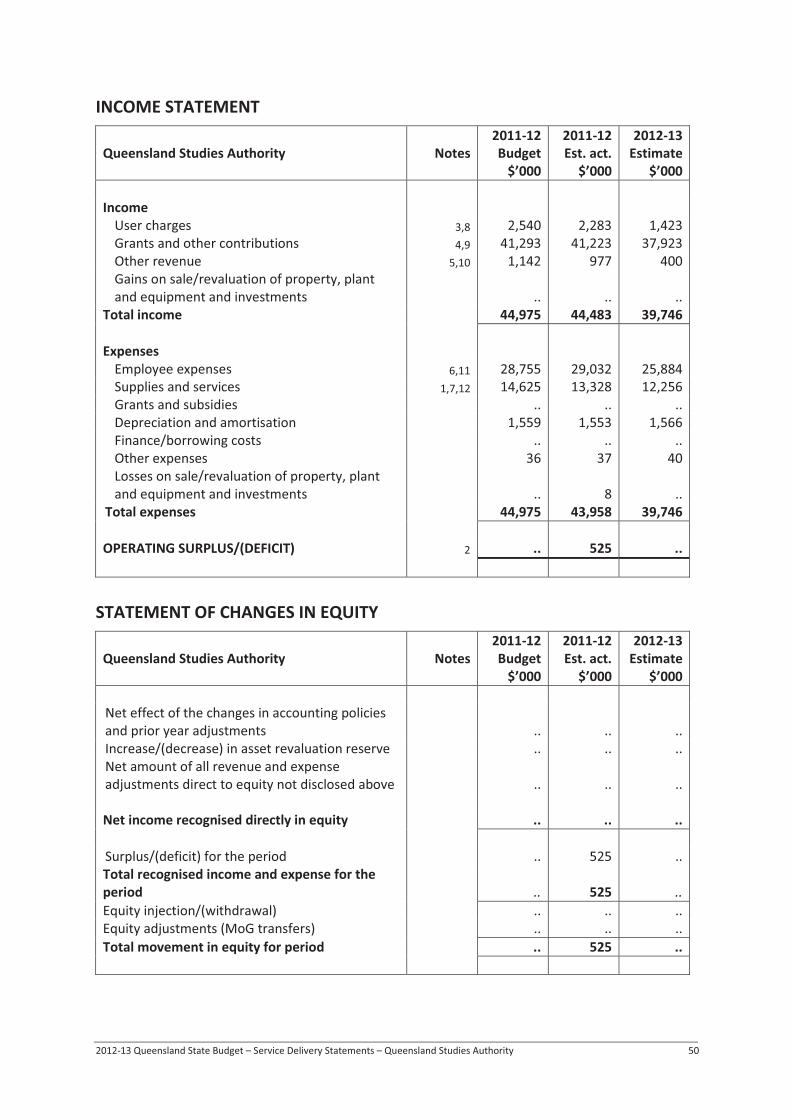
2012-13 Queensland State Budget – Service Delivery Statements – Queensland Studies Authority 50
INCOME STATEMENT
Queensland Studies Authority Notes 2011-12 Budget
$’000
2011-12 Est. act.
$’000
2012-13 Estimate
$’000 Income
User charges 3,8 2,540 2,283 1,423 Grants and other contributions 4,9 41,293 41,223 37,923 Other revenue 5,10 1,142 977 400 Gains on sale/revaluation of property, plant and equipment and investments .. .. ..
Total income 44,975 44,483 39,746 Expenses
Employee expenses 6,11 28,755 29,032 25,884 Supplies and services 1,7,12 14,625 13,328 12,256 Grants and subsidies .. .. .. Depreciation and amortisation 1,559 1,553 1,566 Finance/borrowing costs .. .. .. Other expenses 36 37 40 Losses on sale/revaluation of property, plant and equipment and investments .. 8 ..
Total expenses 44,975 43,958 39,746 OPERATING SURPLUS/(DEFICIT) 2 .. 525 ..
STATEMENT OF CHANGES IN EQUITY
Queensland Studies Authority Notes 2011-12 Budget
$’000
2011-12 Est. act.
$’000
2012-13 Estimate
$’000
Net effect of the changes in accounting policies and prior year adjustments .. .. .. Increase/(decrease) in asset revaluation reserve .. .. .. Net amount of all revenue and expense adjustments direct to equity not disclosed above .. .. .. Net income recognised directly in equity .. .. .. Surplus/(deficit) for the period .. 525 .. Total recognised income and expense for the period .. 525 .. Equity injection/(withdrawal) .. .. .. Equity adjustments (MoG transfers) .. .. .. Total movement in equity for period .. 525 ..

2012-13 Queensland State Budget – Service Delivery Statements – Queensland Studies Authority 51
BALANCE SHEET
Queensland Studies Authority Notes 2011-12 Budget
$’000
2011-12 Est. act.
$’000
2012-13 Estimate
$’000 CURRENT ASSETS
Cash assets 13,19 9,880 10,739 10,008 Receivables 20 499 477 317 Other financial assets .. .. .. Inventories 38 8 7 Other 14,18 400 199 172
Non-financial assets held for sale .. .. .. Total current assets 10,817 11,423 10,504 NON-CURRENT ASSETS
Receivables .. .. .. Other financial assets .. .. .. Property, plant and equipment 17,21 806 873 1,311 Intangibles 5,451 5,601 5,459 Other .. .. ..
Total non-current assets 6,257 6,474 6,770 TOTAL ASSETS 17,074 17,897 17,274 CURRENT LIABILITIES
Payables 3,674 3,442 3,114 Accrued employee benefits 15 1,783 2,101 1,856 Interest-bearing liabilities and derivatives .. .. .. Provisions .. .. .. Other 16 81 291 241
Total current liabilities 5,538 5,834 5,211 NON-CURRENT LIABILITIES
Payables .. .. .. Accrued employee benefits .. .. .. Interest-bearing liabilities and derivatives .. .. .. Provisions .. .. .. Other .. .. ..
Total non-current liabilities .. .. .. TOTAL LIABILITIES 5,538 5,834 5,211 NET ASSETS/(LIABILITIES) 11,536 12,063 12,063 EQUITY
Capital/contributed equity 4,832 4,832 4,832 Accumulated surplus/(accumulated deficit) 6,704 7,231 7,231 Reserves:
- Asset revaluation surplus .. .. .. - Other (specify) .. .. ..
TOTAL EQUITY 11,536 12,063 12,063
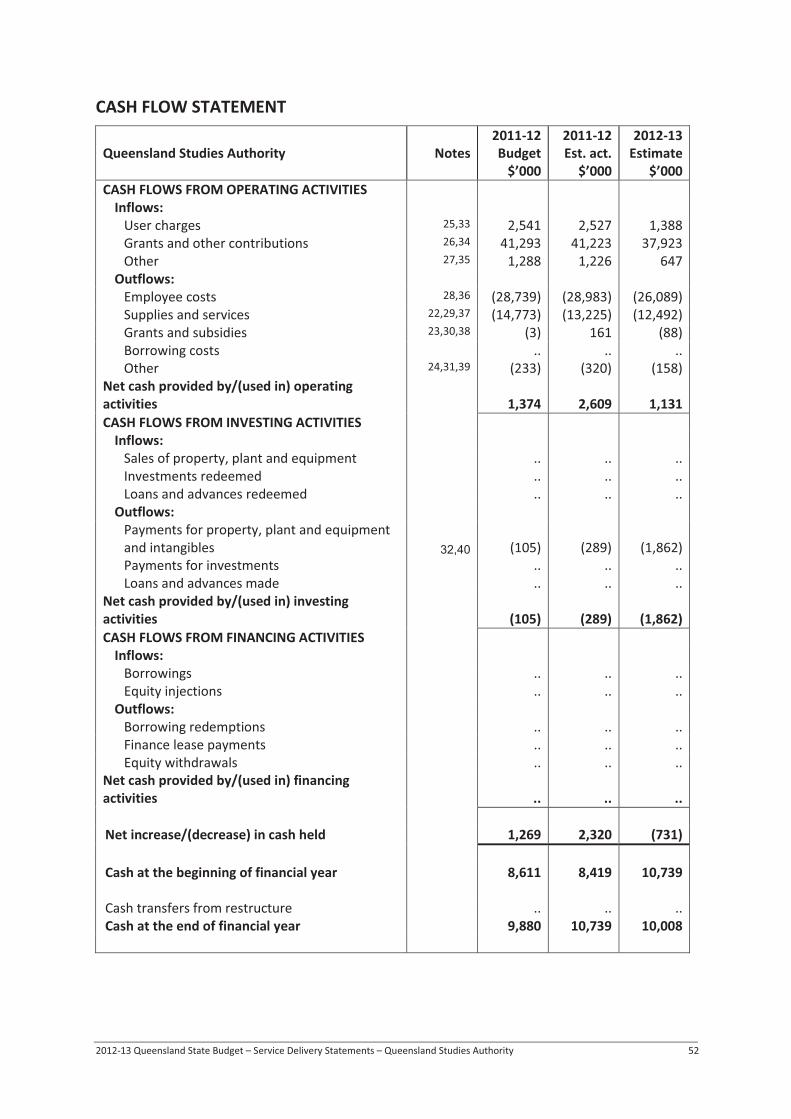
2012-13 Queensland State Budget – Service Delivery Statements – Queensland Studies Authority 52
CASH FLOW STATEMENT
Queensland Studies Authority Notes 2011-12 Budget
$’000
2011-12 Est. act.
$’000
2012-13 Estimate
$’000 CASH FLOWS FROM OPERATING ACTIVITIES
Inflows: User charges 25,33 2,541 2,527 1,388 Grants and other contributions 26,34 41,293 41,223 37,923 Other 27,35 1,288 1,226 647
Outflows: Employee costs 28,36 (28,739) (28,983) (26,089) Supplies and services 22,29,37 (14,773) (13,225) (12,492) Grants and subsidies 23,30,38 (3) 161 (88) Borrowing costs .. .. .. Other 24,31,39 (233) (320) (158)
Net cash provided by/(used in) operating activities 1,374 2,609 1,131 CASH FLOWS FROM INVESTING ACTIVITIES
Inflows: Sales of property, plant and equipment .. .. .. Investments redeemed .. .. .. Loans and advances redeemed .. .. ..
Outflows: Payments for property, plant and equipment and intangibles 32,40 (105) (289) (1,862) Payments for investments .. .. .. Loans and advances made .. .. ..
Net cash provided by/(used in) investing activities (105) (289) (1,862) CASH FLOWS FROM FINANCING ACTIVITIES
Inflows: Borrowings .. .. .. Equity injections .. .. ..
Outflows: Borrowing redemptions .. .. .. Finance lease payments .. .. .. Equity withdrawals .. .. ..
Net cash provided by/(used in) financing activities .. .. ..
Net increase/(decrease) in cash held 1,269 2,320 (731) Cash at the beginning of financial year 8,611 8,419 10,739 Cash transfers from restructure .. .. .. Cash at the end of financial year 9,880 10,739 10,008

2012-13 Queensland State Budget – Service Delivery Statements – Queensland Studies Authority 53
EXPLANATION OF VARIANCES IN THE FINANCIAL STATEMENTS Income statement Major variations between 2011-12 Budget and 2011-12 Estimated actual include: 1. Decrease predominately due to savings from a reduction in review panel monitoring meetings as well as
the National Assessment Program – Literacy and Numeracy (NAPLAN) contractor costs being lower than anticipated. Savings were also realised from the consolidation of two separate district offices into one location and from lower venue hire and catering costs due to a reduction in professional development workshops.
2. Surplus due to cost savings in review panel monitoring meetings, NAPLAN, operating leases, venue hire and catering. These savings were reduced by less income from professional development workshops combined with lower interest rates on invested funds.
Major variations between 2011-12 Budget and 2012-13 Estimate include: 3. Decrease due to the decision not to hold a conference in 2013 as well as an anticipated continuing
decline in attendance at professional development workshops due to competing opportunities for teacher professional development.
4. Decrease predominately due to the cessation of funding from the Department of Education, Training and Employment (DETE) for the Queensland Comparable Assessment Tasks (QCATs) as part of DETE’s commitment to reducing the regulatory burden.
5. Decrease due to a change in the timing of administered grant payments from DETE to more closely match the QSA’s planned expenditure profile resulting in a reduction in investible funds.
6. Decrease due to a reduction in FTEs as a result of the cessation of QCATs in 2013. 7. Decrease due to savings in costs from the decision to not hold a conference in 2013 as well as cost
savings from a reduction in other professional development activities, contractors and travel. Savings also realised from the consolidation of two separate district offices into one location in 2011-12.
Major variations between 2011-12 Estimated actual and the 2012-13 Estimate include: 8. Decrease due to the decision not to hold a conference in 2013 as well as an anticipated continuing
decline in attendance at professional development workshops due to competing opportunities for teacher professional development.
9. Decrease predominately due to the cessation of funding from DETE for QCATs as part of DETE’s commitment to reducing the regulatory burden.
10. Decrease due to a change in the timing of administered grant payments from DETE to more closely match the QSA’s planned expenditure profile resulting in a reduction in investible funds.
11. Decrease due to a reduction in FTEs as a result of the cessation of QCATs in 2013. 12. Decrease due to savings in costs from the decision to not hold a conference in 2013 as well as cost
savings from a reduction in other professional development activities, contractors and travel.
Balance sheet Major variations between 2011-12 Budget and 2011-12 Estimated actual include: 13. Increase due to operating surplus. 14. Decrease due to decline in prepaid expenditure in line with reduction in supplies and services. 15. Increase primarily reflects a higher than projected opening balance brought forward from 2010-11. 16. Increase in unearned revenue due to a change in accounting treatment of Visa student fee income. Major variations between 2011-12 Budget and 2012-13 Estimate include: 17. Increase in capital expenditure due to replacement of the Senior Learning Information Management
System (SLIMS) ICT hardware. 18. Decrease due to decline in prepaid expenditure in line with reduction in supplies and services. Major variations between 2011-12 Estimated actual and the 2012-13 Estimate include: 19. Decrease due to a reduction in grant funding from DETE and a change in the timing of the grant
payments to more closely match the QSA’s planned expenditure profile. Reduction also due to increased capital expenditure from the replacement of Senior Learning Information Management System (SLIMS) ICT hardware.

2012-13 Queensland State Budget – Service Delivery Statements – Queensland Studies Authority 54
20. Decrease in line with reduction in user charges and interest revenue. 21. Increase in capital expenditure due to replacement of SLIMS ICT hardware.
Cash flow statement Major variations between 2011-12 Budget and 2011-12 Estimated actual include: 22. Decrease predominately due to savings from a reduced number of review panel monitoring meetings in
regional areas affected by flooding as well as NAPLAN contractor costs being lower than anticipated. Savings were also realised from the consolidation of two separate district offices into one location and from lower venue hire and catering costs in line with a reduction in professional development workshops.
23. Reduction in cash outflow resulting from June 2011 payroll tax liability being paid in June 2011, not July 2012.
24. Increase due to higher than anticipated GST payments. Major variations between 2011-12 Budget and 2012-13 Estimate include: 25. Decrease due to the decision not to hold a conference in 2013 as well as an anticipated continuing
decline in attendance at professional development workshops due to competing opportunities for teacher professional development.
26. Decrease predominately due to the cessation of funding from DETE for QCATs as part of DETE’s commitment to reducing the regulatory burden.
27. Decrease due to a change in the timing of administered grant payments from DETE to more closely match the QSA’s planned expenditure profile resulting in a reduction in investible funds.
28. Decrease due to a reduction in FTEs as a result of the cessation of QCATs in 2013. 29. Decrease due to savings in costs from the decision to not hold a conference in 2013 as well as cost
savings from a reduction in other professional development activities, contractors and travel. Savings also realised from the consolidation of two separate district offices into one location in 2011-12.
30. Increase in cash outflow resulting from June 2011 payroll tax liability being paid in June 2011, not July 2012.
31. Reduction in GST payments in line with reduction in user charges income. 32. Increase in capital expenditure due to replacement of SLIMS ICT hardware and the Student Data
Capture System (SDCS) software application. Major variations between 2011-12 Estimated actual and the 2012-13 Estimate include: 33. Decrease due to the decision not to hold a conference in 2013 as well as an anticipated continuing
decline in attendance at professional development workshops due to competing opportunities for teacher professional development.
34. Decrease predominately due to the cessation of funding from DETE for QCATs as part of DETE’s commitment to reducing the regulatory burden.
35. Decrease due to a change in the timing of administered grant payments from DETE to more closely match the QSA’s planned expenditure profile resulting in a reduction in investible funds.
36. Decrease due to a reduction in FTEs as a result of the cessation of QCATs in 2013. 37. Decrease due to savings in costs from the decision to not hold a conference in 2013 as well as cost
savings from a reduction in other professional development activities, contractors and travel. 38. Increase in cash outflow resulting from June 2011 payroll tax liability being paid in June 2011, not
July 2012. 39. Reduction in GST payments in line with reduction in user charges income. 40. Increase in capital expenditure due to replacement of SLIMS ICT hardware and the SDCS software
application.
2012-13 Queensland State Budget - Service Delivery Statements – Southbank Institute of Technology 55
SOUTHBANK INSTITUTE OF TECHNOLOGY
AGENCY OVERVIEW
Strategic direction
Southbank Institute of Technology (SBIT) was established as a statutory TAFE institute under the Vocational Education, Training and Employment Act 2000 on 1 April 2008. SBIT contributes to the Government’s objective to grow a four pillar economy by delivering world-class education and training, providing educational development pathways and enhanced skills for a global market. The Institute’s vision is to be Australia’s leading provider of vocational training and job-ready graduates. SBIT offers a range of high-level vocational qualifications, associate degrees, university pathways and articulation arrangements in key industries. On behalf of the Department of Education, Training and Employment, SBIT acts as the contract manager for two Australian Government programs – the Adult Migrant English Program and the Language, Literacy and Numeracy Program, both delivered in TAFE institutes across Queensland. The Institute is focused on building a more commercial and high performing culture, improving academic quality and operational efficiency, building a stronger market position and improving the experience of its staff and students. The overall purpose of the business is to support the ongoing growth of Queensland’s economy through training high quality, job ready graduates. This will be achieved by meeting industry skills needs and through applied learning. RESOURCES AND PERFORMANCE SBIT offers both FEE-HELP and VET FEE-HELP and continues to increase the number of eligible VET courses as a VET FEE-HELP provider. In 2011-12, the Institute had over 1435 full time equivalent students enrolled in FEE- HELP, compared to 939 in 2010-11. In 2011-12, SBIT students were able to access an increased number of pathways to higher education. The number of pathways increased to 258 (up from 189 in 2010-11) to universities such as Queensland University of Technology, Griffith University, University of Queensland and the University of Sunshine Coast, University of Southern Queensland and Southern Cross University. As a statutory authority, the Institute’s business model is focussed on driving commercial efficiency outcomes by increasing fee for service programs which results in less reliance on government grants and contributions. The Institute is also developing strategies to continue to strengthen its financial position and ensure it continues to deliver quality vocational training for students. These strategies include:
establishing an Academic Board exploring new markets and developing strong international partnerships increasing the number of degree programs available to students.
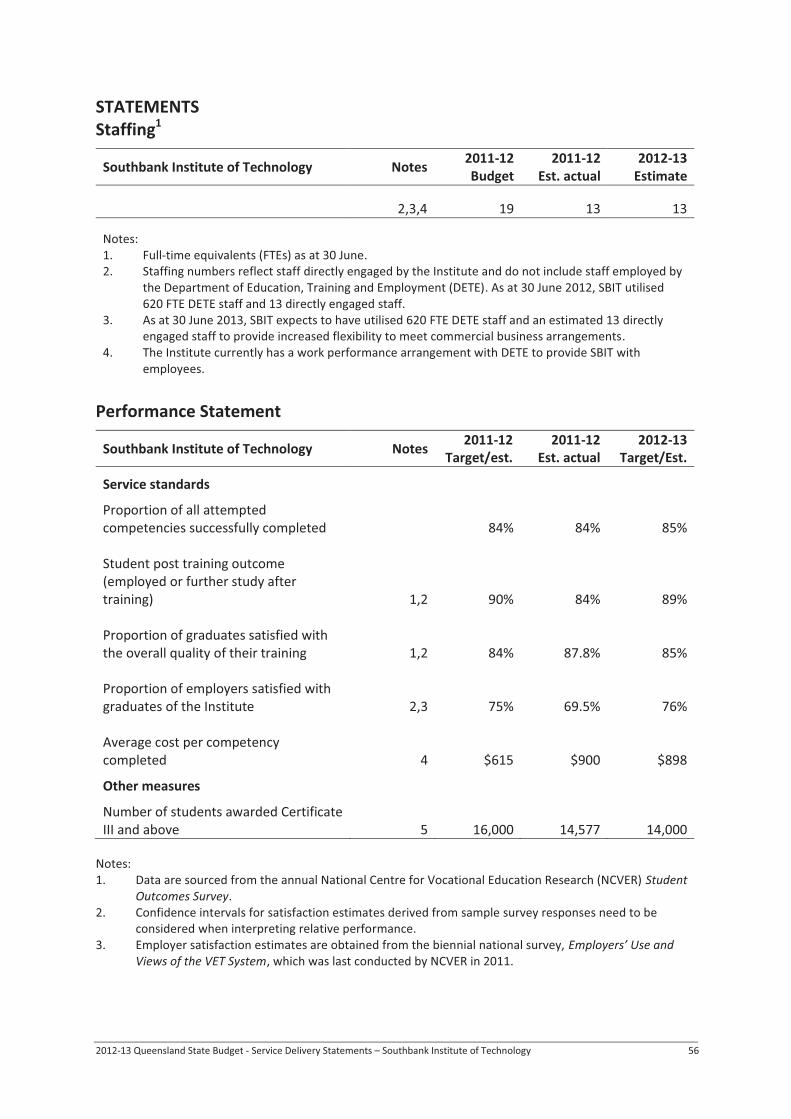
2012-13 Queensland State Budget - Service Delivery Statements – Southbank Institute of Technology 56
STATEMENTS Staffing1
Southbank Institute of Technology Notes 2011-12 Budget
2011-12 Est. actual
2012-13 Estimate
2,3,4 19 13 13
Notes: 1. Full-time equivalents (FTEs) as at 30 June.2. Staffing numbers reflect staff directly engaged by the Institute and do not include staff employed by
the Department of Education, Training and Employment (DETE). As at 30 June 2012, SBIT utilised 620 FTE DETE staff and 13 directly engaged staff.
3. As at 30 June 2013, SBIT expects to have utilised 620 FTE DETE staff and an estimated 13 directly engaged staff to provide increased flexibility to meet commercial business arrangements.
4. The Institute currently has a work performance arrangement with DETE to provide SBIT with employees.
Performance Statement
Southbank Institute of Technology Notes 2011-12 Target/est.
2011-12 Est. actual
2012-13 Target/Est.
Service standards
Proportion of all attempted competencies successfully completed 84% 84% 85% Student post training outcome (employed or further study after training) 1,2 90% 84% 89% Proportion of graduates satisfied with the overall quality of their training 1,2 84% 87.8% 85% Proportion of employers satisfied with graduates of the Institute 2,3 75% 69.5% 76% Average cost per competency completed 4 $615 $900 $898
Other measures
Number of students awarded Certificate III and above 5 16,000 14,577 14,000
Notes: 1. Data are sourced from the annual National Centre for Vocational Education Research (NCVER) Student
Outcomes Survey. 2. Confidence intervals for satisfaction estimates derived from sample survey responses need to be
considered when interpreting relative performance. 3. Employer satisfaction estimates are obtained from the biennial national survey, Employers’ Use and
Views of the VET System, which was last conducted by NCVER in 2011.
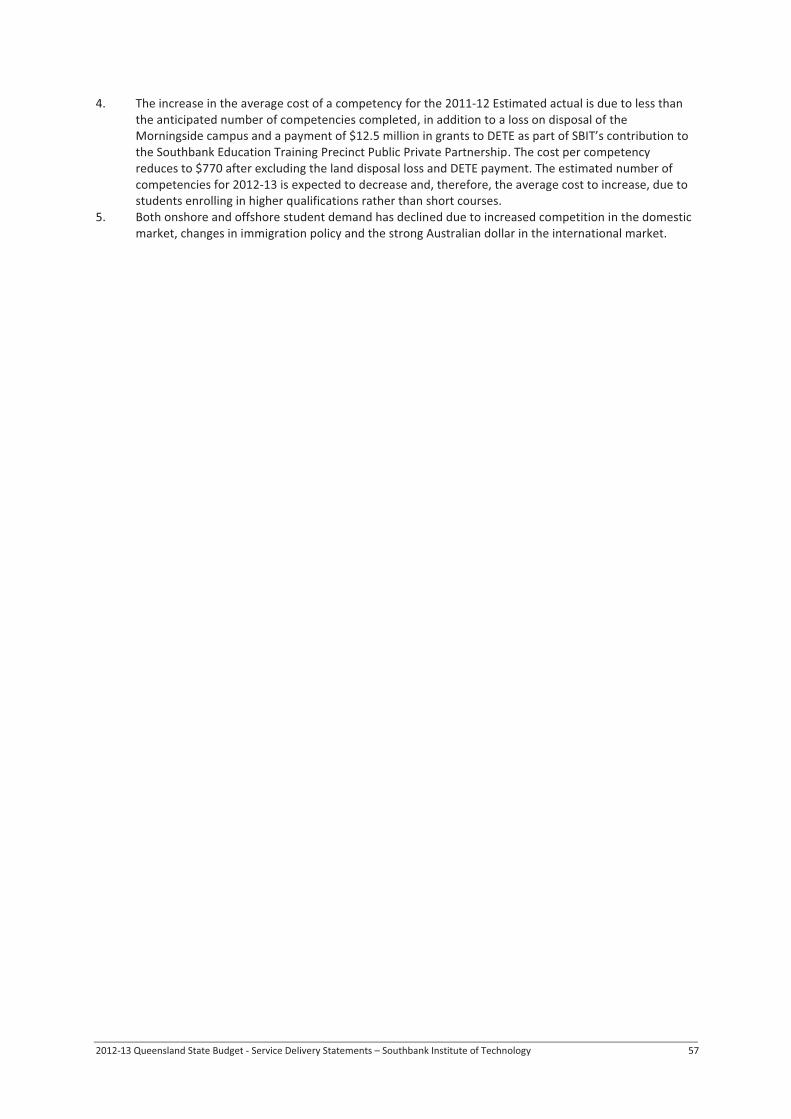
2012-13 Queensland State Budget - Service Delivery Statements – Southbank Institute of Technology 57
4. The increase in the average cost of a competency for the 2011-12 Estimated actual is due to less than the anticipated number of competencies completed, in addition to a loss on disposal of the Morningside campus and a payment of $12.5 million in grants to DETE as part of SBIT’s contribution to the Southbank Education Training Precinct Public Private Partnership. The cost per competency reduces to $770 after excluding the land disposal loss and DETE payment. The estimated number of competencies for 2012-13 is expected to decrease and, therefore, the average cost to increase, due to students enrolling in higher qualifications rather than short courses.
5. Both onshore and offshore student demand has declined due to increased competition in the domestic market, changes in immigration policy and the strong Australian dollar in the international market.

2012-13 Queensland State Budget - Service Delivery Statements – Southbank Institute of Technology 58
INCOME STATEMENT
Southbank Institute of Technology Notes 2011-12 Budget
$’000
2011-12 Est. act.
$’000
2012-13 Estimate
$’000 Income
User charges 1,8,11 62,528 60,769 67,040 Grants and other contributions 2,9 35,706 37,195 36,892 Other revenue 3,12 640 1,440 1,348 Gains on sale/revaluation of property, plant and equipment and investments .. .. ..
Total income 98,874 99,404 105,280 Expenses
Employee expenses 4 3,194 2,515 2,588 Supplies and services 5,10,13 103,873 95,855 100,872 Grants and subsidies 6,14 .. 12,500 .. Depreciation and amortisation 15 1,369 1,326 1,517 Finance/borrowing costs .. .. .. Other expenses 386 513 944 Losses on sale/revaluation of property, plant and equipment and investments 7,16 .. 3,883 ..
Total expenses 108,822 116,592 105,921 OPERATING SURPLUS/(DEFICIT) (9,948) (17,188) (641) STATEMENT OF CHANGES IN EQUITY
Southbank Institute of Technology Notes 2011-12 Budget
$’000
2011-12 Est. act.
$’000
2012-13 Estimate
$’000
Net effect of the changes in accounting policies and prior year adjustments .. .. .. Increase/(decrease) in asset revaluation reserve .. .. .. Net amount of all revenue and expense adjustments direct to equity not disclosed above .. .. .. Net income recognised directly in equity .. .. .. Surplus/(deficit) for the period (9,948) (17,188) (641)Total recognised income and expense for the period .. .. .. Equity injection/(withdrawal) .. .. (946)Equity adjustments (MoG transfers) .. .. .. Total movement in equity for period (9,948) (17,188) (1,587)
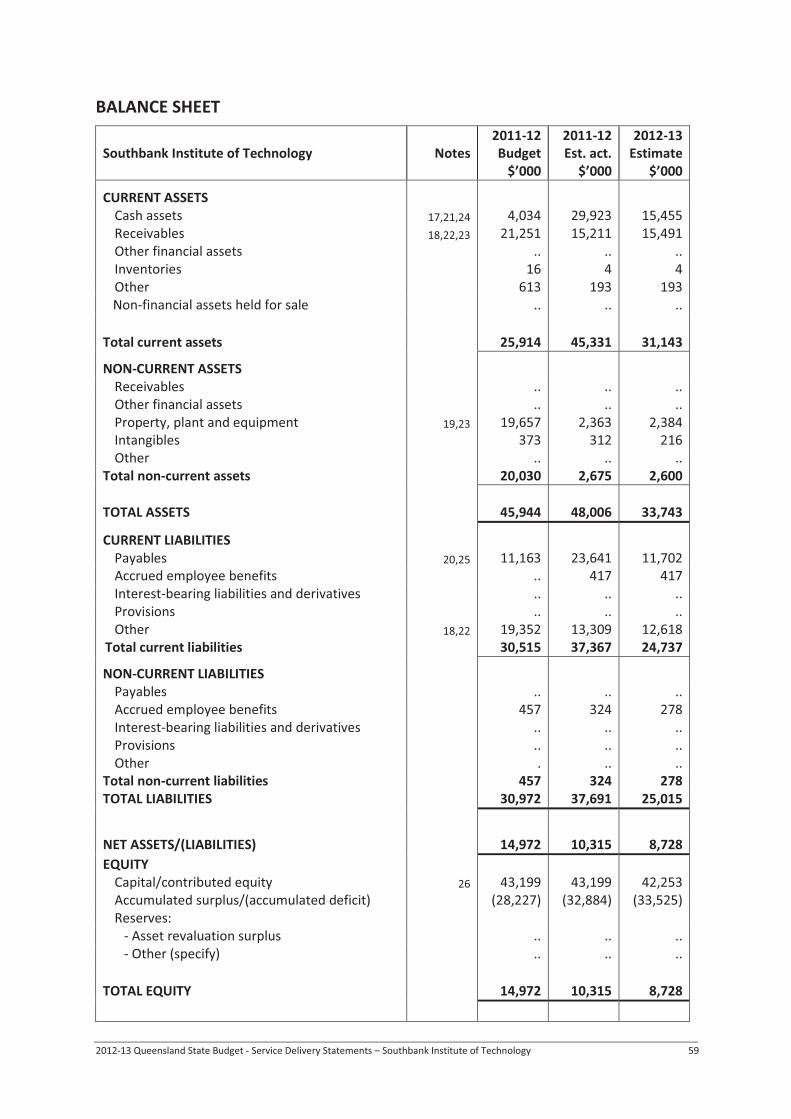
2012-13 Queensland State Budget - Service Delivery Statements – Southbank Institute of Technology 59
BALANCE SHEET
Southbank Institute of Technology Notes 2011-12 Budget
$’000
2011-12 Est. act.
$’000
2012-13 Estimate
$’000
CURRENT ASSETS Cash assets 17,21,24 4,034 29,923 15,455 Receivables 18,22,23 21,251 15,211 15,491 Other financial assets .. .. .. Inventories 16 4 4 Other 613 193 193
Non-financial assets held for sale .. .. .. Total current assets 25,914 45,331 31,143
NON-CURRENT ASSETS Receivables .. .. .. Other financial assets .. .. .. Property, plant and equipment 19,23 19,657 2,363 2,384 Intangibles 373 312 216 Other .. .. ..
Total non-current assets 20,030 2,675 2,600 TOTAL ASSETS 45,944 48,006 33,743
CURRENT LIABILITIES Payables 20,25 11,163 23,641 11,702 Accrued employee benefits .. 417 417 Interest-bearing liabilities and derivatives .. .. .. Provisions .. .. .. Other 18,22 19,352 13,309 12,618
Total current liabilities 30,515 37,367 24,737
NON-CURRENT LIABILITIES Payables .. .. .. Accrued employee benefits 457 324 278 Interest-bearing liabilities and derivatives .. .. .. Provisions .. .. .. Other . .. ..
Total non-current liabilities 457 324 278 TOTAL LIABILITIES 30,972 37,691 25,015
NET ASSETS/(LIABILITIES) 14,972 10,315 8,728 EQUITY
Capital/contributed equity 26 43,199 43,199 42,253 Accumulated surplus/(accumulated deficit) (28,227) (32,884) (33,525) Reserves:
- Asset revaluation surplus .. .. .. - Other (specify) .. .. ..
TOTAL EQUITY 14,972 10,315 8,728
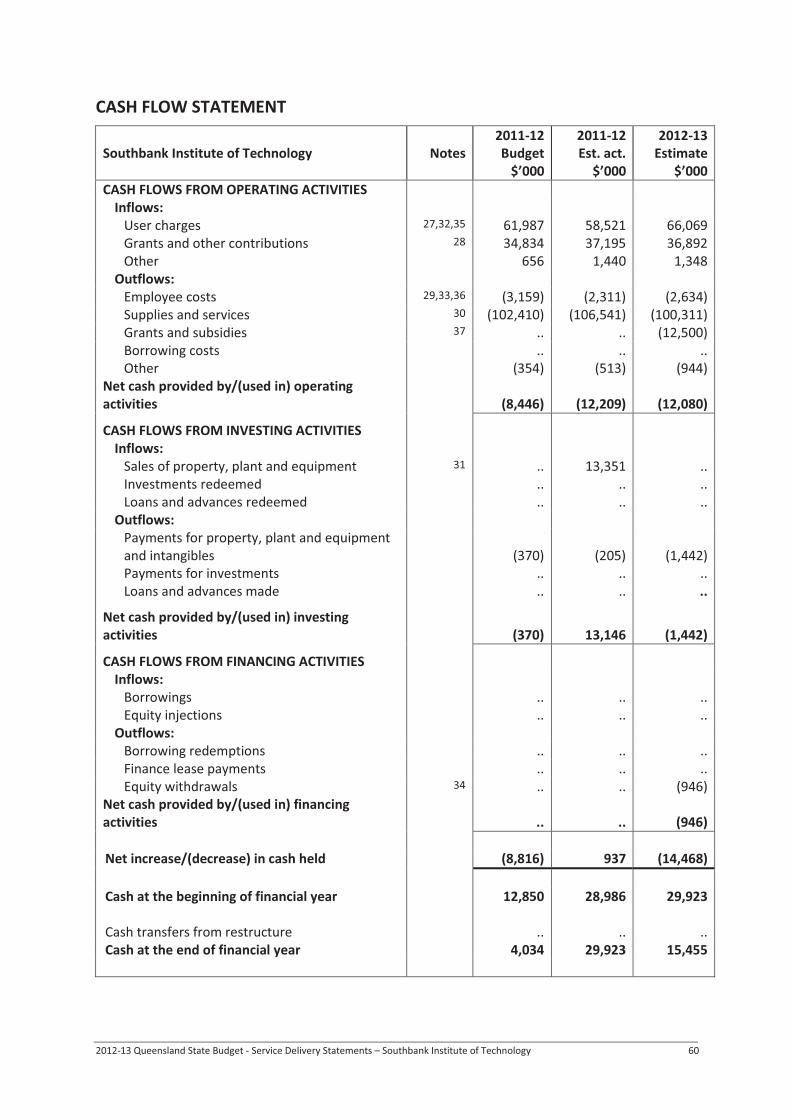
2012-13 Queensland State Budget - Service Delivery Statements – Southbank Institute of Technology 60
CASH FLOW STATEMENT
Southbank Institute of Technology Notes 2011-12 Budget
$’000
2011-12 Est. act.
$’000
2012-13 Estimate
$’000 CASH FLOWS FROM OPERATING ACTIVITIES
Inflows: User charges 27,32,35 61,987 58,521 66,069 Grants and other contributions 28 34,834 37,195 36,892 Other 656 1,440 1,348
Outflows: Employee costs 29,33,36 (3,159) (2,311) (2,634) Supplies and services 30 (102,410) (106,541) (100,311) Grants and subsidies 37 .. .. (12,500) Borrowing costs .. .. .. Other (354) (513) (944)
Net cash provided by/(used in) operating activities (8,446) (12,209) (12,080)
CASH FLOWS FROM INVESTING ACTIVITIES
Inflows: Sales of property, plant and equipment 31 .. 13,351 .. Investments redeemed .. .. .. Loans and advances redeemed .. .. ..
Outflows: Payments for property, plant and equipment and intangibles
(370) (205) (1,442) Payments for investments .. .. .. Loans and advances made .. .. ..
Net cash provided by/(used in) investing activities (370) 13,146 (1,442)
CASH FLOWS FROM FINANCING ACTIVITIES
Inflows: Borrowings .. .. .. Equity injections .. .. ..
Outflows: Borrowing redemptions .. .. .. Finance lease payments .. .. .. Equity withdrawals 34 .. .. (946)
Net cash provided by/(used in) financing activities .. .. (946)
Net increase/(decrease) in cash held (8,816) 937 (14,468) Cash at the beginning of financial year 12,850 28,986 29,923 Cash transfers from restructure .. .. .. Cash at the end of financial year 4,034 29,923 15,455
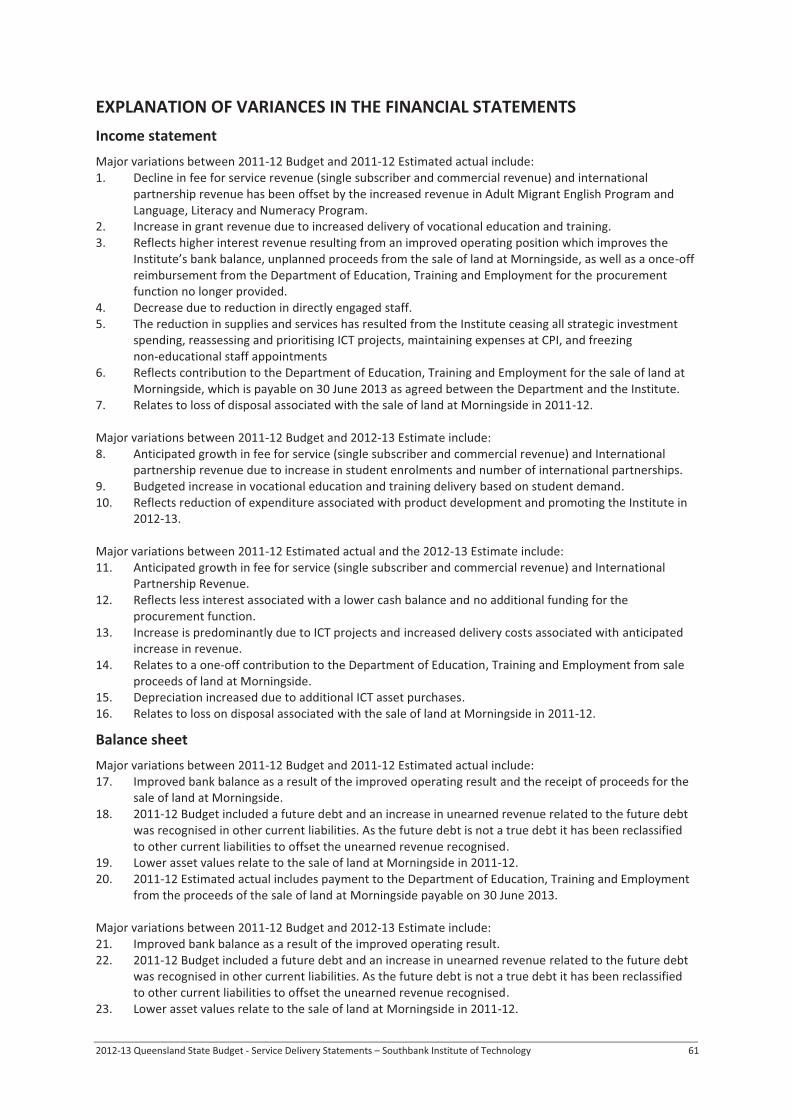
2012-13 Queensland State Budget - Service Delivery Statements – Southbank Institute of Technology 61
EXPLANATION OF VARIANCES IN THE FINANCIAL STATEMENTS Income statement Major variations between 2011-12 Budget and 2011-12 Estimated actual include: 1. Decline in fee for service revenue (single subscriber and commercial revenue) and international
partnership revenue has been offset by the increased revenue in Adult Migrant English Program and Language, Literacy and Numeracy Program.
2. Increase in grant revenue due to increased delivery of vocational education and training. 3. Reflects higher interest revenue resulting from an improved operating position which improves the
Institute’s bank balance, unplanned proceeds from the sale of land at Morningside, as well as a once-off reimbursement from the Department of Education, Training and Employment for the procurement function no longer provided.
4. Decrease due to reduction in directly engaged staff. 5. The reduction in supplies and services has resulted from the Institute ceasing all strategic investment
spending, reassessing and prioritising ICT projects, maintaining expenses at CPI, and freezing non-educational staff appointments
6. Reflects contribution to the Department of Education, Training and Employment for the sale of land at Morningside, which is payable on 30 June 2013 as agreed between the Department and the Institute.
7. Relates to loss of disposal associated with the sale of land at Morningside in 2011-12. Major variations between 2011-12 Budget and 2012-13 Estimate include: 8. Anticipated growth in fee for service (single subscriber and commercial revenue) and International
partnership revenue due to increase in student enrolments and number of international partnerships. 9. Budgeted increase in vocational education and training delivery based on student demand. 10. Reflects reduction of expenditure associated with product development and promoting the Institute in
2012-13. Major variations between 2011-12 Estimated actual and the 2012-13 Estimate include: 11. Anticipated growth in fee for service (single subscriber and commercial revenue) and International
Partnership Revenue. 12. Reflects less interest associated with a lower cash balance and no additional funding for the
procurement function. 13. Increase is predominantly due to ICT projects and increased delivery costs associated with anticipated
increase in revenue. 14. Relates to a one-off contribution to the Department of Education, Training and Employment from sale
proceeds of land at Morningside. 15. Depreciation increased due to additional ICT asset purchases. 16. Relates to loss on disposal associated with the sale of land at Morningside in 2011-12.
Balance sheet Major variations between 2011-12 Budget and 2011-12 Estimated actual include: 17. Improved bank balance as a result of the improved operating result and the receipt of proceeds for the
sale of land at Morningside. 18. 2011-12 Budget included a future debt and an increase in unearned revenue related to the future debt
was recognised in other current liabilities. As the future debt is not a true debt it has been reclassified to other current liabilities to offset the unearned revenue recognised.
19. Lower asset values relate to the sale of land at Morningside in 2011-12. 20. 2011-12 Estimated actual includes payment to the Department of Education, Training and Employment
from the proceeds of the sale of land at Morningside payable on 30 June 2013. Major variations between 2011-12 Budget and 2012-13 Estimate include: 21. Improved bank balance as a result of the improved operating result. 22. 2011-12 Budget included a future debt and an increase in unearned revenue related to the future debt
was recognised in other current liabilities. As the future debt is not a true debt it has been reclassified to other current liabilities to offset the unearned revenue recognised.
23. Lower asset values relate to the sale of land at Morningside in 2011-12.
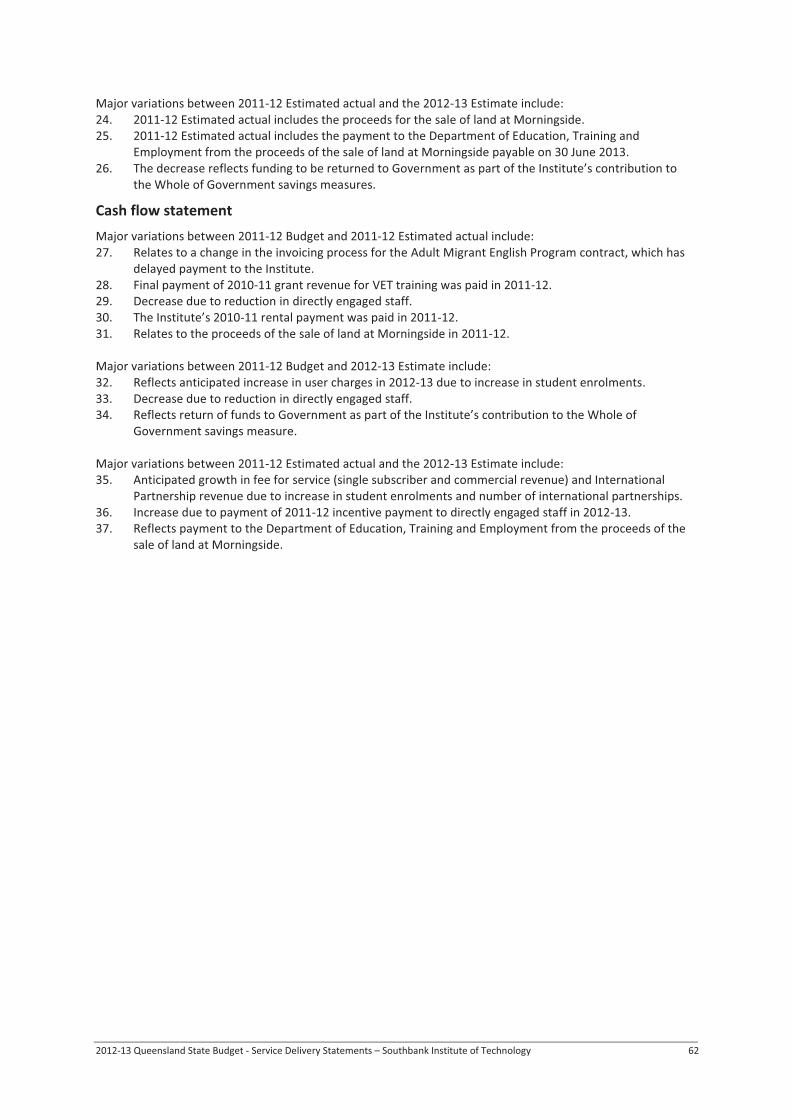
2012-13 Queensland State Budget - Service Delivery Statements – Southbank Institute of Technology 62
Major variations between 2011-12 Estimated actual and the 2012-13 Estimate include: 24. 2011-12 Estimated actual includes the proceeds for the sale of land at Morningside. 25. 2011-12 Estimated actual includes the payment to the Department of Education, Training and
Employment from the proceeds of the sale of land at Morningside payable on 30 June 2013. 26. The decrease reflects funding to be returned to Government as part of the Institute’s contribution to
the Whole of Government savings measures.
Cash flow statement Major variations between 2011-12 Budget and 2011-12 Estimated actual include: 27. Relates to a change in the invoicing process for the Adult Migrant English Program contract, which has
delayed payment to the Institute. 28. Final payment of 2010-11 grant revenue for VET training was paid in 2011-12. 29. Decrease due to reduction in directly engaged staff. 30. The Institute’s 2010-11 rental payment was paid in 2011-12. 31. Relates to the proceeds of the sale of land at Morningside in 2011-12. Major variations between 2011-12 Budget and 2012-13 Estimate include: 32. Reflects anticipated increase in user charges in 2012-13 due to increase in student enrolments. 33. Decrease due to reduction in directly engaged staff. 34. Reflects return of funds to Government as part of the Institute’s contribution to the Whole of
Government savings measure. Major variations between 2011-12 Estimated actual and the 2012-13 Estimate include: 35. Anticipated growth in fee for service (single subscriber and commercial revenue) and International
Partnership revenue due to increase in student enrolments and number of international partnerships. 36. Increase due to payment of 2011-12 incentive payment to directly engaged staff in 2012-13. 37. Reflects payment to the Department of Education, Training and Employment from the proceeds of the
sale of land at Morningside.
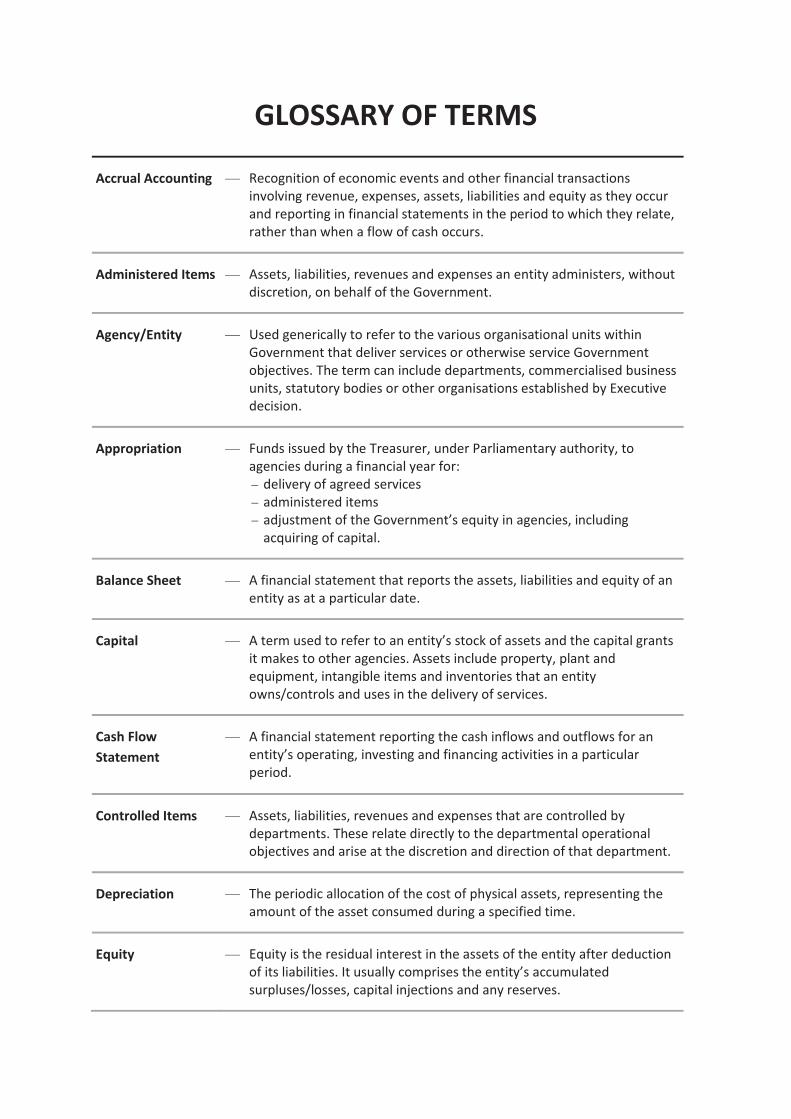
GLOSSARY OF TERMS
Accrual Accounting — Recognition of economic events and other financial transactions involving revenue, expenses, assets, liabilities and equity as they occur and reporting in financial statements in the period to which they relate, rather than when a flow of cash occurs.
Administered Items — Assets, liabilities, revenues and expenses an entity administers, without discretion, on behalf of the Government.
Agency/Entity — Used generically to refer to the various organisational units within Government that deliver services or otherwise service Government objectives. The term can include departments, commercialised business units, statutory bodies or other organisations established by Executive decision.
Appropriation — Funds issued by the Treasurer, under Parliamentary authority, to agencies during a financial year for:
delivery of agreed services administered items adjustment of the Government’s equity in agencies, including acquiring of capital.
Balance Sheet — A financial statement that reports the assets, liabilities and equity of an entity as at a particular date.
Capital — A term used to refer to an entity’s stock of assets and the capital grants it makes to other agencies. Assets include property, plant and equipment, intangible items and inventories that an entity owns/controls and uses in the delivery of services.
Cash Flow Statement
— A financial statement reporting the cash inflows and outflows for an entity’s operating, investing and financing activities in a particular period.
Controlled Items — Assets, liabilities, revenues and expenses that are controlled by departments. These relate directly to the departmental operational objectives and arise at the discretion and direction of that department.
Depreciation — The periodic allocation of the cost of physical assets, representing the amount of the asset consumed during a specified time.
Equity — Equity is the residual interest in the assets of the entity after deduction of its liabilities. It usually comprises the entity’s accumulated surpluses/losses, capital injections and any reserves.
Equity Injection — An increase in the investment of the Government in a public sector agency.
Financial Statements
— Collective description of the Income Statement, the Balance Sheet and the Cash Flow Statement for an entity’s controlled and administered activities.
Income Statement — A financial statement highlighting the accounting surplus or deficit of an entity. It provides an indication of whether the entity has sufficient revenue to meet expenses in the current year, including non-cash costs such as depreciation.
Outcomes — Whole-of-government outcomes are intended to cover all dimensions of community well being. They express the current needs and future aspirations of communities, within a social, economic and environment context.
Own-Source Revenue
— Revenue that is generated by an agency, generally through the sale of goods and services, but it may also include some Commonwealth funding.
Priorities — Key policy areas that will be the focus of Government activity.
Services — The actions or activities (including policy development) of an agency which contribute to the achievement of the agency’s objectives.
For a more detailed Glossary of Terms, please refer to the Reader’s Guide available on the Budget website at www.budget.qld.gov.au.

This page has been left blank.

This page has been left blank.

State Budget 2012-13 Service Delivery Statements www.budget.qld.gov.au

State Budget 2012–13 Service Delivery Statements www.budget.qld.gov.au


![State Budget 2015-16 Service Delivery Statements [Department name] · PDF fileSERVICE DELIVERY STATEMENTS. 2017-18 Queensland Budg et Papers 1. Budget Speech 2. Budget Strategy and](https://static.fdocuments.us/doc/165x107/5aa06a947f8b9a89178e067f/state-budget-2015-16-service-delivery-statements-department-name-delivery-statements.jpg)