Stat211 Practice Exam 3 (Final Exam)abilling/Stat211PracEx3Random.pdfStat211 Practice Exam 3 (Final...
18
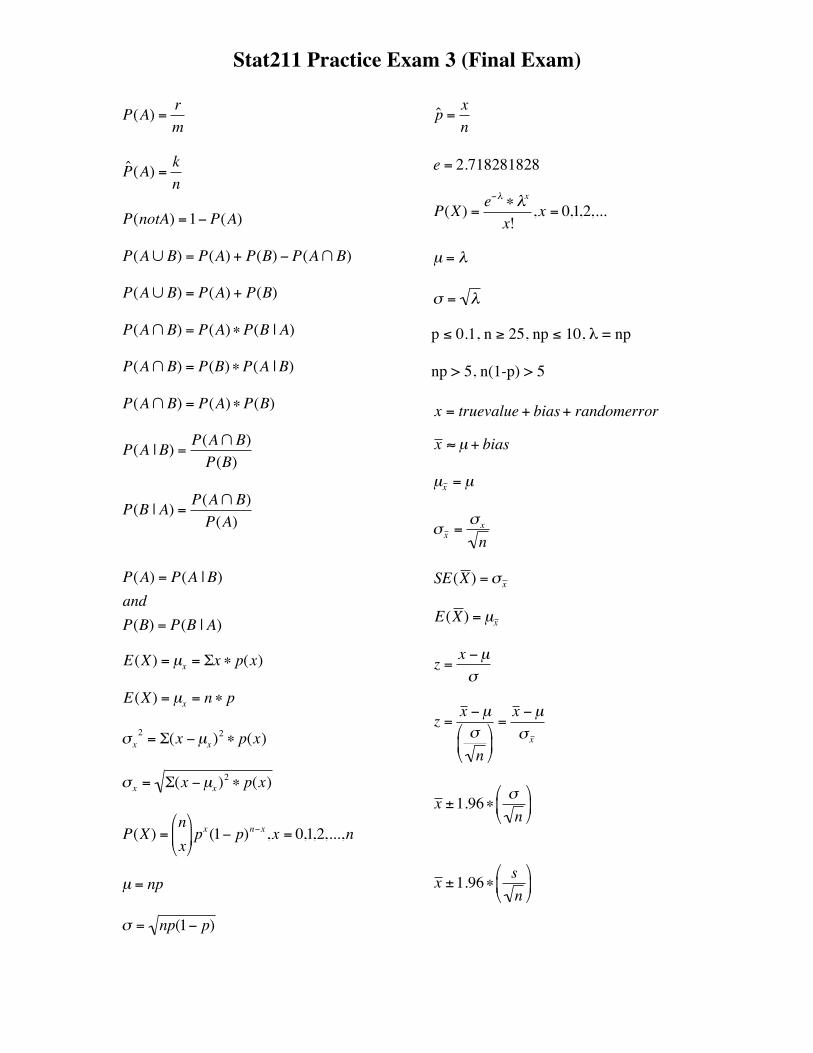
Stat211 Practice Exam 3 (Final Exam) n != n ∗ ( n − 1) ∗K∗ 2 ∗1 n m = n ! m !( n − m)! rel. freq. = freq. n x = Σx n μ = Σx N s = Σ( x − x ) 2 n − 1 = Σx 2 − ( Σx ) 2 n n − 1 σ = Σ( x − μ) 2 N s 2 = Σ( x − x ) 2 n − 1 = Σx 2 − ( Σx ) 2 n n − 1 σ 2 = Σ( x − μ) 2 N 1 2 n + 1 ( ) skew = 3( x − ˜ x ) s IQR = Q 3 – Q 1 z = x − μ σ SS( x ) = Σx 2 − ( Σx ) 2 n = Σ( x − x ) 2 SS( y ) = Σy 2 − ( Σy ) 2 n = Σ( y − y ) 2 SS( xy ) = Σxy − ( Σx )( Σy ) n = Σ( x − x )( y − y ) r = SS ( xy ) SS( x ) ∗ SS ( y ) r = Σxy − ( Σx )( Σy ) n Σx 2 − ( Σx ) 2 n ∗Σy 2 − ( Σy ) 2 n r = 1 n − 1 Σ x − x s x y − y s y r = 1 n − 1 1 s x ∗ s y Σ( x − x )( y − y ) y = b 0 + b 1 x b 1 = SS ( xy ) SS( x ) b 1 = Σxy − ( Σx )( Σy ) n Σx 2 − ( Σx ) 2 n b 1 = r s y s x b 0 = y − b 1 x residual = y − ˆ y SSE = Σ( y − ˆ y ) 2
Transcript of Stat211 Practice Exam 3 (Final Exam)abilling/Stat211PracEx3Random.pdfStat211 Practice Exam 3 (Final...

Stat211 Practice Exam 3 (Final Exam)
€
n!= n ∗ (n −1)∗K∗2∗1
€
nm
=
n!m!(n −m)!
€
rel. freq.= freq.n
€
x = Σxn
€
µ =ΣxN
€
s =Σ(x − x )2
n −1=
Σx 2 − (Σx)2
nn −1
€
σ =Σ(x −µ)2
N
€
s2 =Σ(x − x)2
n −1=Σx 2 − (Σx)
2
nn −1
€
σ 2 =Σ(x −µ)2
N
€
12n +1( )
€
skew =3(x − ˜ x )
s
IQR = Q3 – Q1
€
z =x −µσ
€
SS(x) = Σx 2 − (Σx)2
n= Σ(x − x )2
€
SS(y) = Σy 2 − (Σy)2
n= Σ(y − y )2
€
SS(xy) = Σxy − (Σx)(Σy)n
= Σ(x − x )(y − y )
€
r =SS(xy)
SS(x)∗ SS(y)
€
r =Σxy − (Σx)(Σy)
n
Σx 2 − (Σx)2
n
∗ Σy 2 − (Σy)
2
n
€
r =1
n −1
Σ
x − x sx
y − y sy
€
r =1
n −1
1sx ∗ sy
Σ(x − x )(y − y )
€
y = b0 + b1x
€
b1 =SS(xy)SS(x)
€
b1 =Σxy − (Σx)(Σy)
n
Σx 2 − (Σx)2
n
€
b1 = rsysx
€
b0 = y − b1x
€
residual = y − ˆ y
€
SSE = Σ(y − ˆ y ) 2
Stat211 Practice Exam 3 (Final Exam)
€
P(A) =rm
€
ˆ P (A) =kn
€
P(notA) =1− P(A)
€
P(A∪ B) = P(A) + P(B) − P(A∩ B)
€
P(A∪ B) = P(A) + P(B)
€
P(A∩ B) = P(A)∗P(B | A)
€
P(A∩ B) = P(B)∗P(A |B)
€
P(A∩ B) = P(A)∗P(B)
€
P(A |B) =P(A∩ B)P(B)
€
P(B | A) =P(A∩ B)P(A)
€
P(A) = P(A |B)andP(B) = P(B | A)
€
E(X) = µx = Σx ∗ p(x)
€
E(X) = µx = n ∗ p
€
σ x2 = Σ(x −µx )
2 ∗ p(x)
€
σ x = Σ(x −µx )2 ∗ p(x)
€
P(X) =nx
px (1− p)n−x,x = 0,1,2,...,n
€
µ = np
€
σ = np(1− p)
€
ˆ p = xn
€
e = 2.718281828
€
P(X) =e−λ ∗ λx
x!,x = 0,1,2,...
€
µ = λ
€
σ = λ p ≤ 0.1, n ≥ 25, np ≤ 10, λ = np np > 5, n(1-p) > 5
€
x = truevalue + bias+ randomerror
€
x ≈ µ + bias
€
µx = µ
€
σ x =σ x
n
€
SE(X ) =σ x
€
E(X ) = µx
€
z =x −µσ
€
z =x −µσn
=x −µσ x
€
x ±1.96∗ σn
€
x ±1.96∗ sn

Stat211 Practice Exam 3 (Final Exam)
€
x ± Crit.Val.∗ SE(X )
€
x ± z * sn
€
B = z ∗ sn
€
nˆ p > 5,n(1− ˆ p ) > 5
€
SE( ˆ p ) =ˆ p (1− ˆ p )
n
€
ˆ p ± z ∗ SE( ˆ p )
€
ˆ p ± z ∗ˆ p (1− ˆ p )
n
€
xn
± z ∗
xn1− x
n
n
For 90% C.L. z=1.645 For 95% C.L. z=1.960 For 99% C.L. z=2.578
€
B = z ∗ˆ p (1− ˆ p )
n
€
x ± tn−1 *sn
d.f. = n - 1 C.L. = 1 - α α = 1 – C.L.
€
α2
=1−C.L.( )2
€
t =x −µ
sn
€
(x − y ) ± z ∗ sx2
n+
sy2
m
€
(x − y ) ± tn +m−2 ∗ sp ∗1n
+1m
d.f. = n + m – 2
€
sp =(n −1)∗ sx
2 + (m −1)∗ sy2
n + m − 2
€
d ± tn−1 ∗sd
n
€
d ± z ∗ sd
n
€
d = Σdn
€
sd =Σd2 − (Σd)2
nn −1
=Σ(d − d )2
n −1
€
ˆ p 1 =xn
ˆ p 2 =ym
€
nˆ p 1 > 5n(1− ˆ p 1) > 5mˆ p 2 > 5m(1− ˆ p 2) > 5
€
( ˆ p 1 − ˆ p 2) ± z ∗ˆ p 1(1− ˆ p 1)
n+
ˆ p 2(1− ˆ p 2)m

Stat211 Practice Exam 3 (Final Exam)
€
z =ˆ p − pp(1− p)
n
€
T =x −µ0
sn
€
Z =x −µ0σn
€
T =d −µd
sd
n
€
T =x − y − (µx −µy )
sp ∗1n
+1m
€
Z ≈ T =(x − y ) − (µx −µy )
sx2
n+
sy2
m
€
Z =( ˆ p 1 − ˆ p 2) − (p1 − p2)
ˆ p (1− ˆ p ) 1n
+1m
€
ˆ p = x + yn + m
€
α = P(TypeI)
€
β = P(TypeII) Ei = npi d.f. = k-1
€
χ 2* =∑ (O− E)2
E
€
E =rowtotal∗columntotal
n
€
Eij =rowi ∗column j
n
d.f. = (r-1)(c-1)
€
χ 2* =∑ (O− E − 0.5)2
E

Stat211 Practice Exam 3 (Final Exam)
1. The average length of workweeks of 15 randomly selected employees in the mining industry and 10 randomly selected employees in the manufacturing industry were obtained. The sample mean and sample deviation for each sample are given in the table below. Sample___________ _Observations________Mean__________Std. Dev. Miners (Sample X) 15 47.5 5.5 Manufacturers (Sample Y) 10 42.5 4.9 A 95 % confidence interval for the difference µx - µy a. goes from 0.78 hours to 9.22 hours b. goes from 1.31 hours to 8.69 hours c. goes from 0.88 hours to 9.12 hours d. goes from 0.55 hours to 9.45 hours e. goes from 0.65 hours to 9.35 hours 2. The average length of workweeks of 15 randomly selected employees in the mining industry and 10 randomly selected employees in the manufacturing industry were obtained. The sample mean and sample deviation for each sample are given in the table below. Sample___________ _Observations________Mean__________Std. Dev. Miners (Sample X) 15 47.5 5.5 Manufacturers (Sample Y) 10 42.5 4.9 A 95 % confidence interval for the difference µx - µy
a. requires that the critical value in the error term comes from a t-distribution with 23 degrees of freedom b. requires that the critical value in the error term comes from a t-distribution with 25 degrees of freedom c. does not require that the pooled standard deviation be computed d. cannot be calculated with the information provided e. none of the above
3. The average length of workweeks of 15 randomly selected employees in the mining industry and 10 randomly selected employees in the manufacturing industry were obtained. The sample mean and sample deviation for each sample are given in the table below. Sample___________ _Observations________Mean__________Std. Dev. Miners (Sample X) 15 47.5 5.5 Manufacturers (Sample Y) 10 42.5 4.9 Suppose that a 95 % confidence interval for the difference µx - µy goes from 0.54 hours to 9.46 hours. We can say that
Stat211 Practice Exam 3 (Final Exam)
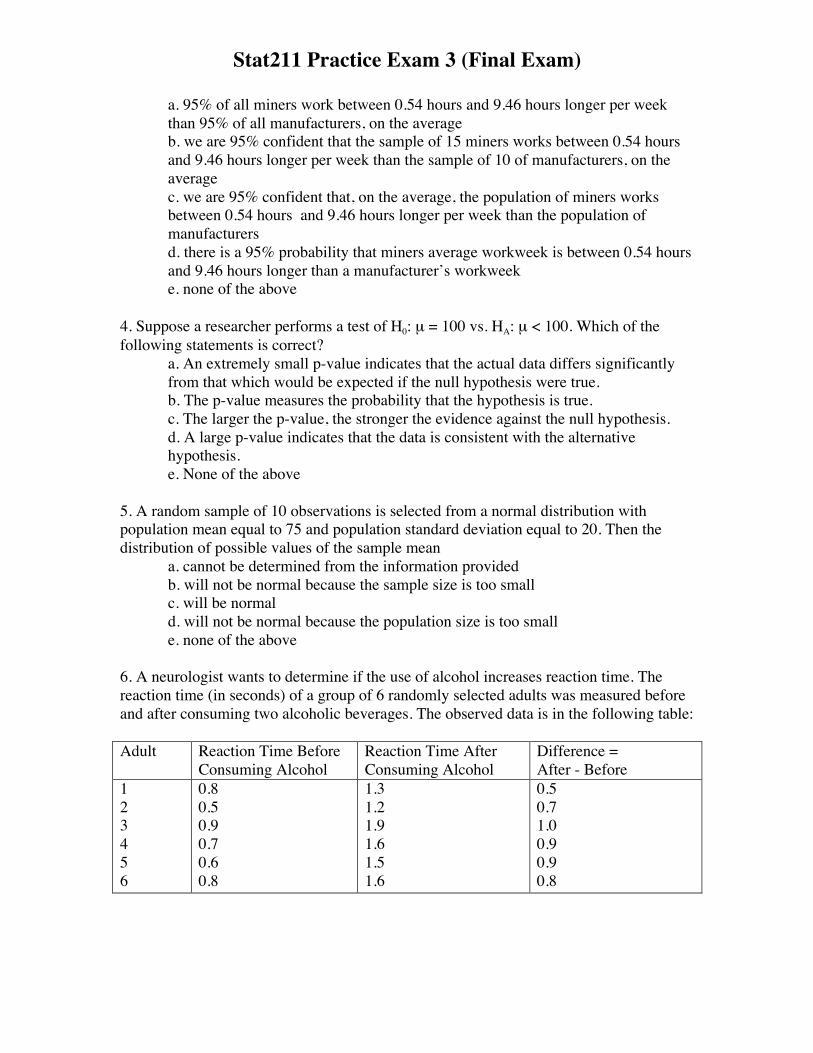
a. 95% of all miners work between 0.54 hours and 9.46 hours longer per week than 95% of all manufacturers, on the average b. we are 95% confident that the sample of 15 miners works between 0.54 hours and 9.46 hours longer per week than the sample of 10 of manufacturers, on the average c. we are 95% confident that, on the average, the population of miners works between 0.54 hours and 9.46 hours longer per week than the population of manufacturers d. there is a 95% probability that miners average workweek is between 0.54 hours and 9.46 hours longer than a manufacturer’s workweek e. none of the above
4. Suppose a researcher performs a test of H0: µ = 100 vs. HA: µ < 100. Which of the following statements is correct?
a. An extremely small p-value indicates that the actual data differs significantly from that which would be expected if the null hypothesis were true. b. The p-value measures the probability that the hypothesis is true. c. The larger the p-value, the stronger the evidence against the null hypothesis. d. A large p-value indicates that the data is consistent with the alternative hypothesis. e. None of the above
5. A random sample of 10 observations is selected from a normal distribution with population mean equal to 75 and population standard deviation equal to 20. Then the distribution of possible values of the sample mean a. cannot be determined from the information provided b. will not be normal because the sample size is too small c. will be normal
d. will not be normal because the population size is too small e. none of the above
6. A neurologist wants to determine if the use of alcohol increases reaction time. The reaction time (in seconds) of a group of 6 randomly selected adults was measured before and after consuming two alcoholic beverages. The observed data is in the following table: Adult Reaction Time Before
Consuming Alcohol Reaction Time After Consuming Alcohol
Difference = After - Before
1 2 3 4 5 6
0.8 0.5 0.9 0.7 0.6 0.8
1.3 1.2 1.9 1.6 1.5 1.6
0.5 0.7 1.0 0.9 0.9 0.8

Stat211 Practice Exam 3 (Final Exam)
The sample mean difference is 0.8 seconds with a sample standard deviation of 0.1789 seconds. The neurologist will perform a test of hypothesis to determine if the consumption of alcohol increases reaction time. The alternate hypothesis would be
a. HA: µx - µy = 0 b. HA: µx - µy < 0 c. HA: µd > 0 d. HA: µd = 0.8 e. HA: µX - µY > 0
7. A neurologist wants to determine if the use of alcohol increases reaction time. The reaction time (in seconds) of a group of 6 randomly selected adults was measured before and after consuming two alcoholic beverages. The observed data is in the following table: Adult Reaction Time Before
Consuming Alcohol Reaction Time After Consuming Alcohol
Difference = After - Before
1 2 3 4 5 6
0.8 0.5 0.9 0.7 0.6 0.8
1.3 1.2 1.9 1.6 1.5 1.6
0.5 0.7 1.0 0.9 0.9 0.8
The sample mean difference is 0.8 seconds with a sample standard deviation of 0.1789 seconds. The neurologist will perform a test of hypothesis to determine if the consumption of alcohol increases reaction time. The value of the test statistic, rounded to the nearest hundredth, is a. – 10.95 b. 10.95 c. – 4.47 d. 4.47 e. cannot be determined with the information provided 8. A neurologist wants to determine if the use of alcohol increases reaction time. The reaction time (in seconds) of a group of 6 randomly selected adults was measured before and after consuming two alcoholic beverages. The observed data is in the following table: Adult Reaction Time Before
Consuming Alcohol Reaction Time After Consuming Alcohol
Difference = After - Before
1 2 3 4 5 6
0.8 0.5 0.9 0.7 0.6 0.8
1.3 1.2 1.9 1.6 1.5 1.6
0.5 0.7 1.0 0.9 0.9 0.8

Stat211 Practice Exam 3 (Final Exam)
The sample mean difference is 0.8 seconds with a sample standard deviation of 0.1789 seconds. The neurologist will perform a test of hypothesis to determine if the consumption of alcohol increases reaction time, using a significance level of α = 0.05. Suppose that p-value of the test statistic is 0.0143. Then the neurologist would a. accept the null hypothesis b. reject the null hypothesis c. fail to reject the null hypothesis d. fail to reject the alternate hypothesis e. none of the above 9. A random sample of 100 voters in a community produced 59 voters in favor of candidate A. The observed value of the test statistic for testing the null hypothesis Ho: p =0.5 versus the alternative hypothesis HA: p>0.5 is:
a. 1.80 b. 1.90 c. 1.83 d. 1.28 e. 1.75
10. An automobile dealer believes that certain colors of cars are more popular than other colors. He randomly selects 60 sales records from the previous year, and records the color of each car sold. The data is displayed in the table below: Color Observed Frequency Red 21 Blue 12 White 13 Black 14 A hypothesis test is performed in order to determine if the data supports the claim of the automobile dealer. The alternate hypothesis would be
a. HA: The color ”blue” has a lower preference than the other colors. b. HA: At least one color is preferred differently than the other colors. c. HA: The color ”red” has a higher preference than the other colors. d. HA: All colors are equally preferred. e. none of the above
11. An automobile dealer believes that certain colors of cars are more popular than other colors. He randomly selects 60 sales records from the previous year, and records the color of each car sold. The data is displayed in the table below: Color Observed Frequency Red 21 Blue 12 White 13 Black 14
Stat211 Practice Exam 3 (Final Exam)
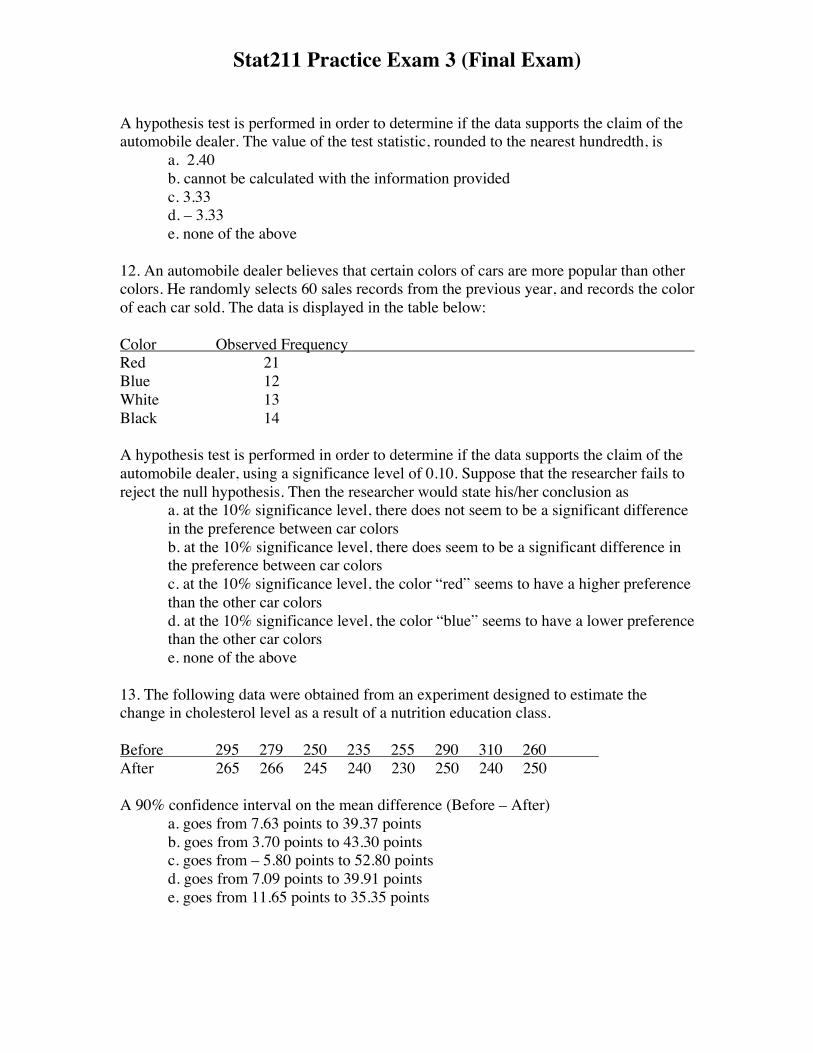
A hypothesis test is performed in order to determine if the data supports the claim of the automobile dealer. The value of the test statistic, rounded to the nearest hundredth, is
a. 2.40 b. cannot be calculated with the information provided c. 3.33 d. – 3.33 e. none of the above
12. An automobile dealer believes that certain colors of cars are more popular than other colors. He randomly selects 60 sales records from the previous year, and records the color of each car sold. The data is displayed in the table below: Color Observed Frequency Red 21 Blue 12 White 13 Black 14 A hypothesis test is performed in order to determine if the data supports the claim of the automobile dealer, using a significance level of 0.10. Suppose that the researcher fails to reject the null hypothesis. Then the researcher would state his/her conclusion as
a. at the 10% significance level, there does not seem to be a significant difference in the preference between car colors b. at the 10% significance level, there does seem to be a significant difference in the preference between car colors c. at the 10% significance level, the color “red” seems to have a higher preference than the other car colors d. at the 10% significance level, the color “blue” seems to have a lower preference than the other car colors
e. none of the above 13. The following data were obtained from an experiment designed to estimate the change in cholesterol level as a result of a nutrition education class. Before 295 279 250 235 255 290 310 260 After 265 266 245 240 230 250 240 250 A 90% confidence interval on the mean difference (Before – After) a. goes from 7.63 points to 39.37 points b. goes from 3.70 points to 43.30 points c. goes from – 5.80 points to 52.80 points d. goes from 7.09 points to 39.91 points e. goes from 11.65 points to 35.35 points

Stat211 Practice Exam 3 (Final Exam)
14. The following data were obtained from an experiment designed to estimate the change in cholesterol level as a result of a nutrition education class. Before 295 279 250 235 255 290 310 260 After 265 266 245 240 230 250 240 250 Suppose that a 90% confidence interval on the mean difference (Before – After) goes from 11.65 points to 35.35 points. The appropriate interpretation is that
a. 90% of all students of this nutrition class exhibit a reduction in cholesterol level between 11.65 points and 35.35 points b. we are 90% confident that the sample of 8 students in the nutrition class exhibit a reduction in cholesterol level between 11.65 points and 35.35 points, on the average c. we are 90% confident that the “average” reduction in cholesterol level, as a result of the nutrition class, is between 11.65 points and 35.35 points d. there is a 90% probability “average” reduction in cholesterol level, as a result of the nutrition class, is between 11.65 points and 35.35 points e. 90% of all students of this nutrition class exhibit an increase in cholesterol level between 11.65 points and 35.35 points
15. The following are grams of fat found in 5 scoops of each of two brands of ice cream: A 5.7 4.5 6.2 6.3 7.3 B 6.3 5.7 5.9 6.4 5.1 Which of the following procedures is appropriate to test the hypothesis of equal average fat content in the two types of ice cream?
a. Paired T-test with 5 d.f. b. Two sample T-test with 8 d.f. c. Paired T-test with 4 d.f. d. Two sample T-test with 9 d.f. e. none of the above
16. A manufacturer of automobile tires believes that a new rubber compound will increase the safety of the tires. A quality assurance specialist must decide between the null hypothesis “The new rubber compound has no beneficial effects on tire safety“ and the alternate hypothesis “The new rubber compound increases tire safety.” A type I error would be
a. the quality assurance specialist decides that the new rubber compound has no beneficial effects on tire safety, when it actually does not have any beneficial effects b. the quality assurance specialist decides that the new rubber compound does increase tire safety, when it actually does not have any beneficial effects c. the quality assurance specialist decides that the new rubber compound has no beneficial effects on tire safety, when it actually does increase tire safety

Stat211 Practice Exam 3 (Final Exam)
d. the quality assurance specialist decides that the new rubber compound has beneficial effects on tire safety, when it actually does increase tire safety e. none of the above
17. A manufacturer of automobile tires believes that a new rubber compound will increase the safety of the tires. A quality assurance specialist must decide between the null hypothesis “The new rubber compound has no beneficial effects on tire safety“ and the alternate hypothesis “The new rubber compound increases tire safety.” A type II error would occur if
a. the quality assurance specialist decides that the new rubber compound has no beneficial effects on tire safety, when it actually does not have any beneficial effects b. the quality assurance specialist decides that the new rubber compound does increase tire safety, when it actually does not have any beneficial effects c. the quality assurance specialist decides that the new rubber compound has no beneficial effects on tire safety, when it actually does increase tire safety d. the quality assurance specialist decides that the new rubber compound has beneficial effects on tire safety, when it actually does increase tire safety e. none of the above
18. A vice president at a bank states that customers obtain service within an average time of 4.9 minutes of arriving at the bank’s drive-up service window. However a long-time customer of the bank wants to test the hypothesis that the average time to obtain service exceeds 4.9 minutes. The customer collects data from 16 randomly selected customers, and calculates the average time to obtain service. The sample mean time is 5.3 minutes and the sample standard deviation is 1.2 minutes. The alternate hypothesis would be
a. HA: µ > 5.3 b. HA: µ < 4.9 c. HA: µ ≠ 4.9 d. HA: µ = 5.3 e. HA: µ > 4.9
19. A vice president at a bank states that customers obtain service within an average time of 4.9 minutes of arriving at the bank’s drive-up service window. However a long-time customer of the bank wants to test the hypothesis that the average time to obtain service exceeds 4.9 minutes. The customer collects data from 16 randomly selected customers, and calculates the average time to obtain service. The sample mean time is 5.3 minutes and the sample standard deviation is 1.2 minutes. The value of the test statistic, rounded to the nearest hundredth, is a. – 5.33 b. 5.33 c. – 1.33 d. 1.33 e. cannot be determined with the information provided

Stat211 Practice Exam 3 (Final Exam)
20. A vice president at a bank states that customers obtain service within an average time of 4.9 minutes of arriving at the bank’s drive-up service window. However a long-time customer of the bank wants to test the hypothesis that the average time to obtain service exceeds 4.9 minutes. The customer collects data from 16 randomly selected customers, and calculates the average time to obtain service. The sample mean time is 5.3 minutes and the sample standard deviation is 1.2 minutes. Suppose that the value of the test statistic is 1.46. Then the p-value of the test statistic is a. 0.9279 b. 0.0721 c. between 0.05 and 0.10 d. cannot be determined with the information provided e. none of the above 21. A vice president at a bank states that customers obtain service within an average time of 4.9 minutes of arriving at the bank’s drive-up service window. However a long-time customer of the bank wants to test the hypothesis that the average time to obtain service exceeds 4.9 minutes, using a significance level of α = 0.01. The customer collects data from 16 randomly selected customers, and calculates the average time to obtain service. The sample mean time is 5.3 minutes and the sample standard deviation is 1.2 minutes. If the researcher decides to reject the null hypothesis, the researcher would conclude that
a. at the 1% significance level, the average waiting time for these 16 bank customers to receive service does not exceed 4.9 minutes b. at the 1% significance level, the average waiting time for these 16 bank customers to receive service does exceed 4.9 minutes c. at the 1% significance level, the average waiting time for all of the bank customers to receive service does not exceed 4.9 minutes d. at the 1% significance level, the average waiting time for all of the bank customers to receive service does exceed 4.9 minutes
e. none of the above 22. Scores on the math section of a college entrance exam are normally distributed with a mean µ= 22.4 and standard deviation σ=3.1. Find the probability that a randomly selected test-taker will score 25 or less on the math section of this exam. a. 0.7995 b. 0.2005 c. 0.8387 d. 0.1613 e. none of the above 23. Each person in a random sample of 200 voters was asked his/her opinion about the governor’s proposed legislation and where the voter lives. The data is given in the following table:

Stat211 Practice Exam 3 (Final Exam)
Opinion of Governor’s Proposed Legislation Row Total Favor Oppose Urban 70 20 Rural 50 60
Location
Column Total A researcher wants to perform a hypothesis test in order to determine if the voter’s location and his/her opinion are independent, using a significance level of 0.05.The expected value for the upper left cell (E11) is
a. 50 b. 54 c. 70 d. 66 e. none of the above
24. Each person in a random sample of 200 voters was asked his/her opinion about the governor’s proposed legislation and where the voter lives. The data is given in the following table: Opinion of Governor’s Proposed Legislation Row Total
Favor Oppose Urban 70 20 Rural 50 60
Location
Column Total A researcher wants to perform a hypothesis test in order to determine if the voter’s location and his/her opinion are independent, using a significance level of 0.05. The number of degrees of freedom is
a. 200 b. 199 c. 3 d. 4 e. 1
25. Each person in a random sample of 200 voters was asked his/her opinion about the governor’s proposed legislation and where the voter lives. The data is given in the following table: Opinion of Governor’s Proposed Legislation Row Total
Favor Oppose Urban 70 20 Rural 50 60
Location
Column Total A researcher wants to perform a hypothesis test in order to determine if the voter’s location and his/her opinion are independent, using a significance level of 0.05. Suppose

Stat211 Practice Exam 3 (Final Exam)
that the researcher fails to reject the null hypothesis. Then the researcher would state his/her conclusion as
a. at the 5% significance level, voter location and voter opinion are independent of each other b. at the 5% significance level, voter location and voter opinion are not independent of each other c. at the 5% significance level, rural voters tend to oppose the governors proposed legislation d. at the 5% significance level, urban voters tend to favor the governors proposed legislation
e. none of the above 26. Twenty-eight percent of college freshmen do not return to college for their sophomore year of study. A random sample of 12 college freshmen is obtained. The probability that exactly two of the 12 freshmen will not return for their sophomore year is a. 0.0784 b. 0.0152 c. 0.2528 d. 0.1937 e. none of the above 27. The GPAs of 31 randomly selected fraternity members and 36 randomly selected non-fraternity students were obtained from the student body. The sample mean and sample deviation for each sample are given in the table below. Sample___________ _ Observations________Mean__________Std. Dev. Fraternity Members (Sample X) 31 2.03 0.68 Non-Fraternity Students (Sample Y) 36 2.31 0.79 To determine if there is a difference between the average GPA of fraternity members and the average GPA of non-fraternity students, which set of hypotheses would be appropriate? a. H0: µx - µy = 0
HA: µx - µy < 0 b. H0: µd = 0 HA: µd ≠ 0 c. H0: µx - µy = 0 HA: µx - µy > 0 d. H0: µx - µy = 0 HA: µx - µy ≠ 0 e. none of the above
28. The GPAs of 31 randomly selected fraternity members and 36 randomly selected non-fraternity students were obtained from the student body. The sample mean and sample deviation for each sample are given in the table below.

Stat211 Practice Exam 3 (Final Exam)
Sample___________ _ Observations________Mean__________Std. Dev. Fraternity Members (Sample X) 31 2.03 0.68 Non-Fraternity Students (Sample Y) 36 2.31 0.79 The researcher wants to determine if there is a difference between the average GPA of fraternity members and the average GPA of non-fraternity students. Suppose that the value of the test statistic, rounded to the nearest hundredth, is 1.56. The p-value of the test statistic is
a. 0.0594 b. 0.1188 c. between 0.05 and 0.10 d. 0.9406 e. cannot be determined from the information provided
29. The GPAs of 31 randomly selected fraternity members and 36 randomly selected non-fraternity students were obtained from the student body. The sample mean and sample deviation for each sample are given in the table below. Sample___________ _ Observations________Mean__________Std. Dev. Fraternity Members (Sample X) 31 2.03 0.68 Non-Fraternity Students (Sample Y) 36 2.31 0.79 The researcher wants to determine if there is a difference between the average GPA of fraternity members and the average GPA of non-fraternity students, using a significance level of α=0.05. Suppose that the researcher decided to reject the null hypothesis. Then the researcher would state his/her conclusion as
a. at the 5% significance level, there does not seem to be a significant difference between the average GPA of fraternity members and the average GPA of non-fraternity students b. at the 5% significance level, there does seem to be a significant difference between the average GPA of fraternity members and the average GPA of non-fraternity students c. at the 5% significance level, the average GPA of fraternity members seems to be significantly higher than the average GPA of non-fraternity students d. at the 5% significance level, the average GPA of fraternity members seems to be significantly lower than the average GPA of non-fraternity students
e. none of the above 30. In a test of hypothesis, the alternate hypothesis
a. is sometimes called the research hypothesis b. is sometimes called the non-research hypothesis
c. is sometimes called the null hypothesis d. parts b) and c) only e. none of the above 31. An event

Stat211 Practice Exam 3 (Final Exam)
a. may consist of a single trial or a series of trials b. is a set of outcomes with some common characteristic c. is a subset of the sample space d. parts b) and c) only e. none of the above 32. The Council on Drug Abuse states that approximately 40% of college students have used at least one illegal drug. However, a sociology professor at ABC University wants to show that the percentage of students at ABC University who have used at least one illegal drug is less than 40%. In a random sample of 100 students, 47 state that they have used at least one illegal drug. A hypothesis test is performed in order to determine if the data supports the claim of the sociology professor. The alternate hypothesis would be
a. HA: p = 0.47 b. HA: p < 0.40 c. HA: p ≠ 0.40 d. HA: µ > 0.40 e. HA: p < 0.47
33. The Council on Drug Abuse states that approximately 40% of college students have used at least one illegal drug. However, a sociology professor at ABC University wants to show that the percentage of students at ABC University who have used at least one illegal drug is less than 40%. In a random sample of 100 students, 47 state that they have used at least one illegal drug. A hypothesis test is performed in order to determine if the data supports the claim of the sociology professor. Suppose that the value of the test statistic is 1.32. Then the p-value of the test statistic is
a. 0.9066 b. 0.0943 c. 0.1886 d. 1.8132 e. 0.9032
34. The Council on Drug Abuse states that approximately 40% of college students have used at least one illegal drug. However, a sociology professor at ABC University wants to show that the percentage of students at ABC University who have used at least one illegal drug is less than 40%. In a random sample of 100 students, 47 state that they have used at least one illegal drug. A hypothesis test is performed in order to determine if the data supports the claim of the sociology professor, using a significance level of 0.10. If the researcher decides not to reject the null hypothesis, the researcher would conclude that
a. at the 10% significance level, more than 40% of students at ABC University have used at least one illegal drug. b. at the 10% significance level, less than 40% of students at ABC University have used at least one illegal drug. c. at the 10% significance level, approximately 40% of students at ABC University have not used any illegal drug. d. at the 10% significance level, approximately 40% of students at ABC University have used at least one illegal drug.
Stat211 Practice Exam 3 (Final Exam)
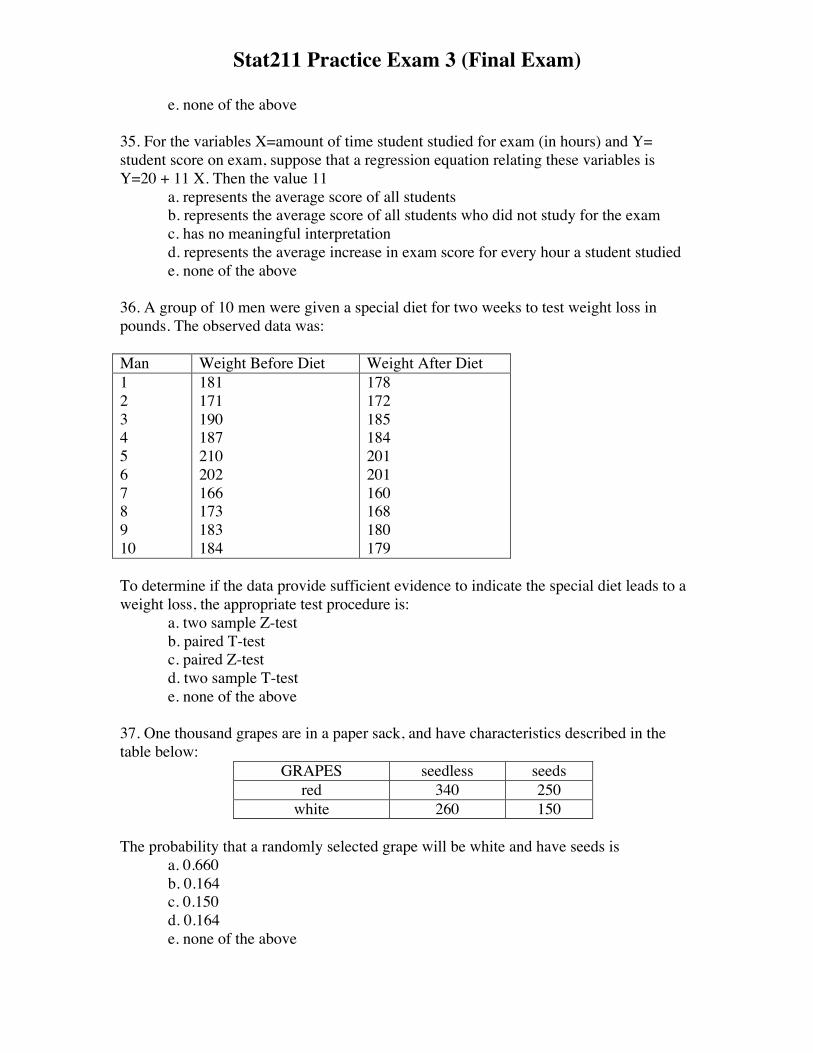
e. none of the above 35. For the variables X=amount of time student studied for exam (in hours) and Y= student score on exam, suppose that a regression equation relating these variables is Y=20 + 11 X. Then the value 11 a. represents the average score of all students
b. represents the average score of all students who did not study for the exam c. has no meaningful interpretation d. represents the average increase in exam score for every hour a student studied
e. none of the above 36. A group of 10 men were given a special diet for two weeks to test weight loss in pounds. The observed data was: Man Weight Before Diet Weight After Diet 1 2 3 4 5 6 7 8 9 10
181 171 190 187 210 202 166 173 183 184
178 172 185 184 201 201 160 168 180 179
To determine if the data provide sufficient evidence to indicate the special diet leads to a weight loss, the appropriate test procedure is:
a. two sample Z-test b. paired T-test c. paired Z-test d. two sample T-test e. none of the above
37. One thousand grapes are in a paper sack, and have characteristics described in the table below:
GRAPES seedless seeds red 340 250
white 260 150 The probability that a randomly selected grape will be white and have seeds is a. 0.660 b. 0.164 c. 0.150 d. 0.164 e. none of the above

Stat211 Practice Exam 3 (Final Exam)
38. A researcher performed a hypothesis test in which she tested the null hypothesis H0: µ = 123 against the alternate hypothesis HA: µ ≠ 123, using a 10% significance level. The researcher decided not to reject the null hypothesis. Suppose the researcher constructs a 90% confidence interval on µ. The 90% confidence interval a. would contain the value 123 b. would not contain the value 123 c. cannot be constructed after the researcher has performed a hypothesis test.
d. there is insufficient information to say anything about the 90% confidence interval
e. none of the above 39. The sampling distribution of the sample mean
a. describes the distribution of the possible values that the sample mean may have, for a sample of size n.
b. describes the exact value of the sample mean for a sample of size n. c. describes the exact value of the population mean for a sample of size n. d. describes the value of the sample standard deviation for a sample of size n. e. none of the above 40. For a specific sample consisting of n observations, the width of a 90% confidence interval on µ a. would be larger than the width of a 95% confidence interval on µ. b. would be smaller than the width of a 95% confidence interval on µ. c. would be the same as the width of a 95% confidence interval on µ. d. cannot be compared to the width of a 95% confidence interval on µ. e. none of the above