Stat 217 – Day 18 t-procedures (Topics 19 and 20).
15
Stat 217 – Day 18 t-procedures (Topics 19 and 20)
-
date post
20-Dec-2015 -
Category
Documents
-
view
215 -
download
0
Transcript of Stat 217 – Day 18 t-procedures (Topics 19 and 20).

Stat 217 – Day 18t-procedures (Topics 19 and 20)

Last Time – Sampling Distn for Mean Penny ages Population
Sample (n = 30)
Sampling distribution
Change Population
Sample (n = 30)
Sampling distribution
Obs unit = sampleVariable = sample mean

Last Time – Distribution of x-barCentral Limit Theorem for Sample Mean (p. 282)1. Sampling distribution is (approximately) normal
2. Sampling distribution mean equals population mean
3. Sampling distribution standard deviation equals /n
Technical conditions1. Random sample2. Either large sample (n>30) or normal population (be told or look at sample)
Activity 15-5 (p. 300)
Ethan Allen October 5, 2005
Are several explanations, could excess passenger weight be one?
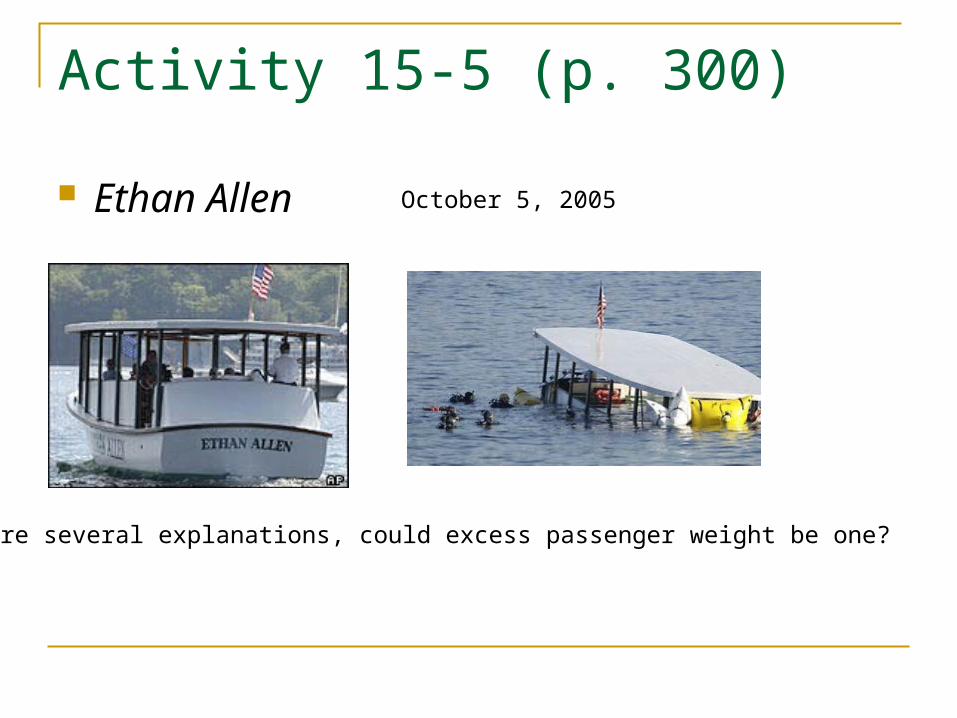
Activity 15-5 (p. 300)
The boat can hold a total of 7500 lbs (or an average of 159.57 lbs over 47 passengers)
CDC: weights of adult Americans have a mean of 167 lbs and SD 35 lbs. What’s the probability the average weight of 47 passengers will exceed 159.57 lbs?

Activity 15-5
What’s the probability the average weight of 47 passengers will exceed 159.57 lbs?
n > 30 so we can apply the CLT1. Shape is approximately normal2. mean will equal 167 lbs3. standard deviation = 35/47 = 5.105 lbsZ = (159.57-167)/5.105 = -1.46Above: .927293% chance of an overweight boat!

One small problem
We don’t usually know the population standard deviation

Informally
A conjecture for the value of is not plausible if it falls more than 2 SD = 2 /n from the observed sample mean ( ) Standardize:
Small problem: don’t know either!
Easy solution?
n
x
devstd
meannobservatio
/
ns
x
devstd
meannobservatio
/
“standard error”
x

Demo
Suppose we have a population with mean = 10 and standard deviation = 5. What does the sampling distribution of samples of size n=5 look like?

Demo, cont.
What really matters is the distribution of the standardized values
But what happens if we use s instead of ?
n
x
devstd
meannobservatio
/
ns
x
devstd
meannobservatio
/

t distribution (p. 376)
The “t distribution” is symmetric and mound-shaped like the normal distribution but has “heavier” tails Models the extra
variation we have with the additional estimation of by s
t distribution

t distribution (p. 376)
A family of distributions, characterized by “degrees of freedom” (df) df = n – 1 As df increases, the
heaviness of the tails decreases and the t distribution looks more and more like the normal distribution Less penalty for estimating
with s
Activity 20-1 (p. 394)

Two Central Limit Theorems (p. 295) Categorical (p-hat)
Mean = SD = (1- )/n Shape = approx normal
if n > 10 and n(1- ) > 10
Random sample
Quantitative (x-bar) Mean = SD = /n Shape = normal
if population normal or approximately normal if n > 30
Random sample

To turn in, with partner Activity 20-1 (m) (n) (o) Handout (f) and (g)
For Wednesday HW 5 Activities 19-6, 20-3, 20-4 Be working on Lab 6