Starspots: A Key to the Stellar Dynamo - Springer
62
Living Rev. Solar Phys., 2, (2005), 8 http://www.livingreviews.org/lrsp-2005-8 Starspots: A Key to the Stellar Dynamo Svetlana V. Berdyugina Institute of Astronomy ETHZ ETH Zentrum, 8092 Zurich, Switzerland email: [email protected] http://www.astro.phys.ethz.ch/staff/berdyugina/ Accepted on 15 August 2005 Published on 13 December 2005 Living Reviews in Solar Physics Published by the Max Planck Institute for Solar System Research Max-Planck-Str. 2, 37191 Katlenburg-Lindau, Germany ISSN 1614-4961 Abstract Magnetic activity similar to that of the Sun is observed on a variety of cool stars with ex- ternal convection envelopes. Stellar rotation coupled with convective motions generate strong magnetic fields in the stellar interior and produce a multitude of magnetic phenomena includ- ing starspots in the photosphere, chromospheric plages, coronal loops, UV, X-ray, and radio emission and flares. Here I review the phenomenon of starspots on different types of cool stars, observational tools and diagnostic techniques for studying starspots as well as starspot prop- erties including their temperatures, areas, magnetic field strengths, lifetimes, active latitudes and longitudes, etc. Evolution of starspots on various time scales allows us to investigate stel- lar differential rotation, activity cycles, and global magnetic fields. Together these constitute the basis for our understanding of stellar and solar dynamos and provide valuable constraints for theoretical models. c Max Planck Society and the authors. Further information on copyright is given at http://solarphysics.livingreviews.org/About/copyright.html For permission to reproduce the article please contact [email protected].
Transcript of Starspots: A Key to the Stellar Dynamo - Springer
Living Rev. Solar Phys., 2, (2005), 8http://www.livingreviews.org/lrsp-2005-8
Starspots: A Key to the Stellar Dynamo
Svetlana V. BerdyuginaInstitute of Astronomy ETHZETH Zentrum, 8092 Zurich,
Switzerlandemail: [email protected]
http://www.astro.phys.ethz.ch/staff/berdyugina/
Accepted on 15 August 2005Published on 13 December 2005
Living Reviews in Solar PhysicsPublished by the
Max Planck Institute for Solar System ResearchMax-Planck-Str. 2, 37191 Katlenburg-Lindau, Germany
ISSN 1614-4961
Abstract
Magnetic activity similar to that of the Sun is observed on a variety of cool stars with ex-ternal convection envelopes. Stellar rotation coupled with convective motions generate strongmagnetic fields in the stellar interior and produce a multitude of magnetic phenomena includ-ing starspots in the photosphere, chromospheric plages, coronal loops, UV, X-ray, and radioemission and flares. Here I review the phenomenon of starspots on different types of cool stars,observational tools and diagnostic techniques for studying starspots as well as starspot prop-erties including their temperatures, areas, magnetic field strengths, lifetimes, active latitudesand longitudes, etc. Evolution of starspots on various time scales allows us to investigate stel-lar differential rotation, activity cycles, and global magnetic fields. Together these constitutethe basis for our understanding of stellar and solar dynamos and provide valuable constraintsfor theoretical models.
c© Max Planck Society and the authors.Further information on copyright is given at
http://solarphysics.livingreviews.org/About/copyright.htmlFor permission to reproduce the article please contact [email protected].
How to cite this article
Owing to the fact that a Living Reviews article can evolve over time, we recommend to cite thearticle as follows:
Svetlana V. Berdyugina,“Starspots: A Key to the Stellar Dynamo”,
Living Rev. Solar Phys., 2, (2005), 8. [Online Article]: cited [<date>],http://www.livingreviews.org/lrsp-2005-8
The date given as <date> then uniquely identifies the version of the article you are referring to.
Article Revisions
Living Reviews supports two different ways to keep its articles up-to-date:
Fast-track revision A fast-track revision provides the author with the opportunity to add shortnotices of current research results, trends and developments, or important publications tothe article. A fast-track revision is refereed by the responsible subject editor. If an articlehas undergone a fast-track revision, a summary of changes will be listed here.
Major update A major update will include substantial changes and additions and is subject tofull external refereeing. It is published with a new publication number.
For detailed documentation of an article’s evolution, please refer always to the history documentof the article’s online version at http://www.livingreviews.org/lrsp-2005-8.
Contents
1 Introduction 5
2 The Phenomenon of Stellar Activity 72.1 Red dwarfs and BY Dra phenomenon . . . . . . . . . . . . . . . . . . . . . . . . . 72.2 Solar-type stars . . . . . . . . . . . . . . . . . . . . . . . . . . . . . . . . . . . . . . 72.3 T Tauri stars . . . . . . . . . . . . . . . . . . . . . . . . . . . . . . . . . . . . . . . 82.4 RS CVn stars . . . . . . . . . . . . . . . . . . . . . . . . . . . . . . . . . . . . . . . 82.5 FK Com stars . . . . . . . . . . . . . . . . . . . . . . . . . . . . . . . . . . . . . . . 92.6 W UMa stars . . . . . . . . . . . . . . . . . . . . . . . . . . . . . . . . . . . . . . . 92.7 Algols . . . . . . . . . . . . . . . . . . . . . . . . . . . . . . . . . . . . . . . . . . . 102.8 Degenerate stars . . . . . . . . . . . . . . . . . . . . . . . . . . . . . . . . . . . . . 10
3 Observational Tools for Studying Starspots 113.1 Photometry . . . . . . . . . . . . . . . . . . . . . . . . . . . . . . . . . . . . . . . . 113.2 Spectroscopy . . . . . . . . . . . . . . . . . . . . . . . . . . . . . . . . . . . . . . . 113.3 Polarimetry . . . . . . . . . . . . . . . . . . . . . . . . . . . . . . . . . . . . . . . . 123.4 Interferometry . . . . . . . . . . . . . . . . . . . . . . . . . . . . . . . . . . . . . . 133.5 Microlensing . . . . . . . . . . . . . . . . . . . . . . . . . . . . . . . . . . . . . . . 13
4 Diagnostic Techniques for Studying Starspots 164.1 Light-curve modelling . . . . . . . . . . . . . . . . . . . . . . . . . . . . . . . . . . 164.2 Doppler Imaging . . . . . . . . . . . . . . . . . . . . . . . . . . . . . . . . . . . . . 164.3 Zeeman–Doppler Imaging . . . . . . . . . . . . . . . . . . . . . . . . . . . . . . . . 204.4 Molecular bands modelling . . . . . . . . . . . . . . . . . . . . . . . . . . . . . . . 224.5 Line depth ratios . . . . . . . . . . . . . . . . . . . . . . . . . . . . . . . . . . . . . 234.6 Asteroseismology . . . . . . . . . . . . . . . . . . . . . . . . . . . . . . . . . . . . . 24
5 Starspot Properties 265.1 Temperature and filling factor . . . . . . . . . . . . . . . . . . . . . . . . . . . . . . 265.2 Magnetic field . . . . . . . . . . . . . . . . . . . . . . . . . . . . . . . . . . . . . . . 275.3 Lifetimes . . . . . . . . . . . . . . . . . . . . . . . . . . . . . . . . . . . . . . . . . 305.4 Active longitudes . . . . . . . . . . . . . . . . . . . . . . . . . . . . . . . . . . . . . 305.5 Differential rotation . . . . . . . . . . . . . . . . . . . . . . . . . . . . . . . . . . . 315.6 Latitudes and butterfly diagrams . . . . . . . . . . . . . . . . . . . . . . . . . . . . 33
6 Starspot Evolution and Stellar Activity Cycles 366.1 Overall activity variations . . . . . . . . . . . . . . . . . . . . . . . . . . . . . . . . 366.2 Flip-flop cycles . . . . . . . . . . . . . . . . . . . . . . . . . . . . . . . . . . . . . . 386.3 Orbital period modulation . . . . . . . . . . . . . . . . . . . . . . . . . . . . . . . . 39
7 Theoretical Models 407.1 Dynamo models . . . . . . . . . . . . . . . . . . . . . . . . . . . . . . . . . . . . . . 407.2 Flux-tube models . . . . . . . . . . . . . . . . . . . . . . . . . . . . . . . . . . . . . 41
8 Summary 43
9 Additional Tables 45
References 62

Starspots: A Key to the Stellar Dynamo 5
1 Introduction
The multitude of activity phenomena on the Sun are related to magnetic fields which are generatedby cyclonic turbulence in the outer convection zone and penetrate the solar atmosphere formingsunspots, plages, network, etc. They further expand into the outer atmosphere and exhibit them-selves as highly dynamic coronal loops. Thus, a detailed study of solar activity phenomena revealsthe structure of underlying magnetic fields and provides valuable constraints for solar dynamotheory. These same activity phenomena are observed on cool stars with outer convection zones.
Studying magnetic activity on stars other than the Sun provides an opportunity for detailedtests of solar dynamo models. Using only solar observations limits the range of the global stellarparameters for such tests, while an extensive sample of stars of various activity levels provides keyconstraints for stellar and solar dynamo theory.
Stellar activity similar to that of the Sun was first discovered on red dwarfs, a fraction of whichexhibit remarkable magnetic activity registered through observations of extremely strong opticalflares (UV Cet-type stars). Periodic brightness variations were observed in binary systems of reddwarfs (BY Dra-type) as distortions of the light curves outside eclipses. Kron (1947) was seeminglythe first who considered the hypothesis that spottedness of the stellar surface was causing thesedistortions. Later, light-curve variations due to starspots and other magnetic phenomena werediscovered on various types of stars.
It was suggested by Skumanich (1972) that rotation plays a crucial role in the generationof stellar activity. This became evident later from the strong correlation of magnetic activityindicators with stellar rotational velocities and periods. Such relations have been reported betweenrotation and coronal emission (Pallavicini et al., 1981; Walter and Bowyer, 1981), chromosphericCa II and Hα emission (Vaughan et al., 1981; Middelkoop, 1981; Mekkaden, 1985), ultraviolet linefluxes (Vilhu, 1984; Simon and Fekel, 1987), and radio emission (Drake et al., 1989). It was foundthat cool stars with more rapid rotation show a higher level of magnetic activity. Such activestars are the best choice for testing and developing stellar dynamo theory. Among single starsthese are pre-main-sequence stars (T Tau-type) and early-age main-sequence stars of solar type.Evolved binary components which are tidally locked at fast rotation by a close companion are alsostrongly magnetically active (RS CVn-type, BY Dra-type, W UMa-type, and Algol-like systems).Rapidly rotating single giants of FK Com-type, which are probably formed from coalesced binariescomplete the selection of magnetically active stars. An overview of magnetic phenomena on suchstars is given in Section 2.
Significant progress in observational tools and diagnostic techniques for studying starspots overthe last two decades has advanced our understanding of the nature of stellar activity. Long-termtraditional photometric observations reveal active region evolution and stellar activity cycles. High-resolution spectroscopy allows for studies of the structure of active regions and stellar differentialrotation with the help of the Doppler imaging technique (Vogt et al., 1987; Rice et al., 1989;Piskunov et al., 1990; Collier Cameron, 1992; Jankov and Foing, 1992; Berdyugina, 1998; Riceand Strassmeier, 2000). Observations of molecular lines provide a unique opportunity for insightinto spatially unresolved starspots (Berdyugina, 2002) and unambiguous measurements of starspottemperature (O’Neal et al., 1996). Spectropolarimetry reveals the distribution of magnetic fieldson the stellar surface thanks to the Zeeman–Doppler imaging technique (Donati et al., 1997). Novelapplications of (spectro-)interferometry, microlensing, asteroseismology, etc., broaden the arsenalof tools and techniques for studying starspots. These are reviewed in Sections 3 and 4.
Since the discovery of rotationally modulated brightness variations due to starspots, a largeamount of data has been collected for different types of stars. Brightness and colour variationsallow for determining temperature of starspots and their relative area. Doppler images revealspot distribution which is different from that observed on the Sun. Polarimetric measurements ofstarspots help to investigate the nature of the underlying magnetic fields. Starspot properties, in-
Living Reviews in Solar Physicshttp://www.livingreviews.org/lrsp-2005-8
6 Svetlana V. Berdyugina
cluding their temperature, sizes, magnetic field strengths, lifetimes, and distribution over latitudesand longitudes are reviewed in Section 5.
Time-series observations over decades reveal stellar cycles similar to the 11-year sunspot cycle.On the other hand, persistent active longitudes and a new type of stellar cycle related to them(flip-flop cycle) have been first discovered on cool stars and later on the Sun (Berdyugina andTuominen, 1998; Berdyugina and Usoskin, 2003). In binaries, orbital period variations suggestlong-term changes of the magnetic field distribution in stellar interiors (Hall, 1991b; Rodono et al.,1995; Lanza et al., 1998a). Such observations provide valuable constraints for stellar and solardynamo models. An overview of stellar activity cycles and their implications for dynamo theoryis given in Sections 6 and 7.
Previous short reviews on starspots and their role in understanding the stellar dynamo weregiven by Hall (1991a), Lanza and Rodono (1999a), Berdyugina (2004) and Strassmeier (2005).Also, starspots were thoroughly discussed at the international workshop “Surface Inhomogeneitieson Late-Type Stars” (1990, Armagh), IAU Symposium 175 “Stellar Surface Structures” (1995,Vienna) and the First Potsdam Thinkshop “Sunspots and Starspots” (2002, Potsdam). The presentreview covers main tendencies in starspot research for the last two decades.
Living Reviews in Solar Physicshttp://www.livingreviews.org/lrsp-2005-8
Starspots: A Key to the Stellar Dynamo 7
2 The Phenomenon of Stellar Activity
2.1 Red dwarfs and BY Dra phenomenon
Red dwarfs are main-sequence stars with the mass range from 0.08M to 0.5M. The lower masslimit is the critical mass for hydrogen burning in the central cores of stars with solar abundances,while the upper limit corresponds to the spectral class M0. The radii of the red dwarfs span from0.2R to about 0.6R while their effective temperatures are in the range of 2500 K – 4000 K.Thus, red dwarf stars are cooler, smaller, and less massive than the Sun. Correspondingly theirluminosities range from 0.1% to about 8% of the solar luminosity. They constitute, at least, 80%of the stellar population in the Galaxy.
Remarkable magnetic activity expressed in extremely strong optical flares was first recordedon UV Cet type stars, while periodic brightness variations were observed in binary systems of reddwarfs as distortions of light curves outside eclipses. Kron (1947, 1952) suggested that they are largespots on the stellar surface that cause these distortions. Subsequent observations by Chugainov(1966, 1971) confirmed this hypothesis. Chugainov also showed that spots are much cooler thanthe undisturbed photosphere and can cover up to 10% of the stellar surface. A spot model forlight curve variations developed by Bopp and Evans (1973) supported the previous findings. Thisappeared to be extraordinary compared to the Sun. The star with such spottedness, BY Dra,became a prototype of a group of stars exhibiting similar behaviour. Also, this type of variabilityis often called the BY Dra phenomenon. It is common among binaries with G–K dwarfs as well.
A typical light curve of such a star has a near-sinusoidal shape with an amplitude about 0.1 mag.In addition to the starspot activity, these stars possess powerful chromospheres and coronae, whoseactivity is exhibited in strong UV, X-ray, and radio emissions and flares.
2.2 Solar-type stars
Stars on the lower main-sequence are known to show chromospheric activity similar to that onthe Sun which is detected, e.g., in the Ca II H & K emission (Wilson, 1978). Shortly after thevariability of the Sun in the visual continuum (total irradiance) was established during the SolarMaximum Mission (Willson et al., 1981), evidence for continuum variability among single solar-type stars was also revealed (Radick et al., 1982, 1983a,b). The solar variations, which never exceeda few tenths of a percent, are clearly associated with the disk passage of sunspots and result froma blockage of radiant flux (e.g., Frohlich, 2002). The amplitude of the stellar variability can beas large as several percent in some cases. It appears to be analogous to the solar phenomenonand is caused by starspots. The survey by Radick et al. revealed that with a precision of about0.003 mag none of the variable stars had a spectral type earlier than F7 or later than K2, althoughthe list of stars included A0 to K8 candidates. Thus, the starspot phenomenon in solar-type starspeaks seemingly at the effective temperature range from 6400 K to 4900 K.
Evidence linking the photometric variability of solar-type stars to the sunspot phenomenon isprovided by the fact that continuum variability seems to occur in anti-phase with variations in Hαand Ca II H & K emission variations (Dorren and Guinan, 1982). The anticorrelation implies thatthe surface activity of such stars is confined to localised activity centres that include both emissionplages and dark spots, similar to active regions observed on the Sun. Moreover, short-term stellarirradiance variations may be largely explained as rotational modulation by active regions whichcan persist for several rotation periods (Lockwood et al., 1984).
The onset of solar-type activity at F7 stars with subsurface convection zones was firmly es-tablished by the survey of Radick et al., while the reality of the limit at K2 seemed to be lesscertain. For instance, a higher precision of 0.001 mag achieved aboard the Hubble Space Telescopeallowed for the detection of periodic brightness variations of the red dwarf Proxima Cen (V645
Living Reviews in Solar Physicshttp://www.livingreviews.org/lrsp-2005-8
8 Svetlana V. Berdyugina
Cen, M5Ve) with an amplitude of 0.01 mag and a period of 41.6 d, which were interpreted asrotational modulation of starspots in the stellar photosphere (Benedict et al., 1993).
It was firmly established that magnetic activity in solar-type stars declines with age and that it isclosely related to a loss of angular momentum throughout the main-sequence lifetime (Skumanich,1972; Noyes et al., 1984; Baliunas et al., 1995; Gudel et al., 1997). Thus, young stars exhibit highaverage levels of activity and rapid rotation, while stars as old as the Sun and older have slowerrotation rates and lower activity levels.
2.3 T Tauri stars
T Tau stars were discovered and recognised as a new type of variables by Joy (1945). They areassociated with interstellar clouds and distinguished by irregular light variations. Emission lines intheir spectra resembling the spectrum of the solar chromosphere are superimposed on photosphericabsorption spectra of G–M types of low luminosity. Strongly enhanced lithium absorption in theirspectra indicates the young age of these stars. T Tau-type stars are, thus, considered as pre-main-sequence stars of about one solar mass at an age of a few million years, still surrounded by disksof gas and dust remaining from their formation. It was admitted that magnetic fields play animportant role in the surface activity of T Tau stars similar to sunspots but strongly enhancedin strength (Petrov and Shcherbakov, 1976; Gershberg, 1982; Appenzeller and Dearborn, 1984),in the flare activity (Guenther and Ball, 1999), as well as in accretion processes and stellar windphenomena (Hartmann, 1990; Konigl, 1991).
A subgroup of T Tau stars with weak emission spectra and little, if any, IR excess radiation,called weak-line T Tau stars, show periodic brightness variations with amplitudes up to 0.5 magwhich are caused by very large cool active regions (Bouvier and Bertout, 1989; Petrov et al., 1994;Hatzes, 1995; Grankin et al., 1995). Properties of T Tauri type stars were recently reviewed byPetrov (2003).
2.4 RS CVn stars
RS CVn stars represent a class of close detached binaries with the more massive primary componentbeing a G–K giant or subgiant and the secondary a subgiant or dwarf of spectral classes G to M.They show optical variability (outside eclipses) which is characterised by an amplitude up to0.6 mag in the V band and interpreted as the rotationally modulated effect of cool spots on theirsurfaces. Because of low luminosity of the secondary many RS CVn systems appear as single-line binaries which is attractive for spectral analysis. In binaries, where both components can beobserved, the primary appears more active than the secondary.
The identification of a new class of variable stars, named after the prototype system RS CVn,was proposed by Hall (1976) who identified the following classification signatures:
i. photometric variability;
ii. Ca II H & K emission lines;
iii. subgiant component well within its Roche lobe;
iv. fast rotation, i.e. almost synchronised binaries with orbital periods of a few days;
v. orbital period variations.
Since they are tidally locked close binaries, they are also fast rotators. Thus, similar to othercool active stars, RS CVn-type variables are remarkable due to strong chromospheric plages, coronalX-ray, and microwave emissions, as well as strong flares in the optical, UV, radio, and X-ray.
Living Reviews in Solar Physicshttp://www.livingreviews.org/lrsp-2005-8
Starspots: A Key to the Stellar Dynamo 9
Large amplitude brightness variations of RS CVn stars imply the presence of enormous starspotson their surfaces covering up to 50% of the visible disc (see Section 5). Remarkable activity andhigh luminosity of these stars make them favourite targets for light curve modelling, Dopplerimaging and spectral line analysis. Most of the present knowledge on starspots is based on studiesof this type stars.
2.5 FK Com stars
FK Comae stars were first defined as a new group of active stars in the early 1980’s (Boppand Rucinski, 1981; Bopp, 1981; Bopp and Stencel, 1981). FK Comae stars are late-type gi-ants with spectral types ranging from G to K and rotation periods of only a few days. Thisindicates very rapid rotation rates. Spectroscopic observations reveal v sin i values of these stars of∼ 50 – 150 km s−1. Still, these stars do not show any significant periodic radial velocity variationsand are, therefore, most likely single. Three most active stars of this type are FK Com, V1794 Cyg(HD199178), and YY Men. A few other stars have been suggested as candidates for this group,but they exhibit milder activity and slower rotation.
The magnetic activity of FK Comae stars is revealed by rotationally modulated photometricvariations with an amplitude in the V -band of 0.1 – 0.3 mag caused by cool asymmetrically dis-tributed spots on the stellar surface. Other characteristics of these stars include a very strong andvariable chromospheric emission in the Ca II H & K lines and in the Balmer lines. The photometricand spectroscopic characteristics of FK Comae stars are very similar to those of the very activeRS CVn stars (see Section 2.4), with the exception that RS CVn stars are close binary systems inwhich the tidal effects produce synchronous rotation and, therefore, also rapid rotation.
The origin of FK Comae stars is still debated. A few evolutionary scenarios have been proposedfor explaining the odd rapid rotation of the late-type single giants. The first idea on the originof FK Comae stars was that the stars may represent the further evolution of W UMa contactbinaries (see Section 2.6) into a coalesced single star (Bopp and Rucinski, 1981; Bopp, 1981; Boppand Stencel, 1981). Such a scenario was first considered by Webbink (1976) who calculated theevolution of a contact binary and showed that the mass ratio (secondary/primary) can decrease onan evolutionary time scale until the secondary is completely dissipated, during the primary’s initialascent of the giant branch. The kinematics and age of FK Com support this hypothesis (Guinanand Robinson, 1986). However, as argued by Fekel and Balachandran (1993), the detection oflithium in these active giants is evidence against binary coalescence. They considered a scenarioin which the surface convection zone reaches the rapidly rotating core just as a star begins itsfirst ascent of the giant branch, and dredges both high angular momentum material and freshlysynthesised Li to the surface. Still, the puzzle is not solved and requires further investigation ofthese objects.
2.6 W UMa stars
W UMa stars are eclipsing binaries with periods between about 5 and 20 h showing continuouslight variations (Selam, 2004). They consist of two solar-type components surrounded by a com-mon envelope. A large-scale energy transfer from the larger, more massive component to thesmaller, less massive one results in almost equalising surface temperatures over the entire sys-tem. The components of such a contact binary rotate very rapidly in spite of their old ages(v sin i ∼ 100 – 200 km s−1) as a result of spin-orbit synchronisation due to strong tidal interac-tions between the stars. W UMa stars are very common, comprising some 95% of eclipsing binaryvariables in the solar neighbourhood, or one star in every 1000 – 2000 in the same spectral range(Eggen, 1967).
Observations reveal that there are two subclasses of W UMa stars: A-type and W-type systems.
Living Reviews in Solar Physicshttp://www.livingreviews.org/lrsp-2005-8
10 Svetlana V. Berdyugina
The former have longer periods, are hotter, have larger total mass, and a smaller mass-ratio andare in better contact. The effective temperatures of the primary and secondary stars in W Uma-type variables are not exactly the same. In W-type the temperature difference is larger and thesecondary appears hotter, while in A-type the primary is hotter or almost the same temperature asthe secondary. Mullan (1975) suggested that the primary stars in W-type systems appear coolerrelative to the secondary due to cool magnetic starspots on their surfaces. Following this idea,photometric peculiarities of such systems have been often interpreted with the help of either coolor hot spots on the binary components. A study of the contact binaries with Doppler imagingtechnique (see Section 4.2) reveals that both components can be covered by cool starspots, witha tendency for the primary to be more active than the secondary (Maceroni et al., 1994; Hendryand Mochnacki, 2000; Barnes et al., 2004).
2.7 Algols
Algols are eclipsing binaries consisting of a hot, main-sequence primary star of spectral class B toF and a cool, evolved, less massive secondary. Cool stars in Algols are usually G or K subgiantswith outer convection envelopes which are in contact with their Roche lobes. Tidal interactionsforce most of these stars to rotate synchronously with their orbital motions, producing typicalrotational velocities between about 30 and 100 km s−1. The rapid rotation combined with deepconvection envelopes produces a variety of magnetic activity phenomena including starspots inthese stars, similar to RS CVn (see Section 2.4), BY Dra (see Section 2.1), and W UMa binaries(see Section 2.6). Hall (1989) summarised observations indicating magnetic activity in Algols. Inaddition to strong Ca II H & K emission, X-ray, and radio emission was detected from a number ofAlgol binaries which indicated the presence of hot coronae associated with the cool stars (Whiteand Marshall, 1983; Stewart et al., 1989; Umana et al., 1989).
Brightness variations due to starspots can be observed in Algols only during primary totaleclipses, when the luminous hot components are hidden. Therefore, because of synchronised ro-tation, only one hemisphere of the cool Algol stars can be observed and the photometric datacollected are less detailed than for other spotted binaries. Photospheric continuum variations werenevertheless detected in cool components and attributed to the effect of cool starspots (Richards,1990; Olson and Etzel, 1993; Varricatt, 2000).
2.8 Degenerate stars
If the magnetic flux is conserved during stellar evolution, white dwarfs should be expected tohave magnetic fields of 107 – 108 G. Yet, isolated magnetic white dwarfs are quite rare, comprisingabout 5% of all white dwarfs (Wickramasinghe and Ferrario, 2000). Observed spectral variations ofmagnetic white dwarfs on a timescale of hours or days suggest a complex magnetic field distributionon their surfaces. In some cases, spot-like magnetic field enhancements superimposed on a weakerdipole magnetic field can be identified (Landi Degl’Innocenti, 1976; Maxted et al., 2000). Similarstructures are most probably present on the surfaces of neutron stars as well. There is a growingevidence, based on X-ray and radio observations, that besides the large-scale dipolar magneticfield, isolated neutron stars possess small-scale magnetic field enhancements (Geppert et al., 2003).Current theory predicts that such structures can be generated from strong subsurface toroidal fieldson both white dwarfs and neutron stars.
Living Reviews in Solar Physicshttp://www.livingreviews.org/lrsp-2005-8
Starspots: A Key to the Stellar Dynamo 11
3 Observational Tools for Studying Starspots
3.1 Photometry
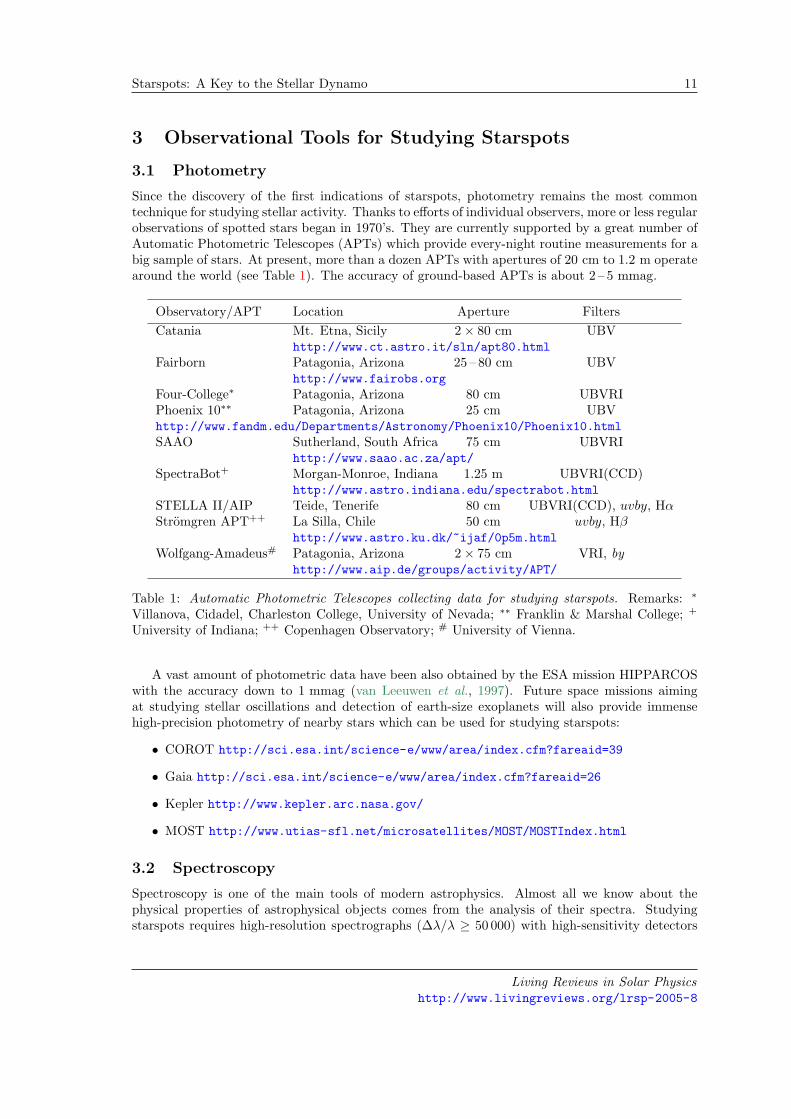
Since the discovery of the first indications of starspots, photometry remains the most commontechnique for studying stellar activity. Thanks to efforts of individual observers, more or less regularobservations of spotted stars began in 1970’s. They are currently supported by a great number ofAutomatic Photometric Telescopes (APTs) which provide every-night routine measurements for abig sample of stars. At present, more than a dozen APTs with apertures of 20 cm to 1.2 m operatearound the world (see Table 1). The accuracy of ground-based APTs is about 2 – 5 mmag.
Observatory/APT Location Aperture FiltersCatania Mt. Etna, Sicily 2× 80 cm UBV
http://www.ct.astro.it/sln/apt80.htmlFairborn Patagonia, Arizona 25 – 80 cm UBV
http://www.fairobs.orgFour-College∗ Patagonia, Arizona 80 cm UBVRIPhoenix 10∗∗ Patagonia, Arizona 25 cm UBVhttp://www.fandm.edu/Departments/Astronomy/Phoenix10/Phoenix10.htmlSAAO Sutherland, South Africa 75 cm UBVRI
http://www.saao.ac.za/apt/SpectraBot+ Morgan-Monroe, Indiana 1.25 m UBVRI(CCD)
http://www.astro.indiana.edu/spectrabot.htmlSTELLA II/AIP Teide, Tenerife 80 cm UBVRI(CCD), uvby, HαStromgren APT++ La Silla, Chile 50 cm uvby, Hβ
http://www.astro.ku.dk/~ijaf/0p5m.htmlWolfgang-Amadeus# Patagonia, Arizona 2× 75 cm VRI, by
http://www.aip.de/groups/activity/APT/
Table 1: Automatic Photometric Telescopes collecting data for studying starspots. Remarks: ∗
Villanova, Cidadel, Charleston College, University of Nevada; ∗∗ Franklin & Marshal College; +
University of Indiana; ++ Copenhagen Observatory; # University of Vienna.
A vast amount of photometric data have been also obtained by the ESA mission HIPPARCOSwith the accuracy down to 1 mmag (van Leeuwen et al., 1997). Future space missions aimingat studying stellar oscillations and detection of earth-size exoplanets will also provide immensehigh-precision photometry of nearby stars which can be used for studying starspots:
• COROT http://sci.esa.int/science-e/www/area/index.cfm?fareaid=39
• Gaia http://sci.esa.int/science-e/www/area/index.cfm?fareaid=26
• Kepler http://www.kepler.arc.nasa.gov/
• MOST http://www.utias-sfl.net/microsatellites/MOST/MOSTIndex.html
3.2 Spectroscopy
Spectroscopy is one of the main tools of modern astrophysics. Almost all we know about thephysical properties of astrophysical objects comes from the analysis of their spectra. Studyingstarspots requires high-resolution spectrographs (∆λ/λ ≥ 50 000) with high-sensitivity detectors
Living Reviews in Solar Physicshttp://www.livingreviews.org/lrsp-2005-8
12 Svetlana V. Berdyugina
which have become available for the past two decades at mid and large aperture telescopes. Among8 – 10 m telescopes it is worth tomention UVES at VLT, HIRES at KECK, HRS at the Hobby-Eberly Telescope (HET), and HDS at Subaru. In addition, there are about 10 high-resolutionspectrographs on 4 m class telescopes and even more on 2 m class telescopes. Most of them areechelle cross-dispersed spectrographs allowing for a wide wavelength range in the optics. A recentoverview of the currently available high-resolution spectrographs and future projects was given byPallavicini (2002).
A study of starspots involves routine monitoring and data collection for a relatively large sampleof stars. A great help comes from using robotic telescopes. The first dedicated robotic telescopeT-13 was developed at the Tennessee State University and has started its operation in 2003 at theFairborn observatory, Arizona (http://schwab.tsuniv.edu/t13/description.html). It is a 2 mtelescope with a spectrograph working at two resolutions, 34 000 and 90 000, and full wavelengthcoverage in the optical. The second spectroscopic robotic telescope STELLA I of 1.2 m is beingbuilt by AIP and IAC. It is expected to start operation in 2006 on Tenerife and will be equippedwith echelle spectrograph of maximum 50 000 resolution (http://www.aip.de/stella/). The twotelescopes are planned to be complementary in studying starspots, as they are separated by about95 in longitude and, thus, will allow prolonging an observing night by 6 h.
3.3 Polarimetry
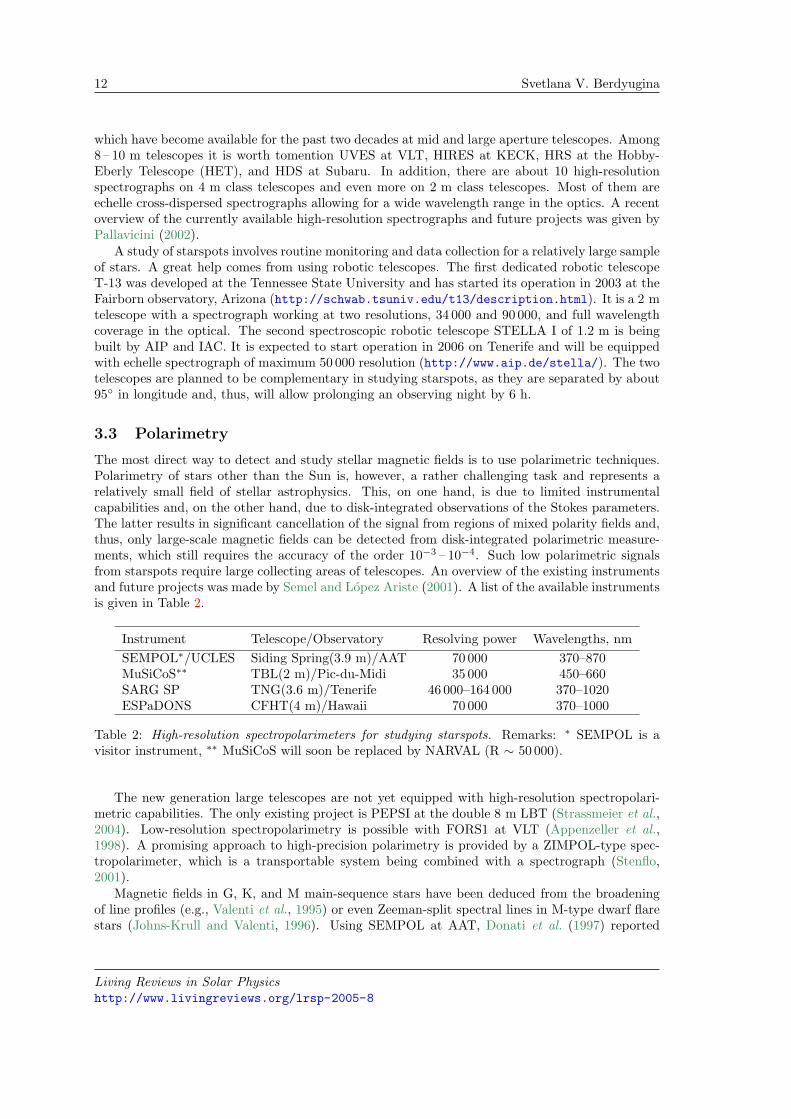
The most direct way to detect and study stellar magnetic fields is to use polarimetric techniques.Polarimetry of stars other than the Sun is, however, a rather challenging task and represents arelatively small field of stellar astrophysics. This, on one hand, is due to limited instrumentalcapabilities and, on the other hand, due to disk-integrated observations of the Stokes parameters.The latter results in significant cancellation of the signal from regions of mixed polarity fields and,thus, only large-scale magnetic fields can be detected from disk-integrated polarimetric measure-ments, which still requires the accuracy of the order 10−3 – 10−4. Such low polarimetric signalsfrom starspots require large collecting areas of telescopes. An overview of the existing instrumentsand future projects was made by Semel and Lopez Ariste (2001). A list of the available instrumentsis given in Table 2.
Instrument Telescope/Observatory Resolving power Wavelengths, nmSEMPOL∗/UCLES Siding Spring(3.9 m)/AAT 70 000 370–870MuSiCoS∗∗ TBL(2 m)/Pic-du-Midi 35 000 450–660SARG SP TNG(3.6 m)/Tenerife 46 000–164 000 370–1020ESPaDONS CFHT(4 m)/Hawaii 70 000 370–1000
Table 2: High-resolution spectropolarimeters for studying starspots. Remarks: ∗ SEMPOL is avisitor instrument, ∗∗ MuSiCoS will soon be replaced by NARVAL (R ∼ 50 000).
The new generation large telescopes are not yet equipped with high-resolution spectropolari-metric capabilities. The only existing project is PEPSI at the double 8 m LBT (Strassmeier et al.,2004). Low-resolution spectropolarimetry is possible with FORS1 at VLT (Appenzeller et al.,1998). A promising approach to high-precision polarimetry is provided by a ZIMPOL-type spec-tropolarimeter, which is a transportable system being combined with a spectrograph (Stenflo,2001).
Magnetic fields in G, K, and M main-sequence stars have been deduced from the broadeningof line profiles (e.g., Valenti et al., 1995) or even Zeeman-split spectral lines in M-type dwarf flarestars (Johns-Krull and Valenti, 1996). Using SEMPOL at AAT, Donati et al. (1997) reported
Living Reviews in Solar Physicshttp://www.livingreviews.org/lrsp-2005-8
Starspots: A Key to the Stellar Dynamo 13
detection of Zeeman polarisation in several kinds of active stars, including RS CVn systems, adwarf flare star of BY Dra type, a FK Com star, and a T Tau star. Several new detections havebeen made with MuSiCoS (Wade, 2003).
3.4 Interferometry
Optical interferometry can be a powerful technique to image inhomogeneities on stellar surfaces.Direct observations of starspots will be the key constraints for models of stellar activity.
A stellar long-baseline interferometer consists of an array of several separate telescopes, whichredirect starlight to a central location where interference fringes are formed. The angular resolutionthat the interferometer can achieve depends on the baseline (the telescope separation), while fora single telescope the resolution is defined by its aperture diameter. The angular resolution isproportional to the ratio of the wavelength to the baseline of the interferometer or the diameter ofthe telescope. The largest existing telescope is 10 m in diameter, whereas the largest interferometerhas a baseline of 600 m, giving the latter a factor of 60 increased resolving power.
If the interferometer is coupled with a spectrograph, fringes can be analysed along spectral do-mains. Such a spectro-interferometer allows for eliminating disturbances by the Earth atmosphereand measure differential phases between two wavelengths, i.e., carry out colour differential interfer-ometry (Petrov, 1988). For magnetically active stars such observations can provide orientation ofthe stellar rotation axis with respect to the line of sight (Lagarde et al., 1995), which is importantfor interpretation of spectroscopic and photometric observations of spotted stars. Also, differentialfringe phases can be used to locate spots on the stellar surface (Wittkowski et al., 2002; Jankovet al., 2003; Rousselet-Perraut et al., 2004), even in such difficult cases as pole-on and equator-onorientations of the star which cannot be resolved by traditional Doppler spectroscopy. In addition,the stellar differential rotation rate and the inclination angle can be disentangled (de Souza et al.,2004).
A spectro-interferometer equipped with a polarimeter allows for recording the visibility functionand fringe phase for different polarisation states and, thus, can provide measurements of localmagnetic fields on the stellar surfaces (Rousselet-Perraut et al., 2004), which is the key informationfor studying stellar magnetic activity.
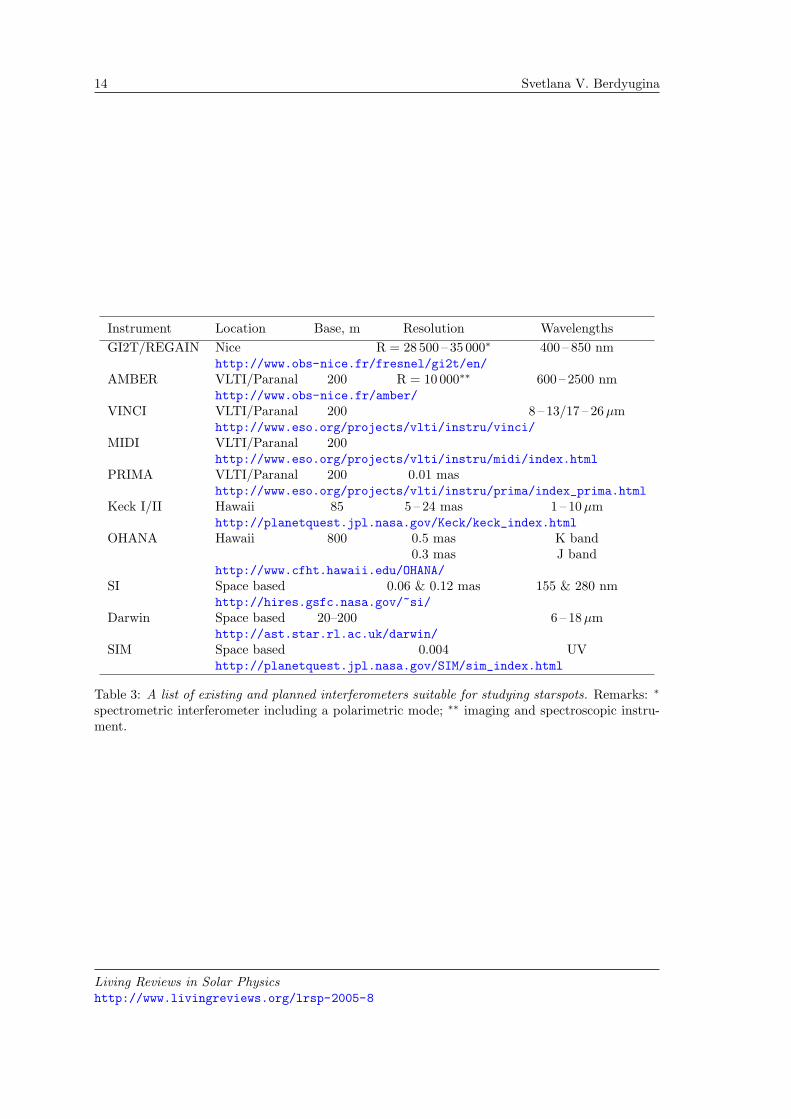
A list of the available and planned for the near future instruments is given in Table 3.
3.5 Microlensing
Gravitational imaging of stellar photospheres is a potentially useful tool for stellar astrophysics.Detecting spots in ways different from, e. g., rotationally induced modulations of the stellar bright-ness or spectral line profiles could bring considerable insight into their properties. For instance,microlensing can help to disentangle the temperature and spot area. Moreover, it provides anopportunity for probing starspots on the surfaces of slow rotating stars, which are unsuitablecandidates for the Doppler imaging technique.
A microlensing event has been recently used for high-precision, multicolour measuring a limbdarkening profile on the surface of a K3 giant and revealed a significant disagreement betweenthe observed and predicted from atmospheric models disk brightness distribution (Fields et al.,2003). The Optical Gravitational Lensing Experiment (OGLE) survey of bulge giants providedphotometric evidence for stellar spots via microlensing events (Udalski et al., 1995). Modelling ofthe spots on the stars selected from the OGLE database was undertaken by Guinan et al. (1997).Further theoretical investigation of possible detections of stellar spots by gravitational microlensingwas carried out by Heyrovsky and Sasselov (2000) and Hendry et al. (2002). They concluded thatstarspots generally produce a clear signature only for transit events. Moreover, this signature isstrongly suppressed by limb darkening for spots close to the limb, although spots may still be
Living Reviews in Solar Physicshttp://www.livingreviews.org/lrsp-2005-8
14 Svetlana V. Berdyugina
Instrument Location Base, m Resolution WavelengthsGI2T/REGAIN Nice R = 28 500 – 35 000∗ 400 – 850 nm
http://www.obs-nice.fr/fresnel/gi2t/en/AMBER VLTI/Paranal 200 R = 10 000∗∗ 600 – 2500 nm
http://www.obs-nice.fr/amber/VINCI VLTI/Paranal 200 8 – 13/17 – 26µm
http://www.eso.org/projects/vlti/instru/vinci/MIDI VLTI/Paranal 200
http://www.eso.org/projects/vlti/instru/midi/index.htmlPRIMA VLTI/Paranal 200 0.01 mas
http://www.eso.org/projects/vlti/instru/prima/index_prima.htmlKeck I/II Hawaii 85 5 – 24 mas 1 – 10µm
http://planetquest.jpl.nasa.gov/Keck/keck_index.htmlOHANA Hawaii 800 0.5 mas K band
0.3 mas J bandhttp://www.cfht.hawaii.edu/OHANA/
SI Space based 0.06 & 0.12 mas 155 & 280 nmhttp://hires.gsfc.nasa.gov/~si/
Darwin Space based 20–200 6 – 18µmhttp://ast.star.rl.ac.uk/darwin/
SIM Space based 0.004 UVhttp://planetquest.jpl.nasa.gov/SIM/sim_index.html
Table 3: A list of existing and planned interferometers suitable for studying starspots. Remarks: ∗
spectrometric interferometer including a polarimetric mode; ∗∗ imaging and spectroscopic instru-ment.
Living Reviews in Solar Physicshttp://www.livingreviews.org/lrsp-2005-8

Starspots: A Key to the Stellar Dynamo 15
clearly detected for favourable lens trajectories. It was found also that in order for microlensingevents to be an effective starspot imaging tool, intensive temporal sampling throughout the transitis needed.
Living Reviews in Solar Physicshttp://www.livingreviews.org/lrsp-2005-8
16 Svetlana V. Berdyugina
4 Diagnostic Techniques for Studying Starspots
4.1 Light-curve modelling
Since the discovery of stellar photometric variations due to cool spots, generally two approaches areused to model such variations and to deduce starspot properties. One is based on a trial-and-errordirect light-curves modelling (LCM) when assuming a number of circular (or of other pre-definedshape) spots causing the variations. Numerical techniques employing this approach have been de-veloped by Budding (1977), Vogt (1981), Rodono et al. (1986), Dorren (1987), Strassmeier (1988)and Kiurkchieva (1990). A technique taking into account time evolution of starspots has been pro-posed by Strassmeier and Bopp (1992). It allowed for detecting spot appearance and disappearanceon time scales from a few to a hundred days. A zonal model with (near-)equatorial inhomogeneousbands of spots was considered by Eaton and Hall (1979) and Alekseev and Gershberg (1996).
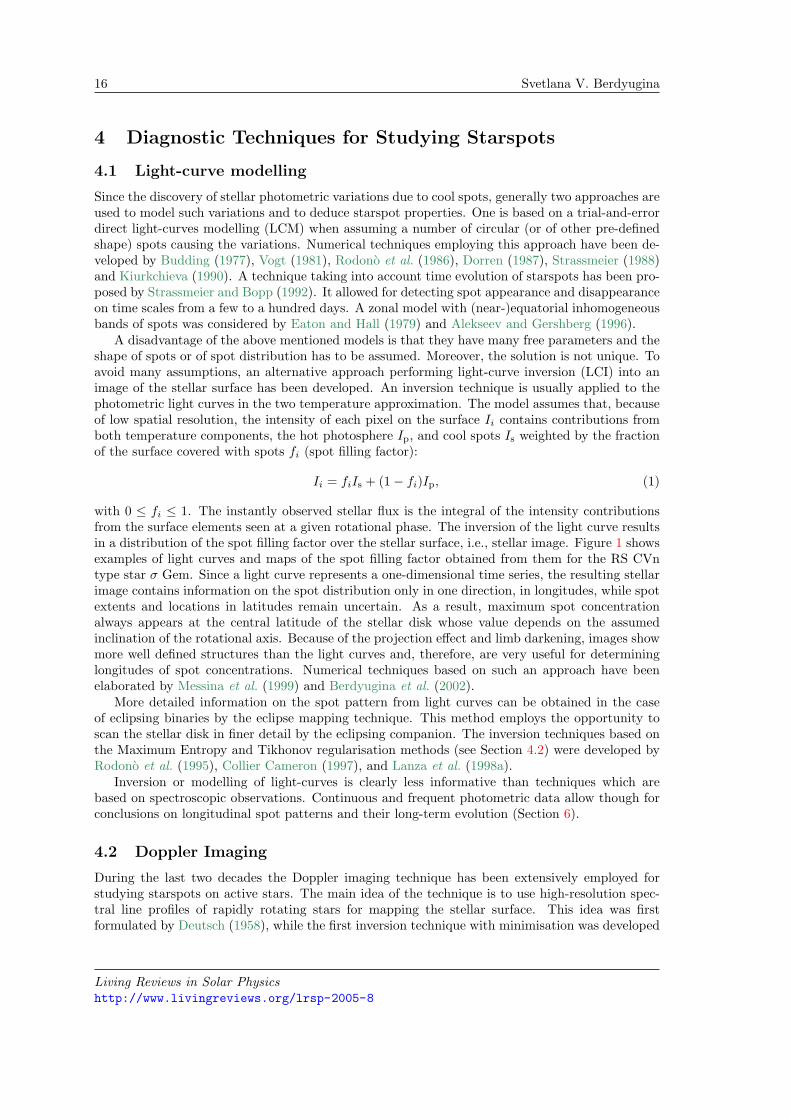
A disadvantage of the above mentioned models is that they have many free parameters and theshape of spots or of spot distribution has to be assumed. Moreover, the solution is not unique. Toavoid many assumptions, an alternative approach performing light-curve inversion (LCI) into animage of the stellar surface has been developed. An inversion technique is usually applied to thephotometric light curves in the two temperature approximation. The model assumes that, becauseof low spatial resolution, the intensity of each pixel on the surface Ii contains contributions fromboth temperature components, the hot photosphere Ip, and cool spots Is weighted by the fractionof the surface covered with spots fi (spot filling factor):
Ii = fiIs + (1− fi)Ip, (1)
with 0 ≤ fi ≤ 1. The instantly observed stellar flux is the integral of the intensity contributionsfrom the surface elements seen at a given rotational phase. The inversion of the light curve resultsin a distribution of the spot filling factor over the stellar surface, i.e., stellar image. Figure 1 showsexamples of light curves and maps of the spot filling factor obtained from them for the RS CVntype star σ Gem. Since a light curve represents a one-dimensional time series, the resulting stellarimage contains information on the spot distribution only in one direction, in longitudes, while spotextents and locations in latitudes remain uncertain. As a result, maximum spot concentrationalways appears at the central latitude of the stellar disk whose value depends on the assumedinclination of the rotational axis. Because of the projection effect and limb darkening, images showmore well defined structures than the light curves and, therefore, are very useful for determininglongitudes of spot concentrations. Numerical techniques based on such an approach have beenelaborated by Messina et al. (1999) and Berdyugina et al. (2002).
More detailed information on the spot pattern from light curves can be obtained in the caseof eclipsing binaries by the eclipse mapping technique. This method employs the opportunity toscan the stellar disk in finer detail by the eclipsing companion. The inversion techniques based onthe Maximum Entropy and Tikhonov regularisation methods (see Section 4.2) were developed byRodono et al. (1995), Collier Cameron (1997), and Lanza et al. (1998a).
Inversion or modelling of light-curves is clearly less informative than techniques which arebased on spectroscopic observations. Continuous and frequent photometric data allow though forconclusions on longitudinal spot patterns and their long-term evolution (Section 6).
4.2 Doppler Imaging
During the last two decades the Doppler imaging technique has been extensively employed forstudying starspots on active stars. The main idea of the technique is to use high-resolution spec-tral line profiles of rapidly rotating stars for mapping the stellar surface. This idea was firstformulated by Deutsch (1958), while the first inversion technique with minimisation was developed
Living Reviews in Solar Physicshttp://www.livingreviews.org/lrsp-2005-8
Starspots: A Key to the Stellar Dynamo 17
Figure 1: Light curve inversion results for the RS CVn star σ Gem (Berdyugina & Henry, inpreparation). The first and third columns are maps of the spot filling factor. Darker regionsindicate larger values. Observed and calculated V -band light curves are shown in the second andfourth columns by crosses and lines, respectively. The images also illustrate a flip-flop event thatoccurred in 1988: the active region near the phase 0.5 has diminished for about one year, whilethe region near the phase 0.0 has increased in size (see discussion of the flip-flop phenomenon inSection 6.2).
Living Reviews in Solar Physicshttp://www.livingreviews.org/lrsp-2005-8
18 Svetlana V. Berdyugina
by Goncharskii et al. (1977). It was first used for mapping chemical peculiarities on the surfaceof Ap stars. Modelling of photometric variations of late-type active stars has revealed that coolstarspots are often quite large, covering up to 20% of the stellar surface. Such starspots should haveresulted in noticeable line profile variations which were first observed in spectra of the RS CVn-type star HR 1099, and from which the first Doppler image of a spotted star was obtained by Vogtand Penrod (1983).
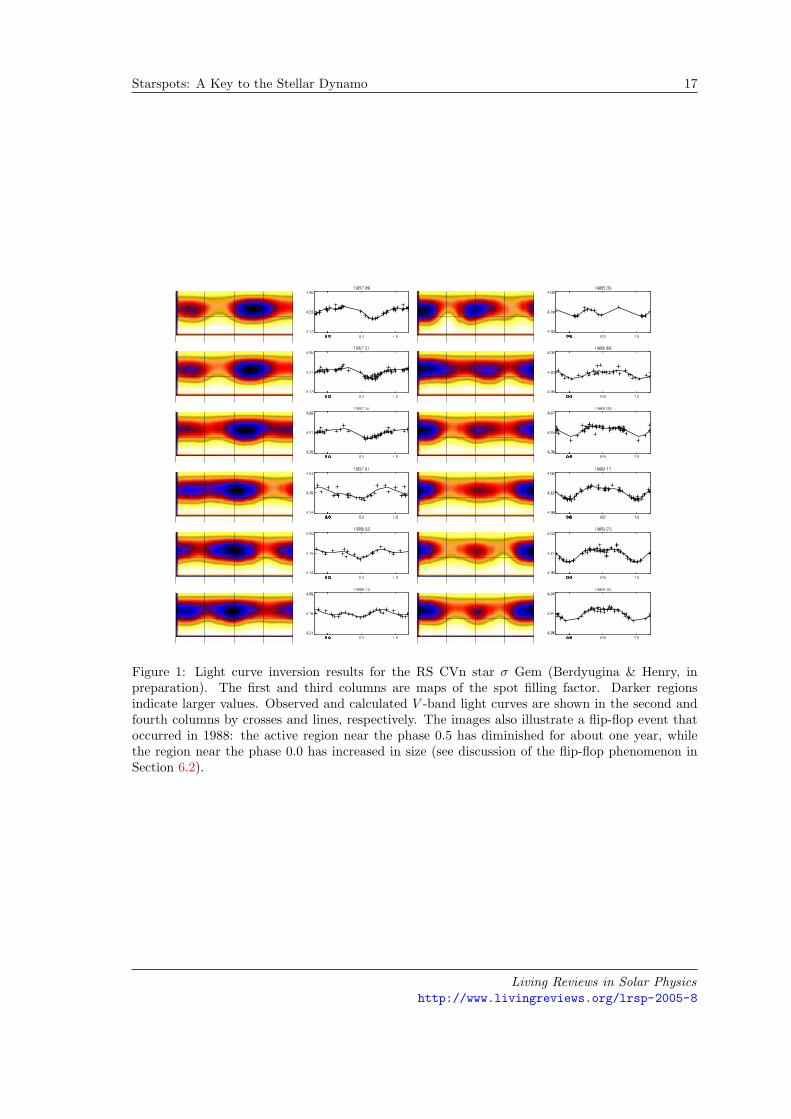
The Doppler imaging technique aims to restore starspot distribution information which is con-tained in time varying line profiles of rotating stars. If the star rotates rapidly enough, so that therotation broadening of a line profile is significantly larger than the local line profile at a single pointon the stellar surface, then a cool spot on the stellar surface will result in a “bump” in the profile(Figure 2). This “bump” moves across the profile, as the star rotates, with the velocity amplitudedepending on the spot latitude. Inversion of a time series of the stellar line profiles results in amap, or image, of the stellar surface.
Figure 2: Spectral line profiles for a model fast rotating star with no spots (dashed line) andwith a spot moving across the disk as the star rotates (solid line). See also animation at http://www.astro.phys.ethz.ch/staff/berdyugina/private/StellarActivity/StellarAct.html
An assumption on the nature of starspots is the main part of the model calculations. Cool spotswill modify the flux integrated over stellar disk. Therefore, the intensity of radiation I(T (s), λ, µ)emitted by the stellar surface from the point s in the direction µ at the wavelength λ is definedby the local temperature T (s), which is assumed to be the effective temperature of the modelatmosphere used for the calculation of the local line profile at the point s. Integration over thestellar disk, given rotational phase φ and set of wavelengths, results in the residual flux rλ(φ) whichcontains information on the temperature distribution on the stellar surface T (s) and, therefore, is tobe compared with the observed residual flux robs
λ (φ). Thus, the integration determines the directtransformation for a subsequent inversion. A comparison of the residual fluxes determines thediscrepancy function D(T ). By minimising D(T ), one can obtain a unique solution with minimumvariance. Such a solution is not however feasible due to noise in data. Smoothing the noise resultsin a multitude of different stable solutions. Searching for the unique and stable solution is a so-called ill-posed inverse problem, and there are different approaches and methods developed forsolving it.
A common way of choosing the unique solution with a given level of goodness of the fit is toinvoke some additional constraints R(T ), which usually determine special properties of the solution.Therefore, the original ill-posed minimisation problem is replaced by another, which has a unique
Living Reviews in Solar Physicshttp://www.livingreviews.org/lrsp-2005-8
Starspots: A Key to the Stellar Dynamo 19
solution:Φ(T ) = D(T ) + Λ ·R(T ), (2)
where Λ is a Lagrange multiplier and R(T ) is a regularisation functional, which makes the solutionunique. The value of Λ should be selected so that if T (s) minimises Φ(T ), then the rms deviationof the fit of the profiles is of the order of the noise in the observations.
Methods developed with such assumptions differ by the definition of R(T ). The Tikhonovregularisation method (TRM), applied by Goncharskii et al. (1977) and Piskunov et al. (1990),claims the solution to be with the least gradient of the parameters, and R(T ) = gradT . TheMaximum Entropy method (MEM) first applied by Vogt et al. (1987) searches for the solutionwith the largest entropy, and R(T ) = T log T . Generally, the two methods assume that theobserved phenomena possess properties R(T ), which cannot be known a priori. For instance, incase of surface imaging both above assumptions cannot be proved by the observations. In fact, forchoosing a unique solution, one indeed needs some additional information, and, if it is not available,it is substituted by some plausible assumptions, which lead to an apparently acceptable solutionbut with an unknown bias. One should note, however, that in case of data of high quality andquantity the role of the regularisation is reduced, and the solution is approaching to the maximumlikelihood solution, which in this case could be also considered as an acceptable result.
An alternative Occamian approach (OA) to inverse problems was developed by Terebizh (1995)and applied to the Doppler imaging problem by Berdyugina (1998). In the Occamian approachthe choice of a solution is based on the analysis of information contained in observations and thetransformation model. Building the Fisher information matrix F with eigenvectors V one defines anew reference frame with coordinates Y , which are linear combinations of the unknown parametersT :
Y = V TT, T = V Y. (3)
The new coordinates Y comprise principal components of the solution. Small eigenvalues of Findicate principal components with relatively large errors of the solution, so that the error ellipsoidis extremely elongated in these directions. Moreover, in case of a lack of data some of the eigenvaluesbecome zero, and the corresponding parameters are linearly dependent. Therefore, only a part ofthe principal components Y (p) completely exhausts the available information on T . In such a case,the Y (p) are estimated instead of T , while other principal components with not enough informationare assumed to be zero. Then, the transformation
T = V Y (p) (4)
leads to the desired unique and stable solution T . Thus, the solution in the Occamian approach isthe one which statistically satisfactorily fits the observed data with a minimum set of Y (p). Sucha solution is unique because of the choice of p and stable because of removing those principalcomponents which contain no significant information but noise. It is not constrained with anyartificial assumptions. Another advantage of the Occamian approach is that the inverse Fisherinformation matrix gives estimates of the variances of the solution.
A number of numerical codes for Doppler imaging of cool stars based on the Maximum Entropymethod have been developed by Vogt et al. (1987), Rice et al. (1989), Brown et al. (1991), Col-lier Cameron (1992, 1995), Jankov and Foing (1992), and Rice and Strassmeier (2000). Piskunovet al. (1990) used the Tikhonov regularisation method and Berdyugina (1998) the Occamian ap-proach. A technique based on the CLEAN-like approach was suggested by Kurster (1993) andone based on the interferometry by Jankov et al. (2001). Effects of different numerical methodswas investigated by Piskunov et al. (1990) (MEM and TR), Strassmeier et al. (1991) (MEM, TR,trial-and-error), Kurster (1993) (CLEAN and MEM), and Korhonen et al. (1999) (TR and OA).As mentioned above, the difference is diminished when the data used are of high quality.
Living Reviews in Solar Physicshttp://www.livingreviews.org/lrsp-2005-8
20 Svetlana V. Berdyugina
Important inputs for Doppler imaging which affect significantly the result are stellar atmospheremodels, atomic and molecular line lists and stellar parameters. Errors in calculations of local lineprofiles have a strong effect on the inversion for moderate rotators. They easily cause artificialfeatures in maps, like polar caps and belts of cool and hot spots (Unruh and Collier Cameron,1995). The same features are obtained in case of a wrong value of the stellar rotational velocityand a wrong estimate of the effective temperature of the star (Berdyugina, 1998). Spot latitudesstrongly depend on the inclination angle of the rotational axis to the line of sight. Various testsshowed that capabilities of the technique are limited in the equatorial region where spots arerecovered with reduced area and contrast. Sub-equatorial spots cannot be restored, especially atlower inclinations. A recent overview of the strengths and weaknesses of the Doppler imagingtechnique was given by Rice (2002).
Doppler imaging of a single star with the inclination angle of the rotational axis to the lineof sight close to 90 (equator-on) experiences difficulties in recovering spots on either side of thestellar equator because of the symmetry of Doppler shifts in line profiles with respect to theequator. In a binary system such an inclination angle of the binary orbit would lead to eclipsesof the components. For an eclipsing binary, the equatorial symmetry problem is reduced, and thequality of the mapping can be improved (Vincent et al., 1993).
For the last two decades more than 60 cool stars have been studied with the surface imagingtechnique (see, for an overview, Strassmeier, 2002). Out of them 29 are single stars and 36 arecomponents in close binaries. A dozen of stars have been monitored for several years. The totalnumber of Doppler images is 245 as of June 2002 (http://www.aip.de/groups/activity/DI/summary/). The results obtained with the Doppler imaging techniques are discussed in Section 5.Examples of stellar Doppler images are shown in Figures 6 and 15.
4.3 Zeeman–Doppler Imaging
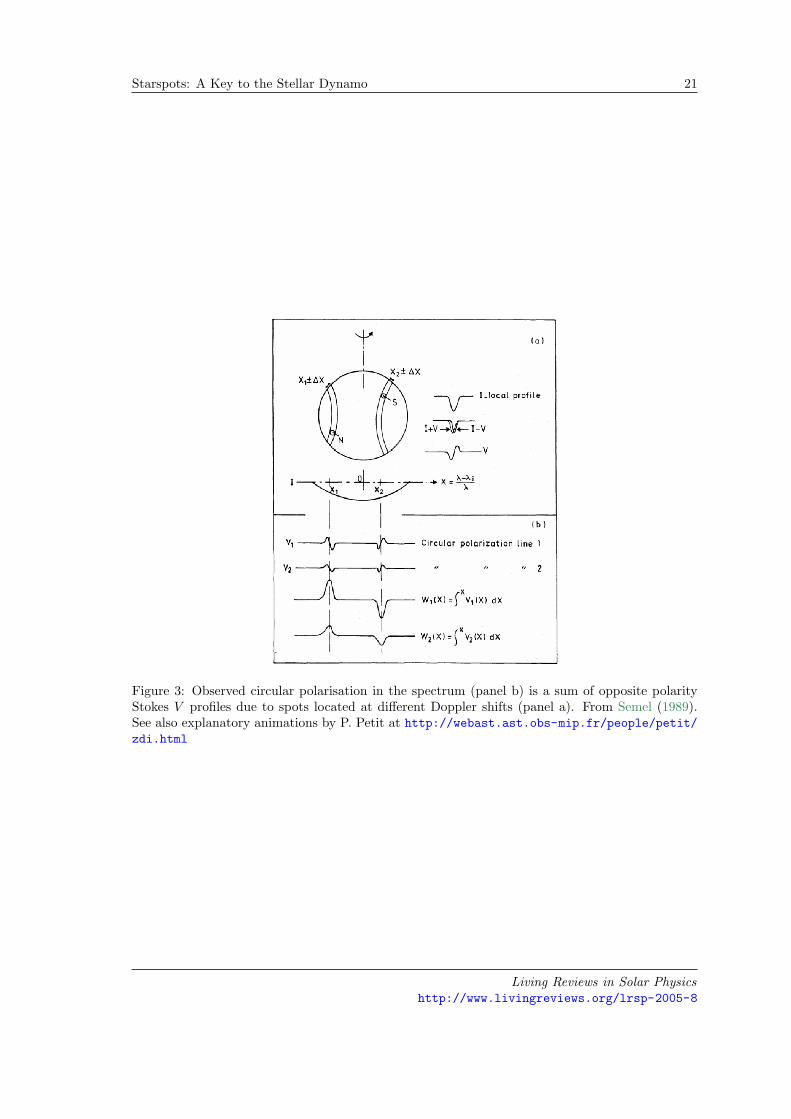
As an extension of the temperature and abundance mapping of the stellar surface, a magneticZeeman–Doppler imaging (ZDI) method was introduced by Semel (1989) and further developedby Donati et al. (1989), Semel et al. (1993), Brown et al. (1991), and Donati and Brown (1997).The technique is based on the analysis of high-resolution spectropolarimetric data and allows fordisentangling magnetic field distribution on the stellar surface due to different Doppler shifts ofZeeman-split local line profiles in the spectrum of a rotating star (Figure 3). In the absenceof rotation, the net circular polarisation signal in spectral lines would be zero due to mutualcancellations of contributions of regions of opposite field polarity.
Zeeman signatures in atomic lines due to starspots are expected to be extremely small, withtypical relative amplitudes of 0.1%. Detecting them requires measurements of polarisation withnoise level in Stokes V as low as 10−4, while the current instrumentation allows for the bestrelative noise level of 10−3. Semel (1989) and Semel and Li (1996) proposed a multi-line approachfor increasing the signal-to-noise (S/N) ratio of the measured polarisation, which has resulted infirst detection of the circular polarisation signal in a cool star (Donati et al., 1997). A combinationof Stokes V profiles using a multi-line technique called Least Squares Deconvolution (LSD) is basedon the weak field approximation, i.e., one assumes that the magnetic splitting of spectral lines issmaller than their local Doppler broadening. In this case the Stokes V signal is proportional tothe derivative of the intensity profile I(v), i.e.,
Vi(v) ∝ giλiIi′(v), (5)
where gi is the effective Lande factor and λi is the wavelength of the i-th spectral line. It isassumed further that the local line profiles are self-similar and scale in depth and width with thecentral depth di and wavelength, i.e.,
Ii′(v) = diZ(v), (6)
Living Reviews in Solar Physicshttp://www.livingreviews.org/lrsp-2005-8
Starspots: A Key to the Stellar Dynamo 21
Figure 3: Observed circular polarisation in the spectrum (panel b) is a sum of opposite polarityStokes V profiles due to spots located at different Doppler shifts (panel a). From Semel (1989).See also explanatory animations by P. Petit at http://webast.ast.obs-mip.fr/people/petit/zdi.html
Living Reviews in Solar Physicshttp://www.livingreviews.org/lrsp-2005-8
22 Svetlana V. Berdyugina
where Z(v) is a so-called mean Zeeman signature, which is constant for all lines. The LSD StokesV profile can be obtained as a sum over many individual lines:
V (v) =∑
i
giλidiZ(v). (7)
Blends and splitting patterns should be treated explicitly for each line. The gain factor in the S/Nratio can be as large as 30 when using more than 2000 line profiles. The LSD technique allowed fordetection of magnetic fields on various types of cool stars, from pre-main-sequence stars to evolvedgiants (Donati et al., 1997). It was also used for temperature mapping using Stokes I observationsof faint stars with short rotational periods for which high signal-to-noise spectra cannot be obtainedthrough longer exposure times.
Applying an inversion technique, similar to those used for Doppler imaging (see Section 4.2), toall four Stokes parameters, one can recover the distribution of the temperature and magneticfield vector over the stellar surface. Three numerical codes based on the Maximum Entropymethod (Brown et al., 1991; Hussain et al., 2000) and the Tikhonov regularisation (Piskunovand Kochukhov, 2002) have presently been developed. In practice, however, measuring the fullStokes vector for cool stars is difficult, because magnetic signatures in Stokes Q and U are con-siderably smaller than in Stokes V . Obtained Zeeman–Doppler images of cool stars are based onmeasurements of only Stokes I and V are certainly not unique and provide limited informationfor the interpretation. A lack of information on different components of the magnetic vector canbe overcome by assuming a certain relation between the components. For instance, Hussain et al.(2001) prescribed the field to be potential and reconstruct its distribution from circularly polarizedline profiles. Piskunov and Kochukhov (2002) suggested a special type of regularisation based onspherical harmonic expansion. In this case the field distribution is forced to take the form of suchan expansion which is acceptable only for stars with clearly dominating multipole structures like,e.g., Ap stars.
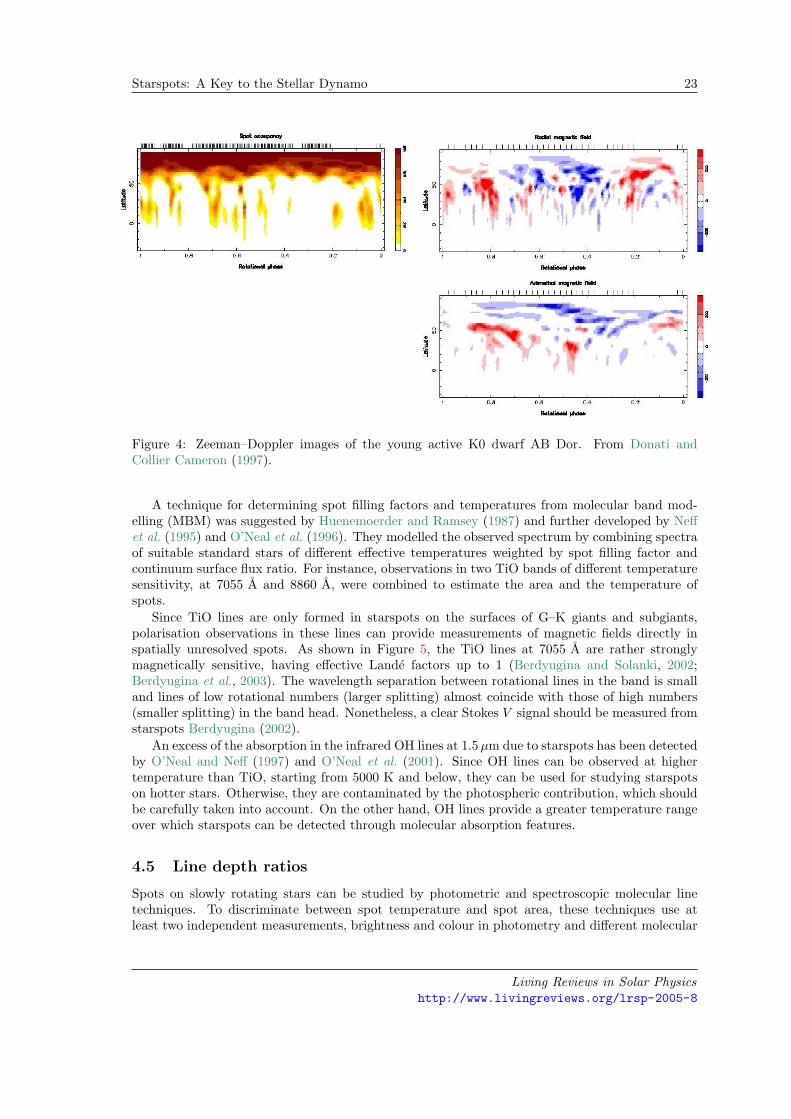
In the inversion procedure three components of the magnetic field vector are generally repre-sented by radial, azimuthal, and meridional fields. To some extent they contribute to the line ofsight component observed in Stokes V at different rotational phases and different Doppler shifts.For instance, the radial field will dominate the Stokes V near the centre of the stellar disk, whilethe azimuthal field will be most noticeable in the circular polarisation near the stellar limb. Thisallows to recover some parts of the magnetic field components from Stokes V observations. An ex-ample of such restoration is shown in Figure 4. When interpreting the results of Zeeman–Dopplerimages obtained only from Stokes I and V , one has to take into account that the magnetic fielddistribution is underdetermined for each component and that there might be a cross-talk betweendifferent components (Donati and Brown, 1997).
4.4 Molecular bands modelling
Molecular lines provide evidence of cool spots on the surfaces of active stars. If the effectivetemperature of the stellar photosphere is high enough, molecular lines can only be formed in coolstarspots. The first detection of molecular bands from starspots was reported by Vogt (1979) fora star whose spectral type K2 was not compatible with the presence of TiO and VO bands. Fromthe relative strengths and overall appearance of the molecular features, an equivalent spectral typeof the spot spectrum was estimated as late as M6. A phase-dependent variation in the strengthof the TiO band was detected by Huenemoerder et al. (1989), with TiO being strongest at thephotometric minimum. This confirmed that the photometric modulation is indeed caused by coolspots. Moreover, a comparison of photometric variations with TiO band strengths provided reliableestimates of unspotted stellar magnitudes (Berdyugina et al., 1998b, 1999b).
Living Reviews in Solar Physicshttp://www.livingreviews.org/lrsp-2005-8
Starspots: A Key to the Stellar Dynamo 23
Figure 4: Zeeman–Doppler images of the young active K0 dwarf AB Dor. From Donati andCollier Cameron (1997).
A technique for determining spot filling factors and temperatures from molecular band mod-elling (MBM) was suggested by Huenemoerder and Ramsey (1987) and further developed by Neffet al. (1995) and O’Neal et al. (1996). They modelled the observed spectrum by combining spectraof suitable standard stars of different effective temperatures weighted by spot filling factor andcontinuum surface flux ratio. For instance, observations in two TiO bands of different temperaturesensitivity, at 7055 A and 8860 A, were combined to estimate the area and the temperature ofspots.
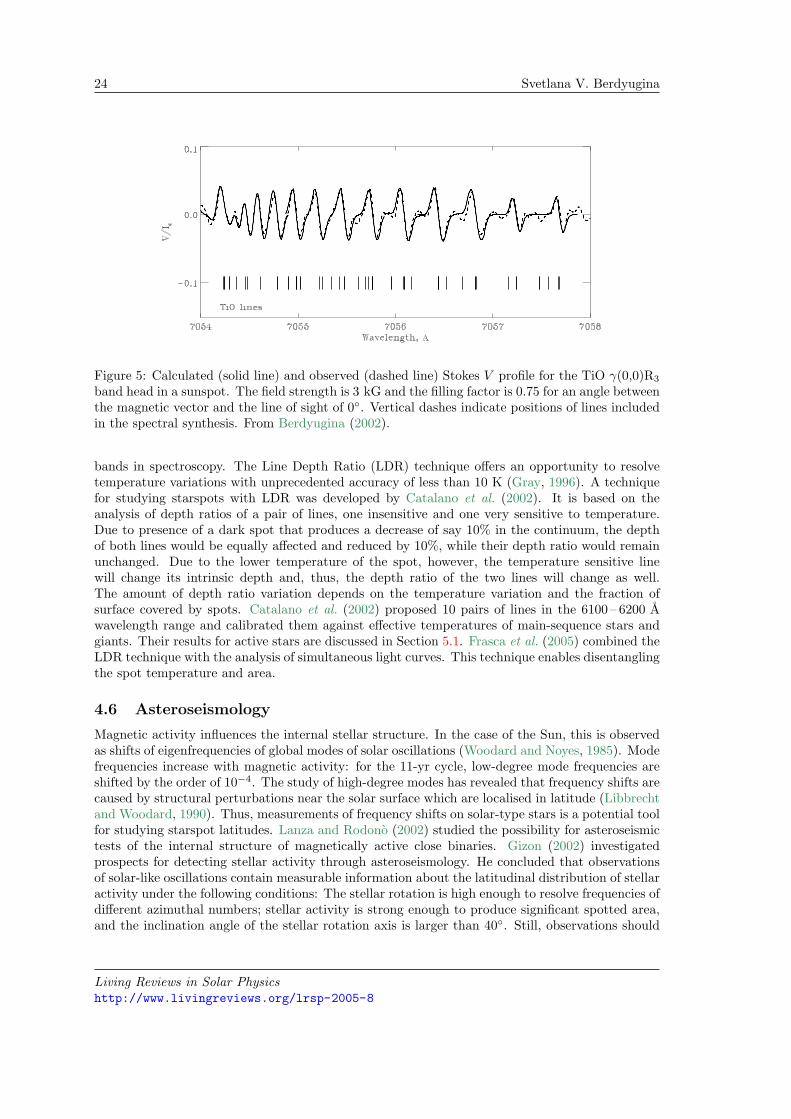
Since TiO lines are only formed in starspots on the surfaces of G–K giants and subgiants,polarisation observations in these lines can provide measurements of magnetic fields directly inspatially unresolved spots. As shown in Figure 5, the TiO lines at 7055 A are rather stronglymagnetically sensitive, having effective Lande factors up to 1 (Berdyugina and Solanki, 2002;Berdyugina et al., 2003). The wavelength separation between rotational lines in the band is smalland lines of low rotational numbers (larger splitting) almost coincide with those of high numbers(smaller splitting) in the band head. Nonetheless, a clear Stokes V signal should be measured fromstarspots Berdyugina (2002).
An excess of the absorption in the infrared OH lines at 1.5µm due to starspots has been detectedby O’Neal and Neff (1997) and O’Neal et al. (2001). Since OH lines can be observed at highertemperature than TiO, starting from 5000 K and below, they can be used for studying starspotson hotter stars. Otherwise, they are contaminated by the photospheric contribution, which shouldbe carefully taken into account. On the other hand, OH lines provide a greater temperature rangeover which starspots can be detected through molecular absorption features.
4.5 Line depth ratios
Spots on slowly rotating stars can be studied by photometric and spectroscopic molecular linetechniques. To discriminate between spot temperature and spot area, these techniques use atleast two independent measurements, brightness and colour in photometry and different molecular
Living Reviews in Solar Physicshttp://www.livingreviews.org/lrsp-2005-8
24 Svetlana V. Berdyugina
Figure 5: Calculated (solid line) and observed (dashed line) Stokes V profile for the TiO γ(0,0)R3
band head in a sunspot. The field strength is 3 kG and the filling factor is 0.75 for an angle betweenthe magnetic vector and the line of sight of 0. Vertical dashes indicate positions of lines includedin the spectral synthesis. From Berdyugina (2002).
bands in spectroscopy. The Line Depth Ratio (LDR) technique offers an opportunity to resolvetemperature variations with unprecedented accuracy of less than 10 K (Gray, 1996). A techniquefor studying starspots with LDR was developed by Catalano et al. (2002). It is based on theanalysis of depth ratios of a pair of lines, one insensitive and one very sensitive to temperature.Due to presence of a dark spot that produces a decrease of say 10% in the continuum, the depthof both lines would be equally affected and reduced by 10%, while their depth ratio would remainunchanged. Due to the lower temperature of the spot, however, the temperature sensitive linewill change its intrinsic depth and, thus, the depth ratio of the two lines will change as well.The amount of depth ratio variation depends on the temperature variation and the fraction ofsurface covered by spots. Catalano et al. (2002) proposed 10 pairs of lines in the 6100 – 6200 Awavelength range and calibrated them against effective temperatures of main-sequence stars andgiants. Their results for active stars are discussed in Section 5.1. Frasca et al. (2005) combined theLDR technique with the analysis of simultaneous light curves. This technique enables disentanglingthe spot temperature and area.
4.6 Asteroseismology
Magnetic activity influences the internal stellar structure. In the case of the Sun, this is observedas shifts of eigenfrequencies of global modes of solar oscillations (Woodard and Noyes, 1985). Modefrequencies increase with magnetic activity: for the 11-yr cycle, low-degree mode frequencies areshifted by the order of 10−4. The study of high-degree modes has revealed that frequency shifts arecaused by structural perturbations near the solar surface which are localised in latitude (Libbrechtand Woodard, 1990). Thus, measurements of frequency shifts on solar-type stars is a potential toolfor studying starspot latitudes. Lanza and Rodono (2002) studied the possibility for asteroseismictests of the internal structure of magnetically active close binaries. Gizon (2002) investigatedprospects for detecting stellar activity through asteroseismology. He concluded that observationsof solar-like oscillations contain measurable information about the latitudinal distribution of stellaractivity under the following conditions: The stellar rotation is high enough to resolve frequencies ofdifferent azimuthal numbers; stellar activity is strong enough to produce significant spotted area,and the inclination angle of the stellar rotation axis is larger than 40. Still, observations should
Living Reviews in Solar Physicshttp://www.livingreviews.org/lrsp-2005-8
Starspots: A Key to the Stellar Dynamo 25
be long and continuous, which can be provided by the future space missions COROT (http://iaa13u.iaa.csic.es/~corot/mainE.html) and Kepler (http://www.kepler.arc.nasa.gov/).
Stellar differential rotation for solar-type stars can be measured through asteroseismology aswell (Gizon and Solanki, 2004). Rotationally split frequencies of global oscillation provide infor-mation about rotation at different latitudes depending on the azimuthal order m of the mode ofpulsation. Since the m = ±1 and m = ±2 components of quadrupole oscillations can be observedsimultaneously in asteroseismology, rotational frequency splittings can be inverted to provide anestimate of the difference in stellar angular velocity between the equator and 45 latitude. Theprecision of the method depends on the value of the mean rotation and on the inclination anglebetween the rotation axis and the line of sight.
Living Reviews in Solar Physicshttp://www.livingreviews.org/lrsp-2005-8
26 Svetlana V. Berdyugina
5 Starspot Properties
5.1 Temperature and filling factor
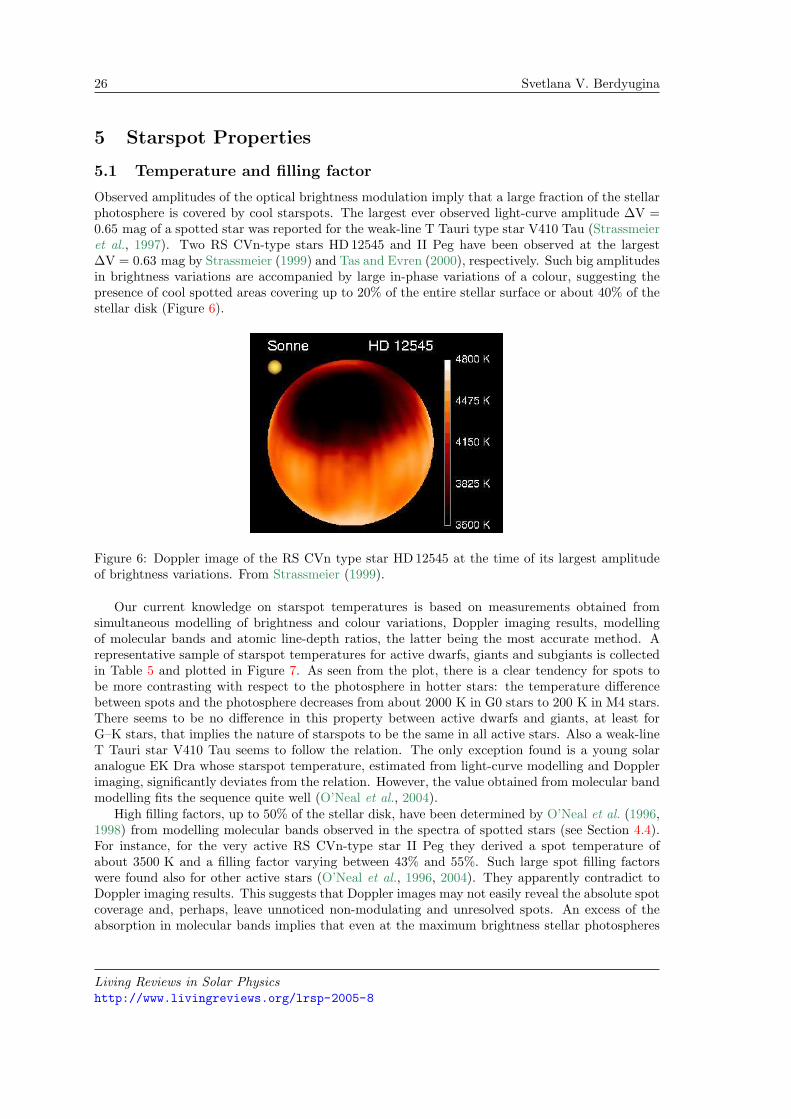
Observed amplitudes of the optical brightness modulation imply that a large fraction of the stellarphotosphere is covered by cool starspots. The largest ever observed light-curve amplitude ∆V =0.65 mag of a spotted star was reported for the weak-line T Tauri type star V410 Tau (Strassmeieret al., 1997). Two RS CVn-type stars HD 12545 and II Peg have been observed at the largest∆V = 0.63 mag by Strassmeier (1999) and Tas and Evren (2000), respectively. Such big amplitudesin brightness variations are accompanied by large in-phase variations of a colour, suggesting thepresence of cool spotted areas covering up to 20% of the entire stellar surface or about 40% of thestellar disk (Figure 6).
Figure 6: Doppler image of the RS CVn type star HD 12545 at the time of its largest amplitudeof brightness variations. From Strassmeier (1999).
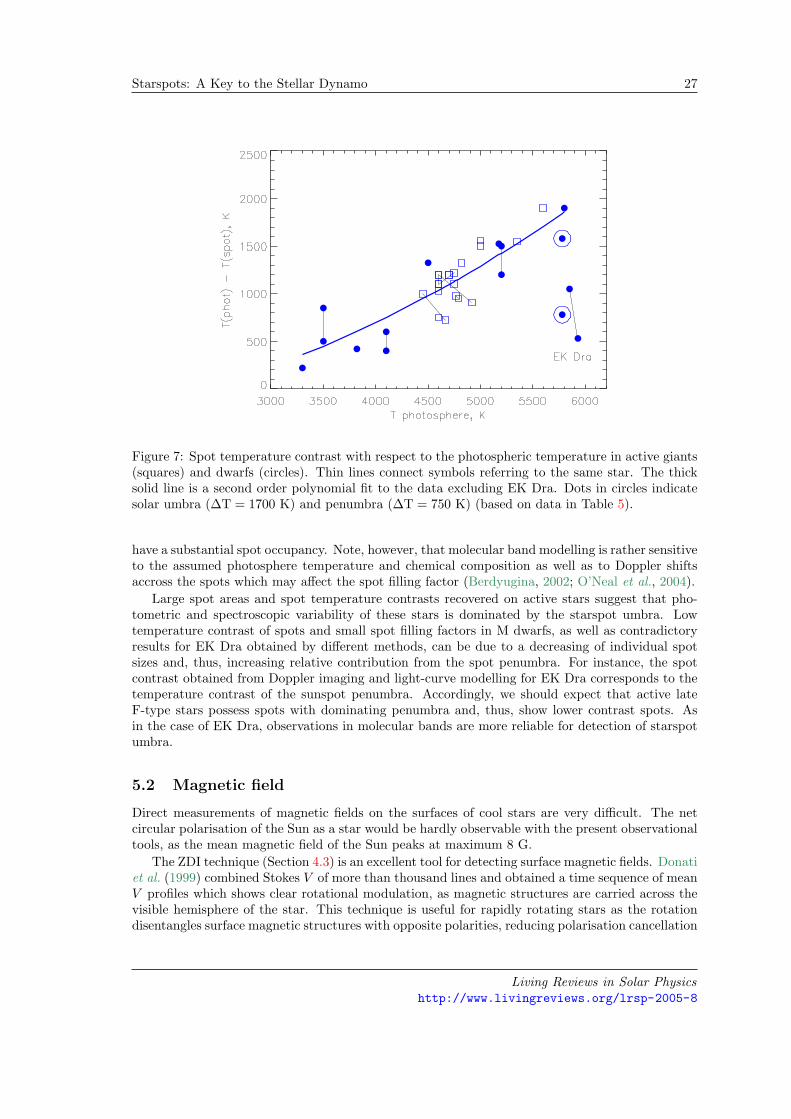
Our current knowledge on starspot temperatures is based on measurements obtained fromsimultaneous modelling of brightness and colour variations, Doppler imaging results, modellingof molecular bands and atomic line-depth ratios, the latter being the most accurate method. Arepresentative sample of starspot temperatures for active dwarfs, giants and subgiants is collectedin Table 5 and plotted in Figure 7. As seen from the plot, there is a clear tendency for spots tobe more contrasting with respect to the photosphere in hotter stars: the temperature differencebetween spots and the photosphere decreases from about 2000 K in G0 stars to 200 K in M4 stars.There seems to be no difference in this property between active dwarfs and giants, at least forG–K stars, that implies the nature of starspots to be the same in all active stars. Also a weak-lineT Tauri star V410 Tau seems to follow the relation. The only exception found is a young solaranalogue EK Dra whose starspot temperature, estimated from light-curve modelling and Dopplerimaging, significantly deviates from the relation. However, the value obtained from molecular bandmodelling fits the sequence quite well (O’Neal et al., 2004).
High filling factors, up to 50% of the stellar disk, have been determined by O’Neal et al. (1996,1998) from modelling molecular bands observed in the spectra of spotted stars (see Section 4.4).For instance, for the very active RS CVn-type star II Peg they derived a spot temperature ofabout 3500 K and a filling factor varying between 43% and 55%. Such large spot filling factorswere found also for other active stars (O’Neal et al., 1996, 2004). They apparently contradict toDoppler imaging results. This suggests that Doppler images may not easily reveal the absolute spotcoverage and, perhaps, leave unnoticed non-modulating and unresolved spots. An excess of theabsorption in molecular bands implies that even at the maximum brightness stellar photospheres
Living Reviews in Solar Physicshttp://www.livingreviews.org/lrsp-2005-8
Starspots: A Key to the Stellar Dynamo 27
Figure 7: Spot temperature contrast with respect to the photospheric temperature in active giants(squares) and dwarfs (circles). Thin lines connect symbols referring to the same star. The thicksolid line is a second order polynomial fit to the data excluding EK Dra. Dots in circles indicatesolar umbra (∆T = 1700 K) and penumbra (∆T = 750 K) (based on data in Table 5).
have a substantial spot occupancy. Note, however, that molecular band modelling is rather sensitiveto the assumed photosphere temperature and chemical composition as well as to Doppler shiftsaccross the spots which may affect the spot filling factor (Berdyugina, 2002; O’Neal et al., 2004).
Large spot areas and spot temperature contrasts recovered on active stars suggest that pho-tometric and spectroscopic variability of these stars is dominated by the starspot umbra. Lowtemperature contrast of spots and small spot filling factors in M dwarfs, as well as contradictoryresults for EK Dra obtained by different methods, can be due to a decreasing of individual spotsizes and, thus, increasing relative contribution from the spot penumbra. For instance, the spotcontrast obtained from Doppler imaging and light-curve modelling for EK Dra corresponds to thetemperature contrast of the sunspot penumbra. Accordingly, we should expect that active lateF-type stars possess spots with dominating penumbra and, thus, show lower contrast spots. Asin the case of EK Dra, observations in molecular bands are more reliable for detection of starspotumbra.
5.2 Magnetic field
Direct measurements of magnetic fields on the surfaces of cool stars are very difficult. The netcircular polarisation of the Sun as a star would be hardly observable with the present observationaltools, as the mean magnetic field of the Sun peaks at maximum 8 G.
The ZDI technique (Section 4.3) is an excellent tool for detecting surface magnetic fields. Donatiet al. (1999) combined Stokes V of more than thousand lines and obtained a time sequence of meanV profiles which shows clear rotational modulation, as magnetic structures are carried across thevisible hemisphere of the star. This technique is useful for rapidly rotating stars as the rotationdisentangles surface magnetic structures with opposite polarities, reducing polarisation cancellation
Living Reviews in Solar Physicshttp://www.livingreviews.org/lrsp-2005-8
28 Svetlana V. Berdyugina
(see Figure 3). On slower rotators the ZDI technique can only reveal large-scale unipolar magneticfields. It has been intensively used for studying three stars: young dwarfs AB Dor and LQ Hya andRS CVn star HR1099 (Donati et al., 2003b, and references therein). An example of the spot andmagnetic field distribution obtained with the ZDI technique is shown in Figure 4. The commonfeature of reconstructions for the three stars is that the magnetic field distribution does not coincidewith the darkest spots in the temperature images. The radial field component reveals large mid-latitude regions of mixed polarity, while the azimuthal component appears as almost axisymmetricrings of opposite polarities at higher and lower latitudes. Donati et al. (2003b) interpreted sucha field distribution as an indication of large-scale poloidal and toroidal field components on thestellar surface and the underlying dynamo processes distributed throughout the entire convectionzone. It was, however, argued by Solanki (2002) that the rings of the azimuthal field may representlarge penumbral regions with a predominantly horizontal magnetic field.
Most of our current knowledge about magnetic fields on cool stars and in starspots is, how-ever, based on Zeeman broadening measurements, which reveal the distribution of magnetic fieldstrengths with little dependence on the unknown field geometry (Robinson Jr, 1980; Saar, 1988;Valenti and Johns-Krull, 2001). Zeeman broadening is best measured for slowly rotating stars, incontrast to ZDI. Reliable measurements require Zeeman splitting larger than, or comparable to,line widths in the absence of the field. Zeeman splitting is proportional to the field strength B andeffective Lande factor geff as
∆λ ∝ λ2geffB. (8)
It is also proportional to the square of the wavelength. For this reason, successful measurementsof magnetic field strengths can be carried out using red or IR lines with large geff . Also, only starswith strong magnetic fields and large field areas can be studied with this technique.
In order to derive magnetic field strength B and filling factor f , observed line profiles are fittedby the sum of synthetic spectra for magnetic and non-magnetic regions (Saar, 1994; Valenti andJohns-Krull, 2001):
Fλ = (1− f)Fλ(B = 0) + f Fλ(B 6= 0). (9)
Such an analysis implicitly assumes that (i) the field is concentrated into flux tubes surroundedby field free regions; (ii) flux tubes are oriented radially in the photosphere; (iii) magnetic regionsare distributed uniformly over the surface; (iv) magnetic regions are characterised by a single fieldstrength, and (v) the temperature structure is the same for magnetic and non-magnetic atmosphere(Valenti and Johns-Krull, 2001). In this approach, the field strength being determined from thesplitting is usually well constrained, but the filling factor depends on the unknown temperaturestructure of magnetic regions. In the case when the used spectral line becomes stronger in starspots,the filling factor can be overestimated, and vice versa. Ruedi et al. (1997) concluded that magneticfield strength and filling factor cannot be determined separately for moderately active stars withoptical spectra of spectral resolution less than 100 000 and S/N≤250.
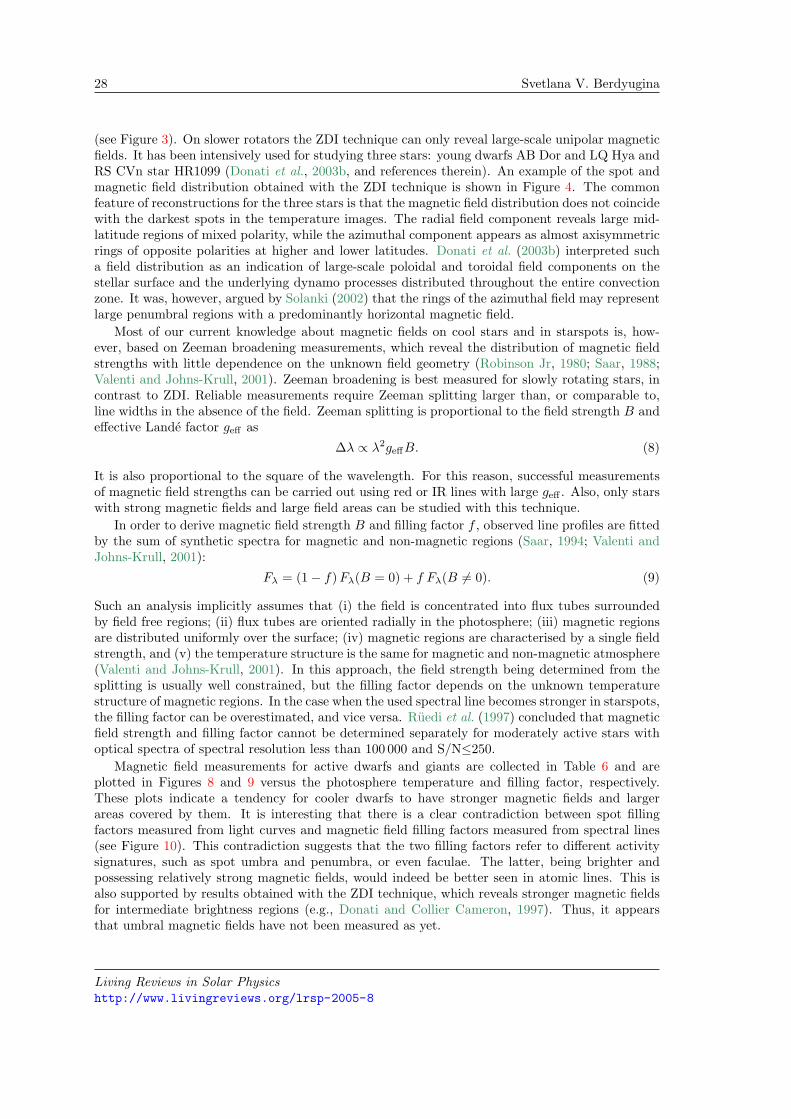
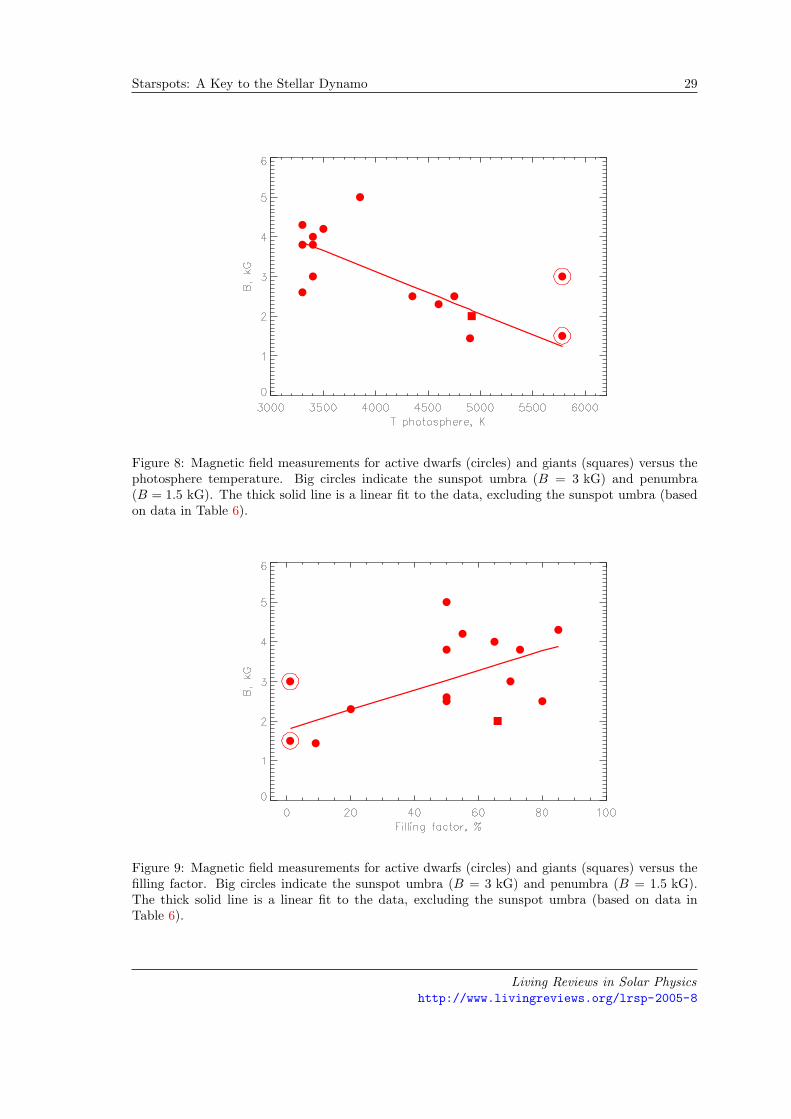
Magnetic field measurements for active dwarfs and giants are collected in Table 6 and areplotted in Figures 8 and 9 versus the photosphere temperature and filling factor, respectively.These plots indicate a tendency for cooler dwarfs to have stronger magnetic fields and largerareas covered by them. It is interesting that there is a clear contradiction between spot fillingfactors measured from light curves and magnetic field filling factors measured from spectral lines(see Figure 10). This contradiction suggests that the two filling factors refer to different activitysignatures, such as spot umbra and penumbra, or even faculae. The latter, being brighter andpossessing relatively strong magnetic fields, would indeed be better seen in atomic lines. This isalso supported by results obtained with the ZDI technique, which reveals stronger magnetic fieldsfor intermediate brightness regions (e.g., Donati and Collier Cameron, 1997). Thus, it appearsthat umbral magnetic fields have not been measured as yet.
Living Reviews in Solar Physicshttp://www.livingreviews.org/lrsp-2005-8
Starspots: A Key to the Stellar Dynamo 29
Figure 8: Magnetic field measurements for active dwarfs (circles) and giants (squares) versus thephotosphere temperature. Big circles indicate the sunspot umbra (B = 3 kG) and penumbra(B = 1.5 kG). The thick solid line is a linear fit to the data, excluding the sunspot umbra (basedon data in Table 6).
Figure 9: Magnetic field measurements for active dwarfs (circles) and giants (squares) versus thefilling factor. Big circles indicate the sunspot umbra (B = 3 kG) and penumbra (B = 1.5 kG).The thick solid line is a linear fit to the data, excluding the sunspot umbra (based on data inTable 6).
Living Reviews in Solar Physicshttp://www.livingreviews.org/lrsp-2005-8
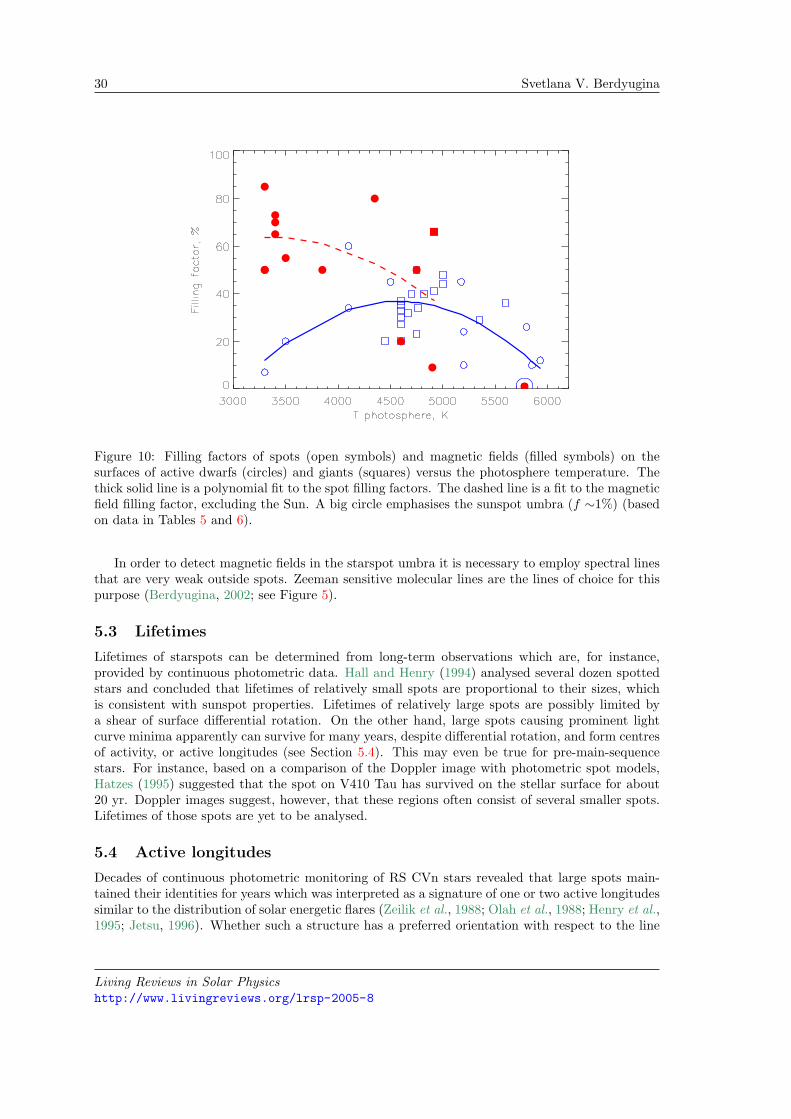
30 Svetlana V. Berdyugina
Figure 10: Filling factors of spots (open symbols) and magnetic fields (filled symbols) on thesurfaces of active dwarfs (circles) and giants (squares) versus the photosphere temperature. Thethick solid line is a polynomial fit to the spot filling factors. The dashed line is a fit to the magneticfield filling factor, excluding the Sun. A big circle emphasises the sunspot umbra (f ∼1%) (basedon data in Tables 5 and 6).
In order to detect magnetic fields in the starspot umbra it is necessary to employ spectral linesthat are very weak outside spots. Zeeman sensitive molecular lines are the lines of choice for thispurpose (Berdyugina, 2002; see Figure 5).
5.3 Lifetimes
Lifetimes of starspots can be determined from long-term observations which are, for instance,provided by continuous photometric data. Hall and Henry (1994) analysed several dozen spottedstars and concluded that lifetimes of relatively small spots are proportional to their sizes, whichis consistent with sunspot properties. Lifetimes of relatively large spots are possibly limited bya shear of surface differential rotation. On the other hand, large spots causing prominent lightcurve minima apparently can survive for many years, despite differential rotation, and form centresof activity, or active longitudes (see Section 5.4). This may even be true for pre-main-sequencestars. For instance, based on a comparison of the Doppler image with photometric spot models,Hatzes (1995) suggested that the spot on V410 Tau has survived on the stellar surface for about20 yr. Doppler images suggest, however, that these regions often consist of several smaller spots.Lifetimes of those spots are yet to be analysed.
5.4 Active longitudes
Decades of continuous photometric monitoring of RS CVn stars revealed that large spots main-tained their identities for years which was interpreted as a signature of one or two active longitudessimilar to the distribution of solar energetic flares (Zeilik et al., 1988; Olah et al., 1988; Henry et al.,1995; Jetsu, 1996). Whether such a structure has a preferred orientation with respect to the line
Living Reviews in Solar Physicshttp://www.livingreviews.org/lrsp-2005-8
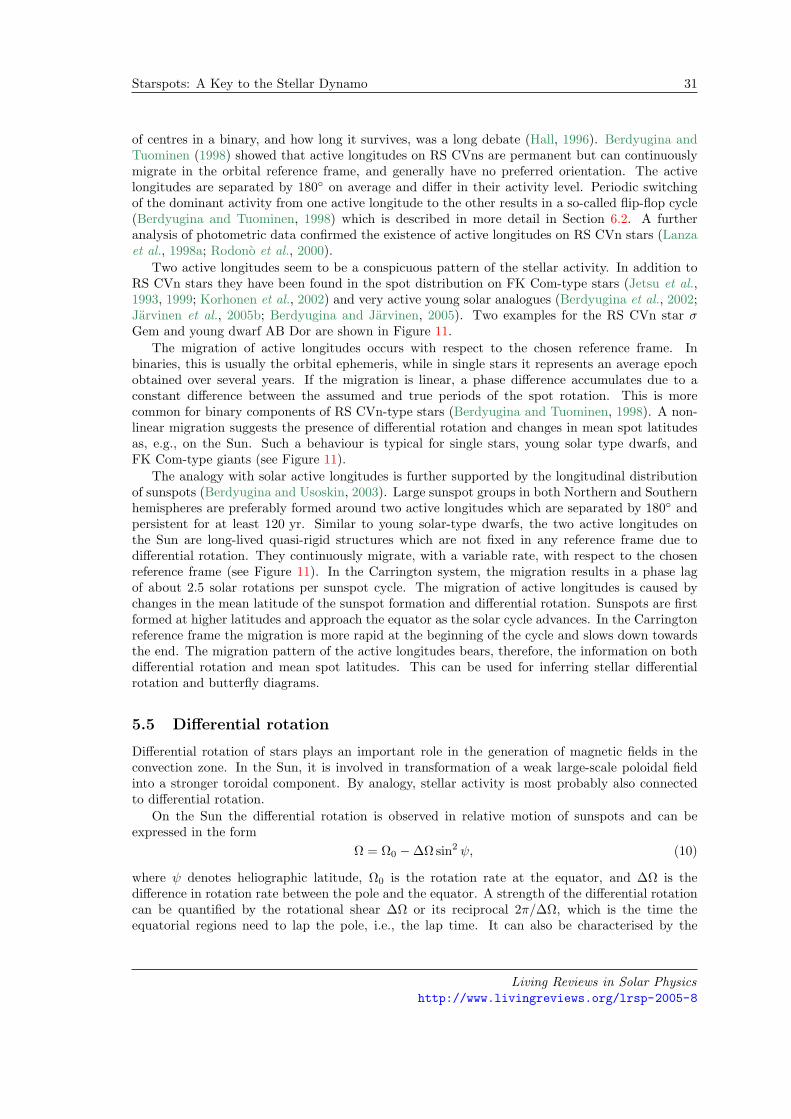
Starspots: A Key to the Stellar Dynamo 31
of centres in a binary, and how long it survives, was a long debate (Hall, 1996). Berdyugina andTuominen (1998) showed that active longitudes on RS CVns are permanent but can continuouslymigrate in the orbital reference frame, and generally have no preferred orientation. The activelongitudes are separated by 180 on average and differ in their activity level. Periodic switchingof the dominant activity from one active longitude to the other results in a so-called flip-flop cycle(Berdyugina and Tuominen, 1998) which is described in more detail in Section 6.2. A furtheranalysis of photometric data confirmed the existence of active longitudes on RS CVn stars (Lanzaet al., 1998a; Rodono et al., 2000).
Two active longitudes seem to be a conspicuous pattern of the stellar activity. In addition toRS CVn stars they have been found in the spot distribution on FK Com-type stars (Jetsu et al.,1993, 1999; Korhonen et al., 2002) and very active young solar analogues (Berdyugina et al., 2002;Jarvinen et al., 2005b; Berdyugina and Jarvinen, 2005). Two examples for the RS CVn star σGem and young dwarf AB Dor are shown in Figure 11.
The migration of active longitudes occurs with respect to the chosen reference frame. Inbinaries, this is usually the orbital ephemeris, while in single stars it represents an average epochobtained over several years. If the migration is linear, a phase difference accumulates due to aconstant difference between the assumed and true periods of the spot rotation. This is morecommon for binary components of RS CVn-type stars (Berdyugina and Tuominen, 1998). A non-linear migration suggests the presence of differential rotation and changes in mean spot latitudesas, e.g., on the Sun. Such a behaviour is typical for single stars, young solar type dwarfs, andFK Com-type giants (see Figure 11).
The analogy with solar active longitudes is further supported by the longitudinal distributionof sunspots (Berdyugina and Usoskin, 2003). Large sunspot groups in both Northern and Southernhemispheres are preferably formed around two active longitudes which are separated by 180 andpersistent for at least 120 yr. Similar to young solar-type dwarfs, the two active longitudes onthe Sun are long-lived quasi-rigid structures which are not fixed in any reference frame due todifferential rotation. They continuously migrate, with a variable rate, with respect to the chosenreference frame (see Figure 11). In the Carrington system, the migration results in a phase lagof about 2.5 solar rotations per sunspot cycle. The migration of active longitudes is caused bychanges in the mean latitude of the sunspot formation and differential rotation. Sunspots are firstformed at higher latitudes and approach the equator as the solar cycle advances. In the Carringtonreference frame the migration is more rapid at the beginning of the cycle and slows down towardsthe end. The migration pattern of the active longitudes bears, therefore, the information on bothdifferential rotation and mean spot latitudes. This can be used for inferring stellar differentialrotation and butterfly diagrams.
5.5 Differential rotation
Differential rotation of stars plays an important role in the generation of magnetic fields in theconvection zone. In the Sun, it is involved in transformation of a weak large-scale poloidal fieldinto a stronger toroidal component. By analogy, stellar activity is most probably also connectedto differential rotation.
On the Sun the differential rotation is observed in relative motion of sunspots and can beexpressed in the form
Ω = Ω0 −∆Ω sin2 ψ, (10)
where ψ denotes heliographic latitude, Ω0 is the rotation rate at the equator, and ∆Ω is thedifference in rotation rate between the pole and the equator. A strength of the differential rotationcan be quantified by the rotational shear ∆Ω or its reciprocal 2π/∆Ω, which is the time theequatorial regions need to lap the pole, i.e., the lap time. It can also be characterised by the
Living Reviews in Solar Physicshttp://www.livingreviews.org/lrsp-2005-8
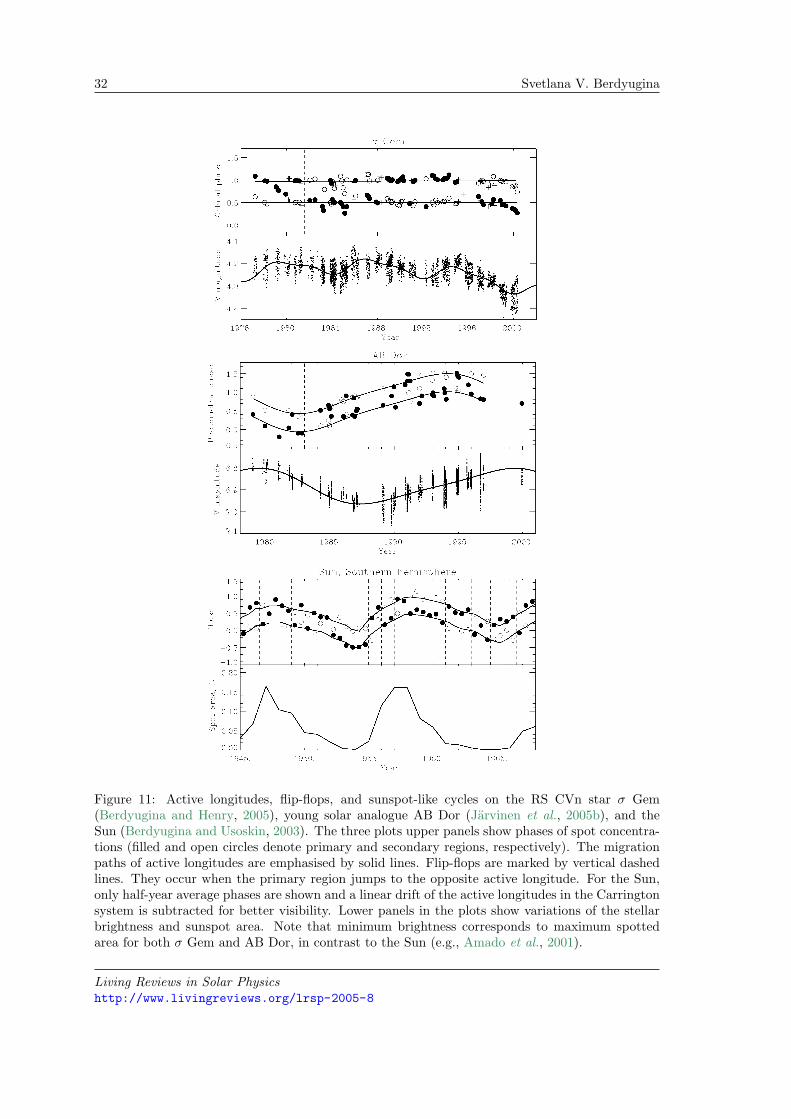
32 Svetlana V. Berdyugina
Figure 11: Active longitudes, flip-flops, and sunspot-like cycles on the RS CVn star σ Gem(Berdyugina and Henry, 2005), young solar analogue AB Dor (Jarvinen et al., 2005b), and theSun (Berdyugina and Usoskin, 2003). The three plots upper panels show phases of spot concentra-tions (filled and open circles denote primary and secondary regions, respectively). The migrationpaths of active longitudes are emphasised by solid lines. Flip-flops are marked by vertical dashedlines. They occur when the primary region jumps to the opposite active longitude. For the Sun,only half-year average phases are shown and a linear drift of the active longitudes in the Carringtonsystem is subtracted for better visibility. Lower panels in the plots show variations of the stellarbrightness and sunspot area. Note that minimum brightness corresponds to maximum spottedarea for both σ Gem and AB Dor, in contrast to the Sun (e.g., Amado et al., 2001).
Living Reviews in Solar Physicshttp://www.livingreviews.org/lrsp-2005-8
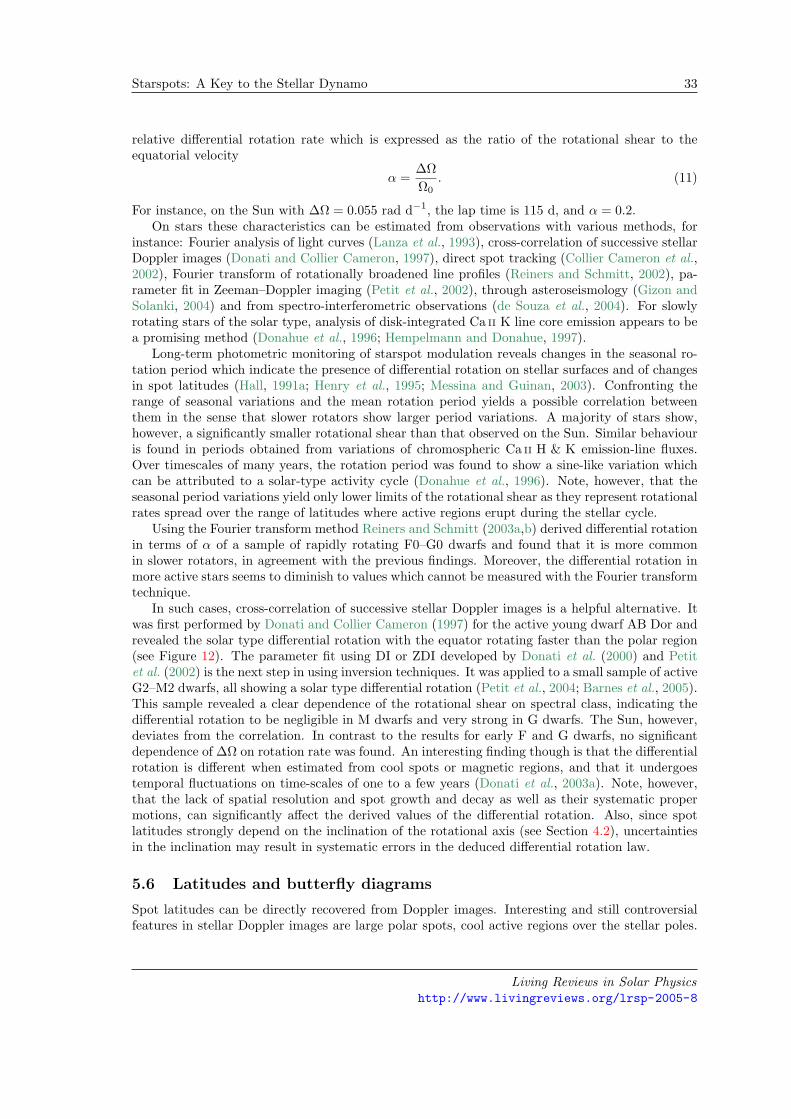
Starspots: A Key to the Stellar Dynamo 33
relative differential rotation rate which is expressed as the ratio of the rotational shear to theequatorial velocity
α =∆ΩΩ0
. (11)
For instance, on the Sun with ∆Ω = 0.055 rad d−1, the lap time is 115 d, and α = 0.2.On stars these characteristics can be estimated from observations with various methods, for
instance: Fourier analysis of light curves (Lanza et al., 1993), cross-correlation of successive stellarDoppler images (Donati and Collier Cameron, 1997), direct spot tracking (Collier Cameron et al.,2002), Fourier transform of rotationally broadened line profiles (Reiners and Schmitt, 2002), pa-rameter fit in Zeeman–Doppler imaging (Petit et al., 2002), through asteroseismology (Gizon andSolanki, 2004) and from spectro-interferometric observations (de Souza et al., 2004). For slowlyrotating stars of the solar type, analysis of disk-integrated Ca II K line core emission appears to bea promising method (Donahue et al., 1996; Hempelmann and Donahue, 1997).
Long-term photometric monitoring of starspot modulation reveals changes in the seasonal ro-tation period which indicate the presence of differential rotation on stellar surfaces and of changesin spot latitudes (Hall, 1991a; Henry et al., 1995; Messina and Guinan, 2003). Confronting therange of seasonal variations and the mean rotation period yields a possible correlation betweenthem in the sense that slower rotators show larger period variations. A majority of stars show,however, a significantly smaller rotational shear than that observed on the Sun. Similar behaviouris found in periods obtained from variations of chromospheric Ca II H & K emission-line fluxes.Over timescales of many years, the rotation period was found to show a sine-like variation whichcan be attributed to a solar-type activity cycle (Donahue et al., 1996). Note, however, that theseasonal period variations yield only lower limits of the rotational shear as they represent rotationalrates spread over the range of latitudes where active regions erupt during the stellar cycle.
Using the Fourier transform method Reiners and Schmitt (2003a,b) derived differential rotationin terms of α of a sample of rapidly rotating F0–G0 dwarfs and found that it is more commonin slower rotators, in agreement with the previous findings. Moreover, the differential rotation inmore active stars seems to diminish to values which cannot be measured with the Fourier transformtechnique.
In such cases, cross-correlation of successive stellar Doppler images is a helpful alternative. Itwas first performed by Donati and Collier Cameron (1997) for the active young dwarf AB Dor andrevealed the solar type differential rotation with the equator rotating faster than the polar region(see Figure 12). The parameter fit using DI or ZDI developed by Donati et al. (2000) and Petitet al. (2002) is the next step in using inversion techniques. It was applied to a small sample of activeG2–M2 dwarfs, all showing a solar type differential rotation (Petit et al., 2004; Barnes et al., 2005).This sample revealed a clear dependence of the rotational shear on spectral class, indicating thedifferential rotation to be negligible in M dwarfs and very strong in G dwarfs. The Sun, however,deviates from the correlation. In contrast to the results for early F and G dwarfs, no significantdependence of ∆Ω on rotation rate was found. An interesting finding though is that the differentialrotation is different when estimated from cool spots or magnetic regions, and that it undergoestemporal fluctuations on time-scales of one to a few years (Donati et al., 2003a). Note, however,that the lack of spatial resolution and spot growth and decay as well as their systematic propermotions, can significantly affect the derived values of the differential rotation. Also, since spotlatitudes strongly depend on the inclination of the rotational axis (see Section 4.2), uncertaintiesin the inclination may result in systematic errors in the deduced differential rotation law.
5.6 Latitudes and butterfly diagrams
Spot latitudes can be directly recovered from Doppler images. Interesting and still controversialfeatures in stellar Doppler images are large polar spots, cool active regions over the stellar poles.
Living Reviews in Solar Physicshttp://www.livingreviews.org/lrsp-2005-8
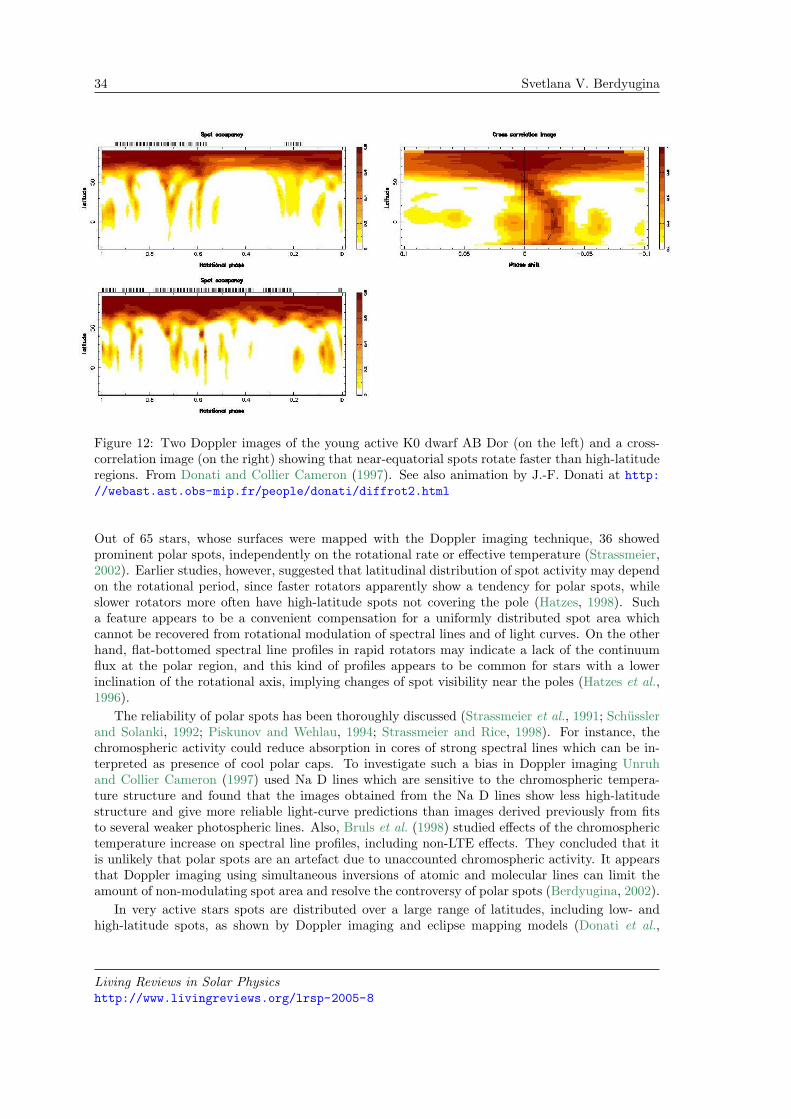
34 Svetlana V. Berdyugina
Figure 12: Two Doppler images of the young active K0 dwarf AB Dor (on the left) and a cross-correlation image (on the right) showing that near-equatorial spots rotate faster than high-latituderegions. From Donati and Collier Cameron (1997). See also animation by J.-F. Donati at http://webast.ast.obs-mip.fr/people/donati/diffrot2.html
Out of 65 stars, whose surfaces were mapped with the Doppler imaging technique, 36 showedprominent polar spots, independently on the rotational rate or effective temperature (Strassmeier,2002). Earlier studies, however, suggested that latitudinal distribution of spot activity may dependon the rotational period, since faster rotators apparently show a tendency for polar spots, whileslower rotators more often have high-latitude spots not covering the pole (Hatzes, 1998). Sucha feature appears to be a convenient compensation for a uniformly distributed spot area whichcannot be recovered from rotational modulation of spectral lines and of light curves. On the otherhand, flat-bottomed spectral line profiles in rapid rotators may indicate a lack of the continuumflux at the polar region, and this kind of profiles appears to be common for stars with a lowerinclination of the rotational axis, implying changes of spot visibility near the poles (Hatzes et al.,1996).
The reliability of polar spots has been thoroughly discussed (Strassmeier et al., 1991; Schusslerand Solanki, 1992; Piskunov and Wehlau, 1994; Strassmeier and Rice, 1998). For instance, thechromospheric activity could reduce absorption in cores of strong spectral lines which can be in-terpreted as presence of cool polar caps. To investigate such a bias in Doppler imaging Unruhand Collier Cameron (1997) used Na D lines which are sensitive to the chromospheric tempera-ture structure and found that the images obtained from the Na D lines show less high-latitudestructure and give more reliable light-curve predictions than images derived previously from fitsto several weaker photospheric lines. Also, Bruls et al. (1998) studied effects of the chromospherictemperature increase on spectral line profiles, including non-LTE effects. They concluded that itis unlikely that polar spots are an artefact due to unaccounted chromospheric activity. It appearsthat Doppler imaging using simultaneous inversions of atomic and molecular lines can limit theamount of non-modulating spot area and resolve the controversy of polar spots (Berdyugina, 2002).
In very active stars spots are distributed over a large range of latitudes, including low- andhigh-latitude spots, as shown by Doppler imaging and eclipse mapping models (Donati et al.,
Living Reviews in Solar Physicshttp://www.livingreviews.org/lrsp-2005-8
Starspots: A Key to the Stellar Dynamo 35
1999; Strassmeier et al., 1999; Berdyugina et al., 1998a, 1999a; Rodono et al., 1995). A long-termDoppler imaging monitoring of the active component of HR 1099 suggests that starspots form atlow or intermediate latitudes and then slowly migrate towards the pole on time scales of a few years(Vogt et al., 1999). Further evidence of poleward spot migration, based on more densely-sampledtime-series imaging, was provided by Strassmeier and Bartus (2000).
The time span of Doppler images for most studied stars is not long enough to see the latitudechanges over the spot cycle, i.e., to recover stellar butterfly diagrams. Light curve modelling offersa longer time scale but spot latitudes obtained from the model are usually not unique and, thus,are less reliable.
A new approach for recovering stellar butterfly diagrams was suggested by Berdyugina (2005).As was emphasised in Section 5.4, phase migration of the active longitudes bears the information onboth differential rotation and mean spot latitudes. Thus, knowing the surface differential rotationand phase migration of active longitudes one can recover mean spot latitudes during the courseof sunspot-like cycles. For young dwarfs the butterfly diagrams are reminiscent of the solar case,although the limited amount of collected results does not yet allow for any conclusions.
Living Reviews in Solar Physicshttp://www.livingreviews.org/lrsp-2005-8
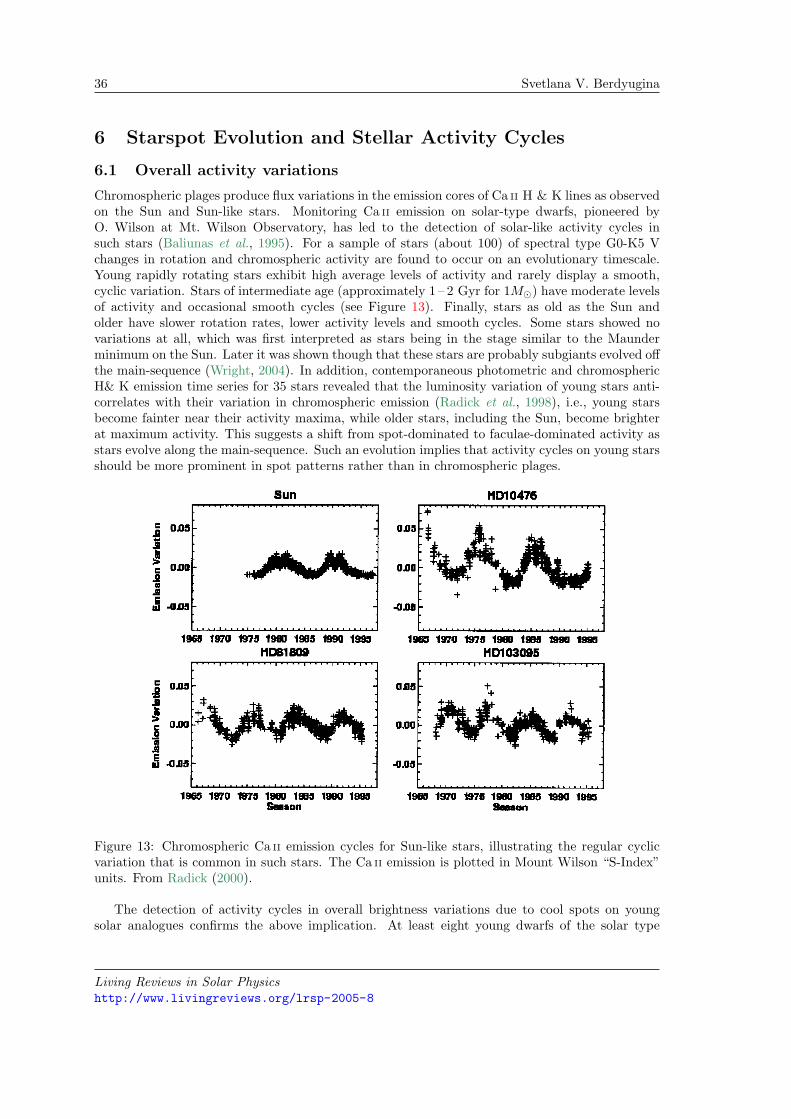
36 Svetlana V. Berdyugina
6 Starspot Evolution and Stellar Activity Cycles
6.1 Overall activity variations
Chromospheric plages produce flux variations in the emission cores of Ca II H & K lines as observedon the Sun and Sun-like stars. Monitoring Ca II emission on solar-type dwarfs, pioneered byO. Wilson at Mt. Wilson Observatory, has led to the detection of solar-like activity cycles insuch stars (Baliunas et al., 1995). For a sample of stars (about 100) of spectral type G0-K5 Vchanges in rotation and chromospheric activity are found to occur on an evolutionary timescale.Young rapidly rotating stars exhibit high average levels of activity and rarely display a smooth,cyclic variation. Stars of intermediate age (approximately 1 – 2 Gyr for 1M) have moderate levelsof activity and occasional smooth cycles (see Figure 13). Finally, stars as old as the Sun andolder have slower rotation rates, lower activity levels and smooth cycles. Some stars showed novariations at all, which was first interpreted as stars being in the stage similar to the Maunderminimum on the Sun. Later it was shown though that these stars are probably subgiants evolved offthe main-sequence (Wright, 2004). In addition, contemporaneous photometric and chromosphericH& K emission time series for 35 stars revealed that the luminosity variation of young stars anti-correlates with their variation in chromospheric emission (Radick et al., 1998), i.e., young starsbecome fainter near their activity maxima, while older stars, including the Sun, become brighterat maximum activity. This suggests a shift from spot-dominated to faculae-dominated activity asstars evolve along the main-sequence. Such an evolution implies that activity cycles on young starsshould be more prominent in spot patterns rather than in chromospheric plages.
Figure 13: Chromospheric Ca II emission cycles for Sun-like stars, illustrating the regular cyclicvariation that is common in such stars. The Ca II emission is plotted in Mount Wilson “S-Index”units. From Radick (2000).
The detection of activity cycles in overall brightness variations due to cool spots on youngsolar analogues confirms the above implication. At least eight young dwarfs of the solar type
Living Reviews in Solar Physicshttp://www.livingreviews.org/lrsp-2005-8
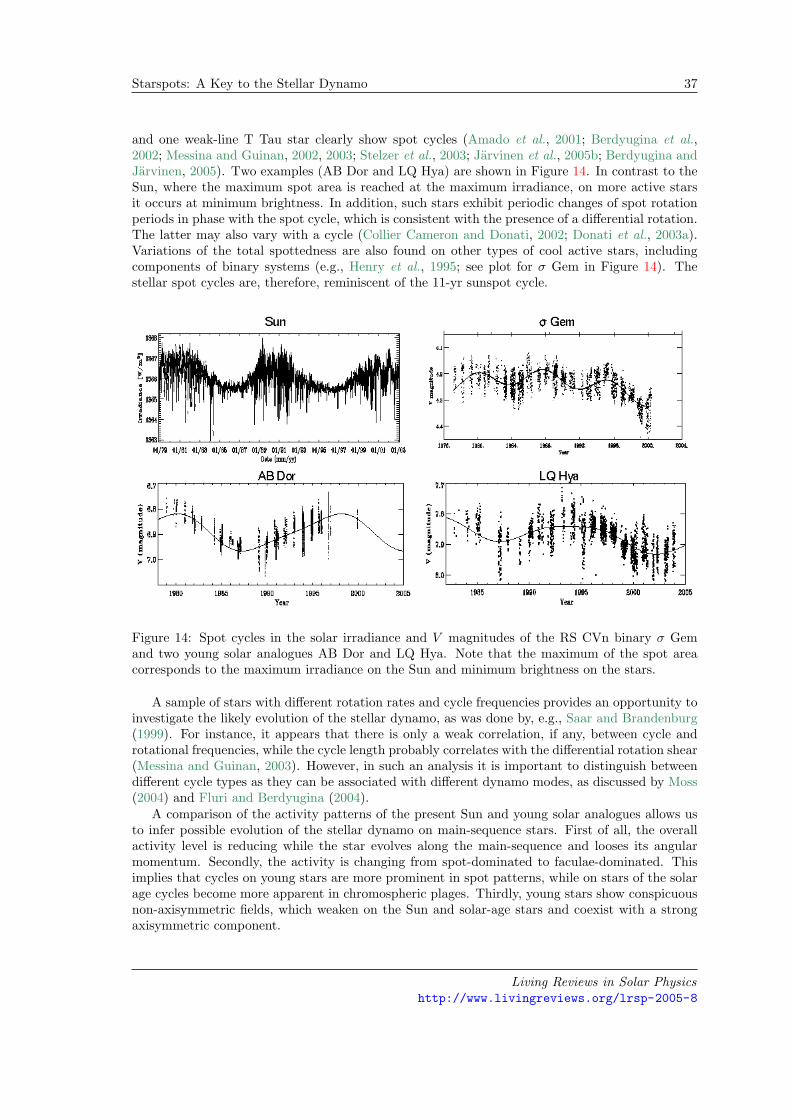
Starspots: A Key to the Stellar Dynamo 37
and one weak-line T Tau star clearly show spot cycles (Amado et al., 2001; Berdyugina et al.,2002; Messina and Guinan, 2002, 2003; Stelzer et al., 2003; Jarvinen et al., 2005b; Berdyugina andJarvinen, 2005). Two examples (AB Dor and LQ Hya) are shown in Figure 14. In contrast to theSun, where the maximum spot area is reached at the maximum irradiance, on more active starsit occurs at minimum brightness. In addition, such stars exhibit periodic changes of spot rotationperiods in phase with the spot cycle, which is consistent with the presence of a differential rotation.The latter may also vary with a cycle (Collier Cameron and Donati, 2002; Donati et al., 2003a).Variations of the total spottedness are also found on other types of cool active stars, includingcomponents of binary systems (e.g., Henry et al., 1995; see plot for σ Gem in Figure 14). Thestellar spot cycles are, therefore, reminiscent of the 11-yr sunspot cycle.
Figure 14: Spot cycles in the solar irradiance and V magnitudes of the RS CVn binary σ Gemand two young solar analogues AB Dor and LQ Hya. Note that the maximum of the spot areacorresponds to the maximum irradiance on the Sun and minimum brightness on the stars.
A sample of stars with different rotation rates and cycle frequencies provides an opportunity toinvestigate the likely evolution of the stellar dynamo, as was done by, e.g., Saar and Brandenburg(1999). For instance, it appears that there is only a weak correlation, if any, between cycle androtational frequencies, while the cycle length probably correlates with the differential rotation shear(Messina and Guinan, 2003). However, in such an analysis it is important to distinguish betweendifferent cycle types as they can be associated with different dynamo modes, as discussed by Moss(2004) and Fluri and Berdyugina (2004).
A comparison of the activity patterns of the present Sun and young solar analogues allows usto infer possible evolution of the stellar dynamo on main-sequence stars. First of all, the overallactivity level is reducing while the star evolves along the main-sequence and looses its angularmomentum. Secondly, the activity is changing from spot-dominated to faculae-dominated. Thisimplies that cycles on young stars are more prominent in spot patterns, while on stars of the solarage cycles become more apparent in chromospheric plages. Thirdly, young stars show conspicuousnon-axisymmetric fields, which weaken on the Sun and solar-age stars and coexist with a strongaxisymmetric component.
Living Reviews in Solar Physicshttp://www.livingreviews.org/lrsp-2005-8
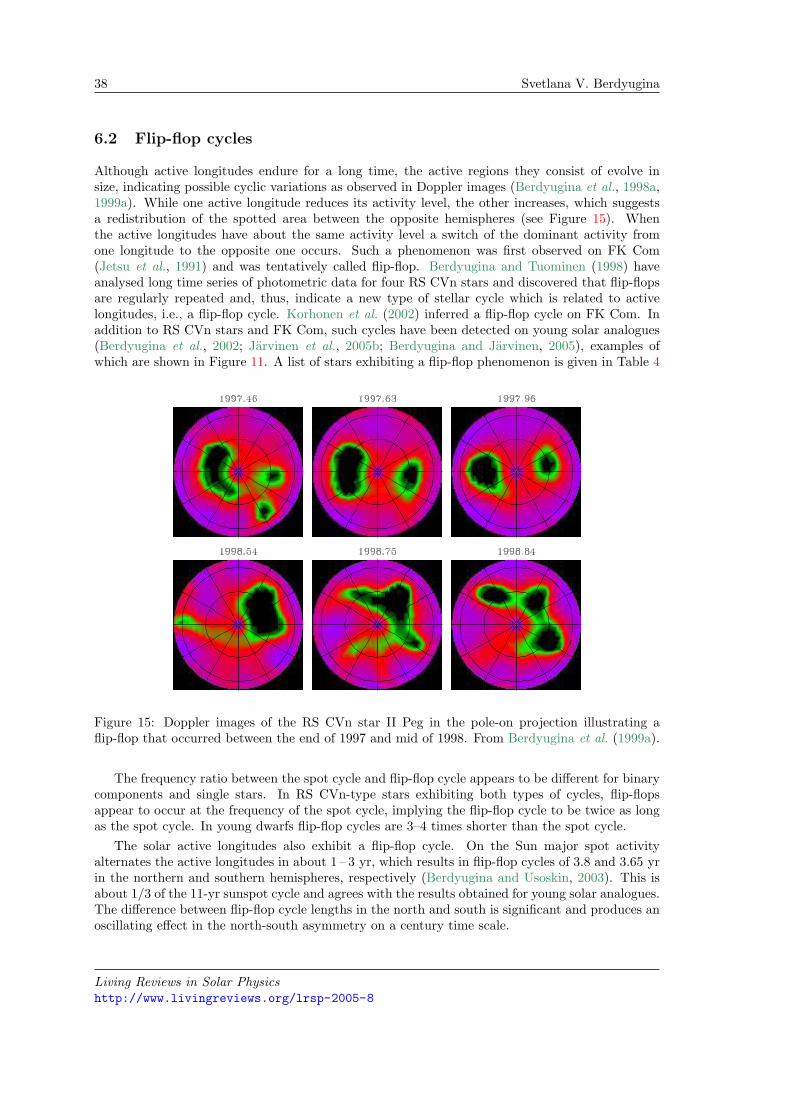
38 Svetlana V. Berdyugina
6.2 Flip-flop cycles
Although active longitudes endure for a long time, the active regions they consist of evolve insize, indicating possible cyclic variations as observed in Doppler images (Berdyugina et al., 1998a,1999a). While one active longitude reduces its activity level, the other increases, which suggestsa redistribution of the spotted area between the opposite hemispheres (see Figure 15). Whenthe active longitudes have about the same activity level a switch of the dominant activity fromone longitude to the opposite one occurs. Such a phenomenon was first observed on FK Com(Jetsu et al., 1991) and was tentatively called flip-flop. Berdyugina and Tuominen (1998) haveanalysed long time series of photometric data for four RS CVn stars and discovered that flip-flopsare regularly repeated and, thus, indicate a new type of stellar cycle which is related to activelongitudes, i.e., a flip-flop cycle. Korhonen et al. (2002) inferred a flip-flop cycle on FK Com. Inaddition to RS CVn stars and FK Com, such cycles have been detected on young solar analogues(Berdyugina et al., 2002; Jarvinen et al., 2005b; Berdyugina and Jarvinen, 2005), examples ofwhich are shown in Figure 11. A list of stars exhibiting a flip-flop phenomenon is given in Table 4
Figure 15: Doppler images of the RS CVn star II Peg in the pole-on projection illustrating aflip-flop that occurred between the end of 1997 and mid of 1998. From Berdyugina et al. (1999a).
The frequency ratio between the spot cycle and flip-flop cycle appears to be different for binarycomponents and single stars. In RS CVn-type stars exhibiting both types of cycles, flip-flopsappear to occur at the frequency of the spot cycle, implying the flip-flop cycle to be twice as longas the spot cycle. In young dwarfs flip-flop cycles are 3–4 times shorter than the spot cycle.
The solar active longitudes also exhibit a flip-flop cycle. On the Sun major spot activityalternates the active longitudes in about 1 – 3 yr, which results in flip-flop cycles of 3.8 and 3.65 yrin the northern and southern hemispheres, respectively (Berdyugina and Usoskin, 2003). This isabout 1/3 of the 11-yr sunspot cycle and agrees with the results obtained for young solar analogues.The difference between flip-flop cycle lengths in the north and south is significant and produces anoscillating effect in the north-south asymmetry on a century time scale.
Living Reviews in Solar Physicshttp://www.livingreviews.org/lrsp-2005-8
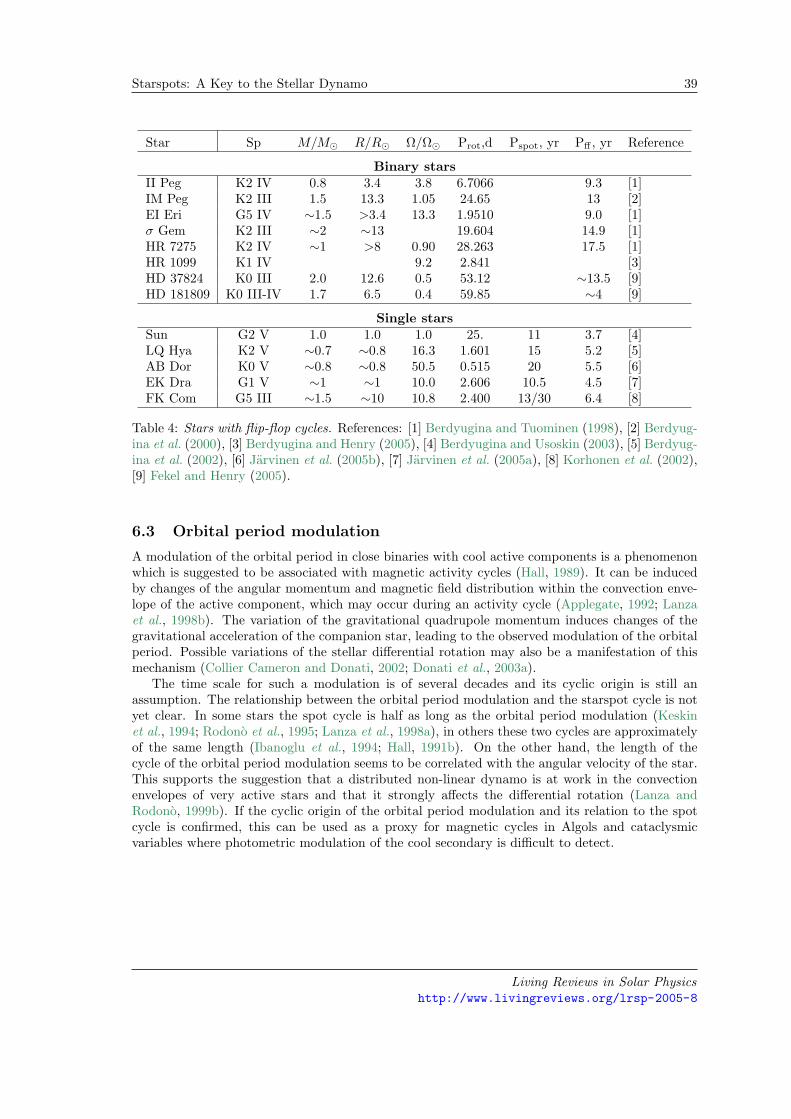
Starspots: A Key to the Stellar Dynamo 39
Star Sp M/M R/R Ω/Ω Prot,d Pspot, yr Pff , yr Reference
Binary starsII Peg K2 IV 0.8 3.4 3.8 6.7066 9.3 [1]IM Peg K2 III 1.5 13.3 1.05 24.65 13 [2]EI Eri G5 IV ∼1.5 >3.4 13.3 1.9510 9.0 [1]σ Gem K2 III ∼2 ∼13 19.604 14.9 [1]HR 7275 K2 IV ∼1 >8 0.90 28.263 17.5 [1]HR 1099 K1 IV 9.2 2.841 [3]HD 37824 K0 III 2.0 12.6 0.5 53.12 ∼13.5 [9]HD 181809 K0 III-IV 1.7 6.5 0.4 59.85 ∼4 [9]
Single starsSun G2 V 1.0 1.0 1.0 25. 11 3.7 [4]LQ Hya K2 V ∼0.7 ∼0.8 16.3 1.601 15 5.2 [5]AB Dor K0 V ∼0.8 ∼0.8 50.5 0.515 20 5.5 [6]EK Dra G1 V ∼1 ∼1 10.0 2.606 10.5 4.5 [7]FK Com G5 III ∼1.5 ∼10 10.8 2.400 13/30 6.4 [8]
Table 4: Stars with flip-flop cycles. References: [1] Berdyugina and Tuominen (1998), [2] Berdyug-ina et al. (2000), [3] Berdyugina and Henry (2005), [4] Berdyugina and Usoskin (2003), [5] Berdyug-ina et al. (2002), [6] Jarvinen et al. (2005b), [7] Jarvinen et al. (2005a), [8] Korhonen et al. (2002),[9] Fekel and Henry (2005).
6.3 Orbital period modulation
A modulation of the orbital period in close binaries with cool active components is a phenomenonwhich is suggested to be associated with magnetic activity cycles (Hall, 1989). It can be inducedby changes of the angular momentum and magnetic field distribution within the convection enve-lope of the active component, which may occur during an activity cycle (Applegate, 1992; Lanzaet al., 1998b). The variation of the gravitational quadrupole momentum induces changes of thegravitational acceleration of the companion star, leading to the observed modulation of the orbitalperiod. Possible variations of the stellar differential rotation may also be a manifestation of thismechanism (Collier Cameron and Donati, 2002; Donati et al., 2003a).
The time scale for such a modulation is of several decades and its cyclic origin is still anassumption. The relationship between the orbital period modulation and the starspot cycle is notyet clear. In some stars the spot cycle is half as long as the orbital period modulation (Keskinet al., 1994; Rodono et al., 1995; Lanza et al., 1998a), in others these two cycles are approximatelyof the same length (Ibanoglu et al., 1994; Hall, 1991b). On the other hand, the length of thecycle of the orbital period modulation seems to be correlated with the angular velocity of the star.This supports the suggestion that a distributed non-linear dynamo is at work in the convectionenvelopes of very active stars and that it strongly affects the differential rotation (Lanza andRodono, 1999b). If the cyclic origin of the orbital period modulation and its relation to the spotcycle is confirmed, this can be used as a proxy for magnetic cycles in Algols and cataclysmicvariables where photometric modulation of the cool secondary is difficult to detect.
Living Reviews in Solar Physicshttp://www.livingreviews.org/lrsp-2005-8
40 Svetlana V. Berdyugina
7 Theoretical Models
7.1 Dynamo models
Mean field dynamo models assume a dynamo action which is extended over the entire convectionenvelope. In the Sun, a shell dynamo based on the αΩ mechanism seems to be able to explainthe main features of the 11-yr cycle. However, in the most active stars it is difficult to reproducethe observed latitudinal range of starspots with the thin-shell dynamo models. It appears that inaddition to a solar-like dynamo, probably working in the overshoot zone, a distributed α2Ω dynamois likely to be present in very active stars (Brandenburg et al., 1989; Moss et al., 1995). Such adistributed dynamo is able to explain, at least qualitatively, a threshold for light modulation, activelongitudes and flip-flops (see below). Also, it is a good candidate for explaining the observed orbitalperiod modulation in active close binaries (Lanza et al., 1998b).
The geometry and behaviour of solar and stellar magnetic fields are globally determined by thestability of dynamo modes with different symmetry (Brandenburg et al., 1989). For instance, thesunspot cycle can be explained by an axisymmetric mean-field dynamo mode of A0 type, which isantisymmetric with respect to the equator (dipole-like). Similarly, spot cycles in other stars canbe also associated with an axisymmetric mode of S0 type which is symmetric with respect to theequator (quadrupole-like).
Persistent active longitudes separated by 180 on the Sun and cool active stars clearly indicatethe presence of non-axisymmetric dynamo modes. They can be either symmetric with respect tothe equatorial plane, e. g., a dipole-like S1 mode (Moss et al., 1991, 1995), or antisymmetric suchas a quadrupole-like A1 mode (Tuominen et al., 2002). The magnetic field configuration in suchmodes consists of magnetic spots of opposite polarities (active longitudes) 180 apart. It appearsthat such modes can be excited at lower dynamo numbers than axisymmetric modes in the casewhen the differential rotation is not large. The extention of these models to synchronised binariesreveals that the maxima of the mean magnetic field appears to concentrate near the line joiningthe centres of the binary components (Moss and Tuominen, 1997).
Beside the symmetry of the modes, their oscillatory properties are important. The mean-fielddynamo theory favours oscillating axisymmetric modes with a clear cyclic behaviour and signchanges (as in the sunspot cycle), while non-axisymmetric modes appear to be rather steady.
The alternating active longitudes and flip-flop cycles observed on the Sun and other active starsimply, however, the existence of apparently oscillating non-axisymmetric fields. As is suggestedby Berdyugina et al. (2002), perhaps the coexistence of oscillating axisymmetric and steady non-axisymmetric modes results in the appearance of flip-flop cycles. Then, the relative strengthsof the two dynamo modes and the period of the oscillations of the axisymmetric mode shoulddefine the amplitudes and lengths of observed cycles. The possibility of such a mechanism wasfirst demonstrated by the mean-field dynamo calculation of Moss (2004) who obtained a stablesolution with an oscillating S0 type mode and a steady, mixed-polarity non-axisymmetric mode.In this case flip-flops are quasi-periodic and as frequent as sign changes of the S0 mode, which isreminiscent of the behaviour observed in some RS CVn stars. A similar mechanism involving anoscillating A0 mode and a steady S1 mode is discussed by Fluri and Berdyugina (2004).
More frequent flip-flops, compared to the sunspot-like cycle in single stars and the Sun, suggesta more complex field configuration. As shown by Fluri and Berdyugina (2004) flip-flops could alsooccur due to alternation of relative strengths of non-axisymmetric S1 and A1 modes without signchanges of any involved modes. If in addition a co-existing axisymmetric mode were changing itssign with a different frequency, it would result in the behaviour observed in solar-type stars. Thestability of such a solution should however be tested by dynamo calculations.
Differential rotation is a key parameter for stellar dynamos, and a theoretical study of itsdependence on the rotation rate and spectral type is important for interpreting observations.
Living Reviews in Solar Physicshttp://www.livingreviews.org/lrsp-2005-8
Starspots: A Key to the Stellar Dynamo 41
A noticeable progress in such modelling was achieved during the recent decade (Kitchatinov andRudiger, 1995; Rudiger et al., 1998). In particular, the following results are important. Simulationsof global circulation in outer stellar convection zones for spectral classes G2 and K5, rotating at thesame rate, demonstrate that differential rotation for G2 is larger compared to K5 (Kitchatinov andRudiger, 1999). However, as the rotation period decreases, the differential rotation first decreasesas well but starts to increase for the shortest periods. It appears that rapid rotation can explainthe rather strong total surface differential rotation of the observed very young solar-type stars, asit creates an equatorward meridional flow at the stellar surface which accelerates the equatorialrotation (Rudiger and Kuker, 2002). A possibility for stars to have an anti-solar differential rotationwas discussed by Kitchatinov and Rudiger (2004).
The latest developments in the solar and stellar dynamo theory are reviewed by Brandenburgand Dobler (2002) and Rudiger and Hollerbach (2004).
7.2 Flux-tube models
High-latitude spots on very active stars can be explained by non-linear models for flux-tube in-stability (Schussler and Solanki, 1992; Schussler et al., 1996). In a rapid rotator with a dynamooperating near the base of the convection zone, the effect of the Coriolis force makes flux tubesto emerge nearly parallel to the rotation axis, thus producing high-latitude activity even if thedynamo amplifies the field only at low latitudes. Such a model is capable to reproduce the sunspotbehaviour as well (Caligari et al., 1995). In addition to rapid rotation, the depth of the convectionzone, stratification and magnetic field strength play an equally important role in the poleward de-flection of rising flux-tubes. In particular, the size of the stellar core affects the magnetic curvatureforce and the rise time, while gravity determines the strength of the buoyancy force.
Calculations for zero-age main-sequence stars show that for increasing rotation rate the emer-gence pattern shifts to higher latitudes, while an equatorial zone of avoidance grows (Granzer et al.,2000). The concentration to higher latitudes is stronger for stars with lower mass and deeper con-vection zones because of geometrical reasons and the larger rise time. It is remarkable that oncethe Coriolis effect has enforced a nearly axis-parallel rise of the flux tube, further increase of therotation rate has no effect on the emergence latitudes, indicating a saturation effect. Truly polarflux emergence was, however, not found for main-sequence stars. Also, low-latitude activity inrapid rotators cannot be described by such a model. For T Tauri-type stars Granzer et al. (2000)find a different pattern of behaviour. Because of the small size of the stellar core, the unstableflux tubes detach completely from the overshoot layer and rise through the convection zone asfree-floating rings. They can emerge in a broad range of latitudes, almost from pole to equator.
A similar perturbation study of rising flux-tubes have been made for close synchronised binarystars with main-sequence components in order to examine an influence of tidal effects on theformation of observed active longitudes (Holzwarth and Schussler, 2003a, 2003b). It was foundthat although the magnitude of tidal effects is rather small, they nevertheless lead to the formationof clusters of flux tube eruptions at preferred longitudes on opposite sides of the star. The longitudedistribution of the clusters depends on the initial parameters of flux-tubes in the overshoot region,such as magnetic field strength and latitude. This implies that there is no preferred orientationof the active longitudes and agrees with most of the observations. The extention of the model topost-main-sequence stars revealed difficulties in recovering starspot properties frequently observedon evolved binary components (Holzwarth, 2004). This points out an insufficiency of the appliedflux tube model and implies that additional flux transport and possibly amplification mechanismshave to be taken into account.
Note that the flux-tube concept, when applied to heavily spotted stars, implicitly assumes thatlarge starspots represent clusters of smaller, more sunspot-like magnetic structures, to which thethin flux-tube approximation is applicable during most of their rise through the convection zone
Living Reviews in Solar Physicshttp://www.livingreviews.org/lrsp-2005-8

42 Svetlana V. Berdyugina
(Schussler, 2002). Further, such an approach gives only the information about potential emergencelocations. The actual prediction of emergence patterns would require a coupling of the emergencecalculations with a full dynamo model providing the flux distribution as functions of latitude,longitude and time.
Living Reviews in Solar Physicshttp://www.livingreviews.org/lrsp-2005-8
Starspots: A Key to the Stellar Dynamo 43
8 Summary
Cool stars with external convection envelopes exhibit various magnetic phenomena similar to thoseobserved on the Sun. Starspots are the best studied proxy of stellar magnetism and, thus, rep-resent a key tool for understanding the stellar dynamo. A remarkable progress in observationalfacilities and numerical techniques for studying starspots achieved for the last two decades allowsfor a deep insight into the nature of starspots and underlying magnetic fields. In addition to tra-ditional photometric and spectroscopic observations, advanced instrumentation for high-precisionspectropolarimetry and (spectro-)interferometry together with foreseen space missions constitutea powerful arsenal for studying starspots and promise for ground-braking discoveries in stellarmagnetism.
Starspot properties are revealed with the help of various numerical techniques, such as light-curve modelling and inversions, Doppler and Zeeman–Doppler imaging, molecular line diagnostics,asteroseismology, etc. Parallel brightness and colour variations, i.e., the faintest state being ac-companied by the reddest colour, imply that starspots are significantly cooler than the unspottedphotosphere, on average by 500 K to 2000 K. Large variations in brightness, up to 0.6 mag, indi-cate that the spotted areas are huge compared to that of sunspots, up to 30% of the whole stellarsurface. Such large cool spots when passing over stellar disks cause strong line profile distortionsin the spectra of rapidly rotating stars. Analysis of a time series of spectral line profile variationsusing Doppler imaging techniques provides the spot distribution over the visible stellar surface.Doppler images reveal that spots on cool rapidly rotating stars are preferably formed at higherlatitudes, from 30 up to the visible pole, in contrast to sunspots which on average appear atlatitudes below 30. Magnetic field measurements suggest that the large starspots represent activeregions consisting of smaller, mixed polarity spots.
Summarising the discussion on starspot evolution, the following main activity patterns appearto be common on cool active stars, namely components of binary systems, young single dwarfs andsingle rapidly rotating giants:
• total spottedness variations indicating sunspot-like cycles;
• persistent active longitudes 180 apart implying non-axisymmetric magnetic fields;
• switching of dominant activity between active longitudes: flip-flop cycles;
• migration of active longitudes;
• differential rotation and butterfly diagrams;
• orbital period variations in binaries: changes of the distribution of magnetic fields in theconvection envelope.
Non-axisymmetric large-scale magnetic fields are persistent in various types of active starsincluding the Sun. Their continuous longitude migration implies the presence of differential rotationand provides an opportunity for studying stellar butterfly diagrams. Activity cycles revealed invariations of spot and plage area appear to accompany flip-flop cycles, i.e., periodic switchingof dominant activity between opposite longitudes. An analysis of these phenomena can help toidentify underlying dynamo modes.
These activity patterns challenge the current stellar dynamo theory. It appears that non-lineardynamo models can qualitatively explain most of the phenomena, although many parameters ofthe models are not realistic as yet.
Comparing the observed properties of the magnetic field on the Sun and active stars, we canconclude that the activity patterns emphasised above for single stars are also relevant for thesolar case. There appears to be more similar between different types of stars than it was thought
Living Reviews in Solar Physicshttp://www.livingreviews.org/lrsp-2005-8

44 Svetlana V. Berdyugina
previously. Thus, fine details of the stellar dynamo can be deduced by studying the Sun, while itsglobal parameters, on an evolutionary time scale, are provided by a sample of active stars.
Acknowledgements
The support by Swiss National Foundation (grant 200021-103696/1) and Academy of Finland(grant 43039) is acknowledged.
Living Reviews in Solar Physicshttp://www.livingreviews.org/lrsp-2005-8
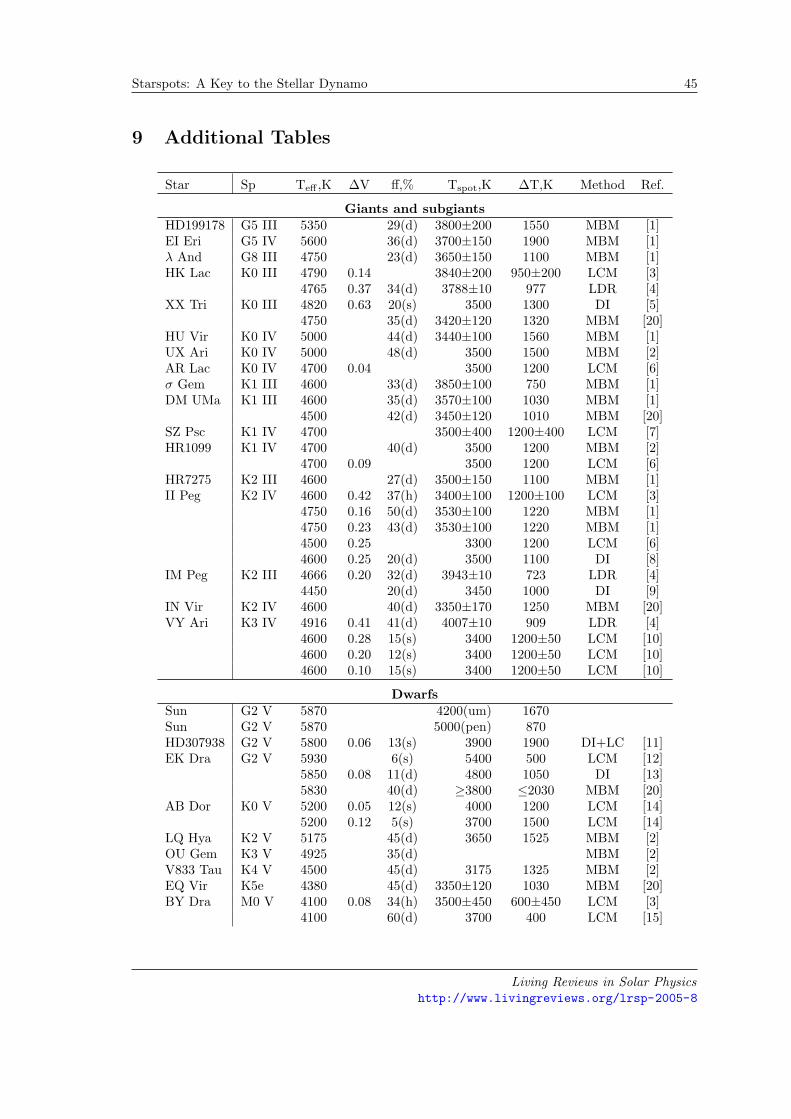
Starspots: A Key to the Stellar Dynamo 45
9 Additional Tables
Star Sp Teff ,K ∆V ff,% Tspot,K ∆T,K Method Ref.
Giants and subgiantsHD199178 G5 III 5350 29(d) 3800±200 1550 MBM [1]EI Eri G5 IV 5600 36(d) 3700±150 1900 MBM [1]λ And G8 III 4750 23(d) 3650±150 1100 MBM [1]HK Lac K0 III 4790 0.14 3840±200 950±200 LCM [3]
4765 0.37 34(d) 3788±10 977 LDR [4]XX Tri K0 III 4820 0.63 20(s) 3500 1300 DI [5]
4750 35(d) 3420±120 1320 MBM [20]HU Vir K0 IV 5000 44(d) 3440±100 1560 MBM [1]UX Ari K0 IV 5000 48(d) 3500 1500 MBM [2]AR Lac K0 IV 4700 0.04 3500 1200 LCM [6]σ Gem K1 III 4600 33(d) 3850±100 750 MBM [1]DM UMa K1 III 4600 35(d) 3570±100 1030 MBM [1]
4500 42(d) 3450±120 1010 MBM [20]SZ Psc K1 IV 4700 3500±400 1200±400 LCM [7]HR1099 K1 IV 4700 40(d) 3500 1200 MBM [2]
4700 0.09 3500 1200 LCM [6]HR7275 K2 III 4600 27(d) 3500±150 1100 MBM [1]II Peg K2 IV 4600 0.42 37(h) 3400±100 1200±100 LCM [3]
4750 0.16 50(d) 3530±100 1220 MBM [1]4750 0.23 43(d) 3530±100 1220 MBM [1]4500 0.25 3300 1200 LCM [6]4600 0.25 20(d) 3500 1100 DI [8]
IM Peg K2 III 4666 0.20 32(d) 3943±10 723 LDR [4]4450 20(d) 3450 1000 DI [9]
IN Vir K2 IV 4600 40(d) 3350±170 1250 MBM [20]VY Ari K3 IV 4916 0.41 41(d) 4007±10 909 LDR [4]
4600 0.28 15(s) 3400 1200±50 LCM [10]4600 0.20 12(s) 3400 1200±50 LCM [10]4600 0.10 15(s) 3400 1200±50 LCM [10]
DwarfsSun G2 V 5870 4200(um) 1670Sun G2 V 5870 5000(pen) 870HD307938 G2 V 5800 0.06 13(s) 3900 1900 DI+LC [11]EK Dra G2 V 5930 6(s) 5400 500 LCM [12]
5850 0.08 11(d) 4800 1050 DI [13]5830 40(d) ≥3800 ≤2030 MBM [20]
AB Dor K0 V 5200 0.05 12(s) 4000 1200 LCM [14]5200 0.12 5(s) 3700 1500 LCM [14]
LQ Hya K2 V 5175 45(d) 3650 1525 MBM [2]OU Gem K3 V 4925 35(d) MBM [2]V833 Tau K4 V 4500 45(d) 3175 1325 MBM [2]EQ Vir K5e 4380 45(d) 3350±120 1030 MBM [20]BY Dra M0 V 4100 0.08 34(h) 3500±450 600±450 LCM [3]
4100 60(d) 3700 400 LCM [15]
Living Reviews in Solar Physicshttp://www.livingreviews.org/lrsp-2005-8
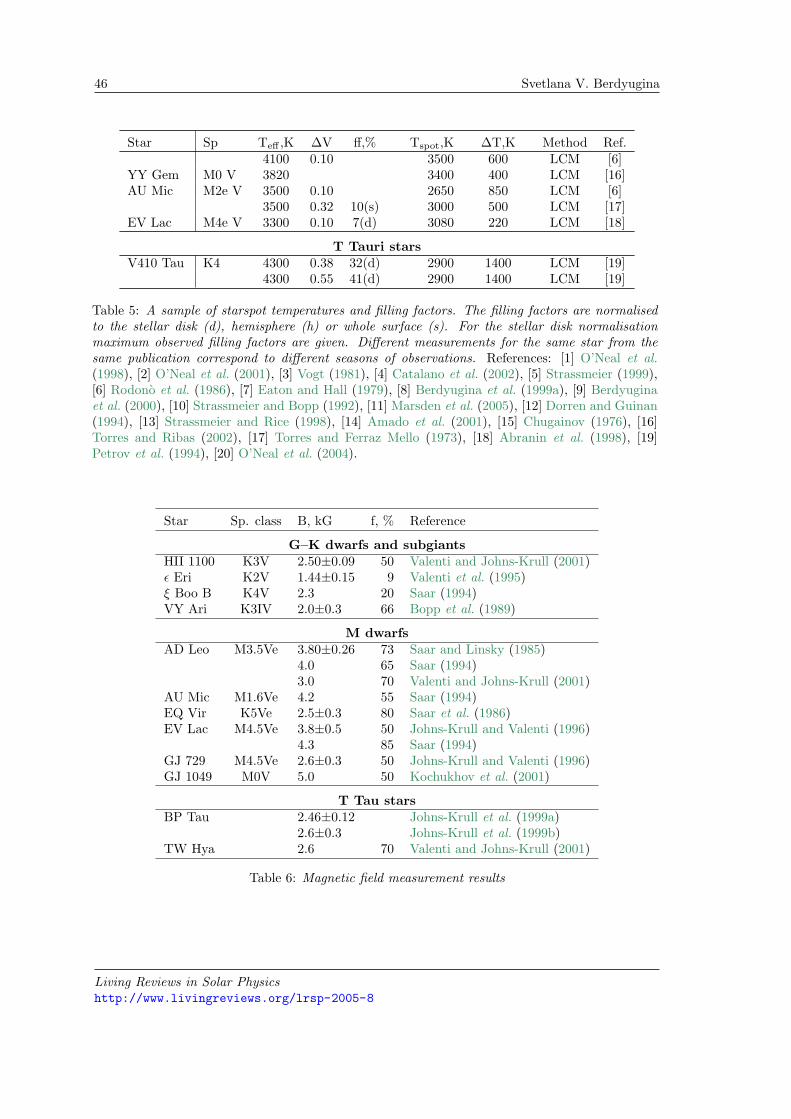
46 Svetlana V. Berdyugina
Star Sp Teff ,K ∆V ff,% Tspot,K ∆T,K Method Ref.4100 0.10 3500 600 LCM [6]
YY Gem M0 V 3820 3400 400 LCM [16]AU Mic M2e V 3500 0.10 2650 850 LCM [6]
3500 0.32 10(s) 3000 500 LCM [17]EV Lac M4e V 3300 0.10 7(d) 3080 220 LCM [18]
T Tauri starsV410 Tau K4 4300 0.38 32(d) 2900 1400 LCM [19]
4300 0.55 41(d) 2900 1400 LCM [19]
Table 5: A sample of starspot temperatures and filling factors. The filling factors are normalisedto the stellar disk (d), hemisphere (h) or whole surface (s). For the stellar disk normalisationmaximum observed filling factors are given. Different measurements for the same star from thesame publication correspond to different seasons of observations. References: [1] O’Neal et al.(1998), [2] O’Neal et al. (2001), [3] Vogt (1981), [4] Catalano et al. (2002), [5] Strassmeier (1999),[6] Rodono et al. (1986), [7] Eaton and Hall (1979), [8] Berdyugina et al. (1999a), [9] Berdyuginaet al. (2000), [10] Strassmeier and Bopp (1992), [11] Marsden et al. (2005), [12] Dorren and Guinan(1994), [13] Strassmeier and Rice (1998), [14] Amado et al. (2001), [15] Chugainov (1976), [16]Torres and Ribas (2002), [17] Torres and Ferraz Mello (1973), [18] Abranin et al. (1998), [19]Petrov et al. (1994), [20] O’Neal et al. (2004).
Star Sp. class B, kG f, % Reference
G–K dwarfs and subgiantsHII 1100 K3V 2.50±0.09 50 Valenti and Johns-Krull (2001)ε Eri K2V 1.44±0.15 9 Valenti et al. (1995)ξ Boo B K4V 2.3 20 Saar (1994)VY Ari K3IV 2.0±0.3 66 Bopp et al. (1989)
M dwarfsAD Leo M3.5Ve 3.80±0.26 73 Saar and Linsky (1985)
4.0 65 Saar (1994)3.0 70 Valenti and Johns-Krull (2001)
AU Mic M1.6Ve 4.2 55 Saar (1994)EQ Vir K5Ve 2.5±0.3 80 Saar et al. (1986)EV Lac M4.5Ve 3.8±0.5 50 Johns-Krull and Valenti (1996)
4.3 85 Saar (1994)GJ 729 M4.5Ve 2.6±0.3 50 Johns-Krull and Valenti (1996)GJ 1049 M0V 5.0 50 Kochukhov et al. (2001)
T Tau starsBP Tau 2.46±0.12 Johns-Krull et al. (1999a)
2.6±0.3 Johns-Krull et al. (1999b)TW Hya 2.6 70 Valenti and Johns-Krull (2001)
Table 6: Magnetic field measurement results
Living Reviews in Solar Physicshttp://www.livingreviews.org/lrsp-2005-8
Starspots: A Key to the Stellar Dynamo 47
References
Abranin, E.P., Alekseev, I.Y., Avgoloupis, S., Bazelyan, L.L., Berdyugina, S.V., Cutispoto, G.,Gershberg, R.E., Larionov, V.M., Leto, G., Lisachenko, V.N., Marino, G., Mavridis, L.N.,Messina, S., Mel’nik, V.N., Pagano, I., Pustil’nik, S.V., Rodono, M., Roizman, G.S., Seiradakis,J.H., Sigal, G.P., Shakhovskaya, N.I., Shakhovskoy, D.N., Shcherbakov, V.A., 1998, “Coordi-nated Observations of the Red Dwarf Flare Star EV LAC in 1994 and 1995”, Astron. Astrophys.Trans., 17, 221–262. 5
Alekseev, I.Y., Gershberg, R.E., 1996, “A model of zonal spottedness for red dwarf stars”, Astron.Zh., 40, 538–545. 4.1
Amado, P.J., Cutispoto, G., Lanza, A.F., Rodono, M., 2001, “AB Doradus: Long and Short TermLight Variations and Spot Parameters”, in Cool Stars, Stellar Systems, and the Sun (11th Cam-bridge Workshop), (Eds.) Garcıa Lopez, R.J., Rebolo, R., Zapaterio Osorio, M.R., Proceedingsof a meeting held at Puerto de la Cruz, Tenerife, Spain, 4–8 October 1999, vol. 223 of ASPConference Series, pp. 895–900, Astronomical Society of the Pacific, San Francisco, U.S.A. 11,6.1, 5
Appenzeller, I., Dearborn, D.S.P., 1984, “Brightness variations caused by surface magnetic fieldsin pre-main-sequence stars”, Astrophys. J., 278, 689–694. 2.3
Appenzeller, I., Fricke, K., Furtig, W., Gassler, W., Hafner, R., Harkl, R., Hess, H.-J., Hummel, W.,Jurgens, P., Kudritzki, R.-P., Mantel, K.-H., Meisl, W., Muschielok, B., Nicklas, H., Rupprecht,G., Seifert, W., Stahl, O., Szeifert, T., Tarantik, K., 1998, “Successful commissioning of FORS1– the First Optical Instrument on the VLT”, Messenger , 94, 1–6. 3.3
Applegate, J.H., 1992, “A mechanism for orbital period modulation in close binaries”, Astrophys.J., 385, 621–629. 6.3
Baliunas, S.L., Donahue, R.A., Soon, W.H., Horne, J.H., Frazer, J., Woodard-Eklund, L., Brad-ford, M., Rao, L.M., Wilson, O.C., Zhang, Q., Bennett, W., Briggs, J., Carroll, S.M., Duncan,D.K., Figueroa, D., Lanning, H.H., Misch, A.A., Mueller, J., Noyes, R.W., Poppe, D., Porter,A.C., Robinson, C.R., Russell, J., Shelton, J.C., Soyumer, T., Vaughan, A.H., Whitney, J.H.,1995, “Chromospheric variations in main-sequence stars. II.”, Astrophys. J., 438, 269–287. 2.2,6.1
Barnes, J.R., Lister, T.A., Hilditch, R.W., Collier Cameron, A., 2004, “High-resolution Dopplerimages of the spotted contact binary AE Phe”, Mon. Not. R. Astron. Soc., 348, 1321–1331. 2.6
Barnes, J.R., Collier Cameron, A., Donati, J.-F., James, D.J., Marsden, S.C., Petit, P., 2005, “Thedependence of differential rotation on temperature and rotation”, Mon. Not. R. Astron. Soc.,357, L1–L5. 5.5
Benedict, G.F., Nelan, E., McArthur, B., Story, D., van Altena, W., Ting-Gao, Y., Jefferys, W.H.,Hemenway, P.D., Shelus, P.J., Whipple, A.L., Franz, O.G., Fredrick, L.W., Duncombe, R.L.,1993, “Periodic low-amplitude variations in the brightness of Proxima Centauri”, Publ. Astron.Soc. Pac., 105, 487–493. 2.2
Berdyugina, S.V., 1998, “Surface imaging by the Occamian approach. Basic principles, simulations,and tests”, Astron. Astrophys., 338, 97–105. 1, 4.2, 4.2
Berdyugina, S.V., 2002, “Sunspot and starspot interiors as seen from molecular lines”, Astron.Nachr., 323, 192–195. 1, 4.4, 5, 5.1, 5.2, 5.6
Living Reviews in Solar Physicshttp://www.livingreviews.org/lrsp-2005-8
48 Svetlana V. Berdyugina
Berdyugina, S.V., 2004, “Non-axisymmetric magnetic fields and flip-flops on the Sun and coolstars”, Solar Phys., 224, 123–131. 1
Berdyugina, S.V., 2005, “Stellar butterfly diagrams”, Astron. Astrophys., in preparation. 5.6
Berdyugina, S.V., Henry, G.W., 2005, “Active longitudes and flip-flops on RS CVn-type stars”,Astrophys. J., in preparation. 11, 4
Berdyugina, S.V., Jarvinen, S.P., 2005, “Spot activity cycles and flip-flops on young solar analogs”,Astron. Nachr., 326, 283–286. 5.4, 6.1, 6.2
Berdyugina, S.V., Solanki, S.K., 2002, “The molecular Zeeman effect and diagnostics of solarand stellar magnetic fields. I. Theoretical spectral patterns in the Zeeman regime”, Astron.Astrophys., 385, 701–715. 4.4
Berdyugina, S.V., Tuominen, I., 1998, “Permanent active longitudes and activity cycles on RSCVn stars”, Astron. Astrophys., 336, L25–L28. 1, 5.4, 5.4, 6.2, 4
Berdyugina, S.V., Usoskin, I.G., 2003, “Active longitudes in sunspot activity: Century scale per-sistence”, Astron. Astrophys., 405, 1121–1128. 1, 5.4, 11, 6.2, 4
Berdyugina, S.V., Berdyugin, A.V., Ilyin, I., Tuominen, I., 1998a, “The active RS Canum Venati-corum binary II Pegasi. II. Surface images for 1992–1996”, Astron. Astrophys., 340, 437–446.5.6, 6.2
Berdyugina, S.V., Jankov, S., Ilyin, I., Tuominen, I., Fekel, F.C., 1998b, “The active RS CanumVenaticorum binary II Pegasi. I. Stellar and orbital parameters”, Astron. Astrophys., 334, 863–872. 4.4
Berdyugina, S.V., Berdyugin, A.V., Ilyin, I., Tuominen, I., 1999a, “The active RS Canum Venati-corum binary II Pegasi. IV. The spot activity cycle”, Astron. Astrophys., 350, 626–634. 5.6,6.2, 15, 5
Berdyugina, S.V., Ilyin, I., Tuominen, I., 1999b, “The long-period RS Canum Venaticorum binaryIM Pegasi. I. Orbital and stellar parameters”, Astron. Astrophys., 347, 932–936. 4.4
Berdyugina, S.V., Berdyugin, A.V., Ilyin, I., Tuominen, I., 2000, “The long-period RS CVn binaryIM Pegasi. II. First surface images”, Astron. Astrophys., 360, 272–280. 4, 5
Berdyugina, S.V., Pelt, J., Tuominen, I., 2002, “Magnetic activity in the young solar analog LQHydrae. I. Active longitudes and cycles”, Astron. Astrophys., 394, 505–515. 4.1, 5.4, 6.1, 6.2,4, 7.1
Berdyugina, S.V., Solanki, S.K., Frutiger, C., 2003, “The molecular Zeeman effect and diagnosticsof solar and stellar magnetic fields. II. Synthetic Stokes profiles in the Zeeman regime”, Astron.Astrophys., 412, 513–527. 4.4
Bopp, B.W., 1981, “Observations of FK Comae stars”, in Second Cambridge Workshop on CoolStars, Stellar Systems, and the Sun, (Eds.) Giampapa, M.S., Golub, L., vol. 392 of SAO Rep.,pp. 207–217, SAO, Cambridge. 2.5
Bopp, B.W., Evans, D.S., 1973, “The spotted flare stars BY Dra and CC Eri: A model for thespots and some astrophysical implications”, Mon. Not. R. Astron. Soc., 164, 343–356. 2.1
Living Reviews in Solar Physicshttp://www.livingreviews.org/lrsp-2005-8
Starspots: A Key to the Stellar Dynamo 49
Bopp, B.W., Rucinski, S.M., 1981, “The Rapidly Rotating Giants of the FK Comae Type”, inFundamental Problems in the Theory of Stellar Evolution, (Eds.) Sugimoto, D., Lamb, D.G.,Schramm, D.N., IAU Symposium 93, held at Kyoto University, Kyoto, Japan, July 22–25, 1980,p. 177, D. Reidel, Dordrecht, Netherlands; Boston, U.S.A. 2.5
Bopp, B.W., Stencel, R.E., 1981, “The FK Comae stars”, Astrophys. J., 247, L131–L134. 2.5
Bopp, B.W., Saar, S.H., Ambruster, C., Feldman, P., Dempsey, R.C., Allen, M., Barden, S.C.,1989, “The active chromosphere binary HD 17433 (VY Arietis)”, Astrophys. J., 339, 1059–1072. 9
Bouvier, J., Bertout, C., 1989, “Spots on T Tauri stars”, Astron. Astrophys., 211, 99–114. 2.3
Brandenburg, A., Dobler, W., 2002, “Solar and stellar dynamos – latest developments”, Astron.Nachr., 323, 411–416. 7.1
Brandenburg, A., Krause, F., Meinel, R., Moss, D., Tuominen, I., 1989, “The stability of nonlineardynamos and the limited role of kinematic growth rates”, Astron. Astrophys., 213, 411–422.7.1
Brown, S.F., Donati, J.-F., Rees, D.E., Semel, M., 1991, “Zeeman-Doppler imaging of active stars.IV - Maximum entropy reconstruction of 2D magnetic topologies”, Astron. Astrophys., 250,463–474. 4.2, 4.3, 4.3
Bruls, J.H.M.J., Solanki, S.K., Schussler, M., 1998, “Doppler imaging: the polar spot controversy”,Astron. Astrophys., 336, 231–241. 5.6
Budding, E., 1977, “The interpretation of cyclical photometric variations in certain dwarf Me-typestars”, Astrophys. Space Sci., 48, 207–223. 4.1
Caligari, P., Moreno-Insertis, F., Schussler, M., 1995, “Emerging flux tubes in the solar convectionzone. I. Asymmetry, tilt, and emergence latitude”, Astrophys. J., 441, 886–902. 7.2
Catalano, S., Biazzo, K., Frasca, A., Marilli, E., 2002, “Measuring starspot temperature from linedepth ratios. I. The method”, Astron. Astrophys., 394, 1009–1021. 4.5, 5
Chugainov, P.F., 1966, “On the Variability of HD 234677”, Inform. Bull. Var. Stars, 122, 1–2.2.1
Chugainov, P.F., 1971, “On the Cause of Periodic Light Variations of Some Red Dwarf Stars”,Inform. Bull. Var. Stars, 520, 1–3. 2.1
Chugainov, P.F., 1976, “Estimates of spot area and temperature on BY Dra”, Krymskaia Astrofiz.Obs. Izv., 55, 94–99. 5
Collier Cameron, A., 1992, “Modelling Stellar Photospheric Spots Using Spectroscopy”, in Sur-face Inhomogeneities on Late-Type Stars, (Eds.) Byrne, P.B., Mullan, D.J., Proceedings of acolloquium held at Armagh Observatory, Northern Ireland, 24–27 July, 1990, vol. 397 of LectureNotes in Physics, p. 33, Springer, Berlin, Germany; New York, U.S.A. 1, 4.2
Collier Cameron, A., 1995, “New limits on starspot lifetimes for AB Doradus”, Mon. Not. R.Astron. Soc., 275, 534–544. 4.2
Collier Cameron, A., 1997, “Eclipse mapping of late-type close binary stars”, Mon. Not. R. Astron.Soc., 287, 556–566. 4.1
Living Reviews in Solar Physicshttp://www.livingreviews.org/lrsp-2005-8
50 Svetlana V. Berdyugina
Collier Cameron, A., Donati, J.-F., 2002, “Doin’ the twist: secular changes in the surface differentialrotation on AB Doradus”, Mon. Not. R. Astron. Soc., 329, L23–L27. 6.1, 6.3
Collier Cameron, A., Donati, J.-F., Semel, M., 2002, “Stellar differential rotation from directstar-spot tracking”, Mon. Not. R. Astron. Soc., 330, 699–706. 5.5
de Souza, D., Zorec, J., Jankov, S., Vakili, F., Abe, L., Janot-Pacheco, E., 2004, “Stellar differentialrotation and inclination angle from spectro-interferometry”, Astron. Astrophys., 418, 781–794.3.4, 5.5
Deutsch, A. J., 1958, “Harmonic Analysis of the Periodic Spectrum Variables”, in Electromag-netic Phenomena in Cosmical Physics, (Ed.) Lehnert, B., IAU Symposium no. 6, pp. 209–221,Cambridge University Press, Cambridge, U.K. 4.2
Donahue, R.A., Saar, S.H., Baliunas, S.L., 1996, “A Relationship between Mean Rotation Periodin Lower Main-Sequence Stars and Its Observed Range”, Astrophys. J., 466, 384–391. 5.5
Donati, J.-F., Brown, S.F., 1997, “Zeeman–Doppler imaging of active stars. V. Sensitivity ofmaximum entropy magnetic maps to field orientation”, Astron. Astrophys., 326, 1135–1142.4.3, 4.3
Donati, J.-F., Collier Cameron, A., 1997, “Differential rotation and magnetic polarity patterns onAB Doradus”, Mon. Not. R. Astron. Soc., 291, 1–19. 4, 5.2, 5.5, 12
Donati, J.-F., Semel, M., Praderie, F., 1989, “Zeeman–Doppler imaging of active stars. II - Nu-merical simulation and first observational results”, Astron. Astrophys., 225, 467–478. 4.3
Donati, J.-F., Semel, M., Carter, B.D., Rees, D.E., Collier Cameron, A., 1997, “Spectropolarimetricobservations of active stars”, Mon. Not. R. Astron. Soc., 291, 658–682. 1, 3.3, 4.3, 4.3
Donati, J.-F., Collier Cameron, A., Hussain, G.A.J., Semel, M., 1999, “Magnetic topology andprominence patterns on AB Doradus”, Mon. Not. R. Astron. Soc., 302, 437–456. 5.2, 5.6
Donati, J.-F., Mengel, M., Carter, B.D., Marsden, S., Collier Cameron, A., Wichmann, R., 2000,“Surface differential rotation and prominences of the Lupus post T Tauri star RX J1508.6-4423”,Mon. Not. R. Astron. Soc., 316, 699–715. 5.5
Donati, J.-F., Collier Cameron, A., Petit, P., 2003a, “Temporal fluctuations in the differentialrotation of cool active stars”, Mon. Not. R. Astron. Soc., 345, 1187–1199. 5.5, 6.1, 6.3
Donati, J.-F., Collier Cameron, A., Semel, M., Hussain, G.A.J., Petit, P., Carter, B.D., Marsden,S.C., Mengel, M., Lopez Ariste, A., Jeffers, S.V., Rees, D.E., 2003b, “Dynamo processes andactivity cycles of the active stars AB Doradus, LQ Hydrae and HR 1099”, Mon. Not. R. Astron.Soc., 345, 1145–1186. 5.2
Dorren, J.D., 1987, “A new formulation of the starspot model, and the consequences of starspotstructure”, Astrophys. J., 320, 756–767. 4.1
Dorren, J.D., Guinan, E.F., 1982, “Evidence for starspots on single solar-like stars”, Astron. J.,87, 1546–1557. 2.2
Dorren, J.D., Guinan, E.F., 1994, “HD 129333: The Sun in its infancy”, Astrophys. J., 428,805–818. 5
Drake, S.A., Simon, T., Linsky, J.L., 1989, “A survey of the radio continuum emission of RSCanum Venaticorum and related active binary systems”, Astrophys. J. Suppl. Ser., 71, 905–930.1
Living Reviews in Solar Physicshttp://www.livingreviews.org/lrsp-2005-8
Starspots: A Key to the Stellar Dynamo 51
Eaton, J.A., Hall, D.S., 1979, “Starspots as the cause of the intrinsic light variations in RS CanumVenaticorum type stars”, Astrophys. J., 227, 907–922. 4.1, 5
Eggen, O.J., 1967, “Contact binaries. II”, Mem. R. Astron. Soc., 70, 111–164. 2.6
Fekel, F.C., Balachandran, S., 1993, “Lithium and rapid rotation in chromospherically active singlegiants”, Astrophys. J., 403, 708–721. 2.5
Fekel, F.C., Henry, G.W., 2005, “Chromospherically Active Stars. XXIV. The Giant, Single-LinedBinaries HD37824, HD181809, and HD217188”, Astron. J., 129, 1669–1685. 4
Fields, D. L., Albrow, M. D., An, J., Beaulieu, J.-P., Caldwell, J. A. R., DePoy, D. L., Dominik,M., Gaudi, B. S., Gould, A., Greenhill, J., Hill, K., Jorgensen, U. G., Kane, S., Martin, R.,Menzies, J., Pogge, R. W., Pollard, K. R., Sackett, P. D., Sahu, K. C., Vermaak, P., Watson,R., Williams, A., Glicenstein, J.-F., Hauschildt, P. H., 2003, “High-Precision Limb-DarkeningMeasurement of a K3 Giant Using Microlensing”, Astrophys. J., 596, 1305–1319. 3.5
Fluri, D.M., Berdyugina, S.V., 2004, “Flip-flops as observational signatures of different dynamomodes in cool stars”, Solar Phys., 224, 153–160. 6.1, 7.1
Frasca, A., Biazzo, K., Catalano, S., Marilli, E., Messina, S., Rodono, M., 2005, “Measuringstarspot temperature from line-depth ratios. II. Simultaneous modeling of light and temperaturecurves”, Astron. Astrophys., 432, 647–655. 4.5
Frohlich, C., 2002, “Total solar irradiance variations since 1978”, Adv. Space Res., 29, 1409–1416.2.2
Geppert, U., Rheinhardt, M., Gil, J., 2003, “Spot-like structures of neutron star surface magneticfields”, Astron. Astrophys., 412, L33–L36. 2.8
Gershberg, R.E., 1982, “A hypothesis on the hydromagnetic activity of T Tau type stars andrelated objects”, Astron. Nachr., 303, 251–261. 2.3
Gizon, L., 2002, “Prospects for detecting stellar activity through asteroseismology”, Astron.Nachr., 323, 251–253. 4.6
Gizon, L., Solanki, S.K., 2004, “Measuring Stellar Differential rotation with asteroseismology”,Solar Phys., 220, 169–184. 4.6, 5.5
Goncharskii, A.V., Stepanov, V.V., Khokhlova, V.L., Yagola, A.G., 1977, “Reconstruction of localline profiles from those observed in an Ap spectrum”, Sov. Astron. Lett., 3, 147–149. 4.2, 4.2
Grankin, K.N., Ibragimov, M.A., Kondrat’ev, V.B., Mel’nikov, S.Y., Shevchenko, V.S., 1995,“Photometric study of the properties of spot rotational modulation in weak line T Tauri stars”,Astron. Zh., 39, 799–807. 2.3
Granzer, T., Schussler, M., Caligari, P., Strassmeier, K.G., 2000, “Distribution of starspots on coolstars. II. Pre-main-sequence and ZAMS stars between 0.4 M and 1.7 M”, Astron. Astrophys.,355, 1087–1097. 7.2
Gray, D.F., 1996, “The determination of temperature from spectral lines”, in Stellar Surface Struc-ture, (Eds.) Strassmeier, K.G., Linsky, J.L., Proceedings of the 176th Symposium of the Interna-tional Astronomical Union, held in Vienna, Austria, October 9–13, 1995, pp. 227–235, Kluwer,Dordrecht, Netherlands; Boston, U.S.A. 4.5
Living Reviews in Solar Physicshttp://www.livingreviews.org/lrsp-2005-8
52 Svetlana V. Berdyugina
Gudel, M., Guinan, E.F., Skinner, S.L., 1997, “The X-Ray Sun in Time: A Study of the Long-TermEvolution of Coronae of Solar-Type Stars”, Astrophys. J., 483, 947–960. 2.2
Guenther, E.W., Ball, M., 1999, “A spectroscopic study of flares on T Tauri and zero-age main-sequence stars”, Astron. Astrophys., 347, 508–517. 2.3
Guinan, E.F., Robinson, C.R., 1986, “FK Comae - The kinematical determination of its age andevolutionary status”, Astron. J., 91, 935–939. 2.5
Guinan, E.F., Gudel, M., Kang, Y.W., Margheim, S., 1997, “Chromospherically Active Stars in theGalactic Bulge as the Source of the Diffuse X-Ray Background Emission”, in Variables Stars andthe Astrophysical Returns of the Microlensing Surveys, (Eds.) Ferlet, R., Maillard, J.-P., Raban,B., Proceedings of the 12th IAP Astrophysics Meeting, July 8–12, 1996, Institut d’Astrophysiquede Paris, p. 339, Editions Frontieres, Gif-sur-Yvette, France. 3.5
Hall, D.S., 1976, “The RS CVn binaries and binaries with similar properties”, in Multiple PeriodicVariable Stars, (Ed.) Fitch, W.S., Proceedings of the International Astronomical Union collo-quium no. 29, held at Budapest, Hungary, 1–5 September 1975, p. 287, D. Reidel, Dordrecht,Netherlands; Boston, U.S.A. 2.4
Hall, D.S., 1989, “The relation between RS CVn and Algol”, Space Sci. Rev., 50, 219–233. 2.7,6.3
Hall, D.S., 1991a, “Learning about stellar dynamos from longterm photometry of starspots”, in TheSun and Cool Stars: Activity, Magnetism, Dynamos, (Eds.) Tuominen, I., Moss, D., Rudiger,G., Proceedings of Colloquium no. 130 of the International Astronomical Union, held in Helsinki,Finland, 17–20 July 1990, vol. 380 of Lecture Notes in Physics, p. 353, Springer, Berlin, Germany;New York, U.S.A. 1, 5.5
Hall, D.S., 1991b, “A connection between long-term luminosity variations and orbital periodchanges in chromospherically active binaries”, Astrophys. J., 380, L85–L87. 1, 6.3
Hall, D.S., 1996, “What we don’t know about starspots”, in Stellar surface structure, (Eds.)Strassmeier, K.G., Linsky, J.L., Proceedings of the 176th Symposium of the International As-tronomical Union, held in Vienna, Austria, October 9–13, 1995, pp. 217–226, Kluwer, Dordrecht,Netherlands; Boston, U.S.A. 5.4
Hall, D.S., Henry, G.W., 1994, “The Law of Starspot Lifetimes”, IAPPP Commun., 55, 51–57.5.3
Hartmann, L., 1990, “Emission lines and winds from T Tauri stars”, in Cool Stars, Stellar Systems,and the Sun (Sixth Cambridge Workshop), (Ed.) Wallerstein, G., Proceedings of the workshopheld in Seattle, WA, September 18–21, 1989, vol. 9 of ASP Conference Series, pp. 289–300,Astronomical Society of the Pacific, San Francisco, U.S.A. 2.3
Hatzes, A.P., 1995, “Doppler Imaging of the Cool Spot Distribution on the Weak T Tauri StarV410 Tauri”, Astrophys. J., 451, 784–794. 2.3, 5.3
Hatzes, A.P., 1998, “Spot activity and the differential rotation on HD 106225 derived from Dopplertomography”, Astron. Astrophys., 330, 541–548. 5.6
Hatzes, A.P., Vogt, S.S., Ramseyer, T.F., Misch, A.A., 1996, “The inclination dependence of themean spectral line shapes of RS CVn stars: Further evidence for polar spots”, Astrophys. J.,469, 808–818. 5.6
Living Reviews in Solar Physicshttp://www.livingreviews.org/lrsp-2005-8
Starspots: A Key to the Stellar Dynamo 53
Hempelmann, A., Donahue, R.A., 1997, “Wavelet analysis of stellar differential rotation. I. TheSun”, Astron. Astrophys., 322, 835–840. 5.5
Hendry, M.A., Bryce, H.M., Valls-Gabaud, D., 2002, “The microlensing signatures of photosphericstarspots”, Mon. Not. R. Astron. Soc., 335, 539–549. 3.5
Hendry, P.D., Mochnacki, S.W., 2000, “Doppler Imaging of VW Cephei: Distribution and Evolu-tion of Starspots on a Contact Binary”, Astrophys. J., 531, 467–493. 2.6
Henry, G.W., Eaton, J.A., Hamer, J., Hall, D.S., 1995, “Starspot evolution, differential rotation,and magnetic cycles in the chromospherically active binaries λ Andromedae, σ Geminorum, IIPegasi, and V711 Tauri”, Astrophys. J. Suppl. Ser., 97, 513–549. 5.4, 5.5, 6.1
Heyrovsky, D., Sasselov, D., 2000, “Detecting Stellar Spots by Gravitational Microlensing”, As-trophys. J., 529, 69–76. 3.5
Holzwarth, V., 2004, “Spot signatures of a solar-type dynamo in close binary stars”, Astron.Nachr., 325, 408–412. 7.2
Holzwarth, V., Schussler, M., 2003a, “Dynamics of magnetic flux tubes in close binary stars. I.Equilibrium and stability properties”, Astron. Astrophys., 405, 291–301. 7.2
Holzwarth, V., Schussler, M., 2003b, “Dynamics of magnetic flux tubes in close binary stars. II.Nonlinear evolution and surface distributions”, Astron. Astrophys., 405, 303–311. 7.2
Huenemoerder, D.P., Ramsey, L.W., 1987, “CCD Echelle observations of the active RS CVn systemII Pegasi”, Astrophys. J., 319, 392–402. 4.4
Huenemoerder, D.P., Ramsey, L.W., Buzasi, D.L., 1989, “Titanium oxide variations in II Pegasi”,Astron. J., 98, 2264–2267. 4.4
Hussain, G.A.J., Donati, J.-F., Collier Cameron, A., Barnes, J.R., 2000, “Comparisons of imagesderived from independent Zeeman Doppler imaging codes”, Mon. Not. R. Astron. Soc., 318,961–973. 4.3
Hussain, G.A.J., Jardine, M., Collier Cameron, A., 2001, “Mapping potential fields on the surfacesof rapidly rotating stars”, Mon. Not. R. Astron. Soc., 322, 681–688. 4.3
Ibanoglu, C., Keskin, V., Akan, M.C., Evren, S., Tunca, Z., 1994, “Long-term luminosity variationsand period changes in V471 Tauri”, Astron. Astrophys., 281, 811–816. 6.3
Jankov, S., Foing, B. H., 1992, “Tomographic imaging of late-type stars from spectroscopic andphotometric rotational modulation. I - Principle and mathematical formulation of the method”,Astron. Astrophys., 256, 533–550. 1, 4.2
Jankov, S., Vakili, F., Domiciano de Souza Jr, A., Janot-Pacheco, E., 2001, “Interferometric-Doppler imaging of stellar surface structure”, Astron. Astrophys., 377, 721–734. 4.2
Jankov, S., Domiciano de Souza Jr, A., Stehle, C., Vakili, F., Perraut-Rousselet, K., Chesneau,O., 2003, “Interferometric-Doppler imaging of stellar surface abundances”, in Interferometry forOptical Astronomy II , (Ed.) Traub, W.A., 22–28 August 2002, Waikoloa, Hawaii, USA, vol. 4838of SPIE Proceedings, pp. 587–593, International Society for Optical Engineering, Bellingham,U.S.A. 3.4
Jarvinen, S.P., Berdyugina, S.V., Strassmeier, K.G., 2005a, “Magnetic activity in the young solaranalog EK Dra: Active longitudes and cycles from long-term photometry”, Astron. Astrophys.,accepted. 4
Living Reviews in Solar Physicshttp://www.livingreviews.org/lrsp-2005-8
54 Svetlana V. Berdyugina
Jarvinen, S.P., Berdyugina, S.V., Tuominen, I., Cutispoto, G., Bos, M., 2005b, “Magnetic activityin the young solar analog AB Dor: Active longitudes and cycles from long-term photometry”,Astron. Astrophys., 432, 657–664. 5.4, 11, 6.1, 6.2, 4
Jetsu, L., 1996, “The active longitudes of λ Andromedae, σ Geminorum, II Pegasi and V 711Tauri”, Astron. Astrophys., 314, 153–164. 5.4
Jetsu, L., Pelt, J., Tuominen, I., Nations, H., 1991, “The spot activity of FK Comae”, in The Sunand Cool Stars: Activity, Magnetism, Dynamos, (Eds.) Tuominen, I., Moss, D., Rudiger, G.,Proceedings of Colloquium no. 130 of the International Astronomical Union, held in Helsinki,Finland, 17–20 July 1990, vol. 380 of Lecture Notes in Physics, pp. 381–383, Springer, Berlin,Germany; New York, U.S.A. 6.2
Jetsu, L., Pelt, J., Tuominen, I., 1993, “Spot and flare activity of FK Comae Berenices: Long-termphotometry”, Astron. Astrophys., 278, 449–462. 5.4
Jetsu, L., Pelt, J., Tuominen, I., 1999, “Time series analysis of V 1794 Cygni long-term photome-try”, Astron. Astrophys., 351, 212–224. 5.4
Johns-Krull, C.M., Valenti, J.A., 1996, “Detection of Strong Magnetic Fields on M Dwarfs”, As-trophys. J. Lett., 459, L95–L98. 3.3, 9
Johns-Krull, C.M., Valenti, J.A., Hatzes, A.P., Kanaan, A., 1999a, “Spectropolarimetry of Mag-netospheric Accretion on the Classical T Tauri Star BP Tauri”, Astrophys. J., 510, L41–L44.9
Johns-Krull, C.M., Valenti, J.A., Koresko, C., 1999b, “Measuring the Magnetic Field on the Clas-sical T Tauri Star BP Tauri”, Astrophys. J., 516, 900–915. 9
Joy, A.H., 1945, “T Tauri Variable Stars.”, Astrophys. J., 102, 168–195. 2.3
Keskin, V., Ibanoglu, C., Akan, M.C., Evren, S., Tunca, Z., 1994, “Luminosity variations andorbital period changes in RT Lacertae”, Astron. Astrophys., 287, 817–823. 6.3
Kitchatinov, L.L., Rudiger, G., 1995, “Differential rotation in solar-type stars: revisiting theTaylor-number puzzle”, Astron. Astrophys., 299, 446–452. 7.1
Kitchatinov, L.L., Rudiger, G., 1999, “Differential rotation models for late-type dwarfs and giants”,Astron. Astrophys., 344, 911–917. 7.1
Kitchatinov, L.L., Rudiger, G., 2004, “Anti-solar differential rotation”, Astron. Nachr., 325, 496–500. 7.1
Kiurkchieva, D.P., 1990, “Photometry of stars with nonhomogeneous temperature spots”, Astro-phys. Space Sci., 172, 255–262. 4.1
Kochukhov, O., Piskunov, N.E., Valenti, J.A., Johns-Krull, C.M., 2001, “The Search and Mod-elling of Magnetic Fields on M Dwarfs”, in Magnetic Fields Across the Hertzsprung–RussellDiagram, (Eds.) Mathys, G., Solanki, S.K., Wickramasinghe, D.T., Proceedings of a workshopheld in Santiago, Chile, 15–19 January 2001, vol. 248 of ASP Conference Series, pp. 219–222,Astronomical Society of the Pacific, San Francisco, U.S.A. 9
Konigl, A., 1991, “Disk accretion onto magnetic T Tauri stars”, Astrophys. J., 370, L39–L43. 2.3
Korhonen, H., Berdyugina, S.V., Hackman, T., Duemmler, R., Ilyin, I.V., Tuominen, I., 1999,“Study of FK Comae Berenices. I. Surface images for 1994 and 1995”, Astron. Astrophys., 346,101–110. 4.2
Living Reviews in Solar Physicshttp://www.livingreviews.org/lrsp-2005-8
Starspots: A Key to the Stellar Dynamo 55
Korhonen, H., Berdyugina, S.V., Tuominen, I., 2002, “Study of FK Comae Berenices. IV. Activelongitudes and the “flip-flop” phenomenon”, Astron. Astrophys., 390, 179–185. 5.4, 6.2, 4
Kron, G.E., 1947, “The probable detection of patches of varying brightness on AR Lacertae B”,Publ. Astron. Soc. Pac., 350, 261–265. 1, 2.1
Kron, G.E., 1952, “A Photoelectric Study of the Dwarf M Eclipsing Variable YY Geminorum”,Astrophys. J., 115, 301–319. 2.1
Kurster, M., 1993, “Doppler imaging with a CLEAN-like approach. I. A newly developed algorithmsimulations and tests”, Astron. Astrophys., 274, 851–869. 4.2
Lagarde, S., Sanchez, L.J., Petrov, R.G., 1995, “Sub-resolution Limit Spatio-Spectral InformationUsing Differential Speckle Interferometry”, in Tridimensional Optical Spectroscopic Methods inAstrophysics, (Eds.) Comte, G., Marcelin, M., Proceedings of I.A.U. Colloquium 149, Marseille(France), 22–25 March 1994, vol. 71 of ASP Conference Series, p. 360, Astronomical Society ofthe Pacific, San Francisco, U.S.A. 3.4
Landi Degl’Innocenti, E., 1976, “Are there spots on magnetic white dwarfs?”, Astrophys. J., 209,208–213. 2.8
Lanza, A.F., Rodono, M., 1999a, “Observations and modelling of starspots: A tool to understandstellar dynamos”, in Solar and Stellar Activity: Similarities and Differences, (Eds.) Butler, C.J.,Doyle, J.G., Proceedings of a meeting held in Armagh, N. Ireland, 2–4 September 1998, vol. 158of ASP Conference Series, pp. 121–132, Astronomical Society of the Pacific, San Francisco,U.S.A. 1
Lanza, A.F., Rodono, M., 1999b, “Orbital period modulation and quadrupole moment changes inmagnetically active close binaries”, Astron. Astrophys., 349, 887–897. 6.3
Lanza, A.F., Rodono, M., 2002, “Asteroseismic tests for models of magnetically active close binarieswith orbital period modulation”, Astron. Astrophys., 390, 167–172. 4.6
Lanza, A.F., Rodono, M., Zappala, R.A., 1993, “Fourier analysis of spotted star light curves as atool to detect stellar differential rotation”, Astron. Astrophys., 269, 351–354. 5.5
Lanza, A.F., Catalano, S., Cutispoto, G., Pagano, I., Rodono, M., 1998a, “Long-term starspotevolution, activity cycle and orbital period variation of AR Lacertae”, Astron. Astrophys., 332,541–560. 1, 4.1, 5.4, 6.3
Lanza, A.F., Rodono, M., Rosner, R., 1998b, “Orbital period modulation and magnetic cycles inclose binaries”, Mon. Not. R. Astron. Soc., 296, 893–902. 6.3, 7.1
Libbrecht, K.G., Woodard, M.F., 1990, “Solar-cycle effects on solar oscillation frequencies”, Nature,345, 779–782. 4.6
Lockwood, G.W., Thompson, D.T., Radick, R.R., Osborn, W.H., Baggett, W.E., Duncan, D.K.,Hartmann, L.W., 1984, “The photometric variability of solar-type stars. IV Detection of rota-tional modulation among Hyades stars”, Publ. Astron. Soc. Pac., 96, 714–722. 2.2
Maceroni, C., Vilhu, O., van’t Veer, F., van Hamme, W., 1994, “Surface imaging of late-typecontact binaries. I. AE Phoenicis and YY Eridani”, Astron. Astrophys., 288, 529–537. 2.6
Marsden, S.C., Waite, I.A., Carter, B.D., Donati, J.-F., 2005, “Doppler imaging and surfacedifferential rotation of young open cluster stars. I. HD307938 (R58) in IC 2602”, Mon. Not.R. Astron. Soc., 359, 711–724. 5
Living Reviews in Solar Physicshttp://www.livingreviews.org/lrsp-2005-8
56 Svetlana V. Berdyugina
Maxted, P.F.L., Ferrario, L., Marsh, T.R., Wickramasinghe, D.T., 2000, “WD1953-011: a magneticwhite dwarf with peculiar field structure”, Mon. Not. R. Astron. Soc., 315, L41–L44. 2.8
Mekkaden, M. V., 1985, “Rotation and Hα emission activity in F8–G3 dwarfs”, Astrophys. SpaceSci., 117, 381–385. 1
Messina, S., Guinan, E.F., 2002, “Magnetic activity of six young solar analogues I. Starspot cyclesfrom long-term photometry”, Astron. Astrophys., 393, 225. 6.1
Messina, S., Guinan, E.F., 2003, “Magnetic activity of six young solar analogues II. Surface dif-ferential rotation from long-term photometry”, Astron. Astrophys., 409, 1017–1030. 5.5, 6.1,6.1
Messina, S., Guinan, E.F., Lanza, A.F., 1999, “Photospheric Magnetic Activity in a Proxy for theYoung Sun: HD 134319”, Astrophys. Space Sci., 260, 493–505. 4.1
Middelkoop, F., 1981, “Magnetic structure in cool stars. III - CA II H and K emission and rotationof main-sequence stars”, Astron. Astrophys., 101, 295–298. 1
Moss, D., 2004, “Dynamo models and the flip-flop phenomenon in late-type stars”, Mon. Not. R.Astron. Soc., 352, L17–L20. 6.1, 7.1
Moss, D., Tuominen, I., 1997, “Magnetic field generation in close binary systems”, Astron. Astro-phys., 321, 151–158. 7.1
Moss, D., Brandenburg, A., Tuominen, I., 1991, “Properties of mean field dynamos with non-axisymmetric α-effect”, Astron. Astrophys., 247, 576–579. 7.1
Moss, D., Barker, D.M., Brandenburg, A., Tuominen, I., 1995, “Nonaxisymmetric dynamo solu-tions and extended starspots on late-type stars”, Astron. Astrophys., 294, 155–164. 7.1
Mullan, D.J., 1975, “On the possibility of magnetic starspots on the primary components of WUrsae Majoris type binaries”, Astrophys. J., 198, 563–573. 2.6
Neff, J.E., O’Neal, D., Saar, S.H., 1995, “Absolute Measurements of Starspot Area and Tempera-ture: II Pegasi in 1989 October”, Astrophys. J., 452, 879–893. 4.4
Noyes, R.W., Hartmann, L.W., Baliunas, S.L., Duncan, D.K., Vaughan, A.H., 1984, “Rotation,convection, and magnetic activity in lower main-sequence stars”, Astrophys. J., 279, 763–777.2.2
Olah, K., Panov, K.P., Pettersen, B.R., Valtaoja, E., Valtaoja, L., 1988, “Long-lived active longi-tudes on the spotted RS CVn star σ Germinorum”, Astron. Astrophys., 218, 192–194. 5.4
Olson, E.C., Etzel, P.B., 1993, “Cool-star photometric activity in six totally-eclipsing Algol bina-ries”, Astron. J., 106, 342–347. 2.7
O’Neal, D., Neff, J.E., 1997, “OH 1.563 µm absorption from starspots on active stars”, Astron. J.,113, 1129–1137. 4.4
O’Neal, D., Saar, S.H., Neff, J.E., 1996, “Measurements of Starspot Area and Temperature onFive Active, Evolved Stars”, Astrophys. J., 463, 766–775. 1, 4.4, 5.1
O’Neal, D., Neff, J.E., Saar, S.H., 1998, “Measurements of Starspot Parameters on Active Starsusing Molecular Bands in Echelle Spectra”, Astrophys. J., 507, 919–937. 5.1, 5
Living Reviews in Solar Physicshttp://www.livingreviews.org/lrsp-2005-8
Starspots: A Key to the Stellar Dynamo 57
O’Neal, D., Neff, J.E., Saar, S.H., Mines, J.K., 2001, “Hydroxyl 1.563 Micron Absorption fromStarspots on Active Stars”, Astron. J., 122, 1954–1964. 4.4, 5
O’Neal, D., Neff, J.E., Saar, S.H., Cuntz, M., 2004, “Further Results of TiO-band Observations ofStarspots”, Astron. J., 128, 1802–1811. 5.1, 5.1, 5
Pallavicini, R., 2002, “High-resolution ground-based spectroscopy: where and how?”, Astron.Nachr., 323, 288–293. 3.2
Pallavicini, R., Golub, L., Rosner, R., Vaiana, G. S., Ayres, T., Linsky, J. L., 1981, “Relationsamong stellar X-ray emission observed from Einstein, stellar rotation and bolometric luminosity”,Astrophys. J., 248, 279–290. 1
Petit, P., Donati, J.-F., Collier Cameron, A., 2002, “Differential rotation of cool active stars: thecase of intermediate rotators”, Mon. Not. R. Astron. Soc., 334, 374–382. 5.5
Petit, P., Donati, J.-F., Collier Cameron, A., 2004, “Differential rotation of cool active stars”,Astron. Nachr., 325, 221–224. 5.5
Petrov, P.P., 2003, “T Tauri stars”, Astrophys., 46, 506–529. 2.3
Petrov, P.P., Shcherbakov, A.G., 1976, in Stars and galaxies from observational points of view ,(Ed.) Kharadze, E.K., Proceedings of the Third European Astronomical Meeting, Tiflis, Geor-gian SSR, July 1–5, 1975, Third European Astron. Meeting, p. 163, Metsniereba, Tbilisi, USSR.2.3
Petrov, P.P., Shcherbakov, V.A., Berdyugina, S.V., Shevchenko, V.S., Grankin, K.N., Melnikov,S.Y., 1994, “Photometric and spectroscopic observations of the spotted T Tauri star V410 Tauri”,Astrophys. J. Suppl. Ser., 107, 9–22. 2.3, 5
Petrov, R.G., 1988, “Differential Speckle Imaging”, in High Resolution Imaging by InterferometryII: Ground-Based Interferometry at Visible and Infrared Wavelengths, (Ed.) Merkle, F., Pro-ceedings of the NOAO-ESO Conference, held in Garching, Germany, 15–18 March 1988, vol. 29of ESO Conference and Workshop Proc., p. 235, European Southern Observatory, Garching,Germany. 3.4
Piskunov, N.E., Kochukhov, O., 2002, “Doppler Imaging of stellar magnetic fields. I. Techniques”,Astron. Astrophys., 381, 736–756. 4.3
Piskunov, N.E., Wehlau, W.H., 1994, “The detectability of cool polar caps on late type stars”,Astron. Astrophys., 289, 868–870. 5.6
Piskunov, N.E., Tuominen, I., Vilhu, O., 1990, “Surface imaging of late-type stars”, Astron. As-trophys., 230, 363–370. 1, 4.2, 4.2
Radick, R.R., 2000, “A brief survey of chromospheric and photometric variability among sunlikestars”, Adv. Space Res., 26, 1739–1745. 13
Radick, R.R., Mihalas, D., Hartmann, L., Worden, S.P., Africano, J.L., Klimke, A., Tyson, E.T.,1982, “The photometric variability of solar-type stars. I. Preliminary results for the Pleiades,Hyades, and the Malmquist Field”, Publ. Astron. Soc. Pac., 94, 934–944. 2.2
Radick, R.R., Mihalas, D., Lockwood, G.W., Thompson, D.T., Warnock, A., Hartmann, L.W.,Worden, S.P., Henry, G.W., Sherlin, J.M., 1983a, “The photometric variability of solar-typestars. III. Results from 1981–82, including parallel observations of thirty-six Hyades stars”,Publ. Astron. Soc. Pac., 95, 621–634. 2.2
Living Reviews in Solar Physicshttp://www.livingreviews.org/lrsp-2005-8
58 Svetlana V. Berdyugina
Radick, R.R., Wilkerson, M.S., Worden, S.P., Africano, J.L., Klimke, A., Ruden, S., Rogers, W.,Armandroff, T.E., Giampapa, M.S., 1983b, “The photometric variability of solar-type stars.II. Stars selected from Wilson’s chromospheric activity survey”, Publ. Astron. Soc. Pac., 95,300–310. 2.2
Radick, R.R., Lockwood, G.W., Skiff, B.A., Baliunas, S.L., 1998, “Patterns of Variation amongSun-like Stars”, Astrophys. J. Suppl. Ser., 118, 239. 6.1
Reiners, A., Schmitt, J.H.M.M., 2002, “On the feasibility of the detection of differential rotationin stellar absorption profiles”, Astron. Astrophys., 384, 155–162. 5.5
Reiners, A., Schmitt, J.H.M.M., 2003a, “Rotation and differential rotation in field F- and G-typestars”, Astron. Astrophys., 398, 647–661. 5.5
Reiners, A., Schmitt, J.H.M.M., 2003b, “Differential rotation in rapidly rotating F-stars”, Astron.Astrophys., 412, 813–819. 5.5
Rice, J.B., 2002, “Doppler imaging of stellar surfaces – techniques and issues”, Astron. Nachr.,323, 220–235. 4.2
Rice, J.B., Strassmeier, K.G., 2000, “Doppler imaging from artificial data. Testing the temperatureinversion from spectral-line profiles”, Astrophys. J. Suppl. Ser., 147, 151–168. 1, 4.2
Rice, J.B., Wehlau, W.H., Khokhlova, V.L., 1989, “Mapping stellar surfaces by Doppler imaging -Technique and application”, Astron. Astrophys., 208, 179–188. 1, 4.2
Richards, M.T., 1990, “The RS Canum Venaticorum characteristics of the infrared light curves ofAlgol”, Astrophys. J., 350, 372–385. 2.7
Robinson Jr, R.D., 1980, “Magnetic field measurements on stellar sources - A new method”,Astrophys. J., 239, 961–967. 5.2
Rodono, M., Cutispoto, G., Pazzani, V., Catalano, S., Byrne, P. B., Doyle, J. G., Butler, C. J.,Andrews, A. D., Blanco, C., Marilli, E., Linsky, J. L., Scaltriti, F., Busso, M., Cellino, A.,Hopkins, J. L., Okazaki, A., Hayashi, S. S., Zeilik, M., Helston, R., Henson, G., Smith, P.,Simon, T., 1986, “Rotational modulation and flares on RS CVn and BY Dra-type stars. I.Photometry and spot models for BY Dra, AU Mic, AR Lac, II Peg and V 711 Tau (= HR1099)”, Astron. Astrophys., 165, 135–156. 4.1, 5
Rodono, M., Lanza, A.F., Catalano, S., 1995, “Starspot evolution, activity cycle and orbital periodvariation of the prototype active binary RS Canum Venaticorum”, Astron. Astrophys., 301, 75–88. 1, 4.1, 5.6, 6.3
Rodono, M., Messina, S., Lanza, A.F., Cutispoto, G., Teriaca, L., 2000, “The magnetic activitycycle of II Pegasi: results from twenty-five years of wide-band photometry”, Astron. Astrophys.,358, 624–638. 5.4
Rousselet-Perraut, K., Stehle, C., Lanz, T., Le Bouquin, J.B., Boudoyen, T., Kilbinger, M.,Kochukhov, O., Jankov, S., 2004, “Stellar activity and magnetism studied by optical inter-ferometry”, Astron. Astrophys., 422, 193–203. 3.4
Rudiger, G., Hollerbach, R., 2004, The Magnetic Universe: Geophysical and Astrophysical DynamoTheory , Wiley-VCH, Weinheim, Germany. 7.1
Rudiger, G., Kuker, M., 2002, “Meridional flow and differential rotation by gravity darkening infast rotating solar-type stars”, Astron. Astrophys., 385, 308–312. 7.1
Living Reviews in Solar Physicshttp://www.livingreviews.org/lrsp-2005-8
Starspots: A Key to the Stellar Dynamo 59
Rudiger, G., von Rekowski, B., Donahue, R.A., Baliunas, S.L., 1998, “Differential rotation andmeridional flow for fast-rotating solar-type stars”, Astrophys. J., 494, 691–699. 7.1
Ruedi, I., Solanki, S.K., Mathys, G., Saar, S.H., 1997, “Magnetic field measurements on moderatelyactive cool dwarfs”, Astron. Astrophys., 318, 429–442. 5.2
Saar, S.H., 1988, “Improved methods for the measurement and analysis of stellar magnetic fields”,Astrophys. J., 324, 441–465. 5.2
Saar, S.H., 1994, “New Infrared Measurements of Magnetic Fields on Cool Stars”, in Infrared solarphysics, (Eds.) Rabin, D.M., Jefferies, J.T., Lindsey, C., Proceedings of the 154th Symposiumof the International Astronomical Union, held in Tucson, Arizona, U.S.A., March 2–6, 1992, p.493, Kluwer Academic, Dordrecht, Netherlands; Boston, U.S.A. 5.2, 9
Saar, S.H., Brandenburg, A., 1999, “Time Evolution of the Magnetic Activity Cycle Period: Resultsfor an Expanded Stellar Sample”, Astrophys. J., 524, 295–310. 6.1
Saar, S.H., Linsky, J.L., 1985, “The photospheric magnetic field of the dM3.5e flare star ADLeonis”, Astrophys. J., 299, L47–L50. 9
Saar, S.H., Linsky, J.L., Beckers, J.M., 1986, “The magnetic field of the BY Draconis flare starEQ Virginis”, Astrophys. J., 302, 777–784. 9
Schussler, M., 2002, “The formation of sunspots and starspots”, Astron. Nachr., 323, 377–382.7.2
Schussler, M., Solanki, S.K., 1992, “Why rapid rotators have polar spots”, Astron. Astrophys.,264, L13–L16. 5.6, 7.2
Schussler, M., Caligari, P., Ferriz-Mas, A., Solanki, S.K., Stix, M., 1996, “Distribution of starspotson cool stars. I. Young and main sequence stars of 1Msun”, Astron. Astrophys., 314, 503–512.7.2
Selam, S.O., 2004, “Key parameters of W UMa-type contact binaries discovered by HIPPARCOS”,Astron. Astrophys., 416, 1097–1105. 2.6
Semel, M., 1989, “Zeeman-Doppler imaging of active stars. I - Basic principles”, Astron. Astrophys.,225, 456–466. 4.3, 4.3, 3
Semel, M., Li, J., 1996, “Zeeman-Doppler imaging of solar-type stars: Multi line technique”, SolarPhys., 164, 417–428. 4.3
Semel, M., Lopez Ariste, A., 2001, “Current ground-based stellar spectropolarimeters and theiruse for Zeeman-Doppler imaging”, in Magnetic Fields Across the Hertzsprung–Russell Diagram,(Eds.) Mathys, G., Solanki, S.K., Wickramasinghe, D.T., Proceedings of a workshop held in San-tiago, Chile, 15–19 January 2001], vol. 248 of ASP Conference Series, pp. 575–580, AstronomicalSociety of the Pacific, San Francisco, U.S.A. 3.3
Semel, M., Donati, J.-F., Rees, D.E., 1993, “Zeeman-Doppler imaging of active stars. 3. Instru-mental and technical considerations”, Astron. Astrophys., 278, 231–237. 4.3
Simon, T., Fekel, F.C., 1987, “The dependence of ultraviolet chromospheric emission upon rotationamong late-type stars”, Astrophys. J., 316, 434–448. 1
Skumanich, A., 1972, “Time Scales for CA II Emission Decay, Rotational Braking, and LithiumDepletion”, Astrophys. J., 171, 565–567. 1, 2.2
Living Reviews in Solar Physicshttp://www.livingreviews.org/lrsp-2005-8
60 Svetlana V. Berdyugina
Solanki, S.K., 2002, “The magnetic structure of sunspots and starspots”, Astron. Nachr., 323,165–177. 5.2
Stelzer, B., Fernandez, M., Costa, V.M., Gameiro, J.F., Grankin, K.N., Henden, A., Guenther,E.W., Mohanty, S., Flaccomio, E., Burwitz, V., Jayawardhana, R., Predehl, P., Durisen, R.H.,2003, “The weak-line T Tauri star V410 Tau. I. A multi-wavelength study of variability”, Astron.Astrophys., 411, 517–531. 6.1
Stenflo, J.O., 2001, “Limitations and opportunities for the diagnostics of solar and stellar magneticfields”, in Magnetic Fields Across the Hertzsprung–Russell Diagram, (Eds.) Mathys, G., Solanki,S.K., Wickramasinghe, D.T., Proceedings of a workshop held in Santiago, Chile, 15–19 January2001], vol. 248 of ASP Conference Series, pp. 639–650, Astronomical Society of the Pacific, SanFrancisco, U.S.A. 3.3
Stewart, R.T., Slee, O.B., White, G.L., Budding, E., Coates, D.W., Thompson, K., Bunton, J.D.,1989, “Radio emission from EA eclipsing binaries - Evidence for kilogauss surface fields on bothearly-type and late-type stars”, Astrophys. J., 342, 463–466. 2.7
Strassmeier, K.G., 1988, “A multiple spot model for simultaneous solution of light curves anddistorted line profiles of spotted stars”, Astrophys. Space Sci., 140, 223–235. 4.1
Strassmeier, K.G., 1999, “Doppler imaging of stellar surface structure. XI. The super starspots onthe K0 giant HD 12545: larger than the entire Sun”, Astron. Astrophys., 347, 225–234. 5.1, 6,5
Strassmeier, K.G., 2002, “Doppler images of starspots”, Astron. Nachr., 323, 309–316. 4.2, 5.6
Strassmeier, K.G., 2005, “Stellar activity cycles: observing the dynamo?”, Astron. Nachr., 326,269–277. 1
Strassmeier, K.G., Bartus, J., 2000, “Doppler imaging of stellar surface structure. XII. Rapid spotchanges on the RS CVn binary V711 Tauri = HR 1099”, Astron. Astrophys., 354, 537–550. 5.6
Strassmeier, K.G., Bopp, B.W., 1992, “Time-series photometric spot modeling. I - Parameter studyand application to HD 17433 = VY Arietis”, Astron. Astrophys., 259, 183–197. 4.1, 5
Strassmeier, K.G., Rice, J.B., 1998, “Doppler imaging of stellar surface structure. VI. HD 129333= EK Draconis: a stellar analog of the active young Sun”, Astron. Astrophys., 330, 685–695.5.6, 5
Strassmeier, K.G., Rice, J.B., Wehlau, W.H., Vogt, S.S., Hatzes, A.P., Tuominen, I., Hackman,T., Poutanen, M., Piskunov, N.E., 1991, “Doppler imaging of high-latitude spot activity on HD26337”, Astron. Astrophys., 247, 130–147. 4.2, 5.6
Strassmeier, K.G., Bartus, J., Cutispoto, G., Rodono, M., 1997, “Starspot photometry with robotictelescopes: Continuous UBV and V(RI)c photometry of 23 stars in 1991–1996”, Astrophys. J.Suppl. Ser., 125, 11–63. 5.1
Strassmeier, K.G., Lupinek, S., Dempsey, R.C., Rice, J.B., 1999, “Doppler imaging of stellar surfacestructure. X. The FK Comae-type star HD 199178 = V 1794 Cygni”, Astron. Astrophys., 347,212–224. 5.6
Strassmeier, K.G., Pallavicini, R., Rice, J.B., Andersen, M.I., Zerbi, F.M., 2004, “The sciencecase of the PEPSI high-resolution echelle spectrograph and polarimeter for the LBT”, Astron.Nachr., 325, 278–298. 3.3
Living Reviews in Solar Physicshttp://www.livingreviews.org/lrsp-2005-8
Starspots: A Key to the Stellar Dynamo 61
Tas, G., Evren, S., 2000, “II Pegasi reached the largest amplitude up to now”, Inform. Bull. Var.Stars, 4992, 1. 5.1
Terebizh, V.Y., 1995, “Image restoration with minimum a priori information”, Phys. Usp., 38,137–167. 4.2
Torres, C.A.O., Ferraz Mello, S., 1973, “On variable dMe stars”, Astron. Astrophys., 27, 231–236.5
Torres, G., Ribas, I., 2002, “Absolute dimensions of the M-type eclipsing binary YY Geminorum(Castor C): A challenge to evolutionary models in the lower Main Sequence”, Astrophys. J., 567,1140–1165. 5
Tuominen, I., Berdyugina, S.V., Korpi, M.J., 2002, “Starspot cycles from Doppler imaging andphotometric time series as nonlinear dynamo”, Astron. Nachr., 323, 367–370. 7.1
Udalski, A., Szymanski, M., Ka luzny, J., Kubiak, M., Mateo, M., Krzeminski, W., 1995, “TheOptical Gravitational Lensing Experiment. The Catalog of Periodic Variable Stars in the GalacticBulge. II. Periodic Variables in Four Baade’s Window Fields: BW1, BW2, BW3 and BW4”, ActaAstron., 45, 1–235. 3.5
Umana, G., Catalano, S., Rodono, M., Gibson, D.M., 1989, “Radio Emission from Selected AlgolSystems”, Space Sci. Rev., 50, 370. 2.7
Unruh, Y.C., Collier Cameron, A., 1995, “The sensitivity of Doppler imaging to line profile mod-els”, Mon. Not. R. Astron. Soc., 273, 1–16. 4.2
Unruh, Y.C., Collier Cameron, A., 1997, “Does chromospheric emission mimic polar starspots inDoppler images?”, Mon. Not. R. Astron. Soc., 290, L37–L42. 5.6
Valenti, J.A., Johns-Krull, C.M., 2001, “Magnetic Field Measurements for Cool Stars”, in MagneticFields Across the Hertzsprung–Russell Diagram, (Eds.) Mathys, G., Solanki, S.K., Wickramas-inghe, D.T., Proceedings of a workshop held in Santiago, Chile, 15–19 January 2001], vol. 248 ofASP Conference Series, pp. 179–188, Astronomical Society of the Pacific, San Francisco, U.S.A.5.2, 5.2, 5.2, 9
Valenti, J.A., Marcy, G.W., Basri, G., 1995, “Infrared Zeeman analysis of ε Eridani”, Astrophys.J., 439, 939–956. 3.3, 9
van Leeuwen, F., Evans, D.W., Grenon, M., Grossmann, V., Mignard, F., Perryman, M.A.C.,1997, “The HIPPARCOS mission: photometric data”, Astron. Astrophys., 323, L61–L64. 3.1
Varricatt, W.P., 2000, “Photometric studies of close binary systems”, Bull. Astron. Soc. India, 28,321–327. 2.7
Vaughan, A.H., Preston, G.W., Baliunas, S.L., Hartmann, L.W., Noyes, R.W., Middelkoop, F.,Mihalas, D., 1981, “Comparison of activity cycles in old and young main-sequence stars”, As-trophys. J., 250, 276–283. 1
Vilhu, O., 1984, “The nature of magnetic activity in lower main sequence stars”, Astron. Astrophys.,133, 117–126. 1
Vincent, A., Piskunov, N.E., Tuominen, I., 1993, “Surface imaging of eclipsing binary stars. 1:Techniques”, Astron. Astrophys., 278, 523–541. 4.2
Living Reviews in Solar Physicshttp://www.livingreviews.org/lrsp-2005-8
62 Svetlana V. Berdyugina
Vogt, S.S., 1979, “A spectroscopic and photometric study of the star spot on HD 224085”, Publ.Astron. Soc. Pac., 91, 616. 4.4
Vogt, S.S., 1981, “A method for unambiguous determination of starspot temperatures and areas -Application to II Pegasi, BY Draconis, and HD 209813”, Astrophys. J., 250, 327–340. 4.1, 5
Vogt, S.S., Penrod, G.D., 1983, “Doppler Imaging of spotted stars: Application to the RS CanumVenaticorum star HR 1099”, Publ. Astron. Soc. Pac., 95, 565–576. 4.2
Vogt, S.S., Penrod, G.D., Hatzes, A.P., 1987, “Doppler images of rotating stars using maximumentropy image reconstruction”, Astrophys. J., 321, 496–515. 1, 4.2, 4.2
Vogt, S.S., Hatzes, A.P., Misch, A.A., Kurster, M., 1999, “Doppler Imagery of the Spotted RSCanum Venaticorum Star HR 1099 (V711 Tauri) from 1981 to 1992”, Astrophys. J. Suppl. Ser.,121, 547–589. 5.6
Wade, G.A., 2003, “Measuring the characteristics of magnetic fields in A, B and O stars”, inMagnetic Fields in O, B and A Stars: Origin and Connection to Pulsation, Rotation and MassLoss, (Eds.) Balona, L.A., Henrichs, H.F., Medupe, R., Proceedings of a conference held atUniversity of North-West, Mmabatho, South Africa, 27 November - 1 December, 2002, vol. 305of ASP Conference Series, p. 16, Astronomical Society of the Pacific, San Francisco, U.S.A. 3.3
Walter, F.M., Bowyer, S., 1981, “On the coronae of rapidly rotating stars. I. The relation betweenrotation and coronal activity in RS CVn systems”, Astrophys. J., 245, 671–676. 1
Webbink, R.F., 1976, “The evolution of low-mass close binary systems. I. The evolutionary fate ofcontact binaries”, Astrophys. J., 209, 829–845. 2.5
White, N.E., Marshall, F.E., 1983, “An X-ray survey on nine algol systems”, Astrophys. J., 268,L117–L120. 2.7
Wickramasinghe, D.T., Ferrario, L., 2000, “Magnetism in Isolated and Binary White Dwarfs”,Publ. Astron. Soc. Pac., 112, 873–924. 2.8
Willson, R.C., Gulkis, S., Janssen, M., Hudson, H.S., Chapman, G.A., 1981, “Observations ofSolar Irradiance Variability”, Science, 211, 700–702. 2.2
Wilson, O.C., 1978, “Chromospheric variations in main-sequence stars”, Astrophys. J., 226, 379–396. 2.2
Wittkowski, M., Scholler, M., Hubrig, S., Posselt, B., von der Luhe, O., 2002, “Measuring starspotson magnetically active stars with the VLTI”, Astron. Nachr., 323, 241–250. 3.4
Woodard, M.F., Noyes, R.W., 1985, “Change of Solar Oscillation Eigenfrequencies with the SolarCycle”, Nature, 318, 449. 4.6
Wright, J.T., 2004, “Do we know of any Maunder minimum stars?”, Astron. J., 128, 1273–1278.6.1
Zeilik, M., de Blasi, C., Rhodes, M., Budding, E., 1988, “A half-century of starspot activity on SVCamelopardalis”, Astrophys. J., 332, 293–298. 5.4
Living Reviews in Solar Physicshttp://www.livingreviews.org/lrsp-2005-8