Starfish PSmiths NL - ruffalonl.com · data from Noel‐Levitz with the Starfish tracking and case...
17
9/7/2012 1 Achieving Retention Results at Paul Smith’s College with Starfish Retention Solutions and the College Student Inventory™ July 2012 Welcome Starfish & Noel‐Levitz Powerful Information. Simply Integrated. Presentation to: Noel‐Levitz Community
Transcript of Starfish PSmiths NL - ruffalonl.com · data from Noel‐Levitz with the Starfish tracking and case...

9/7/2012
1
Achieving Retention Results at Paul Smith’s College with Starfish Retention Solutions and the
College Student Inventory™
July 2012
Welcome
Starfish & Noel‐LevitzPowerful Information. Simply Integrated.
Presentation to:
Noel‐Levitz Community
9/7/2012
2
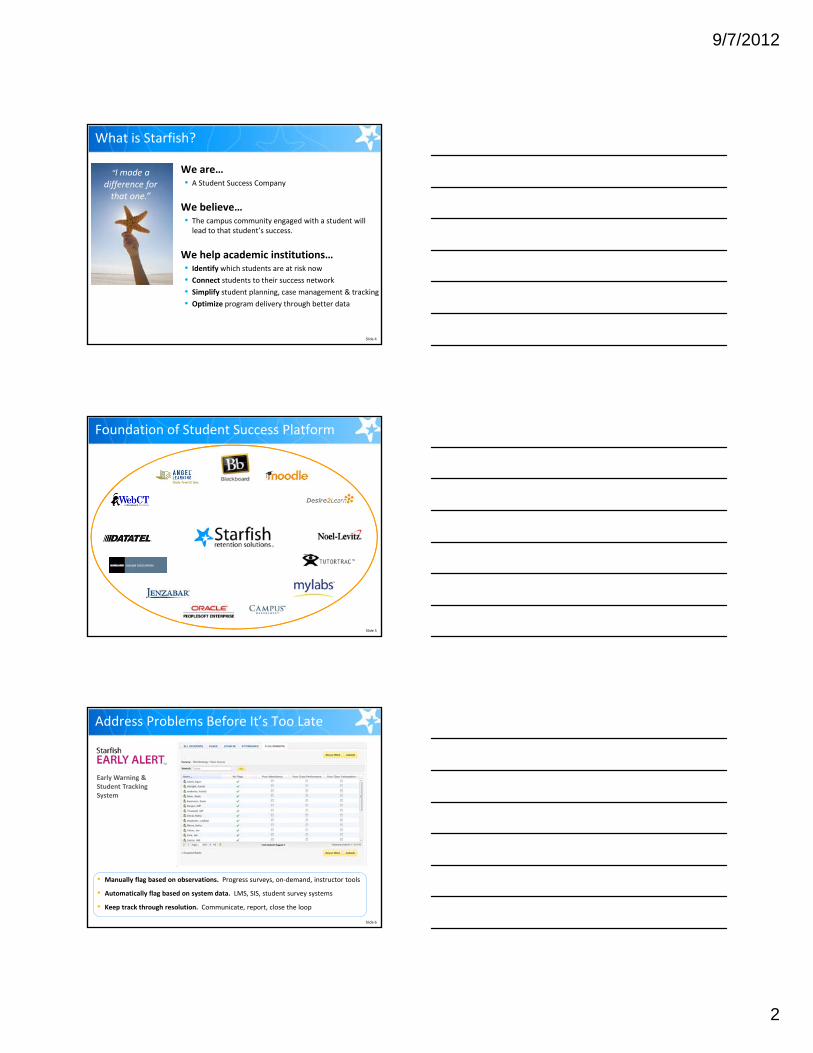
What is Starfish?
We are… • A Student Success Company
We believe…• The campus community engaged with a student will lead to that student’s success.
We help academic institutions…• Identify which students are at risk now
• Connect students to their success network
• Simplify student planning, case management & tracking
• Optimize program delivery through better data
Slide 4
“I made a difference for that one.”
Foundation of Student Success Platform
Slide 5
Address Problems Before It’s Too Late
Slide 6
• Manually flag based on observations. Progress surveys, on‐demand, instructor tools
• Automatically flag based on system data. LMS, SIS, student survey systems
• Keep track through resolution. Communicate, report, close the loop
Early Warning & Student Tracking System

9/7/2012
3
Advisor View of Student Folder
Slide 7
Drive Engagement
Slide 8
• Personalize your success network. People, offices, and services available to help
• Schedule meetings online. Individual and group. 2‐way sync with Microsoft® Outlook®
• Track progress. Plans, milestones, referrals, notes, history of appointments
Educational Support Networking System
The Starfish Community

9/7/2012
4
Example Goals, Metrics & Outcomes
Institution Type Goal & Metric Outcome
Four‐Year Private College
Persistence. Metric: Sophomore‐to‐juniorretention rates from current five‐year average of 62%.
The 2010 cohort had a 12%increase in retention over the previous five‐year average.
Four‐Year Public University Online Program
Persistence.Metric: Online students who are not participating in courses.
More than 26,000 flags for inactivity raised. 53% of students logged back in within 4 days of receiving a message from Starfish.
Four‐Year PublicUniversity
Instructor and student buy‐in. Metric: End user qualitative feedback from online questionnaires and focus groups.
Faculty indicated satisfaction with ease of use and effectiveness, with 100% noting they would use it again.
Two‐Year Community College
Instructor and student buy‐in. Metric: Instructor adoption and participation based on response rates to Starfish progress surveys.
70% of instructors surveyed responded within 8 days, raising more than 1,060 flags.
Extend Your Investment with Noel‐Levitz
• What. We enable you to combine the student motivation and receptivity
data from Noel‐Levitz with the Starfish tracking and case management system.
• Why. As a result, you have a seamless approach to identifying at‐risk and
receptive students, understanding their needs and then prioritizing and managing student interventions.
• Value. You are giving your advisors and first year experience instructors or success coaches real‐time, convenient access to valuable Noel‐Levitz data within the context of working directly with an at‐risk student throughout the term, helping them be better informed, more effective, and more efficient.
Slide 11
• College Student Inventory• Mid‐Year Student Assessment
• Student Retention Predictor• Second‐Year Student Assessment
How the Integration Works
• At‐Risk Students: Raise flags when issues are identified in Noel‐Levitz data sets.
• All Students: Provide a direct link from the Starfish student folder out to the student specific CSI report (PDF).
• Data is read by Starfish and flags are raised automatically.
• Zipped file of the PDF reports are imported into Starfish, displayed on the right student folders, and available to users with the correct permissions.
Slide 12

9/7/2012
5
Noel‐Levitz on the Starfish Student Folder
13
1
2
To learn more about Starfish, we invite you to connect with us.
Slide 14
Learn More
Conference Noel‐Levitz Conference July 24‐26, 2012
Web www.starfishsolutions.com
Webinars www.starfishsolutions.com/webinars
Twitter @Starfish360
Phone 703.260.1186
Beyond Retention:
Student Success with Starfish and Noel Levitz
Loralyn Taylor, Ph.D.

9/7/2012
6
High First Generation, High Pell, High Risk
Retention Rate
First Time Freshmen Fall-to-Fall Retention
Freshman to Soph
All Fresh: 60-65%
Bachelors: 64-65%
Associates: 50-60%
Soph to Junior
All Soph: 60-63%
Bachelors: 70-73%
Associates: 35-50%

9/7/2012
7
Summary Report
Retention Office
Accommodative Services
TRiO Advisor
ARP Advocate
Faculty Advisor
HEOP Advisor
Program Coordinators
Instructors
Academic Support
Student Life
Deans
Student
Student Development
Health Services

9/7/2012
8
Retention Office
Accommodative Services TRiO Advisor
ARP Advocate
Faculty Advisor
HEOP Advisor
Program Coordinators
Instructors
Academic Support
Student Life
Deans
Student
Student Development
Health Services
Early Warning & Student Tracking System
•Manual flags or flag surveys.
•Automatic flags – based on system data
•Automatic communication – appropriate personnel and/ or
student
•Close the loop – Results of intervention to flag
raiser
Educational Support Networking System
•My Success Network– Personalized for each student
•Service catalog– Campus support resources
•Online scheduling
•Appointment confirmation by email.
•Documentation of contact with students
– private and shared notes.
STARFISH
Accommodative Services
TRiO Advisor
ARP Advocate
Faculty Advisor
HEOP Advisor
Program Coordinators
Instructors
Academic Support
Student Life
Deans
Student
Student Development
Health Services

9/7/2012
9
Information Management
Three types of Flags– Informational
• Notify about concern
– Action• Student in need of intervention
– Urgent• Critical action needed
• Student in danger of suspension
Informational Flags
Low Grades
Attendance Concern
Missing Work
Social/Personal Concern
No Show in Class
Behavioral Issues
Academic Probation
Transitional Program
High Academic Risk
CSI Risk Factors
Registrar’s Office Hold
Financial Aid Hold
Student Accounts Hold
Health Services Hold
Did Not Pre-register
Action Flags
3 Flag Warning—Support Action
6 Flag Warning—Advisor and Support Action
Student Development—Private
Health Concern—Private
Missed Required Tutoring
Urgent Flags
Suspension for Non-payment
Academic Recovery Program Suspension Warning
Health Services Suspension Warning
Financial Aid Loss of Funding

9/7/2012
10
Dear STUDENT FIRST NAME:
Your instructor in CLASS NAME has reported that they are concerned about your grades on assignments and/or tests
We are concerned about your success!
Paul Smith’s has a number of student support services designed to help you on your path to graduation. These can be accessed through your home page in Starfish in the My Success Network channel on the bottom left of the screen or through the Success Network link at the top of the page.
Please take advantage of our student support resources.
The Academic Success Center has a number of resources including individual and group tutoring, supplemental instruction, and the Writing Center. Appointments can be made with Renee Marleau, the Tutor Coordinator, through Starfish.
Sincerely,
Virginia McAleese, Associate ProfessorDirector of the Academic Success Center
Feedback to FacultyFeedback has been provided for the Low Grades flag which you raised
on STUDENT NAME.
Flag Details
Student: STUDENT NAMEFlag Name: Low Grades Category: AcademicRaised On: 9/14/2010 Cleared On: 9/20/2010
Feedback From: Monica Buriello
Feedback: The student will be speaking to his professor, attending the SI, and getting tutoring. His tutoring was just assigned for Dendrology. We have a follow-up meeting planned for next week. If you would like to discuss this in more detail please contact me.
Identification of High Risk Students
• Pre-Enrollment– College Student Inventory (CSI)
– High Risk characteristics– First generation, Pell, HS GPA, minority

9/7/2012
11
Identification of At-Risk Students
• During semester– Become at-risk
– Behaviors—attendance, studying, homework
– Early Alert, Midterm grades, continuous reporting
• Pre-Semester– Probation
– Large gpa drops
Our customized CSI Risk Factor Score
• Scored High Risk =1 or not =0 • Study habits
• Self-reported college prep
• Dropout proneness
• Predicted academic difficulty
• Educational stress
• Academic stress
CSI Risk Factor Score
• Score 5 or 6• High Risk
• Raise CSI Risk Factor Flag• Counts toward 3 Flag Warning
• Pre-enrollment outreach• Voluntary Mentoring Program

9/7/2012
12
College Student Inventory
• Summary Observations & Receptivity Report– snapshot of CSI results
– Quick identification of high risk students
Early Alert Survey
• 4th week– Automated faculty survey
–Low grades,
–Missing work
–Attendance Concern,
–Social/Personal concerns

9/7/2012
13
Early Alert Survey
Early Alert Survey Results
2010 2011
Spring Fall Spring Fall
Sections Reporting 92% 98% 96% 84%
Completion Time 1.8 1.4 2.25 1.7
# Flags Raised 614 789 700 810
# Students Flagged 291 380 342 387
% Students Flagged 35% 38% 37% 36%
Top Five: Most Concentrated Departments (by number flagged)
DepartmentFlagged Students
Total Students
% Students
MAT 80 381 20
FOR 69 297 23
ENG 60 332 18
BIO 58 283 20
CHM 50 177 28

9/7/2012
14
Top Five: Most Concentrated Sections (by number flagged)
Section IDFlagged Students Total Students
% Students
BIO 101.LEC.01 52 191 27
FOR 110.LEC.01 31 84 36
CHM 141.LEC.01 18 113 15
CHM 141.LEC.02 16 69 23
FOR 110.LEC. 02 16 69 23
Key Performance Indicators• Pre-Enrollment Identification
– Do we identify high risk students?
– How accurate are we?
High and Low Risk Students identified by CSI Risk Factors
Low RiskHigh Risk % Change
Average GPA 2.74 1.60 -42%
Probation 14% 39% 179%
Withdraws 3% 11% 267%
% in Good Standing 79% 40% -49%

9/7/2012
15
5.0%
10.0%
15.0%
20.0%
25.0%
30.0%
35.0%
Prior Three-yearAverage
2010 2011
% o
f g
rad
es e
arn
ed
Final Grade Distribution First Time Students
A
B
C
D
F
0%
10%
20%
30%
40%
50%
60%
70%
80%
Prior 3 yr ave 2010 2011
First Semester GPA >2.0

9/7/2012
16
0.0%
10.0%
20.0%
30.0%
40.0%
50.0%
60.0%
70.0%
Prior Three-yearAverage
2010 2011
% Students with min 1 D or F grade
0.0%
5.0%
10.0%
15.0%
20.0%
25.0%
Prior 3 year ave 2008 2009
% Students Earning Associates
Assoc Seeking Graduating in 2 Years
Increase in Net Student Revenue due to Increased Overall Retention RateIncreased retention Additional Students Net Student Tuition
Spring 2010 to Fall 4.40% 36 360,000.00
Fall 2010 to Spring 0.80% 39 390,000.00
Spring 2011 to Fall 3.60% 59 590,000.00
Fall 2011 to Spring 2.00% 70 700,000.00
Grand Total $2,040,000.00

9/7/2012
17
We’re here to support your student success initiatives!
For More Information, Contact:Beth Richter
Associate Vice PresidentNoel-Levitz
[email protected], ext. 8785