STARBUCKS CORPORATION - …d18rn0p25nwr6d.cloudfront.net/CIK-0000829224/60e88e6d-18af-4f34... ·...
46
Table of Contents UNITED STATES SECURITIES AND EXCHANGE COMMISSION Washington, DC 20549 FORM 10-Q x QUARTERLY REPORT PURSUANT TO SECTION 13 OR 15(d) OF THE SECURITIES EXCHANGE ACT OF 1934 For the Quarterly Period Ended April 2, 2017 OR ¨ TRANSITION REPORT PURSUANT TO SECTION 13 OR 15(d) OF THE SECURITIES EXCHANGE ACT OF 1934 For the transition period from to . Commission File Number: 0-20322 Starbucks Corporation (Exact Name of Registrant as Specified in its Charter) Washington 91-1325671 (State or Other Jurisdiction of Incorporation or Organization) (IRS Employer Identification No.) 2401 Utah Avenue South, Seattle, Washington 98134 (Address of principal executive offices) (206) 447-1575 (Registrant’s Telephone Number, including Area Code) Indicate by check mark whether the registrant: (1) has filed all reports required to be filed by Section 13 or 15(d) of the Securities Exchange Act of 1934 during the preceding 12 months (or for such shorter period that the Registrant was required to file such reports), and (2) has been subject to such filing requirements for the past 90 days. Yes x No ¨ Indicate by check mark whether the registrant has submitted electronically and posted on its corporate Web site, if any, every Interactive Data File required to be submitted and posted pursuant to Rule 405 of Regulation S-T (§232.405 of this chapter) during the preceding 12 months (or for such shorter period that the registrant was required to submit and post such files). Yes x No ¨ Indicate by check mark whether the registrant is a large accelerated filer, an accelerated filer, a non-accelerated filer, smaller reporting company, or an emerging growth company. See the definitions of “large accelerated filer,” “accelerated filer,” “smaller reporting company” and “emerging growth company” in Rule 12b-2 of the Exchange Act. Large accelerated filer x Accelerated filer ¨ Non-accelerated filer ¨ (Do not check if a smaller reporting company) Smaller reporting company ¨ Emerging growth company ¨ If an emerging growth company, indicate by check mark if the registrant has elected not to use the extended transition period for complying with any new or revised financial accounting standards provided pursuant to Section 13(a) of the Exchange Act. ¨ Indicate by check mark whether the registrant is a shell company (as defined in Rule 12b-2 of the Exchange Act): Yes ¨ No x Indicate the number of shares outstanding of each of the issuer’s classes of common stock, as of the latest practicable date. Title Shares Outstanding as of April 26, 2017 Common Stock, par value $0.001 per share 1,448.1 million
Transcript of STARBUCKS CORPORATION - …d18rn0p25nwr6d.cloudfront.net/CIK-0000829224/60e88e6d-18af-4f34... ·...

Table of Contents
UNITED STATESSECURITIES AND EXCHANGE COMMISSION
Washington, DC 20549
FORM 10-Q
xQUARTERLY REPORT PURSUANT TO SECTION 13 OR 15(d) OF THE SECURITIES EXCHANGE ACT OF 1934For the Quarterly Period Ended April 2, 2017
OR
¨TRANSITION REPORT PURSUANT TO SECTION 13 OR 15(d) OF THE SECURITIES EXCHANGE ACT OF 1934For the transition period from to .
Commission File Number: 0-20322
Starbucks Corporation(Exact Name of Registrant as Specified in its Charter)
Washington 91-1325671(State or Other Jurisdiction of
Incorporation or Organization)(IRS Employer
Identification No.)
2401 Utah Avenue South, Seattle, Washington 98134(Address of principal executive offices)
(206) 447-1575(Registrant’s Telephone Number, including Area Code)
Indicate by check mark whether the registrant: (1) has filed all reports required to be filed by Section 13 or 15(d) of the Securities Exchange Act of 1934 during thepreceding 12 months (or for such shorter period that the Registrant was required to file such reports), and (2) has been subject to such filing requirements for thepast 90 days. Yes x No ¨Indicate by check mark whether the registrant has submitted electronically and posted on its corporate Web site, if any, every Interactive Data File required to besubmitted and posted pursuant to Rule 405 of Regulation S-T (§232.405 of this chapter) during the preceding 12 months (or for such shorter period that theregistrant was required to submit and post such files). Yes x No ¨
Indicate by check mark whether the registrant is a large accelerated filer, an accelerated filer, a non-accelerated filer, smaller reporting company, or an emerginggrowth company. See the definitions of “large accelerated filer,” “accelerated filer,” “smaller reporting company” and “emerging growth company” in Rule 12b-2of the Exchange Act.
Large accelerated filer x Accelerated filer ¨
Non-accelerated filer ¨(Do not check if a smaller reporting company) Smaller reporting company ¨
Emerging growth company ¨
If an emerging growth company, indicate by check mark if the registrant has elected not to use the extended transition period for complying with any new orrevised financial accounting standards provided pursuant to Section 13(a) of the Exchange Act. ¨
Indicate by check mark whether the registrant is a shell company (as defined in Rule 12b-2 of the Exchange Act): Yes ¨ No x Indicate the number of shares outstanding of each of the issuer’s classes of common stock, as of the latest practicable date.
Title Shares Outstanding as of April 26, 2017Common Stock, par value $0.001 per share 1,448.1 million

Table of Contents
STARBUCKS CORPORATIONFORM 10-Q
For the Quarterly Period Ended April 2, 2017Table of Contents
PART I. FINANCIAL INFORMATION
Item 1 Financial Statements (Unaudited): 3 Condensed Consolidated Statements of Earnings 3 Condensed Consolidated Statements of Comprehensive Income 4 Condensed Consolidated Balance Sheets 5 Condensed Consolidated Statements of Cash Flows 6 Index For Notes to Condensed Consolidated Financial Statements 7 Notes to Condensed Consolidated Financial Statements 8Item 2 Management’s Discussion and Analysis of Financial Condition and Results of Operations 21Item 3 Quantitative and Qualitative Disclosures About Market Risk 36Item 4 Controls and Procedures 36
PART II. OTHER INFORMATION
Item 1 Legal Proceedings 37Item 1A Risk Factors 37Item 2 Unregistered Sales of Equity Securities and Use of Proceeds 37Item 6 Exhibits 38Signatures 39

Table of Contents
PART I — FINANCIAL INFORMATIONItem 1. Financial Statements
STARBUCKS CORPORATIONCONDENSED CONSOLIDATED STATEMENTS OF EARNINGS
(inmillions,exceptpersharedata)(unaudited)
Quarter Ended Two Quarters Ended
Apr 2, 2017
Mar 27, 2016
Apr 2, 2017
Mar 27, 2016
Net revenues: Company-operated stores $ 4,195.4 $ 3,944.2 $ 8,664.7 $ 8,154.8Licensed stores 546.7 493.1 1,149.1 1,033.8CPG, foodservice and other 551.9 555.9 1,213.2 1,178.2
Total net revenues 5,294.0 4,993.2 11,027.0 10,366.8Cost of sales including occupancy costs 2,141.2 2,010.3 4,436.2 4,196.5Store operating expenses 1,586.4 1,466.4 3,224.6 2,972.6Other operating expenses 134.7 139.6 280.1 285.8Depreciation and amortization expenses 253.6 247.8 503.3 483.3General and administrative expenses 326.8 330.5 683.1 636.0
Total operating expenses 4,442.7 4,194.6 9,127.3 8,574.2Income from equity investees 84.1 65.6 168.6 129.7
Operating income 935.4 864.2 2,068.3 1,922.3Interest income and other, net 67.9 14.5 92.0 22.5Interest expense (22.9) (18.3) (46.7) (34.8)
Earnings before income taxes 980.4 860.4 2,113.6 1,910.0Income tax expense 327.6 285.4 709.0 647.4
Net earnings including noncontrolling interests 652.8 575.0 1,404.6 1,262.6Net loss attributable to noncontrolling interests — (0.1) (0.3) —Net earnings attributable to Starbucks $ 652.8 $ 575.1 $ 1,404.9 $ 1,262.6
Earnings per share - basic $ 0.45 $ 0.39 $ 0.97 $ 0.85Earnings per share - diluted $ 0.45 $ 0.39 $ 0.96 $ 0.84Weighted average shares outstanding:
Basic 1,453.2 1,472.1 1,455.3 1,479.0Diluted 1,464.8 1,486.6 1,467.7 1,495.0
Cash dividends declared per share $ 0.25 $ 0.20 $ 0.50 $ 0.40
SeeNotestoCondensedConsolidatedFinancialStatements.
3

Table of Contents
STARBUCKS CORPORATIONCONDENSED CONSOLIDATED STATEMENTS OF COMPREHENSIVE INCOME
(inmillions,unaudited)
Quarter Ended Two Quarters Ended
Apr 2, 2017
Mar 27, 2016
Apr 2, 2017
Mar 27, 2016
Net earnings including noncontrolling interests $ 652.8 $ 575.0 $ 1,404.6 $ 1,262.6Other comprehensive loss, net of tax:
Unrealized holding gains/(losses) on available-for-sale securities 1.9 3.8 (11.5) 4.8Tax (expense)/benefit (0.5) (1.4) 3.6 (1.8)
Unrealized gains/(losses) on cash flow hedging instruments (33.5) (68.1) 80.0 (62.3)Tax (expense)/benefit 7.7 17.4 (18.8) 14.7
Unrealized gains/(losses) on net investment hedging instruments (25.2) — 15.9 —Tax (expense)/benefit 9.3 — (5.9) —
Translation adjustment and other 58.6 56.1 (113.2) 30.0Tax (expense)/benefit 0.9 4.9 0.9 6.6
Reclassification adjustment for net (gains)/losses realized in netearnings for available-for-sale securities, hedging instruments, andtranslation adjustment
20.2
27.3
(61.5)
19.5
Tax expense/(benefit) (3.5) (4.1) 12.5 (1.3)Other comprehensive income/(loss) 35.9 35.9 (98.0) 10.2Comprehensive income including noncontrolling interests 688.7 610.9 1,306.6 1,272.8
Comprehensive loss attributable to noncontrolling interests — (0.1) (0.3) —
Comprehensive income attributable to Starbucks $ 688.7 $ 611.0 $ 1,306.9 $ 1,272.8
SeeNotestoCondensedConsolidatedFinancialStatements.
4

Table of Contents
STARBUCKS CORPORATIONCONDENSED CONSOLIDATED BALANCE SHEETS
(inmillions,exceptpersharedata)(unaudited)
Apr 2, 2017
Oct 2, 2016
ASSETS Current assets:
Cash and cash equivalents $ 2,163.9 $ 2,128.8Short-term investments 231.0 134.4Accounts receivable, net 791.0 768.8Inventories 1,323.6 1,378.5Prepaid expenses and other current assets 409.9 347.4
Total current assets 4,919.4 4,757.9Long-term investments 1,070.1 1,141.7Equity and cost investments 391.2 354.5Property, plant and equipment, net 4,564.5 4,533.8Deferred income taxes, net 811.2 885.4Other long-term assets 368.0 403.3Other intangible assets 467.7 516.3Goodwill 1,635.8 1,719.6TOTAL ASSETS $ 14,227.9 $ 14,312.5
LIABILITIES AND EQUITY Current liabilities:
Accounts payable $ 686.9 $ 730.6Accrued liabilities 1,730.6 1,999.1Insurance reserves 217.9 246.0Stored value card liability 1,339.7 1,171.2Short-term debt 25.0 —Current portion of long-term debt — 399.9
Total current liabilities 4,000.1 4,546.8Long-term debt 3,942.5 3,185.3Other long-term liabilities 673.9 689.7
Total liabilities 8,616.5 8,421.8Shareholders’ equity:
Common stock ($0.001 par value) — authorized, 2,400.0 shares; issued and outstanding, 1,447.7 and1,460.5 shares, respectively 1.4 1.5Additional paid-in capital 41.1 41.1Retained earnings 5,768.9 5,949.8Accumulated other comprehensive loss (206.4) (108.4)
Total shareholders’ equity 5,605.0 5,884.0Noncontrolling interests 6.4 6.7
Total equity 5,611.4 5,890.7TOTAL LIABILITIES AND EQUITY $ 14,227.9 $ 14,312.5
SeeNotestoCondensedConsolidatedFinancialStatements.
5

Table of Contents
STARBUCKS CORPORATIONCONDENSED CONSOLIDATED STATEMENTS OF CASH FLOWS
(inmillions,unaudited)
Two Quarters Ended
Apr 2, 2017
Mar 27, 2016
OPERATING ACTIVITIES: Net earnings including noncontrolling interests $ 1,404.6 $ 1,262.6Adjustments to reconcile net earnings to net cash provided by operating activities:
Depreciation and amortization 529.8 509.3Deferred income taxes, net 62.8 260.2Income earned from equity method investees (129.4) (96.5)Distributions received from equity method investees 94.1 102.8Gain resulting from sale of equity in joint venture and certain retail operations (9.6) (0.6)Stock-based compensation 104.9 108.6Excess tax benefit on share-based awards (52.7) (89.3)Other (11.4) 24.5Cash provided by changes in operating assets and liabilities:
Accounts receivable (45.6) (39.8)Inventories 45.4 15.3Accounts payable (21.5) (17.2)Stored value card liability 179.2 216.2Other operating assets and liabilities (211.6) (70.6)
Net cash provided by operating activities 1,939.0 2,185.5INVESTING ACTIVITIES: Purchases of investments (485.7) (579.0)Sales of investments 470.6 247.7Maturities and calls of investments 33.6 4.4Additions to property, plant and equipment (637.9) (668.2)Proceeds from sale of equity in joint venture — 30.2Other 54.1 12.1Net cash used by investing activities (565.3) (952.8)FINANCING ACTIVITIES: Proceeds from issuance of commercial paper 25.0 149.1Proceeds from issuance of long-term debt 750.2 499.7Principal payments on long-term debt (400.0) —Proceeds from issuance of common stock 97.5 79.6Excess tax benefit on share-based awards 52.7 89.3Cash dividends paid (727.8) (591.8)Repurchase of common stock (1,046.1) (1,584.5)Minimum tax withholdings on share-based awards (70.1) (103.6)Other 0.7 (0.8)Net cash used by financing activities (1,317.9) (1,463.0)Effect of exchange rate changes on cash and cash equivalents (20.7) (5.4)Net increase/(decrease) in cash and cash equivalents 35.1 (235.7)CASH AND CASH EQUIVALENTS: Beginning of period 2,128.8 1,530.1End of period $ 2,163.9 $ 1,294.4
SUPPLEMENTAL DISCLOSURE OF CASH FLOW INFORMATION: Cash paid during the period for: Interest, net of capitalized interest $ 48.9 $ 34.4Income taxes, net of refunds $ 822.6 $ 458.1
SeeNotestoCondensedConsolidatedFinancialStatements.

6
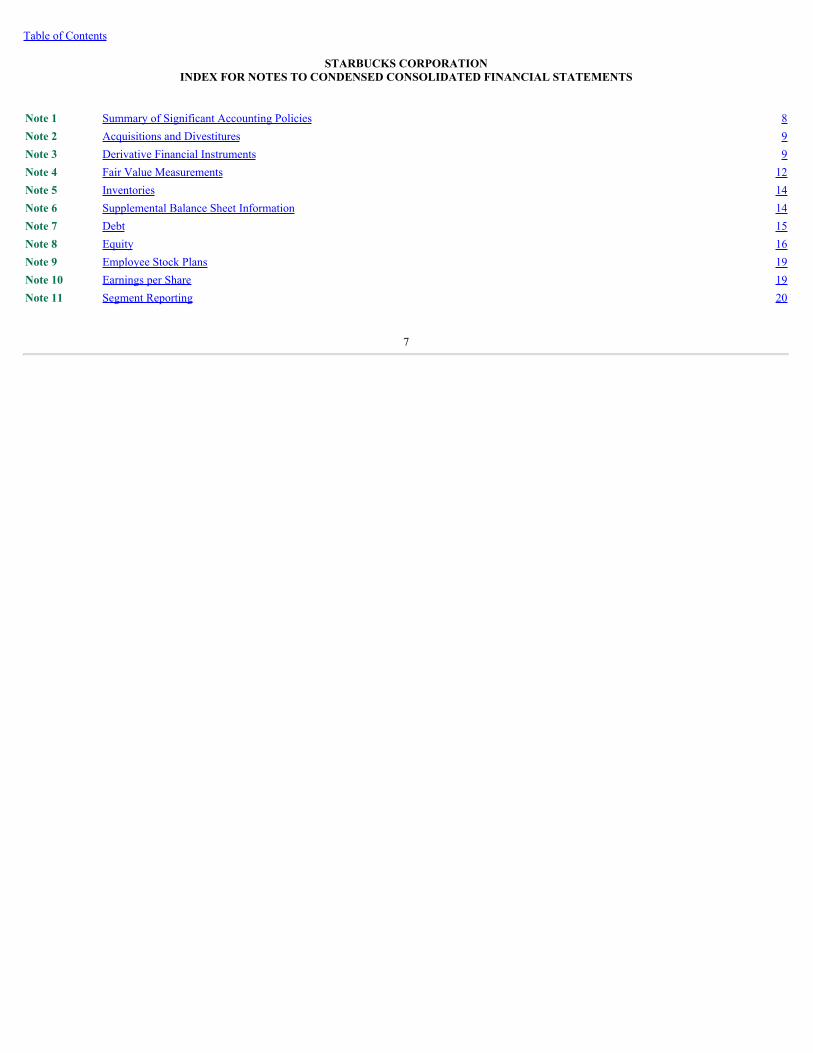
Table of Contents
STARBUCKS CORPORATIONINDEX FOR NOTES TO CONDENSED CONSOLIDATED FINANCIAL STATEMENTS
Note 1 Summary of Significant Accounting Policies 8Note 2 Acquisitions and Divestitures 9Note 3 Derivative Financial Instruments 9Note 4 Fair Value Measurements 12Note 5 Inventories 14Note 6 Supplemental Balance Sheet Information 14Note 7 Debt 15Note 8 Equity 16Note 9 Employee Stock Plans 19Note 10 Earnings per Share 19Note 11 Segment Reporting 20
7

Table of Contents
STARBUCKS CORPORATIONNOTES TO CONDENSED CONSOLIDATED FINANCIAL STATEMENTS
(unaudited)
Note 1: Summary of Significant Accounting Policies
FinancialStatementPreparationThe unaudited condensed consolidated financial statements as of April 2, 2017 , and for the quarter and two quarters ended April 2, 2017 and March 27, 2016 ,have been prepared by Starbucks Corporation under the rules and regulations of the Securities and Exchange Commission (“SEC”). In the opinion of management,the financial information for the quarter and two quarters ended April 2, 2017 and March 27, 2016 reflects all adjustments and accruals, which are of a normalrecurring nature, necessary for a fair presentation of the financial position, results of operations and cash flows for the interim periods. In this Quarterly Report onForm 10-Q (“10-Q”), Starbucks Corporation is referred to as “Starbucks,” the “Company,” “we,” “us” or “our.”
The financial information as of October 2, 2016 is derived from our audited consolidated financial statements and notes for the fiscal year ended October 2, 2016(“fiscal 2016 ”) included in Item 8 in the Fiscal 2016 Annual Report on Form 10-K (the “10-K”). The information included in this 10-Q should be read inconjunction with the footnotes and management’s discussion and analysis of the consolidated financial statements in the 10-K.
The results of operations for the quarter and two quarters ended April 2, 2017 are not necessarily indicative of the results of operations that may be achieved for theentire fiscal year ending October 1, 2017 ("fiscal 2017 ").
RecentAccountingPronouncementsIn January 2017, the Financial Accounting Standards Board (“FASB”) issued guidance that simplifies the measurement of goodwill impairment. Under this newguidance, an impairment charge, if triggered, is calculated as the difference between a reporting unit’s carrying value and fair value, but it is limited to the carryingvalue of goodwill. Current guidance, however, requires an impairment charge to be calculated as the excess of the carrying value of goodwill over its implied fairvalue. During the second quarter of fiscal 2017, we elected to early-adopt this guidance on a prospective basis, and during the third quarter of fiscal 2017, we willconduct our annual goodwill impairment testing. Among our larger reporting units, the fair value of the Teavana reporting unit was closest to its carrying value perour most recently completed test in third quarter of fiscal 2016. As of April 2, 2017 , goodwill attributed to this unit was $467.5 million . We will continue toassess its recoverability as management evaluates the performance and strategy of the reporting unit.
In October 2016, the FASB issued guidance on the accounting for income tax effects of intercompany sales or transfers of assets other than inventory. Theguidance requires entities to recognize the income tax impact of an intra-entity sale or transfer of an asset other than inventory when the sale or transfer occurs,rather than when the asset has been sold to an outside party. The guidance will require a modified retrospective application with a cumulative catch-up adjustmentto opening retained earnings at the beginning of our first quarter of fiscal 2019 but permits adoption in an earlier period. We are currently evaluating the impactthis guidance will have on our consolidated financial statements and the timing of adoption.
In June 2016, the FASB issued guidance on the measurement and recognition of credit losses on most financial assets. For trade receivables, loans, and held-to-maturity debt securities, the current probable loss recognition methodology is being replaced by an expected credit loss model. For available-for-sale debtsecurities, the recognition model on credit losses is generally unchanged, except the losses will be presented as an adjustable allowance. The guidance will beapplied retrospectively with the cumulative effect recognized as of the date of adoption. The guidance will become effective at the beginning of our first quarter offiscal 2021 but can be adopted as early as the beginning of our first quarter of fiscal 2020. We are currently evaluating the impact this guidance will have on ourconsolidated financial statements and the timing of adoption.In March 2016, the FASB issued guidance related to stock-based compensation, which changes the accounting and classification of excess tax benefits andminimum tax withholdings on share-based awards. The guidance becomes effective at the beginning of our first quarter of fiscal 2018 but permits adoption in anearlier period. With this adoption, excess tax benefits and tax deficiencies related to stock-based compensation will be prospectively reflected as income taxexpense in our consolidated statement of earnings instead of additional paid-in capital on our consolidated balance sheet. Additionally, within our consolidatedstatement of cash flows, this guidance will require excess tax benefits to be presented as an operating activity, rather than a financing activity, in the same manneras other cash flows related to income taxes. We are currently evaluating the timing and impact of adopting this guidance; however, as a result of the presentationrequirements associated with the standard, we expect this adoption to have a significant impact on income tax expense and earnings per share, as reported in ourconsolidated statement of earnings, and consolidated statement of cash flows.In March 2016, the FASB issued guidance for financial liabilities resulting from selling prepaid stored value products that are redeemable at third-party merchants.Under the new guidance, expected breakage amounts associated with these products must
8
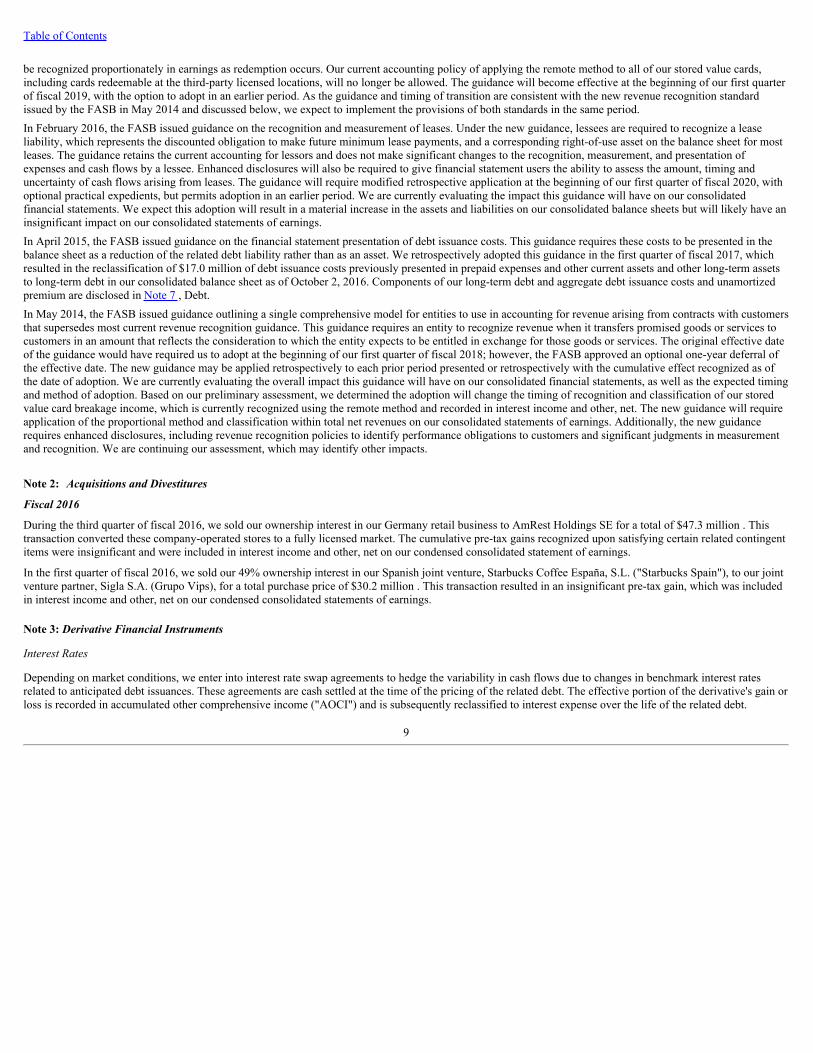
Table of Contents
be recognized proportionately in earnings as redemption occurs. Our current accounting policy of applying the remote method to all of our stored value cards,including cards redeemable at the third-party licensed locations, will no longer be allowed. The guidance will become effective at the beginning of our first quarterof fiscal 2019, with the option to adopt in an earlier period. As the guidance and timing of transition are consistent with the new revenue recognition standardissued by the FASB in May 2014 and discussed below, we expect to implement the provisions of both standards in the same period.In February 2016, the FASB issued guidance on the recognition and measurement of leases. Under the new guidance, lessees are required to recognize a leaseliability, which represents the discounted obligation to make future minimum lease payments, and a corresponding right-of-use asset on the balance sheet for mostleases. The guidance retains the current accounting for lessors and does not make significant changes to the recognition, measurement, and presentation ofexpenses and cash flows by a lessee. Enhanced disclosures will also be required to give financial statement users the ability to assess the amount, timing anduncertainty of cash flows arising from leases. The guidance will require modified retrospective application at the beginning of our first quarter of fiscal 2020, withoptional practical expedients, but permits adoption in an earlier period. We are currently evaluating the impact this guidance will have on our consolidatedfinancial statements. We expect this adoption will result in a material increase in the assets and liabilities on our consolidated balance sheets but will likely have aninsignificant impact on our consolidated statements of earnings.In April 2015, the FASB issued guidance on the financial statement presentation of debt issuance costs. This guidance requires these costs to be presented in thebalance sheet as a reduction of the related debt liability rather than as an asset. We retrospectively adopted this guidance in the first quarter of fiscal 2017, whichresulted in the reclassification of $17.0 million of debt issuance costs previously presented in prepaid expenses and other current assets and other long-term assetsto long-term debt in our consolidated balance sheet as of October 2, 2016. Components of our long-term debt and aggregate debt issuance costs and unamortizedpremium are disclosed in Note 7 , Debt.In May 2014, the FASB issued guidance outlining a single comprehensive model for entities to use in accounting for revenue arising from contracts with customersthat supersedes most current revenue recognition guidance. This guidance requires an entity to recognize revenue when it transfers promised goods or services tocustomers in an amount that reflects the consideration to which the entity expects to be entitled in exchange for those goods or services. The original effective dateof the guidance would have required us to adopt at the beginning of our first quarter of fiscal 2018; however, the FASB approved an optional one-year deferral ofthe effective date. The new guidance may be applied retrospectively to each prior period presented or retrospectively with the cumulative effect recognized as ofthe date of adoption. We are currently evaluating the overall impact this guidance will have on our consolidated financial statements, as well as the expected timingand method of adoption. Based on our preliminary assessment, we determined the adoption will change the timing of recognition and classification of our storedvalue card breakage income, which is currently recognized using the remote method and recorded in interest income and other, net. The new guidance will requireapplication of the proportional method and classification within total net revenues on our consolidated statements of earnings. Additionally, the new guidancerequires enhanced disclosures, including revenue recognition policies to identify performance obligations to customers and significant judgments in measurementand recognition. We are continuing our assessment, which may identify other impacts.
Note 2: Acquisitions and Divestitures
Fiscal 2016
During the third quarter of fiscal 2016, we sold our ownership interest in our Germany retail business to AmRest Holdings SE for a total of $47.3 million . Thistransaction converted these company-operated stores to a fully licensed market. The cumulative pre-tax gains recognized upon satisfying certain related contingentitems were insignificant and were included in interest income and other, net on our condensed consolidated statement of earnings.
In the first quarter of fiscal 2016, we sold our 49% ownership interest in our Spanish joint venture, Starbucks Coffee España, S.L. ("Starbucks Spain"), to our jointventure partner, Sigla S.A. (Grupo Vips), for a total purchase price of $30.2 million . This transaction resulted in an insignificant pre-tax gain, which was includedin interest income and other, net on our condensed consolidated statements of earnings.
Note 3: Derivative Financial Instruments
InterestRates
Depending on market conditions, we enter into interest rate swap agreements to hedge the variability in cash flows due to changes in benchmark interest ratesrelated to anticipated debt issuances. These agreements are cash settled at the time of the pricing of the related debt. The effective portion of the derivative's gain orloss is recorded in accumulated other comprehensive income ("AOCI") and is subsequently reclassified to interest expense over the life of the related debt.
9

Table of Contents
ForeignCurrencyTo reduce cash flow volatility from foreign currency fluctuations, we enter into forward and swap contracts to hedge portions of cash flows of anticipatedintercompany royalty payments, inventory purchases, and intercompany borrowing and lending activities. The effective portion of the derivative's gain or loss isrecorded in AOCI and is subsequently reclassified to revenue, cost of sales including occupancy costs, or interest income and other, net, respectively, when thehedged exposure affects net earnings.From time to time, we enter into forward contracts or use foreign currency-denominated debt to hedge the currency exposure of our net investment in certaininternational operations. The effective portion of these instruments' gain or loss is recorded in AOCI and is subsequently reclassified to net earnings when thehedged net investment is either sold or substantially liquidated.Foreign currency forward and swap contracts not designated as hedging instruments are used to mitigate the foreign exchange risk of certain other balance sheetitems. Gains and losses from these derivatives are largely offset by the financial impact of translating foreign currency denominated payables and receivables;these gains and losses are recorded in interest income and other, net.
CommoditiesDepending on market conditions, we may enter into coffee futures contracts and collars (the combination of a purchased call option and a sold put option) to hedgea portion of anticipated cash flows under our price-to-be-fixed green coffee contracts, which are described further in Note 5 , Inventories. The effective portion ofeach derivative's gain or loss is recorded in AOCI and is subsequently reclassified to cost of sales including occupancy costs when the hedged exposure affects netearnings.To mitigate the price uncertainty of a portion of our future purchases, primarily of dairy products, diesel fuel and other commodities, we enter into swap contracts,futures and collars that are not designated as hedging instruments. Gains and losses from these derivatives are recorded in interest income and other, net to helpoffset price fluctuations on our beverage, food, packaging and transportation costs, which are included in cost of sales including occupancy costs on ourconsolidated statements of earnings.Gains and losses on derivative contracts and foreign currency-denominated debt designated as hedging instruments included in AOCI and expected to bereclassified into earnings within 12 months, net of tax ( inmillions):
Net Gains/(Losses)Included in AOCI Net Gains Expected to be
Reclassified from AOCI intoEarnings within 12 Months
OutstandingContract/Debt
Remaining Maturity(Months)
Apr 2, 2017
Oct 2, 2016
Cash Flow Hedges: Interest rates $ 19.0 $ 20.5 $ 3.0 0Cross-currency swaps (9.0) (7.7) — 92Foreign currency - other 11.5 (0.4) 9.6 34Coffee 0.1 (1.6) 0.1 9
Net Investment Hedges: Foreign currency 17.4 1.3 — 0Foreign currency debt (6.1) — — 84
10

Table of Contents
Pretax gains and losses on derivative contracts and foreign-denominated long-term debt designated as hedging instruments recognized in other comprehensiveincome ("OCI") and reclassifications from AOCI to earnings ( inmillions):
Quarter Ended Two Quarters Ended
Gains/(Losses)Recognized in
OCI Before Reclassifications Gains/(Losses) Reclassified from
AOCI to Earnings
Gains/(Losses)Recognized in
OCI Before Reclassifications Gains/(Losses) Reclassified from
AOCI to Earnings
Apr 2, 2017
Mar 27, 2016
Apr 2, 2017
Mar 27, 2016
Apr 2, 2017
Mar 27, 2016
Apr 2, 2017
Mar 27, 2016
Cash Flow Hedges: Interest rates $ — $ (11.4) $ 1.2 $ 1.3 $ — $ (8.3) $ 2.4 $ 2.8Cross-currency swaps (22.7) (39.6) (23.4) (36.4) 52.6 (44.9) 54.2 (38.2)Foreign currency - other (10.7) (18.1) 3.6 7.8 26.5 (8.8) 8.0 16.3Coffee (0.1) 0.9 (0.3) (0.5) 0.9 (0.4) (1.0) (0.6)
Net Investment Hedges: Foreign currency (15.6) — — — 25.5 — — —Foreign currency debt (9.6) — — — (9.6) — — —
Pretax gains and losses on derivative contracts not designated as hedging instruments recognized in earnings ( inmillions):
Gains/(Losses) Recognized in Earnings
Quarter Ended Two Quarters Ended
Apr 2, 2017 Mar 27, 2016 Apr 2, 2017 Mar 27, 2016
Foreign currency $ (5.0) $ (4.0) $ 3.4 $ (1.9)Coffee — 0.1 — —Dairy (2.4) (1.4) 2.8 (7.0)Diesel fuel and other commodities 0.4 0.5 0.5 (4.2)
Notional amounts of outstanding derivative contracts (inmillions):
Apr 2, 2017 Oct 2, 2016
Cross-currency swaps $ 558 $ 660Foreign currency - other 1,152 688Coffee 99 7Dairy 45 76Diesel fuel and other commodities 50 46
Fair value of outstanding derivative contracts ( inmillions):
Derivative Assets Derivative Liabilities
Apr 2, 2017 Oct 2, 2016 Apr 2, 2017 Oct 2, 2016
Designated Derivative Hedging Instruments: Cross-currency swaps $ 7.5 $ — $ 11.9 $ 57.0Foreign currency - other 21.4 20.8 6.3 24.0Coffee 0.5 1.8 0.5 —
Non-designated Derivative Hedging Instruments: Foreign currency 13.6 6.2 7.6 6.5Dairy 0.2 1.5 1.4 1.6Diesel fuel and other commodities 1.0 3.8 0.8 0.5
11
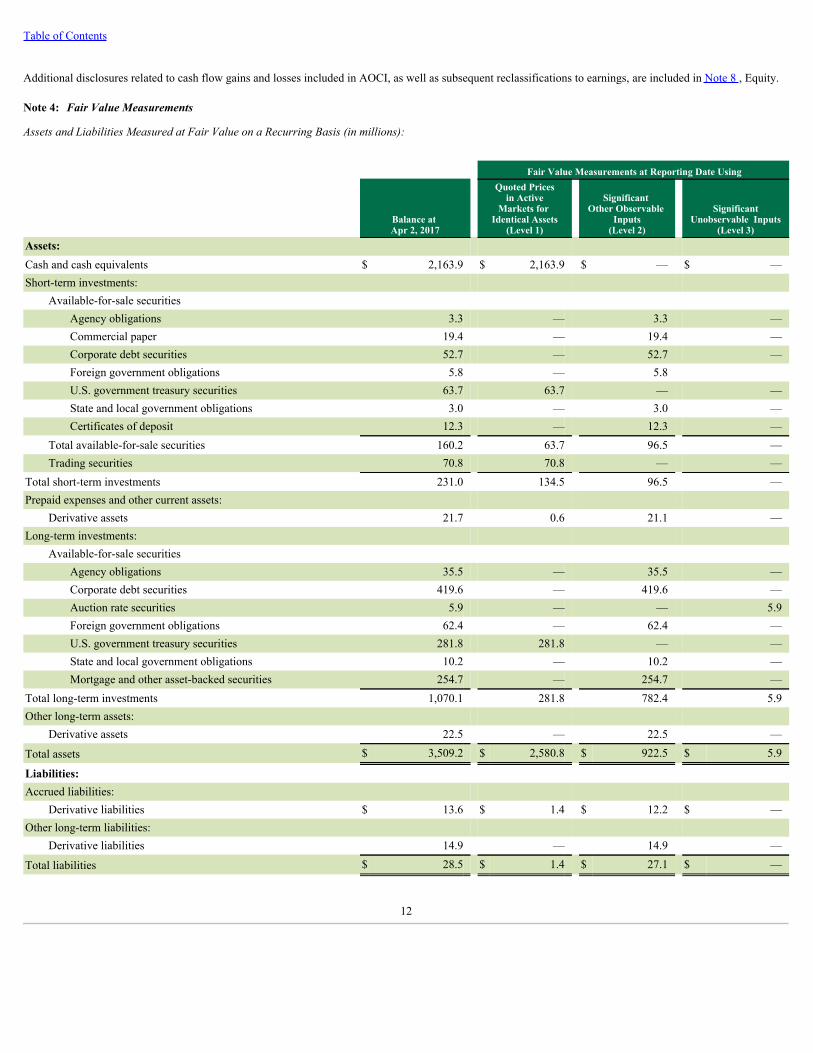
Table of Contents
Additional disclosures related to cash flow gains and losses included in AOCI, as well as subsequent reclassifications to earnings, are included in Note 8 , Equity.
Note 4: Fair Value Measurements
AssetsandLiabilitiesMeasuredatFairValueonaRecurringBasis(inmillions):
Fair Value Measurements at Reporting Date Using
Balance at Apr 2, 2017
Quoted Pricesin Active
Markets for Identical Assets
(Level 1)
Significant Other Observable
Inputs(Level 2)
SignificantUnobservable Inputs
(Level 3)Assets: Cash and cash equivalents $ 2,163.9 $ 2,163.9 $ — $ —Short-term investments:
Available-for-sale securities Agency obligations 3.3 — 3.3 —Commercial paper 19.4 — 19.4 —Corporate debt securities 52.7 — 52.7 —Foreign government obligations 5.8 — 5.8 U.S. government treasury securities 63.7 63.7 — —State and local government obligations 3.0 — 3.0 —Certificates of deposit 12.3 — 12.3 —
Total available-for-sale securities 160.2 63.7 96.5 —Trading securities 70.8 70.8 — —
Total short-term investments 231.0 134.5 96.5 —Prepaid expenses and other current assets:
Derivative assets 21.7 0.6 21.1 —Long-term investments:
Available-for-sale securities Agency obligations 35.5 — 35.5 —Corporate debt securities 419.6 — 419.6 —Auction rate securities 5.9 — — 5.9Foreign government obligations 62.4 — 62.4 —U.S. government treasury securities 281.8 281.8 — —State and local government obligations 10.2 — 10.2 —Mortgage and other asset-backed securities 254.7 — 254.7 —
Total long-term investments 1,070.1 281.8 782.4 5.9Other long-term assets:
Derivative assets 22.5 — 22.5 —
Total assets $ 3,509.2 $ 2,580.8 $ 922.5 $ 5.9
Liabilities: Accrued liabilities:
Derivative liabilities $ 13.6 $ 1.4 $ 12.2 $ —Other long-term liabilities:
Derivative liabilities 14.9 — 14.9 —
Total liabilities $ 28.5 $ 1.4 $ 27.1 $ —
12

Table of Contents
Fair Value Measurements at Reporting Date Using
Balance at Oct 2, 2016
Quoted Pricesin Active
Markets for Identical Assets
(Level 1)
Significant Other Observable
Inputs(Level 2)
SignificantUnobservable Inputs
(Level 3)Assets: Cash and cash equivalents $ 2,128.8 $ 2,128.8 $ — $ —Short-term investments:
Available-for-sale securities Agency obligations 1.3 — 1.3 —Commercial paper 2.6 — 2.6 —Corporate debt securities 34.2 — 34.2 —Foreign government obligations 5.5 — 5.5 —U.S. government treasury securities 15.8 15.8 — —State and local government obligations 0.5 — 0.5 —Certificates of deposit 5.8 — 5.8 —
Total available-for-sale securities 65.7 15.8 49.9 —Trading securities 68.7 68.7 — —
Total short-term investments 134.4 84.5 49.9 —Prepaid expenses and other current assets:
Derivative assets 27.7 3.1 24.6 —Long-term investments:
Available-for-sale securities Agency obligations 44.4 — 44.4 —Corporate debt securities 459.3 — 459.3 —Auction rate securities 5.7 — — 5.7Foreign government obligations 46.7 — 46.7 —U.S. government treasury securities 358.2 358.2 — —State and local government obligations 57.5 — 57.5 —Mortgage and other asset-backed securities 169.9 — 169.9 —
Total long-term investments 1,141.7 358.2 777.8 5.7Other long-term assets:
Derivative assets 6.4 — 6.4 —
Total assets $ 3,439.0 $ 2,574.6 $ 858.7 $ 5.7Liabilities: Accrued liabilities:
Derivative liabilities $ 18.0 $ 1.7 $ 16.3 $ —Other long-term liabilities:
Derivative liabilities 71.6 — 71.6 —Total $ 89.6 $ 1.7 $ 87.9 $ —
There were no transfers between levels, and there was no significant activity within Level 3 instruments during the periods presented. The fair values of anyfinancial instruments presented above exclude the impact of netting assets and liabilities when a legally enforceable master netting agreement exists.Gross unrealized holding gains and losses on investments were not material as of April 2, 2017 and October 2, 2016 .
AssetsandLiabilitiesMeasuredatFairValueonaNonrecurringBasisAssets and liabilities recognized or disclosed at fair value on the condensed consolidated financial statements on a nonrecurring basis include items such asproperty, plant and equipment, goodwill and other intangible assets, equity and cost method
13

Table of Contents
investments, and other assets. These assets are measured at fair value if determined to be impaired. During the quarter and two quarters ended April 2, 2017 andMarch 27, 2016 , there were no material fair value adjustments.
The estimated fair value of our long-term debt based on the quoted market price (Level 2) is included at Note 7 , Debt.
Note 5: Inventories (inmillions)
Apr 2, 2017 Oct 2, 2016 Mar 27, 2016Coffee:
Unroasted $ 599.2 $ 561.6 $ 585.5Roasted 272.8 300.4 261.8
Other merchandise held for sale 244.6 308.6 255.0Packaging and other supplies 207.0 207.9 190.8Total $ 1,323.6 $ 1,378.5 $ 1,293.1
Other merchandise held for sale includes, among other items, serveware and tea. Inventory levels vary due to seasonality, commodity market supply and pricefluctuations.
As of April 2, 2017 , we had committed to purchasing green coffee totaling $441 million under fixed-price contracts and an estimated $676 million under price-to-be-fixed contracts. As of April 2, 2017 , approximately $99 million of our price-to-be fixed contracts were effectively fixed through the use of futures contracts.Price-to-be-fixed contracts are purchase commitments whereby the quality, quantity, delivery period, and other negotiated terms are agreed upon, but the date, andtherefore the price, at which the base “C” coffee commodity price component will be fixed has not yet been established. For most contracts, either Starbucks or theseller has the option to “fix” the base “C” coffee commodity price prior to the delivery date. For other contracts, Starbucks and the seller may agree upon pricingparameters determined by the base "C" coffee commodity price. Until prices are fixed, we estimate the total cost of these purchase commitments. We believe,based on relationships established with our suppliers in the past, the risk of non-delivery on these purchase commitments is remote.
Note 6: Supplemental Balance Sheet Information (inmillions)
Property, Plant and Equipment, net
Apr 2, 2017 Oct 2, 2016Land $ 46.8 $ 46.6Buildings 468.2 458.4Leasehold improvements 6,042.5 5,892.9Store equipment 1,983.7 1,931.7Roasting equipment 603.3 605.4Furniture, fixtures and other 1,431.3 1,366.9Work in progress 311.5 271.4Property, plant and equipment, gross 10,887.3 10,573.3Accumulated depreciation (6,322.8) (6,039.5)Property, plant and equipment, net $ 4,564.5 $ 4,533.8
Accrued Liabilities
Apr 2, 2017 Oct 2, 2016Accrued compensation and related costs $ 468.4 $ 510.8Accrued occupancy costs 135.5 137.5Accrued taxes 201.8 368.4Accrued dividends payable 361.9 365.1Accrued capital and other operating expenditures 563.0 617.3Total accrued liabilities $ 1,730.6 $ 1,999.1
14

Table of Contents
Note 7: Debt
Short-termDebtUnder our commercial paper program, we may issue unsecured commercial paper notes up to a maximum aggregate amount outstanding at any time of $1 billion ,with individual maturities that may vary but not exceed 397 days from the date of issue. Amounts outstanding under the commercial paper program are required tobe backstopped by available commitments under our credit facility. The proceeds from borrowings under our commercial paper program may be used for workingcapital needs, capital expenditures and other corporate purposes, including, but not limited to, business expansion, payment of cash dividends on our commonstock and share repurchases. As of April 2, 2017 , we had $25 million of borrowings outstanding under the program. The estimated fair value of the commercialpaper approximates its carrying value.
Long-termDebt
In March 2017, we issued Japanese yen-denominated long-term debt in an underwritten registered public offering. The 7 -year 0.372% Senior Notes (the "2024notes") due March 2024 were issued with a face value of ¥ 85 billion , of which ¥ 76.0 billion has been designated to hedge the foreign currency exposure of ournet investment in Japan. Interest on the 2024 notes is payable semi-annually on March 15 and September 15 of each year, commencing on September 15, 2017 .
In December 2016, we repaid the $400 million of 0.875% Senior Notes (the "2016 notes") at maturity.
Components of long-term debt including the associated interest rates and related estimated fair values by calendar maturity ( inmillions,exceptinterestrates):
Apr 2, 2017 Oct 2, 2016
Stated Interest RateEffective Interest
Rate (1)Issuance Face Value Estimated Fair Value Face Value Estimated Fair Value 2016 notes $ — $ — $ 400.0 $ 400 0.875% 0.941%2018 notes 350.0 354 350.0 357 2.000% 2.012%2021 notes 500.0 502 500.0 511 2.100% 2.293%2021 notes 250.0 251 250.0 255 2.100% 1.600%2022 notes 500.0 509 500.0 526 2.700% 2.819%2023 notes 750.0 806 750.0 839 3.850% 2.860%2024 notes (2) 761.1 762 — — 0.372% 0.462%2026 notes 500.0 480 500.0 509 2.450% 2.511%2045 notes 350.0 370 350.0 417 4.300% 4.348%
Total 3,961.1 4,034 3,600.0 3,814 Aggregate debt issuance costs andunamortized premium, net (18.6) (14.8)
Total $ 3,942.5 $ 3,585.2
(1) Includes the effects of the amortization of any premium or discount and any gain or loss upon settlement of related treasury locks or forward-starting interestrate swaps utilized to hedge the interest rate risk prior to the debt issuance.
(2) Japanese yen-denominated long-term debt.
The indentures under which the above notes were issued require us to maintain compliance with certain covenants, including limits on future liens and sale andleaseback transactions on certain material properties. As of April 2, 2017 , we were in compliance with all applicable covenants.
15

Table of Contents
The following table summarizes our long-term debt maturities as of April 2, 2017 by fiscal year ( inmillions):
Fiscal Year Total
2018 $ —2019 350.02020 —2021 750.02022 500.0Thereafter 2,361.1
Total $ 3,961.1
Note 8: Equity
Changes in total equity (inmillions):
Two Quarters Ended
Apr 2, 2017 Mar 27, 2016
Attributable to
Starbucks Noncontrolling
interests Total Equity Attributable to
Starbucks Noncontrolling interest Total EquityBeginning balance of total equity $ 5,884.0 $ 6.7 $ 5,890.7 $ 5,818.0 $ 1.8 $ 5,819.8
Net earnings including noncontrolling interests 1,404.9 (0.3) 1,404.6 1,262.6 — 1,262.6Translation adjustment and other, net ofreclassifications and tax (112.3) — (112.3) 36.6 — 36.6
Unrealized gains/(losses), net ofreclassifications and tax 14.3 — 14.3 (26.4) — (26.4)
Other comprehensive income/(loss) (98.0) — (98.0) 10.2 — 10.2Stock-based compensation expense 105.8 — 105.8 109.5 — 109.5Exercise of stock options/vesting of RSUs 64.7 — 64.7 59.7 — 59.7Sale of common stock 14.2 — 14.2 6.9 — 6.9Repurchase of common stock (1,046.1) — (1,046.1) (1,584.5) — (1,584.5)Cash dividends declared (724.5) — (724.5) (587.8) — (587.8)
Ending balance of total equity $ 5,605.0 $ 6.4 $ 5,611.4 $ 5,094.6 $ 1.8 $ 5,096.4
16

Table of Contents
Changes in AOCI by component, net of tax (inmillions):
Quarter Ended
Available-for-Sale
Securities Cash Flow
Hedges Net Investment
Hedges
TranslationAdjustment and
Other TotalApril2,2017 Net gains/(losses) in AOCI, beginning of period $ (7.6) $ 31.6 $ 27.2 $ (293.5) $ (242.3)
Net gains/(losses) recognized in OCI before reclassifications 1.4 (25.8) (15.9) 59.5 19.2Net (gains)/losses reclassified from AOCI to earnings 0.9 15.8 — — 16.7
Other comprehensive income/(loss) attributable to Starbucks 2.3 (10.0) (15.9) 59.5 35.9Net gains/(losses) in AOCI, end of period $ (5.3) $ 21.6 $ 11.3 $ (234.0) $ (206.4)
March27,2016 Net gains/(losses) in AOCI, beginning of period $ 0.8 $ 23.4 $ 1.3 $ (250.6) $ (225.1)
Net gains/(losses) recognized in OCI before reclassifications 2.4 (50.7) — 61.0 12.7Net (gains)/losses reclassified from AOCI to earnings (0.3) 23.5 — — 23.2
Other comprehensive income/(loss) attributable to Starbucks 2.1 (27.2) — 61.0 35.9Net gains/(losses) in AOCI, end of period $ 2.9 $ (3.8) $ 1.3 $ (189.6) $ (189.2)
Two Quarters Ended
Available-for-Sale
Securities Cash Flow
Hedges Net Investment
Hedges
TranslationAdjustment and
Other TotalApril2,2017 Net gains/(losses) in AOCI, beginning of period $ 1.1 $ 10.9 $ 1.3 $ (121.7) $ (108.4)
Net gains/(losses) recognized in OCI before reclassifications (7.9) 61.2 10.0 (112.3) (49.0)Net (gains)/losses reclassified from AOCI to earnings 1.5 (50.5) — — (49.0)
Other comprehensive income/(loss) attributable to Starbucks (6.4) 10.7 10.0 (112.3) (98.0)Net gains/(losses) in AOCI, end of period $ (5.3) $ 21.6 $ 11.3 $ (234.0) $ (206.4)
March27,2016 Net gains/(losses) in AOCI, beginning of period $ (0.1) $ 25.6 $ 1.3 $ (226.2) $ (199.4)
Net gains/(losses) recognized in OCI before reclassifications 3.0 (47.6) — 36.6 (8.0)Net (gains)/losses reclassified from AOCI to earnings — 18.2 — — 18.2
Other comprehensive income/(loss) attributable to Starbucks 3.0 (29.4) — 36.6 10.2Net gains/(losses) in AOCI, end of period $ 2.9 $ (3.8) $ 1.3 $ (189.6) $ (189.2)
17
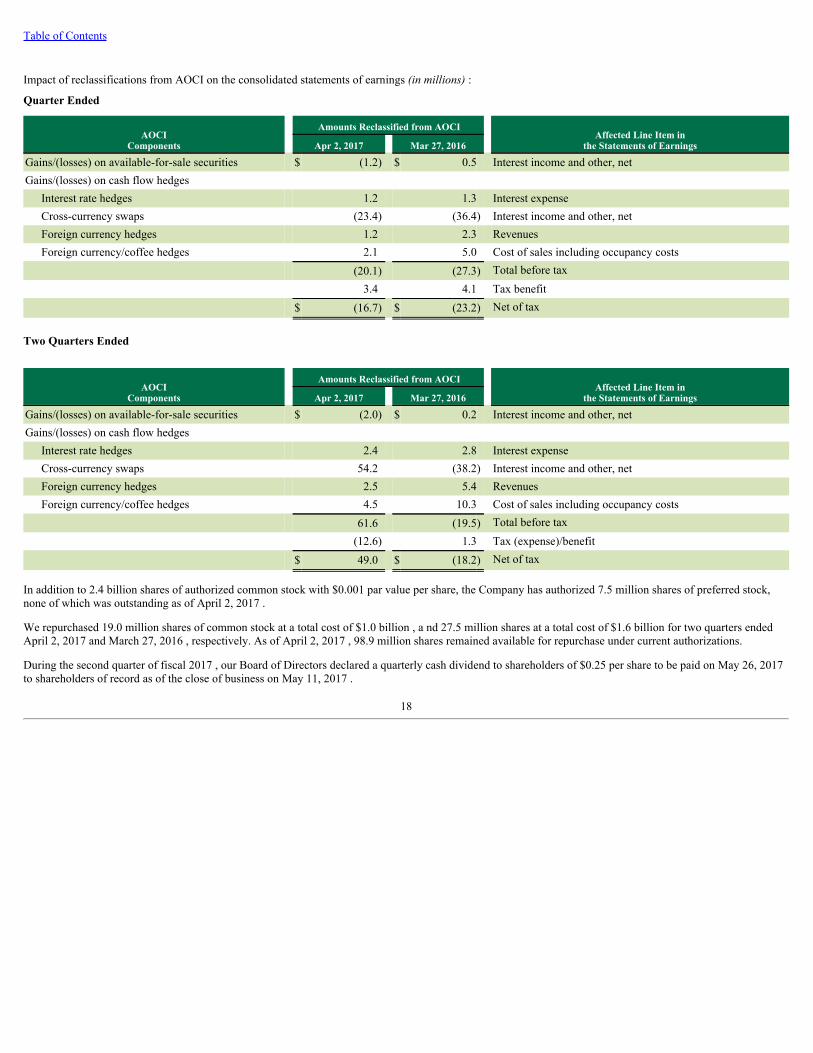
Table of Contents
Impact of reclassifications from AOCI on the consolidated statements of earnings (inmillions):
Quarter Ended
AOCIComponents
Amounts Reclassified from AOCI Affected Line Item in
the Statements of Earnings Apr 2, 2017 Mar 27, 2016 Gains/(losses) on available-for-sale securities $ (1.2) $ 0.5 Interest income and other, netGains/(losses) on cash flow hedges
Interest rate hedges 1.2 1.3 Interest expenseCross-currency swaps (23.4) (36.4) Interest income and other, netForeign currency hedges 1.2 2.3 RevenuesForeign currency/coffee hedges 2.1 5.0 Cost of sales including occupancy costs
(20.1) (27.3) Total before tax 3.4 4.1 Tax benefit
$ (16.7) $ (23.2) Net of tax
Two Quarters Ended
AOCI
Components
Amounts Reclassified from AOCI Affected Line Item in
the Statements of Earnings Apr 2, 2017 Mar 27, 2016 Gains/(losses) on available-for-sale securities $ (2.0) $ 0.2 Interest income and other, netGains/(losses) on cash flow hedges
Interest rate hedges 2.4 2.8 Interest expenseCross-currency swaps 54.2 (38.2) Interest income and other, netForeign currency hedges 2.5 5.4 RevenuesForeign currency/coffee hedges 4.5 10.3 Cost of sales including occupancy costs
61.6 (19.5) Total before tax (12.6) 1.3 Tax (expense)/benefit
$ 49.0 $ (18.2) Net of tax
In addition to 2.4 billion shares of authorized common stock with $0.001 par value per share, the Company has authorized 7.5 million shares of preferred stock,none of which was outstanding as of April 2, 2017 .
We repurchased 19.0 million shares of common stock at a total cost of $1.0 billion , a nd 27.5 million shares at a total cost of $1.6 billion for two quarters endedApril 2, 2017 and March 27, 2016 , respectively. As of April 2, 2017 , 98.9 million shares remained available for repurchase under current authorizations.
During the second quarter of fiscal 2017 , our Board of Directors declared a quarterly cash dividend to shareholders of $0.25 per share to be paid on May 26, 2017to shareholders of record as of the close of business on May 11, 2017 .
18
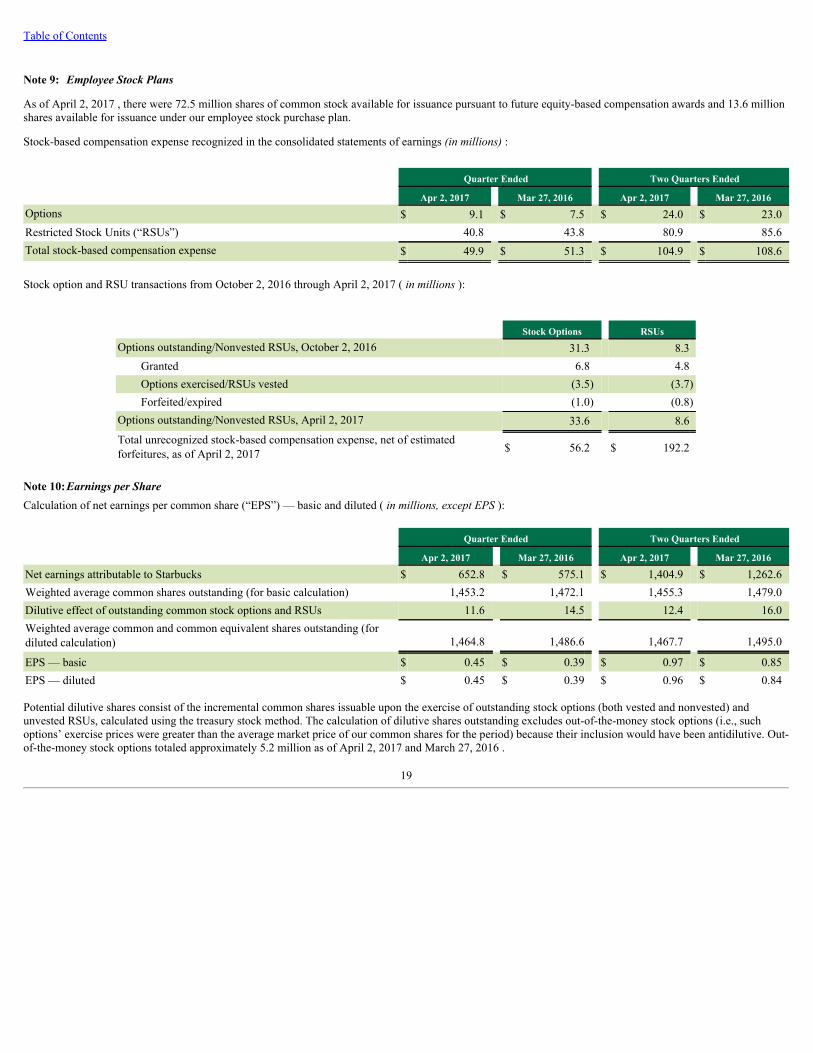
Table of Contents
Note 9: Employee Stock Plans
As of April 2, 2017 , there were 72.5 million shares of common stock available for issuance pursuant to future equity-based compensation awards and 13.6 millionshares available for issuance under our employee stock purchase plan.
Stock-based compensation expense recognized in the consolidated statements of earnings (inmillions):
Quarter Ended Two Quarters Ended
Apr 2, 2017 Mar 27, 2016 Apr 2, 2017 Mar 27, 2016Options $ 9.1 $ 7.5 $ 24.0 $ 23.0Restricted Stock Units (“RSUs”) 40.8 43.8 80.9 85.6Total stock-based compensation expense $ 49.9 $ 51.3 $ 104.9 $ 108.6
Stock option and RSU transactions from October 2, 2016 through April 2, 2017 ( inmillions):
Stock Options RSUsOptions outstanding/Nonvested RSUs, October 2, 2016 31.3 8.3
Granted 6.8 4.8Options exercised/RSUs vested (3.5) (3.7)Forfeited/expired (1.0) (0.8)
Options outstanding/Nonvested RSUs, April 2, 2017 33.6 8.6Total unrecognized stock-based compensation expense, net of estimatedforfeitures, as of April 2, 2017 $ 56.2 $ 192.2
Note 10:Earnings per ShareCalculation of net earnings per common share (“EPS”) — basic and diluted ( inmillions,exceptEPS):
Quarter Ended Two Quarters Ended
Apr 2, 2017 Mar 27, 2016 Apr 2, 2017 Mar 27, 2016
Net earnings attributable to Starbucks $ 652.8 $ 575.1 $ 1,404.9 $ 1,262.6Weighted average common shares outstanding (for basic calculation) 1,453.2 1,472.1 1,455.3 1,479.0Dilutive effect of outstanding common stock options and RSUs 11.6 14.5 12.4 16.0Weighted average common and common equivalent shares outstanding (fordiluted calculation) 1,464.8 1,486.6 1,467.7 1,495.0
EPS — basic $ 0.45 $ 0.39 $ 0.97 $ 0.85EPS — diluted $ 0.45 $ 0.39 $ 0.96 $ 0.84
Potential dilutive shares consist of the incremental common shares issuable upon the exercise of outstanding stock options (both vested and nonvested) andunvested RSUs, calculated using the treasury stock method. The calculation of dilutive shares outstanding excludes out-of-the-money stock options (i.e., suchoptions’ exercise prices were greater than the average market price of our common shares for the period) because their inclusion would have been antidilutive. Out-of-the-money stock options totaled approximately 5.2 million as of April 2, 2017 and March 27, 2016 .
19

Table of Contents
Note 11:Segment Reporting
Our chief executive officer and chief operating officer comprised the Company's Chief Operating Decision Maker function ("CODM"). Segment information isprepared on the same basis that our CODM manages the segments, evaluates financial results and makes key operating decisions.
The table below presents financial information for our reportable operating segments and All Other Segments (inmillions):
Quarter Ended
Americas China/
Asia Pacific EMEA Channel
Development All OtherSegments
SegmentTotal
April2,2017 Total net revenues $ 3,720.4 $ 768.9 $ 231.7 $ 461.3 $ 111.7 $ 5,294.0Depreciation and amortization expenses 155.4 49.3 7.6 0.6 3.5 216.4Income from equity investees — 44.1 — 40.0 — 84.1Operating income/(loss) 826.1 175.9 27.7 193.6 (25.5) 1,197.8
March27,2016 Total net revenues $ 3,455.6 $ 677.9 $ 268.3 $ 461.2 $ 130.2 $ 4,993.2Depreciation and amortization expenses 151.7 44.0 10.7 0.7 3.4 210.5Income from equity investees — 32.7 0.3 32.6 — 65.6Operating income/(loss) 812.0 129.3 27.6 182.0 (19.2) 1,131.7
Two Quarters Ended
Americas China/
Asia Pacific EMEA Channel
Development All OtherSegments
SegmentTotal
April2,2017 Total net revenues $ 7,711.8 $ 1,539.6 $ 493.9 $ 1,014.9 $ 266.8 $ 11,027.0Depreciation and amortization expenses 307.8 98.0 15.2 1.2 6.3 428.5Income from equity investees — 86.6 — 82.0 — 168.6Operating income/(loss) 1,784.6 339.1 71.6 436.4 (15.4) 2,616.3
March27,2016 Total net revenues $ 7,181.8 $ 1,331.4 $ 581.4 $ 973.3 $ 298.9 $ 10,366.8Depreciation and amortization expenses 292.5 86.1 22.2 1.4 7.0 409.2Income from equity investees — 63.9 1.5 64.3 — 129.7Operating income/(loss) 1,746.5 256.1 75.8 375.2 (13.1) 2,440.5
Reconciliation of total segment operating income to consolidated earnings before income taxes (inmillions):
Quarter Ended Two Quarters Ended
Apr 2, 2017 Mar 27, 2016 Apr 2, 2017 Mar 27, 2016Total segment operating income $ 1,197.8 $ 1,131.7 $ 2,616.3 $ 2,440.5Unallocated corporate operating expenses (262.4) (267.5) (548.0) (518.2)
Consolidated operating income 935.4 864.2 2,068.3 1,922.3Interest income and other, net 67.9 14.5 92.0 22.5Interest expense (22.9) (18.3) (46.7) (34.8)Earnings before income taxes $ 980.4 $ 860.4 $ 2,113.6 $ 1,910.0
20

Table of Contents
Item 2. Management’s Discussion and Analysis of Financial Condition and Results of Operations
CAUTIONARY STATEMENT PURSUANT TO THE PRIVATE SECURITIES LITIGATION REFORM ACT OF 1995Certainstatementsherein,includingstatementsregardingtrendsinorexpectationsrelatingtotheexpectedeffectsofourinitiativesandplans,aswellastrendsinorexpectationsregardingrevenues,operatingmargins,comparablestoresales,anticipatednetnewstores,theeffectsofforeigncurrencytranslation,therepositioningoftheEMEAsegmenttoapredominatelylicensedmodel,earningspershare,taxrates,capitalexpenditures,salesleverage,otherfinancialresults,thehealth,strengthandgrowthofourbusinessoverallandofspecificbusinessesormarkets,benefitsofrecentinitiatives,investmentsinourbusinessandpartners,includinginvestmentsinourdigitalplatforms,productdevelopmentandinnovation,businessopportunitiesandexpansion,strategicacquisitions,expenses,dividends,sharerepurchases,commoditycostsandourmitigationstrategies,liquidity,cashflowfromoperations,useofcashandcashrequirements,borrowingcapacityanduseofproceeds,repatriationofcashtotheU.S.,thepotentialissuanceofdebtandapplicableinterestrate,andtheexpectedeffectsofnewaccountingpronouncements,constitute“forward-lookingstatements”withinthemeaningofthePrivateSecuritiesLitigationReformActof1995.Suchstatementsarebasedoncurrentlyavailableoperating,financialandcompetitiveinformationandaresubjecttovariousrisksanduncertainties.Actualfutureresultsandtrendsmaydiffermateriallydependingonavarietyoffactors,including,butnotlimitedto,fluctuationsinU.S.andinternationaleconomiesandcurrencies,ourabilitytopreserve,growandleverageourbrands,potentialnegativeeffectsofincidentsinvolvingfoodorbeverage-borneillnesses,tampering,contaminationormislabeling,potentialnegativeeffectsofmaterialbreachesofourinformationtechnologysystemstotheextentweexperienceamaterialbreach,materialfailuresofourinformationtechnologysystems,costsassociatedwith,andthesuccessfulexecutionof,thecompany'sinitiativesandplans,includingtheintegrationofStarbucksJapan,theacceptanceofthecompany'sproductsbyourcustomers,theimpactofcompetition,coffee,dairyandotherrawmaterialspricesandavailability,theeffectoflegalproceedings,andotherrisksdetailedinourfilingswiththeSEC,includinginPartIItemIA“RiskFactors”inthe10-K.
Aforward-lookingstatementisneitherapredictionnoraguaranteeoffutureeventsorcircumstances,andthosefutureeventsorcircumstancesmaynotoccur.Youshouldnotplaceunduerelianceontheforward-lookingstatements,whichspeakonlyasofthedateofthisreport.Weareundernoobligationtoupdateoralteranyforward-lookingstatements,whetherasaresultofnewinformation,futureeventsorotherwise.
This information should be read in conjunction with the condensed consolidated financial statements and the notes included in Item 1 of Part I of this 10-Q and theaudited consolidated financial statements and notes, and Management’s Discussion and Analysis of Financial Condition and Results of Operations, contained in the10-K.
GeneralOur fiscal year ends on the Sunday closest to September 30. All references to store counts, including data for new store openings, are reported net of store closures,unless otherwise noted.
Overview
Starbucks second quarter results reflect strong operating and financial performance and our continued ability to make disciplined investments in our business andour partners (employees). Consolidated total net revenues increased 6% to $5.3 billion , primarily driven by incremental revenues from 2,240 net new storeopenings over the last 12 months and global comparable store sales growth of 3% . Consolidated operating income increased $71 million, or 8%, to $935 million.Operating margin expanded 40 basis points to 17.7%, primarily due to sales leverage, partially offset by increased partner investments, largely in the Americassegment. Earnings per share of $0.45 increased 15% over the prior year quarter earnings per share of $0.39.The Americas segment continued to perform well in the second quarter, growing revenues by 8% to $3.7 billion , primarily driven by incremental revenues from952 net new store openings over the past 12 months and comparable store sales growth of 3% . Continued strength in all dayparts from the success of our foodofferings and iced beverages contributed to the increase in comparable store sales. Operating income increased $14 million and operating margin at 22.2% declined130 basis points from a year ago, primarily due to increased investments in our store partners and a product mix shift towards food, partially offset by salesleverage.In our China/Asia Pacific segment, revenues grew by 13% to $769 million , primarily driven by incremental revenues from 1,015 net new stores over the past 12months and a 3% increase in comparable store sales. Operating income grew 36% to $176 million, while operating margin expanded 380 basis points to 22.9%.The overall operating margin expansion was primarily due to the transition to China's new value added tax structure and sales leverage.We continue to execute on our strategy of repositioning the EMEA segment to a predominantly licensed model. As part of this strategy, EMEA revenues declined$37 million , or 14% , primarily due to the absence of revenue related to the sale of our
21

Table of Contents
Germany retail operations in the third quarter of fiscal 2016. Partially offsetting lower company-operated store revenues were higher licensed store sales, primarilyresulting from the opening of 304 net new licensed stores and the transfer of 174 company-operated stores to licensed stores over the past 12 months. Operatingmargin expanded 170 basis points to 12.0% due to sales leverage driven by the shift in the portfolio towards more licensed stores, primarily related to the sale ofour Germany retail operations in the third quarter of fiscal 2016, partially offset by unfavorable foreign currency exchange and sales deleverage in certaincompany-operated stores.Channel Development segment revenues were flat, primarily driven by increased sales of packaged coffee as well as higher international and foodservice sales,offset by an unfavorable revenue deduction adjustment pertaining to prior periods. Operating income grew $12 million, or 6%, to $194 million. Operating marginincreased 250 basis points to 42.0% in the second quarter of fiscal 2017 primarily due to lower coffee costs, leverage on cost of sales and higher income from ourNorth American Coffee Partnership joint venture, partially offset by an unfavorable revenue deduction adjustment pertaining to prior periods.
Fiscal 2017 — Financial Outlook for the YearFor fiscal 2017, we expect consolidated revenue growth in the mid-single-digits when compared to our 53-week results in fiscal 2016. After adjusting for the 2% ofadditional revenue attributable to the extra week in fiscal 2016 and the approximate 1% of anticipated unfavorable foreign currency translation for fiscal 2017,consolidated revenue growth is expected to be at the lower end of the range of 8% to 10%. Revenue growth is expected to be driven by approximately 2,100 netnew stores worldwide and global comparable store sales in the mid-single digits, with some expected improvement in global comparable store sales in the secondhalf of fiscal 2017. Approximately 1,000 net new store openings will be in our China/Asia Pacific segment, approximately 800 net new stores coming from theAmericas segment and the remaining store growth from the EMEA segment.
We expect consolidated operating margin to increase slightly and earnings per share to be in the range of $2.06 to $2.10 for fiscal 2017. Revenue growth and salesleverage are expected to be partially offset by investments in our partners (employees) and digital platforms, as well as our continued focus on productdevelopment and innovation, which includes the expansion of our Starbucks Reserve ® and Roastery businesses. When compared to fiscal 2016, we expect theseinvestments to increase by more than $250 million in fiscal 2017 and will continue to elevate both our global brand and customer experience.
22
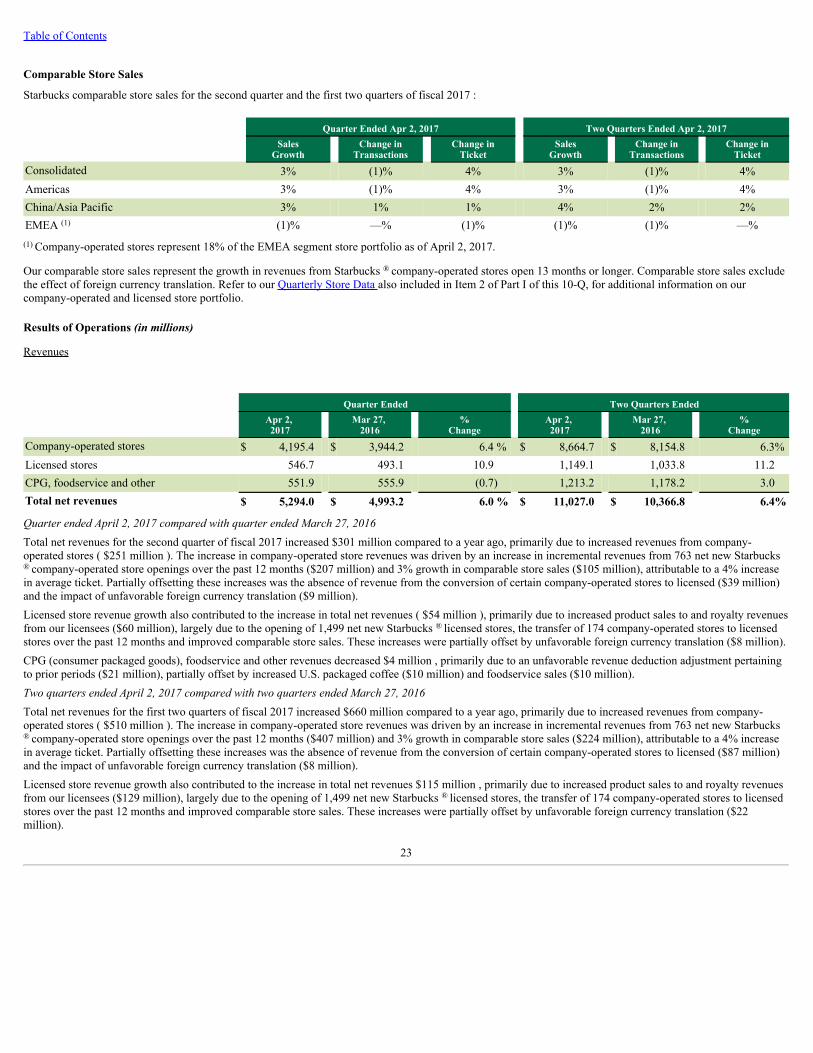
Table of Contents
Comparable Store Sales
Starbucks comparable store sales for the second quarter and the first two quarters of fiscal 2017 :
Quarter Ended Apr 2, 2017 Two Quarters Ended Apr 2, 2017
Sales
Growth Change in
Transactions Change in
Ticket Sales
Growth Change in
Transactions Change in
TicketConsolidated 3% (1)% 4% 3% (1)% 4%Americas 3% (1)% 4% 3% (1)% 4%China/Asia Pacific 3% 1% 1% 4% 2% 2%EMEA (1) (1)% —% (1)% (1)% (1)% —%(1) Company-operated stores represent 18% of the EMEA segment store portfolio as of April 2, 2017.
Our comparable store sales represent the growth in revenues from Starbucks ® company-operated stores open 13 months or longer. Comparable store sales excludethe effect of foreign currency translation. Refer to our Quarterly Store Data also included in Item 2 of Part I of this 10-Q, for additional information on ourcompany-operated and licensed store portfolio.
Results of Operations (in millions)
Revenues
Quarter Ended Two Quarters Ended
Apr 2, 2017
Mar 27, 2016
%Change
Apr 2, 2017
Mar 27, 2016
%Change
Company-operated stores $ 4,195.4 $ 3,944.2 6.4 % $ 8,664.7 $ 8,154.8 6.3%Licensed stores 546.7 493.1 10.9 1,149.1 1,033.8 11.2CPG, foodservice and other 551.9 555.9 (0.7) 1,213.2 1,178.2 3.0Total net revenues $ 5,294.0 $ 4,993.2 6.0 % $ 11,027.0 $ 10,366.8 6.4%
QuarterendedApril2,2017comparedwithquarterendedMarch27,2016Total net revenues for the second quarter of fiscal 2017 increased $301 million compared to a year ago, primarily due to increased revenues from company-operated stores ( $251 million ). The increase in company-operated store revenues was driven by an increase in incremental revenues from 763 net new Starbucks® company-operated store openings over the past 12 months ($207 million) and 3% growth in comparable store sales ($105 million), attributable to a 4% increasein average ticket. Partially offsetting these increases was the absence of revenue from the conversion of certain company-operated stores to licensed ($39 million)and the impact of unfavorable foreign currency translation ($9 million).Licensed store revenue growth also contributed to the increase in total net revenues ( $54 million ), primarily due to increased product sales to and royalty revenuesfrom our licensees ($60 million), largely due to the opening of 1,499 net new Starbucks ® licensed stores, the transfer of 174 company-operated stores to licensedstores over the past 12 months and improved comparable store sales. These increases were partially offset by unfavorable foreign currency translation ($8 million).CPG (consumer packaged goods), foodservice and other revenues decreased $4 million , primarily due to an unfavorable revenue deduction adjustment pertainingto prior periods ($21 million), partially offset by increased U.S. packaged coffee ($10 million) and foodservice sales ($10 million).TwoquartersendedApril2,2017comparedwithtwoquartersendedMarch27,2016Total net revenues for the first two quarters of fiscal 2017 increased $660 million compared to a year ago, primarily due to increased revenues from company-operated stores ( $510 million ). The increase in company-operated store revenues was driven by an increase in incremental revenues from 763 net new Starbucks® company-operated store openings over the past 12 months ($407 million) and 3% growth in comparable store sales ($224 million), attributable to a 4% increasein average ticket. Partially offsetting these increases was the absence of revenue from the conversion of certain company-operated stores to licensed ($87 million)and the impact of unfavorable foreign currency translation ($8 million).Licensed store revenue growth also contributed to the increase in total net revenues $115 million , primarily due to increased product sales to and royalty revenuesfrom our licensees ($129 million), largely due to the opening of 1,499 net new Starbucks ® licensed stores, the transfer of 174 company-operated stores to licensedstores over the past 12 months and improved comparable store sales. These increases were partially offset by unfavorable foreign currency translation ($22million).
23

Table of Contents
CPG, foodservice and other revenues increased $35 million , primarily due to increased sales of U.S. packaged coffee ($20 million) and premium single-serveproducts ($19 million), as well as increased sales through our international channels, primarily associated with our European and North American regions ($15million). Increased sales were partially offset by an unfavorable revenue deduction adjustment pertaining to prior periods ($13 million).
Operating Expenses
Quarter Ended Two Quarters Ended
Apr 2, 2017
Mar 27, 2016
Apr 2, 2017
Mar 27, 2016
Apr 2, 2017
Mar 27, 2016
Apr 2, 2017
Mar 27, 2016
As a % of TotalNet Revenues
As a % of TotalNet Revenues
Cost of sales including occupancycosts $ 2,141.2 $ 2,010.3 40.4% 40.3% $ 4,436.2 $ 4,196.5 40.2% 40.5%Store operating expenses 1,586.4 1,466.4 30.0 29.4 3,224.6 2,972.6 29.2 28.7Other operating expenses 134.7 139.6 2.5 2.8 280.1 285.8 2.5 2.8Depreciation and amortizationexpenses 253.6 247.8 4.8 5.0 503.3 483.3 4.6 4.7General and administrative expenses 326.8 330.5 6.2 6.6 683.1 636.0 6.2 6.1Total operating expenses 4,442.7 4,194.6 83.9 84.0 9,127.3 8,574.2 82.8 82.7Income from equity investees 84.1 65.6 1.6 1.3 168.6 129.7 1.5 1.3Operating income $ 935.4 $ 864.2 17.7% 17.3% $ 2,068.3 $ 1,922.3 18.8% 18.5%Store operating expenses as a % ofcompany-operated store revenues
37.8%
37.2%
37.2%
36.5%
Other operating expenses as a % ofnon-company-operated storerevenues
12.3%
13.3%
11.9%
12.9%
QuarterendedApril2,2017comparedwithquarterendedMarch27,2016Cost of sales including occupancy costs as a percentage of total net revenues increased 10 basis points for the second quarter of fiscal 2017 , primarily due to aproduct mix shift towards food (approximately 80 basis points), partially offset by leverage on cost of sales including occupancy costs (approximately 30 basispoints) and lower coffee costs (approximately 30 basis points).Store operating expenses as a percentage of total net revenues increased 60 basis points for the second quarter of fiscal 2017 . Store operating expenses as apercentage of company-operated store revenues increased 60 basis points, primarily driven by increased investments in our store partners, largely in the Americassegment (approximately 130 basis points), partially offset by sales leverage (approximately 100 basis points).Other operating expenses as a percentage of total net revenues decreased 30 basis points for the second quarter of fiscal 2017 . Excluding the impact of company-operated store revenues, other operating expenses decreased 100 basis points, primarily due to sales leverage.General and administrative expenses as a percentage of total net revenues decreased 40 basis points, primarily driven by the lapping of employment taxes accruedin the prior year period (approximately 50 basis points), and reduced performance-based compensation (approximately 10 basis points). Partially offsetting thisfavorability was higher salaries and benefits related to digital platforms, technology infrastructure and innovations.Income from equity investees increased $19 million, primarily due to higher income from our joint ventures, primarily our China and South Korea as well as ourNorth American Coffee Partnership joint venture operations.The combination of these changes resulted in an overall increase in operating margin of 40 basis points for the second quarter of fiscal 2017 .
24
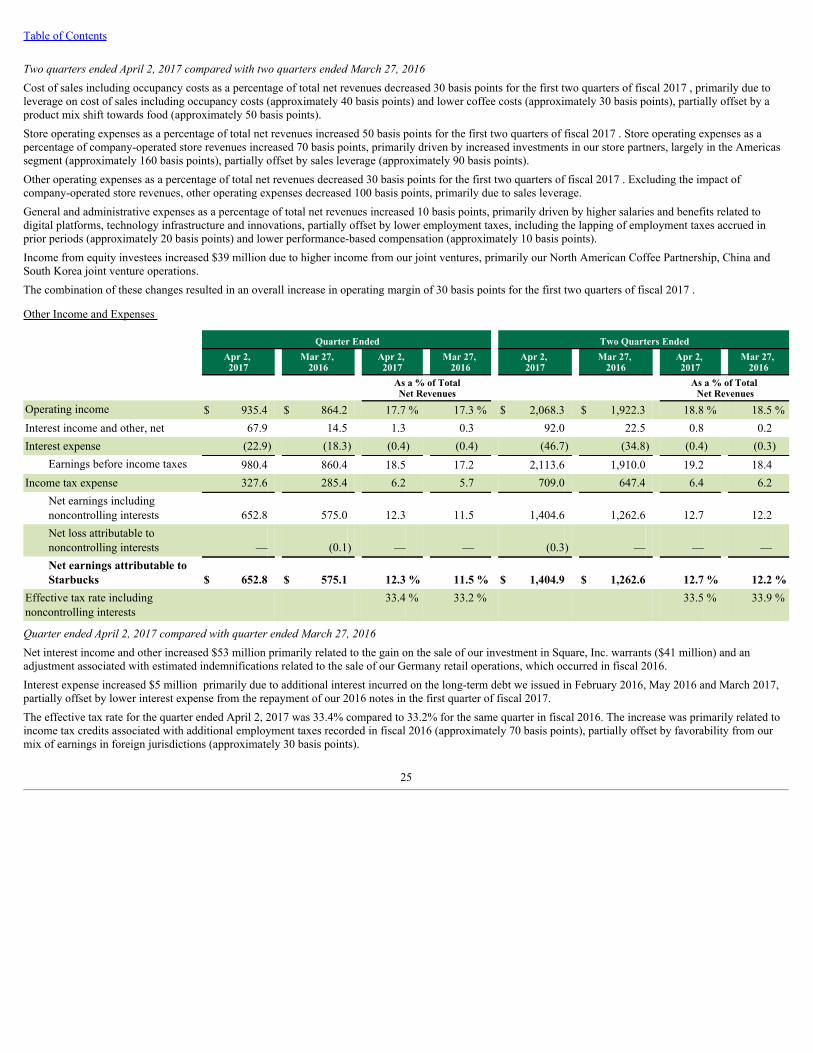
Table of Contents
TwoquartersendedApril2,2017comparedwithtwoquartersendedMarch27,2016Cost of sales including occupancy costs as a percentage of total net revenues decreased 30 basis points for the first two quarters of fiscal 2017 , primarily due toleverage on cost of sales including occupancy costs (approximately 40 basis points) and lower coffee costs (approximately 30 basis points), partially offset by aproduct mix shift towards food (approximately 50 basis points).Store operating expenses as a percentage of total net revenues increased 50 basis points for the first two quarters of fiscal 2017 . Store operating expenses as apercentage of company-operated store revenues increased 70 basis points, primarily driven by increased investments in our store partners, largely in the Americassegment (approximately 160 basis points), partially offset by sales leverage (approximately 90 basis points).Other operating expenses as a percentage of total net revenues decreased 30 basis points for the first two quarters of fiscal 2017 . Excluding the impact ofcompany-operated store revenues, other operating expenses decreased 100 basis points, primarily due to sales leverage.General and administrative expenses as a percentage of total net revenues increased 10 basis points, primarily driven by higher salaries and benefits related todigital platforms, technology infrastructure and innovations, partially offset by lower employment taxes, including the lapping of employment taxes accrued inprior periods (approximately 20 basis points) and lower performance-based compensation (approximately 10 basis points).Income from equity investees increased $39 million due to higher income from our joint ventures, primarily our North American Coffee Partnership, China andSouth Korea joint venture operations.The combination of these changes resulted in an overall increase in operating margin of 30 basis points for the first two quarters of fiscal 2017 .
Other Income and Expenses
Quarter Ended Two Quarters Ended
Apr 2, 2017
Mar 27, 2016
Apr 2, 2017
Mar 27, 2016
Apr 2, 2017
Mar 27, 2016
Apr 2, 2017
Mar 27, 2016
As a % of TotalNet Revenues
As a % of Total Net Revenues
Operating income $ 935.4 $ 864.2 17.7 % 17.3 % $ 2,068.3 $ 1,922.3 18.8 % 18.5 %Interest income and other, net 67.9 14.5 1.3 0.3 92.0 22.5 0.8 0.2Interest expense (22.9) (18.3) (0.4) (0.4) (46.7) (34.8) (0.4) (0.3)
Earnings before income taxes 980.4 860.4 18.5 17.2 2,113.6 1,910.0 19.2 18.4Income tax expense 327.6 285.4 6.2 5.7 709.0 647.4 6.4 6.2
Net earnings includingnoncontrolling interests 652.8 575.0 12.3 11.5 1,404.6 1,262.6 12.7 12.2Net loss attributable tononcontrolling interests — (0.1) — — (0.3) — — —Net earnings attributable toStarbucks $ 652.8 $ 575.1 12.3 % 11.5 % $ 1,404.9 $ 1,262.6 12.7 % 12.2 %
Effective tax rate includingnoncontrolling interests
33.4 %
33.2 %
33.5 %
33.9 %
QuarterendedApril2,2017comparedwithquarterendedMarch27,2016Net interest income and other increased $53 million primarily related to the gain on the sale of our investment in Square, Inc. warrants ($41 million) and anadjustment associated with estimated indemnifications related to the sale of our Germany retail operations, which occurred in fiscal 2016.Interest expense increased $5 million primarily due to additional interest incurred on the long-term debt we issued in February 2016, May 2016 and March 2017,partially offset by lower interest expense from the repayment of our 2016 notes in the first quarter of fiscal 2017.The effective tax rate for the quarter ended April 2, 2017 was 33.4% compared to 33.2% for the same quarter in fiscal 2016. The increase was primarily related toincome tax credits associated with additional employment taxes recorded in fiscal 2016 (approximately 70 basis points), partially offset by favorability from ourmix of earnings in foreign jurisdictions (approximately 30 basis points).
25

Table of Contents
TwoquartersendedApril2,2017comparedwithtwoquartersendedMarch27,2016Net interest income and other increased $70 million primarily related to the gain on the sale of our investment in Square, Inc. warrants ($41 million), net favorablefair value adjustments from derivative instruments used to manage our risk of commodity price fluctuations ($15 million) and an adjustment associated withestimated indemnifications related to the sale of our Germany retail operations, which occurred in fiscal 2016.Interest expense increased $12 million primarily due to additional interest incurred on the long-term debt we issued in February 2016, May 2016 and March 2017,partially offset by lower interest expense from the repayment of the 2016 notes in the first quarter of fiscal 2017.The effective tax rate for the two quarters ended April 2, 2017 was 33.5% compared to 33.9% for the same period in fiscal 2016. The decrease was primarilyrelated to favorability from our mix of earnings in foreign jurisdictions (approximately 20 basis points).
Segment Information
Results of operations by segment (inmillions):
Americas
Quarter Ended Two Quarters Ended
Apr 2, 2017
Mar 27, 2016
Apr 2, 2017
Mar 27, 2016
Apr 2, 2017
Mar 27, 2016
Apr 2, 2017
Mar 27, 2016
As a % of AmericasTotal Net Revenues
As a % of AmericasTotal Net Revenues
Net revenues: Company-operated stores $ 3,334.9 $ 3,097.5 89.6% 89.6% $ 6,895.9 $ 6,428.2 89.4% 89.5%Licensed stores 376.7 351.8 10.1 10.2 798.0 739.4 10.3 10.3Foodservice and other 8.8 6.3 0.2 0.2 17.9 14.2 0.2 0.2
Total net revenues 3,720.4 3,455.6 100.0 100.0 7,711.8 7,181.8 100.0 100.0Cost of sales including occupancycosts 1,354.9 1,230.0 36.4 35.6 2,795.2 2,576.9 36.2 35.9Store operating expenses 1,299.1 1,186.7 34.9 34.3 2,655.5 2,413.5 34.4 33.6Other operating expenses 31.5 27.7 0.8 0.8 63.4 60.4 0.8 0.8Depreciation and amortizationexpenses 155.4 151.7 4.2 4.4 307.8 292.5 4.0 4.1General and administrativeexpenses 53.4 47.5 1.4 1.4 105.3 92.0 1.4 1.3Total operating expenses 2,894.3 2,643.6 77.8 76.5 5,927.2 5,435.3 76.9 75.7
Operating income $ 826.1 $ 812.0 22.2% 23.5% $ 1,784.6 $ 1,746.5 23.1% 24.3%Store operating expenses as a % ofcompany-operated store revenues
39.0%
38.3%
38.5%
37.5%
Other operating expenses as a %of non-company-operated storerevenues
8.2%
7.7%
7.8%
8.0%
QuarterendedApril2,2017comparedwithquarterendedMarch27,2016
RevenuesAmericas total net revenues for the second quarter of fiscal 2017 increased $265 million , or 8% , primarily due to higher revenues from company-operated stores(contributing $237 million ) and licensed stores (contributing $25 million ).The increase in company-operated store revenues was driven by incremental revenues from 386 net new Starbucks ® company-operated store openings over thepast 12 months ($136 million) and a 3% increase in comparable store sales ($90 million), attributable to a 4% increase in average ticket, and favorable foreigncurrency translation ($11 million).
26

Table of Contents
The increase in licensed store revenues was due to higher product sales to and royalty revenues from our licensees ($25 million), primarily resulting from theopening of 566 net new licensed stores over the past 12 months and improved comparable store sales.
Operating ExpensesCost of sales including occupancy costs as a percentage of total net revenues increased 80 basis points for the second quarter of fiscal 2017 , primarily due to aproduct mix shift towards food (approximately 80 basis points).Store operating expenses as a percentage of total net revenues increased 60 basis points for the second quarter of fiscal 2017 . Store operating expenses as apercentage of company-operated store revenues increased 70 basis points, primarily driven by increased investments in our store partners (approximately 160 basispoints), partially offset by sales leverage on salaries and benefits (approximately 110 basis points).General and administrative expenses as a percentage of total net revenues were flat, primarily driven by higher salaries and benefits (approximately 20 basispoints), partially offset by lower performance-based compensation (approximately 10 basis points).The combination of these changes resulted in an overall decrease in operating margin of 130 basis points for the second quarter of fiscal 2017 .
TwoquartersendedApril2,2017comparedwithtwoquartersendedMarch27,2016
RevenuesAmericas total net revenues for the first two quarters of fiscal 2017 increased $530 million , or 7% primarily due to higher revenues from company-operated stores(contributing $468 million ) and licensed stores (contributing $59 million ).The increase in company-operated store revenues was driven by incremental revenues from 386 net new Starbucks ® company-operated store openings over thepast 12 months ($274 million) and a 3% increase in comparable store sales ($181 million), attributable to a 4% increase in average ticket, and favorable foreigncurrency translation ($13 million).
The increase in licensed store revenues was due to higher product sales to and royalty revenues from our licensees ($55 million), primarily resulting from theopening of 566 net new licensed stores over the past 12 months and improved comparable store sales.
Operating ExpensesCost of sales including occupancy costs as a percentage of total net revenues increased 30 basis points for the first two quarters of fiscal 2017 , primarily due to aproduct mix shift towards food (approximately 80 basis points), partially offset by leverage on cost of sales including occupancy costs (approximately 20 basispoints).Store operating expenses as a percentage of total net revenues increased 80 basis points for the first two quarters of fiscal 2017 . Store operating expenses as apercentage of company-operated store revenues increased 100 basis points, primarily driven by increased investments in our store partners (approximately 210basis points), partially offset by sales leverage on salaries and benefits (approximately 100 basis points).General and administrative expenses as a percentage of total net revenues increased 10 basis points, primarily driven by higher salaries and benefits (approximately20 basis points).The combination of these changes resulted in an overall decrease in operating margin of 120 basis points for the first two quarters of fiscal 2017 .
27

Table of Contents
China/Asia Pacific
Quarter Ended Two Quarters Ended
Apr 2, 2017
Mar 27, 2016
Apr 2, 2017
Mar 27, 2016
Apr 2, 2017
Mar 27, 2016
Apr 2, 2017
Mar 27, 2016
As a % of CAP
Total Net Revenues As a % of CAP
Total Net RevenuesNet revenues:
Company-operated stores $ 687.8 $ 608.5 89.5% 89.8% $ 1,379.2 $ 1,188.6 89.6% 89.3%Licensed stores 78.4 67.0 10.2 9.9 156.4 139.1 10.2 10.4Foodservice and other 2.7 2.4 0.4 0.4 4.0 3.7 0.3 0.3
Total net revenues 768.9 677.9 100.0 100.0 1,539.6 1,331.4 100.0 100.0Cost of sales including occupancycosts 333.5 307.2 43.4 45.3 670.8 602.3 43.6 45.2Store operating expenses 202.5 182.3 26.3 26.9 406.8 357.6 26.4 26.9Other operating expenses 17.6 17.2 2.3 2.5 36.7 32.1 2.4 2.4Depreciation and amortizationexpenses 49.3 44.0 6.4 6.5 98.0 86.1 6.4 6.5General and administrativeexpenses 34.2 30.6 4.4 4.5 74.8 61.1 4.9 4.6Total operating expenses 637.1 581.3 82.9 85.8 1,287.1 1,139.2 83.6 85.6Income from equity investees 44.1 32.7 5.7 4.8 86.6 63.9 5.6 4.8
Operating income $ 175.9 $ 129.3 22.9% 19.1% $ 339.1 $ 256.1 22.0% 19.2%Store operating expenses as a % ofcompany-operated store revenues
29.4%
30.0%
29.5%
30.1%
Other operating expenses as a %of non-company-operated storerevenues
21.7%
24.8%
22.9%
22.5%
QuarterendedApril2,2017comparedwithquarterendedMarch27,2016
RevenuesChina/Asia Pacific total net revenues for the second quarter of fiscal 2017 increased $91 million , or 13% over the prior year period, primarily from highercompany-operated store revenues ( $79 million ), driven by incremental revenues from 386 net new company-operated store openings over the past 12 months ($71million). Also contributing was a 3% increase in comparable store sales ($16 million), partially offset by unfavorable foreign currency translation ($7 million).Licensed store revenues increased $11 million due to increased product sales to and royalty revenues from licensees ($13 million), primarily resulting from theopening of 629 net new licensed stores over the past 12 months.
Operating ExpensesCost of sales including occupancy costs as a percentage of total net revenues decreased 190 basis points for the second quarter of fiscal 2017 , primarily due tofavorability from the transition to China's new value added tax structure (approximately 160 basis points) and leverage on cost of sales including occupancy costs(approximately 20 basis points).Store operating expenses as a percentage of total net revenues decreased 60 basis points for the second quarter of fiscal 2017 . As a percentage of company-operated store revenues, store operating expenses also decreased 60 basis points, primarily due to sales leverage on salaries and benefits (approximately 110 basispoints), partially offset by higher payroll-related expenditures and partner investments (approximately 50 basis points).Other operating expenses as a percentage of total net revenues decreased 20 basis points for the second quarter of fiscal 2017 . Excluding the impact of company-operated store revenues, other operating expenses decreased 310 basis points in the second quarter, primarily due to the lapping of investments in regionalleadership and training conferences in the prior year (approximately 200 basis points).Income from equity investees increased $11 million due to higher income from our joint venture operations, primarily in China and South Korea. Our China jointventure operations benefited from the new value added tax structure.
28
Table of Contents
The combination of these changes resulted in an overall increase in operating margin of 380 basis points for the second quarter of fiscal 2017 .
TwoquartersendedApril2,2017comparedwithtwoquartersendedMarch27,2016
RevenuesChina/Asia Pacific total net revenues for the first two quarters of fiscal 2017 increased $208 million , or 16% over the prior year period, primarily from highercompany-operated store revenues ( $191 million ), driven by incremental revenues from 386 net new company-operated store openings over the past 12 months($133 million). Also contributing was a 4% increase in comparable store sales ($44 million) and favorable foreign currency translation ($13 million).Licensed store revenues increased $17 million due to increased product sales to and royalty revenues from licensees ($21 million), primarily resulting from theopening of 629 net new licensed stores over the past 12 months, partially offset by unfavorable foreign currency translation ($4 million).
Operating ExpensesCost of sales including occupancy costs as a percentage of total net revenues decreased 160 basis points for the first two quarters of fiscal 2017 , primarily drivenby favorability from the transition to China's new value added tax structure (approximately 140 basis points).Store operating expenses as a percentage of total net revenues decreased 50 basis points for the first two quarters of fiscal 2017 . As a percentage of company-operated store revenues, store operating expenses decreased 60 basis points for the first two quarters of fiscal 2017 , primarily due to sales leverage on salaries andbenefits (approximately 120 basis points), partially offset by higher payroll-related expenditures and partner investments (approximately 70 basis points).Other operating expenses as a percentage of total net revenues was flat for the first two quarters of fiscal 2017 . Excluding the impact of company-operated storerevenues, other operating expenses increased 40 basis points, primarily due to the timing of certain business taxes (approximately 110 basis points) and increasedinvestment in our e-commerce business (approximately 100 basis points), partially offset by the lapping of investments in regional leadership and trainingconferences in the prior year (approximately 90 basis points).General and administrative expenses as a percentage of total net revenues increased 30 basis points, primarily due to continued focus on product quality andinnovation (approximately 30 basis points).Income from equity investees increased $23 million, driven by higher income from our joint venture operations, primarily in China and South Korea. Our Chinajoint venture operations benefited from the new value added tax structure.The combination of these changes resulted in an overall increase in operating margin of 280 basis points for the first two quarters of fiscal 2017 .
29

Table of Contents
EMEA
Quarter Ended Two Quarters Ended
Apr 2, 2017
Mar 27, 2016
Apr 2, 2017
Mar 27, 2016
Apr 2, 2017
Mar 27, 2016
Apr 2, 2017
Mar 27, 2016
As a % of EMEA
Total Net Revenues As a % of EMEA
Total Net RevenuesNet revenues:
Company-operated stores $ 127.5 $ 182.8 55.0% 68.1% $ 273.4 $ 401.7 55.4% 69.1%Licensed stores 90.9 73.3 39.2 27.3 193.0 153.1 39.1 26.3Foodservice 13.3 12.2 5.7 4.5 27.5 26.6 5.6 4.6
Total net revenues 231.7 268.3 100.0 100.0 493.9 581.4 100.0 100.0Cost of sales including occupancycosts 122.6 136.6 52.9 50.9 258.7 288.0 52.4 49.5Store operating expenses 50.3 66.5 21.7 24.8 97.1 140.4 19.7 24.1Other operating expenses 14.1 13.9 6.1 5.2 30.2 28.7 6.1 4.9Depreciation and amortizationexpenses 7.6 10.7 3.3 4.0 15.2 22.2 3.1 3.8General and administrativeexpenses 9.4 13.3 4.1 5.0 21.1 27.8 4.3 4.8Total operating expenses 204.0 241.0 88.0 89.8 422.3 507.1 85.5 87.2Income from equity investees — 0.3 — 0.1 — 1.5 — 0.3
Operating income $ 27.7 $ 27.6 12.0% 10.3% $ 71.6 $ 75.8 14.5% 13.0%Store operating expenses as a % ofcompany-operated store revenues
39.5%
36.4%
35.5%
35.0%
Other operating expenses as a % ofnon-company-operated storerevenues
13.5%
16.3%
13.7%
16.0%
QuarterendedApril2,2017comparedwithquarterendedMarch27,2016
RevenuesEMEA total net revenues decreased $37 million , or 14% , for the second quarter of fiscal 2017 . The decrease was primarily due to a decline in company-operatedstore revenues ( $55 million ), driven by the shift to more licensed stores in the region ($39 million), which includes the absence of revenue related to the sale ofour Germany retail operations in the third quarter of fiscal 2016, as well as unfavorable foreign currency translation ($14 million).Licensed store revenues increased $18 million , or 24% due to higher product sales to and royalty revenues from our licensees ($23 million), primarily resultingfrom the opening of 304 net new licensed stores and the transfer of 174 company-operated stores to licensed stores over the past 12 months, partially offset byunfavorable foreign currency translation ($7 million).
Operating ExpensesCost of sales including occupancy costs as a percentage of total net revenues increased 200 basis points for the second quarter of fiscal 2017 , primarily due tounfavorable foreign currency transactions (approximately 140 basis points) and the shift in the composition of our store portfolio to more licensed stores, whichhave a lower gross margin (approximately 110 basis points), partially offset by lower commodity costs, primarily coffee (approximately 30 basis points).Store operating expenses as a percentage of total net revenues decreased 310 basis points for the second quarter of fiscal 2017 . As a percentage of company-operated store revenues, store operating expenses increased 310 basis points, primarily driven by sales deleverage in certain company-operated stores(approximately 210 basis points).Other operating expenses as a percentage of total net revenues increased 90 basis points for the second quarter of fiscal 2017 . Excluding the impact of company-operated store revenues, other operating expenses decreased 280 basis points, primarily due to sales leverage driven by the shift to more licensed stores in theregion (approximately 280 basis points).
Depreciation and amortization expense as a percentage of total net revenue decreased 70 basis points, primarily due to the shift in the portfolio towards morelicensed stores (approximately 60 basis points).
30

Table of Contents
General and administrative expenses as a percentage of total net revenues decreased 90 basis points, primarily due to the shift in the portfolio towards morelicensed stores (approximately 50 basis points).The combination of these changes resulted in an overall increase in operating margin of 170 basis points for the second quarter of fiscal 2017 .
TwoquartersendedApril2,2017comparedwithtwoquartersendedMarch27,2016
RevenuesEMEA total net revenues decreased $88 million , or 15% , for the first two quarters of fiscal 2017 . The decrease was primarily due to a decline in company-operated store revenues ( $128 million ), driven by the shift to more licensed stores in the region ($87 million), which includes the absence of revenue related to thesale of our Germany retail operations in the third quarter of fiscal 2016, as well as unfavorable foreign currency translation ($33 million).Licensed store revenues increased $40 million , or 26% due to higher product sales to and royalty revenues from our licensees ($53 million), primarily resultingfrom the opening of 304 net new licensed stores and the transfer of 174 company-operated stores to licensed stores over the past 12 months, partially offset byunfavorable foreign currency translation ($17 million).
Operating ExpensesCost of sales including occupancy costs as a percentage of total net revenues increased 290 basis points for the first two quarters of fiscal 2017 , primarily due tounfavorable foreign currency transactions (approximately 190 basis points) and the shift in the composition of our store portfolio to more licensed stores, whichhave a lower gross margin (approximately 100 basis points).Store operating expenses as a percentage of total net revenues decreased 440 basis points for the first two quarters of fiscal 2017 . As a percentage of company-operated store revenues, store operating expenses increased 50 basis points in the second quarter, primarily driven by sales deleverage in certain company-operatedstores (approximately 170 basis points), partially offset by the shift in the portfolio towards more licensed stores (approximately 150 basis points).Other operating expenses as a percentage of total net revenues increased 120 basis points for the first two quarters of fiscal 2017 . Excluding the impact ofcompany-operated store revenues, other operating expenses decreased 230 basis points for the second quarter, primarily due to sales leverage driven by the shift tomore licensed stores in the region (approximately 230 basis points).
Depreciation and amortization expense as a percentage of total net revenue decreased 70 basis points, primarily due to the shift in the portfolio towards morelicensed stores (approximately 60 basis points).
General and administrative expenses as a percentage of total net revenues decreased 50 basis points, primarily due to the shift in the portfolio towards morelicensed stores (approximately 40 basis points).The combination of these changes resulted in an overall increase in operating margin of 150 basis points for the first two quarters of fiscal 2017 .
31

Table of Contents
Channel Development
Quarter Ended Two Quarters Ended
Apr 2, 2017
Mar 27, 2016
Apr 2, 2017
Mar 27, 2016
Apr 2, 2017
Mar 27, 2016
Apr 2, 2017
Mar 27, 2016
As a % of ChannelDevelopment
Total Net Revenues
As a % of ChannelDevelopment
Total Net RevenuesNet revenues:
CPG $ 346.3 $ 354.4 75.1% 76.8% $ 783.3 $ 753.6 77.2% 77.4%Foodservice 115.0 106.8 24.9 23.2 231.6 219.7 22.8 22.6
Total net revenues 461.3 461.2 100.0 100.0 1,014.9 973.3 100.0 100.0Cost of sales 254.5 252.9 55.2 54.8 543.0 538.4 53.5 55.3Other operating expenses 50.5 53.5 10.9 11.6 110.9 113.8 10.9 11.7Depreciation and amortizationexpenses 0.6 0.7 0.1 0.2 1.2 1.4 0.1 0.1General and administrativeexpenses 2.1 4.7 0.5 1.0 5.4 8.8 0.5 0.9Total operating expenses 307.7 311.8 66.7 67.6 660.5 662.4 65.1 68.1Income from equity investees 40.0 32.6 8.7 7.1 82.0 64.3 8.1 6.6
Operating income $ 193.6 $ 182.0 42.0% 39.5% $ 436.4 $ 375.2 43.0% 38.5%
Discussion of our Channel Development segment results below reflect the impact of an unfavorable revenue deduction adjustment. While this adjustment wasimmaterial, the discussion below quantifies the impact to provide a better understanding of our results for the quarter and two quarters ended April 2, 2017 .QuarterendedApril2,2017comparedwithquarterendedMarch27,2016
RevenuesChannel Development total net revenues for the second quarter of fiscal 2017 were flat when compared to the prior year period. Increased sales of packaged coffee($10 million) and higher international sales, primarily associated with our European and North American regions ($8 million), were offset by an unfavorablerevenue deduction adjustment pertaining to periods prior to the second quarter of fiscal 2017 ($21 million). Higher foodservice sales was primarily the result of achange to a direct distribution model and recognizing the benefit of full revenue from premium single-serve product sales.
Operating ExpensesCost of sales as a percentage of total net revenues increased 40 basis points for the second quarter, primarily driven by the unfavorable revenue deductionadjustment (approximately 220 basis points), partially offset by lower coffee costs (approximately 120 basis points) and leverage on cost of sales (approximately50 basis points).Other operating expenses as a percentage of total net revenues decreased 70 basis points, primarily driven by lower performance-based compensation(approximately 70 basis points), partially offset by higher salaries and benefits (approximately 40 basis points).Income from equity investees increased $7 million due to higher income from our North American Coffee Partnership joint venture, primarily due to increasedsales of Frappuccino ® and Starbucks Doubleshot ® beverages and new product launches over the past 12 months.
The combination of these changes resulted in an overall increase in operating margin of 250 basis points for the second quarter of fiscal 2017 .
TwoquartersendedApril2,2017comparedwithtwoquartersendedMarch27,2016
RevenuesChannel Development total net revenues for the first two quarters of fiscal 2017 increased $42 million or 4% , primarily driven by higher sales of U.S. packagedcoffee ($20 million) and premium single-serve products ($19 million), as well as increased sales through our international channels, primarily associated with ourEuropean and North American regions ($15 million), partially offset by an unfavorable revenue deduction adjustment pertaining to periods prior to fiscal 2017($13 million). Higher
32

Table of Contents
foodservice sales was primarily the result of a change to a direct distribution model and recognizing the benefit of full revenue from premium single-serve productsales.
Operating ExpensesCost of sales as a percentage of total net revenues decreased 180 basis points for the first two quarters of fiscal 2017 , primarily driven by lower coffee costs(approximately 140 basis points) and leverage on cost of sales (approximately 130 basis points), partially offset by the unfavorable revenue deduction adjustment(approximately 60 basis points).Other operating expenses as a percentage of total net revenues decreased 80 basis points for the first two quarters of fiscal 2017 , primarily driven by lowerperformance-based compensation (approximately 40 basis points).Income from equity investees increased $18 million for the first two quarters of fiscal 2017 due to higher income from our North American Coffee Partnershipjoint venture, primarily from increased sales of Frappuccino ® and Starbucks Doubleshot ® beverages and new product launches over the past 12 months.
The combination of these changes resulted in an overall increase in operating margin of 450 basis points for the first two quarters of fiscal 2017 .
All Other Segments
Quarter Ended Two Quarters Ended
Apr 2, 2017
Mar 27, 2016
%Change
Apr 2, 2017
Mar 27, 2016
%Change
Net revenues: Company-operated stores $ 45.2 $ 55.4 (18.4)% $ 116.2 $ 136.3 (14.7)%Licensed stores 0.7 1.0 (30.0) 1.7 2.2 (22.7)CPG, foodservice and other 65.8 73.8 (10.8) 148.9 160.4 (7.2)
Total net revenues 111.7 130.2 (14.2) 266.8 $ 298.9 (10.7)Cost of sales including occupancy costs 74.1 83.0 (10.7) 164.5 178.3 (7.7)Store operating expenses 34.5 30.9 11.7 65.2 61.1 6.7Other operating expenses 20.7 27.2 (23.9) 38.2 50.8 (24.8)Depreciation and amortization expenses 3.5 3.4 2.9 6.3 7.0 (10.0)General and administrative expenses 4.4 4.9 (10.2) 8.0 14.8 (45.9)Total operating expenses 137.2 149.4 (8.2) 282.2 312.0 (9.6)
Operating loss $ (25.5) $ (19.2) 32.8 % $ (15.4) $ (13.1) 17.6%
All Other Segments primarily includes Teavana, Seattle’s Best Coffee, Evolution Fresh, as well as Starbucks Reserve ® and Roastery businesses.
33

Table of Contents
Quarterly Store DataOur store data for the periods presented is as follows:
Net stores opened/(closed) andtransferred during the period
Quarter Ended Two Quarters Ended Stores open as of
Apr 2, 2017
Mar 27, 2016
Apr 2, 2017
Mar 27, 2016
Apr 2, 2017
Mar 27, 2016
Americas Company-operated stores 82 38 157 119 9,176 8,790Licensed stores 118 94 294 184 6,882 6,316
Total Americas 200 132 451 303 16,058 15,106China/Asia Pacific
Company-operated stores 67 54 171 144 2,982 2,596Licensed stores 120 121 319 312 3,951 3,322
Total China/Asia Pacific 187 175 490 456 6,933 5,918EMEA
Company-operated stores — (10) (18) (49) 505 688Licensed stores 46 57 159 175 2,278 1,800
Total EMEA 46 47 141 126 2,783 2,488All Other Segments
Company-operated stores (7) (4) (9) (5) 349 370Licensed stores 1 — 3 (2) 38 39
Total All Other Segments (6) (4) (6) (7) 387 409Total Company 427 350 1,076 878 26,161 23,921
Financial Condition, Liquidity and Capital Resources
Investment OverviewOur cash and investments totaled $3.5 billion as of April 2, 2017 and $3.4 billion as of October 2, 2016 . We actively manage our cash and investments in order tointernally fund operating needs, make scheduled interest and principal payments on our borrowings, make acquisitions, and return cash to shareholders throughcommon stock cash dividend payments and share repurchases. Our investment portfolio primarily includes highly liquid available-for-sale securities, includingcorporate debt securities, government treasury securities (foreign and domestic), mortgage and asset-backed securities and agency obligations. As of April 2, 2017 ,approximately $1.8 billion of our cash and investments were held in foreign subsidiaries.
Borrowing CapacityOur $1.5 billion unsecured, revolving credit facility with various banks, of which $150 million may be used for issuances of letters of credit, is available forworking capital, capital expenditures and other corporate purposes, including acquisitions and share repurchases, and is currently set to mature on November 6,2020 . Starbucks has the option, subject to negotiation and agreement with the related banks, to increase the maximum commitment amount by an additional $750million . Borrowings under the credit facility will bear interest at a variable rate based on LIBOR, and, for U.S. dollar-denominated loans under certaincircumstances, a Base Rate (as defined in the credit facility), in each case plus an applicable margin. The applicable margin is based on the better of (i) theCompany's long-term credit ratings assigned by Moody's and Standard & Poor's rating agencies and (ii) the Company's fixed charge coverage ratio, pursuant to apricing grid set forth in the credit agreement. The current applicable margin is 0.565% for Eurocurrency Rate Loans and 0.00% (nil) for Base Rate Loans. Thecredit facility contains provisions requiring us to maintain compliance with certain covenants, including a minimum fixed charge coverage ratio, which measuresour ability to cover financing expenses. As of April 2, 2017 , we were in compliance with all applicable covenants. No amounts were outstanding under our creditfacility as of April 2, 2017 .
Under our commercial paper program, we may issue unsecured commercial paper notes up to a maximum aggregate amount outstanding at any time of $1 billion ,with individual maturities that may vary but not exceed 397 days from the date of issue. Amounts outstanding under the commercial paper program are required tobe backstopped by available commitments under our credit facility discussed above. The proceeds from borrowings under our commercial paper program may beused for working capital needs, capital expenditures and other corporate purposes, including, but not limited to, business expansion, payment of
34

Table of Contents
cash dividends on our common stock and share repurchases. As of April 2, 2017 , we had $25 million of borrowings outstanding under the program.The indentures under which all of our Senior Notes were issued, as detailed in Note 7 , Debt, to the condensed consolidated financial statements included in Item 1of Part I of this 10-Q, require us to maintain compliance with certain covenants, including limits on future liens and sale and leaseback transactions on certainmaterial properties. As of April 2, 2017 , we were in compliance with all applicable covenants.In March 2017, we issued Japanese yen-denominated long-term debt in an underwritten registered public offering. The 7-year 0.372% Senior Notes (the "2024notes") due March 2024 were issued with a face value of ¥85 billion, or $761.1 million as of April 2, 2017 . We will use the net proceeds from the offering toenhance our sustainability programs around coffee supply chain management through Eligible Sustainability Projects. Interest on the 2024 notes is payable semi-annually on March 15 and September 15 of each year, commencing on September 15, 2017. Additionally, in the first quarter of fiscal 2017, our $400 million of0.875% Senior Notes (the "2016 notes") were repaid. See Note 7 , Debt, to the condensed consolidated financial statements included in Item 1 of Part I of this 10-Qfor details of the components of our long-term debt.
Use of CashWe expect to use our available cash and investments, including, but not limited to, additional potential future borrowings under the credit facility and commercialpaper program, to invest in our core businesses, including capital expenditures, new product innovations, related marketing support and partner and digitalinvestments, return cash to shareholders through common stock cash dividend payments and share repurchases, as well as other new business opportunities relatedto our core businesses, including Siren Retail. Further, we may use our available cash resources to make proportionate capital contributions to our investees. Wemay also seek strategic acquisitions to leverage existing capabilities and further build our business in support of our growth agenda. Acquisitions may includeincreasing our ownership interests in our investees. Any decisions to increase such ownership interests will be driven by valuation and fit with our ownershipstrategy.
We believe that future cash flows generated from operations and existing cash and investments both domestically and internationally will be sufficient to financecapital requirements for our core businesses in those respective markets as well as shareholder distributions for the foreseeable future. Significant new jointventures, acquisitions and/or other new business opportunities may require additional outside funding. We have borrowed funds and continue to believe we havethe ability to do so at reasonable interest rates; however, additional borrowings would result in increased interest expense in the future.
We consider the majority of undistributed earnings of our foreign subsidiaries and equity investees as of April 2, 2017 to be indefinitely reinvested and,accordingly, no U.S. income and foreign withholding taxes have been provided on such earnings. We have not, nor do we anticipate the need to, repatriate funds tothe U.S. to satisfy domestic liquidity needs; however, in the event that we need to repatriate all or a portion of our foreign cash to the U.S., we would be subject toadditional U.S. income taxes, which could be material. We do not believe it is practicable to calculate the potential tax impact of repatriation, as there is asignificant amount of uncertainty around the calculation, including the availability and amount of foreign tax credits at the time of repatriation, tax rates in effectand other indirect tax consequences associated with repatriation.
During the second quarter of fiscal 2017 , our Board of Directors declared a quarterly cash dividend to shareholders of $0.25 per share to be paid on May 26, 2017to shareholders of record as of the close of business on May 11, 2017 . We repurchased 19.0 million shares of common stock ( $1.0 billion ) during the first twoquarters of fiscal 2017 under our ongoing share repurchase program. The number of remaining shares authorized for repurchase as of April 2, 2017 totaled 98.9million .
Other than normal operating expenses, cash requirements for the remainder of fiscal 2017 are expected to consist primarily of capital expenditures for newcompany-operated stores; remodeling and refurbishment of, and equipment upgrades for, existing company-operated stores; systems and technology investments inthe stores and in the support infrastructure; and additional investments in manufacturing capacity. Total capital expenditures for fiscal 2017 are expected to beapproximately $1.6 billion .
Cash FlowsCash provided by operating activities was $1.9 billion for the first two quarters of fiscal 2017 , compared to $2.2 billion for the same period in fiscal 2016 . Thechange was primarily due to the timing of our cash payments for income taxes, partially offset by increased earnings.Cash used by investing activities for the first two quarters of fiscal 2017 totaled $565.3 million , compared to $1.0 billion for the same period in fiscal 2016 . Thechange was primarily due to an increase in the sale of investments as well as lower purchases of investments.Cash used by financing activities for the first two quarters of fiscal 2017 totaled $1.3 billion , compared to $1.5 billion for the same period in fiscal 2016 . Thechange was primarily due to a decrease in share repurchases and higher proceeds from issuances of long-term debt, partially offset by the repayment of the 2016notes and an increase in dividend payments in fiscal 2017.
35

Table of Contents
Contractual ObligationsIn Management’s Discussion and Analysis of Financial Condition and Results of Operations included in the 10-K, we disclosed that we had $13.3 billion in totalcontractual obligations as of October 2, 2016 . Other than the issuance of our 2024 notes in the second quarter of fiscal 2017 and the repayment of the 2016 notesin the first quarter of fiscal 2017, as described in Note 7 , Debt, to the condensed consolidated financial statements included in Item 1 of Part I of this 10-Q, therehave been no material changes to our total obligations during the period covered by this 10-Q outside of the normal course of our business.
Off-Balance Sheet ArrangementsThere has been no material change in our off-balance sheet arrangements discussed in Management’s Discussion and Analysis of Financial Condition and Resultsof Operations included in the 10-K.
Commodity Prices, Availability and General Risk ConditionsCommodity price risk represents our primary market risk, generated by our purchases of green coffee and dairy products, among other items. We purchase, roastand sell high-quality arabicacoffee and related products and risk arises from the price volatility of green coffee. In addition to coffee, we also purchase significantamounts of dairy products to support the needs of our company-operated stores. The price and availability of these commodities directly impact our results ofoperations, and we expect commodity prices, particularly coffee, to impact future results of operations. For additional details, see Product Supply in Item 1 of the10-K, as well as Risk Factors in Item 1A of the 10-K.
Seasonality and Quarterly ResultsOur business is subject to moderate seasonal fluctuations, of which our fiscal second quarter typically experiences lower revenues and operating income.Additionally, as Starbucks Cards are issued to and loaded by customers during the holiday season, we tend to have higher cash flows from operations during thefirst quarter of the fiscal year. However, since revenues from Starbucks Cards are recognized upon redemption and not when cash is loaded onto the Card, theimpact of seasonal fluctuations on the consolidated statements of earnings is much less pronounced. As a result of moderate seasonal fluctuations, results for anyquarter are not necessarily indicative of the results that may be achieved for the full fiscal year.
RECENT ACCOUNTING PRONOUNCEMENTSSee Note 1 , Summary of Significant Accounting Policies, to the condensed consolidated financial statements included in Item 1 of Part I of this 10-Q, for adetailed description of recent accounting pronouncements.
Item 3. Quantitative and Qualitative Disclosures About Market RiskThere has been no material change in the commodity price risk, foreign currency exchange risk, equity security price risk or interest rate risk discussed in Item 7Aof the 10-K.
Item 4. Controls and ProceduresWe maintain disclosure controls and procedures that are designed to ensure that material information required to be disclosed in our periodic reports filed orsubmitted under the Securities Exchange Act of 1934, as amended (the “Exchange Act”), is recorded, processed, summarized and reported within the time periodsspecified in the SEC’s rules and forms. Our disclosure controls and procedures are also designed to ensure that information required to be disclosed in the reportswe file or submit under the Exchange Act is accumulated and communicated to our management, including our principal executive officer and principal financialofficer as appropriate, to allow timely decisions regarding required disclosure.During the second quarter of fiscal 2017 , we carried out an evaluation, under the supervision and with the participation of our management, including our chiefexecutive officer and our chief financial officer, of the effectiveness of the design and operation of the disclosure controls and procedures, as defined in Rules 13a-15(e) and 15d-15(e) under the Exchange Act. Based upon that evaluation, our chief executive officer and chief financial officer concluded that our disclosurecontrols and procedures were effective, as of the end of the period covered by this report ( April 2, 2017 ).There were no changes in our internal control over financial reporting (as defined in Rules 13a-15(f) and 15d-15(f) of the Exchange Act) during our most recentlycompleted fiscal quarter that materially affected or are reasonably likely to materially affect internal control over financial reporting.
The certifications required by Section 302 of the Sarbanes-Oxley Act of 2002 are filed as exhibits 31.1 and 31.2 to this 10-Q.
36

Table of Contents
PART II — OTHER INFORMATION
Item 1. Legal Proceedings
Starbucks is party to various legal proceedings arising in the ordinary course of business, including, at times, certain employment litigation cases that have beencertified as class or collective actions, but is not currently a party to any legal proceeding that management believes could have a material adverse effect on ourconsolidated financial position, results of operations or cash flows.
Item 1A. Risk FactorsThere have been no material changes to the risk factors previously disclosed in the 10-K.
Item 2. Unregistered Sales of Equity Securities and Use of ProceedsInformation regarding repurchases of our common stock during the quarter ended April 2, 2017 :
Total Number of
Shares Purchased
Average Price
Paid per Share
Total Number of Shares
Purchased as Part of Publicly
Announced Plans or
Programs (2)
Maximum Number of
Shares that May Yet Be
Purchased Under the Plans
or Programs
Period (1) January 2, 2017 — January 29, 2017 178,846 $ 55.59 178,846 110,035,901January 30, 2017 — February 26, 2017 5,398,941 55.67 5,398,941 104,636,960February 27, 2017 — April 2, 2017 5,771,500 55.78 5,771,500 98,865,460Total 11,349,287 $ 55.72 11,349,287
(1) Monthly information is presented by reference to our fiscal months during the second quarter of fiscal 2017 .(2) Share repurchases are conducted under our ongoing share repurchase program announced in September 2001, which has no expiration date.
37

Table of Contents
Item 6. Exhibits
Incorporated by Reference Exhibit
No. Exhibit Description Form File No. Date ofFiling
ExhibitNumber
FiledHerewith
3.1 Restated Articles of Incorporation of Starbucks Corporation 10-Q 0-20322 4/28/2015 3.1 3.2
Amended and Restated Bylaws of Starbucks Corporation (As amended andrestated through September 13, 2016) 8-K 0-20322 9/16/2016 3.1
4.1
First Supplemental Indenture, dated March 17, 2017, by and betweenStarbucks Corporation and U.S. Bank National Association, as trustee,transfer agent and registrar, and Elavon Financial Services, DAC, UKBranch, as paying agent (0.372% Senior Notes due 2024)
8-K
0-20322
3/20/2017
4.2
4.2 Form of 0.372% Senior Note due March 15, 2024 8-K 0-20322 3/20/2017 4.3
10.1
Offer Letter dated March 23, 2017 between Starbucks Corporation and KevinJohnson — — — — X
31.1
Certification of Principal Executive Officer Pursuant to Rule 13a-14(a) of theSecurities Exchange Act of 1934, As Adopted Pursuant to Section 302 of theSarbanes-Oxley Act of 2002
—
—
—
—
X
31.2
Certification of Principal Financial Officer Pursuant to Rule 13a-14(a) of theSecurities Exchange Act of 1934, As Adopted Pursuant to Section 302 of theSarbanes-Oxley Act of 2002
—
—
—
—
X
32*
Certifications of Principal Executive Officer and Principal Financial OfficerPursuant to 18 U.S.C. Section 1350, As Adopted Pursuant to Section 906 ofthe Sarbanes-Oxley Act of 2002
—
—
—
—
—
101
The following financial statements from the Company's 10-Q for the fiscalquarter ended April 2, 2017, formatted in XBRL: (i) Condensed ConsolidatedStatements of Earnings, (ii) Condensed Consolidated Statements ofComprehensive Income, (iii) Condensed Consolidated Balance Sheets, (iv)Condensed Consolidated Statements of Cash Flows and (v) Notes toCondensed Consolidated Financial Statements
—
—
—
—
X
* Furnished herewith.
38
Table of Contents
SIGNATURESPursuant to the requirements of the Securities Exchange Act of 1934, the registrant has duly caused this report to be signed on its behalf by the undersignedthereunto duly authorized.
May 2, 2017
STARBUCKS CORPORATION
By: /s/ Scott Maw Scott Maw executive vice president, chief financial officer
Signing on behalf of the registrant and asprincipal financial officer
39
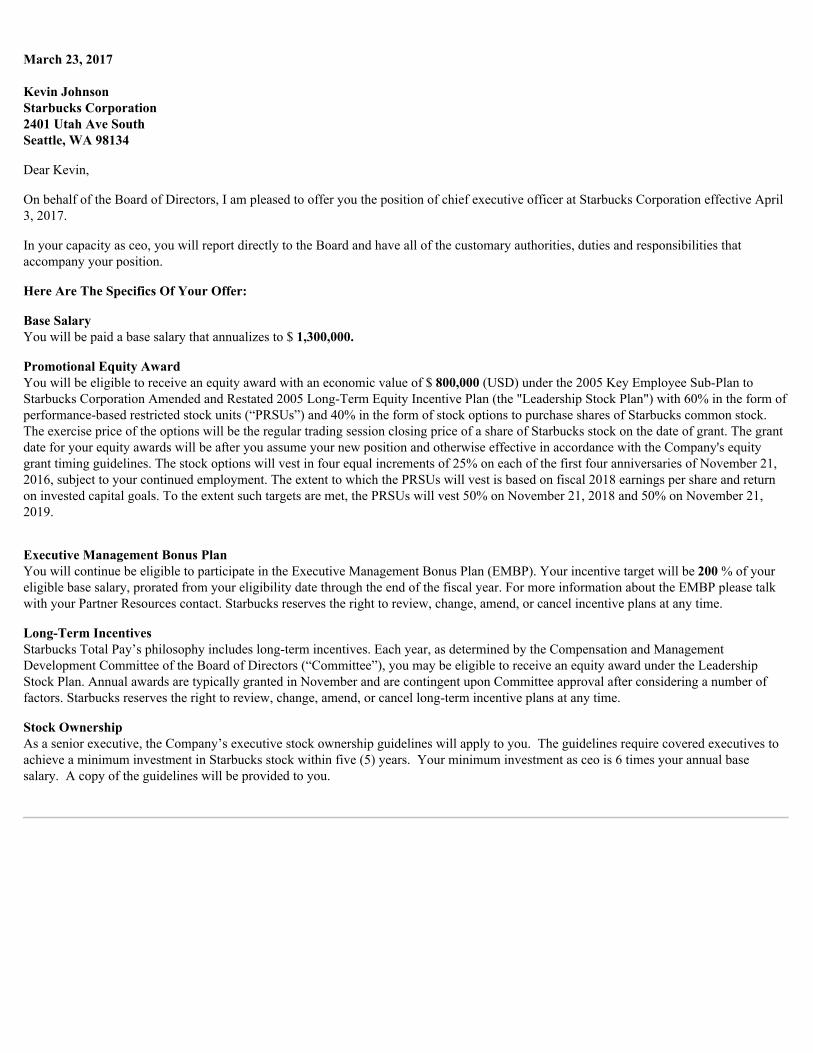
March 23, 2017 Kevin JohnsonStarbucks Corporation2401 Utah Ave SouthSeattle, WA 98134
Dear Kevin,
On behalf of the Board of Directors, I am pleased to offer you the position of chief executive officer at Starbucks Corporation effective April3, 2017.
In your capacity as ceo, you will report directly to the Board and have all of the customary authorities, duties and responsibilities thataccompany your position.
Here Are The Specifics Of Your Offer:
Base SalaryYou will be paid a base salary that annualizes to $ 1,300,000.
Promotional Equity AwardYou will be eligible to receive an equity award with an economic value of $ 800,000 (USD) under the 2005 Key Employee Sub-Plan toStarbucks Corporation Amended and Restated 2005 Long-Term Equity Incentive Plan (the "Leadership Stock Plan") with 60% in the form ofperformance-based restricted stock units (“PRSUs”) and 40% in the form of stock options to purchase shares of Starbucks common stock.The exercise price of the options will be the regular trading session closing price of a share of Starbucks stock on the date of grant. The grantdate for your equity awards will be after you assume your new position and otherwise effective in accordance with the Company's equitygrant timing guidelines. The stock options will vest in four equal increments of 25% on each of the first four anniversaries of November 21,2016, subject to your continued employment. The extent to which the PRSUs will vest is based on fiscal 2018 earnings per share and returnon invested capital goals. To the extent such targets are met, the PRSUs will vest 50% on November 21, 2018 and 50% on November 21,2019.
Executive Management Bonus PlanYou will continue be eligible to participate in the Executive Management Bonus Plan (EMBP). Your incentive target will be 200 % of youreligible base salary, prorated from your eligibility date through the end of the fiscal year. For more information about the EMBP please talkwith your Partner Resources contact. Starbucks reserves the right to review, change, amend, or cancel incentive plans at any time.
Long-Term IncentivesStarbucks Total Pay’s philosophy includes long-term incentives. Each year, as determined by the Compensation and ManagementDevelopment Committee of the Board of Directors (“Committee”), you may be eligible to receive an equity award under the LeadershipStock Plan. Annual awards are typically granted in November and are contingent upon Committee approval after considering a number offactors. Starbucks reserves the right to review, change, amend, or cancel long-term incentive plans at any time.
Stock OwnershipAs a senior executive, the Company’s executive stock ownership guidelines will apply to you. The guidelines require covered executives toachieve a minimum investment in Starbucks stock within five (5) years. Your minimum investment as ceo is 6 times your annual basesalary. A copy of the guidelines will be provided to you.

Executive Life InsuranceAs an executive, you and your family have a greater exposure to financial loss resulting from your death. Starbucks recognizes this exposureand has provided for coverage greater than outlined in Your Special Blend . You will receive partner life coverage equal to three (3) timesyour annualized base pay, paid for by Starbucks. You may purchase up to an additional two (2) times your annualized base pay (for a total offive (5) times pay) to a maximum life insurance benefit of $2,000,000.
Executive Physical ExamYou are eligible to participate in Starbucks executive physical program. Information about the program and our program provider will beemailed to you (new participants are notified at the beginning of each calendar quarter). The program provider will contact you shortlythereafter to establish an appointment. If you have questions about this physical, please consult your Partner Resources contact.
Insider TradingYou will be prohibited from trading Starbucks securities (or, in some circumstances, the securities of companies doing business withStarbucks) from time to time in accordance with the Company’s Insider Trading Policy and Blackout Procedures. A copy of the policy willbe provided to you on your first day and you will be required to sign a certificate indicating that you have read and understood the policy.
Coffee and Dairy Hedging PolicyAs an officer of the Company you are prohibited from trading in coffee or dairy futures, options or similar instruments for your own account.If you have further questions, please consult your Partner Resources contact.
If you accept this offer it is contingent on the following conditions of hire including:
• Confidentiality, Non-Solicitationand Non-Competition Agreement
Your employment with Starbucks Corporation will be “at will,” meaning that either you or the Company will be entitled to terminate youremployment at any time and for any reason, not prohibited by law.
On behalf of the entire team, I wish you the best in your new role and look forward to your continued success and partnership. Warm regards,
/s/ Howard Schultz
Howard Schultzexecutive chairman
Cc: Stock AdministrationExecutive Recruiting
Enc. Confidentiality, Non-Solicitation and Non-Competition AgreementStock Ownership Guidelines
By reporting to work, I accept the promotion with Starbucks Corporation, according to the terms set forth above.
/s/ Kevin Johnson March 23, 2017 Kevin Johnson Date of Acceptance

Please send a signed letter to:Julie Ann Overcashsvp, Talent, Inclusion and Global Rewards

Exhibit 31.1
CERTIFICATION PURSUANT TO RULE 13a-14(a) OF THE SECURITIES EXCHANGE ACT OF 1934AS ADOPTED PURSUANT TO SECTION 302 OF THE SARBANES-OXLEY ACT OF 2002
I, Kevin R. Johnson, certify that: 1. I have reviewed this Quarterly Report on Form 10-Q for the fiscal quarter ended April 2, 2017 of Starbucks Corporation;2. Based on my knowledge, this report does not contain any untrue statement of a material fact or omit to state a material fact necessary to make the
statements made, in light of the circumstances under which such statements were made, not misleading with respect to the period covered by this report;3. Based on my knowledge, the financial statements, and other financial information included in this report, fairly present in all material respects the
financial condition, results of operations and cash flows of the registrant as of, and for, the periods presented in this report;4. The registrant’s other certifying officer(s) and I are responsible for establishing and maintaining disclosure controls and procedures (as defined in
Exchange Act Rules 13a-15(e) and 15d-15(e)) and internal control over financial reporting (as defined in Exchange Act Rules 13a-15(f) and 15d-15(f))for the registrant and have:(a) Designed such disclosure controls and procedures, or caused such disclosure controls and procedures to be designed under our supervision, to
ensure that material information relating to the registrant, including its consolidated subsidiaries, is made known to us by others within thoseentities, particularly during the period in which this report is being prepared;
(b) Designed such internal control over financial reporting, or caused such internal control over financial reporting to be designed under oursupervision, to provide reasonable assurance regarding the reliability of financial reporting and the preparation of financial statements forexternal purposes in accordance with generally accepted accounting principles;
(c) Evaluated the effectiveness of the registrant’s disclosure controls and procedures and presented in this report our conclusions about theeffectiveness of the disclosure controls and procedures, as of the end of the period covered by this report based on such evaluation; and
(d) Disclosed in this report any change in the registrant’s internal control over financial reporting that occurred during the registrant’s most recentfiscal quarter (the registrant’s fourth fiscal quarter in the case of an annual report) that has materially affected, or is reasonably likely tomaterially affect, the registrant’s internal control over financial reporting; and
5. The registrant’s other certifying officer(s) and I have disclosed, based on our most recent evaluation of internal control over financial reporting, to theregistrant’s auditors and the audit committee of the registrant’s board of directors (or persons performing the equivalent functions):(a) All significant deficiencies and material weaknesses in the design or operation of internal control over financial reporting which are reasonably
likely to adversely affect the registrant’s ability to record, process, summarize and report financial information; and(b) Any fraud, whether or not material, that involves management or other employees who have a significant role in the registrant’s internal control
over financial reporting.
Date: May 2, 2017
/s/ Kevin R. Johnson Kevin R. Johnson president and chief executive officer
Exhibit 31.2
CERTIFICATION PURSUANT TO RULE 13a-14(a) OF THE SECURITIES EXCHANGE ACT OF 1934AS ADOPTED PURSUANT TO SECTION 302 OF THE SARBANES-OXLEY ACT OF 2002
I, Scott Maw, certify that: 1. I have reviewed this Quarterly Report on Form 10-Q for the fiscal quarter ended April 2, 2017 of Starbucks Corporation;2. Based on my knowledge, this report does not contain any untrue statement of a material fact or omit to state a material fact necessary to make the
statements made, in light of the circumstances under which such statements were made, not misleading with respect to the period covered by this report;3. Based on my knowledge, the financial statements, and other financial information included in this report, fairly present in all material respects the
financial condition, results of operations and cash flows of the registrant as of, and for, the periods presented in this report;4. The registrant’s other certifying officer(s) and I are responsible for establishing and maintaining disclosure controls and procedures (as defined in
Exchange Act Rules 13a-15(e) and 15d-15(e)) and internal control over financial reporting (as defined in Exchange Act Rules 13a-15(f) and 15d-15(f))for the registrant and have:(a) Designed such disclosure controls and procedures, or caused such disclosure controls and procedures to be designed under our supervision, to
ensure that material information relating to the registrant, including its consolidated subsidiaries, is made known to us by others within thoseentities, particularly during the period in which this report is being prepared;
(b) Designed such internal control over financial reporting, or caused such internal control over financial reporting to be designed under oursupervision, to provide reasonable assurance regarding the reliability of financial reporting and the preparation of financial statements forexternal purposes in accordance with generally accepted accounting principles;
(c) Evaluated the effectiveness of the registrant’s disclosure controls and procedures and presented in this report our conclusions about theeffectiveness of the disclosure controls and procedures, as of the end of the period covered by this report based on such evaluation; and
(d) Disclosed in this report any change in the registrant’s internal control over financial reporting that occurred during the registrant’s most recentfiscal quarter (the registrant’s fourth fiscal quarter in the case of an annual report) that has materially affected, or is reasonably likely tomaterially affect, the registrant’s internal control over financial reporting; and
5. The registrant’s other certifying officer(s) and I have disclosed, based on our most recent evaluation of internal control over financial reporting, to theregistrant’s auditors and the audit committee of the registrant’s board of directors (or persons performing the equivalent functions):(a) All significant deficiencies and material weaknesses in the design or operation of internal control over financial reporting which are reasonably
likely to adversely affect the registrant’s ability to record, process, summarize and report financial information; and(b) Any fraud, whether or not material, that involves management or other employees who have a significant role in the registrant’s internal control
over financial reporting.
Date: May 2, 2017
/s/ Scott Maw Scott Maw executive vice president, chief financial officer
Exhibit 32
CERTIFICATIONS PURSUANT TO 18 U.S.C. SECTION 1350AS ADOPTED PURSUANT TO SECTION 906 OF THE SARBANES-OXLEY ACT OF 2002
In connection with the Quarterly Report of Starbucks Corporation ("Starbucks") on Form 10-Q for the fiscal quarter ended April 2, 2017 , as filed with theSecurities and Exchange Commission on May 2, 2017 (the "Report"), Kevin R. Johnson, president and chief executive officer, and Scott Maw, executive vicepresident, chief financial officer of Starbucks, each hereby certifies, pursuant to 18 U.S.C. Section 1350, as adopted pursuant to Section 906 of the Sarbanes-OxleyAct of 2002, that, to his knowledge: (1) the Report fully complies with the requirements of Section 13(a) or 15(d) of the Securities Exchange Act of 1934; and(2) the information contained in the Report fairly presents, in all material respects, the financial condition and results of operations of Starbucks.
May 2, 2017
/s/ Kevin R. Johnson Kevin R. Johnson president and chief executive officer
May 2, 2017
/s/ Scott Maw Scott Maw executive vice president, chief financial officer