starbucks ar02_financials
26
15 CAUTIONARY STATEMENT PURSUANT TO THE PRIVATE SECURITIES LITIGATION REFORM ACT OF 1995 Certain statements set forth in or incorporated by reference into this Annual Report on Form 10-K, including anticipated Company-operated and licensed store openings, planned capital expenditures, expected cash requirements and trends in or expectations regarding the Company’s operations, constitute “forward-looking statements” within the meaning of the Private Securities Litigation Reform Act of 1995. Such statements are based on currently available operating, financial and competitive information and are subject to various risks and uncertainties. Actual future results and trends may differ materially depending on a variety of factors, including, but not limited to, coffee and other raw materials prices and availability, successful execution of internal performance and expansion plans, the effect of slowing United States and international economies, the impact of competition, the effect of legal proceedings and other risks detailed herein and in Starbucks Corporation’s other filings with the Securities and Exchange Commission. BUSINESS Starbucks Corporation (together with its subsidiaries, “Starbucks” or the “Company”) purchases and roasts high- quality whole bean coffees and sells them, along with fresh, rich-brewed coffees, Italian-style espresso beverages, cold blended beverages, a variety of pastries and confections, coffee- related accessories and equipment, a selection of premium teas and a line of compact discs primarily through Company- operated retail stores. In addition, Starbucks sells coffee and tea products through other channels of distribution, and, through certain of its equity investees, Starbucks also produces and sells bottled Frappuccino ® and Starbucks DoubleShot ™ coffee drinks and a line of premium ice creams. These non-retail channels are collectively known as “Specialty Operations.” The Company’s objective is to establish Starbucks as the most recognized and respected brand in the world.To achieve this goal, the Company plans to continue rapid expansion of its retail operations, grow its Specialty Operations and selectively pursue other opportunities to leverage the Starbucks brand through the introduction of new products and the development of new distribution channels. Company-operated Retail Stores The Company’s retail goal is to become the leading retailer and brand of coffee in each of its target markets by selling the finest quality coffee and related products and by providing superior customer service, thereby building a high degree of customer loyalty. Starbucks strategy for expanding its retail business is to increase its market share in existing markets and to open stores in new markets where the opportunity exists to become the leading specialty coffee retailer. In support of this strategy,Starbucks opened 614 new Company-operated stores during the fiscal year ended September 29, 2002 (“fiscal 2002”). All store openings are reported net of closures. At fiscal year end, Starbucks had 3,496 Company-operated stores in 43 states, the District of Columbia and five Canadian provinces (which comprise the Company’s North American Retail operating segment), as well as 322 stores in the United Kingdom, 33 stores in Australia and 29 stores in Thailand (which comprise the Company’s International Retail business unit). Company-operated retail stores accounted for approximately 85% of net revenues during fiscal 2002. Starbucks retail stores are typically located in high-traffic,high- visibility locations. Because the Company can vary the size and format, its stores are located in a variety of settings, including downtown and suburban retail centers, office buildings and university campuses. While the Company selectively locates stores in suburban malls, it focuses on stores that have convenient access for pedestrians and drivers. All Starbucks stores offer a choice of regular and decaffeinated coffee beverages, including at least one “coffee of the day,” a broad selection of Italian-style espresso beverages,cold blended beverages,a selection of teas and distinctively packaged roasted whole bean coffees. Starbucks stores also offer a selection of fresh pastries and other food items, sodas, juices, coffee-making equipment and accessories, a selection of compact discs, games and seasonal novelty items. Each Starbucks store varies its product mix depending upon the size of the store and its location. Larger stores carry a broad selection of the Company’s whole bean coffees in various sizes and types of packaging, as well as an assortment of coffee and espresso- making equipment and accessories such as coffee grinders, coffee makers, espresso machines, coffee filters, storage containers, travel tumblers and mugs. Smaller Starbucks stores and kiosks typically sell a full line of coffee beverages, a more limited selection of whole bean coffees and a few accessories such as travel tumblers and logo mugs. Approximately 500 Starbucks stores carry a selection of “grab and go” sandwiches and salads. During fiscal 2002, the Company’s retail sales mix by product type was approximately 77% beverages, 13% food items, 6% whole bean coffees and 4% coffee-making equipment and accessories. Specialty Operations Starbucks Specialty Operations strive to develop the Starbucks brand outside the Company-operated retail store environment through a number of channels. Starbucks strategy is to reach customers where they work, travel, shop and dine by establishing relationships with prominent third parties that share the Company’s values and commitment to quality.These relationships take various forms, including arrangements through Business Alliances, international retail store licensing agreements, grocery channel licensing agreements, warehouse club accounts, interactive operations, equity investees and other initiatives related to the Company’s core businesses. In certain licensing situations, Starbucks has an equity ownership interest in licensee operations. During fiscal 2002, specialty revenues (which include royalties and fees from licensees as well as product sales derived from Specialty Operations) accounted for approximately 15% of the Company’s net revenues. North American Foodservice Accounts and Retail Store Licensing together comprise the Business Alliances operating segment and represents approximately 45% of specialty revenues. Foodservice Accounts The Company sells whole bean and ground coffees to office coffee distributors, hotels, airlines, retailers and restaurants as well as institutional foodservice companies that service business, industry, education and healthcare accounts. In fiscal 2002, the Company had approximately 5,600 foodservice accounts, and revenues from these accounts comprised approximately 27% of specialty revenues. Retail Store Licensing Although the Company does not generally relinquish operational control of its retail stores in North America, in situations in which a master concessionaire or another company controls or can provide improved access to desirable retail space, the Company licenses its operations. As part of these arrangements,Starbucks receives license fees and royalties and sells coffee and related products for resale in the licensed locations. Employees working in the licensed locations must follow Starbucks detailed store-operating procedures and attend training classes similar to those given to Starbucks store managers and employees. During fiscal 2002, Starbucks opened 269 licensed retail stores. As of September 29, 2002, the Company had 1,078 licensed stores in continental North America. Revenues from these stores accounted for approximately 18% of specialty revenues in fiscal 2002. The remainder of the Company’s business units include international retail store licensing, grocery channel licensing, warehouse club accounts, interactive operations, equity investees and other initiatives.These business units comprised approximately 55% of specialty revenues in fiscal 2002. International Retail Store Licensing The Company’s retail stores located outside of North America, the United Kingdom, Thailand and Australia are operated through a number of licensing arrangements with prominent retailers. During fiscal 2002, Starbucks expanded its international presence by opening 294 new international licensed stores, including the first stores in Austria, Oman, Spain, Germany, Indonesia, Mexico, Puerto Rico and Greece. Licensing arrangements are managed within three operating
-
Upload
finance41 -
Category
Economy & Finance
-
view
310 -
download
0
Transcript of starbucks ar02_financials

15
CAUTIONARY STATEMENT PURSUANT TO THE PRIVATESECURITIES LITIGATION REFORM ACT OF 1995Certain statements set forth in or incorporated by referenceinto this Annual Report on Form 10-K, including anticipatedCompany-operated and licensed store openings, plannedcapital expenditures, expected cash requirements and trendsin or expectations regarding the Company’s operations,constitute “forward-looking statements” within the meaningof the Private Securities Litigation Reform Act of 1995. Suchstatements are based on currently available operating, financialand competitive information and are subject to various risksand uncertainties. Actual future results and trends may differmaterially depending on a variety of factors, including, but notlimited to, coffee and other raw materials prices andavailability, successful execution of internal performance andexpansion plans, the effect of slowing United States andinternational economies, the impact of competition, the effectof legal proceedings and other risks detailed herein and inStarbucks Corporation’s other filings with the Securities andExchange Commission.
BUSINESS
Starbucks Corporation (together with its subsidiaries,“Starbucks” or the “Company”) purchases and roasts high-quality whole bean coffees and sells them, along with fresh,rich-brewed coffees, Italian-style espresso beverages, coldblended beverages, a variety of pastries and confections, coffee-related accessories and equipment, a selection of premium teasand a line of compact discs primarily through Company-operated retail stores. In addition, Starbucks sells coffee and teaproducts through other channels of distribution, and, throughcertain of its equity investees, Starbucks also produces and sellsbottled Frappuccino® and Starbucks DoubleShot™ coffeedrinks and a line of premium ice creams. These non-retailchannels are collectively known as “Specialty Operations.”The Company’s objective is to establish Starbucks as the mostrecognized and respected brand in the world.To achieve thisgoal, the Company plans to continue rapid expansion of itsretail operations, grow its Specialty Operations and selectivelypursue other opportunities to leverage the Starbucks brandthrough the introduction of new products and thedevelopment of new distribution channels.
Company-operated Retail StoresThe Company’s retail goal is to become the leading retailerand brand of coffee in each of its target markets by selling thefinest quality coffee and related products and by providingsuperior customer service, thereby building a high degree ofcustomer loyalty. Starbucks strategy for expanding its retailbusiness is to increase its market share in existing markets andto open stores in new markets where the opportunity exists tobecome the leading specialty coffee retailer. In support of thisstrategy, Starbucks opened 614 new Company-operated storesduring the fiscal year ended September 29, 2002 (“fiscal2002”). All store openings are reported net of closures. Atfiscal year end, Starbucks had 3,496 Company-operated storesin 43 states, the District of Columbia and five Canadianprovinces (which comprise the Company’s North AmericanRetail operating segment), as well as 322 stores in the UnitedKingdom, 33 stores in Australia and 29 stores in Thailand(which comprise the Company’s International Retail businessunit). Company-operated retail stores accounted forapproximately 85% of net revenues during fiscal 2002.
Starbucks retail stores are typically located in high-traffic, high-visibility locations.Because the Company can vary the size andformat, its stores are located in a variety of settings, includingdowntown and suburban retail centers, office buildings anduniversity campuses. While the Company selectively locatesstores in suburban malls, it focuses on stores that haveconvenient access for pedestrians and drivers.
All Starbucks stores offer a choice of regular and decaffeinatedcoffee beverages, including at least one “coffee of the day,” abroad selection of Italian-style espresso beverages, cold blendedbeverages, a selection of teas and distinctively packaged roastedwhole bean coffees. Starbucks stores also offer a selection offresh pastries and other food items, sodas, juices, coffee-making
equipment and accessories, a selection of compact discs, gamesand seasonal novelty items. Each Starbucks store varies itsproduct mix depending upon the size of the store and itslocation. Larger stores carry a broad selection of theCompany’s whole bean coffees in various sizes and types ofpackaging, as well as an assortment of coffee and espresso-making equipment and accessories such as coffee grinders,coffee makers, espresso machines, coffee filters, storagecontainers, travel tumblers and mugs. Smaller Starbucks storesand kiosks typically sell a full line of coffee beverages, a morelimited selection of whole bean coffees and a few accessoriessuch as travel tumblers and logo mugs. Approximately 500Starbucks stores carry a selection of “grab and go” sandwichesand salads. During fiscal 2002, the Company’s retail sales mixby product type was approximately 77% beverages, 13% fooditems, 6% whole bean coffees and 4% coffee-makingequipment and accessories.
Specialty OperationsStarbucks Specialty Operations strive to develop the Starbucksbrand outside the Company-operated retail store environmentthrough a number of channels. Starbucks strategy is to reachcustomers where they work, travel, shop and dine byestablishing relationships with prominent third parties thatshare the Company’s values and commitment to quality.Theserelationships take various forms, including arrangementsthrough Business Alliances, international retail store licensingagreements, grocery channel licensing agreements, warehouseclub accounts, interactive operations, equity investees and otherinitiatives related to the Company’s core businesses. In certainlicensing situations, Starbucks has an equity ownership interestin licensee operations. During fiscal 2002, specialty revenues(which include royalties and fees from licensees as well asproduct sales derived from Specialty Operations) accounted forapproximately 15% of the Company’s net revenues.
North American Foodservice Accounts and Retail StoreLicensing together comprise the Business Alliances operatingsegment and represents approximately 45% of specialty revenues.
Foodservice AccountsThe Company sells whole bean and ground coffees to officecoffee distributors, hotels, airlines, retailers and restaurants aswell as institutional foodservice companies that servicebusiness, industry, education and healthcare accounts. In fiscal2002, the Company had approximately 5,600 foodserviceaccounts, and revenues from these accounts comprisedapproximately 27% of specialty revenues.
Retail Store LicensingAlthough the Company does not generally relinquishoperational control of its retail stores in North America, insituations in which a master concessionaire or anothercompany controls or can provide improved access to desirableretail space, the Company licenses its operations. As part ofthese arrangements, Starbucks receives license fees and royaltiesand sells coffee and related products for resale in the licensedlocations. Employees working in the licensed locations mustfollow Starbucks detailed store-operating procedures andattend training classes similar to those given to Starbucks storemanagers and employees. During fiscal 2002, Starbucksopened 269 licensed retail stores. As of September 29, 2002,the Company had 1,078 licensed stores in continental NorthAmerica. Revenues from these stores accounted forapproximately 18% of specialty revenues in fiscal 2002.
The remainder of the Company’s business units includeinternational retail store licensing, grocery channel licensing,warehouse club accounts, interactive operations, equityinvestees and other initiatives.These business units comprisedapproximately 55% of specialty revenues in fiscal 2002.
International Retail Store LicensingThe Company’s retail stores located outside of North America,the United Kingdom, Thailand and Australia are operatedthrough a number of licensing arrangements with prominentretailers. During fiscal 2002, Starbucks expanded itsinternational presence by opening 294 new internationallicensed stores, including the first stores in Austria, Oman,Spain, Germany, Indonesia, Mexico, Puerto Rico and Greece.Licensing arrangements are managed within three operating

16
regions, based primarily on geography. At fiscal year end, theCompany had a total of 928 licensed international retail storeslocated in the following operating regions:
Asia-Pacific Europe/Middle East/Africa Latin America
Japan 397 United Arab Emirates 23 Hawaii 30 Taiwan 99 Saudi Arabia 22 Mexico 1 China 88 Kuwait 16 Puerto Rico 1 South Korea 53 Switzerland 12 Philippines 49 Lebanon 11New Zealand 34 Israel 6 Singapore 32 Austria 5Malaysia 26 Spain 5 Indonesia 5 Germany 4
Qatar 3 Bahrain 2 Greece 2 Oman 2
TOTAL 783 113 32
Product sales to, and royalty and license fee revenues from,licensed international retail stores accounted for approximately17% of specialty revenues in fiscal 2002.
Grocery Channel LicensingStarbucks has a licensing agreement with Kraft Foods, Inc.(“Kraft”) to market and distribute Starbucks whole bean andground coffees in the grocery channel in the United States.Pursuant to that agreement, Kraft manages all distribution,marketing, advertising and promotions for Starbucks wholebean and ground coffee in grocery and mass merchandisestores and pays a royalty to Starbucks based on a percentage oftotal net sales. By the end of fiscal 2002, the Company’s wholebean and ground coffees were available throughout the UnitedStates in approximately 18,000 supermarkets. Revenues fromthe grocery channel accounted for approximately 13% ofspecialty revenues in fiscal 2002.
Warehouse Club AccountsThe Company sells whole bean and ground coffees to ware-house club chains in North America.As part of its agreementwith Starbucks to market and distribute to the grocerychannel, Kraft distributes Starbucks products to warehouseclub stores, for which the Company pays a distribution fee.Revenues from warehouse club accounts representedapproximately 13% of specialty revenues in fiscal 2002.
Interactive OperationsThe Company makes Starbucks coffee and coffee-relatedproducts conveniently available via mail order and online.TheCompany maintains a website at Starbucks.com with an onlinestore that allows customers to purchase coffee, gifts and otheritems via the Internet. Starbucks also publishes and distributesa catalog of business gifts that offer coffees, certain food itemsand select coffee-making equipment and accessories.Additionally, Starbucks offers customers high-speed wirelessInternet access at approximately 1,650 enabled Company-operated retail stores.
Management believes these interactive operations support itsretail store expansion into new markets, and reinforce brandrecognition and the Starbucks Experience for customers inexisting markets. The Company’s interactive operationsaccounted for approximately 7% of specialty revenues infiscal 2002.
Equity Investees and Other InitiativesThe Company has two partnerships to produce and distributeStarbucks branded products. The North American CoffeePartnership with the Pepsi-Cola Company develops anddistributes bottled Frappuccino and Starbucks DoubleShotcoffee drinks. The Starbucks Ice Cream Partnership withDreyer’s Grand Ice Cream, Inc. develops and distributespremium ice creams. Starbucks sells roasted coffee for use byequity investees, and these revenues accounted forapproximately 2% of specialty revenues in fiscal 2002.
The Company has several other initiatives related to its corebusinesses that are intended to enhance the customers’experience at Starbucks retail stores. For example, theCompany has marketed a selection of premium tea productssince the acquisition of Tazo, L.L.C. in 1999. Collectively,these initiatives accounted for approximately 3% of specialtyrevenues in fiscal 2002.

17
SELECTED FINANCIAL DATAIn thousands, except earnings per share and store operating data
The following selected financial data have been derived from the consolidated financial statements of the Company.The data setforth below should be read in conjunction with “Management’s Discussion and Analysis of Financial Condition and Results ofOperations” and the Company’s consolidated financial statements and notes thereto.
As of and for the Sept 29, 2002 Sept 30, 2001 Oct 1, 2000 Oct 3, 1999 Sept 27, 1998fiscal year ended (1) (52 Wks) (52 Wks) (52 Wks) (53 Wks) (52 Wks)
RESULTS OF OPERATIONS DATANet revenues:
Retail $ 2,792,904 $ 2,229,594 $ 1,823,607 $ 1,423,389 $ 1,102,574Specialty 496,004 419,386 354,007 263,439 206,128
Total net revenues 3,288,908 2,648,980 2,177,614 1,686,828 1,308,702Merger expenses (2) - - - - 8,930Operating income 318,725 281,094 212,252 156,711 109,216 Internet-related investment losses (3) - 2,940 58,792 - -Gain on sale of investment (4) 13,361 - - - -Net earnings $ 215,073 $ 181,210 $ 94,564 $ 101,693 $ 68,372 Net earnings per common share – diluted (5) $ 0.54 $ 0.46 $ 0.24 $ 0.27 $ 0.19 Cash dividends per share - - - - -BALANCE SHEET DATAWorking capital $ 310,048 $ 148,661 $ 146,568 $ 135,303 $ 157,805Total assets 2,292,736 1,846,519 1,491,546 1,252,514 992,755 Long-term debt (including current portion) 5,786 6,483 7,168 7,691 1,803 Shareholders’ equity 1,726,638 1,375,927 1,148,399 961,013 794,297 STORE OPERATING DATAPercentage change in comparable store sales (6)
North America 7% 5% 9% 6% 5% International (3)% 2% 23% 20% 28%Consolidated 6% 5% 9% 6% 5%
Systemwide retail store sales (7) $ 3,796,000 $ 2,950,000 $ 2,250,000 $ 1,633,000 $ 1,190,000Systemwide stores opened during the year: (8)
Continental North AmericaCompany-operated stores 525 525 408 416 352Licensed stores 269 279 351 46 39
InternationalCompany-operated stores 89 122 76 31 35Licensed stores 294 282 168 119 48
Total 1,177 1,208 1,003 612 474Systemwide stores open at year end:
Continental North AmericaCompany-operated stores 3,496 2,971 2,446 2,038 1,622Licensed stores 1,078 809 530 179 133
InternationalCompany-operated stores 384 295 173 97 66 Licensed stores 928 634 352 184 65
Total 5,886 4,709 3,501 2,498 1,886(1) The Company’s fiscal year ends on the Sunday closest to September 30.All fiscal years presented include 52 weeks, except fiscal 1999, which includes
53 weeks.(2) Merger expenses relate to the business combination with Seattle Coffee Holdings Limited.(3) See Notes to Consolidated Financial Statements (Notes 4 and 7).(4) See Notes to Consolidated Financial Statements (Note 7).(5) See Notes to Consolidated Financial Statements (Note 1). Earnings per share data for fiscal years presented have been restated to reflect the
two-for-one stock splits in fiscal 2001 and 1999.(6) Includes only Company-operated stores open 13 months or longer.(7) Systemwide retail store sales include sales at Company-operated and licensed stores and are believed by management to measure global penetration of
Starbucks retail stores.(8) Systemwide store openings are reported net of closures.
18
MANAGEMENT’S DISCUSSION AND ANALYSIS OFFINANCIAL CONDITION AND RESULTS OF OPERATIONS
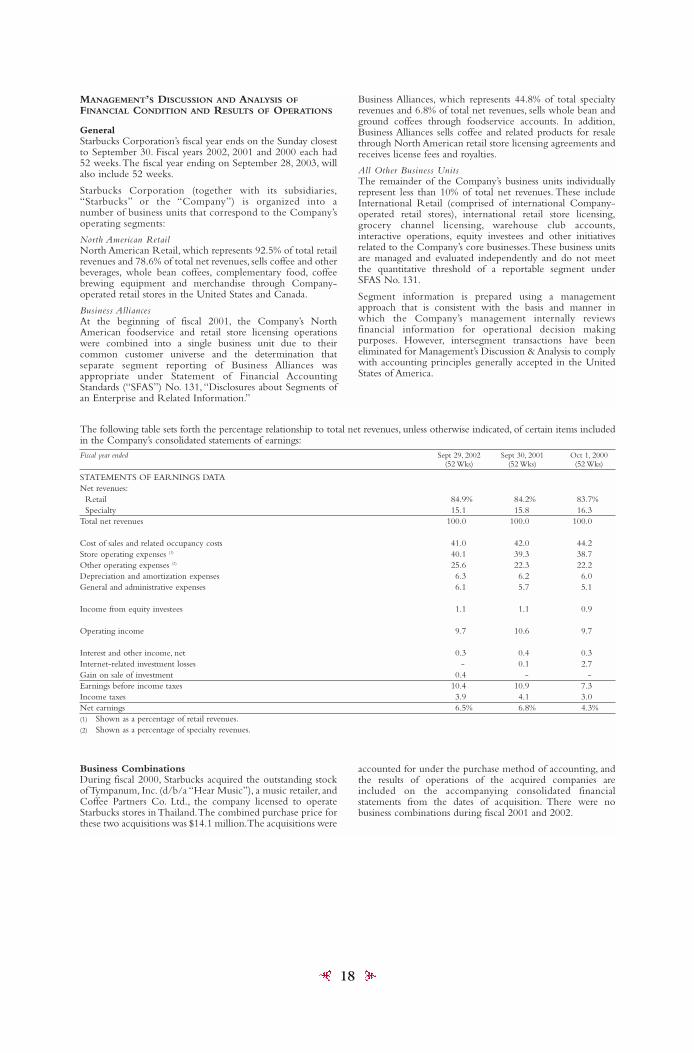
GeneralStarbucks Corporation’s fiscal year ends on the Sunday closestto September 30. Fiscal years 2002, 2001 and 2000 each had52 weeks.The fiscal year ending on September 28, 2003, willalso include 52 weeks.
Starbucks Corporation (together with its subsidiaries,“Starbucks” or the “Company”) is organized into anumber of business units that correspond to the Company’soperating segments:
North American RetailNorth American Retail, which represents 92.5% of total retailrevenues and 78.6% of total net revenues, sells coffee and otherbeverages, whole bean coffees, complementary food, coffeebrewing equipment and merchandise through Company-operated retail stores in the United States and Canada.
Business AlliancesAt the beginning of fiscal 2001, the Company’s NorthAmerican foodservice and retail store licensing operationswere combined into a single business unit due to theircommon customer universe and the determination thatseparate segment reporting of Business Alliances wasappropriate under Statement of Financial AccountingStandards (“SFAS”) No. 131, “Disclosures about Segments ofan Enterprise and Related Information.”
Business Alliances, which represents 44.8% of total specialtyrevenues and 6.8% of total net revenues, sells whole bean andground coffees through foodservice accounts. In addition,Business Alliances sells coffee and related products for resalethrough North American retail store licensing agreements andreceives license fees and royalties.
All Other Business UnitsThe remainder of the Company’s business units individuallyrepresent less than 10% of total net revenues. These includeInternational Retail (comprised of international Company-operated retail stores), international retail store licensing,grocery channel licensing, warehouse club accounts,interactive operations, equity investees and other initiativesrelated to the Company’s core businesses.These business unitsare managed and evaluated independently and do not meetthe quantitative threshold of a reportable segment underSFAS No. 131.
Segment information is prepared using a managementapproach that is consistent with the basis and manner inwhich the Company’s management internally reviewsfinancial information for operational decision makingpurposes. However, intersegment transactions have beeneliminated for Management’s Discussion & Analysis to complywith accounting principles generally accepted in the UnitedStates of America.
The following table sets forth the percentage relationship to total net revenues, unless otherwise indicated, of certain items includedin the Company’s consolidated statements of earnings:Fiscal year ended Sept 29, 2002 Sept 30, 2001 Oct 1, 2000
(52 Wks) (52 Wks) (52 Wks)
STATEMENTS OF EARNINGS DATANet revenues:
Retail 84.9% 84.2% 83.7%Specialty 15.1 15.8 16.3
Total net revenues 100.0 100.0 100.0
Cost of sales and related occupancy costs 41.0 42.0 44.2 Store operating expenses (1) 40.1 39.3 38.7 Other operating expenses (2) 25.6 22.3 22.2 Depreciation and amortization expenses 6.3 6.2 6.0 General and administrative expenses 6.1 5.7 5.1
Income from equity investees 1.1 1.1 0.9
Operating income 9.7 10.6 9.7
Interest and other income, net 0.3 0.4 0.3 Internet-related investment losses - 0.1 2.7 Gain on sale of investment 0.4 - -Earnings before income taxes 10.4 10.9 7.3 Income taxes 3.9 4.1 3.0 Net earnings 6.5% 6.8% 4.3% (1) Shown as a percentage of retail revenues.(2) Shown as a percentage of specialty revenues.
Business CombinationsDuring fiscal 2000, Starbucks acquired the outstanding stockof Tympanum, Inc. (d/b/a “Hear Music”), a music retailer, andCoffee Partners Co. Ltd., the company licensed to operateStarbucks stores in Thailand.The combined purchase price forthese two acquisitions was $14.1 million.The acquisitions were
accounted for under the purchase method of accounting, andthe results of operations of the acquired companies areincluded on the accompanying consolidated financialstatements from the dates of acquisition. There were nobusiness combinations during fiscal 2001 and 2002.
19
RESULTS OF OPERATIONS—FISCAL 2002 COMPARED TOFISCAL 2001
Systemwide Retail Store SalesSystemwide retail store sales, which include net sales for bothCompany-operated and licensed retail stores, were $3.8 billionin fiscal 2002, an increase of 29% from $3.0 billion in fiscal2001, primarily due to the opening of 1,177 new stores andstrong comparable store sales growth in North America.
During fiscal 2003, Starbucks expects to open at least 1,200new stores, including approximately 525 Company-operatedand 225 licensed stores in North America, and 75 Company-operated and 375 licensed stores internationally.
Consolidated Net RevenuesDuring the fiscal year ended September 29, 2002, Starbucksderived approximately 85% of net revenues from itsCompany-operated retail stores. Retail revenues include theNorth American Retail and International Retail businessunits. The remaining 15% of net revenues was derived fromthe Company’s Specialty Operations, which includes BusinessAlliances and all other non-retail business units.
Net revenues increased 24% from $2.6 billion in fiscal 2001 to$3.3 billion in fiscal 2002, primarily due to the Company’sstore expansion program and comparable store sales increases.Comparable store sales increased by 6%, 5%, and 9% in fiscal2002, 2001 and 2000, respectively. As a result of its expansionstrategy of clustering stores in existing markets, Starbucks hasexperienced a certain level of cannibalization of sales ofexisting stores by new stores as store concentration hasincreased.However,management believes such cannibalizationhas been justified by the incremental sales and return on newstore investments. This cannibalization, as well as increasedcompetition, slowing economies and other factors, may putdownward pressure on the Company’s comparable store salesgrowth in future periods.
The table below reconciles revenues by operating segment torevenues on the accompanying consolidated statements ofearnings (in thousands):Fiscal year ended Sept 29, Sept 30, Oct 1,
2002 2002 2000 North American Retail $ 2,583,756 $ 2,086,354 $1,734,929 International Retail 209,148 143,240 88,678
Subtotal – Retail revenues 2,792,904 2,229,594 1,823,607 Business Alliances 222,410 193,574 160,812 All other business units
(excl. International Retail) 344,425 276,603 216,402 Intersegment revenues (1) (70,831) (50,791) (23,207)
Subtotal – Specialty revenues 496,004 419,386 354,007 Total net revenues $ 3,288,908 $ 2,648,980 $2,177,614 (1) Intersegment revenues consist primarily of product sales to and from
subsidiaries and equity method investees.
Net Revenues by Segment
North American RetailNorth American Retail revenues increased by $497.4 million,or 24%, to $2.6 billion in fiscal 2002, from $2.1 billion in fiscal2001, primarily due to the opening of 525 new retail stores infiscal 2002 and comparable store sales growth of 7% for theperiod. The increase in comparable store sales was due tohigher transaction volume. Management believes increasedcustomer traffic was driven by new product innovation, whichcontinues to broaden the customer base during non-peakhours of operation, and by expanding the Company’s capacityto satisfy customer demand through enhanced technology,training and execution at retail stores.
Business AlliancesBusiness Alliances revenues increased by $28.8 million,or 15%,to $222.4 million in fiscal 2002, from $193.6 million in fiscal2001, primarily due to the opening of 269 new licensed storesin fiscal 2002 and the resulting increase in royalty revenuesfrom and product sales to those licensees.
All Other Business Units (including International Retail, net ofIntersegment revenues)Revenues for all other business units increased by $113.6million, or 31%, to $482.7 million for fiscal 2002, from $369.1million in fiscal 2001. This increase was mainly related togrowth in the number of international Company-operatedand licensed retail stores.
Consolidated Results of OperationsCost of sales and related occupancy costs decreased to 41.0%of net revenues in fiscal 2002, from 42.0% in fiscal 2001.Thedecrease was primarily due to a shift in sales mix to highermargin products, such as handcrafted beverages, as well aslower green coffee costs. Starbucks does not expect a benefitfrom lower green coffee costs in fiscal 2003, as the Companyhas moved away from formula-based commodity exchangepricing contracts, and is instead basing most contracts onhigher, fixed prices to encourage the continuing supply ofhigh-quality green coffee. Improvements in cost of sales werepartially offset by higher occupancy costs due to increasedrepair and maintenance activities on Company-operated retailstores and the continuing trend of higher retail rent expense.
Store operating expenses as a percentage of retail revenuesincreased to 40.1% in fiscal 2002, from 39.3% in fiscal 2001.The restaurant portion of retail revenues, which is comprisedof made-to-order beverages and fresh food, was a higherproportion of total retail revenues in fiscal 2002.This resultedin higher payroll-related expenditures due to the continuingshift in sales to more labor-intensive handcrafted beverages aswell as higher average wage rates. Higher provisions for retailstore asset impairment and disposals of $26.0 million in fiscal2002 compared to $7.3 million in fiscal 2001 also contributedto the unfavorable variance.
Starbucks regularly monitors the financial results of itsCompany-operated retail stores and accumulates historicaloperating measures to identify performance trends in variousmarkets. Provisions for asset impairment are recorded when,among other things, retail stores are unable to generate currentand future estimated undiscounted cash flows in excess of assetcarrying values. Gains and losses on disposals are generatedprimarily through renovation activities.
Other operating expenses (expenses associated with non-retail operations) were 25.6% of specialty revenues in fiscal2002, compared to 22.3% in fiscal 2001. The increase was aresult of continued development of the Company’sinternational infrastructure, including additional regionaloffices and employees supporting global expansion, as well ashigher advertising expenditures from the Company’sinteractive operations.
Depreciation and amortization expenses increased to $205.6million in fiscal 2002, from $163.5 million in fiscal 2001.Theincrease was primarily due to the opening of 525 new NorthAmerican and 89 new international Company-operatedretail stores.
General and administrative expenses increased to $202.2million in fiscal 2002, compared to $151.4 million in fiscal2001.The increase was primarily due to higher payroll-relatedexpenditures and an $18.0 million litigation settlement chargerelated to two class action lawsuits.
Operating income increased 13.4% to $318.7 million in fiscal2002, from $281.1 million in fiscal 2001.The operating margindecreased to 9.7% of total net revenues in fiscal 2002,compared to 10.6% in fiscal 2001 primarily due to higheroperating expenses partially offset by cost of salesimprovements, as discussed above.

20
Results of Operations by SegmentThe table below reconciles results of operations on the accompanying consolidated statements of earnings to operating incomeby operating segment (in thousands):Fiscal year ended September 29, 2002: Consolidated Intersegment Segment Results North American Retail $ 432,513 $ - $ 432,513 Business Alliances 56,605 - 56,605 All other business units 62,914 107 63,021 Intersegment eliminations (1) - (107) (107) Unallocated corporate expenses (233,307) - (233,307)
Operating income $ 318,725 $ - $ 318,725 Fiscal year ended September 30, 2001:North American Retail $ 336,434 $ - $ 336,434 Business Alliances 50,165 - 50,165 All other business units 68,783 1,333 70,116 Intersegment eliminations (1) - (1,333) (1,333) Unallocated corporate expenses (174,288) - (174,288)
Operating income $ 281,094 $ - $ 281,094 Fiscal year ended October 1, 2000:North American Retail $ 249,924 $ - $ 249,924 Business Alliances 43,777 - 43,777 All other business units 53,453 (130) 53,323 Intersegment eliminations (1) - 130 130 Unallocated corporate expenses (134,902) - (134,902)
Operating income $ 212,252 $ - $ 212,252 (1) Intersegment eliminations consist primarily of product sales and related cost of sales to and from subsidiaries and equity investees.
North American RetailOperating income for North American Retail increased by28.6% to $432.5 million in fiscal 2002, from $336.4 million infiscal 2001. Operating margin increased to 16.7% of relatedrevenues from 16.1% in the prior year, primarily due toimprovements in cost of sales related to the shift to highermargin products and lower green coffee and dairy costs,partially offset by increased payroll-related expendituresresulting from the continuing shift in sales to more labor-intensive handcrafted beverages and higher average wage rates.
Business AlliancesOperating income for Business Alliances increased by 12.8%to $56.6 million in fiscal 2002, from $50.2 million in fiscal2001. Operating margin decreased to 25.5% of relatedrevenues from 25.9% in the prior year primarily due to thesignificant amount of infrastructure investment made in fiscal2002 to grow the domestic licensee channel.
All Other Business UnitsOperating income for all other business units decreased 8.5%to $62.9 million in fiscal 2002, from $68.8 million in fiscal2001.Operating margin decreased to 13.0% of related revenuesfrom 18.6% in the prior year, primarily due to increasedinternational store maintenance and rent costs for Company-operated stores, as well as provisions for asset impairment.
Unallocated Corporate ExpensesUnallocated corporate expenses pertain to corporate functionsthat are not specifically attributable to the Company’soperating segments and include “General and administrativeexpenses” and related depreciation and amortization expenses.Depreciation and amortization expenses of $31.1 million and$22.9 million are included in unallocated corporate expensesfor the fiscal years ended 2002 and 2001, respectively.
Income from Equity InvesteesIncome from equity investees was $35.8 million in fiscal 2002,compared to $28.6 million in fiscal 2001. The increase wasprimarily due to the improved profitability of the NorthAmerican Coffee Partnership as a result of increased salesvolume from extensions of its product line and expansion ofgeographic distribution, as well as improvements in its cost ofgoods sold primarily due to manufacturing efficiencies.Additionally, the net earnings of Starbucks Coffee Korea Co.,Ltd. increased as a result of an increase in retail stores to 53 infiscal 2002, compared to 24 in fiscal 2001.These increases were
partially offset by slightly lower contributions from StarbucksCoffee Japan, Ltd. due to lower profitability as well as thereduction of our ownership interest from 50.0% to 40.1% atthe beginning of fiscal 2002. See “Gain on Sale of Investment”discussion for additional information.
Interest and Other Income, NetNet interest and other income, which primarily consists ofinvestment income, decreased to $9.3 million in fiscal 2002,from $10.8 million in fiscal 2001, primarily as a result of lowerinterest rates on cash, cash equivalents and short-term securities.
Gain on Sale of InvestmentOn October 10, 2001, the Company sold 30,000 of its sharesof Starbucks Coffee Japan, Ltd. (“Starbucks Japan”) atapproximately $495 per share, net of related costs. Inconnection with this sale, the Company received cash proceedsof $14.8 million and recorded a gain of $13.4 million on theaccompanying consolidated statement of earnings. TheCompany’s ownership interest in Starbucks Japan was reducedfrom 50.0% to 47.5% following the sale of the shares.
Also on October 10, 2001, Starbucks Japan issued 220,000shares of common stock at approximately $495 per share, netof related costs, in an initial public offering in Japan. Inconnection with this offering, the Company’s ownershipinterest in Starbucks Japan was reduced from 47.5% to 40.1%.The Company recorded “Other additional paid-in capital” onthe accompanying consolidated balance sheet of $39.4 million,reflecting the increase in value of its share of the net assets ofStarbucks Japan related to the stock offering.As of September29, 2002, the quoted closing price of Starbucks Japan shareswas approximately $203 per share.
Income TaxesThe Company’s effective tax rates were 37.0% in fiscal2002 and 37.3% in fiscal 2001. The effective tax rate infiscal 2001 was impacted by the establishment of valuationallowances against deferred tax benefits resulting from lossesfrom investments in majority-owned foreign subsidiaries andInternet-related investment losses. Management determinedthat a portion of these losses may not be realizable for taxpurposes within the allowable carryforward period. Excludingthe impact of these allowances, the effective tax rate wouldhave been 37.0% in fiscal 2001.

21
RESULTS OF OPERATIONS—FISCAL 2001 COMPARED TOFISCAL 2000
Systemwide Retail Store SalesSystemwide retail store sales were $3.0 billion in fiscal 2001,an increase of 31% from $2.3 billion in fiscal 2000, primarilydue to the opening of 1,208 stores.
Consolidated Net RevenuesDuring the fiscal year ended September 30, 2001, Starbucksderived approximately 84% of net revenues from itsCompany-operated retail stores. The remaining 16% of netrevenues was derived from the Company’s SpecialtyOperations.Total net revenues in fiscal 2001 increased 22% to$2.6 billion from $2.2 billion in fiscal 2000.
Net Revenues by Segment
North American RetailNorth American Retail revenues increased by $351.4 million,or 20%, to $2.1 billion in fiscal 2001, from $1.7 billion in fiscal2000, primarily due to the addition of new Company-operated retail stores and comparable store sales growth of5%. The increase in comparable store sales resulted from a2% increase in the number of transactions and a 3% increasein the average dollar value per transaction.
Business AlliancesBusiness Alliances revenues increased by $32.8 million,or 20%,to $193.6 million in fiscal 2001, from $160.8 million in fiscal2000, primarily due to the opening of new licensed stores andthe resulting increase in royalty revenues from and productsales to those licensees.
All Other Business Units (including International Retail, net ofIntersegment revenues)Revenues for all other business units increased by $87.2million, or 31%, to $369.1 million in fiscal 2001, from $281.9million in fiscal 2000. This increase was mainly related togrowth in the number of international Company-operatedand licensed retail stores.
Consolidated Results of OperationsCost of sales and related occupancy costs decreased to 42.0%of net revenues in fiscal 2001, from 44.2% in thecorresponding period in fiscal 2000. The decrease resultedfrom several factors, including lower green coffee costs, theimpact of retail beverage sales price increases, continued costsavings from procurement initiatives and shifts in sales mix tohigher margin products.These factors were partially offset byhigher occupancy costs as a result of higher average rentexpense per square foot as well as the expansion of Company-operated stores in international markets that have higheroccupancy costs as a percentage of revenues than NorthAmerican retail operations.
Store operating expenses as a percentage of retail revenuesincreased to 39.3% in fiscal 2001, from 38.7% in fiscal 2000.The increase was primarily due to higher payroll-relatedexpenditures resulting from higher average wage rates and thecontinuing shift to more labor-intensive handcraftedbeverages, partially offset by leverage gained from regionaloverhead expenses distributed over an expanded revenue baseand reductions in advertising expenses.
Other operating expenses were 22.3% of specialty revenuesin fiscal 2001, compared to 22.2% in fiscal 2000.The increasewas attributable to the Company’s licensee channels, bothinternational and domestic, as the Company expands thesebusinesses geographically and continues to develop itsinternal resources for future growth. These costs werepartially offset by lower advertising expenses for theCompany’s interactive operations.
Depreciation and amortization expenses increased to $163.5million in fiscal 2001, from $130.2 million in fiscal 2000.Theincrease was mainly the result of opening new NorthAmerican and international retail stores.
General and administrative expenses increased to $151.4million in fiscal 2001, compared to $110.2 million in fiscal2000.The increase was primarily due to higher payroll-related
expenditures, professional fees, provisions for obsoletesoftware, charitable donations and uninsured expensesresulting from the Nisqually earthquake in fiscal 2001.
Operating income increased 32.4% to $281.1 million in fiscal2001, from $212.3 million in fiscal 2000.The operating marginincreased to 10.6% of total net revenues in fiscal 2001,compared to 9.7% in the same period in fiscal 2000 primarilydue to growth of total net revenues and improvements in costof sales, as discussed above.
Results of Operations by Segment
North American RetailOperating income for North American Retail increased by34.6% to $336.4 million in fiscal 2001, from $249.9 million infiscal 2000. Operating margin increased to 16.1% of relatedrevenues from 14.4% in the prior year, primarily due to theshift in sales to higher margin products and benefits from lowergreen coffee costs.
Business AlliancesOperating income for Business Alliances increased by 14.6% to$50.2 million in fiscal 2001, from $43.8 million in fiscal 2000.Operating margin decreased to 25.9% of related revenues from27.2% in the prior year, primarily due to increased operatingexpenses resulting from the build-up of infrastructure to supportthe expansion of the domestic licensee channel.
All Other Business UnitsOperating income for all other business units increased by28.7% to $68.8 million in fiscal 2001, from $53.4 million infiscal 2000. Operating margin decreased slightly to 18.6% ofrelated revenues from 19.0% in the prior year, primarily dueto higher International Retail payroll-related expenditurespartially offset by reductions in advertising expenses for theCompany’s interactive operations.
Unallocated Corporate ExpensesUnallocated corporate expenses pertain to corporate functionsthat are not specifically attributable to the Company’soperating segments and include “General and administrativeexpenses” and certain depreciation and amortization expenses.Depreciation and amortization expenses of $22.9 million and$24.7 million are included in unallocated corporate expensesfor fiscal 2001 and 2000, respectively.
Income from Equity InvesteesIncome from equity investees was $28.6 million in fiscal 2001,compared to $20.3 million in fiscal 2000. The increase wasprimarily due to the improved profitability of the NorthAmerican Coffee Partnership that resulted from increased salesvolume from extensions of its product line and expansion ofgeographic distribution, as well as improvements in its cost ofgoods sold primarily due to manufacturing efficiencies. Theincrease was also due to improved operating results ofStarbucks Coffee Japan, Ltd., attributable to additionalprofitable store locations as well as the distribution ofinfrastructure and administrative costs over an expandedrevenue base. Starbucks Coffee Japan, Ltd. had 289 stores openas of September 30, 2001, compared to 154 stores open as ofOctober 1, 2000.
Internet-related Investment LossesDuring fiscal 2001, the Company determined that itsinvestments in Internet-related companies had suffereddeclines in value.The Company’s management deemed thesedeclines as other than temporary due to the sustained weakconditions in the Internet industry as reflected in thebankruptcy or liquidation proceedings of numerouscomparable companies and the significant decline in stockmarket valuation of the sector, the declining financialcondition of each company in which the Company hadinvested, the unfavorable prospects of such companiesobtaining additional funding and the length of time and extentto which the quoted market values had been less than cost forpublicly traded companies. As a result, the Companyrecognized losses totaling $2.9 million to write off theCompany’s remaining investment in Kozmo.com, which wasliquidated during fiscal 2001, and to reduce its investment inLiveworld, Inc. (previously known as Talk City, Inc.).
22
Income TaxesThe Company’s effective tax rates of 37.3% in fiscal 2001 and41.1% in fiscal 2000 were both impacted by theestablishment of valuation allowances against deferred taxbenefits resulting from Internet-related investment losses.Management determined that a portion of these losses maynot be realizable for tax purposes within the allowablecarryforward period. Excluding the impact of theseallowances, the effective tax rates would have been 37.0% and37.6% in fiscal 2001 and 2000, respectively.The decrease to37.0% in fiscal 2001 from 37.6% in fiscal 2000 was due to taxplanning efforts.
LIQUIDITY AND CAPITAL RESOURCES
The Company had $402.2 million in cash and cash equivalentsand short-term investments at the end of fiscal 2002.Workingcapital as of September 29, 2002, totaled $310.0 millioncompared to $148.7 million as of September 30, 2001. Cashand cash equivalents increased by $61.3 million during fiscal2002 to $174.6 million. This increase was in addition to anincrease in short-term investments of $120.4 million duringthe same period.The Company intends to use its available cashresources to invest in its core businesses and other new businessopportunities related to its core businesses. Depending onmarket conditions, Starbucks may acquire additional shares ofits common stock pursuant to its stock repurchase plan.
Cash provided by operating activities in fiscal 2002 totaled$477.7 million and resulted primarily from net earnings andnon-cash charges of $465.8 million. The increase in accruedcompensation and related costs contributed $24.1 millionprimarily due to an increase in the number of employees. Inaddition, the increase in other accrued expenses provided$34.0 million, $18.0 million of which was for the litigationsettlement charge recorded in fiscal 2002, and the remainingchange is due to the growth of the Company’s operations.Inventory purchases to supply a larger number of retail storesused $41.4 million.
Cash used by investing activities in fiscal 2002 totaled $485.3million.This included capital additions to property, plant andequipment of $375.5 million mainly related to opening 614new Company-operated retail stores, remodeling certainexisting stores, and purchasing land and constructing theCompany’s new roasting and distribution facility in Nevada.The net activity in the Company’s marketable securitiesportfolio during fiscal 2002 used $116.9 million of cash.Excess cash was invested primarily in short-term, investment-grade securities. An increase in other assets used $24.5million, mainly relating to an increase in long-termreceivables. During fiscal 2002, the Company made equityinvestments of $6.1 million in its international investees,excluding the effects of foreign currency fluctuations. TheCompany received $22.8 million in distributions mainly fromthe North American Coffee Partnership. Proceeds from thesale of a portion of the Company’s shares in Starbucks Japanprovided $14.8 million.
Cash provided by financing activities in fiscal 2002 totaled$67.4 million.This included $91.3 million generated from theexercise of employee stock options and $16.2 milliongenerated from the Company’s employee stock purchase plan.As options granted under the Company’s stock option plansare exercised, the Company will continue to receive proceedsand a tax deduction; however, neither the amounts nor thetiming thereof can be predicted.The increase in checks issuedbut not presented for payment provided $12.9 million. Duringfiscal 2002, the Company purchased 2.6 million shares of itscommon stock in accordance with authorized repurchaseplans using $52.2 million of cash. Of this amount, $10.2million was used to repurchase 515,000 shares to complete the$60.0 million repurchase plan initiated in September 2001.The remaining $42.0 million was used to repurchase 2.1million shares in accordance with the 10.0 million sharerepurchase plan introduced in June 2002. There wereapproximately 7.9 million additional shares authorized forrepurchase under this plan as of September 29, 2002. Sharerepurchases are at the discretion of management, in accordancewith the terms of each plan, and depend on market conditions,
capital requirements and such other factors as the Companymay consider relevant.
Cash requirements in fiscal 2003, other than normal operatingexpenses, are expected to consist primarily of capitalexpenditures related to the addition of new Company-operated retail stores. Starbucks plans to open at least 600Company-operated stores during fiscal 2003. The Companyalso anticipates incurring additional expenditures forremodeling certain existing stores and enhancing itsproduction capacity and information systems.While there canbe no assurance that current expectations will be realized,management expects capital expenditures in fiscal 2003 to beapproximately $425 million.
Management believes that existing cash and investments aswell as cash generated from operations should be sufficient tofinance capital requirements for its core businesses through2003. New joint ventures, other new business opportunities orstore expansion rates substantially in excess of those presentlyplanned may require outside funding.
COFFEE PRICES, AVAILABILITY AND GENERAL RISKCONDITIONS
The supply and price of coffee are subject to significantvolatility. Although most coffee trades in the commoditymarket, coffee of the quality sought by Starbucks tends to tradeon a negotiated basis at a substantial premium abovecommodity coffee prices, depending upon the supply anddemand at the time of purchase. Supply and price can beaffected by multiple factors in the producing countries,including weather, political and economic conditions. Inaddition, green coffee prices have been affected in the past, andmay be affected in the future, by the actions of certainorganizations and associations that have historically attemptedto influence commodity prices of green coffee throughagreements establishing export quotas or restricting coffeesupplies worldwide.The Company’s ability to raise sales pricesin response to rising coffee prices may be limited, and theCompany’s profitability could be adversely affected if coffeeprices were to rise substantially.
The Company enters into fixed-price purchase commitmentsin order to secure an adequate supply of quality green coffeeand bring greater certainty to the cost of sales in futureperiods. As of September 29, 2002, the Company hadapproximately $242.2 million in fixed-price purchasecommitments which, together with existing inventory, areexpected to provide an adequate supply of green coffeethrough 2003.The Company believes, based on relationshipsestablished with its suppliers in the past, that the risk of non-delivery on such purchase commitments is low.
In addition to fluctuating coffee prices, management believesthat the Company’s future results of operations and earningscould be significantly impacted by other factors such asincreased competition within the specialty coffee industry,fluctuating dairy prices, the Company’s ability to find optimalstore locations at favorable lease rates, increased costs associatedwith opening and operating retail stores and the Company’scontinued ability to hire, train and retain qualified personnel.
FINANCIAL RISK MANAGEMENT
The Company is exposed to market risk related to foreigncurrency exchange rates, equity security prices and changes ininterest rates.
Foreign Currency Exchange RiskThe majority of the Company’s revenue, expense and capitalpurchasing activities are transacted in United States dollars.However, because a portion of the Company’s operationsconsists of activities outside of the United States, the Companyhas transactions in other currencies, primarily the Canadiandollar, British pound and Japanese yen. As part of its riskmanagement strategy, the Company frequently evaluates itsforeign currency exchange risk by monitoring market data andexternal factors that may influence exchange rate fluctuations.As a result, Starbucks may engage in transactions involvingvarious derivative instruments, with maturities generally not
23
exceeding five years, to hedge assets, liabilities, revenues andpurchases denominated in foreign currencies. During fiscal2002, the Company entered into forward foreign exchangecontracts that qualify as cash flow hedges under SFAS No. 133,“Accounting for Derivative Instruments and HedgingActivities,” to hedge a portion of anticipated internationalrevenue. In addition, Starbucks entered into a forward foreignexchange contract that qualifies as a hedge of its netinvestment in a foreign operation. These contracts expirewithin 24 months.
Equity Security Price RiskThe Company has minimal exposure to price fluctuations onequity mutual funds within the trading portfolio. The tradingsecurities are designated to approximate the Company’s liabilityunder the Management Deferred Compensation Plan(“MDCP”). A corresponding liability is included in “Accruedcompensation and related costs” on the accompanyingconsolidated balance sheets.These investments are recorded atfair value with unrealized gains and losses recognized in “Interestand other income, net.”The offsetting changes in the MDCPliability are recorded in “General and administrative expenses”on the accompanying consolidated statements of earnings.
Interest Rate RiskThe Company’s diversified available-for-sale portfolio consistsmainly of fixed income instruments.The primary objectives ofthese investments are to preserve capital and liquidity.Available-for-sale securities are of investment grade and arerecorded on the balance sheet at fair value with unrealizedgains and losses reported as a separate component of“Accumulated other comprehensive income/loss.” TheCompany does not hedge its interest rate exposure.
SEASONALITY AND QUARTERLY RESULTS
The Company’s business is subject to seasonal fluctuations.Significant portions of the Company’s net revenues and profitsare realized during the first quarter of the Company’s fiscalyear, which includes the December holiday season. Inaddition, quarterly results are affected by the timing of theopening of new stores, and the Company’s rapid growth mayconceal the impact of other seasonal influences. Because of theseasonality of the Company’s business, results for any quarterare not necessarily indicative of the results that may beachieved for the full fiscal year.
APPLICATION OF CRITICAL ACCOUNTING POLICIES
Critical accounting policies are those that management believesare both most important to the portrayal of the Company’sfinancial condition and results, and require management’s mostdifficult, subjective or complex judgments, often as a result ofthe need to make estimates about the effect of matters that areinherently uncertain. Judgments and uncertainties affecting theapplication of those policies may result in materially differentamounts being reported under different conditions or usingdifferent assumptions.
Starbucks considers its policy on impairment of long-livedassets to be most critical in understanding the judgments thatare involved in preparing its consolidated financial statements.
Impairment of Long-lived AssetsWhen facts and circumstances indicate that the carrying valuesof long-lived assets, including intangibles, may be impaired, anevaluation of recoverability is performed by comparing thecarrying value of the assets to projected future cash flows inaddition to other quantitative and qualitative analyses. Uponindication that the carrying value of such assets may not berecoverable, the Company recognizes an impairment loss as a
charge against current operations. Property, plant andequipment assets are grouped at the lowest level for whichthere are identifiable cash flows when assessing impairment.Cash flows for retail assets are identified at the individual storelevel. Long-lived assets to be disposed of are reported at thelower of their carrying amount or fair value, less estimatedcosts to sell. Judgments made by the Company related to theexpected useful lives of long-lived assets and the ability of theCompany to realize undiscounted cash flows in excess of thecarrying amounts of such assets are affected by factors such asthe ongoing maintenance and improvements of the assets,changes in economic conditions and changes in operatingperformance. As the Company assesses the ongoing expectedcash flows and carrying amounts of its long-lived assets, thesefactors could cause the Company to realize materialimpairment charges.
NEW ACCOUNTING STANDARDS
In July 2001, the Financial Accounting Standards Board(“FASB”) issued SFAS No. 142, “Goodwill and OtherIntangible Assets.” SFAS No. 142 requires, among other things,the use of a nonamortization approach for purchased goodwilland certain intangibles. Goodwill and certain intangibles withindefinite lives will not be amortized but instead will bereviewed for impairment at least annually. Remainingintangibles with finite useful lives will continue to beamortized. As of September 29, 2002, the Company hadgoodwill and other intangible assets, net of accumulatedamortization, of $19.9 million and $9.9 million, respectively,which are subject to the transitional assessment provisions ofSFAS No. 142.The adoption of SFAS No. 142 on September30, 2002, will not have a material impact on future results ofoperations or the Company’s financial position.
In August 2001, FASB issued SFAS No. 144,“Accounting forthe Impairment or Disposal of Long-Lived Assets,” whichsupercedes SFAS No. 121,“Accounting for the Impairment ofLong-Lived Assets and for Long-Lived Assets to Be DisposedOf.” SFAS No.144 retains the fundamental provisions of SFASNo. 121, but sets forth new criteria for asset classification andbroadens the scope of qualifying discontinued operations. TheCompany’s adoption of SFAS No. 144 on September 30, 2002will not have a material impact on the Company’s consolidatedfinancial position and results of operations.
In November 2001, FASB issued Emerging Issues Task Force(“EITF”) No. 01-14,“Income Statement Characterization ofReimbursements Received for ‘Out-of-Pocket’ ExpensesIncurred.”This Issue clarifies the FASB staff ’s position that allreimbursements received for incidental expenses incurred inconjunction with providing services as part of a company’scentral ongoing operations should be characterized as revenuein the income statement. The Company adopted EITFNo. 01-14 on December 31, 2001, and it did not havea material impact on the Company’s consolidated resultsof operations.
In November 2002, the FASB issued Interpretation No. 45,“Guarantor’s Accounting and Disclosure Requirements forGuarantees, Including Indirect Guarantees of Indebtedness ofOthers,” which elaborates on existing disclosure of mostguarantees, and clarifies when a company must recognize aninitial liability for the fair value of obligations it assumesunder guarantee agreements. The initial recognition andmeasurement provisions apply on a prospective basis toguarantees issued or modified after December 31, 2002. Thedisclosure requirements of the Interpretation are effective forthe Company’s fiscal year 2003. Starbucks does not expect theadoption of this Interpretation to have a material impact onthe Company’s financial position or disclosures.

24
CONSOLIDATED STATEMENTS OF EARNINGSIn thousands, except earnings per share
Fiscal year ended Sept 29, 2002 Sept 30, 2001 Oct 1, 2000 Net revenues:
Retail $ 2,792,904 $ 2,229,594 $ 1,823,607 Specialty 496,004 419,386 354,007
Total net revenues 3,288,908 2,648,980 2,177,614 Cost of sales and related occupancy costs 1,350,011 1,112,785 961,885 Store operating expenses 1,121,108 875,473 704,898 Other operating expenses 127,178 93,326 78,445 Depreciation and amortization expenses 205,557 163,501 130,232 General and administrative expenses 202,161 151,416 110,202
Income from equity investees 35,832 28,615 20,300 Operating income 318,725 281,094 212,252
Interest and other income, net 9,300 10,768 7,110 Internet-related investment losses - 2,940 58,792Gain on sale of investment 13,361 - - Earnings before income taxes 341,386 288,922 160,570
Income taxes 126,313 107,712 66,006 Net earnings $ 215,073 $ 181,210 $ 94,564
Net earnings per common share – basic $ 0.56 $ 0.48 $ 0.25 Net earnings per common share – diluted $ 0.54 $ 0.46 $ 0.24
Weighted average shares outstanding:Basic 385,575 380,566 371,191 Diluted 397,526 394,349 385,999
See Notes to Consolidated Financial Statements.
CONSOLIDATED BALANCE SHEETSIn thousands, except share data
Sept 29, 2002 Sept 30, 2001 ASSETS Current assets:
Cash and cash equivalents $ 174,572 $ 113,237 Short-term investments – Available-for-sale securities 217,302 101,399 Short-term investments – Trading securities 10,360 5,913 Accounts receivable, net of allowances of $3,680 and $4,590, respectively 97,573 90,425 Inventories 263,174 221,253 Prepaid expenses and other current assets 42,351 29,829 Deferred income taxes, net 42,206 31,869 Total current assets 847,538 593,925
Equity and other investments 105,986 63,097 Property, plant and equipment, net 1,265,756 1,135,784 Other assets 53,554 31,868 Goodwill, net 19,902 21,845
TOTAL ASSETS $ 2,292,736 $ 1,846,519 LIABILITIES AND SHAREHOLDERS’ EQUITY Current liabilities:
Accounts payable $ 135,994 $ 127,905 Checks drawn in excess of bank balances 74,895 61,987 Accrued compensation and related costs 105,899 81,458 Accrued occupancy costs 51,195 35,835 Accrued taxes 54,244 70,346 Other accrued expenses 72,289 40,117 Deferred revenue 42,264 26,919 Current portion of long-term debt 710 697 Total current liabilities 537,490 445,264
Deferred income taxes, net 22,496 19,133 Long-term debt 5,076 5,786 Other long-term liabilities 1,036 409
Shareholders’ equity:Common stock and additional paid-in capital – Authorized, 600,000,000 shares;
issued and outstanding, 388,228,592 and 380,044,042 shares, respectively (includes 1,697,100 common stock units in both years) 891,040 791,622
Other additional paid-in capital 39,393 - Retained earnings 804,786 589,713Accumulated other comprehensive loss (8,581) (5,408) Total shareholders’ equity 1,726,638 1,375,927 TOTAL LIABILITIES AND SHAREHOLDERS’ EQUITY $ 2,292,736 $ 1,846,519
See Notes to Consolidated Financial Statements.
25
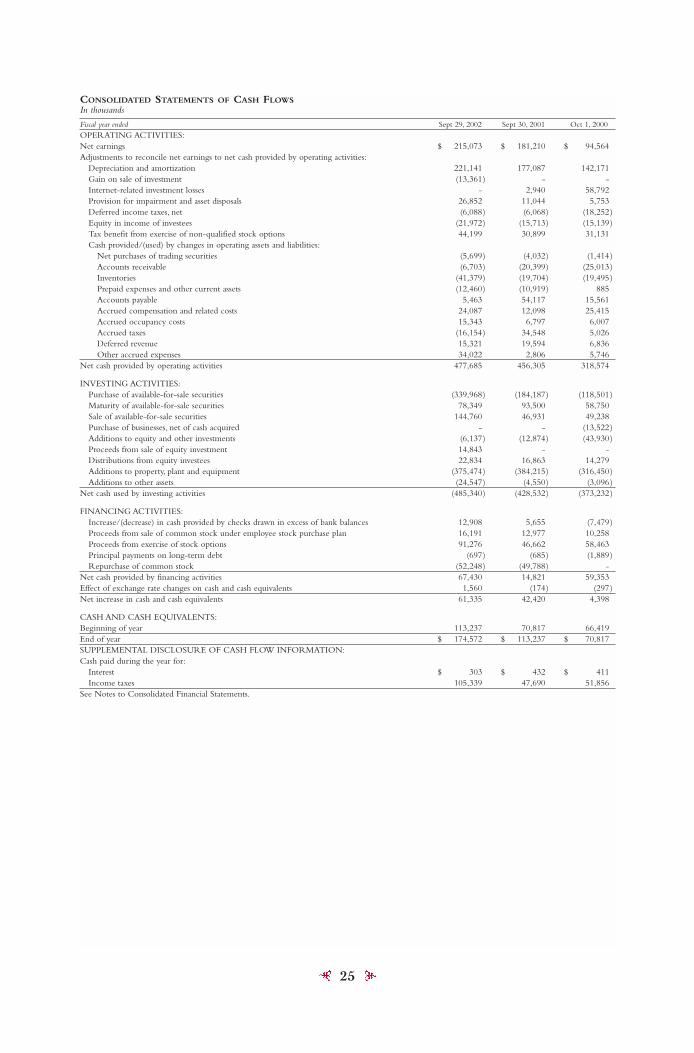
CONSOLIDATED STATEMENTS OF CASH FLOWSIn thousands
Fiscal year ended Sept 29, 2002 Sept 30, 2001 Oct 1, 2000 OPERATING ACTIVITIES:Net earnings $ 215,073 $ 181,210 $ 94,564 Adjustments to reconcile net earnings to net cash provided by operating activities:
Depreciation and amortization 221,141 177,087 142,171 Gain on sale of investment (13,361) - -Internet-related investment losses - 2,940 58,792Provision for impairment and asset disposals 26,852 11,044 5,753 Deferred income taxes, net (6,088) (6,068) (18,252) Equity in income of investees (21,972) (15,713) (15,139) Tax benefit from exercise of non-qualified stock options 44,199 30,899 31,131 Cash provided/(used) by changes in operating assets and liabilities:
Net purchases of trading securities (5,699) (4,032) (1,414)Accounts receivable (6,703) (20,399) (25,013) Inventories (41,379) (19,704) (19,495) Prepaid expenses and other current assets (12,460) (10,919) 885 Accounts payable 5,463 54,117 15,561 Accrued compensation and related costs 24,087 12,098 25,415 Accrued occupancy costs 15,343 6,797 6,007 Accrued taxes (16,154) 34,548 5,026 Deferred revenue 15,321 19,594 6,836 Other accrued expenses 34,022 2,806 5,746
Net cash provided by operating activities 477,685 456,305 318,574
INVESTING ACTIVITIES:Purchase of available-for-sale securities (339,968) (184,187) (118,501)Maturity of available-for-sale securities 78,349 93,500 58,750Sale of available-for-sale securities 144,760 46,931 49,238Purchase of businesses, net of cash acquired - - (13,522)Additions to equity and other investments (6,137) (12,874) (43,930)Proceeds from sale of equity investment 14,843 - - Distributions from equity investees 22,834 16,863 14,279Additions to property, plant and equipment (375,474) (384,215) (316,450)Additions to other assets (24,547) (4,550) (3,096)
Net cash used by investing activities (485,340) (428,532) (373,232)
FINANCING ACTIVITIES:Increase/(decrease) in cash provided by checks drawn in excess of bank balances 12,908 5,655 (7,479)Proceeds from sale of common stock under employee stock purchase plan 16,191 12,977 10,258 Proceeds from exercise of stock options 91,276 46,662 58,463Principal payments on long-term debt (697) (685) (1,889)Repurchase of common stock (52,248) (49,788) -
Net cash provided by financing activities 67,430 14,821 59,353Effect of exchange rate changes on cash and cash equivalents 1,560 (174) (297) Net increase in cash and cash equivalents 61,335 42,420 4,398
CASH AND CASH EQUIVALENTS:Beginning of year 113,237 70,817 66,419End of year $ 174,572 $ 113,237 $ 70,817 SUPPLEMENTAL DISCLOSURE OF CASH FLOW INFORMATION:Cash paid during the year for:
Interest $ 303 $ 432 $ 411 Income taxes 105,339 47,690 51,856
See Notes to Consolidated Financial Statements.

26
CONSOLIDATED STATEMENTS OF SHAREHOLDERS’ EQUITYIn thousands, except share data
Additional Accumulated Other Common Stock Paid-In Retained Comprehensive
Shares Amount Capital Earnings Income/(Loss) Total
Balance, October 3, 1999 366,564,190 $ 366 $ 650,654 $ 313,939 $ (3,946) $ 961,013
Net earnings - - - 94,564 - 94,564 Unrealized holding losses, net - - - - (163) (163) Translation adjustment - - - - (6,867) (6,867) Comprehensive income 87,534
Exercise of stock options,including tax benefit of $31,131 8,943,570 9 89,585 - - 89,594
Sale of common stock 807,542 1 10,257 - - 10,258 Balance, October 1, 2000 376,315,302 376 750,496 408,503 (10,976) 1,148,399
Net earnings - - - 181,210 - 181,210 Unrealized holding gains, net - - - - 2,087 2,087 Translation adjustment - - - - 3,481 3,481 Comprehensive income 186,778
Exercise of stock options,including tax benefit of $30,899 6,289,892 6 77,555 - - 77,561
Sale of common stock 813,848 1 12,976 - - 12,977 Repurchase of common stock (3,375,000) (3) (49,785) - - (49,788)
Balance, September 30, 2001 380,044,042 380 791,242 589,713 (5,408) 1,375,927
Net earnings - - - 215,073 - 215,073 Unrealized holding losses, net - - - - (1,509) (1,509) Translation adjustment - - - - (1,664) (1,664) Comprehensive income 211,900
Equity adjustment related to equity investee transaction - - 39,393 - - 39,393
Exercise of stock options,including tax benefit of $44,199 9,830,136 10 135,465 - - 135,475
Sale of common stock 991,742 1 16,190 - - 16,191 Repurchase of common stock (2,637,328) (3) (52,245) - - (52,248)
Balance, September 29, 2002 388,228,592 $ 388 $ 930,045 $ 804,786 $ (8,581) $ 1,726,638 See Notes to Consolidated Financial Statements.

27
NOTES TO CONSOLIDATED FINANCIAL STATEMENTS
Years ended September 29, 2002, September 30, 2001,and October 1, 2000
Note 1: Summary of Significant Accounting Policies
Description of BusinessStarbucks Corporation (together with its subsidiaries,“Starbucks” or the “Company”) purchases and roasts high-quality whole bean coffees and sells them, along with fresh,rich-brewed coffees, Italian-style espresso beverages, coldblended beverages, a variety of pastries and confections, coffee-related accessories and equipment, a selection of premium teasand a line of compact discs primarily through its Company-operated retail stores. Starbucks sells coffee and tea productsthrough other channels of distribution, and, through certain ofits equity investees, Starbucks also produces and sells bottledFrappuccino® and Starbucks DoubleShot™ coffee drinks and aline of premium ice creams. These non-retail channels arecollectively known as “Specialty Operations.”The Company’sobjective is to establish Starbucks as the most recognized andrespected brand in the world. To achieve this goal, theCompany plans to continue rapid expansion of its retailoperations, grow its Specialty Operations and selectivelypursue other opportunities to leverage the Starbucks brandthrough the introduction of new products and thedevelopment of new distribution channels.
Principles of ConsolidationThe consolidated financial statements reflect the financialposition and operating results of Starbucks, which includeswholly owned subsidiaries and investees controlled bythe Company.
Investments in entities which the Company does not control,but has the ability to exercise significant influence overoperating and financial policies, are accounted for under theequity method. Investments in entities in which Starbucksdoes not have the ability to exercise significant influence areaccounted for under the cost method.
All significant intercompany transactions have been eliminated.
Fiscal Year EndThe Company’s fiscal year ends on the Sunday closest toSeptember 30. The fiscal years ended September 29, 2002,September 30, 2001, and October 1, 2000, each included52 weeks.
Estimates and AssumptionsThe preparation of financial statements in conformity withaccounting principles generally accepted in the United Statesof America requires management to make estimates andassumptions that affect the reported amounts of assets,liabilities, revenues and expenses.Actual results may differ fromthese estimates.
Cash and Cash EquivalentsThe Company considers all highly liquid instruments with amaturity of three months or less at the time of purchase to becash equivalents.
Cash ManagementThe Company’s cash management system provides for thereimbursement of all major bank disbursement accounts on adaily basis. Checks issued but not presented for payment to thebank are reflected as “Checks drawn in excess of bank balances”on the accompanying consolidated financial statements.
Short-term InvestmentsThe Company’s short-term investments, which generally havematurities of more than three months and less than one year,consist primarily of investment-grade marketable debt andequity securities as well as bond and equity mutual funds, allof which are classified as trading or available-for-sale.Tradingsecurities are recorded at fair value with unrealized holdinggains and losses included in net earnings. Available-for-salesecurities are recorded at fair value, and unrealized holdinggains and losses are recorded, net of tax, as a separatecomponent of accumulated other comprehensive income.Unrealized losses are charged against net earnings when adecline in fair value is determined to be other than temporary.
Realized gains and losses are accounted for on the specificidentification method. Purchases and sales are recorded on atrade date basis.
Fair Value of Financial InstrumentsThe carrying value of cash and cash equivalents approximatesfair value because of the short-term maturity of thoseinstruments. The fair value of the Company’s investments inmarketable debt and equity securities as well as bond andequity mutual funds is based upon the quoted market price onthe last business day of the fiscal year.
For equity securities of companies that are privately held, orwhere an observable quoted market price does not exist, theCompany estimates fair value using a variety of valuationmethodologies. Such methodologies include comparing thesecurity with securities of publicly traded companies in similarlines of business, applying revenue multiples to estimatedfuture operating results for the private company and estimatingdiscounted cash flows for that company. For furtherinformation on investments, see Notes 4 and 7.The carryingvalue of long-term debt approximates fair value.
Derivative InstrumentsThe Company manages its exposure to foreign currency riskwithin the consolidated financial statements according to ahedging policy. Under the policy, Starbucks may engage intransactions involving various derivative instruments withmaturities generally not longer than five years, to hedge assets,liabilities, revenues and purchases denominated in foreigncurrencies.
The Company follows Statement of Financial AccountingStandards (“SFAS”) No. 133, “Accounting for DerivativeInstruments and Hedging Activities,” as amended andinterpreted, which requires that all derivatives be recorded onthe balance sheet at fair value.The accounting for changes inthe fair value of derivative instruments depends on theintended use and resulting designation. The Companydesignates its derivatives based upon the criteria established bySFAS No.133.For a derivative designated as a fair value hedge,the gain or loss generated from the change in fair value isrecognized in net earnings in the period of change togetherwith the offsetting loss or gain on the hedged item. For aderivative designated as a cash flow hedge, the effective portionof the derivative’s gain or loss is initially reported as acomponent of other comprehensive income (“OCI”) andsubsequently reclassified into net earnings when the hedgedexposure affects net earnings. For a derivative designated as anet investment hedge, the effective portion of the derivative’sgain or loss is reported as a component of the foreign currencytranslation adjustment, a component of OCI. For a derivativenot designated as a hedging instrument, the gain or loss isrecognized in net earnings in the period of change.
Cash flow hedges related to anticipated transactions aredesignated and documented at the inception of each hedge bymatching the terms of the contract to the underlyingtransaction. Once established, cash flow hedges are generallynot removed until maturity.The Company classifies the cashflows from hedging transactions in the same category as thecash flows from the respective hedged items.
Forward contract effectiveness for cash flow hedges iscalculated by comparing the fair value of the contract to thechange in value of the anticipated transaction using forwardrates on a monthly basis. For net investment hedges, the spot-to-spot method is used to calculate effectiveness. Anyineffectiveness is recognized immediately in “Interest andother income, net” on the accompanying consolidatedstatements of earnings.
InventoriesInventories are stated at the lower of cost (primarily movingaverage cost) or market.
Property, Plant and EquipmentProperty, plant and equipment are carried at cost lessaccumulated depreciation. Depreciation of property, plant andequipment,which includes assets under capital leases, is providedon the straight-line method over estimated useful lives, generallyranging from two to seven years for equipment and 30 to 40
28
years for buildings. Leasehold improvements are amortized overthe shorter of their estimated useful lives or the related lease life,generally ten years.The portion of depreciation expense relatedto production and distribution facilities is included in “Cost ofsales and related occupancy costs” on the accompanyingconsolidated statements of earnings. The costs of repairs andmaintenance are expensed when incurred, while expendituresfor refurbishments and improvements that significantly add tothe productive capacity or extend the useful life of an asset arecapitalized. When assets are retired or sold, the asset cost andrelated accumulated depreciation are eliminated with anyremaining gain or loss reflected in net earnings.
Goodwill and Other Intangible AssetsThe Company’s intangible assets mainly consist of goodwill,trademarks, patents and copyrights.These assets are amortized ona straight-line basis over the period of expected benefit, whichranges from ten to twenty years. Starbucks will adopt SFAS No.142, “Goodwill and Other Intangible Assets” in fiscal 2003.Accordingly, goodwill and certain intangibles with indefinitelives will not be amortized but instead will be reviewed forimpairment at least annually. Remaining intangibles with finiteuseful lives will continue to be amortized.As of September 29,2002, Starbucks had goodwill and other intangible assets, net ofaccumulated amortization, of $19.9 million and $9.9 million,respectively, which are subject to the transitional assessmentprovisions of SFAS No. 142.The Company’s management hasdetermined that the adoption of SFAS No. 142 will not have amaterial impact on results of operations or the Company’sconsolidated financial position.
Long-lived AssetsWhen facts and circumstances indicate that the carrying valuesof long-lived assets, including intangibles, may be impaired, anevaluation of recoverability is performed by comparing thecarrying value of the assets to projected future cash flows inaddition to other quantitative and qualitative analyses. Uponindication that the carrying value of such assets may not berecoverable, the Company recognizes an impairment loss by acharge against current operations. Property, plant andequipment assets are grouped at the lowest level for which thereare identifiable cash flows when assessing impairment. Cashflows for retail assets are identified at the individual store level.
Revenue RecognitionIn most instances, retail store revenues are recognized whenpayment is tendered at the point of sale. Revenues from storedvalue cards are recognized upon redemption. Until theredemption of stored value cards,outstanding customer balanceson such cards are included in “Deferred revenue” on theaccompanying consolidated balance sheets. Specialty revenues,consisting mainly of product sales, are generally recognizedupon receipt by customers. Initial non-refundable fees requiredunder licensing agreements are earned upon substantialperformance of services. Royalty revenues based upon apercentage of sales and other continuing fees are recognizedwhen earned.All revenues are recognized net of any discounts.
AdvertisingThe Company expenses costs of advertising the first time theadvertising campaign takes place, except for direct-to-consumer advertising, which is capitalized and amortized overits expected period of future benefit, generally six to twelvemonths. Net capitalized direct-to-consumer advertising costswere $0.8 million and $0.9 million as of September 29, 2002,and September 30, 2001, respectively, and are included in“Prepaid expenses and other current assets” on theaccompanying consolidated balance sheets. Total advertisingexpenses, recorded in “Store operating expenses” and “Otheroperating expenses,” on the accompanying consolidatedstatements of earnings were $25.6 million, $28.8 million and$32.6 million in 2002, 2001 and 2000, respectively.
Store Preopening ExpensesCosts incurred in connection with the start-up and promotionof new store openings are expensed as incurred.
Rent ExpenseCertain of the Company’s lease agreements provide forscheduled rent increases during the lease terms or for rental
payments commencing at a date other than the date of initialoccupancy. Minimum rental expenses are recognized on astraight-line basis over the terms of the leases.
Stock-based CompensationThe Company accounts for stock-based compensation usingthe intrinsic value method prescribed in Accounting PrinciplesBoard Opinion (“APB”) No. 25,“Accounting for Stock Issuedto Employees.” Compensation cost for stock options, if any, ismeasured by the excess of the quoted market price of theCompany’s stock at the date of grant over the amount anemployee must pay to acquire the stock. SFAS No. 123,“Accounting for Stock-Based Compensation,” establishedaccounting and disclosure requirements using a fair-value basedmethod of accounting for stock-based employee compensationplans. The Company follows the disclosure requirements ofSFAS No. 123, see Note 12, and intends to disclose stock-basedcompensation information quarterly in fiscal 2003.
Foreign Currency TranslationThe Company’s international operations use their localcurrency as their functional currency. Assets and liabilities aretranslated at exchange rates in effect at the balance sheet date.Income and expense accounts are translated at the averagemonthly exchange rates during the year. Resulting translationadjustments are recorded as a separate component ofaccumulated other comprehensive income.
Income TaxesThe Company computes income taxes using the asset andliability method, under which deferred income taxes areprovided for the temporary differences between the financialreporting basis and the tax basis of the Company’s assetsand liabilities.
Stock SplitOn April 27, 2001, the Company effected a two-for-one stocksplit of its $0.001 par value common stock for holders ofrecord on March 30, 2001. All applicable share and per-sharedata in these consolidated financial statements have beenrestated to give effect to this stock split.
Earnings Per ShareThe computation of basic earnings per share is based onthe weighted average number of shares and commonstock units outstanding during the period. The computa-tion of diluted earnings per share includes the dilutive effectof common stock equivalents consisting of certain sharessubject to stock options.
Recent Accounting PronouncementsIn August 2001, the Financial Accounting Standards Board(“FASB”) issued SFAS No. 144, “Accounting for theImpairment or Disposal of Long-Lived Assets,” whichsupercedes SFAS No. 121,“Accounting for the Impairment ofLong-Lived Assets and for Long-Lived Assets to Be DisposedOf.” SFAS No.144 retains the fundamental provisions of SFASNo. 121, but sets forth new criteria for asset classification andbroadens the scope of qualifying discontinued operations. TheCompany’s adoption of SFAS No.144 on September 30, 2002,will not have a material impact on the Company’s consolidatedfinancial position and results of operations.
In November 2001, FASB issued Emerging Issues Task Force(“EITF”) No. 01-14, “Income Statement Characterization ofReimbursements Received for ‘Out-of-Pocket’ ExpensesIncurred.” This Issue clarifies the FASB staff ’s position that allreimbursements received for incidental expenses incurred inconjunction with providing services as part of a company’scentral ongoing operations should be characterized as revenue inthe income statement.The Company adopted EITF No. 01-14on December 31, 2001, and it did not have a material impact onthe Company’s consolidated results of operations.
In November 2002, the FASB issued Interpretation No. 45,“Guarantor’s Accounting and Disclosure Requirements forGuarantees, Including Indirect Guarantees of Indebtedness ofOthers,” which elaborates on existing disclosure of mostguarantees, and clarifies when a company must recognize aninitial liability for the fair value of obligations it assumes underguarantee agreements.The initial recognition and measurement

29
provisions apply on a prospective basis to guarantees issued ormodified after December 31,2002.The disclosure requirementsof the Interpretation are effective for the Company’s fiscal year2003. Starbucks does not expect the adoption of thisInterpretation to have a material impact on the Company’sconsolidated financial position or disclosures.
ReclassificationsCertain reclassifications of prior years’ balances have beenmade to conform to the fiscal 2002 presentation.
Note 2: Business CombinationsDuring fiscal 2000, Starbucks acquired the outstanding stockof Tympanum, Inc. (d/b/a “Hear Music”), a music retailer, andCoffee Partners Co. Ltd., the company licensed to operateStarbucks stores in Thailand.The combined purchase price forthese two acquisitions was $14.1 million.The acquisitions were
accounted for under the purchase method of accounting.Results of operations of the acquired companies are includedon the accompanying consolidated financial statements fromthe dates of acquisition.There were no business combinationsduring fiscal 2001 and 2002.
Note 3: Cash and Cash EquivalentsCash and cash equivalents consist of the following (inthousands):
Sept 29, Sept 30,2002 2001
Operating funds and interest-bearing deposits $ 163,592 $ 51,164
Commercial paper - 1,698 Money market funds 10,980 60,375 Total $ 174,572 $ 113,237
Note 4: Short-term InvestmentsThe Company’s short-term investments consist of the following (in thousands):
Gross Gross Unrealized Unrealized
Amortized Holding Holding Fair September 29, 2002: Cost Gains Losses Value
Short-term investments – available-for-sale securities:State and local government obligations $ 155,471 $ 244 $ (16) $ 155,699 U.S. government obligations 2,406 4 - 2,410 Mutual funds 32,000 211 - 32,211 Commercial paper 26,982 - - 26,982
Total $ 216,859 $ 459 $ (16) $ 217,302 Short-term investments – trading securities 13,210 10,360 Total short-term investments $ 230,069 $ 227,662
Gross Gross Unrealized Unrealized
Amortized Holding Holding Fair September 30, 2001: Cost Gains Losses Value
Short-term investments – available-for-sale securities:U.S. government obligations $ 1,999 $ 18 $ - $ 2,017 Commercial paper 98,000 1,332 - 99,332 Marketable equity securities 250 - (200) 50
Total $ 100,249 $ 1,350 $ (200) $ 101,399 Short-term investments – trading securities 7,448 5,913 Total short-term investments $ 107,697 $ 107,312
In fiscal 2002, 2001 and 2000, proceeds from the sale ofinvestment securities were $144.8 million, $46.9 million and$49.2 million, respectively. Gross realized gains from the saleof securities were $1.7 million in 2002.There were no grossrealized losses in 2002, and gross realized gains and losses fromthe sale of securities were not material in 2001 and 2000.
During fiscal 2001 and 2000, the Company recognized lossesof $0.9 million and $6.8 million, respectively, on its investmentin the common stock of Liveworld, Inc. (previously known asTalk City, Inc.), due to impairments that were determined bymanagement to be other than temporary.
The trading securities are comprised mainly of marketableequity mutual funds designated to approximate theCompany’s liability under the Management DeferredCompensation Plan. The corresponding deferredcompensation liability of $10.4 million in fiscal 2002 and $6.0million in fiscal 2001 is included in “Accrued compensationand related costs” on the accompanying consolidated balancesheets. In fiscal 2002 and 2001, the changes in net unrealizedholding losses in the trading portfolio included in earningswere $1.3 million and $1.9 million, respectively.
Note 5: Derivative Financial Instruments
Cash Flow HedgesDuring fiscal 2001 and 2002, the Company entered intoforward foreign exchange contracts that qualify as cash flowhedges under SFAS No. 133 to hedge portions of anticipatedproduct and royalty revenues denominated in Japanese yenand Canadian dollars. These contracts expire within 24months.The Company had accumulated net derivative gainsof $0.8 million, net of taxes, in other comprehensive incomeas of September 29, 2002, related to cash flow hedges. Of thisamount, $0.3 million of net derivative losses will bereclassified into net earnings within 12 months.There was noineffectiveness related to cash flow hedges for the fiscal yearsended September 29, 2002, and September 30, 2001.
Net Investment HedgesDuring fiscal 2001 and 2002, the Company entered intoforward foreign exchange contracts that qualify as hedges of theCompany’s net investment in Starbucks Coffee Japan, Ltd.These contracts expire within 19 months and are intended tominimize foreign currency exposure to fluctuations in theJapanese yen.As a result of using the spot-to-spot method, theCompany recognized net gains of $1.8 million and $1.4 millionduring the fiscal years ended September 29, 2002, andSeptember 30,2001, respectively. In addition, the Company hadaccumulated net derivative losses of $0.5 million, net of taxes,in other comprehensive income as of September 29, 2002.
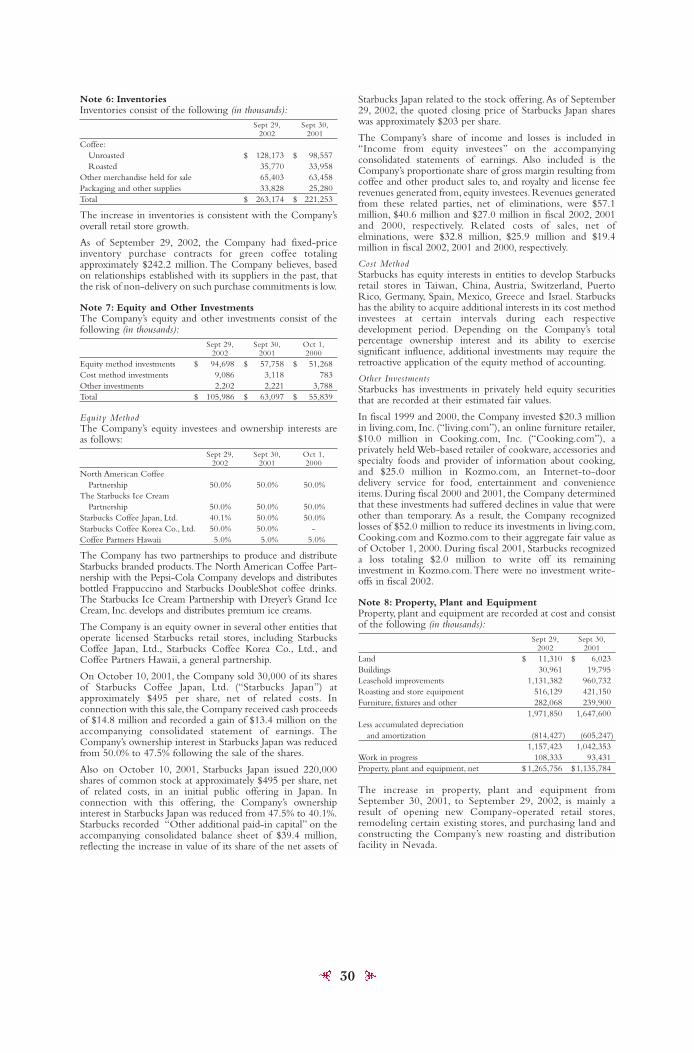
30
Note 6: InventoriesInventories consist of the following (in thousands):
Sept 29, Sept 30,2002 2001
Coffee:Unroasted $ 128,173 $ 98,557 Roasted 35,770 33,958
Other merchandise held for sale 65,403 63,458Packaging and other supplies 33,828 25,280Total $ 263,174 $ 221,253
The increase in inventories is consistent with the Company’soverall retail store growth.
As of September 29, 2002, the Company had fixed-priceinventory purchase contracts for green coffee totalingapproximately $242.2 million. The Company believes, basedon relationships established with its suppliers in the past, thatthe risk of non-delivery on such purchase commitments is low.
Note 7: Equity and Other InvestmentsThe Company’s equity and other investments consist of thefollowing (in thousands):
Sept 29, Sept 30, Oct 1,2002 2001 2000
Equity method investments $ 94,698 $ 57,758 $ 51,268Cost method investments 9,086 3,118 783Other investments 2,202 2,221 3,788Total $ 105,986 $ 63,097 $ 55,839
Equity MethodThe Company’s equity investees and ownership interests areas follows:
Sept 29, Sept 30, Oct 1,2002 2001 2000
North American Coffee Partnership 50.0% 50.0% 50.0%
The Starbucks Ice Cream Partnership 50.0% 50.0% 50.0%
Starbucks Coffee Japan, Ltd. 40.1% 50.0% 50.0% Starbucks Coffee Korea Co., Ltd. 50.0% 50.0% - Coffee Partners Hawaii 5.0% 5.0% 5.0%
The Company has two partnerships to produce and distributeStarbucks branded products.The North American Coffee Part-nership with the Pepsi-Cola Company develops and distributesbottled Frappuccino and Starbucks DoubleShot coffee drinks.The Starbucks Ice Cream Partnership with Dreyer’s Grand IceCream, Inc. develops and distributes premium ice creams.
The Company is an equity owner in several other entities thatoperate licensed Starbucks retail stores, including StarbucksCoffee Japan, Ltd., Starbucks Coffee Korea Co., Ltd., andCoffee Partners Hawaii, a general partnership.
On October 10, 2001, the Company sold 30,000 of its sharesof Starbucks Coffee Japan, Ltd. (“Starbucks Japan”) atapproximately $495 per share, net of related costs. Inconnection with this sale, the Company received cash proceedsof $14.8 million and recorded a gain of $13.4 million on theaccompanying consolidated statement of earnings. TheCompany’s ownership interest in Starbucks Japan was reducedfrom 50.0% to 47.5% following the sale of the shares.
Also on October 10, 2001, Starbucks Japan issued 220,000shares of common stock at approximately $495 per share, netof related costs, in an initial public offering in Japan. Inconnection with this offering, the Company’s ownershipinterest in Starbucks Japan was reduced from 47.5% to 40.1%.Starbucks recorded “Other additional paid-in capital” on theaccompanying consolidated balance sheet of $39.4 million,reflecting the increase in value of its share of the net assets of
Starbucks Japan related to the stock offering.As of September29, 2002, the quoted closing price of Starbucks Japan shareswas approximately $203 per share.
The Company’s share of income and losses is included in“Income from equity investees” on the accompanyingconsolidated statements of earnings. Also included is theCompany’s proportionate share of gross margin resulting fromcoffee and other product sales to, and royalty and license feerevenues generated from, equity investees. Revenues generatedfrom these related parties, net of eliminations, were $57.1million, $40.6 million and $27.0 million in fiscal 2002, 2001and 2000, respectively. Related costs of sales, net ofelminations, were $32.8 million, $25.9 million and $19.4million in fiscal 2002, 2001 and 2000, respectively.
Cost MethodStarbucks has equity interests in entities to develop Starbucksretail stores in Taiwan, China, Austria, Switzerland, PuertoRico, Germany, Spain, Mexico, Greece and Israel. Starbuckshas the ability to acquire additional interests in its cost methodinvestees at certain intervals during each respectivedevelopment period. Depending on the Company’s totalpercentage ownership interest and its ability to exercisesignificant influence, additional investments may require theretroactive application of the equity method of accounting.
Other InvestmentsStarbucks has investments in privately held equity securitiesthat are recorded at their estimated fair values.
In fiscal 1999 and 2000, the Company invested $20.3 millionin living.com, Inc. (“living.com”), an online furniture retailer,$10.0 million in Cooking.com, Inc. (“Cooking.com”), aprivately held Web-based retailer of cookware, accessories andspecialty foods and provider of information about cooking,and $25.0 million in Kozmo.com, an Internet-to-doordelivery service for food, entertainment and convenienceitems. During fiscal 2000 and 2001, the Company determinedthat these investments had suffered declines in value that wereother than temporary. As a result, the Company recognizedlosses of $52.0 million to reduce its investments in living.com,Cooking.com and Kozmo.com to their aggregate fair value asof October 1, 2000. During fiscal 2001, Starbucks recognizeda loss totaling $2.0 million to write off its remaininginvestment in Kozmo.com.There were no investment write-offs in fiscal 2002.
Note 8: Property, Plant and EquipmentProperty, plant and equipment are recorded at cost and consistof the following (in thousands):
Sept 29, Sept 30,2002 2001
Land $ 11,310 $ 6,023 Buildings 30,961 19,795 Leasehold improvements 1,131,382 960,732 Roasting and store equipment 516,129 421,150Furniture, fixtures and other 282,068 239,900
1,971,850 1,647,600 Less accumulated depreciation
and amortization (814,427) (605,247)1,157,423 1,042,353
Work in progress 108,333 93,431 Property, plant and equipment, net $ 1,265,756 $1,135,784
The increase in property, plant and equipment fromSeptember 30, 2001, to September 29, 2002, is mainly aresult of opening new Company-operated retail stores,remodeling certain existing stores, and purchasing land andconstructing the Company’s new roasting and distributionfacility in Nevada.

31
Note 9: Long-term DebtIn September 1999, the Company purchased the land andbuilding comprising its York County, Pennsylvania, roastingplant and distribution facility. The total purchase price was$12.9 million. In connection with this purchase, the Companyassumed loans totaling $7.7 million from the York CountyIndustrial Development Corporation. The remainingmaturities of these loans range from 7 to 8 years, with interestrates from 0.0% to 2.0%.
Scheduled principal payments on long-term debt are asfollows (in thousands):Fiscal year ending2003 $ 710 2004 722 2005 735 2006 748 2007 762 Thereafter 2,109Total principal payments $ 5,786
Note 10: LeasesThe Company leases retail stores, roasting and distributionfacilities and office space under operating leases expiringthrough 2025. Most lease agreements contain renewal optionsand rent escalation clauses. Certain leases provide forcontingent rentals based upon gross sales.
Rental expense under these lease agreements was as follows(in thousands):Fiscal year ended Sept 29, Sept 30, Oct 1,
2002 2001 2000 Minimum rentals – Retail $ 200,827 $ 150,510 $ 114,239Minimum rentals – Other 19,143 16,033 12,910Contingent rentals 5,415 4,018 3,743Total $ 225,385 $ 170,561 $ 130,892
Minimum future rental payments under non-cancelable leaseobligations as of September 29, 2002, are as follows(in thousands):Fiscal year ending2003 $ 248,0162004 243,5192005 232,6412006 219,3842007 203,395Thereafter 863,874Total minimum lease payments $2,010,829
Note 11: Shareholders’ EquityDuring fiscal 2001, the Company amended and restated itsArticles of Incorporation to, among other things, change thepar value of the Company’s common stock and preferred stockfrom no par value per share to $0.001 par value per share.
In addition to 600.0 million shares of authorized common stock,the Company has authorized 7.5 million shares of preferredstock, none of which was outstanding at September 29, 2002.
In September 2001, the Company’s Board of Directorsapproved a plan to repurchase up to $60.0 million of itscommon stock in the open market.This plan was completedthrough the acquisition of 515,000 shares and 3.4 millionshares during fiscal years 2002 and 2001, respectively.
In June 2002, the Board of Directors authorized the repurchaseof up to an additional 10.0 million shares of common stock.During fiscal year 2002, the Company acquired 2.1 millionshares at a cost of $42.0 million, leaving 7.9 million additionalshares authorized for repurchase under this plan as ofSeptember 29, 2002.
Comprehensive IncomeComprehensive income includes all changes in equity duringthe period, except those resulting from transactions withshareholders and subsidiaries of the Company. It has twocomponents: net earnings and other comprehensive income.Accumulated other comprehensive loss reported on theCompany’s consolidated balance sheets consists of foreigncurrency translation adjustments and the unrealized gains andlosses, net of applicable taxes, on available-for-sale securitiesand on derivative instruments designated and qualifying ascash flow and net investment hedges.
Comprehensive income, net of related tax effects, is as follows (in thousands):Fiscal year ended Sept 29, 2002 Sept 30, 2001 Oct 1, 2000 Net earnings $ 215,073 $ 181,210 $ 94,564
Unrealized holding gains/(losses) on available-for-sale securities,net of tax benefit/(provision) of ($231), ($434) and $52 in 2002, 2001 and 2000, respectively 394 738 (85)
Unrealized holding gains on cash flow hedges, net of tax provisionof $1,066, $683 and $0 in 2002, 2001 and 2000, respectively 1,815 1,163 -
Unrealized holding gains/(losses) on net investment hedges, net of tax benefit/(provision) of $415, ($109) and $0 in 2002, 2001 and 2000, respectively (706) 186 -
Reclassification adjustment for gains realized in net income, net of tax provision of $1,769, $0 and $48 in 2002, 2001 and 2000, respectively (3,012) - (78)
Net unrealized gain/(loss) (1,509) 2,087 (163) Translation adjustment (1,664) 3,481 (6,867) Total comprehensive income $ 211,900 $ 186,778 $ 87,534
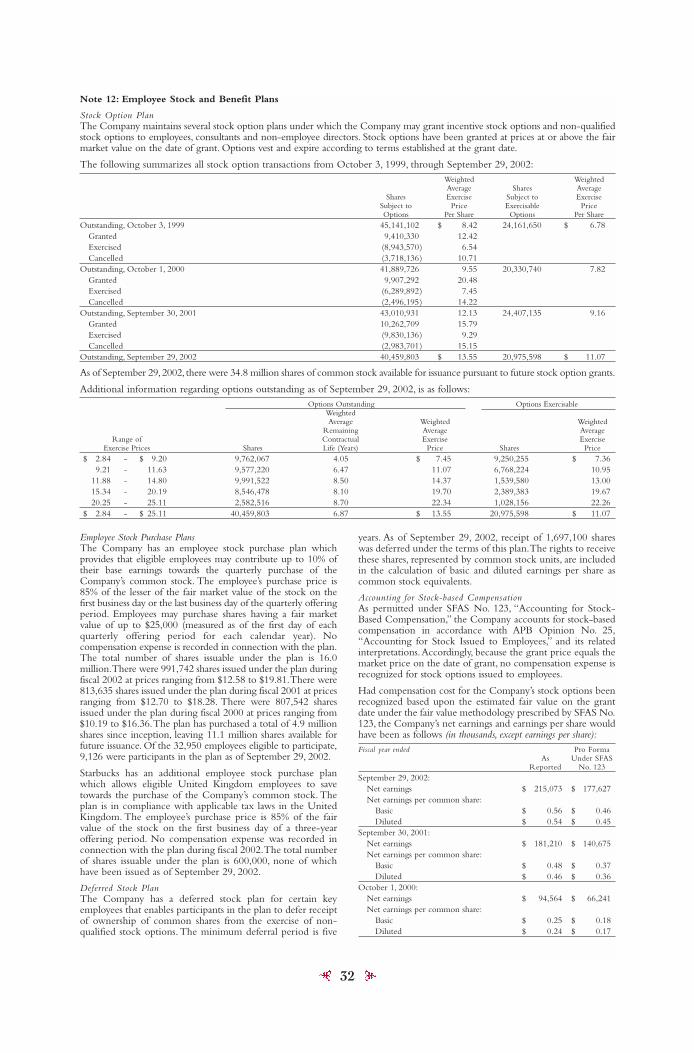
32
Note 12: Employee Stock and Benefit Plans
Stock Option PlanThe Company maintains several stock option plans under which the Company may grant incentive stock options and non-qualifiedstock options to employees, consultants and non-employee directors. Stock options have been granted at prices at or above the fairmarket value on the date of grant. Options vest and expire according to terms established at the grant date.
The following summarizes all stock option transactions from October 3, 1999, through September 29, 2002:Weighted Weighted Average Shares Average
Shares Exercise Subject to Exercise Subject to Price Exercisable Price Options Per Share Options Per Share
Outstanding, October 3, 1999 45,141,102 $ 8.42 24,161,650 $ 6.78Granted 9,410,330 12.42Exercised (8,943,570) 6.54Cancelled (3,718,136) 10.71
Outstanding, October 1, 2000 41,889,726 9.55 20,330,740 7.82 Granted 9,907,292 20.48 Exercised (6,289,892) 7.45Cancelled (2,496,195) 14.22
Outstanding, September 30, 2001 43,010,931 12.13 24,407,135 9.16 Granted 10,262,709 15.79 Exercised (9,830,136) 9.29 Cancelled (2,983,701) 15.15
Outstanding, September 29, 2002 40,459,803 $ 13.55 20,975,598 $ 11.07
As of September 29,2002, there were 34.8 million shares of common stock available for issuance pursuant to future stock option grants.
Additional information regarding options outstanding as of September 29, 2002, is as follows:Options Outstanding Options Exercisable
WeightedAverage Weighted Weighted
Remaining Average Average Range of Contractual Exercise Exercise
Exercise Prices Shares Life (Years) Price Shares Price $ 2.84 - $ 9.20 9,762,067 4.05 $ 7.45 9,250,255 $ 7.36
9.21 - 11.63 9,577,220 6.47 11.07 6,768,224 10.95 11.88 - 14.80 9,991,522 8.50 14.37 1,539,580 13.00 15.34 - 20.19 8,546,478 8.10 19.70 2,389,383 19.67 20.25 - 25.11 2,582,516 8.70 22.34 1,028,156 22.26
$ 2.84 - $ 25.11 40,459,803 6.87 $ 13.55 20,975,598 $ 11.07
Employee Stock Purchase PlansThe Company has an employee stock purchase plan whichprovides that eligible employees may contribute up to 10% oftheir base earnings towards the quarterly purchase of theCompany’s common stock. The employee’s purchase price is85% of the lesser of the fair market value of the stock on thefirst business day or the last business day of the quarterly offeringperiod. Employees may purchase shares having a fair marketvalue of up to $25,000 (measured as of the first day of eachquarterly offering period for each calendar year). Nocompensation expense is recorded in connection with the plan.The total number of shares issuable under the plan is 16.0million.There were 991,742 shares issued under the plan duringfiscal 2002 at prices ranging from $12.58 to $19.81.There were813,635 shares issued under the plan during fiscal 2001 at pricesranging from $12.70 to $18.28. There were 807,542 sharesissued under the plan during fiscal 2000 at prices ranging from$10.19 to $16.36.The plan has purchased a total of 4.9 millionshares since inception, leaving 11.1 million shares available forfuture issuance. Of the 32,950 employees eligible to participate,9,126 were participants in the plan as of September 29, 2002.
Starbucks has an additional employee stock purchase planwhich allows eligible United Kingdom employees to savetowards the purchase of the Company’s common stock. Theplan is in compliance with applicable tax laws in the UnitedKingdom. The employee’s purchase price is 85% of the fairvalue of the stock on the first business day of a three-yearoffering period. No compensation expense was recorded inconnection with the plan during fiscal 2002.The total numberof shares issuable under the plan is 600,000, none of whichhave been issued as of September 29, 2002.
Deferred Stock PlanThe Company has a deferred stock plan for certain keyemployees that enables participants in the plan to defer receiptof ownership of common shares from the exercise of non-qualified stock options. The minimum deferral period is five
years. As of September 29, 2002, receipt of 1,697,100 shareswas deferred under the terms of this plan.The rights to receivethese shares, represented by common stock units, are includedin the calculation of basic and diluted earnings per share ascommon stock equivalents.
Accounting for Stock-based CompensationAs permitted under SFAS No. 123, “Accounting for Stock-Based Compensation,” the Company accounts for stock-basedcompensation in accordance with APB Opinion No. 25,“Accounting for Stock Issued to Employees,” and its relatedinterpretations.Accordingly, because the grant price equals themarket price on the date of grant, no compensation expense isrecognized for stock options issued to employees.
Had compensation cost for the Company’s stock options beenrecognized based upon the estimated fair value on the grantdate under the fair value methodology prescribed by SFAS No.123, the Company’s net earnings and earnings per share wouldhave been as follows (in thousands, except earnings per share):Fiscal year ended Pro Forma
As Under SFAS Reported No. 123
September 29, 2002:Net earnings $ 215,073 $ 177,627Net earnings per common share:
Basic $ 0.56 $ 0.46Diluted $ 0.54 $ 0.45
September 30, 2001:Net earnings $ 181,210 $ 140,675Net earnings per common share:
Basic $ 0.48 $ 0.37Diluted $ 0.46 $ 0.36
October 1, 2000:Net earnings $ 94,564 $ 66,241Net earnings per common share:
Basic $ 0.25 $ 0.18Diluted $ 0.24 $ 0.17

33
The Company’s valuations are based upon a multiple optionvaluation approach, and forfeitures are recognized as theyoccur. The Black-Scholes option valuation model wasdeveloped for use in estimating the fair value of traded options,which have no vesting restrictions and are fully transferable. Inaddition, option valuation models require the input of highlysubjective assumptions, including the expected stock-pricevolatility. The Company’s employee stock options havecharacteristics significantly different from those of tradedoptions, and changes in the subjective input assumptions canmaterially affect the fair value estimate. Because Companystock options do not trade on a secondary exchange,employees can receive no value nor derive any benefit fromholding stock options under these plans without an increase,above the grant price, in the market price of the Company’sstock. Such an increase in stock price would benefit allstockholders commensurately.
As required by SFAS No. 123, the Company has determinedthat the weighted average estimated fair values of optionsgranted during fiscal 2002, 2001 and 2000 were $6.48, $8.98and $5.37 per share, respectively.
In applying SFAS No. 123, the impact of outstanding stockoptions granted prior to 1996 has been excluded from the proforma calculations; accordingly, the 2002 pro formaadjustments are not necessarily indicative of future period proforma adjustments.
Defined Contribution PlanStarbucks maintains voluntary defined contribution planscovering eligible employees as defined in the plan documents.Participating employees may elect to defer and contribute aportion of their compensation to the plan up to plan limits ofapproximately 19%, not to exceed the dollar amounts set byapplicable laws. Effective January 1, 2003, participatingemployees may elect to defer and contribute up to 50% of theircompensation. For certain plans, the Company matched 25%of each employee’s eligible contribution up to a maximum ofthe first 4% of each employee’s compensation. BeginningApril 1, 2002, the Company’s matching contributions for themajority of its plans were increased to a maximum of 150%,depending on participants’ years of service.
The Company’s matching contributions to all plans wereapproximately $3.1 million, $1.6 million and $1.1 million infiscal 2002, 2001 and 2000, respectively.
Note 13: Income TaxesA reconciliation of the statutory federal income tax rate withthe Company’s effective income tax rate is as follows:Fiscal year ended Sept 29, Sept 30, Oct 1,
2002 2001 2000Statutory rate 35.0% 35.0% 35.0% State income taxes, net of federal
income tax benefit 3.4 3.8 3.7Valuation allowance change
from prior year (0.9) 0.9 3.5Other, net (0.5) (2.4) (1.1) Effective tax rate 37.0% 37.3% 41.1 %
The provision for income taxes consists of the following(in thousands):Fiscal year ended Sept 29, Sept 30, Oct 1,
2002 2001 2000Currently payable:
Federal $ 109,154 $ 91,750 $ 70,157State 16,820 17,656 12,500 Foreign 5,807 3,198 1,601
Deferred tax asset, net (5,468) (4,892) (18,252) Total $ 126,313 $ 107,712 $ 66,006
Deferred income taxes or tax benefits reflect the tax effect oftemporary differences between the amounts of assets andliabilities for financial reporting purposes and amounts asmeasured for tax purposes. The Company will establish avaluation allowance if it is more likely than not these items willeither expire before the Company is able to realize theirbenefits, or that future deductibility is uncertain. Periodically,the valuation allowance is reviewed and adjusted based onmanagement’s assessments of realizable deferred tax assets.Thevaluation allowance as of September 29, 2002, was related tolosses from investments in majority-owned foreignsubsidiaries; the valuation allowance as of September 30, 2001,was related to losses from investments in majority-ownedforeign subsidiaries and from Internet-related companies.Thetax effect of temporary differences and carryforwards thatcause significant portions of deferred tax assets and liabilities isas follows (in thousands):
Sept 29, Sept 30,2002 2001
Deferred tax assets:Equity and other investments $ 14,026 $ 3,784Capital loss carryforwards 6,077 17,448Accrued occupancy costs 14,597 12,317Accrued compensation and related costs 12,726 9,898Other accrued expenses 16,608 7,245Foreign tax credits 10,199 5,199Other 6,971 164
Total 81,204 56,055 Valuation allowance (5,476) (8,704)Total deferred tax asset, net
of valuation allowance 75,728 47,351Deferred tax liabilities:
Property, plant and equipment (50,819) (34,260)Other (5,199) (355)
Total (56,018) (34,615) Net deferred tax asset $ 19,710 $ 12,736
As of September 29, 2002, the Company had foreign tax creditcarryforwards of $10.2 million with expiration dates betweenfiscal years 2004 and 2008.The Company also had capital losscarryforwards of $15.8 million expiring in 2006.
Taxes currently payable of $32.8 million and $50.3 million areincluded in “Accrued taxes” on the accompanyingconsolidated balance sheets as of September 29, 2002, andSeptember 30, 2001, respectively.
The fair value of stock-based awards to employees is estimated on the date of grant using the Black-Scholes option-pricing modelwith the following weighted average assumptions:
Employee Stock Options Employee Stock Purchase Plan 2002 2001 2000 2002 2001 2000
Expected life (years) 2 – 5 2 – 5 2 – 6 0.25 0.25 0.25Expected volatility 43% – 54% 57% 55% 33% – 51% 41% – 49% 42% – 82%Risk-free interest rate 1.63% – 4.96% 2.37% – 5.90% 5.65% – 6.87% 1.93% – 2.73% 2.35% – 4.68% 5.97% – 6.40%Expected dividend yield 0.00% 0.00% 0.00% 0.00% 0.00% 0.00%

34
Note 14: Earnings Per ShareThe following table represents the calculation of net earnings per common share – basic (in thousands, except earnings per share):Fiscal year ended Sept 29, 2002 Sept 30, 2001 Oct 1, 2000 Net earnings $ 215,073 $ 181,210 $ 94,564
Weighted average common shares and common stock units outstanding 385,575 380,566 371,191 Net earnings per common share – basic $ 0.56 $ 0.48 $ 0.25
The following table represents the calculation of net earnings per common and common equivalent share – diluted (in thousands,except earnings per share):Fiscal year ended Sept 29, 2002 Sept 30, 2001 Oct 1, 2000 Net earnings $ 215,073 $ 181,210 $ 94,564
Weighted average common shares and common stock units outstanding 385,575 380,566 371,191 Dilutive effect of outstanding common stock options 11,951 13,783 14,808Weighted average common and common equivalent shares outstanding 397,526 394,349 385,999
Net earnings per common and common equivalent share – diluted $ 0.54 $ 0.46 $ 0.24
Options with exercise prices greater than the average market price were not included in the computation of diluted earnings pershare.These options totaled 1.8 million, 0.9 million and 0.3 million in fiscal 2002, 2001 and 2000, respectively.
Note 15: Commitments and ContingenciesIn connection with various yen denominated bank loansentered into by Starbucks Coffee Japan, Ltd., the Companyguaranteed approximately $11.8 million of the outstandingdebt in the event of default by Starbucks Coffee Japan, Ltd.
On June 20, 2001, and July 2, 2001, two purported class actionlawsuits against the Company, entitled James Carr, et al. v.Starbucks Corporation and Olivia Shields, et al. v. StarbucksCorporation, were filed in the Superior Courts of California,Alameda and Los Angeles Counties, respectively. On April 19,2002, Starbucks announced that it had reached an agreementto settle both lawsuits and fully resolve all claims brought bythe plaintiffs without engaging in protracted litigation.Accordingly, Starbucks recorded an $18.0 million charge,which is included in “General and administrative expenses” onthe accompanying consolidated financial statement ofearnings, for the estimated claims to eligible class members,attorneys’ fees and costs, and costs to a third-party claimsadministrator, as well as applicable employer payroll taxes. OnDecember 17, 2002, the settlement was approved. Claimsunder the settlement agreement will be paid on a “claimsmade” basis.The Company expects most claims will be paid inthe second quarter of fiscal 2003.
In addition to the California lawsuits described above, theCompany is party to various legal proceedings arising in theordinary course of its business, but it is not currently a partyto any legal proceeding that management believes would havea material adverse effect on the consolidated financial positionor results of operations of the Company.
Note 16: Segment ReportingThe Company is organized into a number of business units,which correspond to the Company’s operating segments.
North American RetailNorth American Retail, which represents 92.5% of total retailrevenues and 78.6% of total net revenues, sells coffee and otherbeverages, whole bean coffees, complementary food, coffeebrewing equipment and merchandise through Company-operated retail stores in the United States and Canada.
Business AlliancesAt the beginning of fiscal 2001, the Company’s NorthAmerican foodservice and retail store licensing operationswere combined into a single business unit due to theircommon customer universe and the determination thatseparate segment reporting of Business Alliances wasappropriate under SFAS No. 131,“Disclosures about Segmentsof an Enterprise and Related Information.”
Business Alliances, which represents 44.8% of total specialtyrevenues and 6.8% of total net revenues, sells whole bean andground coffees through foodservice accounts. In addition,Business Alliances sells coffee and related products for resalethrough North American retail store licensing agreements, andreceives license fees and royalties.
All Other Business UnitsThe remainder of the Company’s business units individuallyrepresent less than 10% of total net revenues. These includeInternational Retail (comprised of international Company-operated retail stores), international retail store licensing,grocerychannel licensing, warehouse club accounts, interactiveoperations, equity investees and other initiatives related to theCompany’s core businesses. These business units are managedand evaluated independently and do not meet the quantitativethresholds of a reportable segment under SFAS No. 131.
Revenues from these segments include both sales tounaffiliated customers and sales between segments, which areaccounted for on a basis consistent with sales to unaffiliatedcustomers. Segment information has been prepared usinga management approach that is consistent with the basisand manner in which the Company’s managementinternally reviews financial information for operationaldecision making purposes. However, intersegment revenues,consisting primarily of product sales to and from subsidiariesand equity method investees, and other intersegmenttransactions, which are included in the information presentedbelow, have been eliminated on the accompanyingconsolidated financial statements.
The accounting policies of the operating segments are thesame as those described in the summary of significantaccounting policies in Note 1. Operating income representsearnings before “Interest and other income, net,” “Internet-related investment losses,” “Gain on sale of investment” and“Income taxes.”No allocations of overhead, interest or incometaxes are made to the segments. Identifiable assets by segmentare those assets used in the Company’s operations in eachsegment. General corporate assets include cash andinvestments, unallocated assets of the corporate headquartersand roasting facilities, deferred taxes and certain intangibles.Management evaluates performance of the segments based ondirect product sales and operating costs.

35
The table below presents information by operating segment (in thousands):Intersegment
North All other eliminations/American Business business Unallocated
Fiscal year ended Retail Alliances units corporate Total
Fiscal 2002:Total net revenues $ 2,583,756 $ 222,410 $ 553,573 $ (70,831) $ 3,288,908 Earnings before income taxes (1) (2) 432,513 56,605 63,021 (210,753) 341,386 Depreciation and amortization expenses 143,337 6,153 27,331 28,736 205,557 Income from equity investees - - 22,014 13,818 35,832 Identifiable assets 897,651 51,662 357,997 985,426 2,292,736 Fiscal 2001:Total net revenues $ 2,086,354 $ 193,574 $ 419,843 $ (50,791) $ 2,648,980 Earnings before income taxes (1) (2) 336,434 50,165 70,116 (167,793) 288,922 Depreciation and amortization expenses 115,061 5,278 17,768 25,394 163,501 Income from equity investees - - 17,556 11,059 28,615 Identifiable assets 873,306 57,578 217,027 698,608 1,846,519 Fiscal 2000:Total net revenues $ 1,734,929 $ 160,812 $ 305,080 $ (23,207) $ 2,177,614 Earnings before income taxes (1) (2) 249,924 43,777 53,323 (186,454) 160,570 Depreciation and amortization expenses 94,312 3,547 10,117 22,256 130,232 Income from equity investees - - 15,139 5,161 20,300 Identifiable assets 664,773 52,596 111,521 659,434 1,488,324 (1) North American Retail and International Retail regularly monitor the financial results of their Company-operated retail stores and accumulate
historical operating measures to identify performance trends in various markets. Provisions for long-lived asset impairment are recorded when, amongother things, retail stores are unable to generate current and future estimated undiscounted cash flows in excess of asset carrying values, consistingprimarily of leasehold improvements. Gains and losses on disposals are generated primarily through renovation activities.As a result of these activities,Starbucks recorded provisions and net losses of $26.0 million, $7.3 million and $4.4 million in fiscal 2002, 2001 and 2000, respectively.
(2) Unallocated corporate includes general and administrative expenses, certain depreciation expenses on general and administrative related assets, as wellas amounts included in “Interest and other income, net,”“Internet-related investment losses,” and “Gain on sale of investment” on the accompanyingconsolidated statements of earnings.
The tables below represent information by geographic area (in thousands):Fiscal year ended Sept 29, 2002 Sept 30, 2001 Oct 1, 2000 Net revenues from external customers:United States $ 2,830,650 $ 2,301,013 $ 1,910,092 Foreign countries 458,258 347,967 267,522Total $ 3,288,908 $ 2,648,980 $ 2,177,614
Revenues from foreign countries are based on the location of the customers and consist primarily of retail revenues from Canadaand the United Kingdom as well as specialty revenues generated from product sales to international licensees. No customeraccounts for 10% or more of the Company’s revenues.
Fiscal year ended Sept 29, 2002 Sept 30, 2001 Oct 1, 2000 Long-lived assets:United States $ 1,206,101 $ 1,065,448 $ 915,762Foreign countries 239,097 187,146 114,328Total $ 1,445,198 $ 1,252,594 $ 1,030,090
Assets attributed to foreign countries are based on the country in which those assets are located.
Note 17: Quarterly Financial Information (Unaudited)Summarized quarterly financial information in fiscal years 2002 and 2001 is as follows (in thousands, except earnings per share):
First Second Third Fourth2002 quarter:
Net revenues $ 805,335 $ 783,217 $ 835,158 $ 865,198Operating income 92,646 48,780 87,709 89,590 Net earnings 68,355 32,077 56,174 58,467Net earnings per common share – diluted $ 0.17 $ 0.08 $ 0.14 $ 0.15
2001 quarter:Net revenues $ 667,387 $ 629,288 $ 662,769 $ 689,536Operating income 76,057 50,854 71,307 82,876 Net earnings 48,995 32,210 46,757 53,248Net earnings per common share – diluted $ 0.12 $ 0.08 $ 0.12 $ 0.14

36
MANAGEMENT’S RESPONSIBILITY FOR FINANCIAL REPORTING
The management of Starbucks Corporation is responsible for the preparation and integrity of the financial statements includedin this Annual Report to Shareholders. The financial statements have been prepared in conformity with accounting principlesgenerally accepted in the United States of America and include amounts based on management’s best estimates and judgmentswhere necessary. Financial information included elsewhere in this Annual Report is consistent with these financial statements.
Management maintains a system of internal controls and procedures designed to provide reasonable assurance that transactions areexecuted in accordance with proper authorization, transactions are properly recorded in the Company’s records, assets aresafeguarded and accountability for assets is maintained. The concept of reasonable assurance is based on the recognition thatthe cost of maintaining our system of internal accounting controls should not exceed benefits expected to be derived fromthe system. Internal controls and procedures are periodically reviewed and revised, when appropriate, due to changingcircumstances and requirements. In addition, the Company’s internal audit department assesses the effectiveness and adequacyof internal controls on a regular basis and recommends improvements when appropriate. Management considers the internalauditors’ and independent auditors’ recommendations concerning the Company’s internal controls, and takes steps to implementthose that are believed to be appropriate in the circumstances.
Independent auditors are appointed by the Company’s Board of Directors and ratified by the Company’s shareholders to audit thefinancial statements in accordance with auditing standards generally accepted in the United States of America and to independentlyassess the fair presentation of the Company’s financial position, results of operations and cash flows.Their report appears in thisAnnual Report.
The Audit Committee, all of whose members are outside directors, is responsible for monitoring the Company’s accounting andreporting practices. The Audit Committee meets periodically with management, the independent auditors and the internalauditors, jointly and separately, to review financial reporting matters as well as to ensure that each is properly discharging itsresponsibilities. The independent auditors and the internal auditors have full and free access to the Committee without thepresence of management to discuss the results of their audits, the adequacy of internal accounting controls and the qualityof financial reporting.
Orin C. Smith Michael Caseypresident and executive vice president,chief executive officer chief financial officer and
chief administrative officer
INDEPENDENT AUDITORS’ REPORT
To the Board of Directors and Shareholders of Starbucks CorporationSeattle,Washington
We have audited the accompanying consolidated balance sheets of Starbucks Corporation and subsidiaries (the Company) as ofSeptember 29, 2002, and September 30, 2001, and the related consolidated statements of earnings, shareholders’ equity and cashflows for the years ended September 29, 2002, September 30, 2001, and October 1, 2000. These financial statements are theresponsibility of the Company’s management. Our responsibility is to express an opinion on these financial statements based onour audits.
We conducted our audits in accordance with auditing standards generally accepted in the United States of America. Thosestandards require that we plan and perform the audit to obtain reasonable assurance about whether the financial statementsare free of material misstatement.An audit includes examining, on a test basis, evidence supporting the amounts and disclosuresin the financial statements. An audit also includes assessing the accounting principles used and significant estimates made bymanagement, as well as evaluating the overall financial statement presentation.We believe that our audits provide a reasonablebasis for our opinion.
In our opinion, such consolidated financial statements present fairly, in all material respects, the financial position of theCompany as of September 29, 2002, and September 30, 2001, and the results of its operations and its cash flows for the yearsended September 29, 2002, September 30, 2001, and October 1, 2000, in conformity with accounting principles generallyaccepted in the United States of America.
Deloitte & Touche LLPSeattle,WashingtonDecember 4, 2002
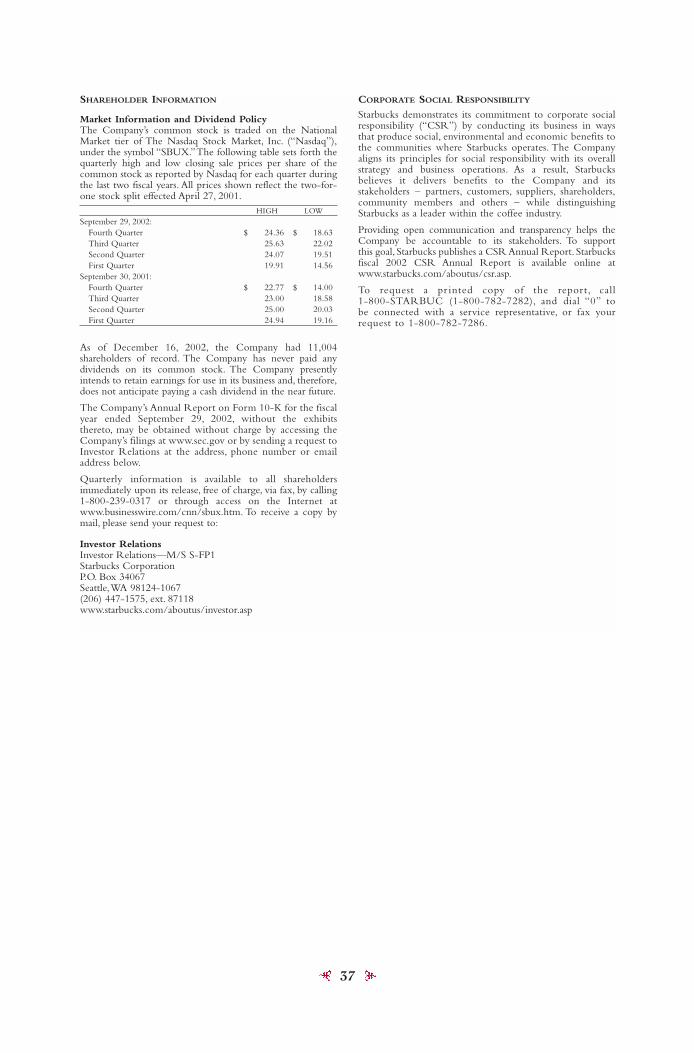
37
SHAREHOLDER INFORMATION
Market Information and Dividend PolicyThe Company’s common stock is traded on the NationalMarket tier of The Nasdaq Stock Market, Inc. (“Nasdaq”),under the symbol “SBUX.”The following table sets forth thequarterly high and low closing sale prices per share of thecommon stock as reported by Nasdaq for each quarter duringthe last two fiscal years. All prices shown reflect the two-for-one stock split effected April 27, 2001.
HIGH LOWSeptember 29, 2002:
Fourth Quarter $ 24.36 $ 18.63Third Quarter 25.63 22.02Second Quarter 24.07 19.51First Quarter 19.91 14.56
September 30, 2001:Fourth Quarter $ 22.77 $ 14.00Third Quarter 23.00 18.58Second Quarter 25.00 20.03First Quarter 24.94 19.16
As of December 16, 2002, the Company had 11,004shareholders of record. The Company has never paid anydividends on its common stock. The Company presentlyintends to retain earnings for use in its business and, therefore,does not anticipate paying a cash dividend in the near future.
The Company’s Annual Report on Form 10-K for the fiscalyear ended September 29, 2002, without the exhibitsthereto, may be obtained without charge by accessing theCompany’s filings at www.sec.gov or by sending a request toInvestor Relations at the address, phone number or emailaddress below.
Quarterly information is available to all shareholdersimmediately upon its release, free of charge, via fax, by calling1-800-239-0317 or through access on the Internet atwww.businesswire.com/cnn/sbux.htm. To receive a copy bymail, please send your request to:
Investor RelationsInvestor Relations—M/S S-FP1Starbucks CorporationP.O. Box 34067Seattle,WA 98124-1067(206) 447-1575, ext. 87118www.starbucks.com/aboutus/investor.asp
CORPORATE SOCIAL RESPONSIBILITY
Starbucks demonstrates its commitment to corporate socialresponsibility (“CSR”) by conducting its business in waysthat produce social, environmental and economic benefits tothe communities where Starbucks operates. The Companyaligns its principles for social responsibility with its overallstrategy and business operations. As a result, Starbucksbelieves it delivers benefits to the Company and itsstakeholders – partners, customers, suppliers, shareholders,community members and others – while distinguishingStarbucks as a leader within the coffee industry.
Providing open communication and transparency helps theCompany be accountable to its stakeholders. To supportthis goal, Starbucks publishes a CSR Annual Report. Starbucksfiscal 2002 CSR Annual Report is available online atwww.starbucks.com/aboutus/csr.asp.
To request a pr inted copy of the report, call 1-800-STARBUC (1-800-782-7282), and dial “0” tobe connected with a service representative, or fax your request to 1-800-782-7286.

38
Board of Directors and Senior Officers
Board of Directors
Howard SchultzStarbucks Corporationchairman of the board and chief global strategist
Orin C. SmithStarbucks Corporationpresident and chief executive officer
Howard BeharStarbucks Corporationpresident, North America
Barbara BassGerson Bakar Foundationpresident
Craig J. FoleyWickham Capital Corp.president
Gregory B. Maffei360networks inc.chairman and chief executive officer
Arlen I. PrenticeKibble & Prenticechairman and chief executive officer
James G. Shennan, Jr.Trinity Venturesgeneral partner
Craig E.WeatherupThe Pepsi Bottling Group, Inc.director
Senior Officers
James Donald president, North America
Peter Maslenpresident,Starbucks Coffee International, Inc.
Paula E. Boggsexecutive vice president,general counsel and secretary
Michael Caseyexecutive vice president, chief financial officer and chief administrative officer
Eduardo R. (Ted) Garciaexecutive vice president,Supply Chain & Coffee Operations
David A. Paceexecutive vice president,Partner Resources
Deidra Wagerexecutive vice president; chief retail officer,Starbucks Coffee Japan, Ltd.
James Allingsenior vice president, U.S. Retail
Troy Alsteadsenior vice president,Finance and Business Development,International
Martin J.Annesesenior vice president – Northeast,U.S. Retail
David N. Chichestersenior vice president, Finance
Brian Crynessenior vice president,chief information officer
Christine Daysenior vice president,North America Administration
Julio Gutiérrezsenior vice president; president,Latin America
Willard (Dub) Haysenior vice president, Coffee
Wanda Herndonsenior vice president,Worldwide Public Affairs
Darren Hustonsenior vice president,Starbucks Branded Products,North America
Gregg S. Johnsonsenior vice president, Licensed Stores,North America
David Landausenior vice president and deputy general counsel,Law & Corporate Affairs
Katharine Lindemannsenior vice president,Operations & Asset Development, International
Mark Lindstromsenior vice president – Southwest,U.S. Retail
Pedro Y.K. Mansenior vice president;president,Asia Pacific
Mark McKeonsenior vice president;president, Europe, Middle East and Africa
Kenneth F. Meyerssenior vice president,Human Resources, International
Colin Mooresenior vice president; president, Canada
Dave Olsensenior vice president,Culture and Immersion
Launi Skinnersenior vice president – Northwest,U.S. Retail
Henry J. Suerthsenior vice president, Business Alliances,North America
Mark Wesleysenior vice president,Store Development and Asset Management,North America
Mary Williamssenior vice president, Coffee
Howard Wollnersenior vice president,Store Concepts
Thomas Yangsenior vice president,Marketing, International

39
© 2002 Starbucks Coffee Company. All rights reserved. Printed in the USA.
This annual report is printed on recycled paper containing 100% post-consumer waste.

Please visit us at Starbucks.com.