Stanford Law ReviewStanford Law Review ARTICLE Does Peer Review Work? An Experiment of...
119
1 Volume 69 January 2017 Stanford Law Review ARTICLE Does Peer Review Work? An Experiment of Experimentalism Daniel E. Ho* Abstract. Ensuring the accuracy and consistency of highly decentralized and discretionary decisionmaking is a core challenge for the administrative state. The widely influential school of “democratic experimentalism” posits that peer review—the direct and deliberative evaluation of work product by peers in the discipline—provides a way forward, but systematic evidence remains limited. This Article provides the first empirical study of the feasibility and effects of peer review as a governance mechanism based on a unique randomized controlled trial conducted with the largest health department in Washington State (Public Health—Seattle and King County). We randomly assigned half of the food safety inspection staff to engage in an intensive peer review process for over four months. Pairs of inspectors jointly visited establishments, separately assessed health code violations, and deliberated about divergences on health code implementation. Our * William Benjamin Scott and Luna M. Scott Professor of Law, Stanford Law School; Address: 559 Nathan Abbott Way, Stanford, CA 94305; Tel: (650) 723-9560; Fax: (650) 725- 0253; E-mail: [email protected]. Thanks to Zoe Ashwood, Adrianna Boghozian, Aubrey Jones, and Sam Sherman for terrific research assistance; to Becky Elias, manager of the Food Program in King County for bold and wise leadership with the intervention; to the supervisors and technical seniors in King and Pierce Counties (particularly Rachel Knight, Katie Lott, Eyob Mazengia, Dan Moran, Jill Trohimovich, Todd Yerkes, and Phil Wyman) for thoughtfully collaborating on the intervention; to Mark Bossart and Brad Costello for help with accessing data; to the inspection staff in both counties for participating in the peer review trial; to participants at the Faculty Workshop at Stanford Law School, the Law and Economics Workshop at the University of Chicago Law School, the Law and Field Experiments group at Yale Law School, the Administrative Law Forum at Berkeley Law School, the Faculty Colloquy at the University of Tulsa College of Law, the statistics seminar at RAND Corporation, the Faculty Enrichment Series at the University of Arizona College of Law, the National Environmental Health Association Annual Educational Conference, and the Conference on Empirical Legal Studies at Duke Law School; and to Joe Graham (Food Safety Program Supervisor in Washington State), Michael Asimow, Ian Ayres, Omri Ben-Shahar, John Braithwaite, Andy Coan, Josh Cohen, Dick Craswell, Mike Dorf, Becky Elias, David Engstrom, Dan Farber, Stephen Galoob, Nadia Hermez, David Hausman, Deborah Hensler, Aubrey Jones, Bob Kagan, Mark Kelman, Rachel Knight, Katie Lott, Rob MacCoun, Anup Malani, David Marcus, Toni Massaro, Bernie Meyler, Jennifer Nou, Anne Joseph O’Connell, Lisa Ouellette, Chuck Sabel, Jane Schacter, Jodi Short, Bill Simon, Jason Solomon, Norm Spaulding, David Studdert, Dane Thorley, Laura Trice, Marty Wells, and Phil Wyman for helpful comments and conversations. No county provided any funding for this research.
Transcript of Stanford Law ReviewStanford Law Review ARTICLE Does Peer Review Work? An Experiment of...

1
Volume 69 January 2017
Stanford Law Review
ARTICLE
Does Peer Review Work? An Experiment of Experimentalism
Daniel E. Ho*
Abstract. Ensuring the accuracy and consistency of highly decentralized and discretionary decisionmaking is a core challenge for the administrative state. The widely influential school of “democratic experimentalism” posits that peer review—the direct and deliberative evaluation of work product by peers in the discipline—provides a way forward, but systematic evidence remains limited. This Article provides the first empirical study of the feasibility and effects of peer review as a governance mechanism based on a unique randomized controlled trial conducted with the largest health department in Washington State (Public Health—Seattle and King County). We randomly assigned half of the food safety inspection staff to engage in an intensive peer review process for over four months. Pairs of inspectors jointly visited establishments, separately assessed health code violations, and deliberated about divergences on health code implementation. Our
* William Benjamin Scott and Luna M. Scott Professor of Law, Stanford Law School; Address: 559 Nathan Abbott Way, Stanford, CA 94305; Tel: (650) 723-9560; Fax: (650) 725-0253; E-mail: [email protected]. Thanks to Zoe Ashwood, Adrianna Boghozian, Aubrey Jones, and Sam Sherman for terrific research assistance; to Becky Elias, manager of the Food Program in King County for bold and wise leadership with the intervention; to the supervisors and technical seniors in King and Pierce Counties (particularly Rachel Knight, Katie Lott, Eyob Mazengia, Dan Moran, Jill Trohimovich, Todd Yerkes, and Phil Wyman) for thoughtfully collaborating on the intervention; to Mark Bossart and Brad Costello for help with accessing data; to the inspection staff in both counties for participating in the peer review trial; to participants at the Faculty Workshop at Stanford Law School, the Law and Economics Workshop at the University of Chicago Law School, the Law and Field Experiments group at Yale Law School, the Administrative Law Forum at Berkeley Law School, the Faculty Colloquy at the University of Tulsa College of Law, the statistics seminar at RAND Corporation, the Faculty Enrichment Series at the University of Arizona College of Law, the National Environmental Health Association Annual Educational Conference, and the Conference on Empirical Legal Studies at Duke Law School; and to Joe Graham (Food Safety Program Supervisor in Washington State), Michael Asimow, Ian Ayres, Omri Ben-Shahar, John Braithwaite, Andy Coan, Josh Cohen, Dick Craswell, Mike Dorf, Becky Elias, David Engstrom, Dan Farber, Stephen Galoob, Nadia Hermez, David Hausman, Deborah Hensler, Aubrey Jones, Bob Kagan, Mark Kelman, Rachel Knight, Katie Lott, Rob MacCoun, Anup Malani, David Marcus, Toni Massaro, Bernie Meyler, Jennifer Nou, Anne Joseph O’Connell, Lisa Ouellette, Chuck Sabel, Jane Schacter, Jodi Short, Bill Simon, Jason Solomon, Norm Spaulding, David Studdert, Dane Thorley, Laura Trice, Marty Wells, and Phil Wyman for helpful comments and conversations. No county provided any funding for this research.
Peer Review 69 STAN. L. REV. 1 (2017)
2
findings are threefold. First, observing identical conditions, inspectors disagreed 60% of the time. These joint inspection results in turn helped to pinpoint challenging code items and to develop training and guidance documents efficiently during weekly sessions. Second, analyzing over 28,000 independently conducted inspections across the peer review and control groups, we find that the intervention caused an increase in violations detected and scored by 17% to 19%. Third, peer review appeared to decrease variability across inspectors, thereby improving the consistency of inspections. As a result of this trial, King County has now instituted peer review as a standard practice. Our study has rich implications for the feasibility, promise, practice, and pitfalls of peer review, democratic experimentalism, and the administrative state.

Peer Review 69 STAN. L. REV. 1 (2017)
3
Table of Contents
Introduction ................................................................................................................................................................. 5
I. Peer Review and Democratic Experimentalism ......................................................................... 14A. Antecedents of Peer Review ........................................................................................................ 14B. Democratic Experimentalism ..................................................................................................... 17C. Limited Evidence Base .................................................................................................................... 22
II. Food Safety ....................................................................................................................................................... 28A. Inspection Systems as Fertile Testing Ground .................................................................. 28B. Washington State .............................................................................................................................. 34C. King and Pierce Counties .............................................................................................................. 38
1. King County ............................................................................................................................... 382. County comparison ................................................................................................................ 45
III. Experimental Design .................................................................................................................................. 49A. Preparation and Rollout ................................................................................................................. 50B. Randomized Peer Inspections ..................................................................................................... 50C. Weekly Huddles ................................................................................................................................. 54
IV. Results ................................................................................................................................................................. 60A. Peer Inspections .................................................................................................................................. 60B. Independent Inspections ................................................................................................................ 61C. Qualitative Results ............................................................................................................................ 69
V. Limitations ....................................................................................................................................................... 73A. Substantive ............................................................................................................................................ 73B. Methodological ................................................................................................................................... 76
VI. Implications ..................................................................................................................................................... 78A. Peer Review ........................................................................................................................................... 79B. Rules and Guidance ........................................................................................................................... 82C. New Governance, Old Problems? ............................................................................................. 85D. Quality Assurance .............................................................................................................................. 90E. Facile Reforms ..................................................................................................................................... 92
Conclusion .................................................................................................................................................................. 97
Appendix A ................................................................................................................................................................ 99
Appendix B .............................................................................................................................................................. 104
Appendix C ............................................................................................................................................................. 106
Appendix D ............................................................................................................................................................. 107
Appendix E .............................................................................................................................................................. 108

Peer Review 69 STAN. L. REV. 1 (2017)
4
Appendix F .............................................................................................................................................................. 109
Appendix G ............................................................................................................................................................. 111
Appendix H ............................................................................................................................................................. 112
Appendix I ............................................................................................................................................................... 115
Appendix J ............................................................................................................................................................... 118

Peer Review 69 STAN. L. REV. 1 (2017)
5
Introduction
Every day, thousands of frontline government officials carry out the law. These officials often have extensive discretion, and the quality and consistency of their decisions can vary dramatically.
This problem of inconsistency is endemic, spanning across all areas of law, levels of government, and types of institutional structures. To provide a sense of the scope, consider the following:
The U.S. Citizenship and Immigration Services deploys some 450 asylum officers1 and some 250 immigration judges2 to decide whether an asylum applicant has a “well-founded fear” of persecution.3 Cases are assigned irrespective of the merits within an office, but examiners and judges vary widely in granting relief.4 In New York, of the judges hearing more than one hundred cases, one judge had a grant rate of 6% and another 91%.5 Scholars have denounced the process as a form of “refugee roulette.”6 Judge Richard Posner lamented “a complete breakdown of this immigration adjudication business.”7 Judge Marsha Berzon described one immigration judge’s decision as “def[ying] parsing under ordinary rules of English grammar.”8
1. U.S. Citizenship and Immigration Servs., USCIS Processing of Asylum Cases, U.S. DEP’T HOMELAND SECURITY, http://www.uscis.gov/humanitarian/refugees-asylum/uscis -processing-asylum-cases (last updated June 18, 2015).
2. Office of the Chief Immigration Judge, U.S. DEP’T JUST., http://www.justice.gov/eoir/office-of-the-chief-immigration-judge (last updated Jan. 12, 2016).
3. 8 C.F.R. § 208.13(b) (2016). 4. See David Hausman, The Failure of Immigration Appeals, 164 U. PA. L. REV. 1177 app. at
1218-19 (2016) (noting that while cases are not strictly randomly assigned within an office, “case assignment is arbitrary with respect to the merits”).
5. Jaya Ramji-Nogales et al., Refugee Roulette: Disparities in Asylum Adjudication, 60 STAN. L. REV. 295, 334 fig.22 (2007). These statistics exclude judges predominantly hearing detainee cases, as grant rates between affirmative and defensive cases are likely quite different. See id. at 333 n.68, 395 (noting that asylum seekers in detainee cases often face “obstacles to obtaining representation and corroborating evidence,” both of which “could contribute to significantly lower grant rates”).
6. Id. at 301-02, 305 (capitalization altered); see id. (“When an asylum seeker stands before an official or court who will decide whether she will be deported or may remain in the United States, the result may be determined as much or more by who that official is, or where the court is located, as it is by the facts and law of the case.”).
7. Oral Argument at 15:25, Benslimane v. Gonzales, 430 F.3d 828 (7th Cir. 2005) (No. 04-1339), http://media.ca7.uscourts.gov/sound/2005/migrated.aims.04 -1339_09_23_2005.mp3.
8. Adam Liptak, Courts Criticize Judges’ Handling of Asylum Cases, N.Y. TIMES (Dec. 26, 2005) (quoting Recinos De Leon v. Gonzales, 400 F.3d 1185, 1190 (9th Cir. 2005)), http://nyti.ms/1IPANMw.

Peer Review 69 STAN. L. REV. 1 (2017)
6
The Social Security Administration (SSA) employs over 1300 administra-tive law judges (ALJs) to adjudicate whether an individual is entitled to social security disability.9 The determination hinges on whether the individual is unable to engage in “substantial gainful activity” for her age, education, and work experience.10 Based on an exhaustive study of this adjudicative system, six leading scholars concluded that the “evidence is persuasive that the interjudge dispersion in reversal rates is truly a product of subjective factors, probably relating to the interpretative role of the ALJ rather than the investigative one.”11 They found that inter-ALJ consistency was the “most glaring” weakness of the ALJ system, as some ALJs reversed state agency determinations only about 10% of the time, while others reversed upwards of 90% of the time.12 With respect to ALJs, Justice Scalia argued that “we should be concerned not about bias but about bona fide incompetence.”13 Jerry Mashaw argued that conventional due process doctrine has failed to produce adjudicatory fairness and that due process should be reconceptualized to mandate improvement in management.14 Inconsistencies continue to plague the system.15 In 2013, of the San Francisco Bay Area ALJs deciding more than forty cases that year, one had a grant rate of 15% and another above 90%.16 In
9. See Information About SSA’s Office of Disability Adjudication and Review, U.S. SOC. SECURITY ADMIN., https://www.ssa.gov/appeals/about_odar.html (last visited Jan. 1, 2017).
10. 42 U.S.C. § 423(d)(1)(A), (2)(A) (2015); see also Substantial Gainful Activity, U.S. SOC. SECURITY ADMIN., https://www.socialsecurity.gov/oact/cola/sga.html (last visited Jan. 1, 2017).
11. JERRY L. MASHAW ET AL., SOCIAL SECURITY HEARINGS AND APPEALS: A STUDY OF THE SOCIAL SECURITY ADMINISTRATION HEARING SYSTEM 21 (1978) [hereinafter MASHAW ET AL., SOCIAL SECURITY HEARINGS AND APPEALS]; see also JERRY L. MASHAW, BUREAUCRATIC JUSTICE: MANAGING SOCIAL SECURITY DISABILITY CLAIMS 158 (1983) [hereinafter MASHAW, BUREAUCRATIC JUSTICE] (describing “a system that is so inherently judgmen-tal that a slight ‘tilt’ toward generosity or stinginess has dramatic effects on outcomes”).
12. See MASHAW ET AL., SOCIAL SECURITY HEARINGS AND APPEALS, supra note 11, at 21 fig.1-2.
13. Antonin Scalia, The ALJ Fiasco—A Reprise, 47 U. CHI. L. REV. 57, 58 (1979). 14. Jerry L. Mashaw, The Management Side of Due Process: Some Theoretical and Litigation
Notes on the Assurance of Accuracy, Fairness, and Timeliness in the Adjudication of Social Welfare Claims, 59 CORNELL L. REV. 772, 775-76 (1974) (arguing that due process requires “a management system for assuring adjudication quality in claims processing, sometimes called a quality control or quality assurance system”).
15. See HAROLD J. KRENT & SCOTT MORRIS, ACHIEVING GREATER CONSISTENCY IN SOCIAL SECURITY DISABILITY ADJUDICATION: AN EMPIRICAL STUDY AND SUGGESTED REFORMS 15 (2013) (showing that allowance rates spanned from 4% to 98% across ALJs), https://www.acus.gov/sites/default/files/documents/Achieving_Greater_Consistency _Final_Report_4-3-2013_clean.pdf.
16. These statistics come from ALJ disposition data available on the SSA’s website. See Archived Public Data Files: FY 2013, U.S SOC. SECURITY ADMIN., https://www.ssa.gov/appeals/DataSets/archive/archive_data_reports.html#&ht=3&a3=2 (to locate, select
footnote continued on next page

Peer Review 69 STAN. L. REV. 1 (2017)
7
two out of three cases, decisions are reversed on appeal,17 and the “massive unexplained differences” between ALJs18 have led to assessments of the process as “rife with errors,”19 “systematically wrong,”20 and “wildly out of control.”21
The Patent and Trademark Office employs some 9100 examiners22 to decide whether an invention is novel, nonobvious, and useful so as to warrant a patent.23 Patent grants24 and the search for prior art25 vary considerably across examiners. Claim language amendments appear similarly affected by examiners, so that patent scope, according to one scholar, is “remarkably sensitive to the happenstance of examiner identity.”26 One widely cited
“FY 2013” tab, then follow “ALJ Disposition Data” hyperlink, then select “September 2013”) (last visited Jan. 1, 2017).
17. William H. Simon, The Organizational Premises of Administrative Law, 78 LAW & CONTEMP. PROBS., nos. 1 & 2, 2015, at 61, 83.
18. Richard J. Pierce, Jr., What Should We Do About Social Security Disability Appeals?, REGULATION, Fall 2011, at 34, 35.
19. STAFF OF H. COMM. ON OVERSIGHT AND GOV’T REFORM, 113TH CONG., MISPLACED PRIORITIES: HOW THE SOCIAL SECURITY ADMINISTRATION SACRIFICED QUALITY FOR QUANTITY IN THE DISABILITY DETERMINATION PROCESS 52 (2014).
20. Simon, supra note 17, at 83. 21. Jerry L. Mashaw, How Much of What Quality?: A Comment on Conscientious Procedural
Design, 65 CORNELL L. REV. 823, 823 (1980). 22. U.S. PATENT & TRADEMARK OFFICE, U.S. DEP’T OF COMMERCE, PERFORMANCE AND
ACCOUNTABILITY REPORT 211 tbl.29 (2015), http://www.uspto.gov/sites/default/files/documents/USPTOFY15PAR.pdf.
23. 35 U.S.C. §§ 101-103 (2015). 24. Id. at 22 (“[A] significant portion of the overall variance among patents . . . can be
explained by the identity of the examiner—in the language of econometrics, ‘examiner fixed effects.’”); id. at 52 (“[I]diosyncratic aspects of examiner behavior appear to have a significant impact on the nature of the patent rights that they grant . . . .”); Mark A. Lemley & Bhaven Sampat, Examiner Characteristics and Patent Office Outcomes, 94 REV. ECON. & STAT. 817, 821 (2012) (finding that the most experienced patent examiners have an 11% higher grant rate than the least experienced patent examiners).
25. See Iain M. Cockburn et al., Are All Patent Examiners Equal?: Examiners, Patent Characteristics, and Litigation Outcomes, in PATENTS IN THE KNOWLEDGE-BASED ECONOMY 19, 24 (Wesley M. Cohen & Stephen A. Merrill eds., 2003) (“There is considerable scope for heterogeneity in [the] search procedure [for prior art].”).
26. Douglas Lichtman, Rethinking Prosecution History Estoppel, 71 U. CHI. L. REV. 151, 170 (2004); see also Michael D. Frakes & Melissa F. Wasserman, Is the Time Allocated to Review Patent Applications Inducing Examiners to Grant Invalid Patents?: Evidence from Micro-Level Application Data, REV. ECON. & STAT. (forthcoming 2017) (manuscript at 10-28), http://www.mitpressjournals.org/toc/rest/0/ja (analyzing over 1.4 million utility patent applications and finding that grant rates increased as patent examiners’ time to assess the patents decreased); Lemley & Sampat, supra note 24, at 819-26 (finding that examiner experience level influenced the likelihood that a patent would be granted or rejected).

Peer Review 69 STAN. L. REV. 1 (2017)
8
diagnosis: “There may be as many patent offices as there are patent examiners.”27
The Centers for Medicare and Medicaid Services (CMS) contracts with states to conduct nursing home surveys for compliance with federal regulations.28 By one count, inspectors enforced over a thousand regulations,29 some involving highly discretionary or subjective judgments such as whether a home cares for residents in a manner that “maintains or enhances each resident’s dignity.”30 The Government Accountability Office (GAO) found that an “important and continuing issue[]” is the “inconsistency among state surveyors.”31 One study attributed the low reliability of U.S. inspections to regulatory complexity: “How do [inspectors] cope with such a daunting task? The answer is that they do not. Some of the standards are completely forgotten . . . .”32
In response to allegations of child abuse or neglect, juvenile court judges decide whether to remove children from parental custody based on assessments of, for instance, “substantial risk of serious future injury.”33 One study of child welfare determinations from 1990 to 2001 in Illinois found statistically significant differences in removal rates across 409 case managers, even though cases were close to randomly assigned.34 Other scholars assailed these standards as presenting “uncabinable discretion” with institutional “chaos, oppression, and tragic ineffectiveness.”35
The Nuclear Regulatory Commission (NRC) employs roughly eight hundred staff members to conduct oversight inspections of some one hundred civilian nuclear reactors and thirty research reactors.36 One audit concluded,
27. Cockburn et al., supra note 25, at 28 (quoting unnamed informant). 28. See Survey & Certification: General Information, CTRS. FOR MEDICARE & MEDICAID SERVS.,
https://www.cms.gov/Medicare/Provider-Enrollment-and-Certification/Survey CertificationGenInfo (last updated Nov. 5, 2013).
29. John Braithwaite & Valerie Braithwaite, The Politics of Legalism: Rules Versus Standards in Nursing-Home Regulation, 4 SOC. & LEGAL STUD. 307, 320 (1995).
30. HHS Requirements for States and Long Term Care Facilities, 42 C.F.R. § 483.15(a) (2016).
31. U.S. GOV’T ACCOUNTABILITY OFFICE, GAO-06-117, NURSING HOMES: DESPITE INCREASED OVERSIGHT, CHALLENGES REMAIN IN ENSURING HIGH-QUALITY CARE AND RESIDENT SAFETY 4 (2005).
32. Braithwaite & Braithwaite, supra note 29, at 320. 33. See CAL. WELF. & INST. CODE § 300(a) (West 2016). 34. Joseph J. Doyle, Jr., Child Protection and Child Outcomes: Measuring the Effects of Foster
Care, 97 AM. ECON. REV. 1583, 1589-98, 1595 tbl.3, 1597 tbl.4 (2007). 35. Kathleen G. Noonan et al., Legal Accountability in the Service-Based Welfare State: Lessons
from Child Welfare Reform, 34 LAW & SOC. INQUIRY 523, 524 (2009). 36. U.S. NUCLEAR REGULATORY COMM’N, 2016 CONGRESSIONAL BUDGET JUSTIFICATION 19
(2016).

Peer Review 69 STAN. L. REV. 1 (2017)
9
“The subjectivity of some inspection criteria, coupled with considerable staff discretion, provides an environment for potential program inconsistency.”37 A study of forty inspectors found violation detection rates ranging from under 10% to over 60%.38 “[N]ondetection is endemic . . . .”39 Said one NRC section chief: “People can write requirements forever. But it’s a case of the alligator mouth and the hummingbird stomach.”40
Environmental health inspectors visit restaurants, food trucks, schools, nursing homes, and cafeterias to assess compliance with food safety regulations to prevent foodborne illness. Vagueness in health codes can give inspectors considerable discretion. For instance, health codes mandate that there be “adequate spacing” between foods to prevent cross-contamination.41 A 2009 audit of New York City’s health department, which then employed roughly 160 inspectors who were randomly assigned to inspect establishments, found that oversight was lacking.42 Inspector variation was substantial. At the time, twenty-eight violation points would have been considered a failed inspection,43 and some inspectors had average inspection scores as low as fifteen and others as high as fifty points.44 (Between 1988 and 1989, forty-six staff and former staff members—over half of the seventy-person inspection corps at the time—pled guilty to or were convicted of extortion, with the U.S. Attorney noting that “[t]he city agency was the criminal enterprise.”)45 A 2015
37. OFFICE OF THE INSPECTOR GEN., U.S. NUCLEAR REGULATORY COMM’N, OIG-95A-04, FACTORS CONTRIBUTING TO INCONSISTENCY IN THE OPERATING REACTOR INSPECTION PROGRAM (1995).
38. Jonathan S. Feinstein, The Safety Regulation of U.S. Nuclear Power Plants: Violations, Inspections, and Abnormal Occurrences, 97 J. POL. ECON. 115, 134 fig.4, 135 (1989).
39. Id. at 122. 40. Elizabeth Nichols & Aaron Wildavsky, Nuclear Power Regulation: Seeking Safety, Doing
Harm?, 11 REGULATION, no. 1, 1987, at 45, 50 (quoting unnamed NRC section chief). 41. U.S. FOOD & DRUG ADMIN., U.S. DEP’T OF HEALTH & HUMAN SERVS., FOOD CODE ¶ 3-
302.11(A)(2) annex 3, at 386 (2009). The 2013 Food Code replaces the “adequate spacing” requirement with a requirement to “arrang[e] each type of food in equipment so that cross contamination . . . is prevented.” U.S. FOOD & DRUG ADMIN., U.S. DEP’T OF HEALTH & HUMAN SERVS., FOOD CODE ¶ 3-302.11(A)(2)(b), at 68 (2013) (capitalization altered) [hereinafter 2013 FOOD CODE].
42. OFFICE OF THE COMPTROLLER, CITY OF N.Y., ME09-074A, AUDIT REPORT ON THE DEPARTMENT OF HEALTH AND MENTAL HYGIENE OVERSIGHT OF THE CORRECTION OF HEALTH CODE VIOLATIONS AT RESTAURANTS 13 (2009) (finding that the Department of Health “does not adequately track its inspectors or supervisors to ensure that inspec-tions are being properly conducted and monitored”).
43. Id. at 3. 44. Id. at 13. 45. Thomas Morgan, 9 Are Convicted of Extortion on Restaurant Inspections, N.Y. TIMES
(Jan. 6, 1989) (quoting Andrew J. Maloney, U.S. Att’y, E.D.N.Y.), http://nyti.ms/2cW6gEa; see also Todd S. Purdum, 15 More Arrested in Restaurant Inspection Bribes, N.Y. TIMES (July 8, 1988), http://nyti.ms/2cCAmRa; Selwyn Raab,
footnote continued on next page

Peer Review 69 STAN. L. REV. 1 (2017)
10
audit found that the department “did not consistently attempt follow-up inspections,” violating mandatory timing 50% of the time, and “supervisors failed to consistently perform [required] supervisory field inspections.”46 Due in part to this “inspector lottery,” one study of over 120,000 New York inspections showed that scores from one routine, unannounced inspection had virtually no predictive power for future inspection outcomes.47
As Appendix A documents, the examples go on and on, spanning tax law, labor law, privacy law, vehicle safety, criminal sentencing, drug manufactur-ing, and occupational safety, to name a few.48 Frontline decisionmaking is where “100 percent of bureaucratic implementation begins, and most of it ends.”49 And perceptions of arbitrariness in frontline decisions can seriously erode trust in government.50
Yet administrative law—the body of law most directly concerned with accurate and consistent public administration of the laws—has shockingly little to offer as a proven remedy.51
Inspectors Seized in Wide Extortion from Restaurants, N.Y. TIMES (Mar. 25, 1988), http://nyti.ms/2cCAbVS.
46. MARJORIE LANDA, OFFICE OF THE COMPTROLLER, CITY OF N.Y., MJ14-058A, AUDIT REPORT ON THE NEW YORK CITY DEPARTMENT OF HEALTH AND MENTAL HYGIENE’S FOLLOW-UP ON HEALTH CODE VIOLATIONS AT RESTAURANTS 2 (2015).
47. Daniel E. Ho, Fudging the Nudge: Information Disclosure and Restaurant Grading, 122 YALE L.J. 574, 592, 626, 637, 653 (2012) (“[I]nspectors may use a seemingly objective scoring rubric in drastically divergent ways.”); see also Ginger Zhe Jin & Jungmin Lee, A Tale of Repetition: Lessons from Florida Restaurant Inspections 19 (Nat’l Bureau of Econ. Research, Working Paper No. 20596, 2014), http://www.nber.org/papers/w20596 (finding “[t]he range of . . . inspector fixed effects [to be] huge”).
48. See infra Appendix A; see also A.F. Bissel, Inconsistency of Inspection Standards: A Case Study, 4 J. APPLIED STAT., no. 2, 1977, at 16, 16 (employing eight inspectors to review the same batch of items with drastically different results to show that dramatically divergent inspections are deployed).
49. MASHAW, BUREAUCRATIC JUSTICE, supra note 11, at 16. 50. See Tom Christensen & Per Lægreid, Trust in Government: The Relative Importance of
Service Satisfaction, Political Factors, and Demography, 28 PUB. PERFORMANCE & MGMT. REV. 487, 491, 505 (2005) (analyzing a cohort of Norwegian citizens’ relative trust in government depending on their satisfaction with specific public services, among other factors); B. Guy Peters, Bureaucracy and Democracy, 10 PUB. ORG. REV. 209, 216-17 (2010) (noting that disparities between the quality of public services in low-income and high-income communities can erode public trust); Craig W. Thomas, Maintaining and Restoring Public Trust in Government Agencies and Their Employees, 30 ADMIN. & SOC’Y 166, 186 (1998) (noting that “trust in professions can be lost through individual incompe-tence” and complacency).
51. See, e.g., Mariano-Florentino Cuéllar, Auditing Executive Discretion, 82 NOTRE DAME L. REV. 227, 240-49 (2006) (describing ways in which the traditional mechanism of judicial review of agency actions is often closed off or severely limited). To be sure, problems of accuracy and consistency of frontline decisionmaking may plague any large bureau-cratic organization, but due to a number of design features of public institutions
footnote continued on next page
Peer Review 69 STAN. L. REV. 1 (2017)
11
This Article makes the following six contributions. First, this Article investigates the lynchpin of “democratic experimentalism,” the widely influential school in “New Governance”52 that posits that peer review can help government agencies implement the law more effectively and consistently.53 Peer review consists of the direct and deliberative evaluation of work product by peers in the discipline. In the experimentalist sense, peer review also entails efforts at programmatic improvement based on pooling the results of such reviews with feedback to frontline employees. Scholars have discussed numerous variations of peer review, but the literature provides little sense of how to affirmatively design an effective peer review program given real regulatory constraints.54 This Article shows concretely how to design a prospective, affirmative, and effective intervention of experimentalist peer review within such constraints.
Second, this Article demonstrates how to empirically ground our under-standing of the administrative state by designing and tailoring a randomized controlled trial (RCT) of peer review in an actual regulatory enforcement setting. The evidence base for peer review remains weak, consisting primarily of limited case studies.55 Observational inferences about one-time interven-tions are inherently fragile, as it can be difficult to attribute outcome differences to the intervention. RCTs, by contrast, represent the gold standard for assessing the causal effects of an intervention.56 Randomization ensures
(appointments, removals, salaries, and civil service protections), the problems may be more acute in the public sector.
52. Democratic experimentalism is often characterized as one of several New Governance schools of thought. See Gráinne de Búrca, New Governance and Experimentalism: An Introduction, 2010 WIS. L. REV. 227, 228 n.5 (“While the term ‘new governance’ is applied to a broad range of processes and practices . . . , the most theoretically developed and normatively attractive model is to be found in Charles Sabel’s extensive work on democratic experimentalism.”).
53. See infra Part I.B. 54. See infra Part I. 55. See infra Part I.C. 56. Many recent works discuss the unique value of RCTs in law. See, e.g., Michael
Abramowicz et al., Randomizing Law, 159 U. PA. L. REV. 929, 934-38 (2011) (noting that randomization provides the basis for clean inference about causal effects and proposing that public officials adopt RCTs in much the same vein as cost-benefit analyses and environmental impact statements); Adam Chilton & Dustin Tingley, Why the Study of International Law Needs Experiments, 52 COLUM. J. TRANSNAT’L L. 173, 192-221 (2013) (arguing that RCTs should be used to assess the influence of multinational treaties on states); Donald P. Green & Dane R. Thorley, Field Experimentation and the Study of Law and Policy, 10 ANN. REV. L. & SOC. SCI. 53, 61-68 (2014) (providing an overview of randomized data studies conducted in a variety of legal realms); Michael Greenstone, Toward a Culture of Persistent Regulatory Experimentation and Evaluation, in NEW PERSPECTIVES ON REGULATION 111, 116-19 (David Moss & John Cisternino eds., 2009) (outlining a path for governments to adopt widespread RCTs as a means of regulatory
footnote continued on next page

Peer Review 69 STAN. L. REV. 1 (2017)
12
that differences in outcomes can be credibly attributed to the intervention. In collaboration with the largest health department in Washington State (Public Health—Seattle & King County), we designed an intensive, four-month RCT of peer review in food safety inspections. We randomly assigned half of the health inspectors into a peer review program, where inspectors spent a full day each week engaging in peer review inspections and participated in weekly training sessions based on pooling and deliberating over the results of peer inspections.57 To our knowledge, this is the first RCT—indeed, the first systematic quantitative evidence at all—of peer review as a governance mechanism. Given the limited evidence base and dearth of RCTs in regulatory policy,58 this study contributes by showing how rigorous policy evaluation can (and should) be built into the inception of policy.
Third, while many have argued that frontline differences in decisionmak-ing could merely reflect the different facts of different cases,59 our results prove that regulatory inconsistency plagues cases even when the facts are the same. In peer review inspections, when observing identical conditions, inspectors disagree on how to implement the health code 60% of the time.60 Disparities among frontline officials are real and challenge the core justification for administrative agencies and deference thereto: expertise.
reform); D. James Greiner & Andrea Matthews, Randomized Control Trials in the United States Legal Profession, 12 ANN. REV. L. & SOC. SCI. 295, 297-305 (2016) (compiling instances of RCTs conducted in the legal profession and attempting to explain why the legal world in particular has resisted their implementation); D. James Greiner & Cassandra Wolos Pattanayak, Randomized Evaluation in Legal Assistance: What Difference Does Representation (Offer and Actual Use) Make?, 121 YALE L.J. 2118, 2196-98 (2012) (describing how randomized studies can fill in evidentiary gaps regarding the effectiveness of legal representation); Daniel E. Ho & Donald B. Rubin, Credible Causal Inference for Empirical Legal Studies, 7 ANN. REV. L. & SOC. SCI. 17, 33-34 (2011) (discussing methodological advances in causal inference for empirical legal studies and showing that quasi-experimental approaches are more likely to recover estimates from RCTs); Daniel E. Ho, Randomizing . . . What?: A Field Experiment of Child Access Voting Laws, 171 J. INSTITUTIONAL & THEORETICAL ECON. 150, 150-51, 153 (2015) (proposing that randomization of legal information can allow causal inference about legal entitlements when (a) laws themselves cannot be randomized and (b) individuals lack legal information and applying such a technique in the voting context on voter turnout and voting behaviors).
57. For a discussion of interpreting the compound treatment effect of peer inspections coupled with training, see Part V.B below.
58. See STUART BUCK & JOSH MCGEE, LAURA & JOHN ARNOLD FOUND., WHY GOVERNMENT NEEDS MORE RANDOMIZED CONTROLLED TRIALS: REFUTING THE MYTHS 2 (2015) (noting that little is known about the efficacy of social programs and advocating widespread use of RCTs); Greenstone, supra note 56, at 111-12 (noting that the “current system” of regulatory policy is “broken” and “largely based on faith, rather than evidence” and arguing for widespread regulatory experimentation).
59. See infra note 297 and accompanying text. 60. See infra Part IV.A.

Peer Review 69 STAN. L. REV. 1 (2017)
13
Fourth, this Article provides rigorous and compelling evidence of the benefits of peer review in addressing these disparities. We find that the disagreement rate of inspectors in peer inspections decreases considerably over the course of the intervention.61 Applying randomization inference and a (Bayesian) multilevel model, we also show that the effects of peer review on independently conducted (that is, nonpeer) inspections are considerable.62 The program caused an increase of 17% to 19% in the violation detection and citation rate in independent inspections, and we provide strong reasons to believe that this average increase represents an improvement.63 More importantly, because the increase was driven by inspectors who ex ante scored violations at low rates, the intervention improved consistency (reduced variability) across inspectors. In short, peer review can reduce the arbitrariness of decisionmaking.
Fifth, the results and experience of designing this intervention challenge conventional wisdom about regulatory reform, namely efforts (a) to cabin discretion via increasingly fine-grained rules and (b) to remedy shortcomings via disclosure. Our findings corroborate the emphasis by democratic experimentalists on deliberation around enforcement discretion. But they also show that other New Governance initiatives (for example, information disclosure) can not only be ineffective but are actually in part to blame for the problem of regulatory inconsistency.
Last, the Article shows that the ubiquitous problem of inconsistency in frontline administration of law—long considered intractable due to preexisting constraints on and limitations of regulatory agencies—may in fact be soluble. While scholars have fixated on judicial review and political accountability as mechanisms to address such disparities, these solutions are highly imperfect. Our results show that peer review holds great promise for remedying what might otherwise be perceived as insurmountable problems of the administra-tive state. Surveys and interviews of all participants in King County reveal that despite a historically fractured staff and initial trepidation, the peer review group grew to be quite enthusiastic about the intervention. The participants observed many collateral benefits in terms of increased technical understand-ing, engagement, collegiality, and professionalism. Based on these results, King County institutionalized peer review for the entire staff as an ongoing, standard practice.
This Article proceeds as follows. Part I reviews the claims by democratic experimentalists that center around peer review as a central intervention to coordinate and improve decentralized government decisionmaking.
61. See infra Part IV.B. 62. See infra Part IV.B. 63. See infra Parts IV.B, V.A.

Peer Review 69 STAN. L. REV. 1 (2017)
14
Independent of experimentalism, peer review has also long been proposed as a policy matter,64 but the evidence base for its effectiveness remains weak.65 In the words of one of its main proponents: “Peer review is strikingly underdeveloped in law.”66 Part II spells out why the food safety inspection system provides an ideal test case for experimentalism and provides regulatory background on Washington State and King County. Part III details the intensive experiment King County and I jointly designed to provide a rigorous assessment of democratic experimentalism. In line with the theory, we used peer inspection results to develop health code training, feedback, and guidance in a collaborative fashion within the peer review group. Part IV presents the results. Part V discusses some limitations, including whether the citation increase and improved consistency represent normatively desirable improvements. Part VI spells out implications for the broader practice of peer review, administrative law, and the regulatory state. Part VII concludes.
I. Peer Review and Democratic Experimentalism
We here provide background on peer review as a governance mechanism. Subpart A discusses the intellectual antecedents of peer review, which has been proposed and/or implemented across a wide range of areas, even without reference to democratic experimentalism. Subpart B discusses the widely influential theory of democratic experimentalism, which elevates and deepens peer review as a central part of governance. Subpart C discusses the limited evidence base on which peer review rests.
A. Antecedents of Peer Review
Even before democratic experimentalism was recognized as a theory, commentators had long opined about, and agencies had flirted with variants of, peer review. Herbert Kaufman argued that the rotation of officers in the U.S. Forest Service in the 1950s helped to detect errors and promote loyalty to the agency: “As a means of inducing men to conform and of exposing noncompli-ance, movement of personnel exerts a constant integrative pressure.”67 As democratic experimentalists would later emphasize, Jerry Mashaw identified a “gap in our constitutional order”68 and argued against the reliance on formal
64. See infra Part I.A. 65. See infra Part I.C. 66. William H. Simon, Where Is the “Quality Movement” in Law Practice?, 2012 WIS. L. REV.
387, 398. 67. HERBERT KAUFMAN, THE FOREST RANGER: A STUDY IN ADMINISTRATIVE BEHAVIOR 156
(1960). 68. MASHAW, BUREAUCRATIC JUSTICE, supra note 11, at 226.
Peer Review 69 STAN. L. REV. 1 (2017)
15
proceedings and judicial review in favor of an “internal administrative law” of organizational management.69 In particular, Mashaw pointed to a 1969 study that deployed teams (consisting of a social worker, a physician, a psychologist, an occupational therapist, and a vocational counselor) to reevaluate social security disability cases and transmitted findings to personnel who had made the initial determination.70 He concluded, “[T]he model seems sufficiently attractive to warrant a serious test.”71 In the 1960s, some district courts instituted peer review to address sentencing disparities.72 Robert Kagan and Eugene Bardach noted that “regular mechanisms for enforcement officials to discuss hard cases, both among themselves and with superiors,” is a “vital element in teaching controlled discretion.”73 Michael Lipsky, author of the leading book on frontline bureaucrats, wrote:
The hardest reform of all will be to develop in street-level bureaucracies supportive environments in which peer review is joined to peer support and assistance in the working out of problems of practice. . . . [P]eer review and instruction currently do take place, but in ways that force workers either to be extremely circumspect or to promote routine processing rather than responses appropriate to individual clients.74 John and Valerie Braithwaite argued that team deliberation (a form of peer
review) over a small number of standards can lead to high reliability in nursing home inspections.75 Jeffrey Lubbers wrote that one of the “two guiding principles” for “assessing and dealing with apparent or alleged instances of misbehavior, bias, or unacceptably low productivity . . . ought to be . . . peer
69. Id. at 1 (capitalization altered); see also id. at 194-209. 70. Id. at 205-08; see also SAAD Z. NAGI, DISABILITY AND REHABILITATION: LEGAL, CLINICAL,
AND SELF-CONCEPTS AND MEASUREMENT 18-19, 23 (1969). 71. MASHAW, BUREAUCRATIC JUSTICE, supra note 11, at 208. Another commentator
suggested peer review as a way to respond to formal complaints about ALJ conduct. See John Holmes, In Praise of the ALJ System, ADMIN. & REG. L. NEWS, Summer 1996, at 3, 16.
72. See Theodore Levin, Toward a More Enlightened Sentencing Procedure, 45 NEB. L. REV. 499, 499 (1966) (discussing peer review in the Eastern District of Michigan); see also Shari Seidman Diamond & Hans Zeisel, Sentencing Councils: A Study of Sentence Disparity and Its Reduction, 43 U. CHI. L. REV. 109, 116-49 (1975) (assessing effects of Sentencing Councils); Kate Stith & Steve Y. Koh, The Politics of Sentencing Reform: The Legislative History of the Federal Sentencing Guidelines, 28 WAKE FOREST L. REV. 223, 252 (1993) (discussing the history of and disputes surrounding Sentencing Councils).
73. EUGENE BARDACH & ROBERT A. KAGAN, GOING BY THE BOOK: THE PROBLEM OF REGULATORY UNREASONABLENESS 159 (1982).
74. MICHAEL LIPSKY, STREET-LEVEL BUREAUCRACY: DILEMMAS OF THE INDIVIDUAL IN PUBLIC SERVICES 206-07 (30th anniversary expanded ed. 2010).
75. See Braithwaite & Braithwaite, supra note 29, at 322 (“The beauty of a small number of broad standards is therefore that one can design a regulatory process to ensure that the ticking of a met rating means that a proper process of information-gathering and team deliberation has occurred on that standard.”).

Peer Review 69 STAN. L. REV. 1 (2017)
16
review.”76 The U.S. Commission on International Religious Freedom proposed “peer review panels” for the asylum adjudication process.77 And Chris Guthrie, Jeff Rachlinski, and Andrew Wistrich proposed peer review for judges to overcome biases in decisionmaking.78
While these peer review systems themselves exhibit tremendous hetero-geneity in design (a topic we explore in Part VI when we compare peer review to more conventional quality assurance mechanisms), a chief goal common to them all is to improve the quality of governance and service delivery.79 Many
76. Jeffrey S. Lubbers, The Federal Administrative Judiciary: Establishing an Appropriate System of Performance Evaluation for ALJs, 7 ADMIN. L.J. AM. U. 589, 600-01 (1993) [hereinafter Lubbers, Appropriate System]; see id. at 602 (“‘[P]eer pressure’ likely would have a beneficial effect on ALJ performance.”); see also Jeffrey S. Lubbers, APA-Adjudication: Is the Quest for Uniformity Faltering?, 10 ADMIN. L.J. AM. U. 65, 78 (1996) (“[A] system of peer review, supervised by chief ALJs, should be established.”). Some ALJs have supported a thin form of peer review for grammar and style of decisions. See, e.g., Robert Robinson Gales, The Peer Review Process in Administrative Adjudication, 21 J. NAT’L ASS’N ADMIN. L. JUDGES 56, 62-75 (2001).
77. 1 U.S. COMM’N ON INT’L RELIGIOUS FREEDOM, REPORT ON ASYLUM SEEKERS IN EXPEDITED REMOVAL: FINDINGS & RECOMMENDATIONS 72 (2005).
78. See Chris Guthrie et al., Blinking on the Bench: How Judges Decide Cases, 93 CORNELL L. REV. 1, 38-40 (2007). In a fairly similar vein, now-California Supreme Court Justice Mariano-Florentino Cuéllar proposed random audits reviewing random samples of discretionary executive decisions. See Cuéllar, supra note 51, at 252. To be sure, Cuéllar leaves open the question of who and what organization should conduct the audit, so the auditors may or may not be peers per se. See id. at 286.
79. Outside of the direct literature on frontline administration, broader calls for diverse forms of peer review have proliferated as well. Of course, government grant agencies, such as the National Institutes of Health and the National Science Foundation, routinely deploy peer review to allocate discretionary grants. See Office of Extramural Research, Nat’l Insts. of Health, Peer Review Process, U.S. DEP’T HEALTH & HUM. SERVS., http://grants.nih.gov/grants/peer_review_process.htm (last updated Sept. 12, 2016); Phase II: Proposal Review and Processing, U.S. NAT’L SCI. FOUND., http://www.nsf.gov/bfa/dias/policy/merit_review/phase2.jsp#review (last visited Jan. 1, 2017). Many scholars and policymakers have called on government agencies to incorporate peer review more expansively for evaluating evidence in the regulatory process. See J.B. Ruhl & James Salzman, In Defense of Regulatory Peer Review, 84 WASH. U. L. REV. 1, 54-61 (2006) (arguing that peer review can improve agency decisionmaking and proposing a form of randomized peer review); Louis J. Virelli III, Scientific Peer Review and Administrative Legitimacy, 61 ADMIN. L. REV. 723, 726-27 (2009). The Office of Manage-ment and Budget issued guidelines for agencies to engage in such peer review, see OFFICE OF MGMT. & BUDGET, EXEC. OFFICE OF THE PRESIDENT, OMB BULL. NO. M-05-03, FINAL INFORMATION QUALITY BULLETIN FOR PEER REVIEW 2 (2004), and the GAO documented a wide range of such practices, including quality assurance reviews, see U.S. GEN. ACCOUNTING OFFICE, GAO/RCED-99-99, PEER REVIEW PRACTICES AT FEDERAL SCIENCE AGENCIES VARY 1-2 (1999). Since 1982, Medicare has required a form of peer review to improve the quality of medical care. See 42 U.S.C. §§ 1320c to 1320c-12 (2015) (outlining the requirements for agency contracts with quality improvement organiza-tions, including a standard peer review program). The Federal Highway Administra-tion requires “peer exchanges” among state departments of transportation as a condition of funding. 23 C.F.R. § 420.209(a)(7) (2016). The National Research Council’s
footnote continued on next page

Peer Review 69 STAN. L. REV. 1 (2017)
17
peer review programs also couple the review of one’s work product by peers with more substantive feedback, such as rule clarification and determining best practices.80
B. Democratic Experimentalism
Although many scholars and commentators outside of the experimentalist school have posited that peer review might help promote accuracy and consistency of law, experimentalism elevates the importance and deepens the nature of peer review in governance. In their seminal article A Constitution of Democratic Experimentalism, Michael Dorf and Charles Sabel address what they perceive as the modern constitutional dilemma: the increasing irrelevance of traditional constitutional principles (for example, the separation of powers and federalism) in the face of the administrative state.81 According to Dorf and Sabel, the complexity, diversity, and volatility of national affairs undermine the governance function of conventional legislation, administrative rules, and judicial judgments.82 Invoking pragmatist philosophy, Dorf and Sabel propose a new model of deliberative democratic governance to grapple with such systemic uncertainty: democratic experimentalism.83
First, Dorf and Sabel praise decentralized decisionmaking as a way for policy experiments to surface.84 Drawing on work that highlights the autonomy and discretion of frontline bureaucrats, they argue that “experimen-talist local government that looks to local adjustment for direction in higher
Transportation Research Board has compiled research for challenges and best practices in peer review of transportation planning and airports. See JOCELYN HOFFMAN ET AL., TRANSP. RESEARCH BD., PEER EXCHANGE SERIES ON STATE AND METROPOLITAN TRANSPORTATION PLANNING ISSUES § 3.1.1 tbl.3.1 (2006); AIRPORT COOP. RESEARCH PROGRAM, TRANSP. RESEARCH BD., CONDUCTING AIRPORT PEER REVIEWS: A SYNTHESIS OF AIRPORT PRACTICE 11, 12 tbl.1 (2013). The Patent and Trademark Office has explored the use of peer input on patenting decisions. See Eli Kintisch, PTO Wants to Tap Experts to Help Patent Examiners, 312 SCIENCE 982, 982 (2006); Beth Simone Noveck, “Peer to Patent”: Collective Intelligence, Open Review, and Patent Reform, 20 HARV. J.L. & TECH. 123, 143-61 (2006). Timur Kuran and Cass Sunstein argue that peer review, much like cost-benefit analysis, can help to combat misinformation and misperceptions that distort risk regulation. See Timur Kuran & Cass R. Sunstein, Availability Cascades and Risk Regulation, 51 STAN. L. REV. 683, 754, 762 (1999).
80. See, e.g., Braithwaite & Braithwaite, supra note 29, at 321 (arguing that the more successful Australian nursing home inspectors “actually do deliberate on all their standards and collect the evidence that they judge sufficient to support that delibera-tion”).
81. Michael C. Dorf & Charles F. Sabel, A Constitution of Democratic Experimentalism, 98 COLUM. L. REV. 267, 270 (1998).
82. See id. 83. See id. at 289. 84. See id. at 340.

Peer Review 69 STAN. L. REV. 1 (2017)
18
level reform makes virtues of these vices.”85 “Democratic experimentalism”—as they coined the model—opposes the usual (command-and-control) solution of centralized, top-down rules to cabin frontline discretion.86 Decentralized decisionmaking instead becomes the source of innovation and appropriate tailoring of discretion to localized circumstances.87
Second, Dorf and Sabel argue that information pooling across deci-sionmaking units—coupled with error correction, proposals for change, and learning by monitoring—would both increase the efficiency of public administration and increase accountability by reengaging citizens.88 As initially conceived, Dorf and Sabel contemplate information pooling as a form of benchmarking of outcomes, which would spawn comparisons across peers to adopt the best model.89 Such information pooling could occur both within and across governmental agencies.90 “Inspection by peer administrators is a
85. Id. at 321 (discussing MICHAEL LIPSKY, STREET-LEVEL BUREAUCRACY: DILEMMAS OF THE INDIVIDUAL IN PUBLIC SERVICES 3 (1980)).
86. See Simon, supra note 17, at 69. 87. Eugene Bardach and Robert Kagan are in many ways the intellectual antecedents to
this form of New Governance. See BARDACH & KAGAN, supra note 73, at 123-83 (discussing the model of the “good inspector” and how management practices in an agency can foster such behavior); see also Lester M. Salamon, The New Governance and the Tools of Public Action: An Introduction, 28 FORDHAM URB. L.J. 1611, 1639 (2001) (“Eugene Bardach and Robert Kagan recognized this point clearly in their classic analysis of the problem of regulatory enforcement. Rather than the classic ‘tough cop,’ Bardach and Kagan suggest that regulatory enforcement actually may be more successful if it promotes the concept of the ‘good inspector,’ the inspector who understands when forbearance rather than rigid enforcement will best achieve regulatory compliance, and who has the discretion to adjust regulatory enforcement accordingly. . . . Instead of narrowing the range of administrative discretion left to the ‘street-level bureaucrat,’ the ‘new governance’ calls for broadening that discretion and equipping the public official with the skills and understanding needed to exercise this discretion in a way that advances program objectives.” (footnotes omitted)).
88. Dorf & Sabel, supra note 81, at 287-88. 89. See id. at 287. 90. Id. at 354 (“Agency staff, observing . . . the regulated entities first-hand, develop a strong
sense of emerging processes, and by pooling knowledge of these processes with staff at other locations, agencies can identify emerging best practices.”); see also id. at 287 (analogizing to the private sector and noting how “distinct and effectively independent operating units of the firm . . . propose changes to the provisional design”); id. at 316 (“Just as discussion of the relation among programs and rules within a single locale reveals strengths and weaknesses concealed when each is considered in isolation, so comparison among individual programs’ variant rules and methods of coordinating them allows each jurisdiction to see its viewpoints and its proposals in the light of alternatives articulated by the others.”); id. at 319 (“[R]eviews can begin with compari-sons of results obtained by various units of all like providers in the local jurisdiction . . . .”).

Peer Review 69 STAN. L. REV. 1 (2017)
19
characteristic institution for establishing these connections,”91 and “peer administration could become . . . the frame of national experimentalism.”92
Subsequent work, particularly William Simon’s, argues for thicker forms of information pooling in peer review. By mutual learning and continuous improvement, organizations can achieve greater accountability and “norm-governed transparency in sectors that depend on [contextualized] judg- ment . . . . The key is peer deliberation and review.”93 Peer review as envisioned by William Simon and others entails substantive deliberation over norms, with the fruits of this deliberation diffused throughout each local unit.94 By requiring deliberation and articulation of rationales for the exercise of discretion, peer review is hypothesized to help reduce inconsistencies across frontline officials. Where inconsistencies persist, frontline officials are given the chance to justify their departure from the norm with reasoning vetted by their peers and supervisors.95
To illustrate, Kathleen Noonan, Charles Sabel, and William Simon describe child welfare reform in Alabama and Utah as an experimentalist intervention that exhibits responsiveness, flexibility, and accountability.96 In response to child welfare litigation, Alabama and Utah adopted a Quality Service Review (QSR), during which agency officials and outsiders review a stratified random sample of past cases.97 The team reviews case files, conducts interviews with parties, and scores cases numerically along several indicators (for example, child safety and family stability).98 After reviewing the scores collectively, the team meets with frontline caseworkers to convey and discuss
91. Id. at 355. 92. Id. at 356. 93. Simon, supra note 17, at 81. 94. See Charles F. Sabel & William H. Simon, Minimalism and Experimentalism in the
Administrative State, 100 GEO. L.J. 53, 93 (2011) (“[E]xperimentalist regimes . . . strive for accountability less through simple rules than through peer review of local discretion. The aspiration is that pooled learning will discipline local autonomy while generaliz-ing its successes.”).
95. Id. at 80 (“[T]he experimentalist regimes differ from command and control in that a large fraction of their norms are indicative or presumptive rather than mandatory. . . . [T]he agent can depart from the rule but only if she signals her departure and explains her reasons to peers or superiors. . . . [H]er duty is to ‘comply or explain.’” (quoting Christopher Hogg, The “Comply or Explain” Approach to Improving Standards of Corporate Governance, http://www.financepractitioner.com/contentFiles/QF02/glus0fcl/1k/0/the-comply-or-explain-approach-to-improving-standards-of-corporate-governance.pdf)).
96. See Noonan et al., supra note 35, at 524-25; see also Sabel & Simon, supra note 94, at 91-92 (discussing the Noonan study).
97. See Noonan et al., supra note 35, at 525, 542. 98. Id. at 543, 544 tbl.1.

Peer Review 69 STAN. L. REV. 1 (2017)
20
their assessments.99 Noonan, Sabel, and Simon argue that the QSR process helps to articulate norms for implementing elusive agency goals (for example, child safety), serves as a diagnostic tool for reform, and fosters the transparent exercise of discretion of frontline officials.100 “By discussing how the norms apply to particular cases, peers develop consistent understanding, or ‘inter-rater reliability.’”101
The impact of democratic experimentalism—dubbed by Judge Guido Calabresi “the Columbia School”102 and often conceived of as part of the New Governance movement103—could hardly be overstated. Three volumes have been dedicated to the topic alone,104 and Dorf and Sabel’s work has been cited over 1600 times.105 The literature extending, adapting, and applying the theory of democratic experimentalism across fields of law—environmental law,106 antidiscrimination law,107 occupational health and safety,108 financial regulation,109 international law,110 and European integration,111 to name a
99. Id. at 544-45. 100. See id. at 545-48. 101. Simon, supra note 17, at 81. 102. Guido Calabresi, An Introduction to Legal Thought: Four Approaches to Law and to the
Allocation of Body Parts, 55 STAN. L. REV. 2113, 2125 n.50 (2003). 103. For discussions of various New Governance typologies, see, for example, Orly Lobel,
The Renew Deal: The Fall of Regulation and the Rise of Governance in Contemporary Legal Thought, 89 MINN. L. REV. 342, 345-47 (2004) [hereinafter Lobel, The Renew Deal]. See also Bradley C. Karkkainen, Reply, “New Governance” in Legal Thought and in the World: Some Splitting as Antidote to Overzealous Lumping, 89 MINN. L. REV. 471, 475-78 (2004); Orly Lobel, Surreply, Setting the Agenda for New Governance Research, 89 MINN. L. REV. 498, 503-09 (2004) [hereinafter Lobel, Setting the Agenda].
104. EXPERIMENTALIST GOVERNANCE IN THE EUROPEAN UNION: TOWARDS A NEW ARCHITECTURE (Charles F. Sabel & Jonathan Zeitlin eds., 2010); EXTENDING EXPERIMENTALIST GOVERNANCE?: THE EUROPEAN UNION AND TRANSNATIONAL REGULATION (Jonathan Zeitlin ed., 2015); Democratic Experimentalism, CONTEMP. PRAGMATISM, Dec. 2012, at 1.
105. GOOGLE SCHOLAR, https://scholar.google.com (to locate, search “Michael C. Dorf & Charles F. Sabel, A Constitution of Democratic Experimentalism” and view citation count on the bottom left of page) (last visited Jan. 1, 2017).
106. See Dorf & Sabel, supra note 81, at 373-88. 107. See Susan Sturm, Gender Equity Regimes and the Architecture of Learning, in LAW AND
NEW GOVERNANCE IN THE EU AND THE US 323, 324-25 (Gráinne de Búrca & Joanne Scott eds., 2006).
108. See Lobel, Setting the Agenda, supra note 103, at 507. 109. See Robert F. Weber, New Governance, Financial Regulation, and Challenges to Legitimacy:
The Example of the Internal Models Approach to Capital Adequacy Regulation, 62 ADMIN. L. REV. 783, 836-67 (2010).
110. See Gráinne de Búrca et al., New Modes of Pluralist Global Governance, 45 N.Y.U. J. INT’L L. & POL. 723, 738-86 (2013).

Peer Review 69 STAN. L. REV. 1 (2017)
21
few—is voluminous.112 Brandon Garrett and James Liebman, for instance, argue that peer review and experimentalism can solve challenges with equal protection.113 Lisa Ouellette argues that peer review within the Patent and Trademark Office would help patent examiners exercise discretion consistent with the broader goals of innovation policy.114 And Joseph Landau suggests that immigration officials, including line officers, should engage in peer deliberation to coordinate immigration enforcement.115
To be sure, as a matter of theory, democratic experimentalism has certain ambiguities.116 It remains unclear what level of divergence across decisionmak-ing units is desirable and why.117 Concepts of information pooling, benchmarking, and continuous improvement remain diffuse, hence potentially covering a vast array of governance arrangements.118 While the theory is
111. See Burkard Eberlein & Dieter Kerwer, New Governance in the European Union: A Theoretical Perspective, 42 J. COMMON MKT. STUD. 121, 131-35 (2004).
112. See, e.g., Joshua Cohen & Charles Sabel, Directly-Deliberative Polyarchy, 3 EUR. L.J. 313, 313, 314 n.1 (1997) (drawing on democratic experimentalism to defend a new form of democracy); Charles Sabel, Dewey, Democracy, and Democratic Experimentalism, CONTEMP. PRAGMATISM, Dec. 2012, at 35, 50-51 (arguing that democratic experimental-ism clarifies the institutional design choices left ambiguous by Dewey’s pragmatism, helping to connect the focus on society as a whole and the local community); William H. Simon, The Institutional Configuration of Deweyan Democracy, CONTEMP. PRAGMATISM, Dec. 2012, at 5, 6 (arguing that democratic experimentalism better expresses Dewey’s pragmatism).
113. See Brandon L. Garrett & James S. Liebman, Experimentalist Equal Protection, 22 YALE L. & POL’Y REV. 261, 280-324 (2004).
114. See Lisa Larrimore Ouellette, Patent Experimentalism, 101 VA. L. REV. 65, 104-27 (2015). 115. See Joseph Landau, Bureaucratic Administration: Experimentation and Immigration Law, 65
DUKE L.J. 1173, 1238 (2016). 116. See, e.g., Jamison E. Colburn, “Democratic Experimentalism”: A Separation of Powers for Our
Time?, 37 SUFFOLK U. L. REV. 287, 391 (2004) (describing some features of democratic experimentalism as “more rigorous (at times unrealistic) possibility conditions”); Jason M. Solomon, New Governance, Preemptive Self-Regulation, and the Blurring of Boundaries in Regulatory Theory and Practice, 2010 WIS. L. REV. 591, 594-97 (arguing that a common feature of New Governance is to blur boundaries within conventional categories, such as actors, stages, modes, functions, and the structure of regulation); David A. Super, Laboratories of Destitution: Democratic Experimentalism and the Failure of Antipoverty Law, 157 U. PA. L. REV. 541, 603 (2008) (noting the “substantive indeterminacy of democratic experimentalism”).
117. The response by democratic experimentalists would be that the optimal level depends itself on the process of mutual learning through information pooling. See Sabel & Simon, supra note 94, at 79 (“[F]ramework goals, performance measures, and decision-making procedures themselves are periodically revised on the basis of alternatives reported and evaluated in peer reviews . . . .”).
118. See Dorf & Sabel, supra note 81, at 287-88 (describing information pooling as “linked systems of local and inter-local or federal pooling of information . . . enabl[ing] the actors to learn from one another’s successes and failures while reducing the vulnerabil-ity created by the decentralized search for solutions”); id. at 287 (defining benchmark-
footnote continued on next page

Peer Review 69 STAN. L. REV. 1 (2017)
22
expansive, the central mechanism that stands at the heart of experimentalism is peer review.119
C. Limited Evidence Base
To date, there is, unfortunately, very limited evidence for the claims about peer review. To be sure, as a normative political theory, elements of democratic experimentalism—such as its claim of iterative improvement toward broad, evolving goals—may not be empirically testable at all. Moreover, failures of experimentalist institutions in practice may simply represent the failure to execute experimentalism properly.120 But many claims are at least amenable to empirical inquiry:121 Given the myriad of different designs of peer review, how and at what cost can such institutions be implemented and sustained? To what extent are such institutions more flexible and accountable? Does peer review work to achieve more effective outcomes?
Many scholars have contested experimentalism’s empirical supposi-tions.122 Some experimentalists have offered promising, suggestive, and in-
ing as “an exacting survey of current or promising products and processes which identifies those products and processes superior to those the company presently uses, yet are within its capacity to emulate and eventually surpass”); Sabel & Simon, supra note 94, at 80 (defining continuous improvement as “contemplat[ing] that rules will be continuously revised in the course of application” and “treat[ing] rule departures diagnostically as symptoms of systemic problems and opportunities for systemic improvement”).
119. See Charles F. Sabel & William H. Simon, Epilogue: Accountability Without Sovereignty, in LAW AND NEW GOVERNANCE IN THE EU AND THE US, supra note 107, at 395, 400 (“Peer review is the answer of new governance to the inadequacies of principal-agent accountability.”); Charles F. Sabel & Jonathan Zeitlin, Learning from Difference: The New Architecture of Experimentalist Governance in the EU, 14 EUR. L.J. 271, 274 (2008) (“[A] single institutional mechanism, such as a formal peer review exercise, can perform a number of distinct governance functions . . . .”); Sabel & Simon, supra note 94, at 82 n.77 (“[P]eer review . . . is central to experimentalism.”); Weber, supra note 109, at 848 (“[P]eer review interactions permit the identification . . . of best practices and create a forum to exert moral suasion on underperforming member states.”).
120. See Simon, supra note 17, at 91. 121. See Cohen & Sabel, supra note 112, at 341-42 (promoting directly deliberative polyarchy
while noting that “hav[ing] offered some empirical hints,” when “a new, radically participatory form of democracy is beginning to stare us in the face, the obvious and urgent thing to do is stare back”); see also Dorf & Sabel, supra note 81, at 407 (“Experi-mentalism would be superfluous if its results could be anticipated by reflection.”).
122. See, e.g., Eberlein & Kerwer, supra note 111, at 127 (“[A]lthough by no means futile, any empirical evaluation of the new modes of governance is problematic at present.”); Wendy Netter Epstein, Bottoms Up: A Toast to the Success of Health Care Collaboratives . . . What Can We Learn?, 56 ADMIN. L. REV. 739, 742-43 (2004) (“[A]rticles about a different, innovative governance structure . . . are criticized because their optimism is not adequately supported by specific, concrete, tangible proof that these new models of governance might actually work.”); Karkkainen, supra note 103, at 476-77 (“[O]utcomes
footnote continued on next page

Peer Review 69 STAN. L. REV. 1 (2017)
23
depth qualitative case studies, but the findings remain disputed.123 David Super reviewed experimentalist claims and evidence with respect to antipoverty law and found that “reliance on research can be selective” and that “even tendentious studies with fundamental, well-documented flaws have proven influential.”124 While documenting the rise of experimentalist institutions, Dorf and Sabel concede, “reforms are still too new to permit any overall assessment of their effectiveness.”125 More succinctly, Miriam Baer concludes, “there is little empirical evidence that New Governance produces good governance.”126
Specifically with respect to the core premise of peer review, the evidence is thin. Case studies in the public sector make it hard to assess the effectiveness of
of these scattered policy experiments remain ambiguous and contested.”); Errol Meidinger, Competitive Supragovernmental Regulation: How Could It Be Democratic?, 8 CHI. J. INT’L L. 513, 534 (2008) (“[W]e have little evidence that democratic experimentalism is actually being practiced on a widespread basis. It is possible that what we often have is a form of managed tokenism designed to cloak status quo practices in a mantle of procedural and technocratic propriety.”); William E. Scheuerman, Democratic Experimentalism or Capitalist Synchronization?: Critical Reflections on Directly-Deliberative Polyarchy, 17 CAN. J.L. & JURIS. 101, 118 (2004) (“[R]ecent studies of real-life instantia-tions of democratic experimentalist ideas offer little empirical evidence in support of the claim that democratic experimentalism is temporally efficient and fast-footed.”).
123. For instance, Liebman and Sabel provide case studies of Texas and Kentucky school reform, see James S. Liebman & Charles F. Sabel, A Public Laboratory Dewey Barely Imagined: The Emerging Model of School Governance and Legal Reform, 28 N.Y.U. REV. L. & SOC. CHANGE 183, 231-66 (2003), but the evidence remains contested, see, e.g., Mark Tushnet, A New Constitutionalism for Liberals?, 28 N.Y.U. REV. L. & SOC. CHANGE 357, 358 (2003) (“Liebman and Sabel . . . abstract from the case studies they provide and extract from them some general characteristics of a process that in fact does not exist in either venue.”). Michael Dorf and Charles Sabel discuss drug treatment courts as “open and evolving experimentalist institutions” to allay the tradeoff between efficacy and accountability. See Michael C. Dorf & Charles F. Sabel, Drug Treatment Courts and Emergent Experimentalist Government, 53 VAND. L. REV. 831, 837 (2000). A meta-analysis of drug courts finds that drug courts reduce recidivism but notes the “generally weak nature of the research designs.” David B. Wilson et al., A Systematic Review of Drug Court Effects on Recidivism, 2 J. EXPERIMENTAL CRIMINOLOGY 459, 479 (2006). Scholars say that “[t]he recursive properties of the EU’s new experimentalist governance architecture are displayed most clearly in the family of processes known as the OMC [Open Method of Coordination].” Sabel & Zeitlin, supra note 119, at 289. However, one critic opined: “Despite the claims that the OMC can lead to ‘better regulation’ and ‘more effective’ regulation there has been very little empirical work carried out on the real effects of the OMC.” Erika Szyszczak, Experimental Governance: The Open Method of Coordination, 12 EUR. L.J. 486, 496 (2006).
124. Super, supra note 116, at 581 (footnote omitted). 125. Dorf & Sabel, supra note 81, at 326. 126. Miriam Hechler Baer, Governing Corporate Compliance, 50 B.C. L. REV. 949, 1011 (2009).

Peer Review 69 STAN. L. REV. 1 (2017)
24
peer review as an intervention. Some proposals were not implemented,127 and others were never seriously evaluated.128
The Braithwaites’ study of Australian nursing homes showed that ratings by a government team of inspectors exhibited high interrater reliability (as compared to an independent rater) and that after postinspection discussion between the team and the independent rater, reliability increased slightly.129 The Braithwaites interpreted this evidence to mean that a limited number of standards can be preferable to a large number of rules, thereby potentially explaining why U.S. nursing home inspections exhibit lower reliability.130 They also argue that a distinct benefit of the standards-based system in Australia is that it allows for a postinspection “exit conference” between inspectors to discuss the inspectors’ ratings for each standard in turn—a form of inspector peer review.131 While this evidence is suggestive of the optimal complexity of rules, the apparent impact of peer deliberation was small, and it is unclear how peer deliberation would extrapolate to the American context. In the case of child welfare, Noonan, Sabel, and Simon pointed to the improve-ment of QSR scores across small samples of twenty-four cases from 2003 to 2007 but recognized that the measure is “crude” as “it is rarely plausible to get a large enough sample size for statistical validity.”132 Because the comparison was purely over time133 and because both jurisdictions were operating under consent decrees,134 it is also difficult to attribute performance gains to the form
127. The so-called Bellmon Review Program, which would have provided for feedback and counseling to ALJs based on reviews of random samples of disability cases, was never implemented due to litigation and fierce pushback by ALJs. See Ass’n of Admin. Law Judges v. Heckler, 594 F. Supp. 1132, 1133-36 (D.D.C. 1984) (describing the peer review program and its elimination). The Bellmon Review was also a much more hierarchical-ly driven review program than would be favored by experimentalists.
128. The Executive Office for Immigration Review, for instance, reported that a “peer observation” program was piloted successfully but provided no analysis of outcomes. EXEC. OFFICE FOR IMMIGRATION REVIEW, DEP’T OF JUSTICE, EOIR’S IMPROVEMENT MEASURES—PROGRESS OVERVIEW 2 (2008). While the peer observation program appears to have been part of the training for immigration judges, not an ongoing quality assurance mechanism, it could still have been subject to evaluation.
129. Braithwaite & Braithwaite, supra note 29, at 313, 314 tbl.1 (reporting an average increase of roughly 3.7% in the agreement rate across standards, based on subtracting the initial average agreement rate from the average agreement rate after conferring).
130. Id. at 319-22. 131. Id. at 321 (“The crucial difference is that Australian teams actually do deliberate on all
their standards and collect the evidence that they judge sufficient to support that deliberation.”).
132. Noonan et al., supra note 35, at 546 tbl.2, 548. 133. Id. at 546 tbl.2. 134. Id. at 534-37.

Peer Review 69 STAN. L. REV. 1 (2017)
25
of peer review alone. Noonan, Sabel, and Simon admit providing only “impressionistic evidence for [the] promise” of “improved performance.”135
Other studies are similarly limited in their ability to speak to experimen-talist peer review and/or methodology. Jennifer Goldstein studied one school district before and after it implemented teacher peer review, finding greater accountability as reported in interviews and surveys with participants.136 Teacher peer review, however, was implemented as a corrective measure specifically for struggling teachers,137 rather than in the continuous monitoring sense that experimentalists advocate. In the accounting field, one study showed that peer review results can predict adverse outcomes.138 That study suggests that peer reports provide meaningful information, but it offers limited evidence about peer review’s impact because all firms in the sample were subject to peer review.139 One study in food safety documented improvement in staff consistency with desk audits, but the trend was only over time and the study did not test for statistical significance.140
Outside of governance, the evidence for peer review remains similarly limited.141 Many scholars have studied the effects of “student peer assessments”
135. Id. at 525. 136. See Jennifer Goldstein, Easy to Dance to: Solving the Problems of Teacher Evaluation with
Peer Assistance and Review, 113 AM. J. EDUC. 479, 483, 498 tbl.1 (2007). 137. Id. at 482. 138. See Jeffrey R. Casterella et al., Is Self-Regulated Peer Review Effective at Signaling Audit
Quality?, 84 ACCT. REV. 713, 720-24 (2009). Adverse outcomes were measured by malpractice claims against firms. Id. at 714.
139. See id. at 717-18. 140. See Morgan Poloni, The Impact of Desk Audits on the Consistency of Retail Food Inspection
Reports in Alaska: A Trend Analysis, 73 J. ASS’N FOOD & DRUG OFFICIALS (SPECIAL EDITION) 75, 77-78 (2013); see also Davonna W. Koebrick, Impact of FDA Core Courses on Texas Manufactured Food Inspector Written Observations, 73 J. ASS’N FOOD & DRUG OFFICIALS (SPECIAL EDITION) 54, 57-59 (2013) (finding inconclusive evidence of the impact of the FDA course on inspection practices).
141. When it comes to scientific peer review for grants and publication, there are studies of specific parameters of the peer review system (for example, blinded versus unblinded review or effects of author-suggested reviewers) but no estimates of the impact of peer review itself. See, e.g., Lutz Bornmann & Hans-Dieter Daniel, Do Author-Suggested Reviewers Rate Submissions More Favorably than Editor-Suggested Reviewers?: A Study on Atmospheric Chemistry and Physics, PLOS ONE 3-7 (Oct. 14, 2010), http://dx.doi.org/10.1371/journal.pone.0013345; Carole J. Lee et al., Bias in Peer Review, 64 J. AM. SOC’Y FOR INFO. SCI. & TECH. 2, 10-13 (2013) (reviewing evidence of the effects of blind peer review). One review of the literature notes, “Because of the centrality of peer review to the propagation of scientific knowledge, one would expect that peer review has been thoroughly studied, with its benefits and potential pitfalls exhaustively documented. Such is not the case.” Richard Snodgrass, Single- Versus Double-Blind Reviewing: An Analysis of the Literature, SIGMOD REC., Sept. 2006, at 8, 9. Many have also conjectured and studied liabilities of peer review, namely that it can be costly, unreliable, biased, slow, ineffective, and conservative. See Lutz Bornmann, Scientific Peer Review, 45 ANN.
footnote continued on next page
Peer Review 69 STAN. L. REV. 1 (2017)
26
as a pedagogical tool. Numerous studies suggest that peer assessments have positive effects, but a review of the literature found the evidence weak.142 Most studies lacked a control group, and those studies that included a control group yielded mixed effects.143 One rigorous study involved an experimental intervention in an introductory statistics class.144 It found that students randomized into peer assessment performed modestly better on quizzes and
REV. INFO. SCI. & TECH. 199, 206-11 (2011) (documenting low interrater reliability among referees); Stephen Cole et al., Chance and Consensus in Peer Review, 214 SCIENCE 881, 881, 885 (1981) (subjecting 150 National Science Foundation proposals to fresh review and concluding “that the fate of a particular grant application is roughly half determined by the characteristics of the proposal and the principal investigator, and about half by apparently random elements which might be characterized as the ‘luck of the reviewer draw’”); Glenn Ellison, The Slowdown of the Economics Publishing Process, 110 J. POL. ECON. 947, 953 tbl.1 (2002) (documenting that the mean time from submis-sion to acceptance—not publication—at the American Economic Review was twenty-one months in 1999); Robert H. Fletcher & Suzanne W. Fletcher, Evidence for the Effectiveness of Peer Review, 3 SCI. & ENGINEERING ETHICS 35, 37 (1997) (“What is the evidence that the additional effort and expense of external peer review, statistical consultants, manu-script editors and the like are worthwhile? The evidence base is not strong.”); Lee et al., supra, at 6-8 (reviewing evidence of bias by prestige, affiliation, nationality, language, and gender of author); Michael J. Mahoney, Publication Prejudices: An Experimental Study of Confirmatory Bias in the Peer Review System, 1 COGNITIVE THERAPY & RES. 161, 164, 173-74 (1977) (conducting an experiment with seventy-five journal reviewers, who were asked to referee manuscripts with identical procedures but different results, and finding strong evidence of confirmation bias). One study, for instance, used twelve published articles from authors in prestigious psychology departments and resubmit-ted them under fictitious names and institutions. See Douglas P. Peters & Stephen J. Ceci, Peer-Review Practices of Psychological Journals: The Fate of Published Articles, Submitted Again, 5 BEHAV. & BRAIN SCI. 187, 188-89 (1982). There was little awareness that the manuscripts had already been published, and nearly 90% of referees recommended rejecting the manuscript. Id. at 189-90. Whether peer review improves science vis-à-vis some alternative system (for example, publication with only ex post review) is unclear. As one study concluded, “[g]iven the widespread use of peer review and its importance, it is surprising that so little is known of its effects.” Tom Jefferson et al., Effects of Editorial Peer Review: A Systematic Review, 287 J. AM. MED. ASS’N 2784, 2785 (2002); see also J. Scott Armstrong, Peer Review for Journals: Evidence on Quality Control, Fairness, and Innovation, 3 SCI. & ENGINEERING ETHICS 63, 79 (1997) (“Efforts by journals to ensure quality and fairness through peer review have not been overly successful.”); Richard Smith, Peer Review: A Flawed Process at the Heart of Science and Journals, 99 J. ROYAL SOC’Y MED. 178, 179 (2006) (“People have a great many fantasies about peer review, and one of the most powerful is that it is a highly objective, reliable, and consistent process.”).
142. See Nanine A.E. van Gennip et al., Peer Assessment for Learning from a Social Perspective: The Influence of Interpersonal Variables and Structural Features, 4 EDUC. RES. REV. 41, 52 (2009).
143. See id. at 46 tbl.2. 144. Dennis L. Sun et al., Peer Assessment Enhances Student Learning: The Results of a Matched
Randomized Crossover Experiment in a College Statistics Class, PLOS ONE 3-4 (Dec. 18, 2015), http:/dx.doi.org/10.1371/journal.pone.0143177.

Peer Review 69 STAN. L. REV. 1 (2017)
27
exams (for example, a two-to-three percentage point increase in average exam scores) than students who were not subject to peer assessment.145
The strongest evidence in favor of peer review comes from the medical context, where researchers have carried out a series of randomized trials of coaching, peer teaching, and peer assessment.146 A study of fifty nursing students, for instance, found that peer teaching improved performance on a psychomotor and cognitive test of a surgical dressing procedure.147 Rooted in this evidence, Atul Gawande wrote in the New Yorker, “Coaching done well may be the most effective intervention designed for human performance.”148 Even here, however, one review concluded, “The paucity of randomized controlled outcome studies is perhaps the major shortcoming in the coaching literature.”149
* * *
For all its talk about experimentalism, democratic experimentalism has
never been subject to an actual randomized experiment. And despite its ubiquity as a proposed policy reform, we are not aware of a single randomized controlled trial of peer review in public governance. To be sure, such experiments are exceptionally challenging to design and implement due to practical, ethical, and political constraints. John Braithwaite explains: “On no issue have I met more resistance than in implementing randomized controlled trials of responsive justice interventions . . . .”150 But such trials are necessary
145. Id. at 4. 146. See, e.g., Peter Weyrich et al., Peer-Assisted Versus Faculty Staff-Led Skills Laboratory
Training: A Randomised Controlled Trial, 43 MED. EDUC. 113, 114-19 (2009); Tzu-Chieh Yu et al., Medical Students-as-Teachers: A Systematic Review of Peer-Assisted Teaching During Medical School, 2 ADVANCES MED. EDUC. & PRAC. 157, 162 tbl.3 (2011) (summariz-ing studies).
147. See Carroll L. Iwasiw & Dolly Goldenberg, Peer Teaching Among Nursing Students in the Clinical Area: Effects on Student Learning, 18 J. ADVANCED NURSING 659, 661-63 (1993).
148. Atul Gawande, Personal Best, NEW YORKER (Oct. 3, 2011), http://www.newyorker.com/magazine/2011/10/03/personal-best.
149. Anthony M. Grant et al., The State of Play in Coaching Today: A Comprehensive Review of the Field, 25 INT’L REV. INDUS. & ORGANIZATIONAL PSYCHOL. 125, 138 (2010); see also Heidi Schwellnus & Heather Carnahan, Peer-Coaching with Health Care Professionals: What Is the Current Status of the Literature and What Are the Key Components Necessary in Peer-Coaching?; A Scoping Review, 36 MED. TCHR. 38, 43 (2014) (“The literature within health care concerning peer-coaching is restricted by weak study designs . . . .”).
150. John Braithwaite, Fellow, Austl. Research Council Fed’n, Fasken Lecture at the University of British Columbia: The Essence of Responsive Regulation (Sept. 21, 2010), in 44 U.B.C. L. REV. 475, 512 (2011). While Braithwaite was discussing testing theories of responsive regulation, his statement applies equally to peer review and democratic experimentalism.
Peer Review 69 STAN. L. REV. 1 (2017)
28
when much of the scholarship “uses [a sample size] of 1 or data without a control group to assert confidently that this or that feature of responsive regulation clearly does not work.”151 And as Jerry Mashaw notes, “[c]areful design and testing . . . should precede policy choice.”152
II. Food Safety
This Part provides background on food safety regulation. Subpart A describes why food safety inspections, which experimentalists themselves point out as an area for experimentalist reform,153 provide an ideal test case for peer review. Because our study takes place in King County, Washington, Subparts B and C provide background on the statutory, regulatory, and institutional setting for food safety there at the state and county levels, respectively.
A. Inspection Systems as Fertile Testing Ground
The food safety inspection system provides an ideal test case for experi-mentalism’s premise for three reasons: high levels of decentralization and fragmentation, longstanding concerns about accuracy and consistency of frontline administration, and deep uncertainty about how to reduce risk.
First, the U.S. food safety system is highly fragmented and decentralized.154 By one count, fifteen federal agencies are responsible for administering thirty food safety laws.155 The U.S. Department of Agriculture’s (USDA’s) Food Safety and Inspection Service (FSIS) employs some eight thousand staff members across ten district offices156 to conduct meat,157 poultry,158 and egg product159
151. Id. at 513. “Responsive regulation” is the idea that actions by regulators—for example, persuasion versus sanction—should respond and be tailored to actions by regulated parties. Id. at 476.
152. MASHAW, BUREAUCRATIC JUSTICE, supra note 11, at 209. 153. See Sabel & Simon, supra note 94, at 83; see also Susanne Wengle, When Experimentalist
Governance Meets Science-Based Regulation: The Case of Food Safety Regulations, 10 REG. & GOVERNANCE 262 (2016).
154. See Note, Reforming the Food Safety System: What if Consolidation Isn’t Enough?, 120 HARV. L. REV. 1345, 1345-47, 1355 (2007) (noting that jurisdictional lines have sometimes led to inconsistent inspection procedures for comparable foods).
155. See U.S. GOV’T ACCOUNTABILITY OFFICE, GAO-15-290, HIGH-RISK SERIES: AN UPDATE 262 (2015).
156. See U.S. DEP’T OF AGRIC., FOOD SAFETY AND INSPECTION SERVICE: PROTECTING PUBLIC HEALTH AND PREVENTING FOODBORNE ILLNESS 7, 11 (2013).
157. See 21 U.S.C. §§ 601-695 (2015). 158. See id. §§ 451-472. 159. See id. §§ 1031-1056.

Peer Review 69 STAN. L. REV. 1 (2017)
29
inspections at roughly six thousand establishments.160 The Food and Drug Administration (FDA) promulgates food safety regulations, investigates instances of foodborne illnesses, and conducts a limited number of inspections of domestic and foreign food facilities that export food to the United States.161 Of the approximately 167,000 domestic- and 254,000 foreign-registered facilities that existed in 2011, the FDA inspected roughly 11% and 0.4%, respectively.162 Food-producing facilities have also increasingly relied on third-party auditors to ensure compliance with FDA standards, with little federal oversight and substantial heterogeneity in standards.163
As a practical matter, states, counties, and localities play an outsized role in implementing and ensuring food safety compliance. The FDA increasingly contracts with states to conduct food facility inspections on its behalf.164 In 2009, the FDA contracted with forty-one states, which performed roughly 60% of the FDA’s food facility inspections.165 An Inspector General report documented “significant weaknesses in FDA’s oversight,” finding for instance that eight states simply failed to conduct the required number of inspections.166 Due to a failed proposal in 1976 to federalize restaurant inspections,167
160. See U.S. DEP’T OF AGRIC., supra note 156, at 7. 161. A food facility is one “that manufactures/processes, packs, or holds food for
consumption,” 21 C.F.R. § 1.227(b)(2) (2016), but does not include farms, restaurants, or retail food establishments, id. § 1.226(b)-(d).
162. See U.S. Food & Drug Admin., 2012 Annual Report on Food Facilities, Food Imports, and FDA Foreign Offices, U.S. DEP’T HEALTH & HUM. SERVS. (Aug. 2012), http://www.fda.gov/Food/GuidanceRegulation/FSMA/ucm315486.htm. Percentages are calculated by dividing the number of inspections reported for domestic and foreign facilities by the total number of facilities for each type.
163. See D.A. Powell et al., Audits and Inspections Are Never Enough: A Critique to Enhance Food Safety, 30 FOOD CONTROL 686, 687 (2013) (“The popularity of third-party audits has increased corresponding to a shift in food safety governance away from government regulation and inspection toward the development of private food safety standards. . . . [T]he effectiveness of both audits and inspections is driven largely by observational judgment and consistency of the inspector or auditor.”); Stephanie Armour et al., Food Sickens Millions as Company-Paid Checks Find It Safe, BLOOMBERG MKTS. (Oct. 11, 2012, 12:00 AM), http://www.bloomberg.com/news/articles/2012-10-11/food-sickens-millions-as-industry-paid-inspectors-find-it-safe (“The food industry hires for-profit inspection companies—known as third-party auditors—who aren’t required by law to meet any federal standards and have no government supervision.”).
164. In 2011, $25 million of approximately $190 million appropriated for inspecting registered food facilities went toward the states. See U.S. Food & Drug Admin., supra note 162.
165. See OFFICE OF INSPECTOR GEN., U.S. DEP’T OF HEALTH & HUMAN SERVS., OEI-02-09-00430, VULNERABILITIES IN FDA’S OVERSIGHT OF STATE FOOD FACILITY INSPECTIONS, at i-ii (2011).
166. Id. at ii-iii. 167. See U.S. FOOD & DRUG ADMIN., U.S. DEP’T OF HEALTH, EDUC. & WELFARE, FOOD SERVICE
SANITATION MANUAL 74-75 (1976).

Peer Review 69 STAN. L. REV. 1 (2017)
30
inspecting these establishments is nearly exclusively a local affair.168 To be sure, the FDA revises a Model Food Code every few years, but states vary widely in the version of the Food Code adopted,169 citing substantial costs of adopting each revision.170 Counties and cities bear the large brunt of funding, staffing, interpreting, adapting, and implementing the health code.
The result of such decentralization and loose federal oversight is that there is wide heterogeneity in the design of inspection regimes. For instance, while the FDA recommends a default of at least two inspections per year,171 actual frequencies can vary from less than one to four inspections per year,172 and the number of establishments assigned to an inspector can vary from 120 to 880.173
Food safety is also a good testing ground for experimentalism because questions of accuracy and consistency have long haunted food inspections. In
168. The FDA conducts small, unscored random samples of restaurant inspections across the United States, but these efforts are quite limited in scope. See U.S. FOOD & DRUG ADMIN. NAT’L RETAIL FOOD TEAM, FDA REPORT ON THE OCCURRENCE OF FOODBORNE ILLNESS RISK FACTORS IN SELECTED INSTITUTIONAL FOODSERVICE, RESTAURANT, AND RETAIL FOOD STORE FACILITY TYPES 15, 17 (2009). The FDA also aids with foodborne illness investigations. See U.S. Food & Drug Admin., 2013 Annual Report on Food Facilities, Food Imports, and FDA Foreign Offices, U.S. DEP’T HEALTH & HUM. SERVS. (Nov. 2013), http://www.fda.gov/Food/GuidanceRegulation/FSMA/ucm376478.htm.
169. See Ass’n of Food & Drug Officials, Real Progress in Food Code Adoption 1-3 (2015), http://www.fda.gov/downloads/Food/GuidanceRegulation/RetailFoodProtection/FoodCode/UCM476819.pdf (finding states adopting the 1995, 1997, 1999, 2001, 2005, 2009, or 2013 Model Food Code).
170. See OFFICE OF INSPECTOR GEN., U.S. DEP’T OF HEALTH & HUMAN SERVS., OEI-05-00-00540, RETAIL FOOD SAFETY 11-12 (2001), https://oig.hhs.gov/oei/reports/oei-05-00-00540.pdf (“Sixteen of 34 States that did not update their codes . . . indicated that the length of time and the difficulty of the adoption process inhibits them from updating their code every 2 years.”).
171. See 2013 FOOD CODE, supra note 41, ¶ 8-401.10(A), at 210. The FDA also allows classifying establishments by risk, which determines inspection frequency (for example, high risk establishments might receive two inspections per year, but low risk establishments might receive one inspection per year). See 2013 FOOD CODE, supra note 41, at annex 5 § 3(A) & tbl.1, at 590-91.
172. See THOMAS PEACOCK, IS IT SAFE TO EAT OUT?: HOW OUR LOCAL HEALTH OFFICIALS INSPECT RESTAURANTS TO ASSURE SAFE FOOD . . . OR DO THEY? 65 (2002).
173. See id. at 67-68. In 2012, of the top twenty metropolitan areas, eleven deviated from the FDA by using numerical scoring. Ho, supra note 47, at 601-03, 602 tbl.1. And of eight jurisdictions using a 100-point scale, the threshold to trigger a return visit varied from 70 to 90 points. Id. at 602 tbl.1. Jurisdictions also vary considerably in classifying a violation “critical” on the inspection scoring sheet in spite of the FDA Model Food Code’s classification. We collected and analyzed the score sheets of nearly forty large metropolitan areas (on file with the Author) and coded whether the score sheet clearly denoted whether a violation was a critical one. Of the twenty-seven violations that the FDA considers critical, only one (for food additives) is clearly marked as critical by more than 90% of the jurisdictions in which the violation exists. Two violations (lack of clean food surfaces and presence of toxic substances) are marked as critical by less than 55% of the jurisdictions where scored.

Peer Review 69 STAN. L. REV. 1 (2017)
31
many local agencies, inspectors possess relatively little experience and staff turnover can be acute.174 Because the system is so localized, health code adaptations, inspection score sheets, inspection frequency, training materials, guidance documents, and supervision vary dramatically across and even within jurisdictions.175 Inspections are conducted on the premises of an establishment, making direct supervision very costly. Detecting the failure to cite a violation (Type II error) is nearly impossible without a peer on the ground. Conducting the inspection itself can be an “extremely complex task” due to the intricacies of the Food Code, engagement with operators, divergent conditions in establishments, and innovation in food preparation techniques.176
The 2013 FDA Model Food Code, for instance, spans over seven hundred pages and is filled simultaneously with complex rules and vague standards. One rule instructs inspectors to follow a seven-question decision tree, ultimately leading to a 3 × 3 or 4 × 4 matrix of pH level and water activity (aw) values to assess time/temperature controls.177 On the standards side, when is an employee “changing tasks” to trigger the handwashing requirement?178 What does it mean for a handwashing facility to be “blocked”?179 When has an operator “respond[ed] correctly to the inspector’s questions as they relate to the specific food operation”?180 The FDA recommends a top-down “standardiza-tion” model (often dubbed “FDA standardization”) of food inspectors, which consists of an initial performance and training audit comprising eight joint field inspections conducted within the first year, followed by six reinspections
174. See, e.g., SAN MATEO CTY. CIVIL GRAND JURY, FOOD INSPECTION IN SAN MATEO COUNTY 2 (2004), https://www.sanmateocourt.org/documents/grand_jury/2003/food _inspection_smc.pdf (finding the average inspector leaves in about three years); Jon Marcus, Inexperience Hinders Restaurant Inspections, SUN SENTINEL (Fort Lauderdale) (Sept. 8, 1985), http://articles.sun-sentinel.com/1985-09-08/news/8502060759_1_health-inspectors-restaurant-trouble-spots (attributing high turnover to low salaries); Mike Perlstein, Investigation Questions Restaurant Inspections, WWLTV (July 13, 2016, 11:19 PM CDT), http://www.wwltv.com/news/investigations/investigation -questions-restaurant-inspection-process/272326602 (noting that staff turnover can account for many redundant inspections).
175. See Ho, supra note 47, at 601-03, 602 tbl.1; Harlan Stueven, Challenges of Health Department Food Safety Inspections, FOOD SAFETY MAG. (July 16, 2013), http://www.foodsafetymagazine.com/enewsletter/challenges-of-health-department -food-safety-inspections (“[N]ational chains need to follow guidelines that vary state-by-state and municipality-by-municipality.”).
176. A.C. Johnson et al., Factors that Influence Whether Health Inspectors Write Down Violations on Inspection Reports, 34 FOOD PROTECTION TRENDS 226, 226, 228, 236 (2014).
177. 2013 FOOD CODE, supra note 41, ¶ 1-201.10(B) annex 3, at 334-39, 339 tbls.A & B. 178. Id. ¶ 2-301.14(F), at 47-48. 179. Id. ¶ 5-204.11 annex 3, at 519. 180. Id. ¶ 2-102.11(C), at 26 (formatting altered).

Peer Review 69 STAN. L. REV. 1 (2017)
32
every three years after that.181 But the model does not appear to be widely adopted.182 In practice, implementing the Food Code can be a matter of tremendous discretion on the ground. As Peter Schuck noted of meat inspectors (and as others assert of prosecutors183), “if all meat-inspection regulations were enforced to the letter, no meat processor in America would be open for business. . . . [T]he inspector is not expected to enforce strictly every rule, but rather to decide which rules are worth enforcing at all.”184
Empirical evidence corroborates the notion that inspection outcomes “ha[ve] more to do with who the inspector is than what the restaurant is, or is not, doing.”185 In Wisconsin, only half of inspectors were even aware of a change in state packaging regulations.186 A Florida study showed “[t]he range
181. See U.S. FOOD & DRUG ADMIN., U.S. DEP’T OF HEALTH & HUMAN SERVS., FDA PROCEDURES FOR STANDARDIZATION OF RETAIL FOOD SAFETY INSPECTION OFFICERS ¶¶ 3-103(A) to (B), at 10-11 (updated ed. 2010) (formatting altered). As evidence of the model’s top-down approach, the inspector takes the lead in all inspections, and the standardiza-tion manual expressly provides that standardization “is not a joint training exercise. It is an assessment with an auditing and training component.” Id. ¶¶ 3-301(A)(1) to (2), at 14.
182. For instance, in a focus group study of forty-two environmental health specialists, only 36% reported having received certification by the FDA standardization procedures. See Laura Green & Carol Selman, Environmental Health Specialists’ Practices and Beliefs Concerning Restaurant Inspections, Presentation at the 92d Annual International Association for Food Protection 3, 4 tbl.1 (Aug. 14-17, 2005), https://www.researchgate.net/publication/228795805.
183. See, e.g., Glenn Harlan Reynolds, Ham Sandwich Nation: Due Process When Everything Is a Crime, 113 COLUM. L. REV. SIDEBAR 102, 104 (2013) (“The result of overcriminalization is that prosecutors no longer need to wait for obvious signs of a crime. . . . [Because] everyone is a criminal if prosecutors look hard enough, they are guaranteed to find something eventually.”).
184. Peter Schuck, The Curious Case of the Indicted Meat Inspectors: Lambs to Slaughter, HARPER’S MAG., Sept. 1972, at 81, 82 (emphasis omitted).
185. Andrew Do, Opinion, Why Restaurant Letter Grades Wouldn’t Boost Public Safety, ORANGE COUNTY REG. (July 26, 2015, 12:00 AM), http://www.ocregister.com/articles/restaurants-673757-restaurant-grading.html (discussing differences in grades based on inspection outcomes); see also Timothy F. Jones et al., Restaurant Inspection Scores and Foodborne Disease, 10 EMERGING INFECTIOUS DISEASES 688, 689 (2004) (reporting that in Tennessee, average inspection scores for inspectors ranged from 69 to 92 points in a 100-point system); Carol A. Selman & Laura R. Green, Environmental Health Specialists’ Self-Reported Foodborne Illness Outbreak Investigation Practices, J. ENVTL. HEALTH, Jan./Feb. 2008, at 16, 17-19 (showing, based on a random sample of officials, substantial variability in how foodborne illness investigations were conducted, with several investigators simply conducting routine inspections as opposed to investigations of specific causes even though routine inspections are less likely to identify the cause of outbreaks); supra notes 41-47 and accompanying text.
186. See Anthony Anderson, Food Safety Inspection Officers’ Awareness of Reduced Oxygen Packaging (ROP) Requirements in Wisconsin, 73 J. ASS’N FOOD & DRUG OFFICIALS (SPECIAL EDITION) 15, 17 (2013) (assessing food inspectors’ awareness of a change in ROP requirements).

Peer Review 69 STAN. L. REV. 1 (2017)
33
of . . . inspector . . . effects [to be] huge.”187 In Indiana, researchers found that inspector differences explained some 34% of variation in inspection scores188 and that the probability of a violation being detected varied from 0% to 47.9% across inspectors.189 What was said of the Patent and Trademark Office can be said of food safety: there may be as many food safety regimes as food safety inspectors.
Finally, food safety provides a good testing ground for experimentalism because while food safety has considerable effects on the U.S. population, there is deep uncertainty about how to most effectively protect the public. Each year, the best estimates suggest that 48 million people get sick from foodborne diseases, 128,000 are hospitalized, and 3000 die.190 The Department of Agriculture estimates that the economic cost of foodborne illness from the most common known foodborne pathogens stands at $14-16 billion per year.191 The elderly, young, immune-compromised, and pregnant are at particularly acute risk.192 The system is hence ripe for invention, reform, and improvement. Most sources of foodborne illness are never identified,193 as underreporting194 and misreporting195 are rampant and diagnosing and
187. Jin & Lee, supra note 47, at 3, 19. 188. See Ji-Eun Lee et al., The Impact of Individual Health Inspectors on the Results of Restaurant
Sanitation Inspections: Empirical Evidence, 19 J. HOSPITALITY MARKETING & MGMT. 326, 337 (2010).
189. See Ji-Eun Lee et al., Health Inspection Reports as Predictors of Specific Training Needs, 31 INT’L J. HOSPITALITY MGMT. 522, 525 (2012).
190. See Div. of Foodborne, Waterborne & Envtl. Diseases, Ctrs. for Disease Control & Prevention, CDC Estimates of Foodborne Illness in the United States (2011), http://www.cdc.gov/foodborneburden/pdfs/factsheet_a_findings_updated4-13.pdf.
191. See SANDRA HOFFMAN & TOBENNA D. ANEKWE, U.S. DEP’T OF AGRIC., EIB-118, MAKING SENSE OF RECENT COST-OF-FOODBORNE-ILLNESS ESTIMATES 10-14, 13 tbl.3 (2013), http://www.ers.usda.gov/media/1204379/eib118.pdf.
192. U.S. Food & Drug Admin., U.S. Dep’t of Health & Human Servs., Foodborne Illness: Especially Dangerous for the Vulnerable 1 (2013), http://www.fda.gov/downloads/ForConsumers/ConsumerUpdates/UCM355228.pdf.
193. See Elaine Scallan et al., Foodborne Illness Acquired in the United States—Major Pathogens, 17 EMERGING INFECTIOUS DISEASES 7, 7 (2011) (noting that only a small proportion of foodborne illnesses are confirmed by laboratory testing).
194. See S. Palmer et al., Problems in the Diagnosis of Foodborne Infection in General Practice, 117 EPIDEMIOLOGY & INFECTION 479, 480-84 (1996) (finding that most patients suffering from gastrointestinal illness—including those suffering from food poisoning—did not report their symptoms to their doctors); James Andrews, Outbreak Case Counts: Why Official Numbers Fall Far Below Estimates, FOOD SAFETY NEWS (Apr. 3, 2014), http://www.foodsafetynews.com/2014/04/outbreak-case-counts-why-official -numbers-fall-far-below-estimates/#.V72RspMrJPM (“While there are numerous factors that play into th[e] estimates [of unreported cases of food poisoning], one thing is certain: For every person officially counted as part of an outbreak, far more cases go unnoticed.”).

Peer Review 69 STAN. L. REV. 1 (2017)
34
tracing sources can be quite challenging.196 The GAO classified the food safety system as “high risk” due to “inconsistent oversight, ineffective coordination, and inefficient use of resources.”197 Nearly half of food expenditures go to restaurant dining,198 four out of ten Americans eat out on any particular day,199 and 60% of outbreaks have been attributed to restaurant food.200 Local inspection systems—and innovation within them—are thus a critical part of the food safety system.
B. Washington State
In 2014, King County reached out to me seeking advice on interventions to improve its food safety program.201 Here, we provide some background on the role of Washington State in food safety enforcement. The state has been following the FDA Model Food Code since 2005 and adopted the 2009 version in 2012.202 The State Department of Health plays largely a coordination and training role in administering the food safety regime.203
195. See Zoe Cormier, 3 Myths About Food Poisoning You Should Stop Believing, BEST HEALTH (July 2011), http://besthealthus.com/diet-weight/healthy-eating/food-poisoning -myths (“Food-borne illnesses can occur within a few hours of ingesting a meal, but most cases happen within two to five days—others can take weeks or even months to cause symptoms. The cause of what ails you may never be known, so don’t be so quick to think the local pizzeria has a dirty kitchen.”).
196. See John J. Guzewich, No Quick Fixes for Outbreak Surveillance and Response, FOOD SAFETY NEWS (Mar. 22, 2012), http://www.foodsafetynews.com/2012/03/challenges-to -foodborne-disease-outbreak-surveillance-response/#.V5zA_SMrLq0.
197. U.S. GOV’T ACCOUNTABILITY OFFICE, supra note 155, at 262 (capitalization altered); see also Ron Nixon, Obama Proposes Single Overseer for Food Safety, N.Y. TIMES (Feb. 20, 2015), http://nyti.ms/17Cq0ZZ.
198. HAYDEN STEWART ET AL., U.S. DEP’T OF AGRIC., EIB-19, LET’S EAT OUT: AMERICANS WEIGH TASTE, CONVENIENCE, AND NUTRITION 1 (2006).
199. See Timothy F. Jones & Frederick J. Angulo, Eating in Restaurants: A Risk Factor for Foodborne Disease?, 43 CLINICAL INFECTIOUS DISEASES 1324, 1324 (2006).
200. See DIV. OF FOODBORNE, WATERBORNE & ENVTL. DISEASES, CTRS. FOR DISEASE CONTROL & PREVENTION, SURVEILLANCE FOR FOODBORNE DISEASE OUTBREAKS, UNITED STATES, 2013: ANNUAL REPORT 3 (2015). To be sure, the 60% figure may overstate the actual proportion of foodborne illnesses from restaurants, as illnesses involving restaurants are also more likely to be subject to an investigation.
201. For more background on how we developed the intervention, see Improving Governance by Peer Review: Food Safety and Beyond, STAN. L. SCH.: LEGAL AGGREGATE (July 6, 2016), https://law.stanford.edu/2016/07/06/improving-governance-by-peer-review-food -safety-and-beyond.
202. WASH. ADMIN. CODE § 246-215-01100 (2016). The State Board of Health is required to consider the most recent version of the FDA’s Model Food Code when setting standards for food service. See WASH. REV. CODE § 43.20.145(1) (2016). Beginning in 2010, a workgroup studied the 2009 Model Food Code and created a draft rule, which the State Board of Health adopted in 2012. See Joe Graham, State Food Code Undergoes Revision, WASH. RESTAURANT MAG., Winter 2012, at 10, 10. The last revision had been
footnote continued on next page

Peer Review 69 STAN. L. REV. 1 (2017)
35
The state score sheet and accompanying marking instructions, contrary to the FDA Model Food Code but like those of many other jurisdictions, use numerical scoring of violations.204 The state divides violations into two types. First, the twenty-seven red (or critical) violations—such as the failure to maintain proper temperatures, wash one’s hands, and store food to prevent cross-contamination—present the highest risk of foodborne illness.205 Each red violation item is assigned a fixed value from five to twenty-five points.206 Second, twenty-three blue violations are “maintenance and sanitation issues that are not likely to be the cause of a food borne illness,”207 such as improper food labeling and poor condition of physical facilities. Each blue violation item is assigned a fixed value from two to five points.208 Point thresholds for closing or conducting a return inspection on an establishment are set locally by counties, based principally on the sum of red points.209 In King County, for
in 2005, when the state adopted the 2001 Model Food Code. Wash. State Dep’t of Health, Washington Food Rule: Revision 2005 (2004), http://www.co.thurston.wa.us/health/ehfood/pdf/WA2005FoodRuleChangeBro.pdf.
203. Four food safety specialists at the state level coordinate working groups to consider revisions to the State Administrative Code, develop the inspection score sheet that is used as a model throughout the state, provide occasional clarification on statutory and regulatory interpretation, conduct annual one-day educational workshops for food safety regulators, teach a three-day class for newly hired inspectors, lead multicounty foodborne illness investigations, and coordinate internal safety protocols for chain establishments operating across county lines. E-mail from Joe M. Graham, Food Safety Program Supervisor, Wash. Dep’t of Health, to Daniel E. Ho, Professor of Law, Stanford Law Sch. (Mar. 23, 2016, 4:42 PM) (on file with author); see also Dave Gifford, Food Rule Revision Process (2004), http://safefood.wsu.edu/Presentations/FTTPresentations/Gifford_FTT04.pdf.
204. Pub. Health: Seattle & King Cty., Food Establishment Inspection Report: Form A (2013), http://www.kingcounty.gov/healthservices/health/ehs/foodsafety/inspections/~/media/health/publichealth/documents/foodsafety/inspectionform.ashx [hereinafter Form A]. The FDA Model Food Code does not rely on any numerical scores. See Ho, supra note 47, at 590 n.101 (describing the FDA’s rejection of a 100-point scoring scale).
205. Form A, supra note 204. 206. While formally there are twenty-seven red violations, two violations are disaggregated
based on the severity: (1) a proper hot holding temperature violation of < 130°F is scored at 25 points, while temperature between 130-134°F is scored at 5 points; (2) a proper cold holding temperature violation of > 45°F is scored at 10 points, while temperature between 42-45°F is scored at 5 points. Because these are exclusively scored, our data analysis treats these as distinct violations, making for a total of twenty-nine unique red violations. See id.
207. Inspection Reporting System, KING COUNTY, http://www.kingcounty.gov/healthservices/health/ehs/foodsafety/inspections/system.aspx (last updated Feb. 4, 2011).
208. See Form A, supra note 204. 209. For instance, from 1997 to 2007, King County had return and closure thresholds of 35
and 75 red points, respectively. E-mail from Phil Wyman, Health & Envtl. Investigator, King Cty. Dep’t of Pub. Health, to Daniel E. Ho, Professor of Law, Stanford Law Sch. (Oct. 5, 2015, 11:40 AM) (on file with author). From 2007 to 2010, these were changed to
footnote continued on next page

Peer Review 69 STAN. L. REV. 1 (2017)
36
instance, return and closure thresholds currently are set at 35 and 90 red points, respectively.210
State law enables the operation of joint county-city health departments, governed by a board of health, to enforce public health statutes and regulations.211 Thirty-one county health departments, three multicounty health districts,212 and two city-county health departments, covering Washington’s thirty-nine counties, implement the bulk of food safety enforcement measures.213 King and Pierce Counties comprise nearly 41% of the population of Washington State, and the King County Food Program is the state’s largest public health program.214 Maintaining consistent enforcement, however, is a challenge both within and across health jurisdictions.215
45 and 90 red points, respectively. See id. Since 2010, the thresholds have been 35 and 90 red points, respectively. See id. Clark County maintains return and closure thresholds of 35 and 60 points, respectively. Restaurant Inspections, CLARK COUNTY PUB. HEALTH, https://www.clark.wa.gov/public-health/restaurant-inspection (last visited Jan. 1, 2017).
210. When Public Health Investigates a Food Establishment, KING COUNTY, http://www.kingcounty.gov/healthservices/health/ehs/foodsafety/inspections/mock2.aspx (last updated Mar. 18, 2013). Closures can occur for five reasons: (1) an imminent health hazard, such as a sewage backup; (2) receiving 90 or more red points during an inspection; (3) three repeat red violations within twelve months; (4) receiving 120 or more combined red and blue points; or (5) an expired operation permit. Id.
211. WASH. REV. CODE § 70.08.010 (2016). By default, the director of the health department is appointed by the county executive and mayor of the city, subject to confirmation by the county council and city council and removable by the county executive after consultation with the mayor and a “statement of reasons” provided to the county and city councils. Id. § 70.08.040.
212. Such multicounty health districts may be formed by a joint resolution of two or more boards of county commissioners. See id. § 70.46.020.
213. See Washington’s Public Health System, WASH. ST. DEP’T HEALTH, http://www.doh.wa.gov/AboutUs/PublicHealthSystem (last visited Jan. 1, 2017).
214. This calculation is based on 2010 U.S. Census total population figures. See QuickFacts: Washington, U.S. CENSUS BUREAU, http://www.census.gov/quickfacts/table/PST045215/53,53053,53033 (last visited Jan. 1, 2017); see also PUB. HEALTH: SEATTLE & KING CTY., KING COUNTY FOOD PROTECTION PROGRAM REVIEW: FINAL REPORT 1 (2014), http://www.kingcounty.gov/healthservices/health/ehs/foodsafety/~/media/health/publichealth/documents/foodsafety/KCFoodProgramReview.ashx.
215. See supra Part II.A.

Peer Review 69 STAN. L. REV. 1 (2017)
37
Figure 1
INSERT FIGURE 1 HERE Density of restaurants in King and Pierce Counties. The dark line divides the two counties, and each cell represents the number of restaurants in that 0.25-square-mile area. For ease of visibility and due to the low density of establishments in the eastern parts of King County and in the southeastern parts of Pierce County, the map focuses on high-density areas. Red dots represent the locations for King County’s downtown office in Seattle and Eastgate office in Bellevue and Pierce County’s office in Tacoma.
SeattS eeaaaaattttleeeeeeeeeaaaaattttleeeeeSeSSeeeeeaattttleeeee
KentKentKe t
BellevueueBBBBBBBBBB lleeevvueel evuBBBB lll
SeaTacSSeeaaTTTaaccSSeeaaTTaaccTTTP
uget
Sou
ndS
P
TacomamTTTaaccoommmmmaaaTTTaaccoommmmaTTT
shon Islandslhhon IsIIVasass
King County
Pierce County
●
●
●
<1010−2020−40
>40
No. Restaurants
5 miles
Washington
Pierce
King
Peer Review 69 STAN. L. REV. 1 (2017)
38
C. King and Pierce Counties
1. King County216
With over two million residents,217 King County, home to Seattle, is the most populous county in Washington State and the thirteenth-most populous in the country.218 King County’s Department of Public Health is a combined city-county department219 with roughly 1500 employees and an annual budget of $318 million.220 Budgetary control rests in the County Council and City Council.221 The food safety program was established in 1894222 and is located in the Department’s Environmental Health Services Division.223
The Board of Health224 has adopted the Washington State Health Code, with additions covering calorie labeling, mobile food trucks, and temporary
216. Institutional details of King County’s food program stem in part from conversations, visits, and phone calls with many members of the King County staff. While we cite to publicly available sources wherever possible, this is not feasible in all instances. For instance, there is no public document indicating the general practice that King County inspectors have discretion over which establishments to visit. Reporting these facts is nonetheless important for understanding the institutional environment.
217. See QuickFacts: King County, Washington, U.S. CENSUS BUREAU, http://www.census.gov/quickfacts/table/PST045215/53033 (last visited Jan. 1, 2017) (estimating the 2015 population of King County at 2,117,125).
218. The 25 Largest Counties in the United States in 2015, by Population (in Millions), STATISTA, http://www.statista.com/statistics/241702/largest-counties-in-the-us (last visited Jan. 1, 2017).
219. The director of the department is appointed by the Mayor of Seattle and the King County Executive (a four-year elected official), subject to confirmation by the Seattle City Council and the King County Council. See KING COUNTY, WASH., CODE § 2.35A.010(A)(2) (2016), http://aqua.kingcounty.gov/council/clerk/code/05_Title _2.htm. The County Executive may remove the director after consultation with the mayor and with justification presented to the City and County Councils. Id.
220. About Us, KING COUNTY, http://www.kingcounty.gov/healthservices/health/about/description.aspx (last updated Feb. 16, 2016).
221. See KING COUNTY, WASH., CODE § 2.35.051, http://aqua.kingcounty.gov/council/clerk/code/05_Title_2.htm.
222. See Charles F. Kleeberg, Address to Environmental Health Conference: History of Environmental Health 3 (Mar. 29, 1989) (describing how local public health issues motivated the City Council to implement a garbage service and plumbing, food, milk, and meat programs at the turn of the century).
223. See Food Protection Program, KING COUNTY, http://www.kingcounty.gov/healthservices/health/ehs/foodsafety.aspx (last updated May 16, 2016).
224. The Board comprises three members of the King County Council (an elected legislative body), three elected officials from the City of Seattle, two elected officials from other cities, two health professionals appointed by the Board, and possibly one nonvoting health professional appointed by the Board. KING COUNTY, WASH., CODE § 2.35.021, http://aqua.kingcounty.gov/council/clerk/code/05_Title_2.htm. The Board appoints a
footnote continued on next page

Peer Review 69 STAN. L. REV. 1 (2017)
39
events (for example, farmer’s markets).225 The Board also sets the fee schedule for required establishment permits, classifies establishments by risk, and determines the minimum number of inspections by risk type.226
Three basic inspections exist for food establishments. Routine inspections are unannounced, scored inspections.227 Return inspections are typically conducted within two weeks after the first inspection when a routine inspection results in thirty-five or more red points.228 Educational inspections are unscored visits that provide opportunities for inspectors to educate establishments about sanitation practices.229 Frontline inspectors are assigned a geographic area and rotated once every few years. Many inspectors are also assigned pool and spa inspections, typically conducted in the summer.230 The annual performance target for inspectors is 870 routine and educational visits, but inspectors retain discretion over how many and which establishments to visit on any given day.231
As permitted under the FDA Model Food Code, the frequency of inspec-tions is based on a three-part risk classification at the time of permitting.232 Risk I (low risk) establishments have limited food preparation (for example, grocery stores with cold-held ready-to-eat sandwiches) and are subject to one routine inspection per year. Risk II (medium risk) establishments have food processing steps that can include limited food preparation (for example, on-site
local health officer—a physician with no formal term limit—to enforce statutes and regulations. WASH. REV. CODE §§ 70.05.040, -.050, -.070(1) (2016).
225. See KING COUNTY, WASH., BOARD OF HEALTH CODE § 5.02.025 (2016), http://www.kingcounty.gov/depts/health/board-of-health/code.aspx (adopting state health code); id. § 5.10.015 (calorie labeling); id. § 5.34 (mobile food units); id. § 5.42 (temporary events).
226. See id. § 2.10.020 & tbl.1 (permit fee schedule); id. § 5.64.010 (food establishment risk categories); LAINA POON ET AL., KING CTY. AUDITOR’S OFFICE, NO. 2013-06, PERFORMANCE AUDIT OF ENVIRONMENTAL HEALTH SERVICES app. 1, at 19-20 (2013), http://www.kingcounty.gov/~/media/depts/auditor/new-web-docs/2013/2013-ehs/ ehs-final-2013.ashx?la=en (minimum number of inspections by risk type).
227. See When Public Health Investigates a Food Establishment, supra note 210. 228. See id.; see also What the Food Inspection Terms We Use Mean, KING COUNTY,
http://www.kingcounty.gov/healthservices/health/ehs/foodsafety/inspections/ FoodTerms.aspx (last updated Apr. 7, 2009) (describing return inspections).
229. POON ET AL., supra note 226, app. 1, at 20. 230. See PUB. HEALTH—SEATTLE & KING CTY., ENVIRONMENTAL HEALTH SERVICES ANNUAL
REPORT 3 (2009), https://www.kingcounty.gov/healthservices/health/ehs/~/media/health/publichealth/documents/ehs/EHS2009AnnualReport.ashx.
231. POON ET AL., supra note 226, at 14. 232. See Risk Levels and Permit Classifications, KING COUNTY, http://www.kingcounty.gov/
healthservices/health/ehs/foodsafety/FoodBusiness/RiskLevelsPermitClassifications.aspx (last updated Feb. 18, 2014); see also 2013 FOOD CODE, supra note 41, ¶ 8-401.10(B)(2).

Peer Review 69 STAN. L. REV. 1 (2017)
40
baking and smoothies) and are subject to one routine and one educational visit per year. Risk III (high risk) establishments comprise the vast majority of full-service restaurants and are subject to two routine inspections and one educational visit per year.233 Annual permit fees range from $380 to $1158, based on risk category and seating capacity (for example, the permit fee for a Risk III restaurant with thirteen to fifty seats is $868).234 King County does not generally assess penalties for violations.235 The county can charge half of the permit fee for a repeat inspection and the full fee for reopening after a closure.236
The Environmental Health Services Division houses numerous programs, including hazardous waste management, drinking water, and chemical hazards programs.237 The Food Protection and Water Recreation Protection program (the food safety program) is the largest program within the division, with fifty-five employees238 and an annual budget of roughly $11 million.239 It is supported principally by permitting fees and oversees more than 11,000 permitted food establishments.240 The program is run by a manager appointed by the director of the Division to a nonunion career service position.241 Within the program, there are three inspection units, each headed by a supervisor.242 Two of the units are located in the central office in downtown Seattle, and the third is in the Eastgate office in Bellevue, the second-largest
233. See Risk Levels and Permit Classifications, supra note 232. 234. Pub. Health: Seattle & King Cty., Food Protection Program Service Fees: 2016 (2015),
http://www.kingcounty.gov/healthservices/health/ehs/~/media/health/publichealth/documents/ehs/fees/food-establishment-fees.ashx.
235. See Phuong Cat Le, Restaurant Inspections Skipped, Fines for Infractions Infrequent, SEATTLE POST-INTELLIGENCER (July 8, 2004, 10:00 PM), http://www.seattlepi.com/local/article/Restaurant-inspections-skipped-fines-for-1149005.php (noting that in 2003, public health officials levied only two civil penalties against food establishments and many restaurants only paid a reinspection fee when they failed to fix repeat violations).
236. See id. 237. See Learn About the Work of Environmental Health Services, KING COUNTY,
http://www.kingcounty.gov/healthservices/health/ehs/overview.aspx (last updated June 20, 2012).
238. See PUB. HEALTH: SEATTLE & KING CTY., supra note 214, at 1. Fifty-five employees are responsible for permitting and inspecting more than 11,000 permanent food businesses, id., but the number of establishments has since grown to 11,500.
239. Telephone Interview with Becky Elias, Food & Facilities Manager, Dep’t of Pub. Health, Seattle & King Cty. (Feb. 7, 2016).
240. See PUB. HEALTH: SEATTLE & KING CTY., supra note 214, at 1. 241. Telephone Interview with Becky Elias, supra note 239. 242. See PUB. HEALTH: SEATTLE & KING CTY., supra note 214, at 20.

Peer Review 69 STAN. L. REV. 1 (2017)
41
city in the county.243 Figure 1 above plots the density of restaurants and food program office locations (in red dots) in the county.
The frontline staff is comprised of Health and Environmental Investiga-tors (HEIs), graded into four categories.244 All HEIs are unionized, with a salary, supervision, and vacation schedule set out in the collective bargaining agreement.245 HEIs may be disciplined and terminated “for just cause,”246 although no employee has been terminated for poor performance per se in recent history.247 HEI I is an entry-level position with a starting salary of around $59,000.248 HEI Is have not yet completed state or professional environmental health certification249 or “[a] twelve (12) month probationary period,”250 required to be promoted to HEI II. Training typically takes several months and involves the completion of an online course, a one-day workshop, a review of code materials, and an employee log recording the trainee’s observation of twenty-five professional inspections as well as twenty-five inspections conducted by the trainee under supervision of others.251 HEI Is and IIs (the “frontline inspectors”) conduct the bulk of routine and educational field inspections, typically via a computer tablet system, and investigate complaints. HEI II salaries range from around $70,000 to $89,000 based on a ten-step system.252 Salary and step increases “shall be granted” in twelve-month service
243. See id.; April 15, 2015 Population of Cities, Towns and Countries, WASH. ST. OFF. FIN. MGMT. FORECASTING DIVISION, http://www.kingcounty.gov/~/media/depts/executive/performance-strategy-budget/ regional-planning/Demographics/KC-CitiesPop2015OFM.ashx?la=en (last visited Jan. 1, 2017).
244. Agreement Between King County and Professional and Technical Employees Local 17 add. A, at 78 (2015-2016) [hereinafter King County Collective Bargaining Agreement].
245. See id. arts. 1, 7, 8, 10. 246. Id. art. 22, §§ 1-2, at 67-68. 247. Employees have been discharged under other extreme circumstances (for example, for
abusing county property). Telephone Interview with Becky Elias, supra note 239. 248. See King County Collective Bargaining Agreement, supra note 244, add. A, at 78 (setting
compensation based on pay range number fifty-one in the King County squared salary table); Salary Tables, KING COUNTY, http://www.kingcounty.gov/audience/employees/pay-benefits/salary-tables.aspx (to locate, follow “KC Squared: FLSA Exempt 2016” hyperlink) (last updated Dec. 20, 2014) (providing standard salary compensation for 2016).
249. See King County Collective Bargaining Agreement, supra note 244, art. 7, § 6.B, at 17. State certification, for instance, requires (i) a bachelor’s degree in environmental health or basic science courses, (ii) a year of experience as a sanitarian, and (iii) two letters of recommendation. See WASH. ST. BOARD REGISTERED SANITARIANS, http://www.wsbrs.org/getreg.html (last visited Jan. 1, 2017).
250. King County Collective Bargaining Agreement, supra note 244, art. 7, § 6.A, at 17. 251. Telephone Interview with Becky Elias, supra note 239.

Peer Review 69 STAN. L. REV. 1 (2017)
42
intervals.253 A handful of frontline inspectors are so-called “hot desk” employees, meaning that they ordinarily go from home directly to visit establishments and only infrequently come to the office.254
HEI IIIs are “senior” positions, which no longer involve routine field visits. Their salaries range from around $73,000 to $93,000,255 and HEI IIIs occupy one of three different positions: (i) “plan reviewers,” who approve blueprints for permit applicants (for example, reviewing whether there is enough refrigeration space for an establishment of a particular size);256 (ii) “field operations seniors,” who are in charge of quality assurance, participation in administrative hearings for the formulation of compliance plans, joint inspections for business under compliance plans, and variance review (for example, waiving a requirement due to the presence of a so-called Hazard Analysis and Critical Control Point plan); and (iii) “technical seniors,” who run training and programmatic implementation, FDA standardization, oversight of quality assurance programs, policy implementation (for example, caloric disclosure), and foodborne illness investigations.257 Training and programmat-ic implementation includes the development and revision of the so-called “marking instructions,” a manual adapted from state materials explaining how to score each red violation.258 In practice, quality assurance and FDA standardization have not been formalized throughout the program.
252. King County Collective Bargaining Agreement, supra note 244, add. A, at 78 (setting compensation based on pay range number fifty-eight in the King County squared salary table); Salary Tables, supra note 248 (providing standard salary compensation for 2016).
253. King County Collective Bargaining Agreement, supra note 244, art. 8, § 8.C, at 25. 254. Telephone Interview with Becky Elias, supra note 239. 255. King County Collective Bargaining Agreement, supra note 244, add. A, at 78 (setting
HEI III compensation based on pay range number sixty in the King County squared salary table); Salary Tables, supra note 248 (providing standard salary compensation for 2016).
256. See PUB. HEALTH: SEATTLE & KING CTY., PLAN REVIEW AND PERMITTING GUIDELINES FOR THE NEW CONSTRUCTION OR REMODELING OF A FOOD SERVICE ESTABLISHMENT 4-6, 20 (2016), http://www.kingcounty.gov/healthservices/health/ehs/foodsafety/FoodBusiness/~/media/health/publichealth/documents/foodsafety/Plan-Guide-Food-Service-Plan-Review.ashx. The County has seven plan reviewers, with four dedicated to food safety and three dedicated to water recreation. Food safety plan reviewers process roughly 800-1100 plans per year; the time for each plan is highly variable, but each takes roughly four hours per establishment. See id. at 12.
257. Telephone Interview with Becky Elias, supra note 239. 258. See WASH. STATE DEP’T OF HEALTH, MARKING INSTRUCTIONS: WASHINGTON STATE FOOD
ESTABLISHMENT INSPECTION REPORT RED BLUE FORMS A, B, AND C (2015). This is the “[c]ompanion document to” the Washington State Retail Food Code. See id.; see also WASH. STATE DEP’T OF HEALTH, DOH 332-033, WASHINGTON STATE RETAIL FOOD CODE: CHAPTER 246-215 WASHINGTON ADMINISTRATIVE CODE (WAC) (2013), http://www.doh.wa.gov/portals/1/Documents/Pubs/332-033.pdf.

Peer Review 69 STAN. L. REV. 1 (2017)
43
Supervisors in each of the three units (HEI IVs) conduct performance evaluations of HEIs and handle appeals from operators.
Foodborne illness investigations are conducted jointly between the food safety program and a team of nurses and epidemiologists in the Communicable Disease section of Public Health—Seattle & King County.259 Nurses interview individuals who are ill and obtain lab samples if available, epidemiologists use the information to pinpoint implicated establishments, and food safety staff conduct investigations on site and issue corrective orders.260 Tracing of sources can be a multi-agency effort—for example, involving the state, USDA/FDA, and the Centers for Disease Control and Prevention (CDC)—depending on the scope of the outbreak. For instance, when thirteen individuals were infected with E. coli in August 2015, the investigation revealed that they had all eaten at the same vendor operating farmers’ market stands, food trucks, and a catering operation.261 King County issued a cease-and-desist order to the kitchen used by the vendor, tested the employees, and attempted to identify the underlying food source.262 But from 2012 to 2014, only roughly 60% of investigations of probable or confirmed outbreaks identified the agent (for example, norovirus, vibrio, E. coli, or campylobacter).263
Substantial differences in inspection styles exist among inspectors. In terms of workload, six inspectors completed fewer than six hundred inspections per year, compared with four inspectors who completed more than one thousand inspections per year.264 One inspector had an average of 1.8 red points per inspection, compared to ten inspectors with averages of over 10 red points. The percentage of return visits ranged from 0.4% to 13%. A historical analysis showed that area rotations did not have substantial effects on these interinspector differences, suggesting they are not primarily driven by
259. Telephone Interview with Becky Elias, supra note 239; see also Hilary N. Karasz, You Heard It Here First: Changing Our Food Borne Illness Public Notification Process, PUB. HEALTH INSIDER (Nov. 13, 2015), https://publichealthinsider.com/2015/11/13/you -heard-it-here-first-changing-our-food-borne-illness-public-notification-process.
260. Telephone Interview with Becky Elias, supra note 239. 261. See Cathy Siegner, Update: 9 Confirmed, 1 Probable Case in Seattle E. Coli Outbreak, FOOD
SAFETY NEWS (Sept. 4, 2015), http://www.foodsafetynews.com/2015/09/6-e-coli-cases -linked-to-mexican-food-sold-at-washington-farmers-markets/#.V5gq6TYzf4o; see also Lindsay Bosslet, Public Health Investigates E-Coli Outbreak, PUB. HEALTH INSIDER (Sept. 15, 2015), https://publichealthinsider.com/2015/09/01/public-health -investigates-e-coli.
262. Siegner, supra note 261. 263. This statistic was calculated from the County’s internal database of probable or lab-
confirmed foodborne illness outbreaks, which is on file with the Author. 264. We calculated all of these statistics from a baseline period of 2013-2014 before the
intervention began, using inspection data sent to us by King County. The dataset is on file with the Author.

Peer Review 69 STAN. L. REV. 1 (2017)
44
establishment differences. However, survey responses of the inspection staff revealed divergent ways in which inspectors have exercised discretion, roughly falling along a spectrum from more educational to more punitive.265 Inspectors reported facing contradictory criticisms of failing to protect the public health on the one hand and overzealously regulating on the other. Responding to a survey, one inspector noted, “We all do and see things differently,” and another noted, “We all use some level of discretion.” “If we write everything we observe without ‘professionally assessing risks’ through dialogue, most of our inspections will be ‘Unsatisfactory.’” Differences in stringency have also reached popular audiences. A local Seattle newspaper profiled one of the tougher inspectors, with the headline “Mr. Clean.”266 The article reported that businesses owners and kitchen workers were frustrated at his “overly aggressive” interpretation of health guidelines: “He was on [restaurant owners] like stink on shit.”267
These differences in inspection style have also caused some tension among staff. Several employees filed grievances against one another. In one instance, an inspector appeared on a television news show, anonymously in shadow figure and disguised voice, accusing another inspector and the department of “turning a blind eye” to ethnic restaurants.268 In staff meetings, inspectors articulated that improving the consistency of inspections would build trust and confidence in each other.269
265. These interinspector differences track longstanding debates in regulatory theory about cooperative versus punitive regulatory approaches. See, e.g., IAN AYRES & JOHN BRAITHWAITE, RESPONSIVE REGULATION: TRANSCENDING THE DEREGULATION DEBATE 19-53 (1992); BARDACH & KAGAN, supra note 73, at 71-77 (describing a trend of “single-minded enforcement of the rules” in federal agencies that displaced more cooperative mechanisms of regulatory compliance); Peter Mascini & Eelco Van Wijk, Responsive Regulation at the Dutch Food and Consumer Product Safety Authority: An Empirical Assessment of Assumptions Underlying the Theory, 3 REG. & GOVERNANCE 27, 41-43 (2009) (evaluating the efficacy of responsive regulation, or the notion that persuasion precedes coercion in regulatory enforcement, by studying the Dutch Food and Consumer Product Safety Authority).
266. Jonah Spangenthal-Lee, Mr. Clean: Meet Seattle’s Toughest Restaurant Inspector, STRANGER (May 1, 2008), http://www.thestranger.com/seattle/mr-clean/Content?oid=568012.
267. Id. (alteration in original). 268. Doug Powell, Do Health Inspectors Turn Blind Eye to Ethnic Restaurants?, BARFBLOG
(May 9, 2013), http://barfblog.com/2013/05/do-health-inspectors-turn-blind-eye-to -ethnic-restaurants (linking to a video from the KIRO 7 television broadcast on May 6, 2013). For the news article accompanying the initial broadcast, see Jeff Dubois, Whistleblower: Health Inspectors Turning Blind Eye to Ethnic Restaurants, KIRO 7 (May 6, 2013, 1:57 PM), http://www.kiro7.com/news/whistleblower-health-inspectors -turning-blind-eye-/246287633.
269. See Improving Governance by Peer Review: Food Safety and Beyond, supra note 201 (“[I]f you haven’t been in the restaurant before and start marking violations, it is not uncommon to hear, ‘the last inspector didn’t do it like that,’ which can cause inspectors to doubt
footnote continued on next page
Peer Review 69 STAN. L. REV. 1 (2017)
45
A review of the food safety program in 2014 provided the impetus for this research project. Due to public demand, the review recommended that the county investigate a window placarding system, by which restaurants would be required to post grades based on recent inspection scores in windows.270 In stakeholder meetings, many articulated concerns about the accuracy and credibility of the basis for grades.271 The review also concluded that the program should develop measures for “[q]uality assurance” to ensure “that staff conduct inspections according to standards for quality, fairness, consistency and adherence to the Food Code.”272 King County then contacted me seeking advice on how to address these issues in an evidence-based fashion, which led us to design the peer review intervention.
2. County comparison
While preparations for the King County intervention were underway, Pierce County—the second-largest county in the state, with a population of more than 800,000—also indicated interest in joining the evaluation.273 As our analysis focuses on King County, the institutional details of Pierce County’s food safety program may be found in Appendix I. Table 1 below provides basic statistics about the county programs. Formally, the two counties appear similar, subject to the same state health code and inspection score sheet. Several differences, however, emerge that help to illuminate the management challenges of running a food safety program.
First, the ratio of quality assurance supervisors to frontline inspectors differs considerably: a lead inspector oversees roughly three employees in Pierce County, while a field operations senior inspector oversees some eleven employees in King County. This difference may explain why Pierce County’s quality assurance program, with the county having engaged in FDA standardization with all of its frontline inspectors, is considerably stronger.
each other.” (quoting Becky Elias, Food & Facilities Manager, Dep’t of Pub. Health, Seattle & King Cty.)).
270. See PUB. HEALTH: SEATTLE & KING CTY., supra note 214, at 15-16. 271. See, e.g., Food Program Stakeholder, Restaurant Reporting Subcommittee Meeting #5
Notes (Dec. 8, 2014), http://www.kingcounty.gov/healthservices/health/ehs/foodsafety/~/media/health/publichealth/documents/foodsafety/RestaurantReporting SubCommittee141208Notes.ashx; Food Program Stakeholder, Restaurant Reporting Subcommittee Meeting Notes (June 25, 2014), http://www.kingcounty.gov/healthservices/health/ehs/foodsafety/~/media/health/ publichealth/documents/foodsafety/RestaurantReportingSubCommittee140625 Notes.ashx.
272. See PUB. HEALTH: SEATTLE & KING CTY., supra note 214, at 8. 273. FORECASTING & RESEARCH DIV., STATE OF WASH. OFFICE OF FIN. MGMT., STATE OF
WASHINGTON: 2015 POPULATION TRENDS 3, 8 tbl.3 (2015), http://www.ofm.wa.gov/pop/april1/poptrends.pdf.

Peer Review 69 STAN. L. REV. 1 (2017)
46
More senior staff members in King County, by contrast, are not directly engaged with quality assurance oversight.
Second, while the median employee has served for fifteen years in King County, the median employee has served for only three years in Pierce County. The differences in tenure may explain why Pierce County inspectors exhibited little resistance to the intervention, while more work was required to bring King County inspectors along.
Third, the caseloads are different in the two counties. Pierce County employees undertake fewer inspections per year (760, compared to 870 in King County) but complete a comparable number of inspections per year. Based on historical data, the caseload completion rate in Pierce County rose dramatically with new performance management and sharp turnover in Pierce County in 2011. Last, Pierce County inspectors tend to find a higher number of violations on average.

Peer Review 69 STAN. L. REV. 1 (2017)
47
Table 1 King County Pierce County
Industry Establishments 11,500 3,800 High risk establishments 6,786 1,878 Mobile establishments 450 122
Inspection Staff Total staff 55 19 Frontline inspectors 34 10 Operational managers 3 4 Inspectors/manager 11.3 2.5 Entry-level salary 56-71k 51-66k Unionized Yes Yes Median time on staff 15 3 Proportion female 0.42 0.79 Exclusively food No Yes
Inspection Caseload (25%, 75%) Target number of inspections 870 760 Inspections completed (557, 896) (512, 844) Routine inspections completed (383, 600) (467, 766) Routine (high risk) inspections completed (279, 454) (315, 497)
Inspection Stringency (25%, 75%) Red points (high risk) (6, 13) (13, 16) Returns (high risk) (24, 79) (31, 71) Closures (high risk) (0, 2) (1, 2)
Quality Management Quality assurance Low High FDA standardization No Yes
Summary attributes about the industry, inspection staff, inspection caseload and stringency, and quality management in King and Pierce Counties. Num-bers reported in parentheses indicate the twenty-fifth and seventy-fifth per-centiles (i.e., the interquartile range) of frontline inspectors for those dimensions. “Establishments” indicates the total number of permitted estab-lishments inspected for food safety. “Operational managers” refers to “lead” positions in Pierce County and “field operations seniors” in King County, who perform direct quality assurance oversight of frontline inspectors. King County has two other senior positions performing plan review and technical work. The inspector-to-manager ratio is often referred to as the “span of control.” “Salaries” indicates entry-level salaries of HEI Is in King County and frontline inspectors in Pierce County. “Exclusively food” indicates whether entry-level frontline inspectors in the food safety program focus exclusively on food inspections, as opposed to community safety inspections (e.g., pools).
Peer Review 69 STAN. L. REV. 1 (2017)
48
We excluded inspectors who were not on staff for at least ten months in the two-year baseline period from 2013 to 2015.274 “FDA standardization” refers to whether the county had engaged in standardization for its employees. “Quality assurance” is an assessment of how much review of frontline work product occurs, including but not limited to standardization.
The county difference in stringency is not due to differences in types of
establishments. The left panel of Figure 2 plots differences in the stringency of routine inspections across the counties. Each dot represents a red violation, with the citation rate across inspections for King County on the x-axis and for Pierce County on the y-axis. For instance, Pierce County inspectors cite a room temperature storage violation in 10% of inspections, compared to 5% in King County. To investigate whether differences could stem from differences in types of establishments, we focus on chain restaurants, which generally maintain independent, uniform food safety protocols across franchises. We hence identified seventy-eight chains (for example, Subway, Wendy’s, and Applebee’s) with franchises in both counties, for a total of 985 franchises in King County and 512 in Pierce County. The right panel of Figure 2 plots similar results for chains, with Pierce County’s chain franchise composition weighted to King County’s chain franchise composition. For instance, inadequate handwashing facilities are cited in 18% of Pierce County franchise inspections, compared to 9% of King County franchise inspections. Across chain franchises, Pierce County inspectors appear to cite a greater number of violations, which strongly suggests that the intercounty difference in stringency does not stem from differences in types of establishments.275
As a matter of statewide policy, this difference matters in terms of con-sistent implementation of the Health Code. The counties border one another,276 so operators with establishments crossing county lines are subject to divergent implementations of the same Health Code. A priori, there might
274. For information on mobile establishments in King County, see Beena Raghavendran, Food Trucks Are Served a Strict Menu of Health Rules to Roll in King County, SEATTLE TIMES (Sept. 14, 2015, 8:32 AM), http://www.seattletimes.com/seattle-news/food -trucks-face-strict-menu-of-health-rules-to-roll-in-king-county.
275. The only violations that are cited frequently and that Pierce County scores at a lower rate than King County are those for failure to post a permit or for current food worker cards (earned after a food safety class). Pierce officials confirmed that the permit posting is rarely not done by an operator and very low in risk priority. Food worker card compliance may be quite high in Pierce County because the county has taken a leadership role on that front in the state. The county offered six classes per week (with a 134-person capacity) until the county created the online class used by the state. Telephone Interview with Rachel Knight, Food Safety Program Manager, Tacoma-Pierce Cty. Dep’t of Health (Aug. 26, 2015).
276. See infra Figure 1.

Peer Review 69 STAN. L. REV. 1 (2017)
49
be little reason to think that a peer review intervention should cause an increase in citation rates in King County. FDA inspectors, however, also cite comparable violations at uniformly higher rates than King County.277 This FDA comparison and the stronger quality measures and training in place in Pierce County give reason to think that peer review should lead King County to become more stringent.
Figure 2
Intercounty variability in citation rates. Each dot represents the citation rate (across inspections) of one of twenty-seven types of red violations in King County on the x-axis and in Pierce County on the y-axis. The left panel presents the differences across all (high risk) establishments, and the right panel presents the differences across chain restaurants (weighted to King County’s chain composi-tion). Differences are statistically significant (p-values from t-test and weighted t-test are each less than 0.01). Chains represent seventy-eight franchises present in both counties that likely have uniform food safety protocols.
III. Experimental Design
We now describe the experimental intervention aimed to test peer review in King County. Subpart A describes preparation for the intervention with the staff. Subpart B discusses the randomization procedure to schedule random paired peer inspections. Subpart C describes what turned into a central part of
277. To study this, we matched violations from FDA baseline studies to King County. Comparing citation rates for full-service restaurants to routine inspections of risk III establishments with seating in King County, rates are uniformly higher from FDA inspectors. See U.S. FOOD & DRUG ADMIN. NAT’L RETAIL FOOD TEAM, supra note 168, app. E, at 195-98.
FIGURE 2 HERE
0.00 0.05 0.10 0.15 0.20
0.00
0.05
0.10
0.15
0.20
All Establishments
King County
Pie
rce
Cou
nty
0.00 0.05 0.10 0.15 0.20
0.00
0.05
0.10
0.15
0.20
Restaurant Chains
King County
Pie
rce
Cou
nty

Peer Review 69 STAN. L. REV. 1 (2017)
50
the intervention, namely a core transformation of weekly trainings and guidance for the peer review group.
A. Preparation and Rollout
Early in 2014, the now-manager of King County’s food safety program contacted me after his supervisors read my earlier work on information disclosure and food safety inspections.278 The county was interested in conducting an evaluation of how to improve the consistency of its inspection process, and we began discussions about potential interventions that might be rigorously assessed. The staff held a series of meetings that uncovered a wide range of rationales for valuing consistency. Some of the chief reasons included the improvement of the credibility of the food safety program; the reduction of conflict among coworkers, management, and operators; and confidence in oneself, one’s peers, and the program. For instance, after an area rotation, some inspectors reported it challenging to follow a relatively lenient inspector as establishments were more likely to push back against citations, pointing to purportedly inconsistent code interpretations.
In October 2014, I visited the county to present to the full staff findings from an earlier study of inspections from ten jurisdictions, which highlighted the fragility of grading systems in the face of interinspector inconsistency.279 Among all the potential interventions, the county was most interested in one centering on peer review, itself a positive indicator of the viability of experimentalism.280
B. Randomized Peer Inspections
After considerable discussion with the supervisors and seniors and a pilot peer review inspection, we designed the peer review process to (a) meet constraints from the county side (chiefly, resources and staff morale), (b) facilitate rigorous evaluation based on a randomized controlled trial, and (c) track the best governance ideas from the experimentalist literature.
First, we randomly assigned the inspection staff into a peer review (or “treatment”) group or a control group. The control group would continue to conduct inspections in the same fashion as before. We included all staff (supervisors, seniors, plan reviewers, and meat inspectors) in the eligible pool for randomization. The principal reason was to make clear that the intervention was not meant as a top-down form of supervision but rather as a method for mutual all-around learning, as contemplated by experimentalists.
278. The work they encountered was Ho, supra note 47. 279. See id. at 586-87, 599-606. 280. During the visit, we also piloted the first peer review inspection.

Peer Review 69 STAN. L. REV. 1 (2017)
51
In addition, frontline staff members were informed that participation in the peer review group would reduce their target number of inspections for the year. The reduction was equal to the number of inspections that could not be conducted because inspectors were doubled up for peer inspections, with the aim to make inspectors indifferent on caseload grounds between being randomized in or out.
Second, we randomly paired members of the peer review group each week. To maximize exposure to variance in inspection styles (and to guard against groupthink and group polarization281), we restricted any repeat pairs.
Third, each pair was randomly assigned establishments, in a randomly chosen inspection area, to visit on “peer review day.”282 Because we wanted to expose inspectors to the full range of possible code violations, we assigned only risk III (high risk) establishments to be subject to peer review inspections.283 Dedicating a full day to peer review was meant to encourage continuing conversations about the inspection process between the pair (for example, over lunch). To prevent defensiveness, a pair could not be assigned to the home areas of either member. But to allay concerns about caseloads (and to prevent contamination of learning across treatment and control groups), the areas were drawn from others in the peer review group. To minimize discretion in choosing establishments, inspectors were instructed to conduct inspections following the randomized order of establishments.
Fourth, one inspector was randomly assigned to serve as the “lead inspec-tor” in the first establishment and instructed to conduct the inspection as she typically would for the first inspection of the day. The non-lead inspector was instructed to shadow the other inspector, and the pair alternated roles for subsequent establishments that day. Each inspector was then required to independently fill out the inspection form and note violations observed. After submitting separate forms, inspectors were instructed to share their results with each other, deliberate about differences, and—on the part of the lead inspector—present the results to the operator. To monitor results, we collected all forms physically and electronically.
One challenge with the lead/non-lead model was how to allay possible tension between peers. King County supervisors were concerned that a truly independent inspection by the lead might fracture the staff as it could lead to second-guessing of and arguing over decisions. This led to several design
281. See PAUL ’T HART, GROUPTHINK IN GOVERNMENT: A STUDY OF SMALL GROUPS AND POLICY FAILURE 275-76 (Johns Hopkins Univ. Press 1994) (1990); Cass R. Sunstein, The Law of Group Polarization, 10 J. POL. PHIL. 175, 176 (2002).
282. One inspector reported that conveying to operators that they were chosen randomly completely changed the tenor of the relationship with the peer review inspectors, easing any tension.
283. For instance, raw meat violations are only applicable to risk III establishments.

Peer Review 69 STAN. L. REV. 1 (2017)
52
choices: (a) permitting the non-lead to assist with ministerial tasks (for example, recording temperatures) and engage with the operator; (b) sequencing the discussion between the lead and non-lead to occur before briefing the operator about results; and (c) conveying that the peer review process was a “no judgment” zone so that inspectors would feel free to submit truly independent-ly completed forms.284 In contrast, due to deeper experience with field supervisorial review (for example, joint visits and FDA standardization), Pierce County was less concerned about potential tension and hence adopted a model falling closer to an independent inspection (with one peer merely shadowing the other) during peer review.
At the end of each peer review week, the county circulated a survey asking participants to comment on challenging code items they encountered, explain reasons for divergence with their peer, articulate what they learned, and provide any other feedback.285 Responses were anonymous to reduce response bias286 and used primarily to identify and address questions that arose during peer review. We continued to observe inspection outcomes from independent inspections conducted by all inspectors.
Table 2 below presents balance statistics for the treatment and control groups. Groups appear comparable. The top panel presents basic statistics on membership in each group. While there are small imbalances (for example, fewer HEI IIIs and more HEI IVs in the treatment group), none of these differences are statistically significant. The bottom panels present statistics on inspection stringency averaged at the inspector level and the inspection level. By ensuring that treatment and control groups are comparable, randomization provides the critical basis for drawing a causal inference about the effects of the intervention.
284. In that sense, the design is also consistent with the focus of some public management theories that focus not on people but on systems. See James E. Swiss, Adapting Total Quality Management (TQM) to Government, 52 PUB. ADMIN. REV. 356, 357 (1992) (“When quality slips, it is almost always the system that is wrong, not the people . . . .”).
285. The specific questions were: (1) Which violations did you diverge on? What was the issue that caused the difference of opinion? (2) Which questions required you to consult the code, marking instructions, or seek clarification? (3) Did the nature of your comments either on the inspection or on specific violations differ? What might be most effective in facilitating corrective action? (4) What did you learn from the peer review? Other comments?
286. See Anthony D. Ong & David J. Weiss, The Impact of Anonymity on Responses to Sensitive Questions, 30 J. APPLIED SOC. PSYCHOL. 1691, 1695-704 (2000) (finding that undergraduate students were significantly more likely to submit truthful self-reports when results were anonymized as opposed to merely confidential). On the other hand, anonymity might also have led some respondents not to take the survey as seriously.

Peer Review 69 STAN. L. REV. 1 (2017)
53
Table 2 Treatment Control SD p-value Job Grade Frontline inspector
(HEI I) 0.04 0.08 0.24 0.56
Frontline inspector (HEI II)
0.71 0.62 0.48 0.55
Senior staff (HEI III) 0.08 0.21 0.36 0.23 Supervisors (HEI IV) 0.12 0.04 0.28 0.31 Meat program
(MPRAF) 0.04 0.04 0.20 1.00
Demographics Years on staff 12.52 16.13 8.55 0.15 Hot desk 0.08 0.17 0.33 0.39 Female employee 0.38 0.46 0.50 0.57
Caseload Inspections/year 466.20 401.47 182.93 0.31 Routine
inspections/year 330.01 292.25 100.92 0.28
Risk III routine inspections/year
257.34 215.90 88.15 0.17
Stringency by Inspection score 13.07 13.43 5.58 0.86 inspector Red points 10.59 10.58 5.09 0.99
Red violations 0.87 0.90 0.40 0.83 Frontline inspectors 17 17 Employees 24 24
Stringency by Inspection score 12.48 13.52 17.42 0.59 inspections Red points 9.69 10.31 15.61 0.70
Red violations 0.81 0.88 1.14 0.58 Number of
inspections 11,660 10,184
Balance statistics for treatment and control groups for baseline period from January 2013 to the beginning of the intervention. “HEI” stands for Health and Environmental Investigator. “MPRAF” stands for Meat, Poultry, Rabbit and Aquatic Foods Compliance Officer, historically a separate inspection unit. “Years on staff” indicates the average number of years as part of the food safety program. “Hot desk” indicates whether an employee does not check into a permanent office on a daily basis. “Inspections/year” represents the number of food safety inspec-tions (including routine, educational, and return visits for all risk types) for frontline inspectors. “Risk III routine inspections/year” indicates the number of routine food safety inspections of risk III establishments by frontline inspectors. The bottom two panels present balance statistics averaged across inspector means and then across inspections for risk III routine inspections by frontline inspectors. “Inspection score” refers to the average number of violation points (i.e., the sum of blue and red violations). “Red points” indicates the average number of red

Peer Review 69 STAN. L. REV. 1 (2017)
54
violation points. “Red violations” indicates the average number of red violations cited.
C. Weekly Huddles
In order to resolve common issues encountered during the week, the peer review team met weekly for so-called “huddles.” The county’s initial conception of the huddles was as a relatively quick check-in to address logistical issues that might have arisen during peer review inspections. Supervisors and seniors expected that huddles would be more time consuming in the early weeks. Early sessions were consistent with this model. The first few meetings focused on when it would be acceptable to skip an establishment (for example, if the establishment was closed), how to coordinate results with the area inspector (for example, if a return visit was triggered), and how to manage closures of establishments during peer review. By and large, participants adhered to the peer review protocol.287
After monitoring results from the first weeks of peer review, however, the peer inspections surfaced many areas of disagreement. From the feedback, it became evident that the huddles would need to be more comprehensive to address underlying issues. Figure 3 below plots the results through week seven, comparing the baseline citation rate of a violation for the peer review group and the rate at which two inspectors disagree on citing that violation for an establishment (the deviation rate). Each dot represents one violation, with the baseline rate at which the violation is cited on the x-axis and the deviation rate based on the first seven weeks on the y-axis.288 The left panel shows that deviation rates are generally much higher for blue violations, which is consistent with the fact that counties expend fewer resources training for blue violations. The right panel shows that there is a cluster of violations surrounding raw meat cross-contamination (marked by the dashed oval) that is cited frequently but with high deviation across inspectors.
Consider the violation for storage of raw meats—a “1400 violation”—which is cited in roughly 20% of peer inspections and on which inspectors disagree in roughly 10% of peer inspections. The Washington Food Code provides:
287. Some differences in implementation did surface. For instance, some inspectors converted the guideline to perform “at least two routines” into a general rule to perform two inspections on a peer review day. Because some inspection sites turned out to be closed (for example, a nighttime establishment), one inspector reported that the peer review pair skipped a more difficult establishment.
288. The baseline rate adjusts for the fact that deviations are at least in part a function of the prevalence of the violation. A violation that is never scored nor observed by construc-tion has a deviation rate of zero.

Peer Review 69 STAN. L. REV. 1 (2017)
55
A food must be protected from cross contamination by: (a) . . . separating raw animal foods during storage, preparation, holding and display from: (i) Raw ready-to-eat food . . . and (ii) Cooked ready-to-eat food . . . [and] (b) . . . separating types of raw animal foods from each other . . . by: (i) Using separate equipment . . .; or (ii) Arranging each . . . so that cross contamination of one type with another is prevented; and (iii) Preparing each type of food at different times or in separate areas.289 Three principal concerns emerged from peer review. First, many inspec-
tors were unclear about how to distinguish this violation from other violations that provide for (a) no cross-contamination from food contact surfaces from raw meat (a “1300 violation”) and (b) the prevention of potential food contamination during preparation, storage, and display (a “3300 violation”). Second, many inspectors questioned what constituted separation. Wrote one inspector: “What is considered separation? I consider [it] good separation and no violation when the raw meat is in a solid deep food container that cannot leak or spill on a ready to eat food below it.” Third, many inspectors exhibited confusion about whether “raw animal foods” covered raw, shelled eggs.
Figure 3
Deviation rates of violations as indicated from peer review inspections. Each dot represents one of twenty-seven red or twenty-three blue violation types, with the baseline citation rate plotted on the x-axis and the rate at which two inspectors disagreed in a peer review inspection on whether or not to cite that violation on the y-axis. The left panel plots blue violations and the right panel plots red violations, with the dashed ellipse indicating violations that had both a substantial baseline rate and high deviation rate. These items became the focus of reoriented trainings.
289. WASH. ADMIN. CODE § 246-215-03306(1)(a)-(b) (2016) (formatting and capitalization altered).
0.00 0.10 0.20 0.30
0.00
0.04
0.08
0.12
Blue Violations
Baseline Frequency
Dev
iatio
n R
ate
0.00 0.10 0.20 0.30
0.00
0.04
0.08
0.12
Red Violations
Raw Meatstorage

Peer Review 69 STAN. L. REV. 1 (2017)
56
In response to these early results, we refocused the huddle process toward the subset of violations generating the most disagreement from peer review. First, we used photographs of tough scenarios to generate discussion among the peer review group. Figure 4 below presents two sample photographs used to generate discussion among inspectors. On the right panel, raw meat is vacuum packaged but stored above ready-to-eat foods. On the left panel, raw, shelled eggs are stored in cartons but above ready-to-eat foods. These pictures provided concrete challenges for code interpretation: Does vacuum packing constitute adequate separation? Should meat always be stored on bottom shelves regardless of storage mechanism? Given the constrained space of the kitchen, what would be a feasible way to store the eggs to reduce risk? Much of the discussion surrounded how to distinguish three related violations (1300, 1400, and 3300). At one point, one inspector asked why a fourth distinct violation—providing for “safe and unadulterated” food (a “1000 violation”)—could not be scored, generating even more uncertainty about code interpreta-tion.
Figure 4
Pictures used to trigger group deliberation about food code items. In collaboration with the supervisors and seniors, my research team then
engaged in substantial research into governing statutory and regulatory law, as well as the science underpinning the violation. We drafted several lengthy guidance memoranda for the senior staff and supervisors. For instance, we clarified that the Washington Food Code incorporates the definition of “adulteration” from the Food Drug and Cosmetics Act, which contemplates contamination by nonfood substances and hence unambiguously precludes
FIGURE 4 LEFT HERE FIGURE 4 RIGHT HERE

Peer Review 69 STAN. L. REV. 1 (2017)
57
scoring a 1000 violation when cross-contamination of raw meat is at issue. In addition, we clarified that a critical distinction between 1300 and 1400 violations is that the former refers to actual cross-contamination of food contact surfaces, while the latter refers to potential cross-contamination.290 Based on these memoranda, the seniors developed more accessible training materials to use for future huddles. Inspectors in the control group were not privy to the discussion and guidance developed by the peer review team.
One of the pivotal concepts conveyed in the huddles was risk assessment. Many were initially inclined to search for determinate, binary answers on whether a particular scenario constituted a violation. As one state official noted, “[w]e can give anybody a clipboard and checklist,” but the much more challenging aspect to teach is the use of discretion and risk assessment. For instance, one supervisor encountered a food he had never seen before (taro root) in the context of an inspection and wondered whether it should be considered “potentially hazardous food” (food that absent temperature control would support the growth of microorganisms). Rather than providing a determinate answer, peers began to probe how taro was prepared, as pH and moisture levels can have dramatic effects on risk. Instead of merely memorizing a specific classification, the huddles began to draw on the underlying science leading to a classification of “potentially hazardous.” The virtue of this approach is that by teaching underlying principles, inspectors can develop the skill set to conduct risk-based inspections for the myriad of novel scenarios that can arise. These conversations began to track the experimental-ist notion of “norm articulation” to guide the exercise of local discretion.291
One item that presented particularly intense discussion, and illuminates the role of risk assessment, was shelled, raw eggs. Under the food code, raw eggs are unambiguously considered raw animal products. But most inspectors believed the risk of cross-contamination to be substantially lower than for raw meat. In the left panel of Figure 4 above, the eggs are stored in cartons and therefore unlikely to break; operators are likely to observe cross-contamination should it occur (which is less likely with microbial material from raw meat juices); and compared to cross-contamination from raw meat juices, the actual food risk remains lower.292 Because of this relative risk, the
290. Appendix D contains an excerpt from a series of memoranda written on these topics, which include, for instance, one systematic way to spell out the relationship between cross-contamination violations. See infra Appendix D; infra Appendix E; see also WASH. ADMIN. CODE § 246-215-03306(1)(a)-(b).
291. See supra note 95. 292. See Petra Luber, Cross-Contamination Versus Undercooking of Poultry Meat or Eggs: Which
Risks Need to Be Managed First?, 134 INT’L J. FOOD MICROBIOLOGY 21, 23 tbl.1, 24 tbl.2 (2009) (summarizing evidence of higher prevalence of campylobacter and salmonella on poultry meat as compared to eggs).

Peer Review 69 STAN. L. REV. 1 (2017)
58
consensus position was developed that raw, shelled eggs could be scored as a lower-level potential cross-contamination, depending on the circumstances.
Based on what was learned in peer inspections and huddles, the model for how to conduct effective trainings continued to evolve. The final template consisted of five modules for any issue: (i) identifying the underlying food science, (ii) connecting the food science to the intent of the state food code language, (iii) breaking code language into discrete constituent elements, (iv) determining which elements were mandatory versus discretionary based on risk principles, and (v) applying the criteria to a range of examples based on risk. As Appendix C shows, covering one cluster of violations typically took considerable time, and the length of the training sessions also expanded substantially. The huddles often also revealed underlying motivational differences. Some inspectors were concerned about the distributive dimensions to certain violations, such as whether small, ethnic establishments would be disproportionately burdened. Others were driven by conflict aversion, preferring a more educational than punitive approach. Developing the more substantial huddle model facilitated discussion of these issues, consistent with the (experimentalist) aim to use peer review to develop better guidance to fulfill the mission of the food program.293
293. As one inspector put it: Problem places will generate the greatest amount of discussion and divergence between inspectors . . . . However problem places are just that for a number of reasons and are time consuming and difficult, but are probably where the majority of public health risk resides and therefore warrants [sic] a more direct programmatic strategy for dealing with them than is currently used.

Peer Review 69 STAN. L. REV. 1 (2017)
59
5 10 15
0.00
0.10
0.20
Weeks
Dev
iatio
n R
ate
Figure 5 Raw Meat Storage
Deviation rates of raw meat storage violation over the duration of peer review. The decrease is statistically significant (p-value = 0.02) based on a simple linear model with weeks as the explanatory variable.
Figure 5 above shows the evolution of raw meat storage violation disa-
greements as the peer review progressed. The gray bar indicates the weeks during which the huddles intensively trained to the cluster of food contamination items. The deviation rate during peer reviews dropped substantially, suggesting that training and deliberation had a considerable effect on how inspectors cited the item.294
Some ambiguity over code items also stemmed from the State Code and marking instructions. As a result, we reached out to the Food Safety Program Supervisor at the State Department of Health, who then participated in a number of huddles.295 At the same time, we also coordinated the efforts across county lines, so that a form of peer review between departments emerged. Items with high deviation rates overlapped to a considerable extent between the two counties, and Pierce County began to draft guidelines for items that King County had not yet covered with the aim of sharing and jointly revising guidelines across counties to generate intercounty consistency. The counties, for instance, disagreed on how to treat raw, shelled eggs, which inspired discussion with state officials on code clarification, updating the marking instructions, and in one instance, a call to amend the State Health Code itself.296
294. While it is possible that the decrease in deviation rates stems from increased communication across the peer review pair, the county explicitly instructed partici-pants not to change the level of interaction during peer review inspections.
295. In experimentalist terms, this was the multilevel governance aspect of peer review. 296. Section 246-215-03306(1)(a) of the Washington Administrative Code requires
separation of raw animal products from ready-to-eat (RTE) foods, and section 246-215-03306(1)(b) requires separating different raw animal products from each other, but the Code fails to specifically mention separation of raw animal products from other kinds of food. See supra note 289 and accompanying text. The express Code provisions have been interpreted to mean that raw meats should be stored below RTE foods, but food
footnote continued on next page
FIGURE 5 HERE
5 10 15
0.00
0.10
0.20
Raw Meat Storage
Weeks
Dev
iatio
n R
ate

Peer Review 69 STAN. L. REV. 1 (2017)
60
IV. Results
We now present results from peer and independently conducted inspec-tions by frontline inspectors through August 2015. Subpart A discusses the results from the peer inspections, when inspectors observed identical conditions. Subpart B presents estimates of the causal effect of the intervention on independent inspections, both on the propensity to score and on interinspector variability. A successful intervention should reduce variability among the peer review group after the intervention. Subpart C presents qualitative results based on the survey and interviews. Because results from Pierce County (which had only nine frontline inspectors) are limited due to sample size, we focus our discussion of results on King County. Results for Pierce County can be found in Appendix J.
A. Peer Inspections
While inconsistency is widely opined about, one common response is that by themselves, statistics about differences in grant rates are not evidence of a problem.297 After all, there is always some chance variability.298
Our peer review results conclusively show that even when inspectors observe identical conditions, inconsistency remains a major problem. While overall point totals were positively correlated across 378 peer review inspections, inspectors disagreed on code implementation 60% of the time.299 On average, inspectors disagreed over 1.7 code items and exhibited an average absolute score difference of 6.3 points. Given that the baseline number of violations and points are 1.6 and 13, respectively, and that the return threshold is 35 red points, these disagreements are substantial. Given the raw descriptive statistics from other regulatory settings,300 it is highly unlikely that this result is unique to King County.
risk principles would also require that raw meats be stored below any other food that might be cooked to a lower temperature than meats.
297. See, e.g., OFFICE OF THE COMPTROLLER, CITY OF N.Y., supra note 42, at 13 (“[V]ariances in and of themselves are not necessarily a sign that inspectors are not performing their jobs correctly, or that corruption exists in the inspection process. However, these variances do merit further investigation . . . .”).
298. For some thirty years, the Merit System Protection Board took this position with respect to caseload statistics by ALJs, as caseload differences could be explained by differences in the complexity of cases. See Soc. Sec. Admin. v. Goodman, 19 M.S.P.R. 321, 331-32 (1984) (holding that low productivity could constitute “good cause” for the discharge of ALJs but that merely showing caseload differences was insufficient, as cases could differ in complexity).
299. The disagreement rate might well be lower in risk I and II establishments, but the typical restaurant is a risk III establishment and, of course, also poses the greatest risk.
300. See supra notes 1-49 and accompanying text; see also infra Appendix A.
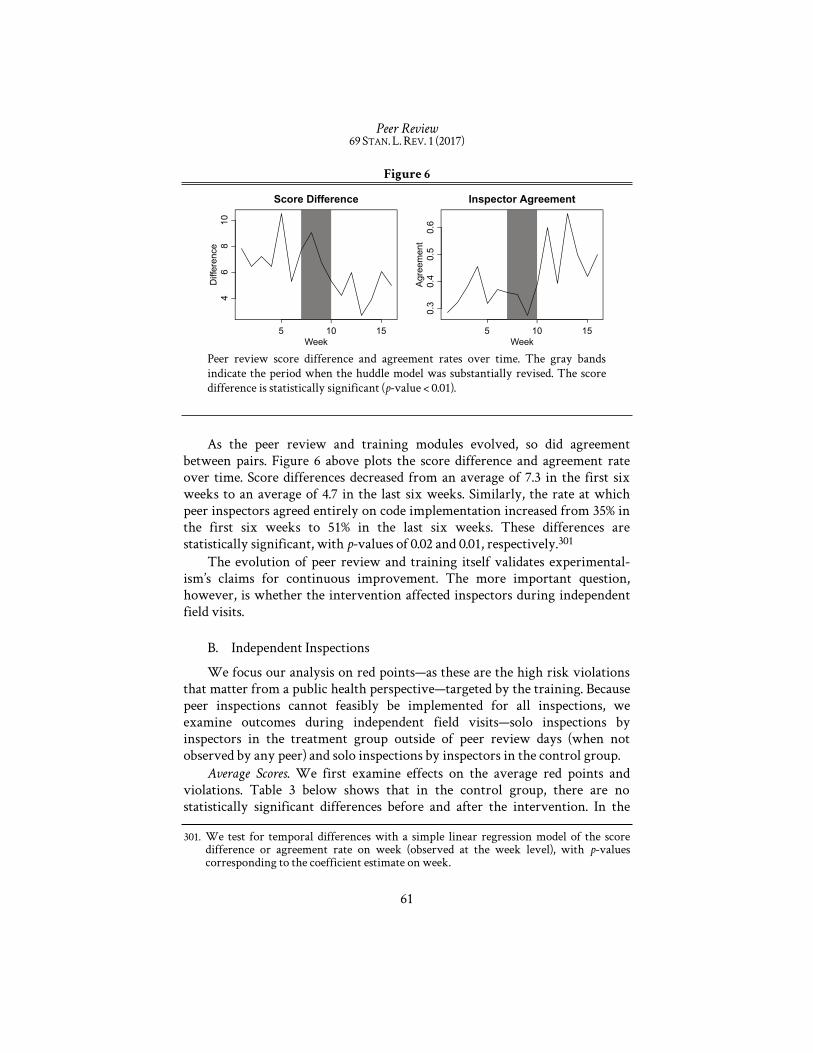
Peer Review 69 STAN. L. REV. 1 (2017)
61
5 10 15
46
810
Score Difference
Week
Diff
eren
ce
5 10 15
0.3
0.4
0.5
0.6
Inspector Agreement
Week
Agre
emen
t
Figure 6
Peer review score difference and agreement rates over time. The gray bands indicate the period when the huddle model was substantially revised. The score difference is statistically significant (p-value < 0.01). As the peer review and training modules evolved, so did agreement
between pairs. Figure 6 above plots the score difference and agreement rate over time. Score differences decreased from an average of 7.3 in the first six weeks to an average of 4.7 in the last six weeks. Similarly, the rate at which peer inspectors agreed entirely on code implementation increased from 35% in the first six weeks to 51% in the last six weeks. These differences are statistically significant, with p-values of 0.02 and 0.01, respectively.301
The evolution of peer review and training itself validates experimental-ism’s claims for continuous improvement. The more important question, however, is whether the intervention affected inspectors during independent field visits.
B. Independent Inspections
We focus our analysis on red points—as these are the high risk violations that matter from a public health perspective—targeted by the training. Because peer inspections cannot feasibly be implemented for all inspections, we examine outcomes during independent field visits—solo inspections by inspectors in the treatment group outside of peer review days (when not observed by any peer) and solo inspections by inspectors in the control group.
Average Scores. We first examine effects on the average red points and violations. Table 3 below shows that in the control group, there are no statistically significant differences before and after the intervention. In the
301. We test for temporal differences with a simple linear regression model of the score difference or agreement rate on week (observed at the week level), with p-values corresponding to the coefficient estimate on week.
FIGURE 6 HERE
5 10 15
46
810
Score Difference
Week
Diff
eren
ce
5 10 15
0.3
0.4
0.5
0.6
Inspector Agreement
Week
Agr
eem
ent

Peer Review 69 STAN. L. REV. 1 (2017)
62
treatment group, the number of red points increased by 2 points on average, relative to a baseline of 9.7 points. The third panel presents difference-in-differences (DID) estimates, indicating a treatment effect of 1.83, which constitutes a 19% gain from the baseline. Similar results exist for the number of red violations cited.
Table 3 Control Group Treatment Group DID DID% Before After Diff. Before After Diff. Red Points 10.31
(0.16) 10.52 (0.27)
0.21 (0.31)
9.69 (0.15)
11.74 (0.31)
2.05*** (0.32)
1.83*** (0.44)
19%
Red Violations
0.88 (0.01)
0.87 (0.02)
-0.01 (0.02)
0.81 (0.01)
0.94 (0.02)
0.13*** (0.02)
0.14*** (0.03)
7%
N 10,184 3,386 11,660 3,385 Figure 7 below breaks out the pre-post differences over time by group. Red points and violations for each group before and after the intervention. The pre-period covers a two-year period from January 1, 2013 to January 11, 2015, after which the peer review intervention began. The post-period covers January 12, 2015 through August 31, 2015. “Red points” indicates the average number of red points for an inspection in each group for a time period, with standard errors in parentheses. “Diff.” indicates the pre-post difference. The third panel presents difference-in-differences (DID) estimates, and “DID%” indicates the magnitude of the effect relative to the baseline in the treatment group. N represents the number of inspections. *** denotes statistical significance at an α-level of 0.01.

Peer Review 69 STAN. L. REV. 1 (2017)
63
0 5 10 15 20 25 30
21
01
23
Week
Differen
ce
0 5 10 15 20 25 30
21
01
23
Week
Differen
ce
Figure 7 Treatment
Control
Before-after difference over time in treatment and control groups. The lines indicate the difference over each week. Gray bands plot 95% confidence intervals.
Figure 7 above breaks out the pre-post differences over time by group. The x-axis represents the week of the intervention, and the y-axis represents the pre-post difference at that time, with gray bands indicating 95% pointwise confidence intervals. Increases manifest themselves for the treatment group relatively quickly, within eight weeks of the intervention.
The above analyses assume independence across inspections, but if inspectors conduct inspections differently, our estimates may be falsely precise. We hence use randomization inference, which directly incorporates the fact that treatment is assigned at the inspector level, to test the sharp null
FIGURE 7 HERE
0 5 10 15 20 25 30
−2−1
01
23
Treatment
Week
Diff
eren
ce
0 5 10 15 20 25 30
−2−1
01
23
Control
Week
Diff
eren
ce

Peer Review 69 STAN. L. REV. 1 (2017)
64
hypothesis of no treatment effects for any inspectors.302 Appendix H provides details, but the intuition is that under the sharp null, we can calculate the DID test statistic under any possible randomization of inspectors to treatment and control groups. Comparing the observed test statistic to this randomization distribution hence allows us to calculate the probability of observing a difference this large under the null hypothesis. Because this p-value is low (0.02), we reject the null hypothesis, providing evidence that the intervention affected outcomes.303
A priori, one might not have expected the intervention to necessarily increase average inspection scores. Taken together with (a) King County’s scoring difference with Pierce County and (b) King County’s longstanding challenge with low-scoring inspectors, one would hope that peer review would shift King County toward Pierce County. In that sense, the average increase from peer review has improved intercounty consistency.304
Consistency. While the above analysis suggests that peer review increased the number of red violations and points detected on average, effects may not have been uniform across inspectors. We hence develop a statistical model to directly test whether interinspector variability in citation of red points has decreased. Because the number of inspections can vary across inspectors, we use a Bayesian multilevel model with inspector random effects. Appendix H provides statistical details, but the basic question is whether the variance of interinspector differences has shrunk in the treatment group after intervention relative to the baseline.305
Table 4 below presents results. The first column shows that interinspector variance in the baseline condition (τ0) is 28, compared to 14 in the treatment
302. See John J. Donohue III & Daniel E. Ho, The Impact of Damage Caps on Malpractice Claims: Randomization Inference with Difference-in-Differences, 4 J. EMPIRICAL LEGAL STUD. 69, 90-96 (2007) (applying randomization inference in the difference-in-differences context); Daniel E. Ho & Kosuke Imai, Randomization Inference with Natural Experiments: An Analysis of Ballot Effects in the 2003 California Recall Election, 101 J. AM. STAT. ASS’N 888, 890-98 (2006) (adapting randomization inference to test for a sharp null hypothesis of ballot page effects on voting). Randomization inference has a close relationship to cluster bootstrap techniques, which have also been proposed to address within-group dependence. See, e.g., A. Colin Cameron et al., Bootstrap-Based Improvements for Inference with Clustered Errors, 90 REV. ECON. & STAT. 414, 414-24 (2008) (developing cluster bootstrapping to account for within-group dependence).
303. Appendix H presents estimates from parametric DID regressions, including month, inspector, and establishment fixed effects, clustering standard errors on inspectors.
304. As Appendix J spells out, scores went down in Pierce County, if anything, but the results are not statistically significant.
305. Random effects are assumed to come from a common hyperdistribution in the baseline condition but a different hyperdistribution in the treatment group postintervention. Priors on these hyperdistributions are identical, and the parameter of interest is the variance of that hyperdistribution.

Peer Review 69 STAN. L. REV. 1 (2017)
65
condition (τ1). One virtue of a Bayesian approach is that we can calculate directly the (posterior) probability that the variance has shrunk: 0.94. The second column uses data on establishments observed both in the pre- and post-period, adding random effects for 5320 establishments. This model yields comparable results, with a 0.96 (posterior) probability that the variance has decreased. Based on this data, we place a high probability on the inference that peer review decreased interinspector variability.
Inspection scores are highly skewed and prone to outliers. For instance, roughly 51% of routine, risk III inspections result in no red points. And while the average number of red points is roughly 10.5, some inspections score as high as 190 points. Moreover, newly hired employees tend to score at substantially higher ranges of point scores. To investigate whether these results are driven by outliers, we fit the same models to a dataset with trimmed outcomes. We use the fact that the thirty-five red point threshold triggers a return inspection. Once inspectors have reached the return threshold, many do not exhaustively document all violations beyond the threshold. We hence trim inspection scores at thirty-five points, roughly 6% of the sample, to reduce the role of outliers. The middle columns present results for this trimmed dataset, corroborating the inference that peer review improved inspector consistency: there is a 0.95 (posterior) probability that the intervention reduced the variability of inspector effects.

Peer Review 69 STAN. L. REV. 1 (2017)
66
Table 4
Raw
Trimmed
Trimmed Compliers
Baseline interinspector variance ( 0)
28.03 (7.60)
25.19 (6.61)
13.76 (3.72)
13.28 (3.62)
13.61 (3.72)
13.15 (3.70)
Interinspector variance in treatment group post-peer review ( 1)
13.59 (6.23)
10.96 (5.06)
6.62 (2.92)
6.11 (2.76)
5.26 (2.61)
4.57 (2.23)
Probability of convergence [P( 1 <
0)]
0.94 0.96 0.95 0.95 0.97 0.99
Proportion ( 1/ 0) 0.48 0.44 0.48 0.46 0.39 0.35 Inspector effect Yes Yes Yes Yes Yes Yes Establishment effect No Yes No Yes No Yes Parameters 58 5411 58 5411 56 5400 N 28,615 23,962 28,615 23,962 27,713 23,363
Convergence models. The left two models represent parameters for red points with the raw data (“Raw”). The middle two models present parameters for data trimming red scores at the 35-point return threshold (“Trimmed”). The right two models use trimmed data and exclude one treatment employee who did not conduct many routine, risk III inspections during the peer review process due to other obligations (“Trimmed Compliers”). For each group, we present estimates for models with and without establishment fixed effects. τ1 represents the variance in the peer review group after the intervention started; 0 represents the variability in the baseline condition (i.e., the control group or the treatment group prior to the intervention). Posterior standard errors are in parentheses. Lastly, one treatment employee—due to preparations for a county presen-
tation and non-risk III inspections—did not conduct many routine risk III inspections during the principal portion of the peer review. We hence fit the model excluding this one inspector, the results of which are presented in the right panels.306 Evidence of convergence remains comparable. Across these
306. This form of noncompliance could of course be modeled more directly. See Constantine E. Frangakis & Donald B. Rubin, Principal Stratification in Causal Inference, 58 BIOMETRICS 21, 22-28 (2002) (proposing a methodology for comparing treatments adjusting for post-treatment variables). Noncompliance is also itself an indicator of the feasibility of peer review.

Peer Review 69 STAN. L. REV. 1 (2017)
67
models, the interinspector variance with peer review is 35% to 48% of the baseline.
To illustrate the findings and intuition, Figure 8 below plots each inspec-tor’s average red points before and after the intervention by subgroup. Dots are weighted by sample size, reflecting the fact that more inspections were conducted in the pre-intervention period. The y-axis represents the average number of (trimmed) red points, with lines connecting the same inspector before and after the intervention. The control group in the right panel exhibits relative stability over time—inspectors on the high range in the pre-period remain in the high range in the post-period, just as inspectors in the low range stay there over time. In the treatment group, however, the inspector averages exhibit signs of converging to the group mean. This is most pronounced for inspectors on the low end in the pre-period, who exhibit substantial gains, accounting for the overall average increase in red points. It is worth noting the substantive importance of this apparent asymmetry. Some supervisors were initially skeptical whether low-scoring inspectors would be affected by the intervention. Our evidence suggests that the group dynamic of peer review may be a particularly effective way to unsettle and disrupt longstanding habits. Individuals can be more open to change than one might think.
Figure 9 below plots the probability of convergence over time.307 While gains appeared relatively quickly, convergence appeared to take considerably more time. The gray bands plot the time period during which we reformed the huddle trainings to provide much more intensive deliberation over specific code items. Evidence of convergence is strongest after the revised huddles.
In sum, our evidence suggests not only that peer review on average increased critical violations detected but that it decreased interinspector variability.
307. We do this by fitting a model for data up until each week.

Peer Review 69 STAN. L. REV. 1 (2017)
68
Mea
n R
ed P
oint
s
Before After
05
1015
Before After
05
1015
Figure 8 Treatment Control
Evidence of convergence in inspector average scores before and after interven-tion across treatment and control groups. Each dot represents the mean number of red points for an inspector before the intervention (on the left) or after the intervention (on the right). Dots are weighted by the number of inspections conducted. Lines connect the same inspector. The left panel presents inspectors in the treatment group, and the right panel presents inspectors in the control group. While inspectors remain anchored around their pre-intervention average in the control group, the treatment group exhibits signs of convergence, principally driven by low-scoring inspectors increasing their point score after the interven-tion. These data represent the trimmed complier sample.
FIGURE 8 HERE
Treatment
Mea
n R
ed P
oint
s
Before After
05
1015
Control
Before After
05
1015

Peer Review 69 STAN. L. REV. 1 (2017)
69
Mar May Jul Sep
0.5
0.6
0.7
0.8
0.9
1.0
Prob
abilit
y of
Con
verg
ence
Figure 9
Probability of convergence over time. The line represents the posterior probabil-ity that the interinspector variance parameter in the treatment group after the intervention is smaller than in the baseline condition, with separate models run for each week. The gray lines indicate the period during which the modified huddles were developed. Models were fit to the trimmed complier sample.
C. Qualitative Results
We now present results based on structured interviews with each member of the peer review team and responses to the weekly survey. The response rate was high,308 but response bias is of course possible.309 One aspect alleviating this concern is that interviewees were very candid, expressing a wide range of opinions about the food program generally. Yet nearly all were enthusiastic about the peer review intervention. To provide a clearer sense of this, we coded survey answers to two questions to indicate whether the respondent
308. Interviews were conducted with all twenty-four members of the peer review team. The response rate to the survey was quite high during the first five weeks, with 80% to 96% of respondents answering the survey each week. Because the same questions were sent out each week, and because of the expanded huddle trainings, the response rate dropped in later weeks. Overall, we received 195 survey responses.
309. Such bias may come, for example, from fake or untruthful answers. See Adrian Furnham, Response Bias, Social Desirability and Dissimulation, 7 PERSONALITY & INDIVIDUAL DIFFERENCES 385, 385 (1986) (defining the varieties of response bias).
FIGURE 9 HERE
0.6
0.7
0.8
0.9
1.0
Convergence Over TimeP
roba
bilit
y of
Con
verg
ence
Feb Mar Apr May June July Aug

Peer Review 69 STAN. L. REV. 1 (2017)
70
mentioned particular benefits or costs.310 Of the nearly two hundred anonymous responses, 48% indicated distinct benefits and 5% indicated costs.
The responses were also quite informative about the mechanism of peer review. Many highlighted how focusing on risk helped improve the consistency of the inspection process. Inspectors found the huddles to be the most valuable for improving consistency, reporting that the early huddles at times generated even more uncertainty about code items, which the revised huddles began to clarify. There was “no chance to develop these guidelines outside of the huddle,” and a first-year inspector found the huddle to be “more helpful than state or local training.” As one respondent noted, “discussing the severity of every violation in regard to causing illnesses or analyzing risk associated with the violation” is “helping us become more consistent.” Another indicated, “I think this study is helping us become more consistent and [I learned to] discuss[] the severity of every violation in regard to causing illnesses or analyzing risk associated with the violation.” Some inspectors noted that “in the beginning, we [thought] we kn[e]w the code,” but that the peer review has been a “wake up call.” Another remarked, “I’ve been in the county for 20 years. It’s about time we had some introspection.” Wrote yet another, “Irrespective of study outcome, this project will have made me better and more effective at what I do.”
One example of field learning noted by several participants was observing one peer request that establishment operators take apart a meat slicer. In the past, an investigation revealed a meat slicer to have contributed to a large, multivenue salmonella outbreak.311 Pathogens had accumulated inside the slicer despite the fact that it had been superficially cleaned.312 Whether a manager could disassemble the meat slicer also provided a sense of “active managerial control” (that is, proactive management involvement to prevent food risk).313 If unable to, the inspection provided a good teaching opportunity
310. We used the general comment field and the field about what inspectors learned during the inspection to code whether a benefit or a cost to the intervention was noted. For instance, the comment “Takes a lot of time if there are a large number of problems to deal with” was coded as noting a cost. An example of a comment coded as mentioning a benefit was: “I learned that there’s a lot more that I need to learn such as using the marking instructions and cross referencing the Food Code.” These fields are admittedly limited. While we contemplated using more direct survey questions (for example, “Are you satisfied with the peer review?”), our aim with the survey was primarily to receive feedback on what code items needed clarification, and we were concerned about survey responses simply venting about general food program issues.
311. The ultimate source was a USDA processor. 312. E-mail from Phil Wyman, Health & Envtl. Investigator, King Cty. Dep’t of Pub. Health,
to Daniel E. Ho, Professor of Law, Stanford Law Sch. (Jan. 28, 2016, 9:43 AM) (on file with author).
313. The FDA defines active managerial control as “the purposeful incorporation of specific actions or procedures by industry management into the operation of their business to
footnote continued on next page

Peer Review 69 STAN. L. REV. 1 (2017)
71
to show managers how to do this prospectively and build trust with the establishment. The inspectors observing their peer ask this question found it an ingenious technique and began to adopt it as part of their inspection process.
Survey respondents noted many other unanticipated benefits of the peer review process. First, many expressed that peer review led them to reengage with their job and place greater value on professional judgment. One respondent noted, “I learned that there’s a lot more that I need to learn such as using the marking instructions and cross referencing the Food Code.” Another person remarked:
Seeing the other person do their inspection helped highlight where my weakness-es are - very interesting and is helping me to do better inspections!!! VERY COOL!!! This is a VERY good thing because we usually go out by ourselves and can get stuck in our own way of thinking instead of expanding it by seeing other people and how they do things.
Said another, “I am finding that it is an imperative tool in helping me be a better inspector. . . . It also helps me value my profession more, which is a godsend. I do not feel so alone which is nice.”
Second, the peer review appeared to improve group cohesion. Because inspectors belong to two different physical offices (and report to three different supervisors), cultural differences and tensions had historically characterized staff relations. Prior to the intervention, supervisors feared that peer review might exacerbate those tensions, leading inspectors to defend their decisions against one another. Over time, the opposite occurred. One inspector said that her “favorite part was getting to know people in the other office.” One wrote that “the bonne home [sic] that was created by the peer review is very good for us.” Another noted that the huddles “united us,” and another reported the “extreme value of sitting down over lunch and talking impromptu about our work. I learn a lot then.” Others felt that the peer review helped to bridge generational divides across the inspection staff, noting that “food safety is a science; veterans shouldn’t be staying in the science of their decade.” Hot desk employees noted peer review counteracted the problem of not being able to see colleagues each day. Others appreciated how peer review “pushed you out of your box” and emphasized the increase in camaraderie.
Third, many inspectors noted that peer review taught them interpersonal techniques for how to effectively engage and interact with operators on site. One indicated learning “[t]he importance of always asking important questions to the person in charge.” Another reported “lik[ing] my peer’s mellow approach. This approach will help diffuse confronting situations.” Another reported learning about the “importance of asking questions, informing the
attain control over foodborne illness risk factors.” 2013 FOOD CODE, supra note 41, annex 4 § 1(D), at 549.

Peer Review 69 STAN. L. REV. 1 (2017)
72
employees of the hazards, and finding solutions to correcting the issue . . . . You get better cooperation when you actively engage with the employees and show mutual respect.” Another inspector noted that peer review led her to ask more questions about the past and future food flow as a way to counteract conventional criticisms of inspections as merely a “snapshot in time.”
Fourth, inspectors reported many other discrete ways in which peer review sharpened their inspection skillset. In the context of a nursing home food inspection, one respondent appreciated the fact that a “peer reviewed with me the 10 items in the code referring to highly susceptible populations . . . , [as I had] not realize[d] there were that many issues.” Some reported gaining an appreciation of language access, which is particularly acute in light of concerns about the impact on ethnic restaurants314: “Not understanding a word that was said gave me a greater appreciation of ESL [English as a Second Language] difficulties in the field.” Others reported insights to increase inspection efficiency: “I learned shortcuts on the tablets”; “I learned a faster way to get to my area by taking a different road.” One respondent provided perhaps the most comprehensive assessment of skill development required: “[A] good inspector also should know many subjects and disciplines so that he or she can help to trouble shoot and provide a solution for operators like cooking, HVAC, plumbing, people skills, psychology, project management, construction materials, mechanics, proper cleaning techniques, etc.”315
The peer review process appeared to have collateral effects beyond routine inspections as well. In reformulating the huddle trainings, seniors and supervisors developed more effective ways to articulate their decisions to frontline staff. One inspector noted that because “time as a control” was relatively new to the health code, supervisors had been “confused” and the huddles “really clarified” ambiguities. One supervisor noted that being forced to go out into the field was particularly helpful because “I hadn’t done inspections for 25 years.” Plan reviewers similarly reported that routine inspections, not a typical part of the plan review process, were valuable.316 Mobile units, for instance, can present unique challenges for plan review but were not prevalent at the time that plan reviewers last served as frontline inspectors. “We’re trying to envision what a place looks like 6 months down the road,” a reviewer said, and conducting field inspections “made me more aware and changed the way I conduct plan review.” By anchoring code implementation on food
314. See supra note 268 and accompanying text (noting concerns about effects across types of restaurants).
315. This conception is close to Bardach and Kagan’s notion of the “good inspector,” who is “very nearly endow[ed] with the wisdom of Solomon, the craftiness of Ulysses, and the fortitude of Winston Churchill.” BARDACH & KAGAN, supra note 73, at 150-51.
316. While plan reviewers do not typically engage in routine inspections, they do conduct “pre-operational inspections” before an establishment opens.

Peer Review 69 STAN. L. REV. 1 (2017)
73
science, the huddle process also influenced the permitting process for temporary events. Previously, permit categories had been based largely on lists of food items, but the huddle process made clear that the same food item could vary dramatically in risk depending on the method of preparation.
The principal costs consisted of time and human resource management. Some inspectors reported that their partner did not carry out the peer review process as contemplated (for example, leaving early or chatting independently with the operator), and one person articulated frustration about resolving disagreements: “I do not enjoy it when people are so adamant about what they are doing that they cannot see another person’s point of view.” One inspector was reluctant to participate due to lack of familiarity with the tablet system. One plan reviewer was concerned about the process simply adding work, as plan review does not involve routine field inspections. The most acute challenge came from one vocal inspector, who has been part of the food program for nearly thirty years and feared that it would divide the department. One inspector opined on the peer review detractors: “[T]here are some [inspectors] that appreciate that this is over with, so that we can get back to making the same old mistakes.”
V. Limitations
While our RCT provides the strongest evidence for the efficacy of experimentalism to date, it is not without substantive and methodological limitations.
A. Substantive
Some may question whether the increase in inspection scores represents an increase in accuracy and/or a normatively desirable outcome. If the increase, for instance, merely reflects an increasing tendency to “go by the book,” it may exacerbate rather than ameliorate the problem of regulatory unreasonable-ness.317 As a normative matter, democratic experimentalism would posit that the fruits of a reflective and deliberative system are superior, particularly when accuracy cannot be easily gauged.318
Even without that normative position, however, there are reasons to believe that the results reflect an improvement. First, the peer review and huddle processes decidedly emphasized the exercise of enforcement discretion—that is, while the huddles clarified the book, the focus was not on mechanistic code application but rather on the use of risk assessment to determine when
317. See BARDACH & KAGAN, supra note 73, at 184-213 (discussing the regulatory ratchet that makes it difficult to move toward more flexible regulation).
318. I am indebted to William Simon for this point.

Peer Review 69 STAN. L. REV. 1 (2017)
74
conditions warranted a citation. Survey responses demonstrate that the peer review group subjectively felt the process led to greater accuracy. Said one inspector, “Experience and common sense insight of the inspection process is needed and a fair and accurate inspection is not going to happen only by memorizing a regulation code book.”
Second, increases in inspection scores were driven primarily by employees who previously cited violations at low rates, and it was these employees who were seen as underperforming prior to the intervention. One of these employees, for instance, found no red violations in 90% of inspections (compared to 36% of inspections by others in the same establishments). But one of those inspections with no violations in 2012, for instance, was followed by a laboratory-confirmed norovirus outbreak of twelve individuals, with one immune-compromised patient hospitalized. More generally, based on available data, establishments assigned to that low-scoring employee had a higher probability of an outbreak than for any other employee from 2012 to 2015.319
Third, one way to measure accuracy is by whether a reviewer agrees with the disposition in a case. The (statistically significant) increase over time in the agreement rate of peer inspections (see Figure 6 above) suggests that accuracy has improved. Last, King County’s increase in average citation rate reduced the gap with Pierce County (and FDA baseline studies), hence reducing intercounty inconsistency.
Another criticism might focus on consistency. Adherents of “responsive regulation,” for instance, might argue that some level of inconsistency is desirable because enforcement agents should tailor carrots and sticks based on interactions with the regulated entity.320 As an empirical matter, however, the levels of inconsistency prevalent in agencies—when cases are randomly assigned—make it hard to believe that observed inconsistencies are a function of optimal responsive regulation. Based on a field study of the Netherlands food safety system, Mascini and Van Wijk argue that responsive regulation itself can be undercut by the heterogeneity of inspection styles.321 Similarly, others might argue that the lack of predictability itself provides a deterrent effect.322
319. The sample size of sixty-seven laboratory-confirmed outbreaks is very small, impeding more serious statistical analysis.
320. See AYRES & BRAITHWAITE, supra note 265, at 19-53. 321. See Mascini & Van Wijk, supra note 265, at 34-37 (describing one instance where “one
inspector or team was in favor of a persuasive approach because its members were positive about a regulatee’s propensity or ability to comply, [but] another inspector or team chose a punitive approach because it had a negative view of the same regulatee”).
322. See, e.g., Tom Baker et al., The Virtues of Uncertainty in Law: An Experimental Approach, 89 IOWA L. REV. 443, 449-68 (2004) (providing an empirical study of the violation of legal norms supporting the hypothesis that “uncertainty with regard to either the size of a sanction or the probability of detection increases deterrence”).

Peer Review 69 STAN. L. REV. 1 (2017)
75
As an empirical matter, however, inspectors are assigned to areas for several years and operators have short time horizons given high turnover in the industry.323 As a result of these behavioral realities, stakeholders—including consumer groups and food safety staff—favored enforcement consistency, based on the belief that predictability not only improves fairness but also the likelihood of compliance.324
Some might argue that our intervention provides limited insight into the most ambitious version of experimentalism as a theory of government. If democratic experimentalism involves mutual learning exclusively between governmental units, our study may have less to offer. However, Dorf and Sabel
323. See supra note 174. 324. To sketch out this idea in a deterrence framework, assume that the average inspector
cites the socially optimal number of violations. Consider three scenarios. (1) Fixed areas: without area rotations, operators with lenient inspectors will undercomply and operators with tough inspectors will overcomply. But safety measures will be socially optimal in the aggregate. (2) Random assignment: if, on the other hand, inspectors are purely randomly assigned, risk-neutral operators may engage in socially optimal precautions. Given the geography of King County, however, pure random assignment would have dramatic commuting costs, lowering the probability of inspection substantially. (3) The intermediate scenario, then, is that inspectors are assigned for roughly three years to an area. In that scenario, deterrence theory might posit that an operator with a tough inspector would decrease compliance relative to fixed areas and that an operator with a lenient inspector would increase compliance relative to fixed areas because of the probability of an area rotation. The latter may be behaviorally unrealistic. First, area rotations do not occur frequently. Second, the failure rate in the restaurant sector is quite high, meaning that the time horizons for operators are short. See Chris Muller & Robert H. Woods, The Real Failure Rate of Restaurants, FIU HOSPITALITY REV., Jan. 1991, at 60, 63, 65 n.4 (finding in preliminary results that 27% of restaurants failed during their first year in Syracuse, New York and Boone and Shelby, North Carolina). Third, King County does not as a general matter assess fines for violations, so the concrete risk is a very low probability of being shut down. Fourth, inspection staff report that compliance is very difficult to secure after a rotation into an area with a previously lenient inspector. These factors make one doubt whether an area with a lenient inspector is anticipating the probability of a tougher inspector, particularly when the distribution of inspection styles is highly uncertain. Jin and Lee develop a formal theoretical model of restaurant inspections with fines and inspection heterogeneity, where inspectors learn about inspection styles after a single inspection conducted by an inspector. See Jin & Lee, supra note 47, at 4-17. They show through simulation evidence that detection is enhanced by random assignment or making inspectors more homogeneously stringent. Id. at 17-28. The latter is consistent with our evidence of an increase in citation rates and a reduction in interinspector variability. In a more general theoretical framework, Richard Craswell and John E. Calfee show that enforcement uncertainty can have complicated effects, leading to overdeterrence in some instances and underdeterrence in others. See Richard Craswell & John E. Calfee, Deterrence and Uncertain Legal Standards, 2 J.L. ECON. & ORG. 279, 280 (1986); see also John E. Calfee & Richard Craswell, Some Effects of Uncertainty on Compliance with Legal Standards, 70 VA. L. REV. 965, 966 n.2 (1984) (noting that the need to “control[] the discretion of . . . enforcement agencies” may be the purview of democratic, not economic, theory).

Peer Review 69 STAN. L. REV. 1 (2017)
76
themselves write that experimentalist mechanisms can operate on a micro level, with local units composed of line-level inspectors as opposed to larger coordinating bodies.325 In addition, the peer review intervention certainly appeared to (a) reorient the agency’s mission toward risk assessment to tailor code application to establishments and (b) produce mutual learning among staff to bridge longstanding divisions in regulatory approaches (punitive versus educational). Lastly, learning occurred not just within the staff but also horizontally between counties and vertically between the county and state.
B. Methodological
There are also several methodological limitations to our study. First, the jurisdiction was not randomly selected, so effects identified by our intervention may not generalize to other jurisdictions. This “randomization bias” is well known in the literature on social experiments.326 A jurisdiction willing to subject itself to a resource-intensive intervention to randomization may be different in many respects from other jurisdictions. Management is critical in this kind of effort. It takes a manager who has the boldness to fix what is broken, the leadership to effectively engage with staff, and the savvy to facilitate change and carry out an experimental evaluation. In other counties, where there may be less managerial commitment, the gains from peer review may not be as substantial. Indeed, the initial fears of the county—that peer review would exacerbate preexisting divisions internal to the staff—could materialize in other settings.
Second, while our RCT provides the first rigorous assessment of the effects of peer review, our treatment is a compound one, consisting of both the weekly peer review days and the weekly huddles and training sessions. We hence cannot disentangle the effects of training or peer review visits.327 What
325. See supra notes 88-92 and accompanying text. 326. See, e.g., Angus Deaton, Instruments, Randomization, and Learning About Development, 48 J.
ECON. LITERATURE 424, 445 (2010) (discussing how subjects who agree to participate in randomized experiments are not necessarily representative of the population of interest); James J. Heckman & Jeffrey A. Smith, Assessing the Case for Social Experiments, 9 J. ECON. PERSP. 85, 92 (discussing randomization bias); Ho, supra note 56, at 153 (noting that effects in jurisdictions open to randomization may not generalize to the popula-tion); Steven D. Levitt & John A. List, Field Experiments in Economics: The Past, the Present, and the Future, 53 EUR. ECON. REV. 1, 6 (2009) (reviewing literature on randomi-zation bias).
327. Indeed, it is even possible that all of the effects observed simply have to do with the inspectors’ awareness of being studied (a Hawthorne effect). This strikes us as an implausible mechanism, as the control group was also aware of the ongoing research. Neither the treatment nor control group, however, was aware of the kind of outcomes analysis being undertaken. As an example in contrast, in a well-known experiment in Tennessee, Project STAR, which looked at the effects of class size on educational achievement, teachers were likely aware that future public funding decisions would
footnote continued on next page

Peer Review 69 STAN. L. REV. 1 (2017)
77
we can say is that (i) the peer visits helped to crystallize issues of consistency for the staff and (ii) the training sessions would not have been possible without the information from the peer review visits, which allowed the county to focus on the most important code clarifications. Going forward, there is likely an optimal mix between peer visits and training, but either alone is likely insufficient.
Third, while we examined some 28,000 inspections in the eighth-largest food safety jurisdiction in the country,328 the effective sample size for the randomization remains limited. With forty-eight individuals randomized into treatment and control groups, and routine inspection information coming only from seventeen frontline inspectors in each group, the experiment is limited in statistical precision.329 The highly skewed distribution of inspection scores also means that results can be sensitive to outlier inspections with high point totals.330 The statistical adjustments (randomization inference or clustering by inspectors) properly address the fact that the unit of randomiza-tion occurs at the inspector level. While findings appear substantively large and statistically significant, they are nonetheless consistent with a wide range of treatment effects.
Fourth, while the average effects appear immediate and strong, conver-gence effects take longer to materialize. Figure 8 above shows that eight months after the intervention, inspectors in the treatment group still exhibit substantial differences, with one inspector averaging 14 red points and another 6.5 red points. Due to the limited observation period, statistical power to detect convergence may be lower than desired.
Fifth, from the researcher’s perspective, implementing and analyzing the experiment presented a host of challenges related to real-time demands and constraints on the county side. King County had already committed to implementing restaurant grading, so the pressure to learn quickly to determine whether to generalize the intervention to the full staff was substantial. Employee grievances meant that a small number of pairs had to be restricted from being matched. Many inspectors shifted to conducting swimming pool
hinge on the results of the experiment. Eric A. Hanushek, Some Findings from an Independent Investigation of the Tennessee STAR Experiment and from Other Investigations of Class Size Effects, 21 EDUC. EVALUATION & POL’Y ANALYSIS 143, 153 (1999).
328. See Ho, supra note 47, at 602 tbl.1. 329. Relatedly, while we checked balance along all observable features available at the time
that randomization was conducted, balance across offices was not ideal in retrospect. Seventeen individuals in the treatment group were from downtown, compared to fourteen individuals in the control group. While this difference is not statistically significant (the p-value is 0.55), a form of stratified block randomization might have better adjusted for such chance differences.
330. This is the reason we reran all models trimming outliers, which yielded comparable results.

Peer Review 69 STAN. L. REV. 1 (2017)
78
inspections in the summer, limiting the ability to continue with peer review and substantial training. The control group was naturally very curious about what was going on with peer review, and we had to take measures to prevent informational contamination.331 And while we requested all available data, we only later discovered other data that might have been useful to design the intervention.332 In an ideal setting, the experimental intervention would have been carried out for a longer period of time to provide more precise answers. That said, the benefits in terms of training, guidance documents, and qualitative feedback were so substantial that irrespective of the precise convergence gains, the supervisors saw tremendous value in expanding peer review to the full staff.
None of these limitations detract from the fact that this is the first RCT to place peer review and democratic experimentalism on a firm evidence base. The challenges and limitations in research design may well explain the dearth of evidence to date, but our study has shown that rigorous assessments are possible. Placing these governance interventions on a firmer evidence base is a critical path forward for governments to efficiently and effectively deploy resources.
VI. Implications
This Part spells out the legal and policy implications of our RCT. Given the pervasiveness of frontline discretion, Subpart A argues that all institutions should partner with researchers to conduct randomized evaluations of peer review. Subpart B argues that the conventional administrative law answer to frontline discretion—more rules, rules, rules—is mistaken and that the peer review intervention points in the direction of more flexible guidance. Subpart C argues that peer review’s potential effectiveness is constrained by—and can only mitigate small aspects of—conventional administrative law challenges, chiefly the terms of appointment, removal, and decisional independence.
331. Initially, we considered randomizing based on the office to minimize interactions between the peer review and control groups. Because of considerable interoffice differences, we determined that this design would fail to provide one of the main anticipated benefits of having staff from different offices work together. To prevent informational contamination in the intervention, we did not end up circulating the full guidance memoranda beyond the senior staff and instead chose to translate these into much simpler exercises to be used during the huddle. Second, as noted above, we confined peer inspections to establishments in areas assigned to members of the peer review team. Third, we withheld results from the peer review group until the decision was made whether to extend the intervention to the full staff or to cease entirely. Fourth, we did not revise any of the marking instructions, as these were consulted by all staff, during the study period.
332. For instance, we were not aware of pool inspection assignments, and these could have been helpful to assess balance across treatment and control groups.

Peer Review 69 STAN. L. REV. 1 (2017)
79
Subpart D considers the case of peer review against more conventional forms of quality assurance, arguing that peer review offers a compelling solution when quality assurance is barred as a matter of political economy. Subpart E shows how certain facile reforms (for example, restaurant letter grading or calorie disclosure) can actually have detrimental effects on an agency’s ability to impose rationality on frontline decisionmaking.
A. Peer Review
Our intervention provides compelling evidence that peer review as a governance institution can work to improve the accuracy and consistency of administering the law. King and Pierce Counties deserve a tremendous amount of credit for the boldness and vision to pioneer an RCT of the efficacy of this intervention. Given the paucity of evidence-based techniques to solve this ubiquitous challenge of enforcement inconsistency, other jurisdictions should follow suit. There is little reason for the myriad of agencies333 with decentralized decisionmaking not to explore, pilot, and test a peer review model. To be sure, peer review would have to be adapted to different institutional settings. For instance, in more formal adjudicative settings, the design of peer review would have to cohere with procedural protections.334 Most importantly, peer review should be subjected to rigorous evaluation (that is, an RCT) across jurisdictions and government agencies.
There are, admittedly, costs to engaging in peer review that need to be acknowledged more openly by democratic experimentalists.335 First, there are substantial management costs. Managers developed training materials for the huddles, supervised the peer review process, and participated in peer inspections. But these costs are lower than those for pure top-down supervision, as the experimentalist process allows frontline staff to become engaged in developing suitable materials and guidelines.336 Second, designing and analyzing results of the intervention are costly. By designing the intervention as a rigorous RCT, however, agencies can leverage relationships with scholars who have the research resources to help design and analyze data. Such an evaluation should be built into the design of the intervention at the
333. See supra notes 1-49 and accompanying text; see also infra Appendix A. 334. For instance, to protect decisional independence, deliberation would likely have to
occur after a decision is issued. 335. See Super, supra note 116, at 557-58 (“[D]emocratic experimentalism assumes the
absence of . . . agency problems, . . . costs beyond state and local governments’ capacity, and the burdens to businesses operating in multiple jurisdictions of learning and complying with each set of requirements.” (footnote omitted)).
336. See Sabel & Simon, supra note 94, at 81 (“The distinctive goal of experimentalist incentive design is to induce actors to engage in investigation, information sharing, and deliberation . . . .”).
Peer Review 69 STAN. L. REV. 1 (2017)
80
outset, not as an afterthought to an intervention that would pose far greater methodological challenges. As was the case in this study, many scholars may be willing to offer research resources to carry out a well-designed experiment. Given the willingness of scholars to help, when an agency like the Patent and Trademark Office engages in peer sourcing337 or when the Executive Office for Immigration Review pilots a “peer observation program,”338 it should be deemed unacceptable to fail to evaluate the intervention rigorously. Third, peer review does require some allocation of inspection resources. We calculate that peer review costs approximately one full-time equivalent (FTE) inspector in terms of inspections that could otherwise have been completed, primarily because inspectors are doubled up during an inspection and because peer review inspections take more time.339 The increased huddle times also show that deliberation is not costless. And because peer review is best conceived of not as a one-time intervention but rather as an ongoing process that provides space for issues to be discussed and resolved, costs are recurrent.
While these costs are nontrivial, our evidence validates one of the only mechanisms to address the core challenge of managing frontline discretion that is pervasive across the administrative state. The implication is not that all agencies institute peer review permanently but rather that rigorous experimentation should begin to determine costs and benefits dynamically.340 In implementing peer review for its full staff, for instance, King County reduced the number of joint inspection days per month, as the intervention had yielded sufficient information on how to target trainings, which appears to meet a basic cost-benefit test.341 The county estimated that integrating peer
337. See Kintisch, supra note 79, at 982; Noveck, supra note 79, at 143-61. 338. See EXEC. OFFICE FOR IMMIGRATION REVIEW, supra note 128, at 2. 339. Without peer review, inspectors would have been able to conduct roughly 1224
routine inspections collectively (16 weeks × 17 frontline inspectors × 4.5 inspections per inspector per week). With peer review, inspectors completed around 378 inspections. The difference is just under the expected caseload for one FTE frontline inspector.
340. For instance, an agency could run a pilot program to better assess costs and benefits. Similarly, over time, if the peer review process proves effective, there will likely be diminishing gains. At that point, an agency could choose to decrease the frequency of peer reviews and huddles.
341. We can conduct a cost-benefit analysis (CBA) of the intervention, solely with respect to whether the benefit of the average treatment effect (an increase in citation rates) exceeded the cost of foregone inspections due to peer review days. For instance, we can use (a) CDC estimates of foodborne illnesses (one in six Americans annually), see Div. of Foodborne, Waterborne & Envtl. Diseases, supra note 190; (b) the reported odds ratio of 6.3 of a foodborne illness outbreak given that a critical violation is scored in King County (with an average of 2.9 cases per outbreak), see Kathleen Irwin et al., Results of Routine Restaurant Inspections Can Predict Outbreaks of Foodborne Illness: The Seattle-King County Experience, 79 AM. J. PUB. HEALTH 586, 588 & tbl.1 (1989); (c) an estimated increase in the probability of any critical violation being cited of 4% from the intervention; and (d) an average cost estimate per case of foodborne illness of $1626, see Robert L. Scharff,
footnote continued on next page

Peer Review 69 STAN. L. REV. 1 (2017)
81
review going forward would only add 2% to existing prior professional development hours.342 The optimal balance between joint inspections and training will of course vary across jurisdictions and over time.
Peer review should also be considered as a remedy by courts in public law litigation. Jerry Mashaw lucidly argues that procedural due process has failed miserably in its mission to rationalize frontline decisionmaking.343 Instead, he argues, due process should require the imposition of a management system, such as a set of strong quality assurance mechanisms.344 One overarching concern about judicial involvement is that courts are poorly situated to oversee the management of an institution.345 Of course, in part for those reasons, administrative law shields many routine management decisions from judicial review.346 Yet in some settings, courts have in fact ordered remedies that
Economic Burden from Health Losses Due to Foodborne Illness in the United States, 75 J. FOOD PROTECTION 123, 126 tbl.2 (2012). There are, however, severe limitations to this CBA. First, it does not capture the benefits in terms of quality, consistency, morale, efficiency of identifying violations in need of training, and effectiveness of securing the compliance of operators, quantifying only the net benefits due to the increased citation rate. Second, using the reported odds ratio assumes away any health benefit to a citation of an additional critical violation, conditional on a critical violation already having been cited, which is implausible. The 4% increase in any critical violation rate being cited understates the impact, as the intervention affected the citation of critical violations beyond the first violation cited. Third, foodborne illnesses are subject to serious underreporting, and very wide uncertainty intervals on incidence rates limit the analysis substantially. Fourth, while the economic costs of most (common) foodborne illnesses are relatively small, outbreaks can impose very large economic costs. See Sandra Hoffman et al., Annual Costs of Illness and Quality-Adjusted Life Year Losses in the United States Due to 14 Foodborne Pathogens, 75 J. FOOD PROTECTION 1292, 1297 tbl.3 (2012). Fifth, costs do not include management costs to design training materials or research costs to analyze outcomes. All of these factors mean that the CBA can be very sensitive. That said, the CBA reveals the following. First, examining exclusively the retrospective intervention period from January to August of 2015, there was a net benefit of roughly $370,000. Forecasting with one peer review day per month for the whole staff for a five-year period suggests a net present benefit between $5.8 and $17.3 million. The intuition is that training and peer review as we designed them are costly in the short run but can have substantial long-term benefits if properly designed. We emphasize, however, that this CBA is extremely limited and sensitive to weak inputs.
342. These calculations were conducted by the senior staff and are on file with the Author. 343. See Mashaw, supra note 14, at 776-91. 344. Id. at 791-823. 345. In an administrative law setting, Vermont Yankee Nuclear Power Corp. v. Natural
Resources Defense Council, Inc., 435 U.S. 519, 524 (1978), would preclude the judicial imposition of specific additional procedures on the agency.
346. For enforcement decisions, see Heckler v. Chaney, 470 U.S. 821, 837 (1985), which held the FDA’s nonenforcement decision to be committed to agency discretion by law. The conventional federal vehicle for judicial review would be an arbitrary and capricious challenge under the Administrative Procedure Act. For a discussion of problems in
footnote continued on next page

Peer Review 69 STAN. L. REV. 1 (2017)
82
approximate experimentalist standards.347 For instance, structural impact litigation against child welfare agencies in Alabama and Utah ultimately led to consent decrees that set out performance standards for these agencies, coupled with desk audits to monitor compliance.348 These consent decrees, in turn, led to the development of the QSR peer review process.349 Peer review should be considered as a judicial remedy in public law litigation aiming to change agencies where part of the problem stems from frontline discretion.350
B. Rules and Guidance
Limits of Rules. For decades, the standard administrative law answer to guiding line-level discretion has been to write more rules.351 If the exercise of all discretion could only be boiled down to a formula, the administrative state would solve the problem of frontline discretion. Our intervention suggests that the answer is not so simple. Due to time and practical constraints, frontline inspectors have limited capacity to absorb, administer, and implement complex rules. Consider New York’s highly complex rule-bound system, the goal of which, described by one food science writer, was “to write rules that an inspector who doesn’t know how to cook can apply in every case.”352 New
challenging an agency’s failure to manage, see Simon, supra note 17, at 74-75. See also Cuéllar, supra note 51, at 243 (“[B]ureaucratic decisionmakers retain nearly unfettered freedom from review in a bewildering range of contexts . . . .”).
347. See Charles F. Sabel & William H. Simon, Destabilization Rights: How Public Law Litigation Succeeds, 117 HARV. L. REV. 1016, 1016-21 (2004).
348. See Noonan et al., supra note 35, at 534-36. 349. Id. at 537-38. Paul Vincent, Alabama’s child welfare director and later the court monitor
in Utah’s settlement, describes the QSR as “a core element of both the Alabama and Utah settlements.” Paul Vincent, Structuring Litigation-Driven Child Welfare Reform for Success, in FOR THE WELFARE OF CHILDREN: LESSONS LEARNED FROM CLASS ACTION LITIGATION 8, 16 (Judith Meltzer et al. eds., 2012). In Utah, for example, a revised settlement established that QSR measures were to be used as exit conditions for court supervision. Id. For a brief historical overview of the use of qualitative methods like the QSR as monitoring tools in child welfare consent decrees, see Kathleen G. Noonan, Qualitative Case Review in a Child Welfare Lawsuit, in FOR THE WELFARE OF CHILDREN: LESSONS LEARNED FROM CLASS ACTION LITIGATION, supra, at 49, 51-53, which notes that “[i]n both the Alabama and Utah lawsuits, the QSR became the central measure of compliance in decisions to terminate court supervision.” See also William S. Koski, The Evolving Role of the Courts in School Reform Twenty Years After Rose, 98 KY. L.J. 789, 805-27 (2009) (discussing the use of an experimentalist-style consent decree in school litigation).
350. For a discussion of how a judicial remedy can facilitate a predominately bottom-up process like peer review, see Noonan et al., supra note 35, at 534-51.
351. See KENNETH CULP DAVIS, DISCRETIONARY JUSTICE: A PRELIMINARY INQUIRY 97 (1969). 352. Eveline Chao, The Roast Duck Bureaucracy, OPEN CITY (Mar. 11, 2014) (quoting Dave
Arnold, Owner, Booker & Dax Restaurant), http://opencitymag.com/the-roast-duck -bureaucracy.

Peer Review 69 STAN. L. REV. 1 (2017)
83
York’s rules disaggregate a vermin violation (a single, blue violation in Washington) into four distinct violations—rats, mice, roaches, and filth flies—each of which can be scored 5, 6, 7, 8, or 28 points depending on the extent of the evidence.353 Thirty “fresh mice droppings in one area” yields 6 points, but thirty-one droppings 7 points.354 It is exceedingly unlikely that any inspector can carry out such a rule in practice.355 Such rule-bound systems are prevalent in nursing home inspections and nuclear regulatory inspections, but the reality is that inspectors rely only on a few commonly cited items.356 The Australian nursing home study also strongly suggests that the increased number of rules may decrease consistency across inspectors.357 While the motivation to reduce every possible scenario down to a rule might seem beneficial, our huddles underscore that, given real-world constraints, what may be more important is to (a) focus on the few violations that are frequently and inconsistently scored and (b) train inspection staff to reason through aspects of food risk and the underlying rationale for the code item. Mechanical application of rules may be neither feasible nor desirable in light of the wide range of scenarios inspectors can encounter.
Guidance. Our intervention also informs the way administrative law should grapple with guidance. One doctrine holds that binding guidance
353. See Ho, supra note 47, at 641; N.Y.C. Dep’t of Health & Mental Hygiene, What to Expect When You’re Inspected: A Guide for Food Service Operators 3, 4, 14-15 (2016), https://www1.nyc.gov/assets/doh/downloads/pdf/rii/blue-book.pdf.
354. See Ho, supra note 47, at 641; N.Y.C. Dep’t of Health & Mental Hygiene, supra note 353, at 14.
355. See Joanna Fantozzi, Grilling the Restaurant Inspectors, STRAUS MEDIA (Mar. 2, 2015), http://www.nypress.com/grilling-the-restaurant-inspectors (“[Inspectors] are well trained but they are not rocket scientists, and even if they were, everyone interprets things differently . . . . If one inspector counted [the] same number of droppings, it might have been 8 points instead of 28. Same droppings. Same store. You can’t train for that.” (quoting Robert S. Bookman, Gen. & Legislative Counsel, Hosp. All.)).
356. For nursing home inspections, see Braithwaite & Braithwaite, supra note 29, at 320, which quotes one American nursing home inspector as stating: “We use 10 percent of [the regulations] repeatedly. You get into the habit of citing the same ones. . . . Most are never used.” For nuclear regulatory inspections, see Nichols & Wildavsky, supra note 40, at 50, which notes that “there is a set of detailed specifications for the licensee to follow and a parallel set of detailed instructions by which these specifications are to be monitored” and concludes that “[t]he major drawback of all this detail is that the regulatory workload quickly outgrows the agency’s resources.”
357. Braithwaite & Braithwaite, supra note 29, at 317 (“Reliable ratings of the quality of care in nursing homes are possible when professional raters use a limited number of criteria; but when raters use the large number of specific American regulations as their criteria, reliability is lost.”); see also id. at 320 (“[W]hen surveyors have an impossible number of standards to check, arbitrary factors will cause particular standards to be checked in some homes but neglected in others, causing endemic unreliability.”).

Peer Review 69 STAN. L. REV. 1 (2017)
84
documents must follow the notice-and-comment process.358 Our evidence suggests that guidance can have strong benefits but that such formal requirements can stand in the way of peer review. First, guidance appears to be very beneficial for improving the quality of frontline decisions. The clearest evidence comes from the peer review, with many inspectors pointing to the huddles and guidance documents as helping to resolve difficult questions.359 There are distinct advantages to this system, compared to a rule-bound system like New York’s. By identifying high-baseline and high-deviation violations, peer review facilitates efficient allocation of training resources. There may be little payoff to developing complex rules for violations that are rarely cited, and the peer review helps to identify areas generating the highest inconsisten-cy.
Second, guidance is much more likely to be effective than rules imposed top-down, principally because of the level of engagement of frontline inspectors. Peer review inspections concretely demonstrate differences in how code items are implemented, generating the awareness and buy-in for more guidance. And the direct involvement of frontline inspectors in generating guidance fosters a deeper understanding of code items and underlying food risks.
Third, policymakers expressed anxiety about making the notion of discretion in the food safety system transparent via publication of guidance documents, even though everyone acknowledged the existence of such discretion. Because the development of guidelines is best seen as a continuous process, updated week-by-week with evidence from the field, formal procedural requirements would likely impede such development. As Sidney Shapiro and Randy Rabinowitz argue, “[e]xperimentation appears to be the only viable method to find the best mix of discretion and control.”360 This is not to say that guidelines could not be made publicly available. Indeed, they should be shared across jurisdictions and stakeholders for additional layers of peer review. But requiring additional process, as others have noted, can disincentivize the development of guidance documents in the first instance.361
358. See Cmty. Nutrition Inst. v. Young, 818 F.2d 943, 949 (D.C. Cir. 1987). The doctrine could be subject to considerable clarification with the recent preliminary injunction of the Obama Administration’s deferred action program.
359. From the peer review, we also see that blue violations are applied much more inconsistently than red violations. See supra Figure 3. Counties do not train much for these violations and have no marking instructions. WASH. STATE DEP’T OF HEALTH, supra note 258.
360. Sidney A. Shapiro & Randy S. Rabinowitz, Punishment Versus Cooperation in Regulatory Enforcement: A Case Study of OSHA, 49 ADMIN. L. REV. 713, 729 (1997).
361. See Michael Asimow, Nonlegislative Rulemaking and Regulatory Reform, 1985 DUKE L.J. 381, 405.

Peer Review 69 STAN. L. REV. 1 (2017)
85
C. New Governance, Old Problems?
Experimentalism is often styled as part of New Governance.362 Peer review, however, is no panacea. Its feasibility grapples with some old problems, long familiar in administrative law, only some of which it can mitigate.
Appointments. Peer review cannot address the age-old problem of appoint-ing and retaining high quality frontline staff.363 For food safety inspections, salary levels, limited opportunity for career advancement, the relative isolation for most field inspections, and potential for tension with operators can make hiring and retention difficult in these agencies.364 While retention per se has not been an issue in King County,365 and exceptionally skilled staff
362. See, e.g., Sabel & Simon, supra note 94, at 55 (“[E]xperimentalism . . . bears a strong resemblance to what others call ‘new governance’ or ‘responsive regulation.’”).
363. See, e.g., U.S. GOV’T ACCOUNTABILITY OFFICE, GAO-07-1102, U.S. PATENT AND TRADEMARK OFFICE: HIRING EFFORTS ARE NOT SUFFICIENT TO REDUCE THE PATENT APPLICATION BACKLOG 13 (2007) (finding that from 2002 to 2006, one examiner left the office for nearly every two hired); U.S. GEN. ACCOUNTING OFFICE, GAO-03-357, CHILD WELFARE: HHS COULD PLAY A GREATER ROLE IN HELPING CHILD WELFARE AGENCIES RECRUIT AND RETAIN STAFF 5 (2003) (noting that the national annual turnover of child welfare staff is estimated at between 30% and 40%); GREGORY A. HUBER, THE CRAFT OF BUREAUCRATIC NEUTRALITY: INTERESTS AND INFLUENCE IN GOVERNMENTAL REGULATION OF OCCUPATIONAL SAFETY 200, 201 tbl.4.8 (2007) (documenting turnover rates from 1990 to 1995 of 40% for federal Occupational Safety and Health Administra-tion inspectors and rates between 43% and 100% for state inspectors); Stephen Barr, Backlog, Quotas Overwhelm Patent Examiners, WASH. POST (Oct. 8, 2007), http://www.washingtonpost.com/wp-dyn/content/article/2007/10/07/ AR2007100701199.html (noting that a large number of patent examiners are hired straight out of college).
364. See SAN MATEO CTY. CIVIL GRAND JURY, supra note 174, at 2; Lawrence F. Katz & Alan B. Krueger, Public Sector Pay Flexibility: Labour Market and Budgetary Considerations, in PAY FLEXIBILITY IN THE PUBLIC SECTOR 43, 63-65, 64 fig.6, 65 fig.7 (1993) (using Office of Personnel Management personnel data to show that in areas where federal wages are high relative to private sector wages, the government is able to attract more high-skilled workers); Hailey Eber, Health Department Killjoys, N.Y. POST (Apr. 18, 2013, 4:00 AM), http://nyp.st/1hHLmp8 (describing inspectors as “blue-coated buzzkills”); Samuel Leff, Corruption in the Kitchen: A Health Inspector’s Inside Story, N.Y. MAG., Oct. 17, 1988, at 38, 40-41, 45 (noting threats and attacks by operators against the health inspector, the deputy commissioner’s description of it as a “tough” job, very limited time to conduct thorough inspections, low pay, and limited career opportunities in describing one agency’s culture of corruption); Marcus, supra note 174 (attributing one agency’s lack of experience to “[l]ow salaries and high turnover”); Megan Michelle Wright, Biting Off More Than They Can Chew?: Examining Performance for Restaurant Inspections Across North Carolina Counties 3, 5 (2009) (unpublished M.P.A. dissertation, University of North Carolina at Chapel Hill), http://www.mpa.unc.edu/sites/www.mpa.unc.edu/files/MeganWrightsCapstone.pdf (discussing understaffing problems in county food safety inspections).
365. On the other hand, there were three nonretirement departures of staff from King County’s food program from 2015 to 2016. One was in the control group, and two were in the treatment group. Two left to be closer to family and another to attend medical
footnote continued on next page

Peer Review 69 STAN. L. REV. 1 (2017)
86
exist in both counties,366 one of the challenges we encountered was that written guidance was not always absorbed. Some inspectors did not regularly consult the state’s marking instructions, and some of the guidance memoranda had to be succinctly distilled in order to be conveyed to the peer review group. To the extent that quality and consistency are driven by the limited ability of an agency to attract high-quality applicants, peer review cannot address first-order considerations of appointments, salaries, and promotions.367 Nonetheless, our intervention does suggest that peer review can mitigate some of the challenging parts of the inspection job and reengage staff with their profession and peers.368 Even those inspectors reluctant to read guidance documents are amenable to teaching by peers.
Removal. The high variability in performance statistics suggests that the “cause” standard for removal may be unrealistically high. King County has not discharged a frontline inspector for poor performance in recent history, despite the fact that some inspectors perform below six hundred inspections per year when others complete over one thousand.369 In Pierce County, one inspector pre-2011 spent excessive parts of the workday driving around370 instead of conducting inspections.371 That said, on the margin, peer review might help develop more accountability internal to an agency. Area assignments in King County, for instance, typically mean that only a single
school. These reasons appear orthogonal to the peer review program and are, in any case, relatively low.
366. For instance, as part of a routine inspection, one inspector uncovered an equipment failure with a broiler at Burger King. Broken ceramic tiles inside the units led to undercooked and contaminated food. The county proceeded to inspect all Burger King franchises in the county, documenting that the equipment failure was common to many of the franchises, thereby leading the company to take corrective action at all franchises. See Brandi Kruse, Investigation Leads to ‘Zero-Tolerance’ Policy at Burger King Corp., MYNORTHWEST (Apr. 18, 2012, 8:49 AM), http://mynorthwest.com/35999/investigation-leads-to-zero-tolerance-policy-at-burger-king-corp; Washington Warns Burger King of Undercooked Beef, FOOD SAFETY NEWS (Sept. 8, 2011), http://www.foodsafetynews.com/2011/09/washington-burger-kings-served -undercooked-beef.
367. Some evidence suggests that higher local health department expenditures are associated with lower infection rates. See Betty Bekemeier et al., Local Health Department Food Safety and Sanitation Expenditures and Reductions in Enteric Disease, 2000-2010, 105 AM. J. PUB. HEALTH (Supp. 2) S345, S346-S350 (2015).
368. The silver lining to high turnover, as seen in Pierce County, is that it can facilitate wholesale revamping of the management structure.
369. See supra Table 1 and accompanying text (describing how these statistics were calculated).
370. One official recalls it as close to three hours of driving a day. 371. After resigning in protest at the level of supervision, he attempted to collect
unemployment benefits, which the department successfully challenged. Pierce County terminated one employee during the probation period after 2011.

Peer Review 69 STAN. L. REV. 1 (2017)
87
inspector visits specific establishments. By mixing up who visits which areas, peer review can help uncover problematic areas and keep inspectors accountable to one another.
In the federal context, one welcome development on the removal front is the reversal of the thirty-year precedent by the Merit Systems Protection Board (MSPB) that caseload statistics alone were insufficient to prove cause.372 In Shapiro v. Social Security Administration,373 an ALJ challenged his termination as lacking cause.374 Within a year of starting as an ALJ in 1997, Mark Shapiro received repeated warnings from the SSA for scheduling too few hearings; by 2000, his docket had a “tremendous backlog.”375 For years, the agency engaged in “unprecedented and extraordinary efforts” to assist Shapiro in managing his caseload.376 Compared to the average in the same hearing office, Shapiro’s dispositions were as follows377:
2008 2009 2010
Shapiro 149 122 111 Average 567 611 630
The Federal Circuit agreed that the SSA had provided sufficient evidence
to support for-cause termination, concluding that the SSA should not be required to undergo the “herculean effort of providing testimony from four ALJs that an ALJ’s caseload was the same” to be able to rely on such productivity statistics.378
To be sure, caseload completions are only one measure of performance. Fixation on completion rates can have perverse effects, so it is important for agencies to develop more fine-grained measures of quality. As part of the peer
372. In Social Security Administration v. Goodman, 19 M.S.P.R. 321 (1984), the MSPB examined whether an ALJ who decided roughly 190 cases per year—compared to an average of 360 among other ALJs—could be discharged for cause. Id. at 324. The MSPB held that while poor performance could in principle constitute cause, id. at 330, the caseload statistics provided insufficient grounds: “[E]ven with a random assignment method, a single ALJ could have been assigned a disproportionate share of difficult, and therefore more time-consuming, cases,” id. at 332. For thirty years, this standard made it very difficult to discharge ALJs for poor performance. See Lubbers, Appropriate System, supra note 76, at 599-600 (describing Goodman and subsequent cases as presenting a “virtually insurmountable burden of proof” and as a “pyrrhic victory”).
373. 800 F.3d 1332 (Fed. Cir. 2015). 374. Id. at 1334. 375. Id. 376. Id. at 1334, 1338. 377. Id. at 1335. 378. Id. at 1338-39.

Peer Review 69 STAN. L. REV. 1 (2017)
88
review intervention, my research team developed an online tool to more meaningfully evaluate performance along twenty-five dimensions of output. For instance, caseload targets currently do not include return inspections; as a result, some inspectors simply fail to complete these visits within thirty-one days. These return visits, however, are critical to securing compliance from the riskiest establishments in the county. As these performance indicators for line-level officials develop, it should become easier to rely upon (and the case law should become more hospitable toward) such statistics as the basis for performance evaluation and removal.379
Decisional Independence. Peer review must also contend with claims for decisional independence. In the ALJ context, the political dispute over supervision and peer review centered on the notion that the Administrative Procedure Act “confer[s] a qualified right of decisional independence upon ALJs” and “creates a comprehensive bulwark to protect ALJs from agency interference.”380 In Nash v. Califano, an ALJ challenged a series of efforts by the SSA to manage a 113,000 case backload in the agency.381 The efforts included a peer review program, under which the agency would have reviewed cases outside of the usual appeals process and provided instructions on the length of hearings and opinions, evidentiary standards, and use of expert witnesses, as well as a “Quality Assurance Program” to monitor deviations from average reversal rates.382 In Nash v. Bowen,383 the Second Circuit upheld the peer review program but called into question the quality assurance program as potentially intruding on the decisional independence of ALJs,384 and hence the program was ultimately dropped. As Paul Verkuil put it, “[m]anagement techniques are no match for claims of independence.”385
Since then, there has been limited exploration of peer review programs, but the extent of these programs persistently runs into questions of decisional independence. Many ALJs continue to contend that peer review “is antiethical
379. A related model, based on data analysis of cases, is discussed by Gerald K. Ray & Jeffrey S. Lubbers, A Government Success Story: How Data Analysis by the Social Security Appeals Council (with a Push from the Administrative Conference of the United States) Is Transform-ing Social Security Disability Adjudication, 83 GEO. WASH. L. REV. 1575, 1590-607 (2015).
380. Nash v. Califano, 613 F.2d 10, 15-16 (2d Cir. 1980); see also 5 U.S.C. § 556 (2015) (providing for “impartial” decisionmaking and an exclusive record for formal adjudication); id. § 3105 (providing that ALJs “may not perform duties inconsistent with their duties and responsibilities as administrative law judges”); id. §§ 4301(2)(D), 4302(a) (exempting ALJs as employees subject to performance evaluation).
381. 613 F.2d at 12. 382. Id. at 13. 383. 869 F.2d 675 (2d Cir. 1989). 384. Id. at 680-81. 385. Paul R. Verkuil, Reflections upon the Federal Administrative Judiciary, 39 UCLA L. REV.
1341, 1355 (1992).

Peer Review 69 STAN. L. REV. 1 (2017)
89
[sic] to the concept of judicial independence,”386 which could explain why peer review programs have been extremely thin for ALJs. For instance, one ALJ describes one purpose of a peer review program as ensuring that there are no grammatical errors in opinions.387 With such a thin conception of peer review, the politics also appear to have reversed, with ALJs supporting such efforts. The SSA advocates stronger management techniques, but the Association of Administrative Law Judges (AALJ) advocates peer review, perhaps because of its decentralization:
The AALJ has advocated for an ALJ Peer Review Program at SSA for approxi-mately twenty years. The AALJ believes that such a system would efficiently and effectively address ALJ performance and conduct issues in a manner that would be beneficial to the Agency, the Judge and the American people. Instead, the Agency continues to address these issues in a manner that always leads to costly and time consuming litigation. The Agency has not only consistently opposed the establishment of a Peer Review Program but also any similar program. This past year, the AALJ proposed a joint workgroup to study and evaluate establishing an ALJ Peer Review Program. The Agency strongly opposed the creation of such a work group.388
For instance, some groups described peer review as a way of both bolstering decisional quality and increasing decisional independence.389 While the ALJ case demonstrates that peer review can be more politically feasible, it also shows how easily a program can be watered down in the face of decisional independence claims. One consulting report concluded that “no amount of retooling, refocusing, redesign, tinkering or the simple addition of resources to the existing [quality assurance] processes will achieve SSA’s quality improvement goals.”390
Such claims plague non-ALJ systems as well. Claims of independence in King and Pierce Counties emanate largely from the context of labor-
386. Ronnie A. Yoder & John Hardwicke, Yoder-Hardwicke Dialogue: Does Mandatory Quality Assurance Oversight of ALJ Decisions Violate ALJ Decisional Independence, Due Process or Ex Parte Prohibitions?, 17 J. NAT’L ASS’N ADMIN. L. JUDGES 75, 77 (1997).
387. See Gales, supra note 76, at 62-75. Gales also recognizes a form of “quality review” that focuses more on the legal accuracy, thoroughness, and sound logic of a piece of legal writing, though grammatical correctness still plays a role. See id. at 75-79.
388. Securing the Future of the Disability Insurance Program: Hearing Before the Subcomm. on Soc. Sec. of the H. Comm. on Ways & Means, 112th Cong. 8 (2012) (statement of Hon. D. Randall Frye, President, Association of Administrative Law Judges).
389. See Steve Risberger, News from the States: Oregon, NAT’L ASS’N ADMIN. L. JUDICIARY (Aug. 2002), https://naalj.memberclicks.net/assets/documents/NAALJNews_Summer 2002.pdf (“The Hearing Officer Panel’s new peer review system will place an emphasis on both decisional quality and greater decisional independence by ALJ[s].”).
390. THE LEWIN GROUP, INC. ET AL., EVALUATION OF SSA’S DISABILITY QUALITY ASSURANCE (QA) PROCESSES AND DEVELOPMENT OF QA OPTIONS THAT WILL SUPPORT THE LONG-TERM MANAGEMENT OF THE DISABILITY PROGRAM, at i (2001) (formatting altered).

Peer Review 69 STAN. L. REV. 1 (2017)
90
management relations. In the past, the union has claimed that each employee should have decisional independence over which establishments to visit on a given day.391 This autonomy, however, can have real costs. The 2010 quality improvement report of Pierce County stated:
Staggering amount of travel time relative to # of inspections per trip. In any other industry, would expect a lot of resources and energy devoted to optimizing logistics (getting the most from every trip, minimizing travel time, etc.). Most (but not all) interviewed seem to assume it can’t be improved. . . . What other industry would leave it up to the trucker to define his own delivery schedule?392 On the other hand, rather than undermining a culture of decisional
independence, peer review can in fact strengthen it. For example, peers were able to teach each other more efficient driving routes. More importantly, while the desire to reduce all possible fact patterns to a rule is understandable, that tendency can also rob inspectors of a critical element of professional judgment. Instead, the huddle training and guidance, delineating discretionary and nondiscretionary parameters, highlight the space in which inspectors are expected to apply their expertise in food science in the face of constantly changing conditions. In the words of the Pierce County manager, “I’m not paying you to check something off a list; I’m paying you to think about risk.”
D. Quality Assurance
Why use peer review instead of more conventional forms of quality assurance? To answer this question, we first have to consider the origins of quality assurance in the private sector. For manufactured physical widgets, quality assurance might entail the collection of overall quality indicators (for example, production statistics) as well as subjecting random samples of widgets to performance testing. This approach translates most easily into the public sector when the output is amenable to direct, observable quality measures, such as a physical good. For instance, laboratory work within a health department might be subjected to retesting for quality assurance, or samples of pavement
391. Telephone Interview with Becky Elias, supra note 239. 392. Tacoma-Pierce Cty. Health Dep’t, Preliminary QI Assessment 3 (Dec. 10, 2010) (on file
with author). Driving routes could easily be improved using modern operations research techniques. See generally Gilbert Laporte, The Vehicle Routing Problem: An Overview of Exact and Approximate Algorithms, 59 EUR. J. OPERATIONAL RES. 345, 345 (1992) (discussing development of algorithms to optimize vehicle routing paths). How many more inspections could have been conducted if driving routes were optimized? Or how much of the budget could have been saved? Transparency over these tradeoffs would be a welcome development to inform negotiations between employees and management over such claims of decisional independence. Pierce County did attempt to use routing software for one year.
Peer Review 69 STAN. L. REV. 1 (2017)
91
might be taken as an indicator of management of road quality.393 Adapting quality assurance becomes much tougher when the quality (food risk) cannot be directly and easily measured. As one commentator wrote, “no clear consensus exists about what processes should be tracked and standardized for a street-level bureaucrat.”394 As a result, many superficial forms of quality assurance have focused solely on caseloads, potentially sacrificing quality. New management in Pierce County, for instance, dramatically affected the number of inspections completed, but substantial variance in how inspections are conducted has persisted.
Here’s where we begin to understand why peer review, as a matter of political economy, might be more desirable than conventional quality assurance. First, the direct cost of serious quality assurance can be high. One inspector, who previously worked in the health department laboratory, reported that 20% to 25% of laboratory work involved quality assurance. Resources, however, can limit comparable efforts to standardize inspectors in food safety. A fee-supported department faces pressure to complete the requisite number of inspections, and the formal FDA standardization protocol places a substantial burden on upper-level management to conduct joint visits with each frontline inspector separately. The difference in the supervisor-staff ratio between Pierce and King Counties may explain why the former was able to complete standardization and the latter was not. In contrast, peer review spreads those costs more evenly across staff.
Second, conventional quality assurance is perceived of as a direct, top-down mechanism of control and can therefore face considerable staff opposition. The Office of Hearings and Appeals at the SSA, for instance, “walked on eggs as it instituted the quality assurance system.”395 The recommendation by the Administrative Conference of the United States (ACUS) to institute performance reviews led to fierce political backlash, ultimately contributing to the defunding of the ACUS.396 As Michael Lipsky notes, “breaking down the isolation of individual street-level bureaucrats will be mostly destructive if it is done simply in the name of higher degrees of scrutiny.”397 It is hence not surprising that in King County, staff have long resisted strong forms of quality assurance, describing FDA standardization as
393. See, e.g., LINDA M. PIERCE ET AL., U.S. DEP’T OF TRANSP., PRACTICAL GUIDE FOR QUALITY MANAGEMENT OF PAVEMENT CONDITION DATA COLLECTION 44 (2013), http://www.fhwa.dot.gov/pavement/management/qm/data_qm_guide.pdf.
394. Swiss, supra note 284, at 358. 395. Deborah A. Chassman & Howard Rolston, Social Security Disability Hearings: A Case
Study in Quality Assurance and Due Process, 65 CORNELL L. REV. 801, 809 (1980). 396. See Margaret H. Taylor, Refugee Roulette in an Administrative Law Context: The Déjà Vu
of Decisional Disparities in Agency Adjudication, 60 STAN. L. REV. 475, 494-95 (2007). 397. LIPSKY, supra note 74, at 206.

Peer Review 69 STAN. L. REV. 1 (2017)
92
“torture” and “buil[ding] resentment.” Peer review, on the other hand, was viewed by staff as much more congenial, as a collegial and collective effort to improve the consistency of decisionmaking. Peer review helped frontline staff grasp the impetus for greater guidelines, generating buy-in. As one inspector described it, FDA standardization is “top down; this is bottom up; we get our hands greasy.”
As a result, while it may not be the most direct way to promote accurate decisionmaking, peer review might, as a political economy matter, be the most feasible. The distinction between quality assurance and peer review is, to be sure, not a categorical one. Some critical design dimensions include whether (a) cases are randomly selected, (b) the reviewer is an external entity, (c) review is de novo, (d) review involves in-person interaction or is done on paper, and (e) the mechanism is used directly as a form of supervision. While the last factor may be the critical difference between peer review and quality assurance, many hybrid mechanisms may be designed to tailor a system to meet practical constraints.
E. Facile Reforms
Our research and work with the counties also highlight fundamental flaws of some popular and well-intended New Governance-style reforms. Some of these are not merely ineffective but can be downright harmful to accurate and consistent frontline decisionmaking. While peer review may not be flashy, it has the strongest promise for improving food safety on the ground.
Information Disclosure. While scholars have long recognized that infor-mation disclosure can be quite ineffective due to cognitive overload,398 restaurant grading remains hailed as the poster child for how to engage in disclosure.399 Our research shows that reforms like restaurant letter grading have tremendous surface appeal but ultimately mask deeper problems that render the reform meaningless. First, inspector variability swamps the information used to assign different grades. Given the variability in frontline discretion, the health inspection system is better situated to detect outliers and was not designed with fine-grained intermediate distinctions in mind.400 To
398. Ho, supra note 47, at 577-78. 399. Id. at 643-57. 400. See Troyen A. Brennan, The Role of Regulation in Quality Improvement, 76 MILBANK Q.
709, 712 (1998) (arguing that “regulation in every industry . . . often relies solely on culling,” namely “removing defects” from a system with little focus on quality improvement); Miguel A. Cruz et al., An Assessment of the Ability of Routine Restaurant Inspections to Predict Food-Borne Outbreaks in Miami-Dade County, Florida, 91 AM. J. PUB. HEALTH 821, 822 (2001) (finding no association between inspection results and foodborne outbreaks and noting that “inspections are a snapshot of conditions at a particular time”); Owen H. Seiver & Thomas H. Hatfield, Grading Systems for Retail Food
footnote continued on next page

Peer Review 69 STAN. L. REV. 1 (2017)
93
illustrate this, we show here how sensitive a grade can be by calculating counterfactual grades, assuming a tough or a lenient inspector was assigned to inspect all county establishments.401 Consider a grade cutoff for an A of five red points.402 Under a lenient inspector (set at the tenth percentile), 55% of King County establishments would earn an A. Under a tough inspector (set at the ninetieth percentile), only 2.5% of establishments would earn an A. Basing window placards on such fragile information provides falsely precise information to the public. Second, most jurisdictions engaging in grading exhibit rampant grade inflation that cannot be attributed to health improvements.403 In November 2011, of 8941 graded restaurants in San Diego, only eight had less than an A grade.404 Third, the public has dramatic misconceptions about the meaning of grades. One survey revealed that 22% of students would be willing to eat at a C-graded restaurant; in contrast, among food safety professionals—the individuals with the greatest expertise in food safety practices—65% would.405 Fourth, grading can have real resource costs. New York introduced a reinspection solely for grade resolution, which pathologically shifted inspection resources away from riskier establishments and toward grade disputes at the A/B boundary.406 Claims by the New York Health Department that grading has improved affairs are highly questiona-ble.407 The FDA Model Food Code abandoned grading in 1976, with one official noting that inspections provide only a snapshot in time.408
Facilities: A Risk-Based Analysis, J. ENVTL. HEALTH, Oct. 2000, at 22, 25-26 (“[T]he dynamic nature of restaurant operations . . . makes them so challenging to grade. . . . [S]tandardized forms do not guarantee standardized inspections, and standardized inspections do not guarantee consistent measures of risk.”).
401. We do this by fitting a simple linear regression model with raw outcome data used in Table 4 above, with inspector, establishment, and month fixed effects. We then use these coefficients to predict the number of red points for establishments assuming either that a lenient or tough inspector was assigned to inspect all establishments.
402. Recall that half of inspections result in zero red points. Because blue points are even more inconsistently applied, using exclusively red points if anything understates the impact of inspectors on a grade.
403. See Ho, supra note 47, at 611. 404. Id. 405. See Lauren Dundes & Sushama Rajapaksa, Scores and Grades: A Sampling of How College
Students and Food Safety Professionals Interpret Restaurant Inspection Results, J. ENVTL. HEALTH, Dec. 2001, at 14, 15-16.
406. See Ho, supra note 47, at 647-50. 407. Consider the claims in Melissa R. Wong et al., Impact of a Letter-Grade Program on
Restaurant Sanitary Conditions and Diner Behavior in New York City, AM. J. PUB. HEALTH, Mar. 2015, at e81, e83-e85 (2015). The analysis purports to find that letter grading had salutary effects by comparing the proportion of restaurants with zero to thirteen violation points three years before and three years after letter grading was rolled out. Id. This study has fundamental flaws. First, a simple time trend can reveal very little about the impact of letter grading per se. For instance, there was a fierce backlash by
footnote continued on next page

Peer Review 69 STAN. L. REV. 1 (2017)
94
Our peer review results, which show that inspectors disagree 60% of the time when observing the same conditions on the ground, conclusively show that restaurant grading, while widely popular, glosses over core problems. Consider an analogy to medical testing: if a medical laboratory startup’s blood tests were consistent 40% of the time, but 60% of the time, they wrongly diagnosed the patient with HPV, and the patients were perhaps required to disclose that result to the public at large, would anyone find that acceptable? In New York, one city council analyst concluded after studying the data, “We have a government agency that’s willing to blatantly lie to the public.”409
Not a single inspection staff member I spoke with supported restaurant grading, in large part because of the fear of introducing substantial tension into the inspector-operator relationship, when many conceive of their role as educating operators about food risks. Restaurant grading tends to undercut the modern trend toward educational inspections.410 As one inspector said, “none of us want to put that grade up there; it’s nonsense.” If a jurisdiction wants to extract and disclose more meaning out of restaurant inspections, it should be honest about the cost of developing an inspection staff and grading system that can provide accurate information.
restaurants, leading to a dramatic hearing before the New York City Council about the punitive deployment of letter grades. See No New Answers After NYC Letter-Grade Hearing, NAT’L RESTAURANT ASS’N (Mar. 9, 2012), http://www.restaurant.org/News -Research/News/No-new-answers-after-NYC-letter-grade-hearing. This mounting political pressure may have had a direct effect on the Health Department and the conduct of inspections. Second, the analysis ignores the fact that letter grading itself can radically change the behavior of inspectors. Sharp discontinuities around the thirteen-point threshold emerged nearly immediately after restaurant grading was implemented, and it is highly unlikely that these are due to precise sanitation practices by restaurants. See Ho, supra note 47, at 632 & fig.9. Almost surely, these are manifesta-tions of the pressure to bump an establishment up to an A. When letter grading changes the dynamic in which inspections are conducted, one cannot rely on inspec-tion data to infer sanitation improvements. In that sense, the New York Health Department’s claims for letter grading would be akin to Yale University claiming that because professors gave 10% As or A-minuses in 1963, compared to 62% in 2008, its students have radically improved. See Robert McGuire, Grade Expectations, YALE ALUMNI MAG. (Sept.-Oct. 2013), https://yalealumnimagazine.com/articles/3735. Third, the timing of inspections was changed so as to give restaurants scoring less than an A quicker chances to earn a higher grade. By tailoring the inspection frequency in this fashion, we would expect an increase in A grades even if the underlying inspections were entirely random.
408. See Ho, supra note 47, at 590. 409. Gary Buiso, City Restaurant Health Inspection Grades a Sham: Expert, N.Y. POST (Apr. 13,
2014, 1:42 AM) (quoting Artyom Matusov, Analyst, Governmental Operations Comm., N.Y. City Council), http://nyp.st/1hBpXRw.
410. See Ho, supra note 47, at 593-94 (discussing how restaurant letter grading is in tension with the shift toward focus on structural risk factors in the process of food prepara-tion).

Peer Review 69 STAN. L. REV. 1 (2017)
95
Of course, there are other forms of informational disclosure that can be more meaningful. King County, for instance, was the first county in Washington to post inspection reports online and recently began disclosing outbreak investigations in real time.411 It is also possible to design a grading system that is less susceptible to interinspector differences. My research team used historical and peer review data to develop such refinements, but ultimately the quality of inputs limits the quality of the grade.412 Until the first-order issues of inspection accuracy and consistency are addressed via programs like peer review, grading’s benefits remain illusory.
Calorie Disclosure. Other reforms, like calorie disclosure, may offer benefits but are often implemented without full awareness of the costs involved and the resources that may be shifted away from core operations. The King County Board of Health’s vote to explore calorie disclosure in restaurants in 2007413 might, for instance, seem like a low-cost intervention that simply informs the public. The reality, however, is that this reform effort imposed considerable costs on the inspection system. First, supervisors spent exceptional amounts of time developing implementation of calorie disclosure. Which chain restaurants should the disclosure apply to? How would King County staff verify whether a restaurant was part of a chain that meets the eligibility criteria, when most franchises might be located outside of King County? How would the county verify the accuracy of calorie counts?
Second, frontline inspectors spent nontrivial amounts of time collecting menus from every restaurant in King County to prepare for the calorie disclosure and would have been required to ensure compliance during routine inspections. While this might seem negligible, with 11,500 permitted establishments, the cost in time can quickly approach that of one full-time employee.414 Some twenty violation fields were added to the existing fifty simply to track divergent information for calorie disclosure. Third, and most perniciously, the Board of Health’s mandate for supervisors to explore calorie disclosure meant that the supervisors and seniors effectively had to abandon efforts at systematizing quality control measures and FDA standardization. These effects are all the more pathological considering that (a) King County’s
411. See Karasz, supra note 259; Telephone Interview with Becky Elias, supra note 239. 412. See Daniel E. Ho, Equity in the Bureaucracy, 7 U.C. IRVINE L. REV. (forthcoming 2017)
(manuscript at 26-29) (on file with author). 413. An Amendment for the Protection of the Public Health Through the Nutrition
Labeling of Food, BOH07-01.2, 2007 Bd. of Health (King Cty., Wash. 2007). 414. The median total number of inspections completed in a year is roughly seven hundred
and the median time spent per inspection is roughly forty-one minutes, leading to an estimate of roughly 478 annual hours spent on site by a representative inspector. If half of the 11,500 establishments required some degree of interaction to verify eligibility, menus, and so forth (estimated by one inspector to add roughly five minutes to each inspection), the incremental time amounts to roughly 479 hours.

Peer Review 69 STAN. L. REV. 1 (2017)
96
calorie disclosure was ultimately never implemented because the FDA initiated a rulemaking to consider a national rule (with one hundred pages of the Federal Register devoted to the rule)415 and (b) in the face of conflicting evidence, one review concludes, “calorie menu labeling does not have the intended effect of decreasing calorie ordering and consumption.”416
King County is surely not alone in its challenge of interinspector variabil-ity and in fact should be hailed as a model for addressing the core concerns via peer review. But the illusion of quick and costless reforms may account for a principal reason why agencies across the regulatory state have so frequently been unable to manage frontline staff effectively. Disclosure is not costless and can crowd out the ability to manage frontline staff.
Myopic Managerialism. In another area, what might seem like win-win initiatives fall prey to what Jerry Mashaw called “myopic managerialism.”417 Under the mantra of cutting red tape, for instance, the Clinton Administra-tion’s “Reinventing Government” campaign sought to cut midlevel management.418 As Mashaw argued, however, midlevel managers were precisely the individuals capable of managing differences between frontline officials at an agency like the SSA.419 Similarly, in King County, electronic tablets were hailed as a way to cut administrative assistants that were previously helping with data entry. But under the guise of cutting the red tape, little information infrastructure was put into place for seniors to review reports now located in a database. Consolidation of offices over time increased the staff-supervisor ratio, making direct oversight even more challenging. The result likely exacerbated frontline inconsistencies. According to one inspector: “I don’t think anyone reads our reports.”
The challenge of these facile reforms—grading, calorie disclosure, and naively cutting red tape—is that popular reforms appear driven, at least in part,
415. Food Labeling; Nutrition Labeling of Standard Menu Items in Restaurants and Similar Retail Food Establishments, 79 Fed. Reg. 71,156 (Dec. 1, 2014) (codified at 21 C.F.R. pts. 11 & 101).
416. Jonas J. Swartz et al., Calorie Menu Labeling on Quick-Service Restaurant Menus: An Updated Systematic Review of the Literature, 8 INT’L J. BEHAV. NUTRITION & PHYSICAL ACTIVITY, no. 135, at 7 (Dec. 8, 2011), https://ijbnpa.biomedcentral.com/articles/10.1186/1479-5868-8-135.
417. Jerry L. Mashaw, Reinventing Government and Regulatory Reform: Studies in the Neglect and Abuse of Administrative Law, 57 U. PITT. L. REV. 405, 406 (1996) (formatting altered).
418. See id. at 409 (“[M]any of the jobs to be eliminated are those of middle managers . . . .”); John Kamensky, A Brief History, NAT’L PARTNERSHIP FOR REINVENTING GOV’T (Jan. 1999), http://govinfo.library.unt.edu/npr/whoweare/history2.html (“Our mission is to create a government that ‘works better, costs less, and gets results Americans care about.’”).
419. Mashaw, supra note 417, at 414 (“Political accountability seems to demand precisely the internal systems, middle management supervisors and planners, and documentation (‘red tape’) that [the Reinventing Government campaign] seeks to abolish.”).

Peer Review 69 STAN. L. REV. 1 (2017)
97
by public misperceptions of risk, costs, and benefits. As Timur Karan and Cass Sunstein put it: “When there is an upsurge of interest in addressing a particular risk, the government loses its ability to set sensible priorities, undertake long-range planning, and enforce intertemporal consistency.”420 In food safety, these reforms have distorted risk-based regulation and prevented the bureaucracy from developing the very expertise that is the raison d’être of the administra-tive state.421
Perhaps the one genuine benefit of public pressure for restaurant grading has been to push King County into serious efforts of evaluating peer review. And unlike the distortionary effects of facile initiatives, peer review appears to align public priorities with risk.
Conclusion
Designing an administrative system with accurate frontline decisionmak-ing is a vital challenge of governance, critically affecting the rights of children, the elderly, the disabled, immigrants, innovators, and workers, to name just a few.422 It is also central to food safety. Between April and September 2014, 192 individuals were sickened and 30 hospitalized by a multidrug-resistant strain of salmonella.423 Ninety-six percent of the cases occurred in Washington, with the majority resulting from the consumption of pork in group or restaurant meals.424 The investigation ultimately traced the source to pork from a Pierce County slaughterhouse, leading to a multistate recall of over 500,000 pounds of pork.425
Although risk cannot be reduced to zero, it can be reduced by proper and consistent food safety protocols. During the salmonella outbreak, numerous
420. Kuran & Sunstein, supra note 79, at 747. Cost-benefit analysis might discipline these proposals. For instance, a reform proposal could include the budgetary authorization for the FTE required to implement the initiative or conversely determine the concomitant reduction in quality control, holding FTEs constant.
421. See, e.g., STEPHEN BREYER, BREAKING THE VICIOUS CIRCLE: TOWARD EFFECTIVE RISK REGULATION 33 (1993) (“Study after study shows that the public’s evaluation of risk problems differs radically from any consensus of experts in the field.”); Kuran & Sunstein, supra note 79, at 691-98 (discussing misinformation surrounding chemical risks in the context of the Love Canal community, which was developed on an abandoned canal containing toxic waste materials); Paul Slovic et al., Perceived Risk, Trust, and the Politics of Nuclear Waste, 254 SCIENCE 1603, 1603-04 (1991) (discussing how risk perceptions of nuclear fuel storage stand in contrast to expert assessments).
422. See supra notes 1-49 and accompanying text. 423. Multistate Outbreak of Multidrug-Resistant Salmonella I 4,[5],12:i:- and Salmonella Infantis
Infections Linked to Pork (Final Update), CTRS. FOR DISEASE CONTROL & PREVENTION (Dec. 2, 2015, 1:30 PM ET), http://www.cdc.gov/salmonella/pork-08-15.
424. See id. 425. See id.

Peer Review 69 STAN. L. REV. 1 (2017)
98
individuals were infected despite not having consumed pork products at all. Cross-contamination from butcher blocks affected other food products and variable enforcement of proper holding temperatures contributed to rapid growth of salmonella, exacerbating health consequences. All of these factors were uncovered and mitigated during the investigation but underscore the vital importance of frontline enforcement.
Until this study, administrative law has offered virtually no proven methods to ensure that such frontline administration of the law is carried out accurately and consistently. While inconsistency has long been opined about, our intervention for the first time measures the scope of inconsistency and demonstrates its substantive importance. Our RCT shows that peer review is both a feasible and effective method of improving the quality of frontline decisionmaking. Peer review improved interinspector consistency, caused an increase in violation citation rates, and, in an unanticipated way, improved staff morale.
Our results also place the widely influential theory of democratic experi-mentalism, for the first time, on a firm evidence base. It is ironic that for all the talk about “experimentalism” and states as “laboratories,” not a single study has ever put such governance claims to an actual experimental test. We hope that this study begins to move the fields of public administration and administra-tive law in that direction.

Peer Review 69 STAN. L. REV. 1 (2017)
99
Appendix A Additional Examples of the Challenge of Accuracy and Consistency of
Frontline Administration As argued in the Introduction, accurate and consistent frontline admin-
istration is an endemic challenge. Because there is no single place that catalogues these issues across subject areas, we provide a wider range of examples here.
(1) The Mining Safety Health Administration (MSHA) employs over one thousand inspectors to conduct safety inspections of mines.426 The GAO found some inspection criteria unclear, leading to “inconsistencies in inspectors’ interpretations” of requirements.427 For instance, the requirement that floating coal dust “shall be cleaned up” has caused considerable confusion.428 MSHA statistics from area rotations reveal statistically significant differences across inspectors from different offices.429 An audit found that 56% of a sample of 102 journeyman inspectors failed to receive required periodic retraining and 27% of 264 inspectors surveyed did not believe that the agency provided them with the technical training needed to perform effectively.430
(2) The Veterans Benefits Administration employs over 13,000 examiners to make over one million veterans’ disability compensation determinations annually,431 sometimes by relying on psychological and psychiatric diagnoses of post-traumatic stress disorder (PTSD).432 Diagnosing PTSD—which
426. See OFFICE OF INSPECTOR GEN., U.S. DEP’T OF LABOR, NO. 05-10-001-06-001, JOURNEYMAN MINE INSPECTORS DO NOT RECEIVE REQUIRED PERIODIC RETRAINING 1-2 (2010).
427. U.S. GOV’T ACCOUNTABILITY OFFICE, GAO-06-370T, MINE SAFETY: MSHA’S PROGRAMS FOR ENSURING THE SAFETY AND HEALTH OF COAL MINERS COULD BE STRENGTHENED 7 (2006).
428. 30 C.F.R. § 75.400 (2016); see also U.S. GOV’T ACCOUNTABILITY OFFICE supra note 427, at 7 (citing district officials who noted that “the lack of specific criteria for floating coal dust made it difficult to determine what was an allowable level”).
429. These results were obtained from a statistical test (an F-test) on inspector office identifiers that used MSHA data on inspections, holding constant the office to which a mine is assigned and calendar year of the inspection from 2000 to 2015. Under area rotations, this test identifies office inspector differences. See Mine Safety & Health Admin., Open Government Initiative Portal, U.S. DEP’T LABOR, http://arlweb.msha.gov/OpenGovernmentData/OGIMSHA.asp#jump (to locate, follow “Inspections Data Set” hyperlink) (last visited Jan. 1, 2017); see also MINE SAFETY & HEALTH ADMIN., U.S. DEP’T OF LABOR, HANDBOOK NO. PH13-IV-1, METAL AND NONMETAL GENERAL INSPECTION PROCEDURES HANDBOOK 14 (2013), http://www.msha.gov/readroom/handbook/ph13 -iv-1mnmgip.pdf (“Inspection travel areas assigned to inspectors shall be rotated annually . . . .”).
430. OFFICE OF INSPECTOR GEN., supra note 426, at 4. 431. See 3 U.S. DEP’T OF VETERANS AFFAIRS, CONGRESSIONAL SUBMISSION: BENEFITS AND
BURIAL PROGRAMS AND DEPARTMENTAL ADMINISTRATION 202, 205 (2016). 432. 38 C.F.R. § 3.304(f) (2016) (defining the requirements for making a PTSD veterans
disability claim).

Peer Review 69 STAN. L. REV. 1 (2017)
100
involves, for instance, determining whether the “disturbance causes clinically significant distress or impairment in social, occupational, or other important areas of functioning”433—can be “highly subjective,”434 “challenging,”435 and “difficult in the best of circumstances.”436 One survey revealed “wide variation in the beliefs and practices of” clinicians,437 while another found examination times varying from one to four hours.438 The GAO found the management of disability reevaluations to be ineffective,439 and an audit reviewing a random sample of 2100 PTSD claim awards found error rates as low as 11% in one state and as high as 41% in another.440
(3) The IRS employs some 12,000 revenue agents to conduct audits of taxpayers.441 Detection of income tax evasion can involve challenging investigations. The GAO found, for instance, that agents exhibited substantial inconsistencies in processing taxpayer documentation in Earned Income Credit audits.442 Using individual-level data from the 1982 and 1985 Taxpayer Compliance Measurement Program, one study found that examiner differences in detection rates are “at least as important . . . as variation in filer characteris-tics.”443 Discretion can also be granted more expressly. Unintentional failure to
433. Id. § 4.125(a) (applying the American Psychiatric Association’s general definition of PTSD); see also AM. PSYCHIATRIC ASS’N, DIAGNOSTIC AND STATISTICAL MANUAL OF MENTAL DISORDERS § 309.81, at 272 (5th ed. 2013).
434. OFFICE OF INSPECTOR GEN., U.S. DEP’T OF VETERANS AFFAIRS, NO. 05-00765-137, REVIEW OF STATE VARIANCES IN VA DISABILITY COMPENSATION PAYMENTS 52 (2005).
435. COMM. ON THE ASSESSMENT OF ONGOING EFFORTS IN THE TREATMENT OF POSTTRAUMATIC STRESS DISORDER, INST. OF MED. OF THE NAT’L ACADS., TREATMENT FOR POSTTRAUMATIC STRESS DISORDER IN MILITARY AND VETERAN POPULATIONS: FINAL ASSESSMENT 33 (2014).
436. Alan Zarembo, As Disability Awards Grow, So Do Concerns with Veracity of PTSD Claims, L.A. TIMES (Aug. 3, 2014, 5:53 PM), http://fw.to/4YCzjm.
437. James C. Jackson et al., Variation in Practices and Attitudes of Clinicians Assessing PTSD-Related Disability Among Veterans, 24 J. TRAUMATIC STRESS 609, 612 (2011).
438. See Mark D. Worthen & Robert G. Moering, A Practical Guide to Conducting VA Compensation and Pension Exams for PTSD and Other Mental Disorders, 4 PSYCHOL. INJ. & L. 187, 193-94 (2011).
439. See U.S. GOV’T ACCOUNTABILITY OFFICE, GAO-08-75, VETERANS’ BENEFITS: IMPROVED OPERATIONAL CONTROLS AND MANAGEMENT DATA WOULD ENHANCE VBA’S DISABILITY REEVALUATION PROCESS 6-12 (2007).
440. See OFFICE OF INSPECTOR GEN., supra note 434, at ix. 441. See IRS OVERSIGHT BD., FY2015 IRS BUDGET RECOMMENDATION SPECIAL REPORT 14 fig.6
(2014), https://www.treasury.gov/IRSOB/reports/Documents/IRSOB%20FY2015%20 Budget%20Report-FINAL.pdf.
442. See U.S. GEN. ACCOUNTING OFFICE, GAO-02-449, EARNED INCOME CREDIT: OPPORTUNITIES TO MAKE RECERTIFICATION PROGRAM LESS CONFUSING AND MORE CONSISTENT 20-23 (2002).
443. Jonathan S. Feinstein, An Econometric Analysis of Income Tax Evasion and Its Detection, 22 RAND J. ECON. 14, 14-15 (1991).

Peer Review 69 STAN. L. REV. 1 (2017)
101
disclose foreign bank accounts can result in civil penalties of up to $10,000 per account, but examiners are granted nearly plenary discretion to select the penalty amount.444
(4) The National Labor Relations Board employs thirty-four ALJs to make initial decisions about whether a party has engaged in a labor law violation.445 A 1978 GAO report found an “almost threefold production differential between the most and least productive ALJs.”446 A recent study of decisions from 1991 to 2006 found that Democratic ALJs had a 14% higher probability of issuing a pro-labor decision than Republican ALJs, controlling for other potential influences.447
(5) Environmental health inspectors visit hospitals to investigate allega-tions of breaches of state privacy laws. A ProPublica investigation found stark inconsistencies across county lines in California.448 In Los Angeles County, where major hospitals publicly acknowledged privacy breaches, hospitals had few to no cited violations.449 But in Riverside County, one hospital was cited for 278 (largely minor) deficiencies.450 Kaiser Permanente facilities landed both at the top and the bottom of cited privacy violations depending on the county.451
(6) Many states, counties, and cities require regular vehicle safety and/or emissions inspections. The inspection system is typically highly decentralized, with consumers able to choose private, government-licensed stations for their vehicle inspections. A study of nearly 1400 Massachusetts safety and emissions testing stations, averaging over one hundred inspections per two-month period, documented evidence of market pressure to be lenient: the more lenient the station, the more business it gained over time.452 Another study of over three million emissions tests in one metropolitan area showed that employers
444. See IRS, INTERNAL REVENUE MANUAL § 4.26.16.6.4 (2015), https://www.irs.gov/irm/part4/irm_04-026-016.html.
445. See Division of Judges Directory, NAT’L LAB. REL. BOARD, https://www.nlrb.gov/who-we -are/division-judges/division-judges-directory (last visited Jan. 1, 2017).
446. U.S. GEN. ACCOUNTING OFFICE, FPCD-78-25, ADMINISTRATIVE LAW PROCESS: BETTER MANAGEMENT IS NEEDED 32 (1978).
447. Cole D. Taratoot & Robert M. Howard, The Labor of Judging: Examining Administrative Law Judge Decisions, 39 AM. POL. RES. 832, 848 (2011).
448. See Charles Ornstein, The Consequences for Violating Patient Privacy in California?: Depends Where the Hospital Is, PROPUBLICA (Dec. 31, 2015, 9:00 AM), https://www.propublica.org/article/california-patient-privacy-law-inconsistent -enforcement.
449. See id. 450. See id. 451. See id. 452. See David Hemenway & Sara J. Solnick, “You Better Shop Around”: The Market for Motor
Vehicle Inspection, 12 LAW & POL’Y 317, 325 & tbl.4 (1990).

Peer Review 69 STAN. L. REV. 1 (2017)
102
had a considerable influence on inspector lenience and ethics. The average pass rate for inspectors who were employed by multiple employers and who conducted more than one hundred inspections ranged from 73% to 100%.453
(7) Some 670 U.S. district court judges sentence criminal defendants, often within wide statutory ranges for a given offense.454 In response to claims of “glaring disparities” across judges,455 the Sentencing Reform Act of 1984 created the Sentencing Commission to write sentencing guidelines—then thought mandatory—to generate more consistency across district court judges.456 After the Supreme Court held the sentencing guidelines to be advisory in 2005, the interjudge sentencing disparity appears to have doubled.457
(8) The FDA inspects drug manufacturers to determine compliance with manufacturing standards. For instance, federal regulations require that buildings be kept in “clean and sanitary condition.”458 One study of seven hundred investigators found that due to wide variability in training and experience, inspectors exhibited “marked heterogeneity.”459 Some investigators were 40% more likely, and others 20% less likely, than the median investigator to impose sanctions.460
(9) The Occupational Safety and Health Administration (OSHA) oversees approximately 2200 inspectors who are responsible for conducting workplace
453. See Lamar Pierce & Jason Snyder, Ethical Spillovers in Firms: Evidence from Vehicle Emissions Testing, 54 MGMT. SCI. 1891, 1892, 1897 tbl.1 (2008).
454. See Offices of the U.S. Att’ys, Introduction to the Federal Court System, U.S. DEP’T JUST., https://www.justice.gov/usao/justice-101/federal-courts (last visited Jan. 1, 2017).
455. Edward M. Kennedy, Toward a New System of Criminal Sentencing: Law with Order, 16 AM. CRIM. L. REV. 353, 353 (1979); see also ANTHONY PARTRIDGE & WILLIAM B. ELDRIDGE, THE SECOND CIRCUIT SENTENCING STUDY: A REPORT TO THE JUDGES OF THE SECOND CIRCUIT 10 (1974) (documenting “substantial disparity” in sentences). To be sure, the Second Circuit study was not without its detractors as it relied purely on hypothetical fact patterns. See, e.g., KATE STITH & JOSÉ A. CABRANES, FEAR OF JUDGING: SENTENCING GUIDELINES IN THE FEDERAL COURTS 109 (1998) (“The Second Circuit study had major difficulties . . . . First, there is no assurance that any judges, beyond those who helped to organize the study, approached it with the seriousness and deliberation that they would bring to a real case with a real defendant and real victims.”); James M. Anderson et al., Measuring Interjudge Sentencing Disparity: Before and After the Federal Sentencing Guidelines, 42 J.L. & ECON. 271, 279 (1999) (“It is quite difficult . . . for a simulation to reconstruct the full depth of information available to a judge in a real case.”).
456. See Pub. L. No. 98-473, § 991, 98 Stat. 1837, 2017-18 (codified as amended at 28 U.S.C. § 991 (2015)).
457. See Crystal S. Yang, Have Interjudge Sentencing Disparities Increased in an Advisory Guidelines Regime?: Evidence from Booker, 89 N.Y.U. L. REV. 1268, 1307 (2014).
458. 21 C.F.R. § 211.56(a) (2016). 459. Jeffrey T. Macher et al., Regulator Heterogeneity and Endogenous Efforts to Close the
Information Asymmetry Gap, 54 J.L. & ECON. 25, 27, 53 (2011). 460. Id. at 28.

Peer Review 69 STAN. L. REV. 1 (2017)
103
safety inspections.461 Inspectors administer OSHA safety standards such as hazard communication and whether a work surface has the “strength and structural integrity to support employees safely.”462 Early consensus standards were assailed as “hopelessly vague” or “plainly ridiculous.”463 The GAO documented concerns about lack of training and inconsistent enforcement.464 An empirical study of thirty-five inspectors in 1985 concluded that there is “substantial heterogeneity among OSHA inspectors in their detection rates” when controlling for firm characteristics.465 Another study of 464 OSHA inspectors found that the percentage of inspections with no violations ranged from 17% (at the tenth percentile) to 61% (at the ninetieth percentile) across inspectors.466 States opting out of OSHA enforcement are required to have plans “at least as effective” as federal enforcement,467 but state inspectors appear to be less stringent.468
461. See Occupational Safety & Health Admin., Commonly Used Statistics, U.S. DEP’T LABOR, https://www.osha.gov/oshstats/commonstats.html (last visited Jan. 1, 2017).
462. 29 C.F.R. §§ 1910.1200, 1926.501 (2016). 463. THOMAS O. MCGARITY & SIDNEY A. SHAPIRO, WORKERS AT RISK: THE FAILED PROMISE OF
THE OCCUPATIONAL SAFETY AND HEALTH ADMINISTRATION 42 (1993). 464. See 1 U.S. GEN. ACCOUNTING OFFICE, GAO/HEHS-94-138, WORKPLACE REGULATION:
INFORMATION ON SELECTED EMPLOYER AND UNION EXPERIENCES 63-64 (1994). 465. Jonathan S. Feinstein, Detection Controlled Estimation, 33 J.L. & ECON. 233, 237, 252-53
(1990). 466. See Amelia M. Haviland et al., Are There Unusually Effective Occupational Safety and Health
Inspectors and Inspection Practices? 14 tbl.1 (RAND Law, Bus. & Regulation Working Paper Series, Paper No. WR-914-CHSWC, 2012), http://www.rand.org/pubs/working_papers/WR914.html.
467. 29 U.S.C. § 667(c)(2) (2015). 468. See Alison D. Morantz, Has Devolution Injured American Workers?: State and Federal
Enforcement of Construction Safety, 25 J.L. ECON. & ORG. 183, 185 (2009).

Peer Review 69 STAN. L. REV. 1 (2017)
104
Appendix B Peer Review Checklist
FIGURE B HERE
Peer Review Pilot Study Team Checklist
Instructions: This checklist is a tool for your team to use to ensure that all steps and processes arecompleted. This checklist does not have to be turned in.
Roles and ResponsibilitiesEach pair will conduct risk based inspections consistent with the Food Code, programmatic training, policiesand procedures. For every inspection, each inspector will complete an independent inspection form inenvision, regardless of role of Lead Inspector or Non Lead Inspector. One member of each pair will bedesignated the Lead Inspector at the onset, and the two will alternate for each inspection during the peerreview day.1. Lead Inspector: The lead inspector is pre assigned. He/she will be responsible for communicating with
the Person In Charge (PIC) the results of the inspection report once the discussion with their peer hasoccurred.
2. Non lead Inspector: The non lead inspector can record temperatures and assist the lead inspector.Note: Alternate being the lead inspector during the Peer Review day.
Pre Inspection1. The assigned lead initiates contact with their peer to schedule a day to go out in the field.2. Each team will receive a random list of Risk 3 food service facilities.3. These facilities will be in an area that does not belong to either team member.4. Use whatever process you usually do prior to going out on the inspection (review file, etc.).5. Bring a copy of the food code and marking instructions.
During the Peer Review Inspection
Begin with the first establishment on the list and work down doing as many inspections as time allows.If the establishment is closed and you are unable to conduct an inspection, code the visit as noentry (155).
Check in with the Person In Charge (PIC). This is a routine inspection.If the establishment asks why there are two people, explain this is part of our QualityAssurance Program.
Complete a full routine inspection. Both inspectors should be in the same space going through theinspection together, not wandering in different areas of the establishment at different times. The Leadis the principal person leading the inspection (what to look at). The Non Lead should shadow the Leadand assist where needed (record temperatures, etc.).
Both inspectors should fully engage in the inspection and may ask clarification questions.Where possible, violations should be corrected prior to leaving the establishment.
Complete independent inspection forms in Envision, including comments.The Lead enters the inspection as usual (code as 128).The Non Lead enters their inspection with the Peer Review code (190). No signature is requiredfor this inspection.
After the independent inspection forms are completed:Cooperatively discuss any differences recorded on the inspection forms.Discuss questions either team member has regarding what was observed, violations cited, and

Peer Review 69 STAN. L. REV. 1 (2017)
105
why you would or would not cite a violation. Make any final changes to the lead inspector’s (signed) form.
Both inspectors are present as Lead inspector discusses the results of the inspection with the PIC and obtains signatures, etc.
After
the
Peer Review
Day
Provide Phil with the list of establishments of the day, completed, no entry, and not completed.
Initial Lead
Provide a copy of the inspection reports to the area inspector. Follow up with the designated employee as necessary. If a return inspection is required include the designated employee’s senior in the conversation.
Initial Lead
Each week, all participants of the peer review pilot will independently complete an online Peer Review survey
by
the
following
week.
FIGURE B HERE
why you would or would not cite a violation.Make any final changes to the lead inspector’s (signed) form.
Both inspectors are present as Lead inspector discusses the results of the inspection with the PIC andobtains signatures, etc.
After the Peer Review Day
Provide Phil with the list of establishments of the day, completed, no entry, and notcompleted.
Initial Lead
Provide a copy of the inspection reports to the area inspector.Follow up with the designated employee as necessary. If a returninspection is required include the designated employee’s senior in theconversation.
Initial Lead
Each week, all participants of the peer review pilot will independently complete an online Peer Reviewsurvey by the following week.
The peer review questions are

Peer Review 69 STAN. L. REV. 1 (2017)
106
Appendix C Timeline and Evolution of Peer Review Intervention
Timeline of Intervention Date
Topic(s)
Huddle Times
Apr. 10, 2014 Downtown Staff Meeting on “Consistency” May 14, 2014 Eastgate Staff Meeting on “Consistency” July 20, 2014 Memorandum of Understanding Sept. 5, 2014 Institutional Review Board Determination Sept. 9, 2014 All Staff Meeting: Ground Rules Oct. 16, 2014 All Staff Meeting Jan. 8, 2015 Randomization Jan. 12, 2015 Peer Review Begins Jan. 13, 2015 Logistics: E.g., Skipping Establishments, Scheduling 30 min. Jan. 20, 2015 Logistics: Annual Work Load, Number of Inspections 30 min. Feb. 3, 2015 Logistics: Coaching, Coordination with Area Inspector 30 min. Feb. 10, 2015 Logistics: Closures During Peer Review 30 min. Feb. 17, 2015 Logistics: Risk-Based Inspections 30 min. Mar. 6, 2015 Reorientation Based on Early Results Mar. 12, 2015 Substantive: Meat Storage Cross-Contamination 90 min. Mar. 16, 2015 Substantive: Meat Storage Cross-Contamination 30 min. Mar. 24, 2015 Substantive: Meat Storage Cross-Contamination 60 min. Mar. 31, 2015 Substantive: Meat Storage Cross-Contamination 90 min. Apr. 7, 2015 Substantive: Cooling, Time and Temperature, Active
Managerial Control 90 min.
Apr. 21, 2015 Substantive: Cooling, Time and Temperature 60 min. May 5, 2015 Substantive: Discretion with Time and Temperature 90 min. June 2, 2015 Substantive: Discretion with Time and Temperature 90 min. June 16, 2015 Substantive: Time as a Control 90 min. June 30, 2015 Substantive: Time as a Control 90 min. July 20, 2015 Substantive: Preliminary Results, Time as a Control 120 min. July 21, 2015 All-Staff Meeting Sept. 2015 Peer Review Instituted for Control Group

Peer Review 69 STAN. L. REV. 1 (2017)
107
MEMORANDUM
To: Peer Review Staff From: Becky Elias, Dan Ho, Phil Wyman, Adrianna Boghozian, and Aubrey Jones Date: March 18, 2015 Subject: Food Contamination (Including Raw Meat and Chemical Violations)
I. Overview
This memorandum provides clarification on several violations pertaining to food contamination. Major sources of food contamination include contamination from raw meat and contamination from chemicals. Chemical violations –both related to food contamination and other instances of chemical violations –are clarified in this memorandum.
In the huddle on March 12, several questions regarding the differences between food contamination violations (1000, 1300, 1400, and 3300) emerged. Fortunately, many of the questions about the applicable violations are explicitly resolved by the food code. First, adulteration violations (1000) refer to contamination from non-food substances, such as mold, filth, and chemicals, and should hence never be scored for cross-contamination of other food by raw meat. Second, the critical distinction between a 1300 and 1400 violation is that the former refers to actual cross-contamination of food or food contact surfaces by raw meat, while the latter refers to potential cross-contamination. Third, a 3300 violation refers to potential cross-contamination from sources other than raw meat (e.g., whole shell eggs).
In seeking to clarify these questions, this memorandum gives descriptions and examples of related violations including other pooled eggs (1500), chemical violations (2500 and 3400), employee eating areas (3600), and food contact surface violations (4200). 1500, 2500, and 3400 encompass more than just food contamination and relevant examples are provided, especially to resolve the difference between 2500 and 3400.
Our goal in upcoming huddle sessions is to provide both (a) code clarification for violations that the peer review has revealed are subject to confusion, and (b) guidelines for how to best implement discretion based on risk principles.
The single most important thing to bear in mind is that violations should be scored according to risk posed. Risk principles underpinning the health code suggest that raw meat, for instance, should never be stored above other food. Doing so warrants a 1400 violation. Eggs in whole shells, on the other hand, pose such low risk that they may not categorically warrant scoring a 3300 violation.
Section II spells out in greater detail the health code clarifications for 1000, 1300, 1400, 1500, 2500, 3300, 3400, 3600, and 4200 violations and provides some provisional guidelines on how to implement discretion. Section III provides a table of the applicable violations by types of cross-contamination.
Please use the below as an evolving reference guide for raw meat storage and food contamination violations that can help us collectively to improve the consistency of inspections.
Appendix D Example of a Guidance Memorandum

Peer Review 69 STAN. L. REV. 1 (2017)
108
Appendix E Example of Code Clarification
Actual contamination Potential contamination
Food Items
Raw meat Eggs RTE foods Other foods Employee
foods
Food
Item
s
Raw meat
1300
1400
Eggs 1300
1400
1500*or 1300
3300
RTE foods 1300
1400
1300
3300**
N/A
N/A
Other foods^ 1300
1400
1300
3300
3300 or 4200***
3300
or 4200***
3300 or 4200***
3300
or 4200***
Employee foods
1300
1400
1300
3300
3600
3300
3600
3300
N/A
N/A
Non
food
Chemicals 1000
2500
1000
2500
1000
2500
1000
2500
1000
2500
Sanitizing solution^^
1000
3400
1000
3400
1000
3400
1000
3400
1000
3400 Other hazardous items^^^
1000
3300
1000
3300
1000
3300
1000
3300
1000
3300
^e.g., unwashed produce, cooked meat; ^^that meets concentration requirements outlined in WAC 246-215-04565 and is used to hold wiping cloths; ^^^e.g., staples, mold, or other dangerous materials found in food; *1500 used for improper pooling of raw eggs (i.e., raw eggs contaminating other raw eggs), 1300 should be used if raw egg material spills on cooked eggs; **if the risk level is high, you have the discretion to score it as a 3300 (you have discretion to score or not to score based on your risk assessment); ***score 3300 if the vehicle of contamination is another food (e.g., unwashed vegetables touching washed vegetables), and score 4200 if the vehicle of contamination is a food contact surface (e.g., improperly washed cooked meat slicer).

Peer Review 69 STAN. L. REV. 1 (2017)
109
Appendix F Deviation Rates by Week from Peer Review Inspections
Red Violations Base
-line 1 2 3 4 5 6 7 8 9 10 11 12 13 14 15 16 All
Proper cold holding (> 45°F) 14.7 6.9 0.0 4.8 9.1 15.8 0.0 4.0 5.3 0.0 8.7 0.0 0.0 0.0 7.7 12.5 12.5 5.4
Handwashing facilities 12.1 3.4 3.6 0.0 0.0 10.5 3.6 12.0 5.3 18.2 4.3 0.0 0.0 10.0 0.0 8.3 4.2 5.2
Current food worker cards 11.1 0.0 10.7 4.8 0.0 0.0 7.1 4.0 5.3 9.1 0.0 0.0 0.0 0.0 3.8 8.3 4.2 3.6
Proper cold holding (< 45°F) 6.3 0.0 0.0 0.0 9.1 0.0 0.0 0.0 10.5 0.0 17.4 0.0 0.0 0.0 0.0 8.3 4.2 3.1
Proper cooling procedure 5.6 0.0 10.7 14.3 0.0 0.0 7.1 20.0 5.3 4.5 13.0 0.0 4.3 0.0 0.0 8.3 4.2 5.7
Proper storage of raw meat 5.4 20.7 3.6 4.8 22.7 10.5 3.6 12.0 5.3 0.0 0.0 0.0 0.0 0.0 3.8 4.2 4.2 6.0
No room temperature storage 5.3 3.4 0.0 9.5 0.0 15.8 10.7 8.0 10.5 9.1 8.7 0.0 0.0 0.0 0.0 12.5 4.2 5.8
Thermometer used 3.8 0.0 0.0 0.0 9.1 5.3 3.6 4.0 5.3 4.5 4.3 4.0 4.3 5.0 3.8 8.3 4.2 4.1
Proper hot holding (< 130°F) 3.6 0.0 0.0 0.0 0.0 10.5 0.0 4.0 0.0 4.5 0.0 0.0 0.0 0.0 0.0 0.0 4.2 1.5
Handwashing 2.6 17.2 0.0 14.3 4.5 15.8 3.6 4.0 5.3 9.1 0.0 4.0 4.3 0.0 0.0 0.0 0.0 5.1
Chemicals properly identified & used 2.6 3.4 10.7 9.5 9.1 10.5 3.6 4.0 10.5 4.5 13.0 4.0 4.3 10.0 0.0 0.0 4.2 6.3
Hand contact barriers 2.2 3.4 0.0 4.8 0.0 0.0 0.0 4.0 0.0 0.0 4.3 4.0 0.0 0.0 3.8 0.0 0.0 1.5
Consumer advisory posted 1.1 10.3 3.6 0.0 0.0 0.0 0.0 4.0 0.0 13.6 0.0 4.0 0.0 0.0 0.0 0.0 0.0 2.2
Proper storage & handling of raw egg 1.0 0.0 0.0 0.0 4.5 5.3 0.0 4.0 0.0 0.0 0.0 0.0 4.3 0.0 0.0 0.0 0.0 1.1
Proper hot holding (> 130°F) 0.8 0.0 0.0 0.0 0.0 0.0 0.0 0.0 0.0 0.0 0.0 0.0 0.0 0.0 0.0 0.0 4.2 0.3
Proper procedures for fish 0.8 0.0 0.0 0.0 0.0 0.0 0.0 0.0 0.0 0.0 0.0 4.0 4.3 0.0 7.7 0.0 0.0 1.0
Proper monitoring 0.6 3.4 0.0 4.8 0.0 5.3 0.0 4.0 5.3 0.0 0.0 0.0 0.0 0.0 0.0 0.0 0.0 1.4
Certified person in charge 0.6 6.9 0.0 4.8 0.0 0.0 3.6 4.0 5.3 0.0 4.3 0.0 0.0 0.0 0.0 0.0 0.0 1.8
Proper reheating procedures 0.6 0.0 0.0 0.0 0.0 0.0 0.0 0.0 0.0 4.5 0.0 0.0 0.0 0.0 3.8 8.3 4.2 1.3
Proper cook time & temperature 0.5 6.9 0.0 0.0 4.5 21.1 3.6 4.0 10.5 0.0 0.0 0.0 4.3 0.0 0.0 4.2 4.2 4.0
Proper washing fruit & vegetables 0.5 0.0 3.6 0.0 0.0 0.0 3.6 4.0 0.0 0.0 0.0 0.0 0.0 0.0 0.0 4.2 0.0 1.0
Sanitized contact surfaces for raw meat 0.5 3.4 3.6 0.0 4.5 5.3 0.0 4.0 0.0 0.0 0.0 0.0 4.3 0.0 0.0 4.2 0.0 1.8
Food safe & good condition 0.4 0.0 0.0 0.0 0.0 5.3 0.0 0.0 0.0 0.0 0.0 0.0 0.0 0.0 0.0 0.0 0.0 0.3
Obtained specialized processing variance 0.2 0.0 0.0 0.0 0.0 0.0 0.0 0.0 0.0 0.0 4.3 0.0 0.0 0.0 0.0 0.0 0.0 0.3
Food from approved source 0.2 0.0 0.0 0.0 0.0 0.0 0.0 0.0 0.0 0.0 0.0 0.0 0.0 0.0 3.8 0.0 0.0 0.2
Water/ice from approved source 0.0 0.0 0.0 0.0 0.0 0.0 0.0 0.0 0.0 0.0 0.0 0.0 0.0 0.0 0.0 0.0 0.0 0.0

Peer Review 69 STAN. L. REV. 1 (2017)
110
Proper procedures for unusable food 0.0 0.0 0.0 0.0 0.0 0.0 0.0 0.0 0.0 0.0 0.0 0.0 0.0 0.0 0.0 0.0 0.0 0.0
Practices for ill workers 0.0 0.0 0.0 0.0 0.0 0.0 0.0 0.0 0.0 0.0 0.0 0.0 0.0 0.0 0.0 0.0 0.0 0.0
Pasteurized food 0.0 0.0 0.0 0.0 0.0 0.0 0.0 0.0 0.0 0.0 0.0 0.0 4.3 0.0 0.0 0.0 0.0 0.3
Blue Violations
Wiping cloths 11.0 27.6 3.6 14.3 9.1 10.5 7.1 16.0 15.8 9.1 17.4 8.0 17.4 0.0 0.0 4.2 4.2 10.3
Food surfaces cleaned 8.0 10.3 7.1 23.8 9.1 5.3 17.9 16.0 10.5 22.7 26.1 12.0 13.0 15.0 11.5 16.7 12.5 14.3
Proper sanitizing facilities 7.9 6.9 3.6 4.8 13.6 5.3 3.6 24.0 10.5 0.0 8.7 0.0 0.0 0.0 3.8 4.2 4.2 5.8
Prevent food contamination 7.7 10.3 17.9 9.5 13.6 5.3 7.1 8.0 5.3 36.4 13.0 12.0 17.4 0.0 3.8 16.7 4.2 11.3
Nonfood surfaces cleaned 6.3 0.0 3.6 4.8 4.5 15.8 17.9 0.0 5.3 4.5 4.3 8.0 0.0 0.0 7.7 0.0 0.0 4.8
Proper physical facilities 4.6 3.4 7.1 9.5 0.0 0.0 14.3 4.0 15.8 4.5 4.3 0.0 8.7 5.0 7.7 8.3 4.2 6.1
In-use utensils properly stored 4.3 10.3 14.3 9.5 9.1 5.3 10.7 4.0 31.6 9.1 13.0 8.0 0.0 5.0 11.5 16.7 8.3 10.4
Adequate plumbing 2.5 10.3 3.6 0.0 13.6 0.0 0.0 0.0 0.0 9.1 4.3 0.0 4.3 0.0 0.0 4.2 8.3 3.6
Equipment for temp. control 2.4 6.9 7.1 4.8 4.5 0.0 14.3 4.0 5.3 0.0 4.3 8.0 0.0 0.0 0.0 8.3 0.0 4.2
Adequate lighting/ventilation 2.3 3.4 10.7 4.8 0.0 0.0 3.6 4.0 5.3 0.0 4.3 0.0 4.3 0.0 7.7 4.2 4.2 3.5
No pests 2.2 3.4 0.0 0.0 0.0 0.0 3.6 0.0 0.0 0.0 4.3 0.0 4.3 5.0 7.7 12.5 4.2 2.8
Proper thawing methods 2.1 6.9 3.6 9.5 0.0 10.5 3.6 0.0 0.0 9.1 4.3 4.0 0.0 0.0 0.0 8.3 0.0 3.7
Surfaces properly used 1.9 3.4 3.6 0.0 0.0 5.3 7.1 4.0 5.3 22.7 0.0 4.0 13.0 5.0 3.8 4.2 0.0 5.1
Proper labeling 1.5 0.0 0.0 0.0 4.5 21.1 0.0 0.0 0.0 0.0 0.0 4.0 4.3 5.0 0.0 0.0 0.0 2.4
Utensils proper storage 0.7 3.4 7.1 4.8 9.1 5.3 3.6 0.0 10.5 0.0 4.3 0.0 8.7 0.0 3.8 4.2 4.2 4.3
Single-use items proper storage 0.7 0.0 3.6 0.0 0.0 5.3 0.0 0.0 0.0 4.5 0.0 0.0 0.0 5.0 0.0 0.0 0.0 1.1
Proper employee eating/drinking 0.6 0.0 0.0 4.8 4.5 0.0 3.6 0.0 0.0 0.0 4.3 4.0 0.0 0.0 0.0 8.3 0.0 1.8
Garbage properly disposed 0.5 0.0 0.0 0.0 0.0 0.0 0.0 4.0 0.0 0.0 0.0 0.0 0.0 0.0 0.0 4.2 4.2 0.8
Permit posted 0.4 0.0 0.0 0.0 0.0 5.3 0.0 0.0 0.0 0.0 0.0 0.0 0.0 5.0 0.0 0.0 0.0 0.6
Sewage properly disposed 0.2 3.4 0.0 0.0 0.0 0.0 0.0 0.0 0.0 0.0 0.0 0.0 0.0 0.0 0.0 0.0 4.2 0.5
Proper employee hygiene 0.2 0.0 3.6 0.0 0.0 0.0 3.6 0.0 0.0 4.5 4.3 0.0 0.0 0.0 0.0 0.0 0.0 1.0
Food received at proper temperature 0.1 0.0 0.0 0.0 0.0 0.0 0.0 0.0 0.0 0.0 0.0 0.0 0.0 0.0 0.0 0.0 0.0 0.0
Proper toilet facilities 0.1 0.0 0.0 0.0 0.0 0.0 0.0 0.0 0.0 0.0 0.0 0.0 0.0 0.0 0.0 0.0 0.0 0.0
Overall
Red violations 0.9 0.9 0.5 0.8 0.8 1.4 0.5 1.1 0.9 0.8 0.8 0.2 0.4 0.3 0.4 0.9 0.6 0.7
Blue violations 0.7 1.1 1.0 1.0 1.0 1.0 1.2 0.9 1.2 1.4 1.2 0.7 1.0 0.5 0.7 1.3 0.7 1.0
Disagreements 2.1 1.5 1.8 1.7 2.4 1.8 2.0 2.1 2.2 2.0 1.0 1.3 0.8 1.1 2.2 1.3 1.7
Score difference 7.8 6.4 7.2 6.5 10.5 5.2 7.8 9.4 6.7 5.3 4.2 6.0 2.7 3.9 6.0 5.0 6.3
N 29 28 21 22 19 28 25 19 22 23 25 23 20 26 24 24 378
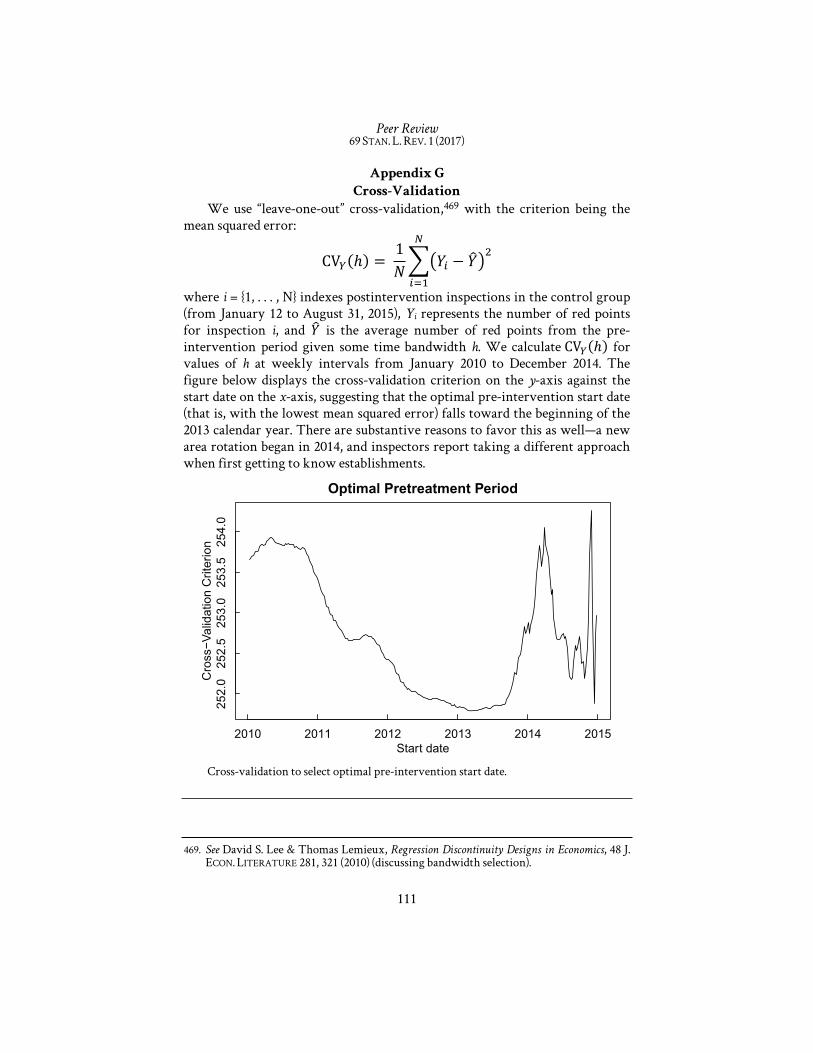
Peer Review 69 STAN. L. REV. 1 (2017)
111
2010 2011 2012 2013 2014 2015
252.
025
2.5
253.
025
3.5
254.
0
Start date
Cro
ssVa
lidat
ion
Crit
erio
n
Appendix G Cross-Validation
We use “leave-one-out” cross-validation,469 with the criterion being the mean squared error:
where i = {1, . . . , N} indexes postintervention inspections in the control group (from January 12 to August 31, 2015), Yi represents the number of red points for inspection i, and is the average number of red points from the pre-intervention period given some time bandwidth h. We calculate for values of h at weekly intervals from January 2010 to December 2014. The figure below displays the cross-validation criterion on the y-axis against the start date on the x-axis, suggesting that the optimal pre-intervention start date (that is, with the lowest mean squared error) falls toward the beginning of the 2013 calendar year. There are substantive reasons to favor this as well—a new area rotation began in 2014, and inspectors report taking a different approach when first getting to know establishments.
Optimal Pretreatment Period
Cross-validation to select optimal pre-intervention start date.
469. See David S. Lee & Thomas Lemieux, Regression Discontinuity Designs in Economics, 48 J. ECON. LITERATURE 281, 321 (2010) (discussing bandwidth selection).
FIGURE G HERE
2010 2011 2012 2013 2014 2015
252.
025
2.5
253.
025
3.5
254.
0
Optimal Pretreatment Period
Start date
Cro
ss−V
alid
atio
n C
riter
ion

Peer Review 69 STAN. L. REV. 1 (2017)
112
Appendix H Statistical Methods
Randomization Inference. Let i = {1, . . . , N} index inspections. Let Ti = 1 if inspection i was carried out by an inspector who was randomized into the peer review group and 0 otherwise. Let Ai = 1 if the inspection occurred after the peer review intervention and 0 otherwise. Using the potential outcomes framework, Yi(1) and Yi(0) represent inspection outcomes (red points) by an inspector who has undergone peer review (treatment) or not (control), respectively. The unit-level causal effect is i Yi(1) - Yi(0). The fundamental problem of causal inference is that we cannot jointly observe both potential outcomes.
We hypothesize that the unit-level causal effect i = 0 for all i. Under this null hypothesis, all potential outcomes are known, so we can write outcomes simply as yi (with yi = Yi(1) for treated units and yi = Yi(0) for control units). We formulate a difference-in-differences statistic, which allows us to difference out group-invariant time differences and time-invariant group differences:
The left bracket represents the before-after difference in red points in the treatment group, and the right bracket represents the before-after difference in red points in the control group. Under the null hypothesis, the randomization distribution of the test statistic is determined solely via the random variable T = (T1, . . . , TN).
The p-value (p0) is then defined as:
where vector t represents the observed treatment assignment. Because the number of possible randomizations of thirty-four inspectors into two groups of seventeen is quite large,470 we calculate the p-value via Monte Carlo simulation:
with M = 10,000 simulations and where represents the indicator function and T(j) is the jth draw of the random variable from the known distribution.
Parametric Analogue. A parametric analogue is a least squares difference-in-differences estimator:
where m indexes months. The table below presents results, with Model A corresponding to the above estimate. Model B adds inspector fixed effects and
470. .

Peer Review 69 STAN. L. REV. 1 (2017)
113
Model C conditions on establishments inspected both before and after the intervention with establishment fixed effects.
Raw Trimmed Model A Model B Model C Model A Model B Model C
Treatment 1.98** (0.83)
1.45*
(0.78) 1.59* (0.85)
1.34** (0.61)
0.95*
(0.54) 1.13* (0.58)
Establishment FE
No No Yes No No Yes
Inspector FE No Yes Yes No Yes Yes Month FE Yes Yes Yes Yes Yes Yes Parameters 34 66 5385 34 66 5385 N 28,615 28,615 23,962 28,615 28,615 23,962 R2 0.30 0.34 0.63 0.30 0.34 0.63
Coefficients reported for difference-in-differences models using red points as the outcome, where “trimmed” refers to red points trimmed at thirty-five points. The Treatment group is defined as the group exposed to peer review. The pre-period is defined from January 1, 2013 until the start of the peer review inspections: January 12, 2015. N indicates the sample size. */** denote statistical significance at α-levels of 0.10 and 0.05, respectively. Standard errors are clustered by inspector. Multilevel Model. Using slightly different notation, let Yijt denote the
outcome for an inspection conducted by inspector i, for establishment j, at month m. Outcomes are modeled as:
where are the inspector random effects, indicates whether the inspector was randomized into the treatment group and the inspection occurred after the intervention, and represents the normal distribution. Inspector random effects are assumed to be normally distributed, but distinct for the treatment group postintervention:
with diffuse priors:
where represents the inverse gamma distribution. For month and establishment random effects, we use comparable diffuse priors. We fit the

Peer Review 69 STAN. L. REV. 1 (2017)
114
model with the Stan package in R, running chains with 2000 iterations and 1000 warm-up iterations.
To visualize the basic results, the figure below plots inspector random effects for the treatment group before and after the intervention. As for the raw data displayed in Appendix F, the model-based estimates of inspector gains are heterogeneous, with the largest gains occurring for the low-scoring inspectors.
Inspector Effects
Inspector random effects in the treatment group from the baseline period on the x-axis and after the intervention on the y-axis. These provide model-based estimates of peer review effects for each inspector, showing that gains material-ized largely among low-scoring inspectors. The gray line is the 45-degree line, and the blue line plots a simple linear fit to median postintervention random effects against pre-intervention random effects. Vertical lines represent 95% credible intervals.
FIGURE H HERE
5 10 15 20 25
510
1520
25
Inspector Effects
Pre−intervention
Post
−int
erve
ntio
n

Peer Review 69 STAN. L. REV. 1 (2017)
115
Appendix I Pierce County Background
Because Pierce County’s frontline inspection staff is considerably smaller, our results above focus on King County.471 We provide some background on Pierce County here.
The Health Department of Tacoma-Pierce County was established in 1971 as a joint health department between the City of Tacoma and Pierce County,472 governed by a County Board of Health.473 The Pierce County Executive and Tacoma Mayor appoint the Director of Health, subject to confirmation by the Tacoma City Council and the Pierce County Council.474
The Health Department has an annual budget of $33 million and roughly 255 employees.475 Its main programs include waste disposal, physical and chemical hazards, and food safety.476 The Food and Community Safety program has nineteen inspection staff members and a budget of roughly $4 million.477 It is funded entirely by fees478 from roughly 3900 permitted food establishments.479 Figure 1 above plots the density of restaurants in Pierce County. In addition to food safety, the program covers pool safety, school safety, and youth camps, but frontline inspectors specialize exclusively in food
471. See supra Part IV. 472. PIERCE COUNTY, WASH., CODE § 2.32 (2016); Joint Resolution to Create Combined
Tacoma-Pierce County Health Department, Joint Res. 1, 1971 City Council (Tacoma, Wash. 1971) and 1971 Bd. of Comm’rs (Pierce Cty., Wash. 1971).
473. The Board is comprised of the Mayor of Tacoma, the Pierce County Executive, a Pierce County Councilmember, a Tacoma Councilmember, a Community Member-at-Large, and a nonvoting member. PIERCE COUNTY, WASH., CODE § 2.06.030.B. The county employs a local health officer to administer and enforce regulations. See Anthony L-T Chen, MD, MPH, TACOMA-PIERCE COUNTY HEALTH DEP’T, http://www.tpchd.org/about/director-health (last visited Jan. 1, 2017).
474. See A Resolution of the Pierce County Council Confirming the Appointment of Anthony L-T Chen, M.D., M.P.H., as Director of Health, Tacoma-Pierce County Health Department, R2008-131, 2008 Cty. Council (Pierce Cty., Wash. 2008).
475. See PAT MCCARTHY, 2015 PIERCE COUNTY BUDGET 481 (2014), http://www.co.pierce.wa.us/DocumentCenter/Home/View/32702.
476. See id. at 488-92. 477. Telephone Interview with Rachel Knight, supra note 275. 478. See MCCARTHY, supra note 475, at 491 (showing 90% of funding originating from
permit fees). The remaining fees are from additional inspections or the food worker card program. Telephone Interview with Rachel Knight, supra note 275; Telephone Interview with Katie Lott, Envtl. Health Specialist, Tacoma-Pierce Cty. Dep’t of Health (July 28, 2015).
479. Akiko Oda, Public Health Week: Food Safety & Restaurant Inspections, GIG HARBOR PATCH (Apr. 5, 2012, 5:20 PM ET), http://patch.com/washington/gigharbor/public-health -week-food-safety-restaurant-inspections.

Peer Review 69 STAN. L. REV. 1 (2017)
116
safety inspections.480 Permit fees are slightly lower than in King County (for example, $655 for an establishment that has between twenty-six and seventy-four seats).481 Pierce County also adopts the state food code, score sheet, and marking instructions.482 It uses a risk classification of establishments comparable to that of King County483 and employs a similar scheme of routine, follow-up, and educational inspections. But Pierce County retains its own set of training materials.
Environmental Health Specialists are unionized and graded into three classifications. The first category consists of frontline inspectors, whose principal job responsibility is to conduct field inspections.484 Next are so-called “leads,” who review all inspection reports by frontline inspectors for quality improvement—focusing particularly on reinspections and repeat red violations—and perform joint training inspections with frontline staff.485 Finally, one midlevel manager hears complaints and is responsible for the FDA standardization process.486 Salaries are based on the grade and a thirteen-step system, ranging from $51,000-66,000, $56,000-73,000, and $62,000-80,000 for the three grades, respectively.487 Management may discharge employees for cause488 and may “provide step increases” with each job grade.489 The Program Manager meets weekly with leads to identify programmatic concerns and handles disciplinary actions.490
Like King County, Pierce County has a history of contentious staff relations. In 2010, an external quality improvement report documented a host
480. E-mail from Katie Lott, Envtl. Health Specialist, Tacoma-Pierce Cty. Dep’t of Health, to Daniel E. Ho, Professor of Law, Stanford Law Sch. (Aug. 27, 2015, 8:26 AM) (on file with author).
481. See Tacoma-Pierce Cty. Health Dep’t, Food Plan Review Application Process 2 (2015), http://www.tpchd.org/files/library/5d9852e3e3dbb9c6.pdf.
482. Telephone Interview with Katie Lott, supra note 478. 483. Pierce County classifies establishments into low risk and high risk. 484. See Collective Bargaining Agreement by and Between the Tacoma-Pierce County
Health Department and Washington State Council of County and City Employees Local No. 120, Tacoma-Pierce County Public Health Employees Association, and Teamsters Local Union #117—Affiliated with the International Brotherhood of Teamsters app. A (Jan. 9, 2014) [hereinafter Pierce County Collective Bargaining Agreement] (listing job titles and classifications); id. apps. B, C & D (defining the corresponding salary schedule range for years 2014-2016).
485. See TACOMA-PIERCE CTY. HEALTH DEP’T, FOOD PROGRAM TRAINING MANUAL 6, 11 (2015).
486. See id. at 11. 487. See Pierce County Collective Bargaining Agreement, supra note 484, app. C. 488. See id. §§ 6.2.(c), 14.1. 489. Id. § 16.2. 490. See TACOMA-PIERCE CTY. HEALTH DEP’T, supra note 485, at 11.

Peer Review 69 STAN. L. REV. 1 (2017)
117
of programmatic challenges with low staff morale. Wrote the investigator: “It was VERY surprising and unusual in my experience, but NO ONE I talked with . . . had specific ‘nuggets on the ground/low hanging fruit’ suggestions . . . . Everything was ‘BIG’ stuff about leadership, culture, morale.”491 Staff particularly complained about mismanagement, large variation in caseloads, and lack of trust within the program.492 As a result of such conditions, a new manager was hired to lead the food program in 2011.493
This manager proposed much more substantial review of frontline inspectors, resulting in four departures, as well as a grievance hearing, wherein an inspector unsuccessfully challenged the level of oversight.494 The manager instituted intensive training and an ongoing quality assurance and quality control program.495 Hires are trained for a period of six to eight weeks, working through a training book covering one code item per day.496 The trainee conducts twenty-five joint inspections and twenty-five individual inspections with a lead inspector present, and these paired inspections are conducted once per month on an ongoing basis.497 The midlevel manager conducts FDA standardization with each frontline inspector once every three years, which involves joint field exercises, review of the 2009 FDA Food Code, and an FDA online course.498 Staff turnover remains a challenge.499
491. Tacoma-Pierce Cty. Health Dep’t, supra note 392, at 3. 492. See id. at 2. 493. Telephone Interview with Katie Lott, supra note 478. 494. Telephone Interview with Rachel Knight, supra note 275. 495. See TACOMA-PIERCE CTY. HEALTH DEP’T, supra note 485, at 2-9. 496. See id. at 12; see also Telephone Interview with Rachel Knight, supra note 275;
Telephone Interview with Katie Lott, supra note 478. 497. TACOMA-PIERCE CTY. HEALTH DEP’T, supra note 485, at 11-12. 498. Id. at 12; see also U.S. Food & Drug Admin., State Training Courses and Training Materials,
U.S. DEP’T HEALTH & HUM. SERVS., http://www.fda.gov/Training/ForStateLocalTribalRegulators/default.htm (last updated Aug. 25, 2015).
499. Telephone Interview with Rachel Knight, supra note 275.

Peer Review 69 STAN. L. REV. 1 (2017)
118
Appendix J Pierce County Results
Pierce County implemented the trial in slightly different ways. First, because of a desire to run the trial before switching software systems,500 the county doubled the number of peer inspections, with two peer review days per week. Second, as a result of this timing, guidelines were drafted only after the peer review inspections had already been completed. Third, peer review inspections were conducted more independently. For instance, only the primary inspector was permitted to ask questions of the operator during the inspection.
Results, however, are inconclusive. Surprisingly, red points and violations decreased in both groups over time but more sharply for the control group. Based on randomization inference, however, we cannot reject the null hypothesis of no treatment effects (one-tailed p-value = 0.39). Based on the multilevel model, the posterior probability that interinspector variability decreased in the treatment group is 0.31.
The chief reason for these inconclusive results is that the effective sample size of frontline inspectors is very small (nine frontline inspectors). Statistical power and precision is hence low.
Of course, other possibilities might explain the differences between King and Pierce Counties, which might be informative for broader considerations of experimentalist interventions. First, one critical difference is that the peer review inspections concluded before the revised huddle model was introduced. Conducting the peer review inspections in a compressed timeframe was therefore less than ideal for a test of experimentalism. Second, Pierce County had undergone the FDA standardization process and maintains an ongoing program of quality assurance. As a result, we might expect the benefit of the peer review intervention to be lower. This suggests that absent political considerations, quality assurance can functionally substitute for peer review. On the other hand, there remain considerable differences between inspectors even within Pierce County, which is what motivated county officials to volunteer for the intervention. Third, the disproportionate drop among the control group could be due to the shift of supervisorial resources toward the peer review group. The lead inspectors randomized into the peer review group, for instance, reported that the time burden proved particularly tough on them. This corroborates the idea that peer review requires considerable management costs and human resources. Fourth, inspectors reported facing challenges with the new software system, so it is possible that while not statistically significant,
500. The county had been planning to change to “Envision Connect,” a software program used to assist in food inspection, at the end of April.

Peer Review 69 STAN. L. REV. 1 (2017)
119
the disproportionate drop in the control group is because those inspectors were not teaching each other how to use the new system.
It is very difficult to distinguish between these potential mechanisms given the data at hand. Pierce County officials did qualitatively report that the process was quite helpful, particularly for identifying problematic code items and collectively drafting guidelines to resolve uncertainties. The county, for instance, developed guidelines for blocked handwashing facilities that surfaced many internal disagreements, which were in turn shared with King County. In that sense, in spite of the inconclusive quantitative results, it is informative that Pierce County also decided to institutionalize a limited form of peer review going forward.