Correlation Study on the Falling Weight Deflectometer and Light Weight Deflectometer for the Local
MD-17-SHA/UM/3-20
MARYLAND DEPARTMENT OF TRANPORTATION STATE HIGHWAY ADMINISTRATION
RESEARCH REPORT
STANDARDIZING LIGHTWEIGHT DEFLECTOMETER MODULUS MEASUREMENTS FOR COMPACTION QUALITY
ASSURANCE
Dr. Charles W. Schwartz, Zahra Afsharikia, Dr. Sadaf Khosravifar
UNIVERSITY OF MARYLAND
COLLEGE PARK
FINAL REPORT
SEPTEMBER 2017
StandardizingLightweightDeflectometerModulusMeasurementsforCompactionQualityAssurance
IntroductionElastic modulus is the fundamental material input required for the structural design of pavements. Modulus-based compaction quality assurance (QA) of unbound materials is gaining popularity as conventional nuclear density gauge (NDG) testing becomes less desirable due to safety, regulatory, and cost concerns. The Lightweight Deflectometer (LWD) is a portable device that can be used to measure the surface modulus of unbound layers directly in the field. The principal objective of this research was to provide a straightforward procedure for using LWDs for modulus-based compaction QA that is suitable for practical implementation by field inspection personnel and that does not increase workload significantly.
The Zorn ZFG 3000, Dynatest 3031, and Olson LWD-1 devices were selected as representing the range of commercially available device configurations. In addition, two non-nuclear water content devices were evaluated: a Decagon GS-1 volumetric and an Ohaus MB45 gravimetric moisture analyzer.
Three test pits were designed and constructed at the Federal Highway Administration’s Turner Fairbank Highway Research Center to simulate under controlled conditions scenarios of acceptable and failing construction quality. The pits were carefully constructed using two different cohesive and non-cohesive subgrade soils and one type of granular aggregate base. LWD deflections on the final layer at each pit were initially used to assess the spatial variability for the three LWD types. Additional material was collected for further routine and advanced tests in the laboratory, including compaction moisture-density relations and resilient modulus tests on samples prepared at optimum and field conditions. Lastly, the concept of LWD testing directly on the compacted Proctor mold was developed to derive the target modulus values for the field.
ResultsSummaryEvaluation of MC Measurement Devices. MC as a critical factor affecting the modulus of geomaterials in the field. The MC should be measured and compared to the acceptable MC range derived from Proctor testing in the lab. It was found that the Decagon sensor is difficult to insert when the soil us compacted to a high density and impractical for base materials having large aggregate sizes. Therefore, only the Ohaus moisture analyzer was evaluated versus NDG and oven drying during the field validation phase.
A good correlation was observed between the water content measured by the Ohaus MB45 and the nuclear moisture-density gauge for the large-scale test pit soils after applying a 1.11 correction factor determined from laboratory calibration. The MC data from the Ohaus device also correlated well versus oven dried samples in the field validation sites after applying the correction factor. Newer Ohaus device models with higher soil capacity appropriate for testing larger aggregates in the field are now commercially available. Evaluation of LWD Devices. Different LWDs with different configurations (drop height, deflection sensor type, plate size and type, etc.) measure different modulus values in the field and in the lab. To minimize the effect of these discrepancies, it is recommended that the same type of LWD be used for target modulus determination in the lab and the as-placed modulus in the field. The plate size and applied pressure should also be reported with the target modulus value. Laboratory Testing Program. Routine laboratory tests including moisture-density relations plus the LWD testing on the Proctor mold were performed on all soils. The LWD on mold test provides essential insights into the moisture, density and stress dependency of the soil that can be used to tailor the compaction criteria in the field. The LWD on mold moduli were interpolated at the appropriate applied stress level and compaction MC of the test pits and field validation sites to establish the target LWD modulus.
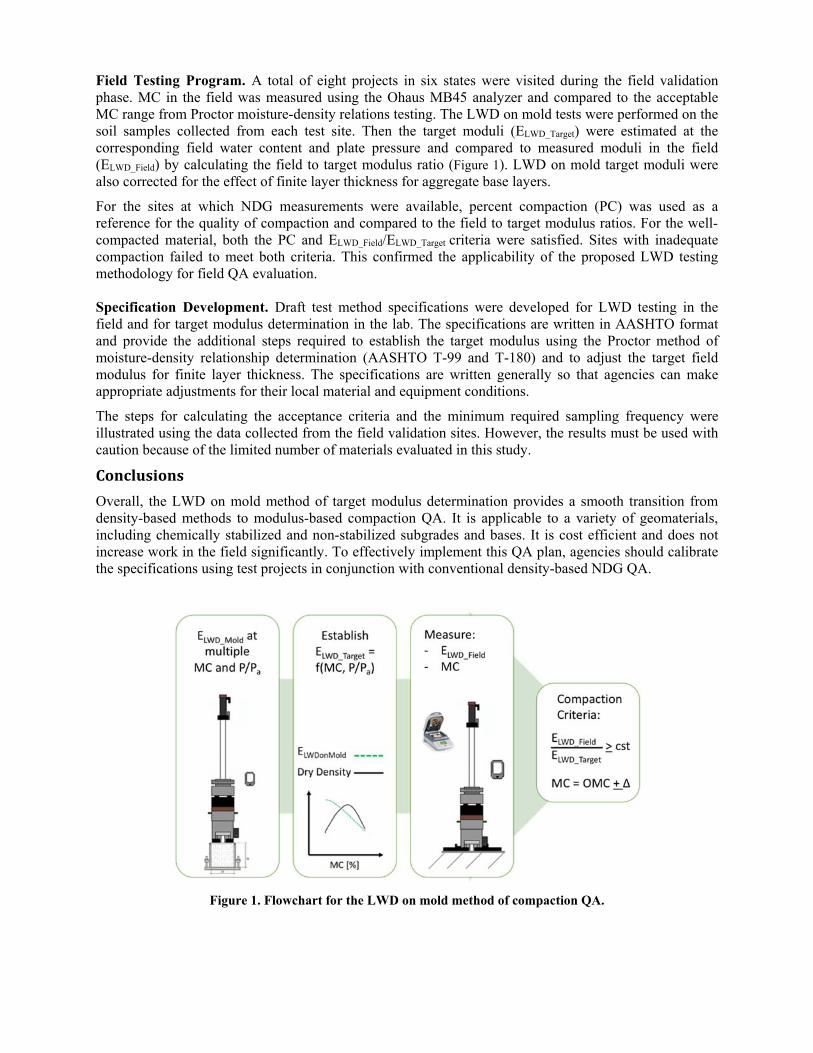
Field Testing Program. A total of eight projects in six states were visited during the field validation phase. MC in the field was measured using the Ohaus MB45 analyzer and compared to the acceptable MC range from Proctor moisture-density relations testing. The LWD on mold tests were performed on the soil samples collected from each test site. Then the target moduli (ELWD_Target) were estimated at the corresponding field water content and plate pressure and compared to measured moduli in the field (ELWD_Field) by calculating the field to target modulus ratio (Figure 1). LWD on mold target moduli were also corrected for the effect of finite layer thickness for aggregate base layers.
For the sites at which NDG measurements were available, percent compaction (PC) was used as a reference for the quality of compaction and compared to the field to target modulus ratios. For the well-compacted material, both the PC and ELWD_Field/ELWD_Target criteria were satisfied. Sites with inadequate compaction failed to meet both criteria. This confirmed the applicability of the proposed LWD testing methodology for field QA evaluation. Specification Development. Draft test method specifications were developed for LWD testing in the field and for target modulus determination in the lab. The specifications are written in AASHTO format and provide the additional steps required to establish the target modulus using the Proctor method of moisture-density relationship determination (AASHTO T-99 and T-180) and to adjust the target field modulus for finite layer thickness. The specifications are written generally so that agencies can make appropriate adjustments for their local material and equipment conditions.
The steps for calculating the acceptance criteria and the minimum required sampling frequency were illustrated using the data collected from the field validation sites. However, the results must be used with caution because of the limited number of materials evaluated in this study.
ConclusionsOverall, the LWD on mold method of target modulus determination provides a smooth transition from density-based methods to modulus-based compaction QA. It is applicable to a variety of geomaterials, including chemically stabilized and non-stabilized subgrades and bases. It is cost efficient and does not increase work in the field significantly. To effectively implement this QA plan, agencies should calibrate the specifications using test projects in conjunction with conventional density-based NDG QA.
Figure 1. Flowchart for the LWD on mold method of compaction QA.

ii
The contents of this report reflect the views of the author who is responsible for the facts and the accuracy of the data presented herein. The contents do not necessarily reflect the official views or policies of the Maryland Department of Transportation. This report does not constitute a standard, specification, or regulation.
iii
Table of Contents
TABLE OF CONTENTS .......................................................................................................................... iiiLIST OF TABLES ...................................................................................................................................... vLIST OF FIGURES ................................................................................................................................... viCONVERSION FACTORS ....................................................................................................................... x
TECHNICAL REPORT DOCUMENTATION PAGE……………………………………………….. xi CHAPTER 1 ................................................................................................................................................ 11. INTRODUCTION .............................................................................................................................. 1
1.1. PROBLEM STATEMENT ................................................................................................................. 21.2. RESEARCH OBJECTIVES ............................................................................................................... 21.3. FINAL REPORT ORGANIZATION ................................................................................................... 3
CHAPTER 2 ................................................................................................................................................ 52. EQUIPMENT EVALUATION ......................................................................................................... 5
2.1. LWD WORKING PRINCIPLES ....................................................................................................... 52.2. SELECTED LWD EQUIPMENT ...................................................................................................... 92.3. MOISTURE CONTENT MEASUREMENT DEVICES ........................................................................ 13
2.3.1. Available technologies .......................................................................................................... 132.3.2. Ohaus MB45 moisture analyzer ............................................................................................ 162.3.3. Volumetric water content (VWC) sensor ............................................................................... 172.3.4. Nuclear moisture-density gauge ............................................................................................ 19
CHAPTER 3 .............................................................................................................................................. 213. CONTROLLED TRIALS ................................................................................................................ 21
3.1. SMALL- SCALE LABORATORY CHARACTERIZATION ................................................................. 223.1.1. Resilient modulus testing ....................................................................................................... 223.1.2. Factors affecting the resilient modulus ................................................................................. 293.1.3. Evaluation of measured resilient modulus versus predictive models .................................... 31
3.2. LARGE-SCALE LABORATORY CHARACTERIZATION TESTS UNDER CONTROLLED CONDITIONS (TEST PITS) ............................................................................................................................................. 33
3.2.1. Introduction ........................................................................................................................... 333.2.2. Evaluation of water content measurement device on the test pits ......................................... 343.2.3. LWD testing on the test pits................................................................................................... 363.2.4. Static plate loading testing on the test pits ............................................................................ 453.2.5. LWD testing on Proctor molds for the test pit soils .............................................................. 53
1.1. LWD MODULUS ON MOLD VERSUS TRIAXIAL RESILIENT MODULUS ...................................... 683.2.6. Conclusion ............................................................................................................................. 72
CHAPTER 4 .............................................................................................................................................. 744. FIELD VERIFICATION ................................................................................................................. 74
4.1. INTRODUCTION .......................................................................................................................... 744.2. EVALUATED FIELD PROJECTS .................................................................................................... 754.3. EVALUATION OF MOISTURE DEVICES IN THE FIELD ................................................................. 774.4. EVALUATION OF LWD DEVICES IN THE FIELD .......................................................................... 814.5. LWD ON MOLD TESTING FOR THE FIELD MATERIAL ............................................................... 894.6. FIELD TO TARGET MODULUS RATIO VERSUS PERCENT COMPACTION ................................... 1024.7. ACCEPTANCE CRITERIA ........................................................................................................... 1094.8. SAMPLING FREQUENCY ........................................................................................................... 112
iv
CHAPTER 5 ............................................................................................................................................ 1145. SPECIFICATION DEVELOPMENT .......................................................................................... 114
5.1. LABORATORY DETERMINATION OF TARGET MODULUS USING LWD DROPS ON COMPACTED PROCTOR MOLD ........................................................................... ERROR! BOOKMARK NOT DEFINED.155.2. COMPACTION QUALITY CONTROL USING LIGHT WEIGHT DEFLECTOMETER (LWD) ............ 122
CHAPTER 6 ............................................................................................................................................ 1306. FINAL CONCLUSION AND FUTURE RESEARCH ............................................................... 1307. REFERENCES ........................................................................................................................... 13333
v
LIST OF TABLES
Table 2-1. Stress distribution factor for different types of soil ....................................................... 8 Table 2-2. (After Vennapusa and White 2009, Nazarian et. al 2009, Mooney and Miller 2009) . 10 Table 2-3. Charactrisitics of the studied LWDs ............................................................................ 11 Table 2-4. Advantages and Disadvantages of Moisture/Density Devices (from Table 2.5.1 –
NCHRP 10-84 final report, 2014) ........................................................................................... 14 Table 2-5. Moisture Measurement Devices /Method (from Christopher et. al., 2013) ................ 15 Table 2-6. Calibration equations for the implemented instrumentations ...................................... 18 Table 3-1. Target MC, Density, and layer thickness .................................................................... 21 Table 3-2. Testing plan for MR testing according to AASHTO T-307 ......................................... 25 Table 3-3. ALF MR test results ..................................................................................................... 26 Table 3-4. HPC MR test results ..................................................................................................... 26 Table 3-5. VA21a MR test results ................................................................................................. 27 Table 3-6. Drop heights for each LWD device ............................................................................. 36 Table 3-7. COV in the surface modulus of the last three drops in LWD testing in Pits ............... 36 Table 3-8. Plate load testing condition ......................................................................................... 46 Table 3-9. Static plate loading test results .................................................................................... 50 Table 3-10. Average static plate loading test results at each Pit and layer ................................... 50 Table 3-11. Revised drop heights for LWD testing on molds ...................................................... 55 Table 3-12. E_M at optimum and the pits condition for HPC, ALF, and VA21a soil as measured
by Zorn, Olson, and Dynatest LWD at P/Pa=1 ....................................................................... 63 Table 4-1. Test sites location and soil type ................................................................................... 76 Table 4-2. Soil surface temperature and weather condition for the visited evaluation sites ........ 77 Table 4-3. Variation of moduli for different LWDs. .................................................................... 83 Table 4-4. Corrlation between moduli at second half-height drop and moduli at first half-height
drop for Zorn LWD. ................................................................................................................ 86 Table 4-5. Corrlation between moduli at second half-height drop and moduli at first half-height
drop for Olson LWD. .............................................................................................................. 87 Table 4-6. Corrlation between moduli at second half-height drop and moduli at first half-height
drop for Dynatest LWD. ......................................................................................................... 88 Table 4-7. Drop heights for LWD testing on molds for field soils ............................................... 89 Table 4-8. A PWL estimation table for a sample size of 10 (from the Quality Assurance Software
for the Personal Computer, 1996). ....................................................................................... 110 Table 4-9. Variabily analysis to find the minimum number of tests in the field for subgrade
material. ................................................................................................................................ 113 Table 4-10. Variabily analysis to find the minimum number of tests in the field for base material.
............................................................................................................................................... 113
vi
LIST OF FIGURES
Figure 2-1. Diagram of LWD and its parts ..................................................................................... 6Figure 2-2. Schematic of the LWD-ground movement: 2 DOF system ......................................... 6Figure 2-4. An example of load and deflection time history (from LWDmod software- Dynatest)......................................................................................................................................................... 7Figure 2-5. An example of load versus deflection hysteresis (from LWDmod software- Dynatest)......................................................................................................................................................... 7Figure 2-6. LWD testing on one layer and two layer systems ........................................................ 7Figure 2-7. Zorn ZFG 3.0 LWD: (a) Zorn LWD with the older data logger and printer system, (b) new Zorn transportation trolley, and (c) new data logger and separate printer (pictures courtesy of Zorn instruments) ....................................................................................................... 11Figure 2-8. Dynatest LWD 3031, including LWD set up with the optional external geophones (pictures courtesy of Dynatest Consulting Inc.) ........................................................................... 12Figure 2-9. Olson LWD-01 with the new ruggedized DELL tablet and optional lighter (~8.5 lbs) drop weight (pictures courtesy of Olson Engineering Inc.) .......................................................... 12Figure 2-10. Ohaus MB45 moisture analyzer ............................................................................... 16Figure 2-11. Comparison of water content measurement by Ohaus MB45 moisture analyzer and oven drying for gravel, sand, silty sand, and clayey sand soils .................................................... 17Figure 2-12. Decagon GS-1 ruggedized volumetric water content (VWC) sensor ...................... 18Figure 2-13. The influence zone of GS-1 sensor (From GS-1 sensor manual) ............................ 19Figure 2-14. Troxler 3440 nuclear moisture-density gauge on the test pit (left picture) and in the field (right picture) ........................................................................................................................ 19Figure 2-15. Nuclear gauge in direct transmission geometry (Troxler 3440 Manual, 2015) ....... 20Figure 3-1. Resilient modulus terms: contact stress, cyclic axial stress (σcyclic), and maximum resilient vertical stress (σmax) (AASHTO T-307) .......................................................................... 23Figure 3-2. Stress-strain relationship in MR test ........................................................................... 23Figure 3-3. UTM- 100 apparatus and sample ............................................................................... 24Figure 3-4. MR for ALF at optimum, Pit 1, and Pit 2 construction conditions ............................. 27Figure 3-5. MR for VA21a at optimum, Pit 2, and Pit 3 construction conditions ......................... 28Figure 3-6. MR for HPC soil at optimum and Pit 3 construction conditions ................................ 28Figure 3-7. Contour of FU as a function of percent compaction (PC) and saturation (S) ............. 30Figure 3-8. Test pit final compacted layer and LWD testing locations ........................................ 33Figure 3-9. GWC from Ohaus MB45 moisture analyzer versus GWC from nuclear moisture-density gauge. ............................................................................................................................... 34Figure 3-10. Decagon GS-1 VWC sensor inserted from the top on the ALF soil; VWC reading with ProCheck; Using a drill to prefabricate holes for the Decagon GS-1 VWC sensor insertion into HPC soil ................................................................................................................................. 35Figure 3-11. VWC measurements: Decagon versus Nuclear gauge ............................................. 35Figure 3-12. Average COV in the last three drops ....................................................................... 37Figure 3-13. LWD surface modulus on the final grade of the subgrade soil in Pit 1 ................... 38Figure 3-14. LWD surface modulus on the final grade of the subgrade soil in Pit 2 ................... 38Figure 3-15. LWD surface modulus on the final grade of the subgrade soil in Pit 2 16 hours after compaction .................................................................................................................................... 39Figure 3-16. LWD surface modulus on the final grade of the base layer in Pit 2 1 hour after compaction .................................................................................................................................... 39
vii
Figure 3-17. LWD surface modulus on the final grade of the base layer in Pit 2 4 hour afters compaction .................................................................................................................................... 40Figure 3-18. LWD surface modulus on the final grade of the base layer in Pit 2 216 hours after compaction .................................................................................................................................... 40Figure 3-19. LWD surface modulus on the final grade of the subgrade soil in Pit 3 ................... 41Figure 3-20. LWD surface modulus on the final grade of the base layer in Pit 3 4 hours after compaction .................................................................................................................................... 41Figure 3-21. Variation in surface modulus of the ALF subgrade soil in Pit 1 after compaction .. 42Figure 3-22. Variation in surface modulus of the ALF subgrade soil in Pit 2 after compaction .. 43Figure 3-23. Variation in surface modulus of the VA21a aggregate base in Pit 2 after compaction. The table shows the volumetric properties of the base and subgrade layers after compaction and after nine days ..................................................................................................... 43Figure 3-24. Variation in surface modulus of the VA21a aggregate in Pit 3 after compaction. Table shows the volumetric properties of the base and subgrade layers after compaction and after 45 hrs ............................................................................................................................................. 44Figure 3-25. Static plate load test on the test pit ........................................................................... 45Figure 3-26. Static plate loading test: load versus deformation for Pit I ALF subgrade .............. 46Figure 3-27. Static plate loading test: load versus deformation for Pit II ALF subgrade ............. 46Figure 3-28. Static plate loading test: load versus deformation for Pit II VA21a base ................ 47Figure 3-29. Static plate loading test: load versus deformation for Pit III HPC subgrade ........... 47Figure 3-30. Static plate loading test: load versus deformation for Pit III VA21a base ............... 48Figure 3-31. Loading and unloading paths in static plate loading test ......................................... 48Figure 3-32. ES-unload / ES-load @90kPa average for the sets 1 and 2 of testing at each layer......... 51Figure 3-33. (A) Surface modulus from LWD testing and loading modulus from plate load testing (set 1 and 2) at 90 kPa; (B) Spatial variability from LWD testing and plate load testing (set 1 and 2) at 90 kPa ................................................................................................................... 52Figure 3-34. Surface modulus from LWD testing versus plate load testing (set 1) at 90 kPa ...... 52Figure 3-35. Moduli determination method for subgrade/unbound material. From Figure 3.5, NCHRP 10-84 phase I report (Nazarian et al, 2011) .................................................................... 53Figure 3-36. Schematic of LWD testing on mold (Tefa, 2015) .................................................... 54Figure 3-37. Configuration of Zorn, Olson, and Dynatest LWDs on top of the Proctor mold ..... 55Figure 3-38. Example of (A) good signal and (B) poor Zorn deflection data. Poor signals were excluded from the analyses. Graphs obtained from the ZornZFG software ................................. 56Figure 3-39. Example of (A) good and (B) poor Dynatest deflection signals. Poor signals were excluded from the analyses. Graphs obtained from the Dynatest LWDmod software ................. 56Figure 3-40. Examples of (A) poor clipped force signal; (B) poor deflection signal with no rebound; (C) good force signal; and (D) good deflection signal for the Olson LWD. Poor signals were excluded from the analyses. Graphs obtained from the Olson WinLWD software ............. 57Figure 3-41. E_ZM and dry density versus (A) GWC and (B) VWC .......................................... 59Figure 3-42. LWD modulus on mold versus GWC and dry density versus GWC for the HPC subgrade at diferent P/Pa values for (A) Zorn, (B) Olson, and (C) Dynatest LWDs. The legend specifies P/Pa ................................................................................................................................ 60Figure 3-43. LWD modulus on mold versus GWC and dry density versus GWC for the ALF subgrade at different P/Pa values for (A) Zorn, (B) Olson, and (C) Dynatest LWDs. The legend specifies P/Pa ................................................................................................................................ 61
viii
Figure 3-44. LWD modulus on mold versus GWC and dry density versus GWC for the VA21a base compacted at modified compaction energy at different P/Pa values for (A) Zorn, (B) Olson, and (C) Dynatest LWDs. The legend specifies P/Pa .................................................................... 62Figure 3-45. (A) E_OM versus E_ZM and (B) E_DM versus E_ZM .......................................... 63Figure 3-46. Resilient modulus and LWD on mold modulus as measured by different LWDs at P/Pa=1. .......................................................................................................................................... 64Figure 3-47. LWD on mold modulus versus resilient modulus at P/Pa=1. .................................. 64Figure 3-48. Ratio of EField / ELWD on Mold for different materials and pits ..................................... 66Figure 3-49. Comparison of field LWD surface modulus and LWD on mold modulus for Zorn, Dynatest, and Olson LWDs: (A) data from Pit 2 ALF and VA21a, Pit 3 HPC and VA21a; (B) data from Pit 2 ALF, Pit 3 HPC and VA21a ................................................................................ 67Figure 3-50. The different stress paths in LWD test on mold versus MR ..................................... 68Figure 3-51. MR/ELWD versus ν at P/Pa of 0.7 for VA21a soil at OPT, Pit 2, and Pit 3 field condition ....................................................................................................................................... 69Figure 3-52. MR/ELWD versus P/Pa for ν= 0.35- VA21a soil at OPT, Pit 2, and Pit 3 field condition ....................................................................................................................................... 69Figure 3-53. MR/ELWD versus ν at P/Pa of 1.7 for HPC soil at Pit 3 field condition .................... 70Figure 3-54. MR/ELWD versus P/Pa for ν= 0.35- HPC soil at Pit 3 field condition ....................... 70Figure 3-55. MR/ELWD versus ν at P/Pa of 1.7 for ALF soil at Pit 2 field condition .................... 70Figure 3-56. MR/ELWD versus P/Pa for ν= 0.35- ALF soil at Pit 2 field condition ....................... 71Figure 3-57. MR/ELWD versus ν at P/Pa of 1.7 for ALF soil at Pit 1 field condition .................... 71Figure 3-58. MR/ELWD versus P/Pa for ν= 0.35- ALF soil at Pit 1 field condition ....................... 71Figure 4-1. Location of test stations along a compacted lane (left) and a station plan (right) ..... 76Figure 4-2. Fluke Infrared Thermometer (left) and Kestrel 4300 Construction Weather Tracker (right) ............................................................................................................................................ 77Figure 4-3. Average GWC obtained by Ohaus moisture analyzer versus oven drying method ... 78Figure 4-4. Summary of GWC measured by NDG at different sites (SG:subgrade, L: Lift, R:Round) ....................................................................................................................................... 79Figure 4-5. Summary of GWC by oven drying method for different sites (SG:subgrade, L: Lift, R:Round) ....................................................................................................................................... 79Figure 4-6. Gravimetric water content obtained by oven drying method vs NDG for field material ......................................................................................................................................... 80Figure 4-7. Spatial COV of water content for NDG versus oven drying method ........................ 80Figure 4-8. LWD and NDG testing on the subgrade and base after compaction ......................... 83Figure 4-9. Summary of Zorn LWD moduli measurements at different sites .............................. 84Figure 4-10. Summary of Olson LWD moduli measurements at different sites .......................... 84Figure 4-11. Summary of Dynatest LWD moduli measurements at different sites...................... 85Figure 4-12. Summary of percent compaction measured by NDG in the field ............................ 85Figure 4-13. Dynatest LWD’s movable release handle and laser engraved scale on the guide shaft (left), and adjustable pipe clamps to set lower drop heights for Zorn LWD (right) ............ 90Figure 4-14. Attached collar during LWD on mold testing .......................................................... 90Figure 4-15. LWD modulus on mold superimposed on dry density versus GWC for VA21a soil at variable P/Pa for (A) Zorn, (B) Dynatest, and (C) Olson LWDs .............................................. 92Figure 4-16. LWD modulus on mold superimposed on dry density versus GWC for MD5 subgrade at variable P/Pa for (A) Zorn, (B) Dynatest, and (C) Olson LWDs .............................. 93
ix
Figure 4-17. LWD modulus on mold superimposed on dry density versus GWC for NY embankment soil at variable P/Pa for (A) Zorn, (B) Dynatest, and (C) Olson LWDs ................. 94Figure 4-18. LWD modulus on mold superimposed on dry density versus GWC for MD337 base at variable P/Pa for (A) Zorn, (B) Dynatest, and (C) Olson LWDs .............................................. 95Figure 4-19. LWD modulus on mold superimposed on dry density versus GWC for FL subgrade at variable P/Pa for (A) Zorn, (B) Dynatest, and (C) Olson LWDs .............................................. 96Figure 4-20. LWD modulus on mold superimposed on dry density versus GWC for FL base at variable P/Pa for (A) Zorn, (B) Dynatest, and (C) Olson LWDs ................................................. 97Figure 4-21. LWD modulus on mold superimposed on dry density versus GWC for MD404 base at variable P/Pa for (A) Zorn, (B) Dynatest, and (C) Olson LWDs .............................................. 98Figure 4-22. LWD modulus on mold superimposed on dry density versus GWC for IN base at variable P/Pa for (A) Zorn, (B) Dynatest, and (C) Olson LWDs ................................................. 99Figure 4-23. LWD modulus on mold superimposed on dry density versus GWC for IN cement modified subgrade at variable P/Pa for (A) Zorn, (B) Dynatest, and (C) Olson LWDs ............. 100Figure 4-24. LWD modulus on mold superimposed on dry density versus GWC for MO base at variable P/Pa for (A) Zorn, (B) Dynatest, and (C) Olson LWDs ............................................... 101Figure 4-25. Two-layer system of subgrade with modulus E2 overlain by base with modulus E1
..................................................................................................................................................... 102Figure 4-26. Average PC versus average Efield to Etarget ratio for MD5 subgrade for (A) Zorn, (B) Dynatest, and (C) Olson LWDs .................................................................................................. 104Figure 4-27. Average PC versus average Efield to Etarget ratio for NY embankment soil for (A) Zorn, (B) Dynatest, and (C) Olson LWDs .................................................................................. 105Figure 4-28. Average PC versus average Efield to Etarget ratio for MD337 base for (A) Zorn, (B) Dynatest, and (C) Olson LWDs .................................................................................................. 106Figure 4-29. Average PC versus average Efield to corrected Etarget ratio for MD404 base for (A) Zorn, (B) Dynatest, and (C) Olson LWDs .................................................................................. 107Figure 4-30. Average PC versus average Efield to corrected Etarget ratio for FL base for (A) Zorn, (B) Dynatest, and (C) Olson LWDs ............................................................................................ 108Figure 4-31. Lower specification limit for Efield /Etarget for (A) Zorn, (B) Dynatest, and (C) Olson LWDs .......................................................................................................................................... 111
x
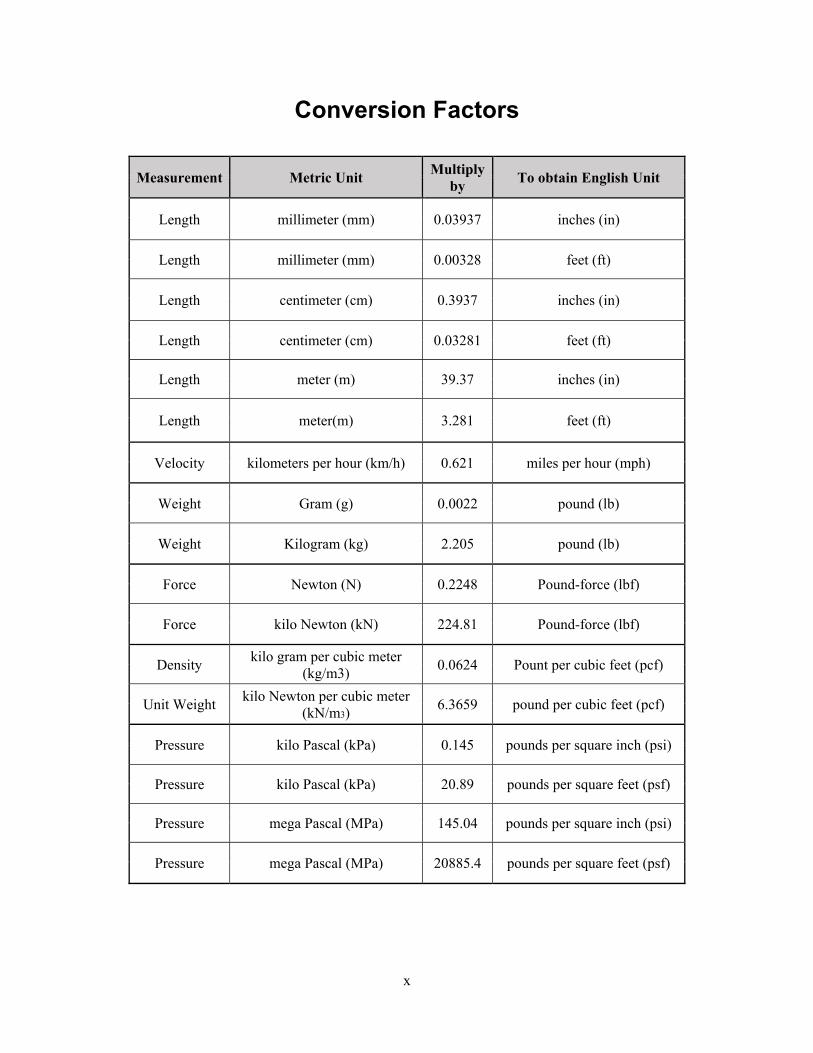
Conversion Factors
Measurement Metric Unit Multiply by To obtain English Unit
Length millimeter (mm) 0.03937 inches (in)
Length millimeter (mm) 0.00328 feet (ft)
Length centimeter (cm) 0.3937 inches (in)
Length centimeter (cm) 0.03281 feet (ft)
Length meter (m) 39.37 inches (in)
Length meter(m) 3.281 feet (ft)
Velocity kilometers per hour (km/h) 0.621 miles per hour (mph)
Weight Gram (g) 0.0022 pound (lb)
Weight Kilogram (kg) 2.205 pound (lb)
Force Newton (N) 0.2248 Pound-force (lbf)
Force kilo Newton (kN) 224.81 Pound-force (lbf)
Density kilo gram per cubic meter (kg/m3) 0.0624 Pount per cubic feet (pcf)
Unit Weight kilo Newton per cubic meter (kN/m3) 6.3659 pound per cubic feet (pcf)
Pressure kilo Pascal (kPa) 0.145 pounds per square inch (psi)
Pressure kilo Pascal (kPa) 20.89 pounds per square feet (psf)
Pressure mega Pascal (MPa) 145.04 pounds per square inch (psi)
Pressure mega Pascal (MPa) 20885.4 pounds per square feet (psf)
xi
Technical Report Documentation Page
1. Report No.MD-17-SHA-UM-3-20
2. Government Accession No. 3. Recipient's Catalog No.
4. Title and SubtitleStandardizing Lightweight Deflectometer Modulus Measurements for Compaction Quality Assurance
5. Report DateSeptember 2017
6. Performing Organization Code
7. Author/sDr. Charles Schwartz, Zahra Afsharikia, Dr. Sadaf Khosravifar
8. Performing Organization Report No.
9. Performing Organization Name and AddressUniversity of Maryland, College Park Department of Civil and Environmental Engineering 1173 Glen L. Martin Hall College Park MD 20742-3021
10. Work Unit No. (TRAIS)
11. Contract or Grant No.TPF-5(285)/SP409B4P
12. Sponsoring Organization Name and AddressMaryland Department of Transportation State Highway Administration Office of Policy & Research 707 North Calvert Street Baltimore MD 21202
13. Type of Report and Period CoveredFinal Report
14. Sponsoring Agency Code(7120) STMD - MDOT/SHA
15. Supplementary Notes16. AbstractTo evaluate the compaction of unbound geomaterials under unsaturated conditions and replace the conventional methods with a practical modulus-based specification using LWD, this study examined three different LWDs, the Zorn ZFG 3000 LWD, Dynatest 3031 LWD, and Olson’s LWD-1. These devices were selected to represent the range of commercially available testing configurations. Following the selection, a unique large-scale controlled experimental setting was designed and constructed for preliminary investigations. In addition to evaluation of the LWDs, two non-nuclear water content measurement techniques, namely a volumetric water content sensor and a gravimetric moisture analyzer, were assessed. Additional material was collected for further routine and advanced tests in the laboratory, including compaction moisture-density relations and resilient modulus tests on samples prepared at optimum and field conditions. Lastly, the concept of LWD testing directly on the compacted Proctor mold was developed to derive the target modulus values for the field.
The research findings were summarized in two modulus-based QA procedures/specifications intended for practical implementation by state DOTs and engineers. The test protocols and data interpretation procedures are in AASHTO format. 17. Key WordsLight Weight Deflectometer (LWD), Modulus Measurement, Moisture Content Measuring Devices, Resilient Modulus Testing
18. Distribution Statement: No restrictionsThis document is available from the Research Division upon request.
19. Security Classification (of this report)None
20. Security Classification (of this page)None
21. No. Of Pages147
22. Price
Form DOT F 1700.7 (8-72) Reproduction of completed page authorized.
1
Chapter 1
1. INTRODUCTION
The foundations of most roads and pavements are prepared by compacting unbound geomaterials under unsaturated conditions. Current compaction specifications in many states require achieving a certain percentage of maximum dry density depending on the layer type and location (subgrade, base, embankment, etc.). Conventional density-based methods of compaction quality assurance (QA) using nuclear density gauges (NDG) have been the practice for many years. Density is a relatively easy property to measure in the field, and it is loosely correlated to more fundamental engineering properties. However, it is not a direct input to the structural design of the pavements and is not directly linked to pavement performance.
Moreover, historically back in 1948, Ralph Proctor used a Penetration Needle to find the correct soil moisture content (MC) for compaction and the Indicated Saturation Penetration Resistance as a measure of compaction (Proctor, 1948). Proctor also explained that no use was made of the actual peak dry weight and that methods for creating laboratory compaction specimens, such as dropping various weight tampers from different heights, were tried and discarded (Proctor 1945). Despite Proctor’s clear recommendation for the use of penetration resistance as the measure of compaction, an “optimum” soil dry weight and moisture content were being adopted by most organizations at that time (Proctor 1948).
Furthermore, the particle arrangement in the soil structure may vary substantially without any significant change in the dry density (Hveem and Carmany, 1949), resulting in different soil behavior and properties.
On the other hand, elastic modulus is the fundamental material input required for the structural design of pavements. Modulus-based compaction QA of unbound materials is gaining attention in the pavement industry as NDG testing becomes less desirable because of safety, regulatory, and cost concerns. The Lightweight Deflectometer (LWD) is a portable device that can be used to measure the surface modulus of unbound layers directly in the field. LWDs are being employed for pavement construction QA in a few states and countries now, but their broader implementation has been hampered by the lack of a widely recognized standard for interpreting the measured stiffness data obtained. There are extensive challenges in establishing such a standard specification, including the differences in the configuration of various commercial LWD devices, the nonlinearity of the soil modulus under different moisture and stress conditions, and the differences in the stress states and boundary conditions between typical laboratory tests and field conditions. Despite these challenges, LWDs are promising tools for performance based construction QA testing that will not only result in a better constructed product but will also provide the engineering properties critical for better understanding of the connection between pavement design and long term pavement performance.
In this study, three different LWDs were examined, Zorn ZFG 3000 LWD, Dynatest 3031 LWD, and Olson’s LWD-1 devices were selected as representing the range of commercially available configurations. A unique large-scale controlled experimental setting was designed and constructed for preliminary investigations. In addition to evaluation of the LWDs, two non-nuclear water content measurement techniques, namely a volumetric water content sensor and a
2
gravimetric moisture analyzer, were assessed. Additional material was collected for further routine and advanced tests in the laboratory, including compaction moisture-density relations and resilient modulus tests on samples prepared at optimum and field conditions. Lastly, the concept of LWD testing directly on the compacted Proctor mold was developed to derive the target modulus values for the field.
Field validation and supplementary lab testing were conducted for evaluating the proposed test equipment and LWD on Proctor mold methodology. Repeatability and reproducibility of the LWD measurements in actual construction practice has been assessed. The spatial variability of moisture, density, and modulus was captured for the final refinement of a practical QC procedure.
The research findings were summarized in two modulus-based QA procedures intended for practical implementation by state DOTs and engineers. The test protocols and data interpretation procedures are in AASHTO format. Both are reasonably easy to implement and do not increase field workload significantly.
1.1. Problem Statement
The mechanistic-empirical pavement design method requires the elastic resilient modulus as the key input for characterization of geomaterials. Current density-based QA procedures do not measure resilient modulus. Additionally, the density-based methods do not incorporate the stiffness changes in unconventional materials over time due to moisture content changes or curing. Studies by Khosravifar et al. (2013) showed that the final stiffness of a field-cured foamed asphalt stabilized base increased over time until it was about 15 times greater than that for the graded aggregate base while the dry density remained constant. The high costs associated with the radiation-safe operation of nuclear density gauges also encourage the search for an alternative.
To replace the conventional methods with a practical modulus-based specification using LWDs, several components are required:
(1) Fundamental understanding of LWD configurations and data interpretation. (2) A target modulus value to aim for after compaction. (3) A testing method and data analysis procedure that does not increase field workload
significantly, so that the agencies will be able to adopt and implement easily. (4) Consideration of the LWD devices’ variabilities and the effects of moisture/drying, stress
states/levels, and finite layer thickness on measured stiffness. (5) Emphasis on the importance of moisture content control at the time of compaction. (6) Recommendations for the field compaction, sampling, and control.
1.2. Research Objectives
The principal objective of this research is to provide a straightforward procedure for using LWDs for modulus -based compaction QA that is suitable for practical implementation by field inspection personnel. To meet this objective, the following work elements were defined and pursued:
(1) Literature review of existing applications of LWDs for modulus-based QA.
3
(2) Preliminary evaluation of LWD load and deflection measurements. (3) Assessment of the effects of LWD device details—e.g., plate diameter, plate rigidity,
contact area stress distribution, loading rate, and deflection measurement locations. (4) Formulation and validation of a LWD modulus-based QA approach through testing in
large, controlled test pits, including documentation of the test pit construction, testing conditions, and all associated laboratory tests.
(5) Evaluation of field moisture content measurement alternatives to NDG. (6) Verification of the proposed LWD modulus-based QA approach under actual field
conditions. (7) Drafting of practical LWD modulus-based QA specifications in AASHTO format.
1.3. Final Report Organization
The main body of this report is organized to summarize the principal findings that have been integrated in the proposed specifications. Supporting details are provided in appendices as appropriate.
Chapter 1 presents an introduction to the study, its objectives, and a summary of the state of practice for modulus-based QA of unbound material using LWD. Detailed reviews of other studies and Department of Transportation (DOT) efforts are provided in Appendix 1.
Chapter 2 describes the devices examined in this study: (1) LWD device configurations, working principles, available brands, and related literature review; (2) Commercially available moisture content measurement devices, including the Ohaus MB-45 moisture analyzer; and (3) NDG devices. Frequency domain spectral analysis was performed on the force and deflection signals from LWD tests on a four-point steel beam as part of this evaluation; this testing is described in Appendix 2. The results were used to distinguish the inherent variabilities between the three LWD devices and to confirm the sufficiency of peak method in LWD stiffness determination.
Chapter 3 provides significant findings from the (1) modulus constitutive models conducted as intermediate steps are documented in Appendix 3. Furthermore, details on test pits construction, instrumentation, and data collection are provided in Khosravifar (2015).
Chapter 4 includes a summary of field projects visited, an illustration of the LWD on mold target determination method, and validation based on the field data. Further details and notes of the field locations, project details, testing, equipment, and analyses are provided in Appendix 4.
Chapter 5 provides the implementation-ready draft specifications in AASHTO format and QA recommendations.
Chapter 6 summarizes the principal findings and conclusions from the study and provides recommendations for future research, controlled trials in the laboratory, as well as (2) the LWD testing performed on the constructed layers in test pits along with static plate loading tests and conventional nuclear gauge moisture-density measurements. Since the final target determination method in this study does not require resilient modulus testing in the lab, the preliminary evaluations and results of resilient modulus testing and assessed soil resilient Background
Conventionally, nuclear density gauges (NDG) have been used to measure the in-situ density of geomaterials after compaction. Percent compaction, calculated by dividing the field measured
4
equivalent dry density by a laboratory determined maximum dry density (MDD), has been used as a criterion to assess compaction quality. The target MDD and optimum moisture content (OMC) are derived from standard or modified Proctor tests (AASHTO T-99 and T-180). It is interesting historically that back in 1948, Ralph Proctor clarified that neither shear strength nor consolidation of compacted soils are proportional to the percentage of the MDD. For instance, “95% of standard MDD” does not necessarily secure 95% of a soil’s shear strength. He used a penetration needle to find the correct soil moisture content (MC) for compaction and the saturation penetration resistance as a measure of compaction (Proctor, 1948).
Moving forward to modulus-based QA methods, work by Fleming et al. (2000), Vennapusa and White (2009), Senseney et al. (2009, 2012, and 2014), and Stamp and Mooney (2013) showed the potential of LWDs for determining the moduli of compacted soil layers. A few of these studies along with a recent NCHRP Synthesis 382 Estimating Stiffness of Subgrade and Unbound Materials for Pavement Design (Puppala, 2009) noted the need for more research to evaluate the ability of LWDs to determine the moduli of prototype test sections and to address the effects of stress dependency and layering on the moduli measurements.
The ASTM Standard Test Methods Method for Measuring Deflections with a Light Weight Deflectometer (ASTM E2583-07) and Measuring Deflections using a Portable Impulse Plate Load Test Device (ASTM E2835-11) only provide standards for measuring deflections using an LWD. They do not provide a standardized way to interpret those deflection measurements for the calculation of stiffness or modulus.
Two recently published project reports served as the main resources in the present literature review: NCHRP Project 10-84 Modulus-Based Construction Specification for Compaction of Earthwork and Unbound Aggregate (Nazarian et al, 2014) and NCHRP Synthesis 20-05/Topic 44-10 Non-Nuclear Methods for Compaction Control (Nazzal, 2014). Recently, several state DOTs including Minnesota, Indiana, and Florida have implemented modulus-based specifications using LWD. A thorough review of past investigations and case studies involving modulus based construction QA procedures along with a review of current LWD based specifications are provided in Appendix 1.
5
Chapter 2
2. EQUIPMENT EVALUATION
Available devices for in situ stiffness and moisture content measurement were evaluated for field QA implementation. The evaluation of in situ stiffness measurement devices focused on commercially available LWD systems including the Zorn ZFG 3.0 and the Dynatest 3031 LWD plus a prototype of the new LWD-01 by Olson Engineering. Factors evaluated include: load levels, load buffer system, plate diameter, technology for maximum load and load vs. time determination, technology for maximum deflection and deflection vs. time determination, number of deflection sensors, data acquisition system, precision and accuracy, ease of use, and experience of others.
Available moisture measurement techniques suitable for field use were reviewed. Factors evaluated included: suitability of the technology for field use, speed in obtaining results, data acquisition, system accuracy and precision, and ease of use.
The key outcomes of this chapter are recommendations for devices to be evaluated further in the laboratory and the field for in-situ stiffness and moisture content measurement.
2.1. LWD Working Principles
The Light-Weight Deflectometer (LWD) is a dynamic plate loading test developed for the determination of the modulus (ELWD) of soils and unbound fill materials. Figure 2-1 shows a typical LWD configuration.
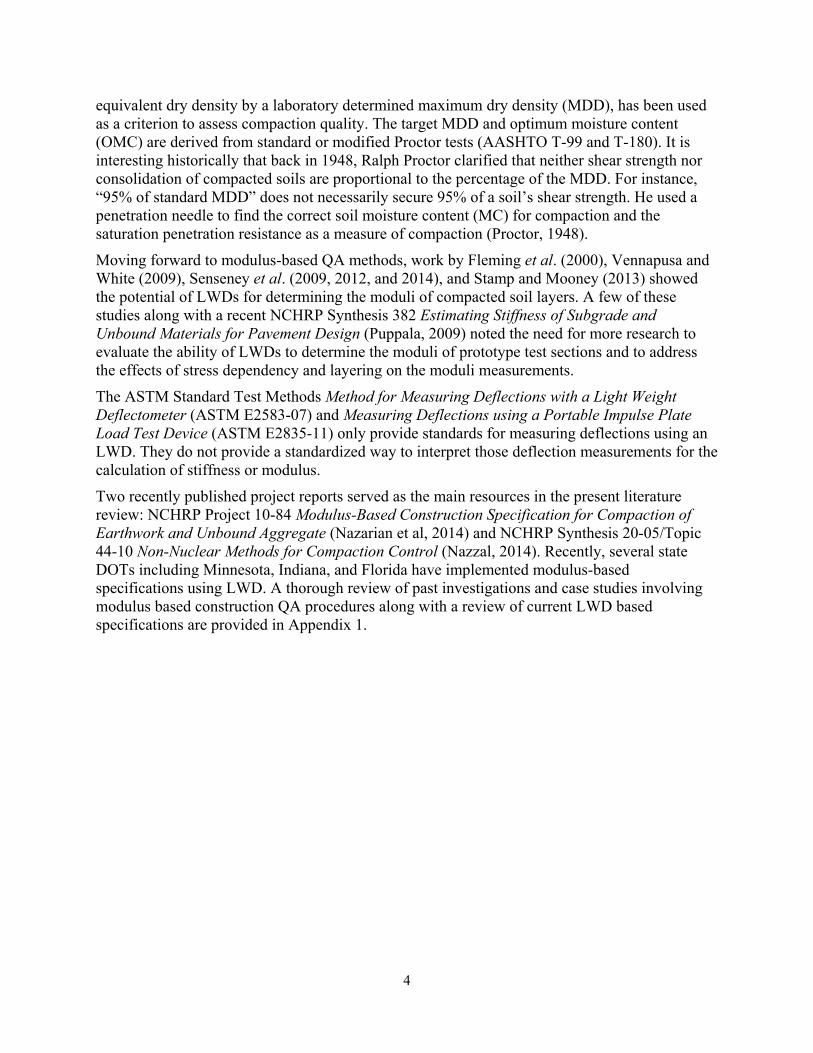
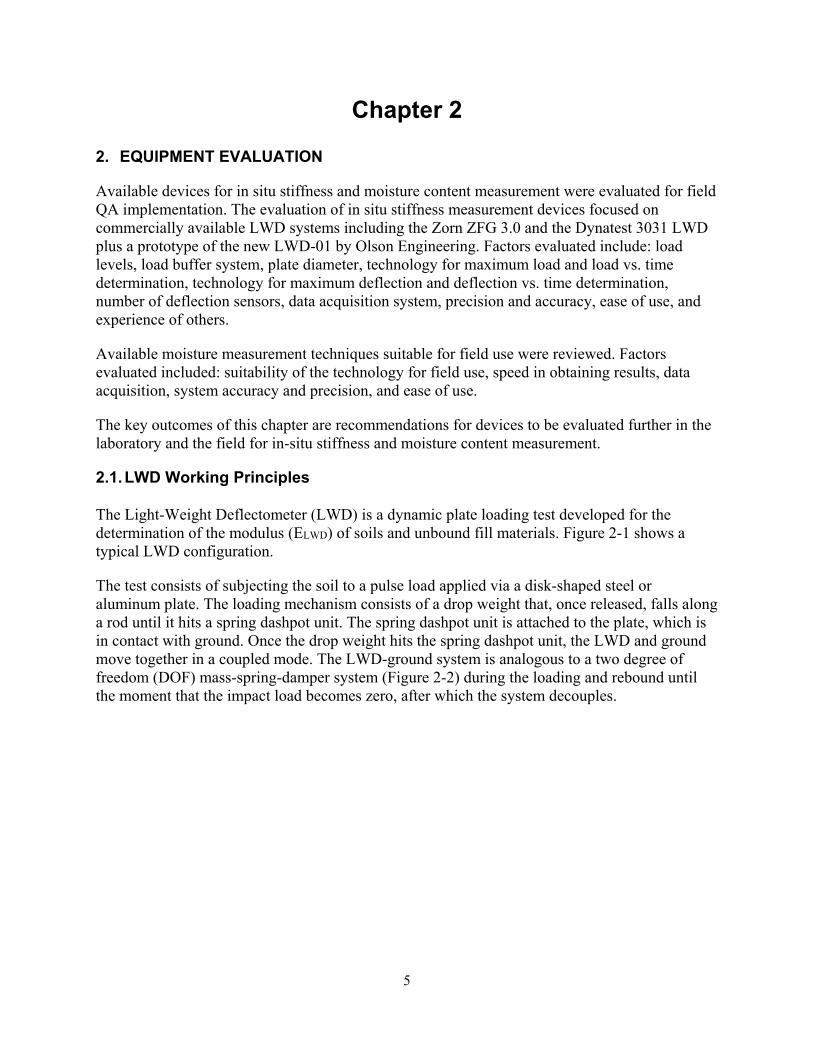
The test consists of subjecting the soil to a pulse load applied via a disk-shaped steel or aluminum plate. The loading mechanism consists of a drop weight that, once released, falls along a rod until it hits a spring dashpot unit. The spring dashpot unit is attached to the plate, which is in contact with ground. Once the drop weight hits the spring dashpot unit, the LWD and ground move together in a coupled mode. The LWD-ground system is analogous to a two degree of freedom (DOF) mass-spring-damper system (Figure 2-2) during the loading and rebound until the moment that the impact load becomes zero, after which the system decouples.
6
Figure 2-1. Diagram of LWD and its parts
Figure 2-2. Schematic of the LWD-ground movement: 2 DOF system
A velocity sensor or accelerometer records the speed or acceleration of the movements of the plate or ground depending on the position of the sensor. The position and type of the deflection sensor is different in different LWD devices. After completion of the test, the maximum displacement is calculated by means of double/single integrations of the accelerations/velocities. The load history and peak load are either assumed or measured by a load cell. Some types of LWDs also provide additional geophones to measure the surface deflection at several radial distances from the center of the load.
m1
h
ksoil
x2
kbuffer
m2
m1
x1
Plate mass
Drop mass
csoil
cbuffer
7
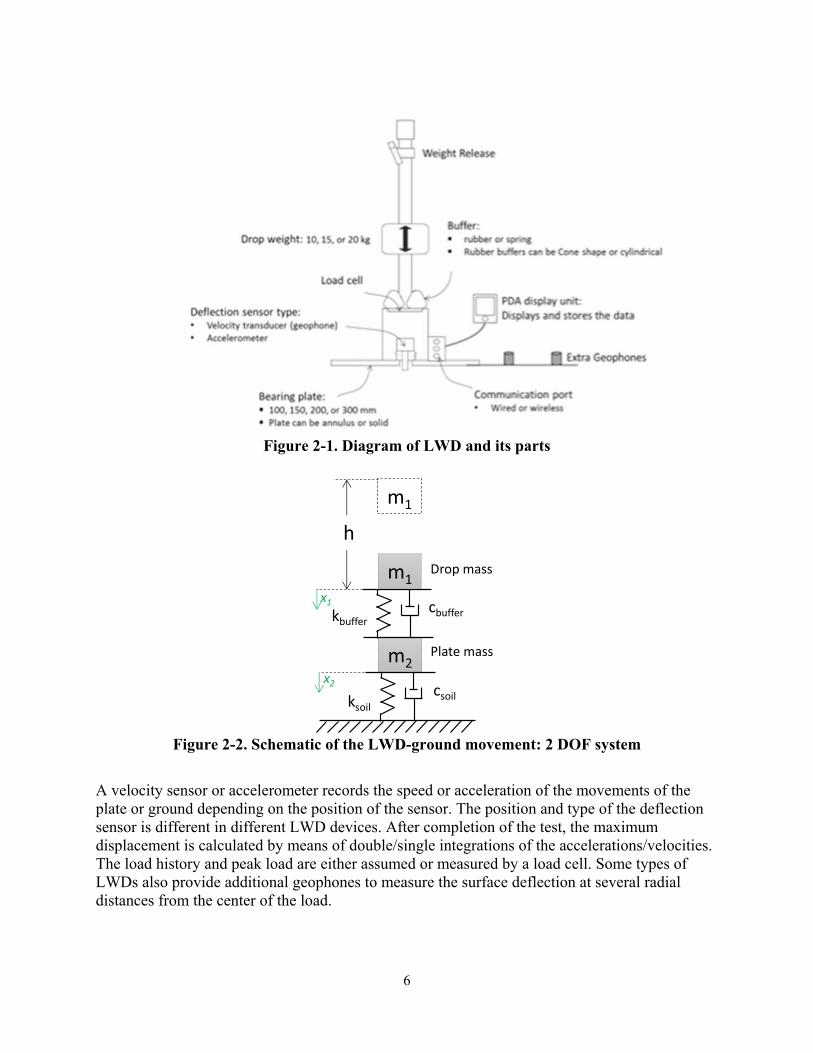
Figure 2-3 and Figure 2-4 present an example of the load and deflection time history and hysteresis, respectively. The area in the hysteresis loop represents the energy loss due to material damping in the soil.
Figure 2-3. An example of load and deflection time history (from LWDmod software-
Dynatest)
Figure 2-4. An example of load versus deflection hysteresis (from LWDmod software- Dynatest)
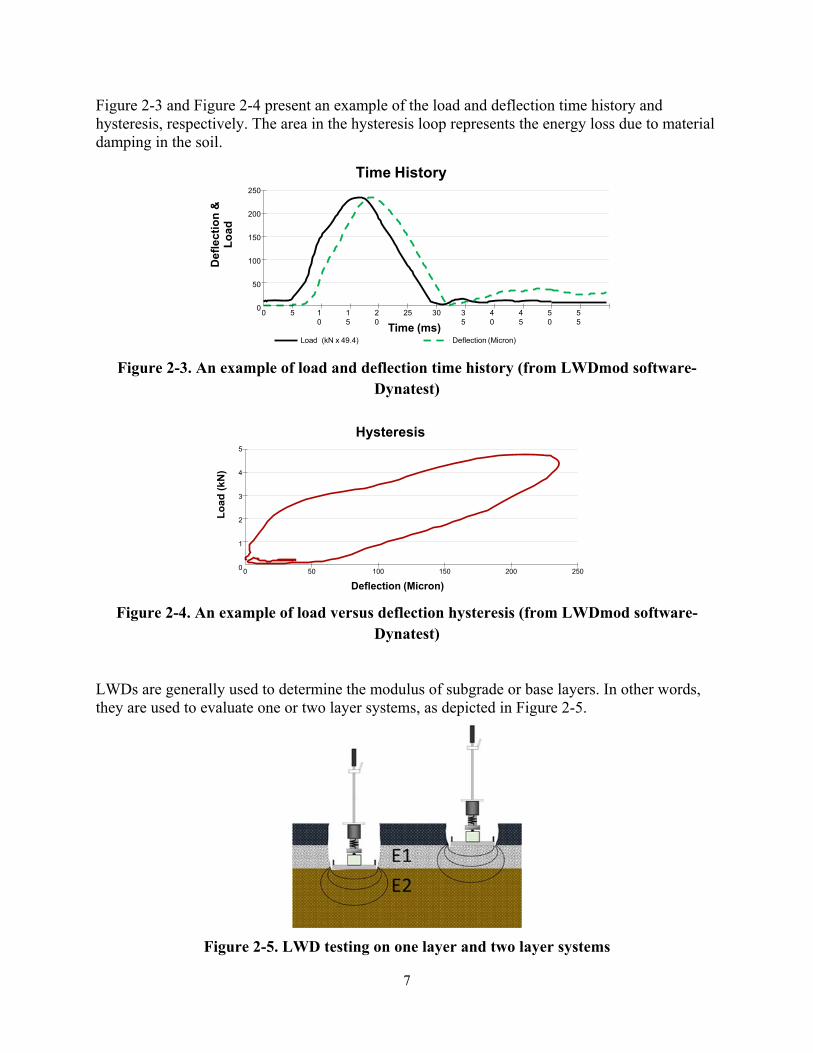
LWDs are generally used to determine the modulus of subgrade or base layers. In other words, they are used to evaluate one or two layer systems, as depicted in Figure 2-5.
Figure 2-5. LWD testing on one layer and two layer systems
Time History
Load (kN x 49.4) Deflection (Micron)
Def
lect
ion
&Lo
ad
250
200
150
100
50
00 5 10
15
20
25 30
Time (ms)35
40
45
50
55
Hysteresis
Load
(kN
)
5
4
3
2
1
00 50 100 150
Deflection (Micron)200 250
8
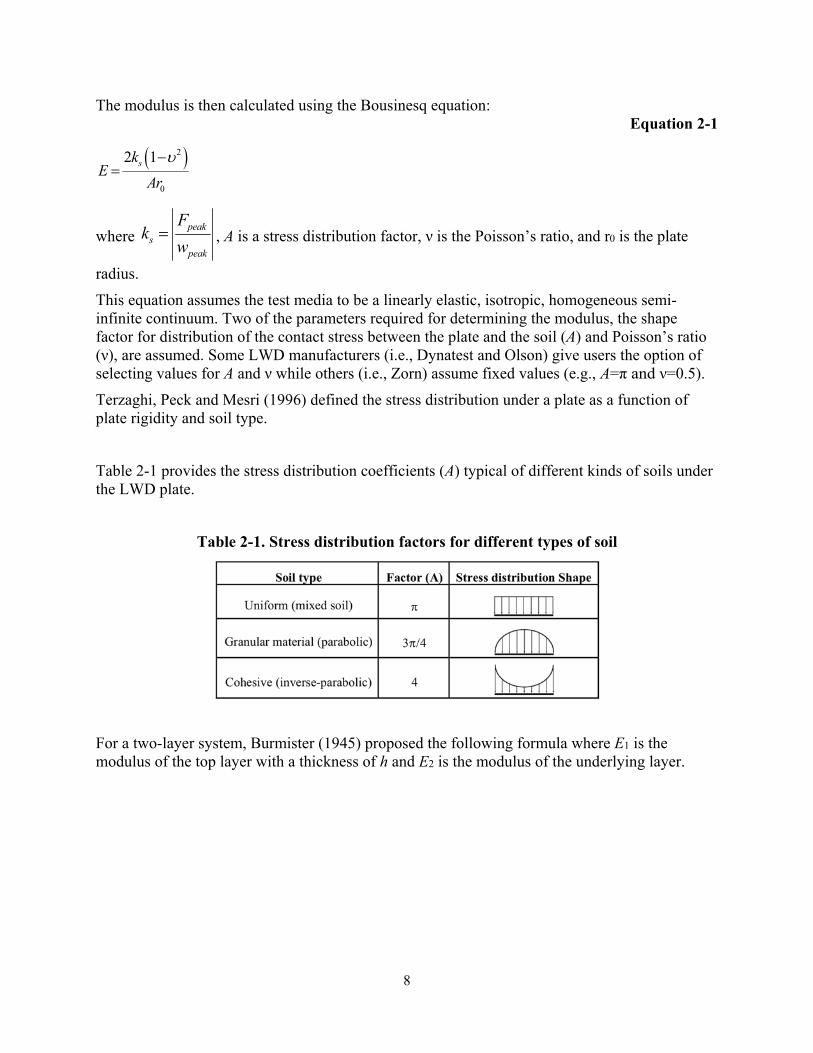
The modulus is then calculated using the Bousinesq equation: Equation 2-1
where , A is a stress distribution factor, ν is the Poisson’s ratio, and r0 is the plate
radius. This equation assumes the test media to be a linearly elastic, isotropic, homogeneous semi-infinite continuum. Two of the parameters required for determining the modulus, the shape factor for distribution of the contact stress between the plate and the soil (A) and Poisson’s ratio (ν), are assumed. Some LWD manufacturers (i.e., Dynatest and Olson) give users the option of selecting values for A and ν while others (i.e., Zorn) assume fixed values (e.g., A=π and ν=0.5).
Terzaghi, Peck and Mesri (1996) defined the stress distribution under a plate as a function of plate rigidity and soil type.
Table 2-1 provides the stress distribution coefficients (A) typical of different kinds of soils under the LWD plate.
Table 2-1. Stress distribution factors for different types of soil
For a two-layer system, Burmister (1945) proposed the following formula where E1 is the modulus of the top layer with a thickness of h and E2 is the modulus of the underlying layer.
� �2
0
2 1skE
ArX�
peaks
peak
Fk
w
9
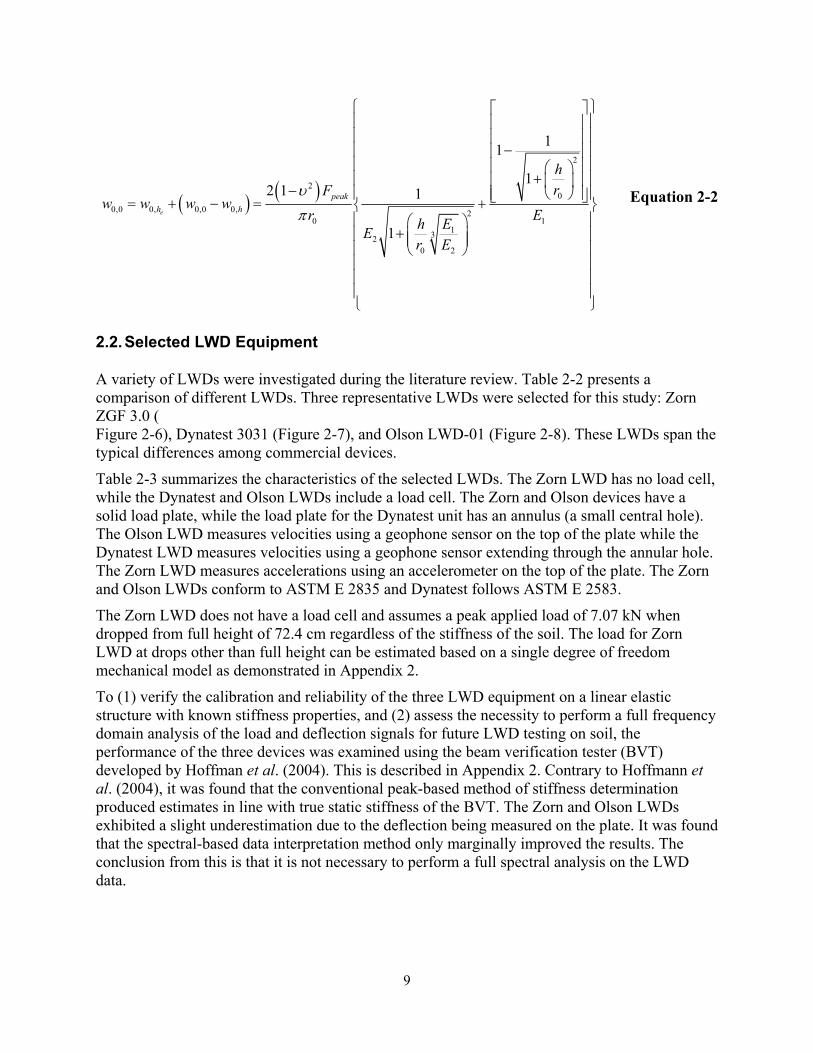
Equation 2-2
2.2. Selected LWD Equipment
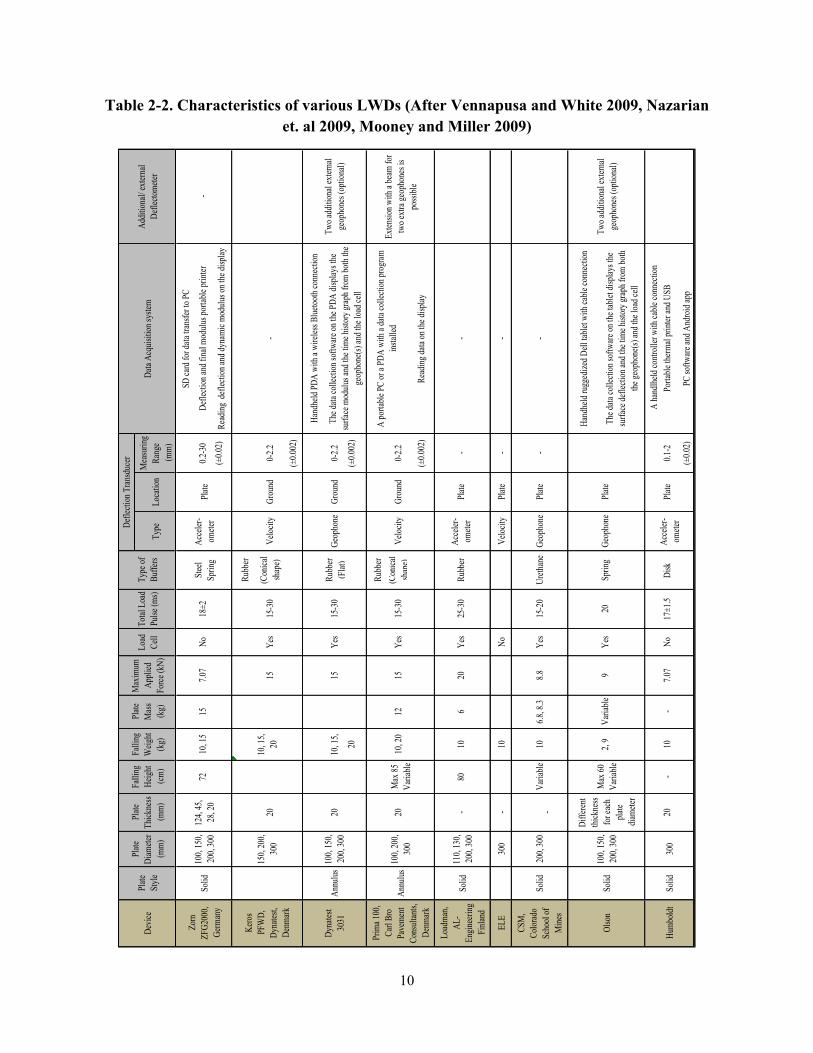
A variety of LWDs were investigated during the literature review. Table 2-2 presents a comparison of different LWDs. Three representative LWDs were selected for this study: Zorn ZGF 3.0 ( Figure 2-6), Dynatest 3031 (Figure 2-7), and Olson LWD-01 (Figure 2-8). These LWDs span the typical differences among commercial devices.
Table 2-3 summarizes the characteristics of the selected LWDs. The Zorn LWD has no load cell, while the Dynatest and Olson LWDs include a load cell. The Zorn and Olson devices have a solid load plate, while the load plate for the Dynatest unit has an annulus (a small central hole). The Olson LWD measures velocities using a geophone sensor on the top of the plate while the Dynatest LWD measures velocities using a geophone sensor extending through the annular hole. The Zorn LWD measures accelerations using an accelerometer on the top of the plate. The Zorn and Olson LWDs conform to ASTM E 2835 and Dynatest follows ASTM E 2583.
The Zorn LWD does not have a load cell and assumes a peak applied load of 7.07 kN when dropped from full height of 72.4 cm regardless of the stiffness of the soil. The load for Zorn LWD at drops other than full height can be estimated based on a single degree of freedom mechanical model as demonstrated in Appendix 2.
To (1) verify the calibration and reliability of the three LWD equipment on a linear elastic structure with known stiffness properties, and (2) assess the necessity to perform a full frequency domain analysis of the load and deflection signals for future LWD testing on soil, the performance of the three devices was examined using the beam verification tester (BVT) developed by Hoffman et al. (2004). This is described in Appendix 2. Contrary to Hoffmann et al. (2004), it was found that the conventional peak-based method of stiffness determination produced estimates in line with true static stiffness of the BVT. The Zorn and Olson LWDs exhibited a slight underestimation due to the deflection being measured on the plate. It was found that the spectral-based data interpretation method only marginally improved the results. The conclusion from this is that it is not necessary to perform a full spectral analysis on the LWD data.
� � � �2
20
0,0 0, 0,0 0, 20 1
1320 2
11
12 1 1
1e
peakh h
hrF
w w w wr EEhE
r E
X
S
½ª º° °« »° °« »
�° °« »° °« »§ ·
�° °« »¨ ¸� ° °« »© ¹¬ ¼ � � �® ¾° °§ ·
�° °¨ ¸¨ ¸° °© ¹° °° °° °¯ ¿
10
Table 2-2. Characteristics of various LWDs (After Vennapusa and White 2009, Nazarian et. al 2009, Mooney and Miller 2009)
SD ca
rd fo
r data
tran
sfer t
o PC
7210
, 15
157.0
7No
18±2
0.2-3
0De
flecti
on an
d fina
l mod
ulus p
ortab
le pr
inter
-
(±0.0
2)
Rubb
er
2015
Yes
15-3
0(C
onica
l sh
ape)
Veloc
ityGr
ound
0-2.2
-
(±0.0
02)
Hand
held
PDA
with
a wire
less B
luetoo
th co
nnec
tion
2010
, 15,
15Ye
s15
-30
Rubb
er (F
lat)
Geop
hone
Grou
nd0-
2.2
20(±
0.002
)
Rubb
er
2010
, 20
1215
Yes
15-3
0(C
onica
l sh
ape)
Veloc
ityGr
ound
0-2.2
(±0.0
02)
Read
ing da
ta on
the d
isplay
-80
106
20Ye
s25
-30
Rubb
erAc
celer
- om
eter
Plate
--
ELE
300
-10
NoVe
locity
Plate
--
-
Hand
held
rugg
edize
d Dell
table
t with
cable
conn
ectio
n
2, 9
Varia
ble9
Yes
20Sp
ring
Geop
hone
Plate
A ha
ndlhe
ld co
ntroll
er wi
th ca
ble co
nnec
tion
20-
10-
7.07
No17
±1.5
Disk
Pl
ate0.1
-2Po
rtable
therm
al pr
inter
and U
SB
(±0.0
2)PC
softw
are an
d And
roid
app
Acce
ler-
omete
r
Two a
dditi
onal
exter
nal
geop
hone
s (op
tiona
l)
Exten
sion w
ith a
beam
for
two e
xtra g
eoph
ones
is
possi
ble
Diffe
rent
thick
ness
for e
ach
plate
diame
ter
Max
60
Varia
bleTh
e data
colle
ction
softw
are on
the t
ablet
disp
lays t
he
surfa
ce de
flecti
on an
d the
time
histo
ry gr
aph f
rom
both
the ge
opho
ne(s)
and t
he lo
ad ce
ll
The d
ata co
llecti
on so
ftware
on th
e PDA
disp
lays t
he
surfa
ce m
odulu
s and
the t
ime h
istor
y grap
h fro
m bo
th the
ge
opho
ne(s)
and t
he lo
ad ce
ll
--
8.8
Read
ing d
eflec
tion a
nd dy
nami
c mod
ulus o
n the
disp
lay
Stee
l Sp
ring
Acce
ler-
omete
rPl
ate
A po
rtable
PC
or a
PDA
with
a data
colle
ction
prog
ram
instal
led
Ureth
ane
Yes
Geop
hone
Plate
15-2
0
124,
45,
28, 2
0
6.8, 8
.310
Varia
ble
10, 1
5, 20
Max
85
Varia
ble
Solid
Solid
Solid
Solid
300
110,
130,
200,
300
200,
300
100,
150,
200,
300
Olso
n
Humb
oldt
Two a
dditi
onal
exter
nal
geop
hone
s (op
tiona
l)
CSM
, Co
lorad
o Sc
hool
of
Mine
s
Load
man,
AL-
Engin
eerin
g Fi
nland
Data
Acqu
isitio
n sys
temAd
dition
al/ ex
terna
l De
flecto
meter
Falli
ng
Heigh
t (cm
)Lo
catio
nM
easu
ring
Rang
e (m
m)
Zorn
ZF
G200
0, Ge
rman
y
Kero
s PF
WD,
Dy
nates
t, De
nmark
Dyna
test
3031
Prim
a 100
, Ca
rl Br
o Pa
veme
nt Co
nsult
ants,
De
nmark
Plate
Th
ickne
ss (m
m)
Falli
ng
Weig
ht (k
g)
Max
imum
Ap
plied
Fo
rce (k
N)De
vice
Plate
Di
amete
r (m
m)
Plate
M
ass
(kg)
Plate
St
yle
Solid
Annu
lus
Annu
lus
100,
150,
200,
300
150,
200,
300
100,
150,
200,
300
100,
200,
300
Load
Ce
llTy
pe of
Bu
ffers
Type
Total
Loa
d Pu
lse (m
s)
Defle
ction
Tran
sduc
er
11
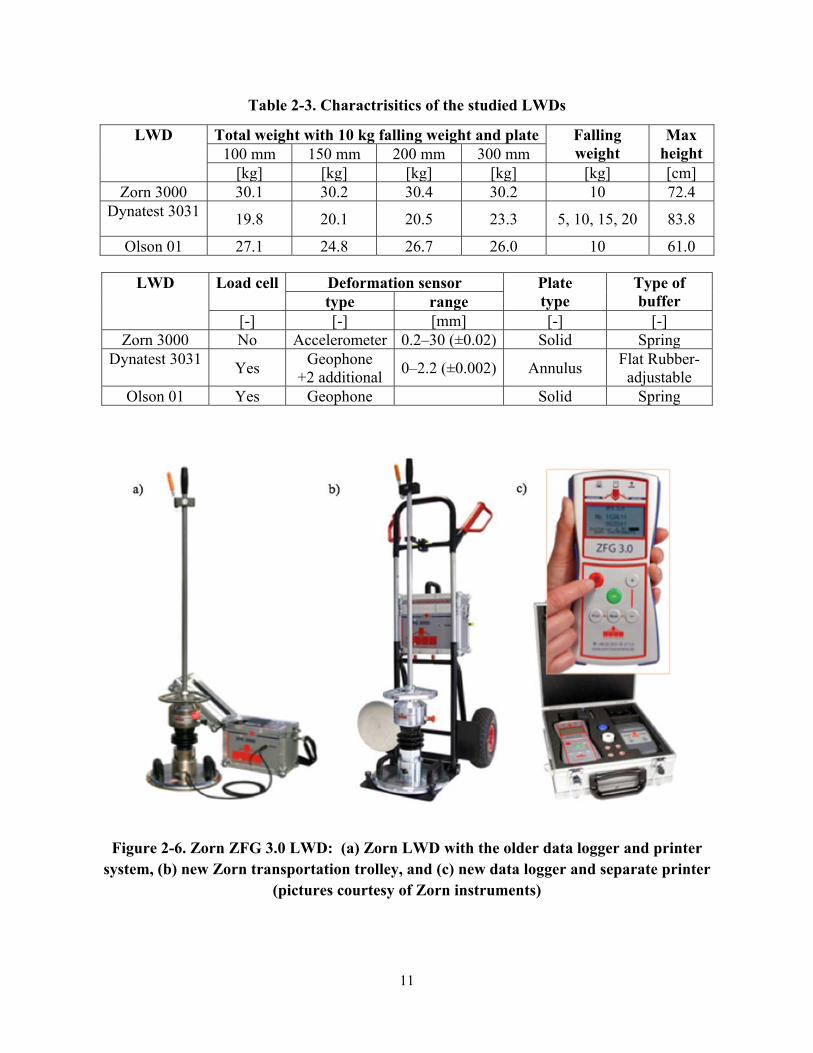
Table 2-3. Charactrisitics of the studied LWDs
LWD Total weight with 10 kg falling weight and plate Falling weight
Max height 100 mm 150 mm 200 mm 300 mm
[kg] [kg] [kg] [kg] [kg] [cm]Zorn 3000 30.1 30.2 30.4 30.2 10 72.4
Dynatest 3031 19.8 20.1 20.5 23.3 5, 10, 15, 20 83.8
Olson 01 27.1 24.8 26.7 26.0 10 61.0
LWD Load cell Deformation sensor Plate type
Type of buffer type range
[-] [-] [mm] [-] [-]Zorn 3000 No Accelerometer 0.2–30 (±0.02) Solid Spring
Dynatest 3031 Yes Geophone +2 additional 0–2.2 (±0.002) Annulus Flat Rubber-
adjustableOlson 01 Yes Geophone Solid Spring
Figure 2-6. Zorn ZFG 3.0 LWD: (a) Zorn LWD with the older data logger and printer
system, (b) new Zorn transportation trolley, and (c) new data logger and separate printer (pictures courtesy of Zorn instruments)
12
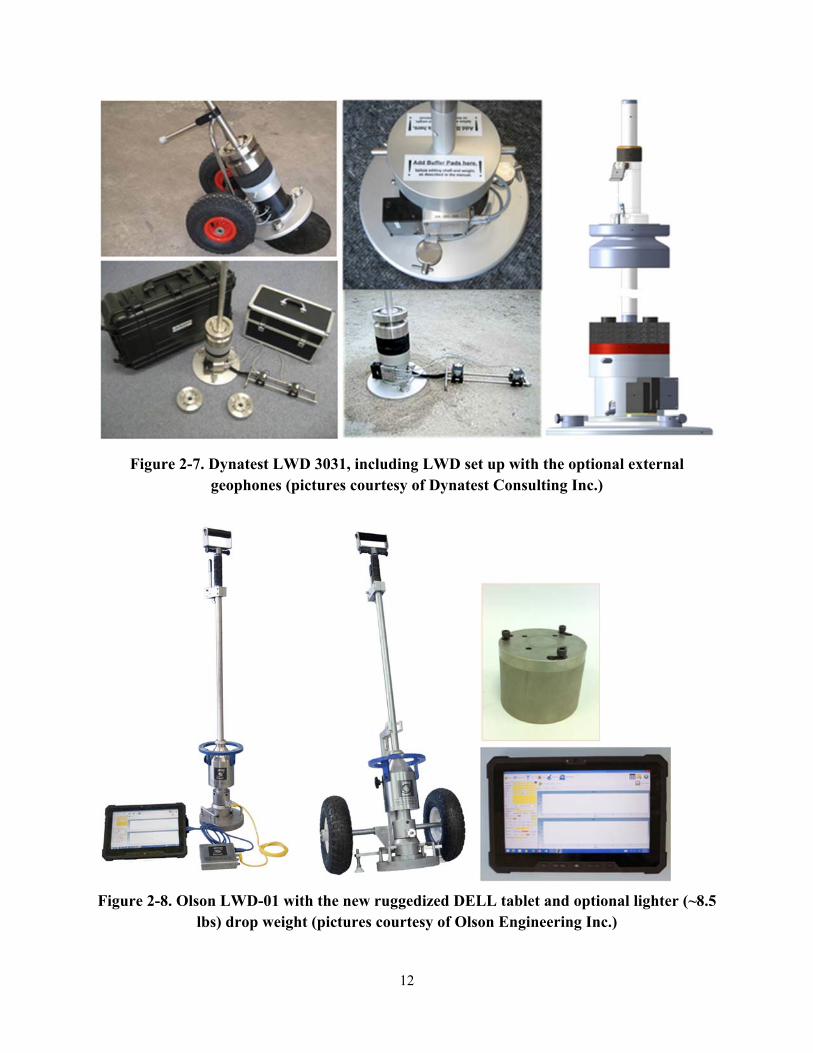
Figure 2-7. Dynatest LWD 3031, including LWD set up with the optional external geophones (pictures courtesy of Dynatest Consulting Inc.)
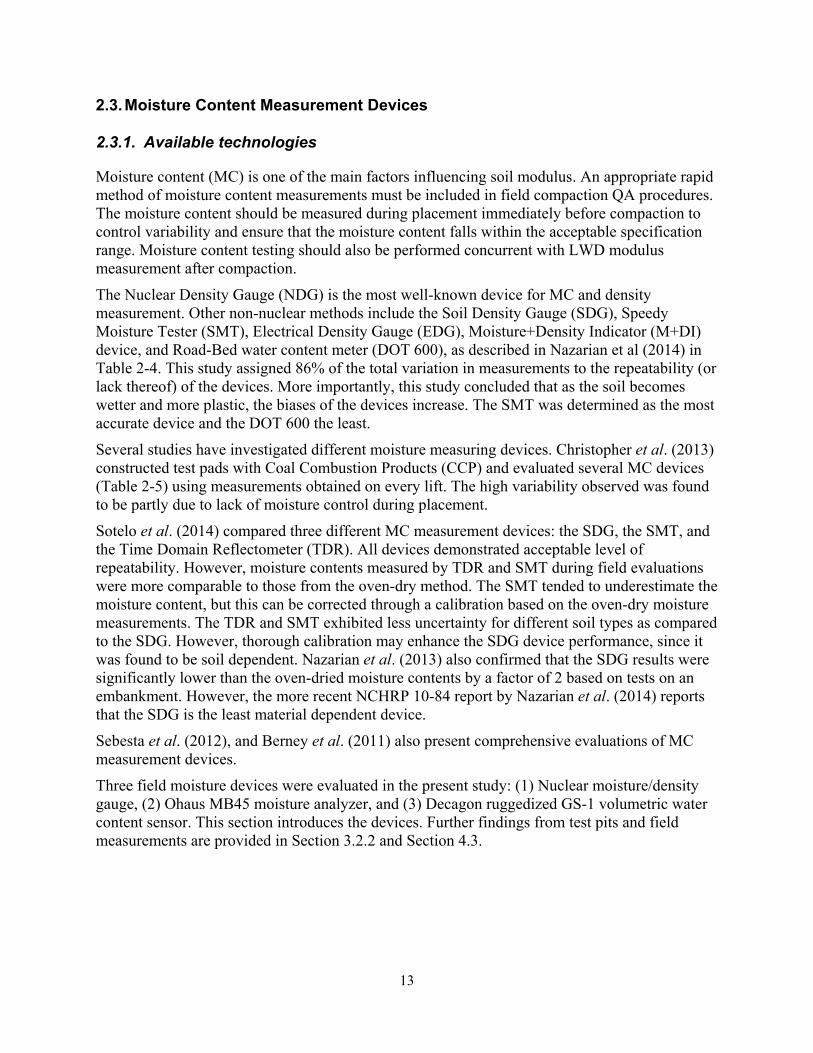
Figure 2-8. Olson LWD-01 with the new ruggedized DELL tablet and optional lighter (~8.5
lbs) drop weight (pictures courtesy of Olson Engineering Inc.)
13
2.3. Moisture Content Measurement Devices
2.3.1. Available technologies
Moisture content (MC) is one of the main factors influencing soil modulus. An appropriate rapid method of moisture content measurements must be included in field compaction QA procedures. The moisture content should be measured during placement immediately before compaction to control variability and ensure that the moisture content falls within the acceptable specification range. Moisture content testing should also be performed concurrent with LWD modulus measurement after compaction.
The Nuclear Density Gauge (NDG) is the most well-known device for MC and density measurement. Other non-nuclear methods include the Soil Density Gauge (SDG), Speedy Moisture Tester (SMT), Electrical Density Gauge (EDG), Moisture+Density Indicator (M+DI) device, and Road-Bed water content meter (DOT 600), as described in Nazarian et al (2014) in Table 2-4. This study assigned 86% of the total variation in measurements to the repeatability (or lack thereof) of the devices. More importantly, this study concluded that as the soil becomes wetter and more plastic, the biases of the devices increase. The SMT was determined as the most accurate device and the DOT 600 the least.
Several studies have investigated different moisture measuring devices. Christopher et al. (2013) constructed test pads with Coal Combustion Products (CCP) and evaluated several MC devices (Table 2-5) using measurements obtained on every lift. The high variability observed was found to be partly due to lack of moisture control during placement.
Sotelo et al. (2014) compared three different MC measurement devices: the SDG, the SMT, and the Time Domain Reflectometer (TDR). All devices demonstrated acceptable level of repeatability. However, moisture contents measured by TDR and SMT during field evaluations were more comparable to those from the oven-dry method. The SMT tended to underestimate the moisture content, but this can be corrected through a calibration based on the oven-dry moisture measurements. The TDR and SMT exhibited less uncertainty for different soil types as compared to the SDG. However, thorough calibration may enhance the SDG device performance, since it was found to be soil dependent. Nazarian et al. (2013) also confirmed that the SDG results were significantly lower than the oven-dried moisture contents by a factor of 2 based on tests on an embankment. However, the more recent NCHRP 10-84 report by Nazarian et al. (2014) reports that the SDG is the least material dependent device.
Sebesta et al. (2012), and Berney et al. (2011) also present comprehensive evaluations of MC measurement devices.
Three field moisture devices were evaluated in the present study: (1) Nuclear moisture/density gauge, (2) Ohaus MB45 moisture analyzer, and (3) Decagon ruggedized GS-1 volumetric water content sensor. This section introduces the devices. Further findings from test pits and field measurements are provided in Section 3.2.2 and Section 4.3.
14
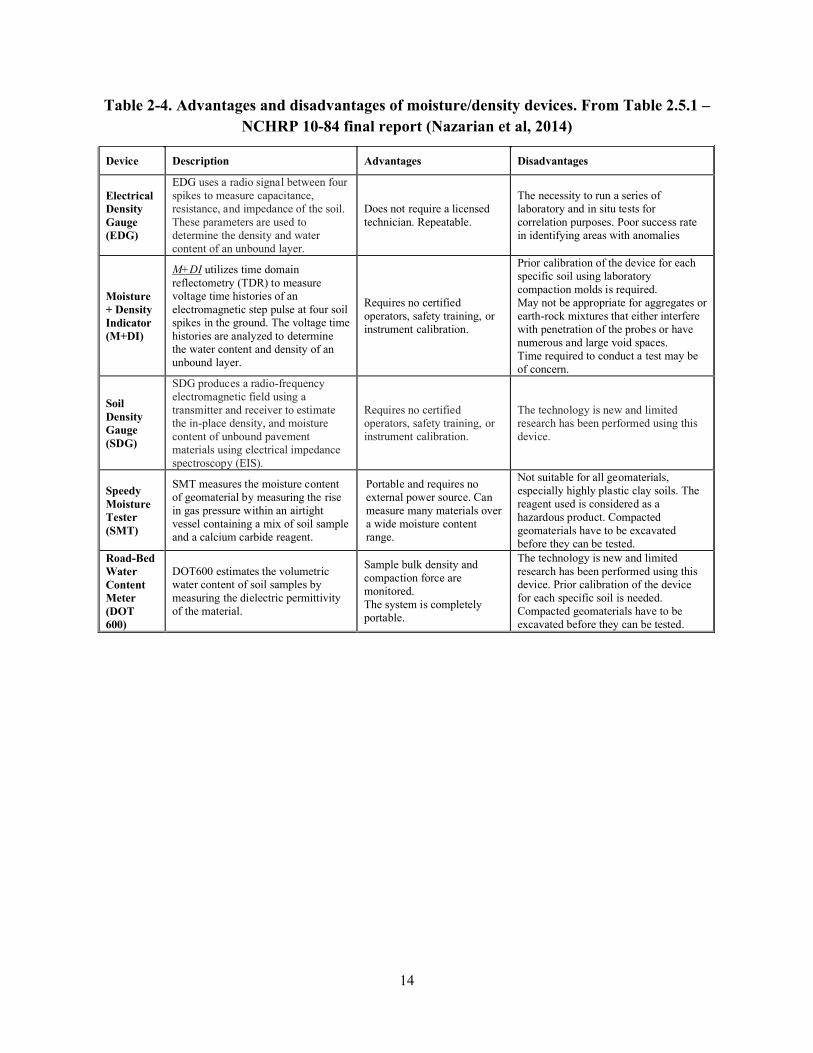
Table 2-4. Advantages and disadvantages of moisture/density devices. From Table 2.5.1 – NCHRP 10-84 final report (Nazarian et al, 2014)
Device Description Advantages Disadvantages
Electrical Density Gauge (EDG)
EDG uses a radio signal between four spikes to measure capacitance, resistance, and impedance of the soil. These parameters are used to determine the density and water content of an unbound layer.
Does not require a licensed technician. Repeatable.
The necessity to run a series of laboratory and in situ tests for correlation purposes. Poor success rate in identifying areas with anomalies
Moisture + Density Indicator (M+DI)
M+DI utilizes time domain reflectometry (TDR) to measure voltage time histories of an electromagnetic step pulse at four soil spikes in the ground. The voltage time histories are analyzed to determine the water content and density of an unbound layer.
Requires no certified operators, safety training, or instrument calibration.
Prior calibration of the device for each specific soil using laboratory compaction molds is required. May not be appropriate for aggregates or earth-rock mixtures that either interfere with penetration of the probes or have numerous and large void spaces. Time required to conduct a test may be of concern.
Soil Density Gauge (SDG)
SDG produces a radio-frequency electromagnetic field using a transmitter and receiver to estimate the in-place density, and moisture content of unbound pavement materials using electrical impedance spectroscopy (EIS).
Requires no certified operators, safety training, or instrument calibration.
The technology is new and limited research has been performed using this device.
Speedy Moisture Tester (SMT)
SMT measures the moisture content of geomaterial by measuring the rise in gas pressure within an airtight vessel containing a mix of soil sample and a calcium carbide reagent.
Portable and requires no external power source. Can measure many materials over a wide moisture content range.
Not suitable for all geomaterials, especially highly plastic clay soils. The reagent used is considered as a hazardous product. Compacted geomaterials have to be excavated before they can be tested.
Road-Bed Water Content Meter (DOT 600)
DOT600 estimates the volumetric water content of soil samples by measuring the dielectric permittivity of the material.
Sample bulk density and compaction force are monitored. The system is completely portable.
The technology is new and limited research has been performed using this device. Prior calibration of the device for each specific soil is needed. Compacted geomaterials have to be excavated before they can be tested.
15
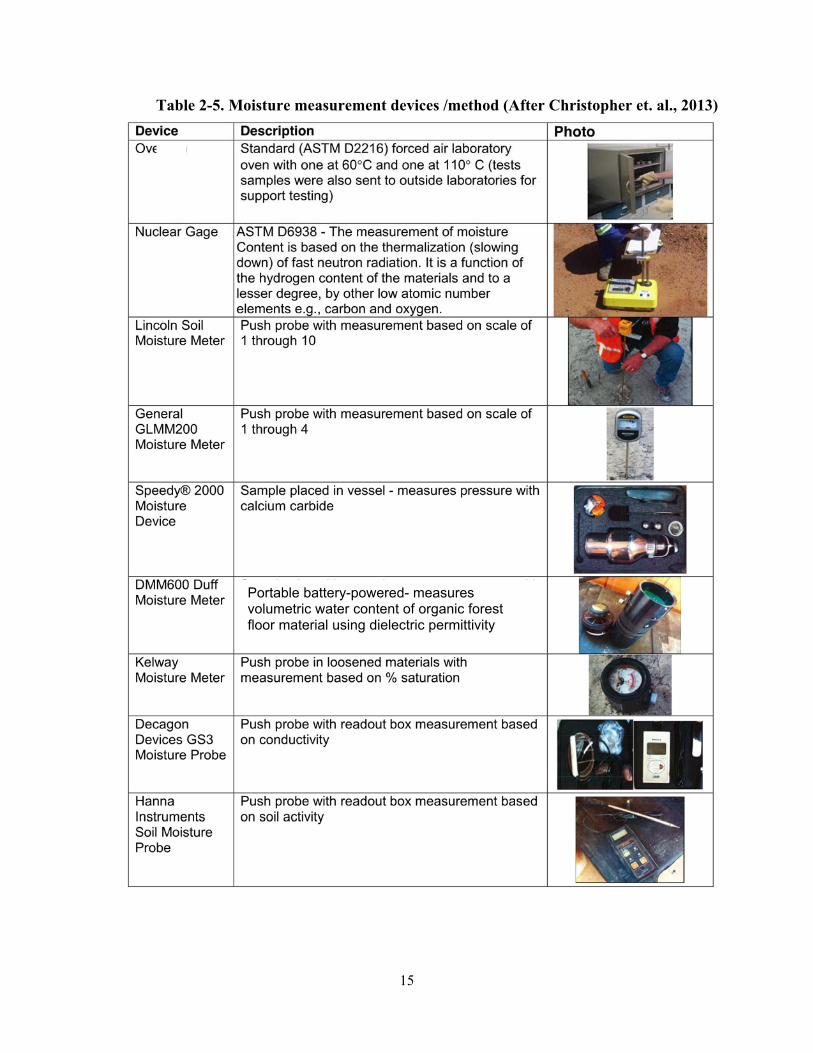
Table 2-5. Moisture measurement devices /method (After Christopher et. al., 2013)
Portable battery-powered- measures volumetric water content of organic forest floor material using dielectric permittivity
16
2.3.2. Ohaus MB45 moisture analyzer
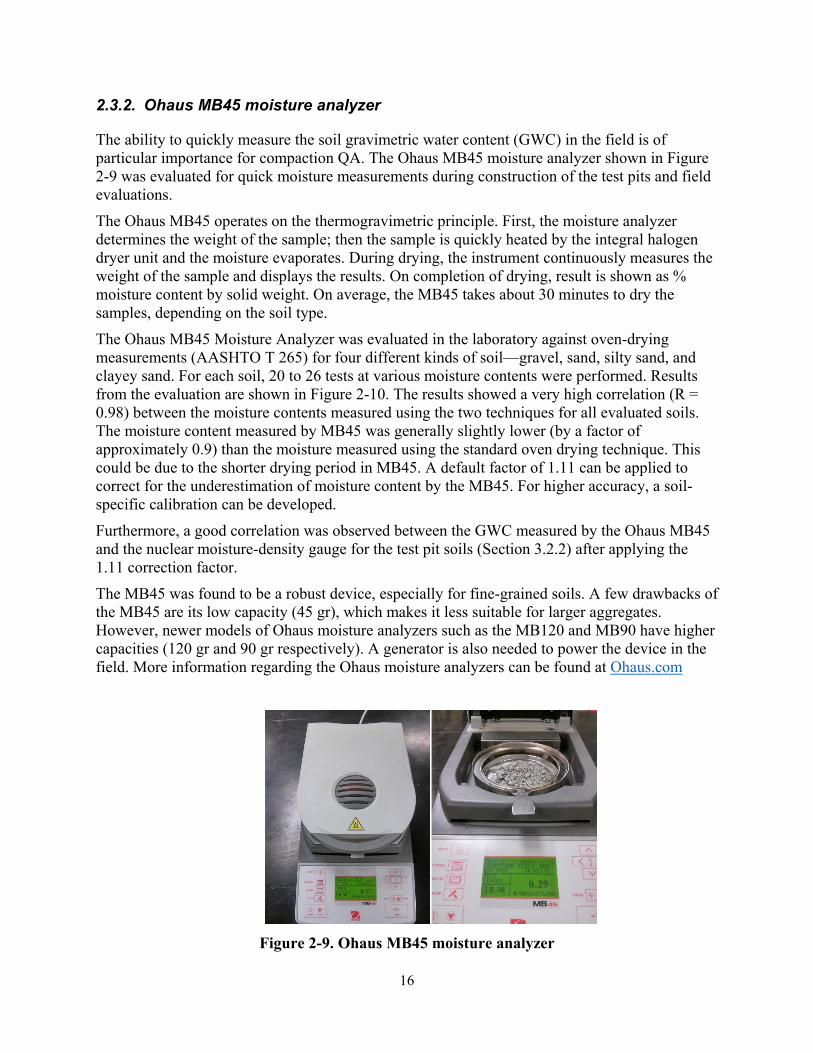
The ability to quickly measure the soil gravimetric water content (GWC) in the field is of particular importance for compaction QA. The Ohaus MB45 moisture analyzer shown in Figure 2-9 was evaluated for quick moisture measurements during construction of the test pits and field evaluations.
The Ohaus MB45 operates on the thermogravimetric principle. First, the moisture analyzer determines the weight of the sample; then the sample is quickly heated by the integral halogen dryer unit and the moisture evaporates. During drying, the instrument continuously measures the weight of the sample and displays the results. On completion of drying, result is shown as % moisture content by solid weight. On average, the MB45 takes about 30 minutes to dry the samples, depending on the soil type.
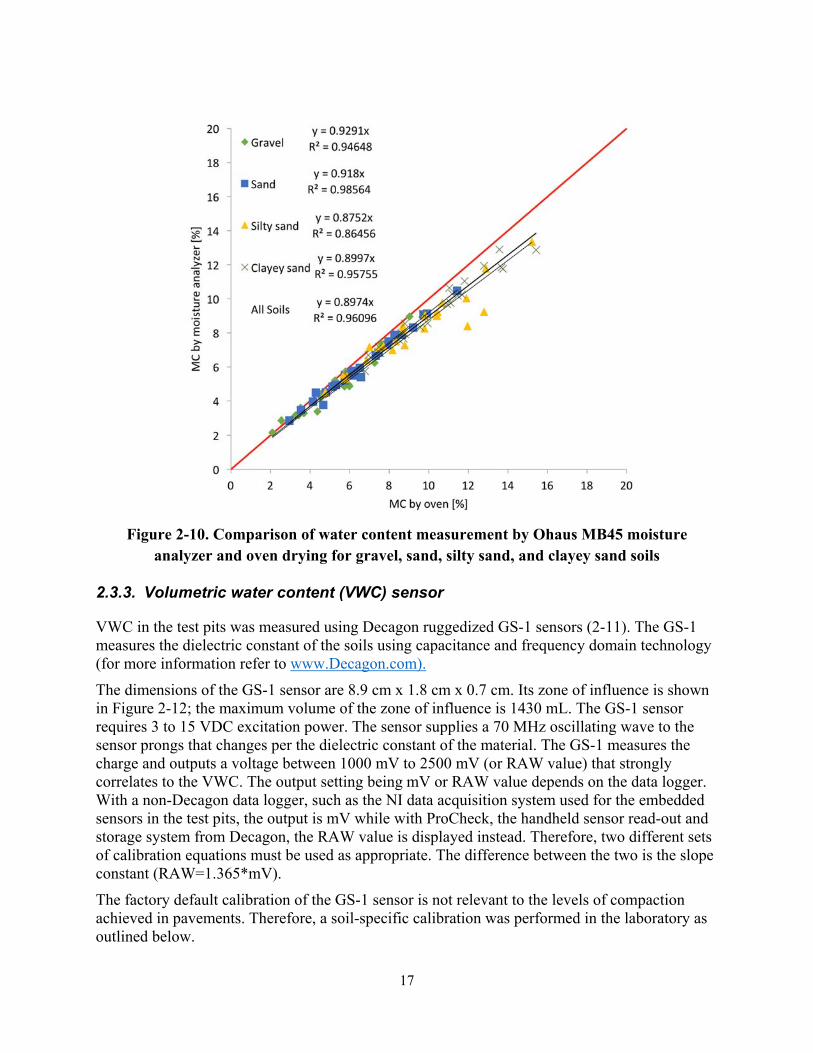
The Ohaus MB45 Moisture Analyzer was evaluated in the laboratory against oven-drying measurements (AASHTO T 265) for four different kinds of soil—gravel, sand, silty sand, and clayey sand. For each soil, 20 to 26 tests at various moisture contents were performed. Results from the evaluation are shown in Figure 2-10. The results showed a very high correlation (R = 0.98) between the moisture contents measured using the two techniques for all evaluated soils. The moisture content measured by MB45 was generally slightly lower (by a factor of approximately 0.9) than the moisture measured using the standard oven drying technique. This could be due to the shorter drying period in MB45. A default factor of 1.11 can be applied to correct for the underestimation of moisture content by the MB45. For higher accuracy, a soil-specific calibration can be developed.
Furthermore, a good correlation was observed between the GWC measured by the Ohaus MB45 and the nuclear moisture-density gauge for the test pit soils (Section 3.2.2) after applying the 1.11 correction factor.
The MB45 was found to be a robust device, especially for fine-grained soils. A few drawbacks of the MB45 are its low capacity (45 gr), which makes it less suitable for larger aggregates. However, newer models of Ohaus moisture analyzers such as the MB120 and MB90 have higher capacities (120 gr and 90 gr respectively). A generator is also needed to power the device in the field. More information regarding the Ohaus moisture analyzers can be found at Ohaus.com
Figure 2-9. Ohaus MB45 moisture analyzer
17
Figure 2-10. Comparison of water content measurement by Ohaus MB45 moisture analyzer and oven drying for gravel, sand, silty sand, and clayey sand soils
2.3.3. Volumetric water content (VWC) sensor
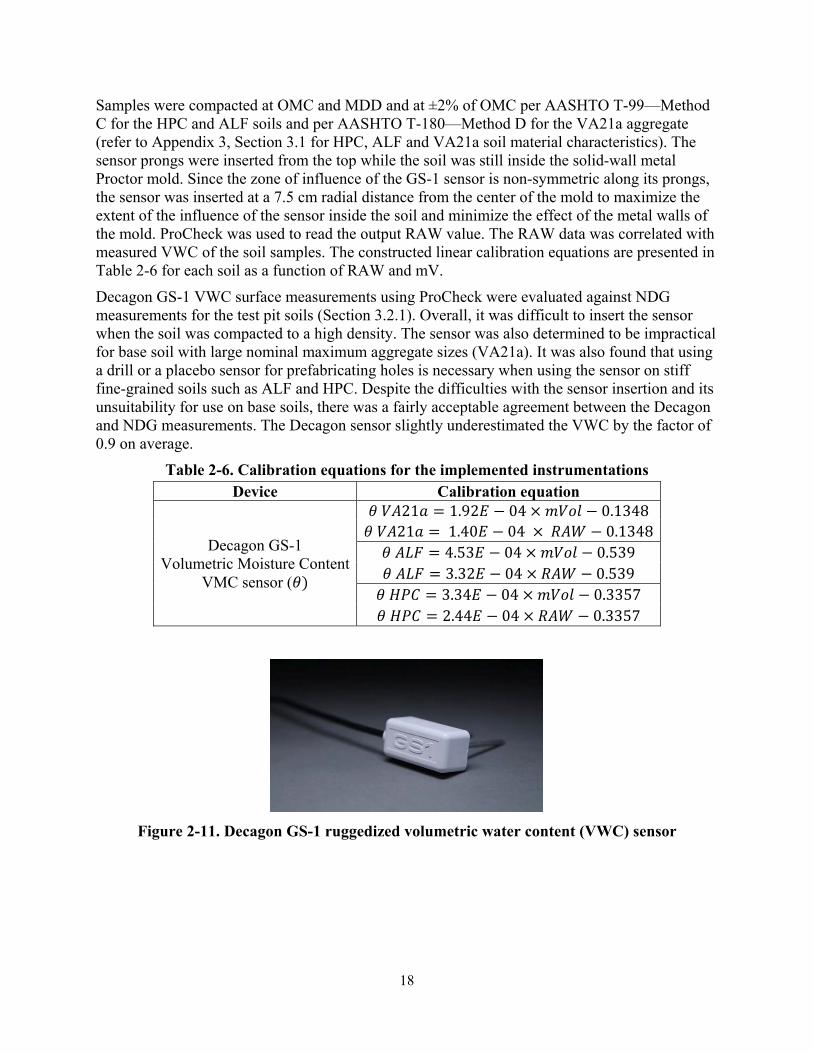
VWC in the test pits was measured using Decagon ruggedized GS-1 sensors (2-11). The GS-1 measures the dielectric constant of the soils using capacitance and frequency domain technology (for more information refer to www.Decagon.com).
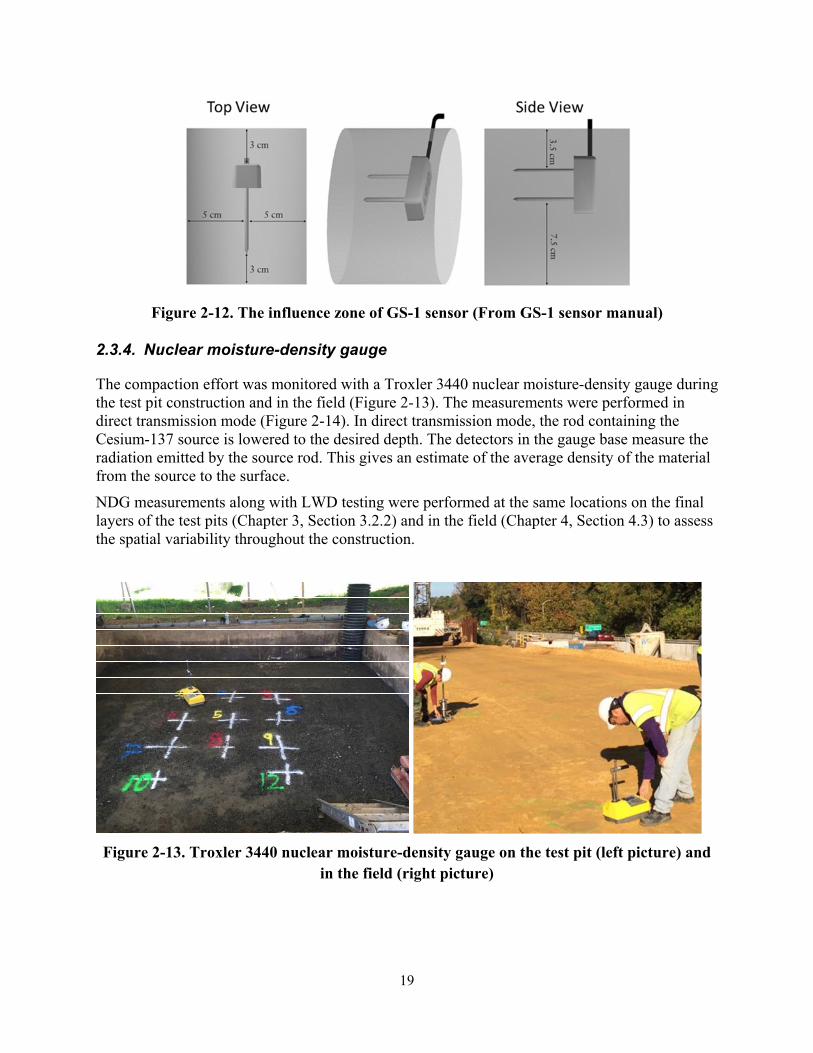
The dimensions of the GS-1 sensor are 8.9 cm x 1.8 cm x 0.7 cm. Its zone of influence is shown in Figure 2-12; the maximum volume of the zone of influence is 1430 mL. The GS-1 sensor requires 3 to 15 VDC excitation power. The sensor supplies a 70 MHz oscillating wave to the sensor prongs that changes per the dielectric constant of the material. The GS-1 measures the charge and outputs a voltage between 1000 mV to 2500 mV (or RAW value) that strongly correlates to the VWC. The output setting being mV or RAW value depends on the data logger. With a non-Decagon data logger, such as the NI data acquisition system used for the embedded sensors in the test pits, the output is mV while with ProCheck, the handheld sensor read-out and storage system from Decagon, the RAW value is displayed instead. Therefore, two different sets of calibration equations must be used as appropriate. The difference between the two is the slope constant (RAW=1.365*mV).
The factory default calibration of the GS-1 sensor is not relevant to the levels of compaction achieved in pavements. Therefore, a soil-specific calibration was performed in the laboratory as outlined below.
18
Samples were compacted at OMC and MDD and at ±2% of OMC per AASHTO T-99—Method C for the HPC and ALF soils and per AASHTO T-180—Method D for the VA21a aggregate (refer to Appendix 3, Section 3.1 for HPC, ALF and VA21a soil material characteristics). The sensor prongs were inserted from the top while the soil was still inside the solid-wall metal Proctor mold. Since the zone of influence of the GS-1 sensor is non-symmetric along its prongs, the sensor was inserted at a 7.5 cm radial distance from the center of the mold to maximize the extent of the influence of the sensor inside the soil and minimize the effect of the metal walls of the mold. ProCheck was used to read the output RAW value. The RAW data was correlated with measured VWC of the soil samples. The constructed linear calibration equations are presented in Table 2-6 for each soil as a function of RAW and mV.
Decagon GS-1 VWC surface measurements using ProCheck were evaluated against NDG measurements for the test pit soils (Section 3.2.1). Overall, it was difficult to insert the sensor when the soil was compacted to a high density. The sensor was also determined to be impractical for base soil with large nominal maximum aggregate sizes (VA21a). It was also found that using a drill or a placebo sensor for prefabricating holes is necessary when using the sensor on stiff fine-grained soils such as ALF and HPC. Despite the difficulties with the sensor insertion and its unsuitability for use on base soils, there was a fairly acceptable agreement between the Decagon and NDG measurements. The Decagon sensor slightly underestimated the VWC by the factor of 0.9 on average.
Table 2-6. Calibration equations for the implemented instrumentations Device Calibration equation
Decagon GS-1 Volumetric Moisture Content
VMC sensor (
21 1.92 04 0.1348 21 1.40 04 0.1348
4.53 04 0.539 3.32 04 0.539 3.34 04 0.3357 2.44 04 0.3357
Figure 2-11. Decagon GS-1 ruggedized volumetric water content (VWC) sensor
19
Figure 2-12. The influence zone of GS-1 sensor (From GS-1 sensor manual)
2.3.4. Nuclear moisture-density gauge
The compaction effort was monitored with a Troxler 3440 nuclear moisture-density gauge during the test pit construction and in the field (Figure 2-13). The measurements were performed in direct transmission mode (Figure 2-14). In direct transmission mode, the rod containing the Cesium-137 source is lowered to the desired depth. The detectors in the gauge base measure the radiation emitted by the source rod. This gives an estimate of the average density of the material from the source to the surface.
NDG measurements along with LWD testing were performed at the same locations on the final layers of the test pits (Chapter 3, Section 3.2.2) and in the field (Chapter 4, Section 4.3) to assess the spatial variability throughout the construction.
Figure 2-13. Troxler 3440 nuclear moisture-density gauge on the test pit (left picture) and
in the field (right picture)
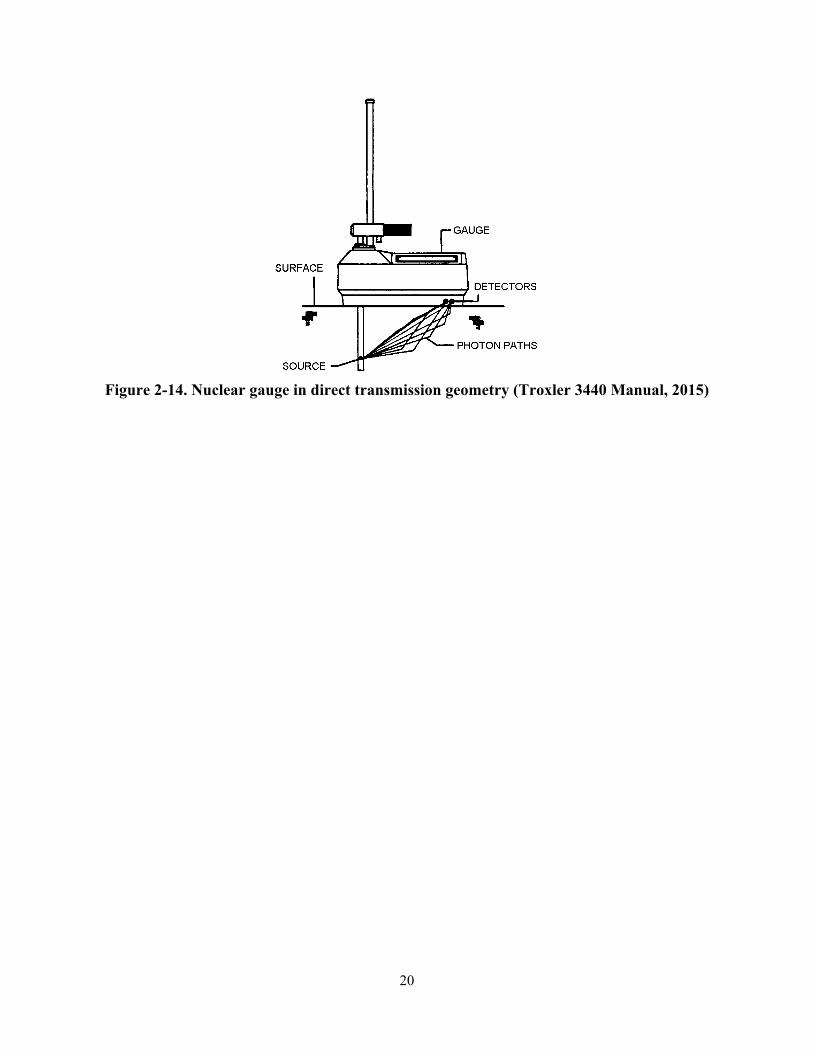
20
Figure 2-14. Nuclear gauge in direct transmission geometry (Troxler 3440 Manual, 2015)
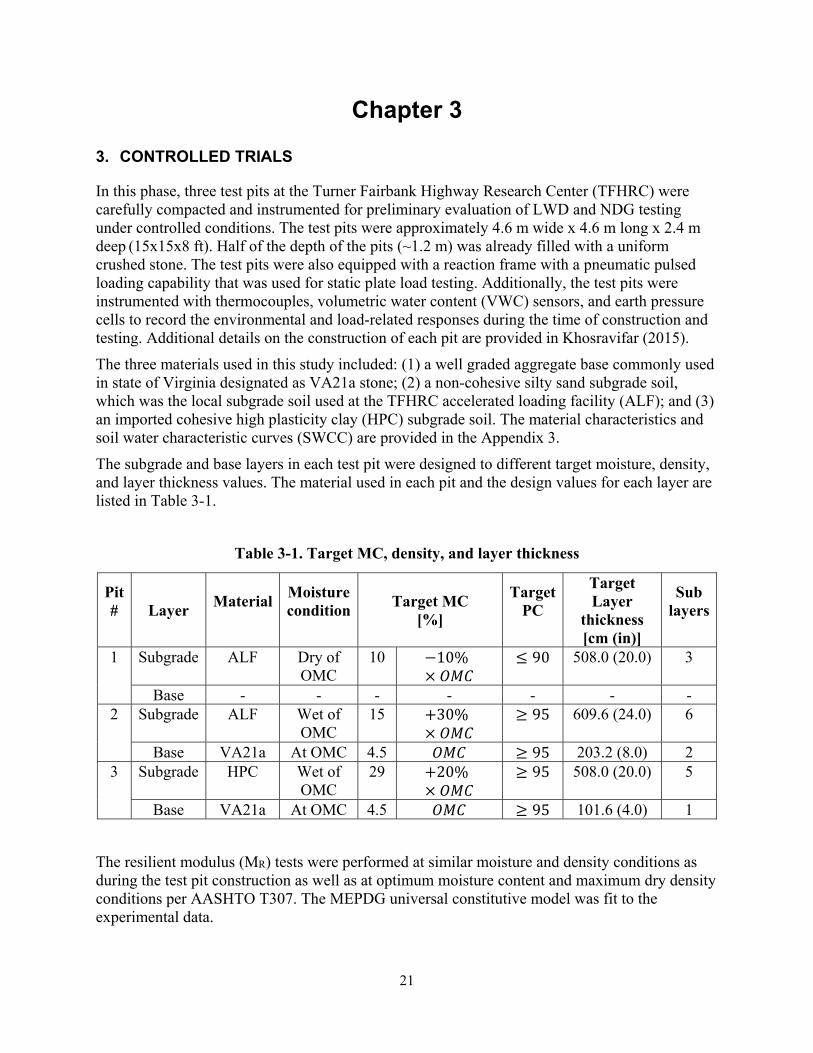
21
Chapter 3
3. CONTROLLED TRIALS
In this phase, three test pits at the Turner Fairbank Highway Research Center (TFHRC) were carefully compacted and instrumented for preliminary evaluation of LWD and NDG testing under controlled conditions. The test pits were approximately 4.6 m wide x 4.6 m long x 2.4 m deep (15x15x8 ft). Half of the depth of the pits (~1.2 m) was already filled with a uniform crushed stone. The test pits were also equipped with a reaction frame with a pneumatic pulsed loading capability that was used for static plate load testing. Additionally, the test pits were instrumented with thermocouples, volumetric water content (VWC) sensors, and earth pressure cells to record the environmental and load-related responses during the time of construction and testing. Additional details on the construction of each pit are provided in Khosravifar (2015).
The three materials used in this study included: (1) a well graded aggregate base commonly used in state of Virginia designated as VA21a stone; (2) a non-cohesive silty sand subgrade soil, which was the local subgrade soil used at the TFHRC accelerated loading facility (ALF); and (3) an imported cohesive high plasticity clay (HPC) subgrade soil. The material characteristics and soil water characteristic curves (SWCC) are provided in the Appendix 3.
The subgrade and base layers in each test pit were designed to different target moisture, density, and layer thickness values. The material used in each pit and the design values for each layer are listed in Table 3-1.
Table 3-1. Target MC, density, and layer thickness
Pit #
Layer Material
Moisturecondition
Target MC [%]
TargetPC
Target Layer
thickness [cm (in)]
Sub layers
1 Subgrade ALF Dry of OMC
10 10%
90 508.0 (20.0) 3
Base - - - - - - -2 Subgrade ALF Wet of
OMC 15 30% 95 609.6 (24.0) 6
Base VA21a At OMC 4.5 95 203.2 (8.0) 2 3 Subgrade HPC Wet of
OMC 29 20% 95 508.0 (20.0) 5
Base VA21a At OMC 4.5 95 101.6 (4.0) 1
The resilient modulus (MR) tests were performed at similar moisture and density conditions as during the test pit construction as well as at optimum moisture content and maximum dry density conditions per AASHTO T307. The MEPDG universal constitutive model was fit to the experimental data.
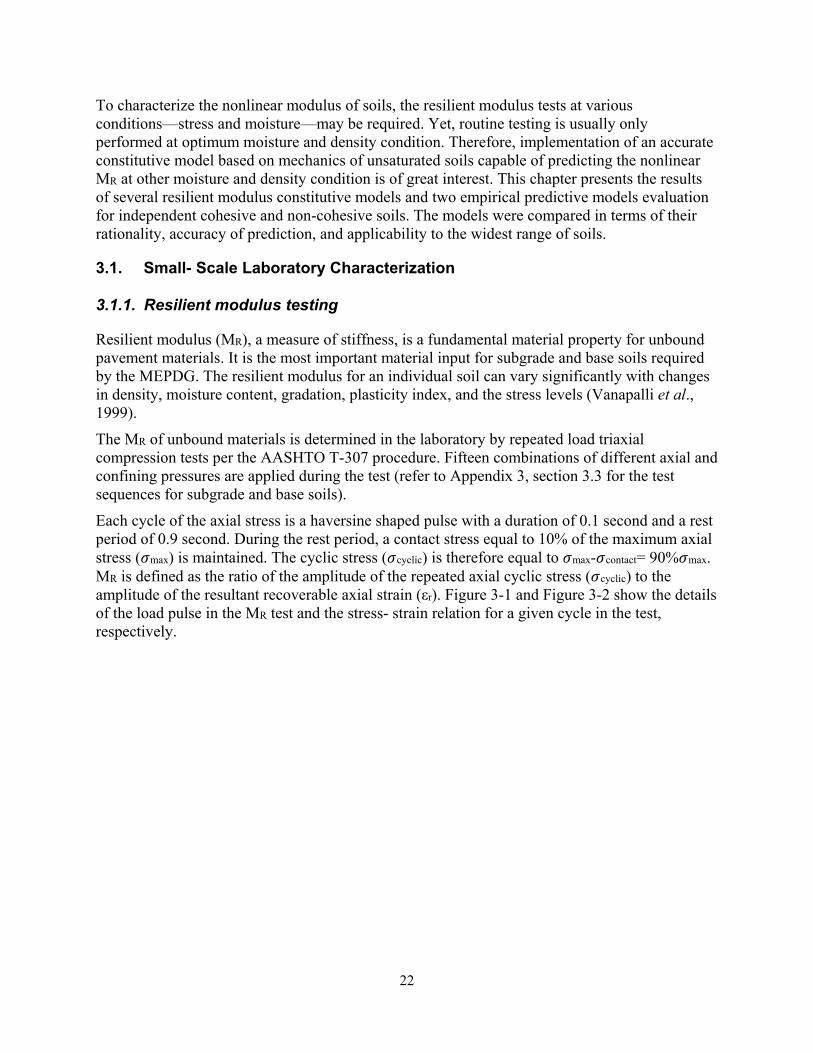
22
To characterize the nonlinear modulus of soils, the resilient modulus tests at various conditions—stress and moisture—may be required. Yet, routine testing is usually only performed at optimum moisture and density condition. Therefore, implementation of an accurate constitutive model based on mechanics of unsaturated soils capable of predicting the nonlinear MR at other moisture and density condition is of great interest. This chapter presents the results of several resilient modulus constitutive models and two empirical predictive models evaluation for independent cohesive and non-cohesive soils. The models were compared in terms of their rationality, accuracy of prediction, and applicability to the widest range of soils.
3.1. Small- Scale Laboratory Characterization
3.1.1. Resilient modulus testing
Resilient modulus (MR), a measure of stiffness, is a fundamental material property for unbound pavement materials. It is the most important material input for subgrade and base soils required by the MEPDG. The resilient modulus for an individual soil can vary significantly with changes in density, moisture content, gradation, plasticity index, and the stress levels (Vanapalli et al., 1999).
The MR of unbound materials is determined in the laboratory by repeated load triaxial compression tests per the AASHTO T-307 procedure. Fifteen combinations of different axial and confining pressures are applied during the test (refer to Appendix 3, section 3.3 for the test sequences for subgrade and base soils).
Each cycle of the axial stress is a haversine shaped pulse with a duration of 0.1 second and a rest period of 0.9 second. During the rest period, a contact stress equal to 10% of the maximum axial stress ( max) is maintained. The cyclic stress ( cyclic) is therefore equal to max- contact= 90% max. MR is defined as the ratio of the amplitude of the repeated axial cyclic stress ( cyclic) to the amplitude of the resultant recoverable axial strain (εr). Figure 3-1 and Figure 3-2 show the details of the load pulse in the MR test and the stress- strain relation for a given cycle in the test, respectively.
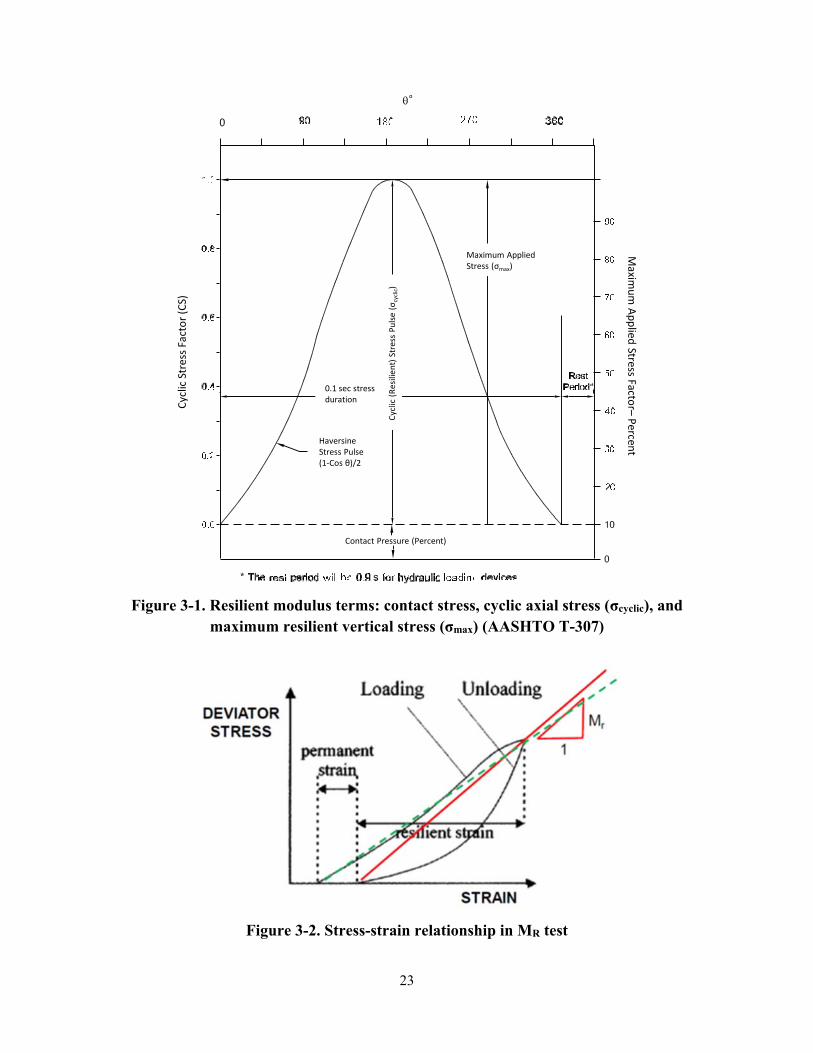
23
Figure 3-1. Resilient modulus terms: contact stress, cyclic axial stress (σcyclic), and
maximum resilient vertical stress (σmax) (AASHTO T-307)
Figure 3-2. Stress-strain relationship in MR test
Cyclic Loa
d Factor (C
S)
σ
σ
Contact Pressure (Percent)
HaversineStress Pulse (1‐Cos θ)/2
0.1 sec stress durationCy
clic Stress F
actor (CS)
Cyclic (R
esilien
t) Stress Pulse (σ
cyclic)
Maximum Applied Stress (σmax)
Maxim
um Applied Stress Factor–
Percent
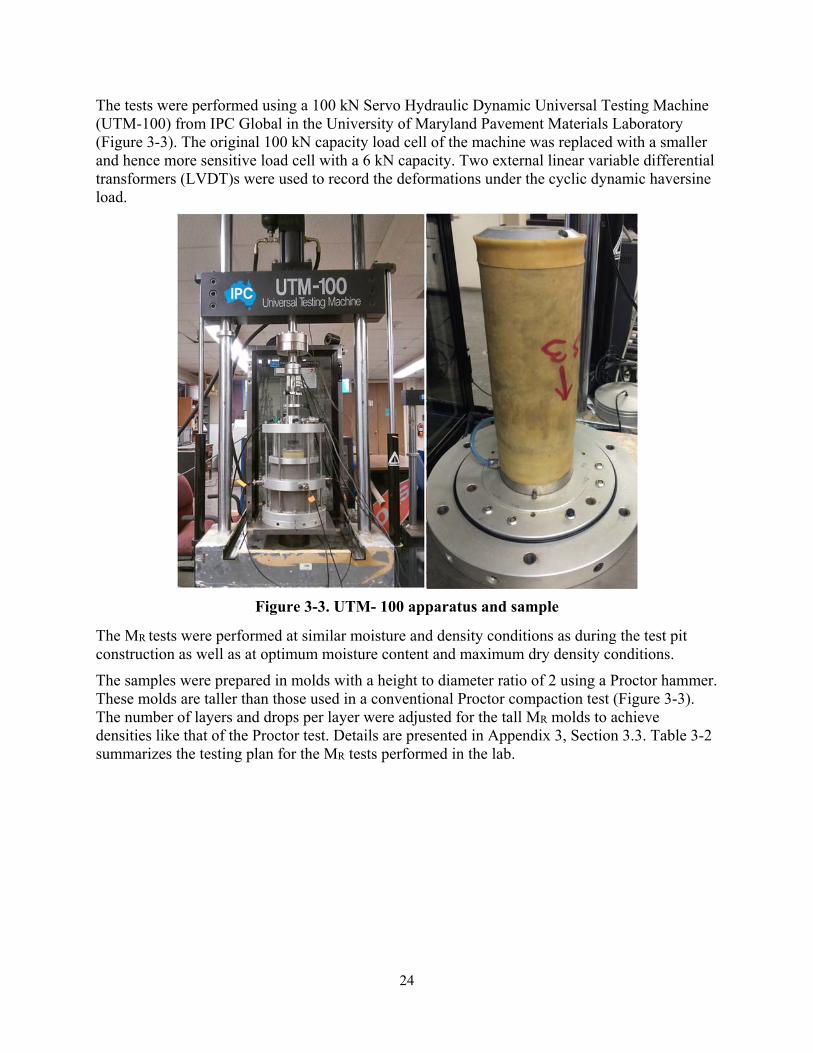
24
The tests were performed using a 100 kN Servo Hydraulic Dynamic Universal Testing Machine (UTM-100) from IPC Global in the University of Maryland Pavement Materials Laboratory (Figure 3-3). The original 100 kN capacity load cell of the machine was replaced with a smaller and hence more sensitive load cell with a 6 kN capacity. Two external linear variable differential transformers (LVDT)s were used to record the deformations under the cyclic dynamic haversine load.
Figure 3-3. UTM- 100 apparatus and sample
The MR tests were performed at similar moisture and density conditions as during the test pit construction as well as at optimum moisture content and maximum dry density conditions.
The samples were prepared in molds with a height to diameter ratio of 2 using a Proctor hammer. These molds are taller than those used in a conventional Proctor compaction test (Figure 3-3). The number of layers and drops per layer were adjusted for the tall MR molds to achieve densities like that of the Proctor test. Details are presented in Appendix 3, Section 3.3. Table 3-2 summarizes the testing plan for the MR tests performed in the lab.
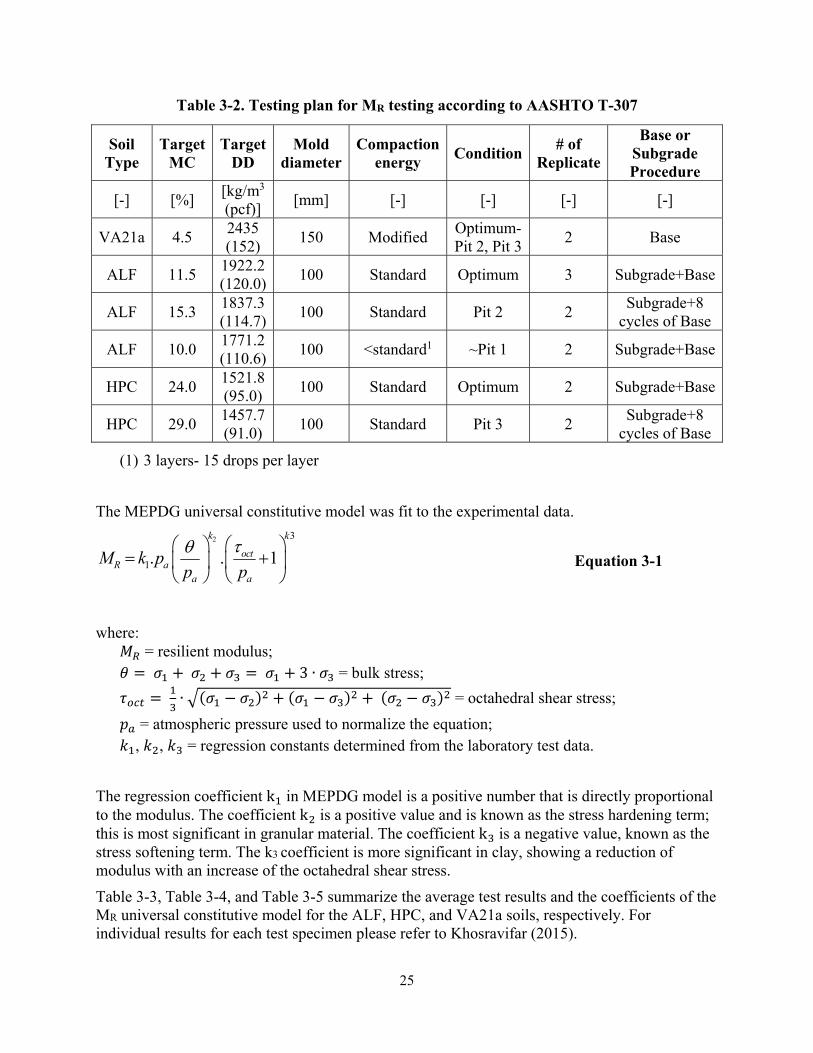
25
Table 3-2. Testing plan for MR testing according to AASHTO T-307
Soil Type
Target MC
Target DD
Mold diameter
Compactionenergy Condition # of
Replicate
Base or Subgrade Procedure
[-] [%] [kg/m3 (pcf)] [mm] [-] [-] [-] [-]
VA21a 4.5 2435 (152) 150 Modified Optimum-
Pit 2, Pit 3 2 Base
ALF 11.5 1922.2 (120.0) 100 Standard Optimum 3 Subgrade+Base
ALF 15.3 1837.3 (114.7) 100 Standard Pit 2 2 Subgrade+8
cycles of Base
ALF 10.0 1771.2 (110.6) 100 <standard1 ~Pit 1 2 Subgrade+Base
HPC 24.0 1521.8 (95.0) 100 Standard Optimum 2 Subgrade+Base
HPC 29.0 1457.7 (91.0) 100 Standard Pit 3 2 Subgrade+8
cycles of Base
(1) 3 layers- 15 drops per layer
The MEPDG universal constitutive model was fit to the experimental data.
Equation 3-1
where: = resilient modulus; 3 ∙ = bulk stress; ∙ = octahedral shear stress;
= atmospheric pressure used to normalize the equation; , , = regression constants determined from the laboratory test data.
The regression coefficient k in MEPDG model is a positive number that is directly proportional to the modulus. The coefficient k is a positive value and is known as the stress hardening term; this is most significant in granular material. The coefficient k is a negative value, known as the stress softening term. The k3 coefficient is more significant in clay, showing a reduction of modulus with an increase of the octahedral shear stress.
Table 3-3, Table 3-4, and Table 3-5 summarize the average test results and the coefficients of the MR universal constitutive model for the ALF, HPC, and VA21a soils, respectively. For individual results for each test specimen please refer to Khosravifar (2015).
2 3
1. . 1k k
octR a
a a
M k pp p
WT§ · § · �¨ ¸ ¨ ¸
© ¹ © ¹
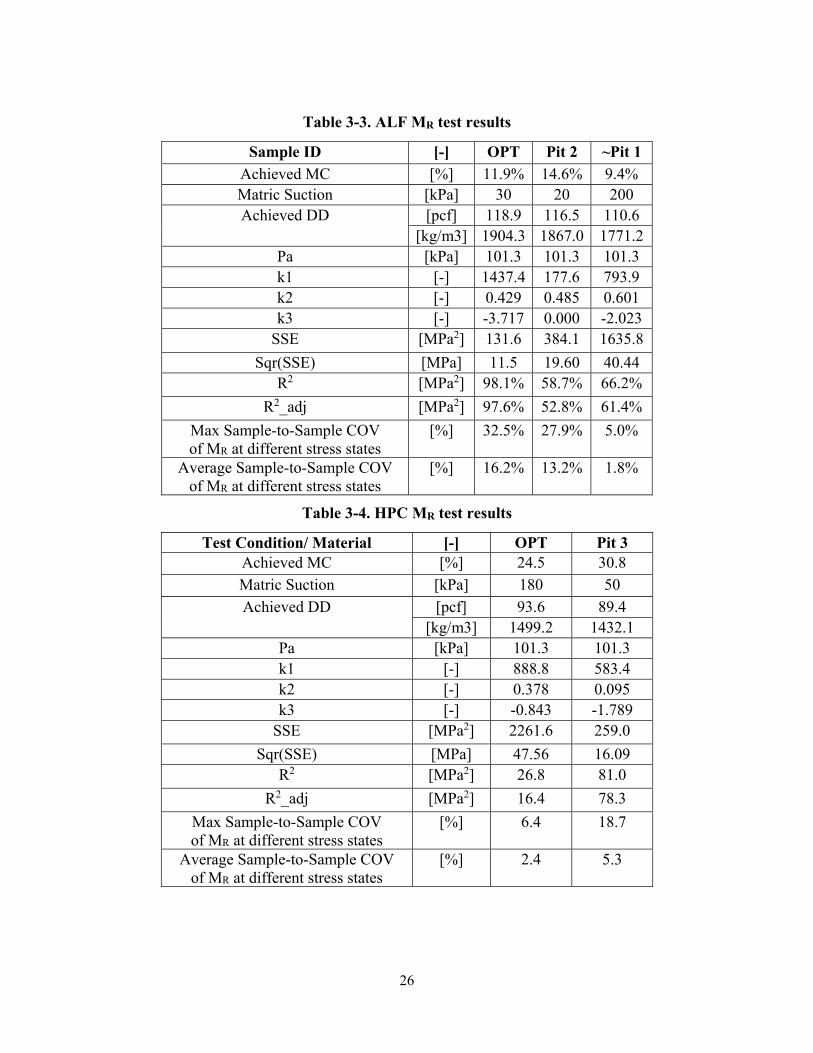
26
Table 3-3. ALF MR test results
Sample ID [-] OPT Pit 2 ~Pit 1 Achieved MC [%] 11.9% 14.6% 9.4% Matric Suction [kPa] 30 20 200 Achieved DD [pcf] 118.9 116.5 110.6
[kg/m3] 1904.3 1867.0 1771.2 Pa [kPa] 101.3 101.3 101.3 k1 [-] 1437.4 177.6 793.9 k2 [-] 0.429 0.485 0.601 k3 [-] -3.717 0.000 -2.023
SSE [MPa2] 131.6 384.1 1635.8 Sqr(SSE) [MPa] 11.5 19.60 40.44
R2 [MPa2] 98.1% 58.7% 66.2% R2_adj [MPa2] 97.6% 52.8% 61.4%
Max Sample-to-Sample COV of MR at different stress states
[%] 32.5% 27.9% 5.0%
Average Sample-to-Sample COV of MR at different stress states
[%] 16.2% 13.2% 1.8%
Table 3-4. HPC MR test results
Test Condition/ Material [-] OPT Pit 3 Achieved MC [%] 24.5 30.8 Matric Suction [kPa] 180 50 Achieved DD [pcf] 93.6 89.4
[kg/m3] 1499.2 1432.1 Pa [kPa] 101.3 101.3 k1 [-] 888.8 583.4 k2 [-] 0.378 0.095 k3 [-] -0.843 -1.789
SSE [MPa2] 2261.6 259.0 Sqr(SSE) [MPa] 47.56 16.09
R2 [MPa2] 26.8 81.0 R2_adj [MPa2] 16.4 78.3
Max Sample-to-Sample COV of MR at different stress states
[%] 6.4 18.7
Average Sample-to-Sample COV of MR at different stress states
[%] 2.4 5.3
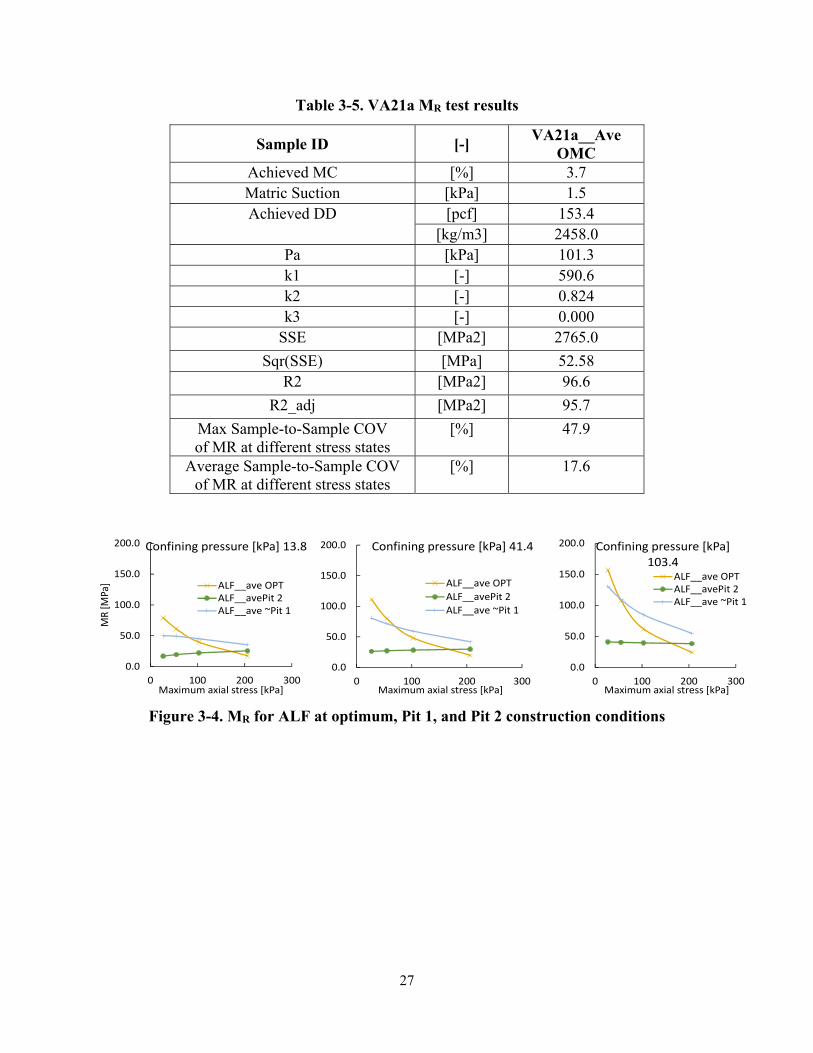
27
Table 3-5. VA21a MR test results
Sample ID [-] VA21a__Ave OMC
Achieved MC [%] 3.7 Matric Suction [kPa] 1.5 Achieved DD [pcf] 153.4
[kg/m3] 2458.0 Pa [kPa] 101.3 k1 [-] 590.6 k2 [-] 0.824 k3 [-] 0.000
SSE [MPa2] 2765.0 Sqr(SSE) [MPa] 52.58
R2 [MPa2] 96.6 R2_adj [MPa2] 95.7
Max Sample-to-Sample COV of MR at different stress states
[%] 47.9
Average Sample-to-Sample COV of MR at different stress states
[%] 17.6
Figure 3-4. MR for ALF at optimum, Pit 1, and Pit 2 construction conditions
0.0
50.0
100.0
150.0
200.0
0 100 200 300
MR [M
Pa]
Maximum axial stress [kPa]
Confining pressure [kPa] 13.8
ALF__ave OPTALF__avePit 2ALF__ave ~Pit 1
0.0
50.0
100.0
150.0
200.0
0 100 200 300Maximum axial stress [kPa]
Confining pressure [kPa] 41.4
ALF__ave OPTALF__avePit 2ALF__ave ~Pit 1
0.0
50.0
100.0
150.0
200.0
0 100 200 300Maximum axial stress [kPa]
Confining pressure [kPa] 103.4
ALF__ave OPTALF__avePit 2ALF__ave ~Pit 1
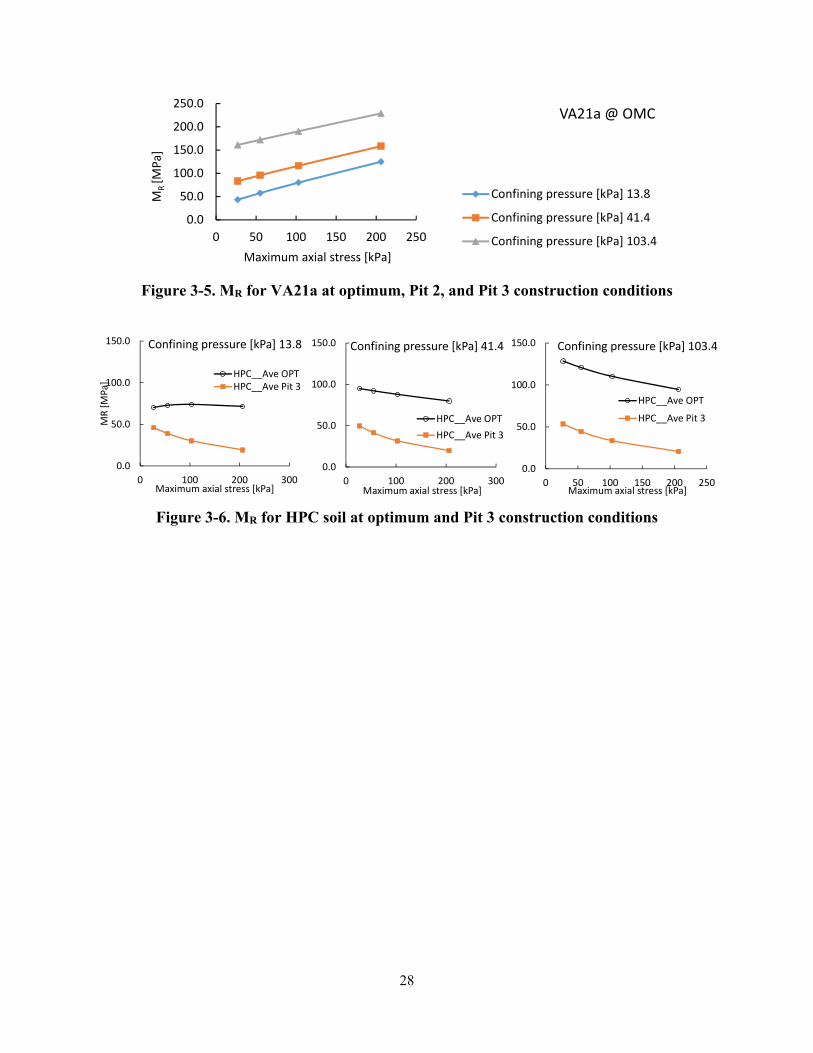
28
Figure 3-5. MR for VA21a at optimum, Pit 2, and Pit 3 construction conditions
Figure 3-6. MR for HPC soil at optimum and Pit 3 construction conditions
0.0
50.0
100.0
150.0
200.0
250.0
0 50 100 150 200 250
MR [M
Pa]
Maximum axial stress [kPa]
VA21a @ OMC
Confining pressure [kPa] 13.8
Confining pressure [kPa] 41.4
Confining pressure [kPa] 103.4
0.0
50.0
100.0
150.0
0 100 200 300
MR [M
Pa]
Maximum axial stress [kPa]
Confining pressure [kPa] 13.8
HPC__Ave OPTHPC__Ave Pit 3
0.0
50.0
100.0
150.0
0 100 200 300Maximum axial stress [kPa]
Confining pressure [kPa] 41.4
HPC__Ave OPTHPC__Ave Pit 3
0.0
50.0
100.0
150.0
0 50 100 150 200 250Maximum axial stress [kPa]
Confining pressure [kPa] 103.4
HPC__Ave OPT
HPC__Ave Pit 3
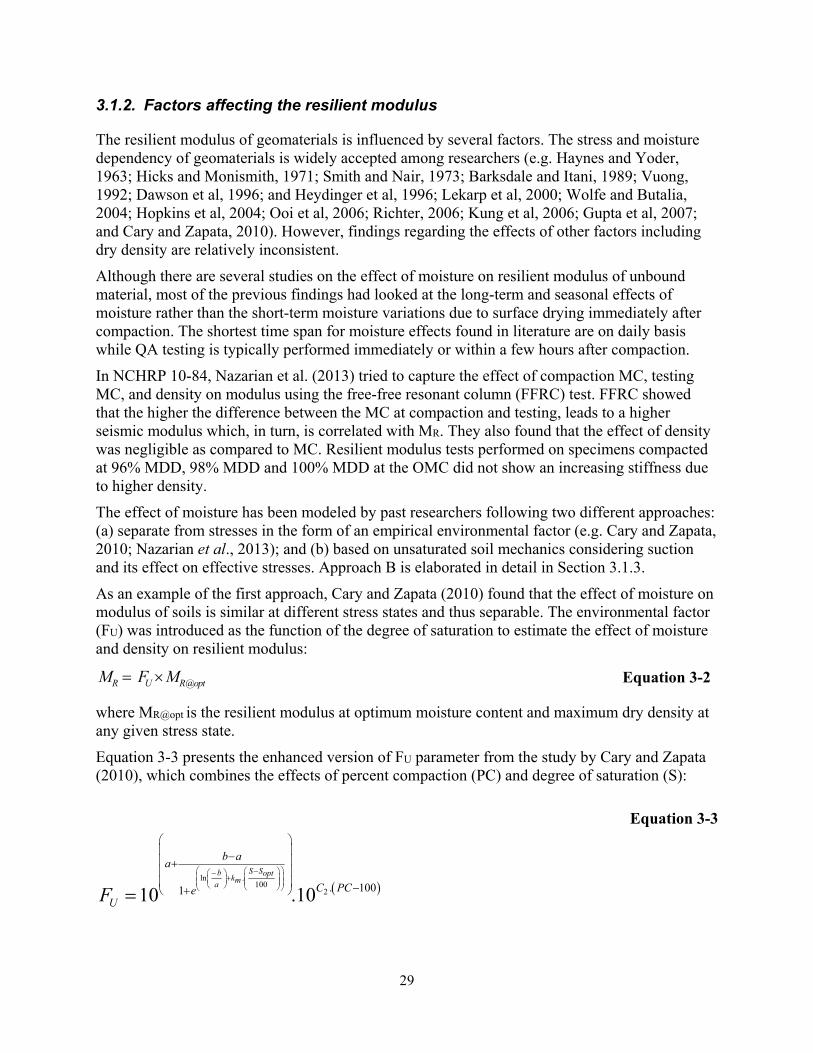
29
3.1.2. Factors affecting the resilient modulus
The resilient modulus of geomaterials is influenced by several factors. The stress and moisture dependency of geomaterials is widely accepted among researchers (e.g. Haynes and Yoder, 1963; Hicks and Monismith, 1971; Smith and Nair, 1973; Barksdale and Itani, 1989; Vuong, 1992; Dawson et al, 1996; and Heydinger et al, 1996; Lekarp et al, 2000; Wolfe and Butalia, 2004; Hopkins et al, 2004; Ooi et al, 2006; Richter, 2006; Kung et al, 2006; Gupta et al, 2007; and Cary and Zapata, 2010). However, findings regarding the effects of other factors including dry density are relatively inconsistent.
Although there are several studies on the effect of moisture on resilient modulus of unbound material, most of the previous findings had looked at the long-term and seasonal effects of moisture rather than the short-term moisture variations due to surface drying immediately after compaction. The shortest time span for moisture effects found in literature are on daily basis while QA testing is typically performed immediately or within a few hours after compaction.
In NCHRP 10-84, Nazarian et al. (2013) tried to capture the effect of compaction MC, testing MC, and density on modulus using the free-free resonant column (FFRC) test. FFRC showed that the higher the difference between the MC at compaction and testing, leads to a higher seismic modulus which, in turn, is correlated with MR. They also found that the effect of density was negligible as compared to MC. Resilient modulus tests performed on specimens compacted at 96% MDD, 98% MDD and 100% MDD at the OMC did not show an increasing stiffness due to higher density.
The effect of moisture has been modeled by past researchers following two different approaches: (a) separate from stresses in the form of an empirical environmental factor (e.g. Cary and Zapata, 2010; Nazarian et al., 2013); and (b) based on unsaturated soil mechanics considering suction and its effect on effective stresses. Approach B is elaborated in detail in Section 3.1.3.
As an example of the first approach, Cary and Zapata (2010) found that the effect of moisture on modulus of soils is similar at different stress states and thus separable. The environmental factor (FU) was introduced as the function of the degree of saturation to estimate the effect of moisture and density on resilient modulus:
Equation 3-2
where MR@opt is the resilient modulus at optimum moisture content and maximum dry density at any given stress state.
Equation 3-3 presents the enhanced version of FU parameter from the study by Cary and Zapata (2010), which combines the effects of percent compaction (PC) and degree of saturation (S):
Equation 3-3
@ R U R optM F M u
� �ln .
1002 . 100110 .10
S Sb optkma
b aa
C PCeUF
§ ·�§ ·�§ ·¨ ¸� ¨ ¸¨ ¸ ¨ ¸¨ ¸© ¹ © ¹© ¹
§ ·¨ ¸�¨ ¸�¨ ¸¨ ¸ ��© ¹
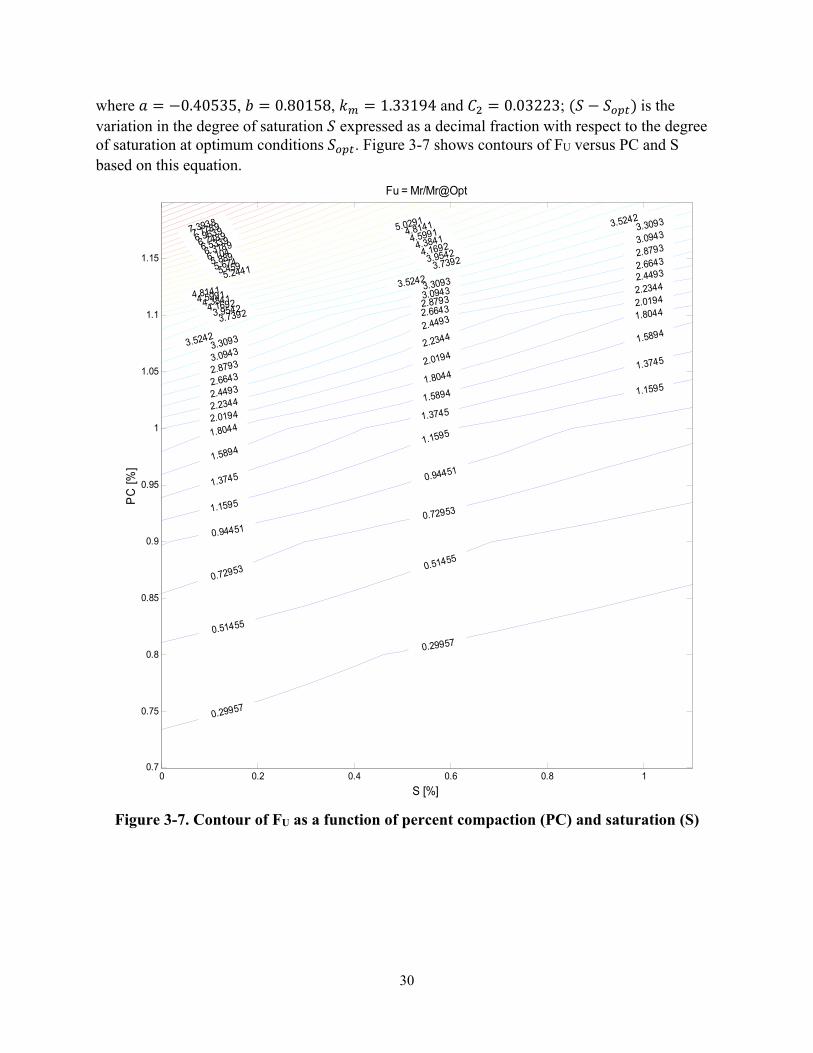
30
where 0.40535, 0.80158, 1.33194 and 0.03223; is the variation in the degree of saturation expressed as a decimal fraction with respect to the degree of saturation at optimum conditions . Figure 3-7 shows contours of FU versus PC and S based on this equation.
Figure 3-7. Contour of FU as a function of percent compaction (PC) and saturation (S)
0.29957
0.299570.51455
0.51455
0.72953
0.72953
0.94451
0.94451
1.1595
1.1595
1.1595
1.3745
1.3745
1.3745
1.5894
1.5894
1.5894
1.8044
1.8044
1.8044
2.0194
2.0194
2.0194
2.2344
2.2344
2.2344
2.4493
2.4493
2.4493
2.6643
2.6643
2.6643
2.8793
2.8793
2.8793
3.0943
3.0943
3.0943
3.3093
3.3093
3.30933.5242
3.5242
3.5242
3.7392
3.7392
3.9542
3.9542
4.1692
4.1692
4.3841
4.3841
4.5991
4.5991
4.8141
4.8141
5.0291
5.24415.4595.6745.8896.1046.31896.53396.74896.96397.17897.3938
S [%]
PC
[%]
Fu = Mr/Mr@Opt
0 0.2 0.4 0.6 0.8 10.7
0.75
0.8
0.85
0.9
0.95
1
1.05
1.1
1.15
31
3.1.3. Evaluation of measured resilient modulus versus predictive models
The mechanical response of soils is a function of effective stresses rather than total stresses (Bishop, 1960; Terzaghi, 1996). In unsaturated soils, two main factors define the effective stresses: (1) pore air pressure (ua) which is often insignificant, and (2) the difference between ua and the pore water pressure (uw), designated as matric suction (ua – uw) or simply u as referred to in this study. Bishop (1960) formulated the effective stress of unsaturated soils as:
Equation 3-4
Matric suction (u) is a function of pore size geometry, pore size distribution, and the soil water content and can be predicted from the soil-water characteristic curve (SWCC) (Fredlund and Xing, 1994) as described in Appendix 3, Section 3.2. The effective stress parameter χ—also known as pore suction resistance factor—in Equation 3-4 is a material variable that shows the contribution of the matric suction in the effective stress and is generally considered to vary between zero and unity, corresponding to a completely dry and fully saturated condition, respectively. At the fully saturated condition, the equation reduces to Terzaghi’s classic effective stress equation.
While several researchers, e.g. Lytton (1995), Khalili and Khabbaz (1998), and Roberson and Siekmeier (2002), have proposed different models to quantify the pore suction resistance factor, these have not been well accepted to date and χ equal to 1 is often preferred by researchers (Morgenstern, 1979).
To evaluate the field LWD modulus data, one must define a target modulus for QA purposes. This requires characterizing the nonlinear modulus of the soil at various stresses and moisture contents, which requires an extensive amount of testing. Routine MR testing, if performed at all, is usually performed only at the optimum moisture and density condition. Therefore, an accurate model based on the mechanics of unsaturated soils that can predict the nonlinear MR at other test conditions is of potentially great interest.
To evaluate the predictive capability of available constitutive models, a total of nine resilient modulus constitutive models and empirical predictive models were evaluated on independent cohesive and non-cohesive soils. These evaluations are described in detail in Appendix 3, Sections 3.4 and 3.5. The statistical analysis of accuracy and bias on the predicted moduli at various moisture and density conditions found that the model proposed by Lytton (1995), designated as model M8 in the Appendix 3 Section 3.4, provided the most accurate predictions of the nine evaluated models and is rationally founded on the principals of unsaturated soil mechanics. But while the model performed better than the rest in terms of rationality, accuracy of prediction, and applicability to the widest range of cohesive and non-cohesive soils, the accuracy of the predictions was far from acceptable and cannot be used to estimate the field LWD target modulus with confidence.
The ability to predict MR at different moisture and density conditions would represent a significant advance in the state of the art. Fortunately, the inability to do this reliably using current models is not a major issue for the purposes of the present study.
LWD testing for compaction QA in the field will usually be performed immediately or very shortly (within 2 hours) after material placement. Any surface drying from the as-placed
� � � �a a wu u uV V Fc � � �

32
moisture condition will be minimal during this short time interval for most soils. Moreover, our proposed approach of LWD drops on Proctor molds (described later) compacted at different moisture contents can quantify the effect of MC on modulus. This approach can be used to determine the target modulus of the compacted geomaterial at the field MC.
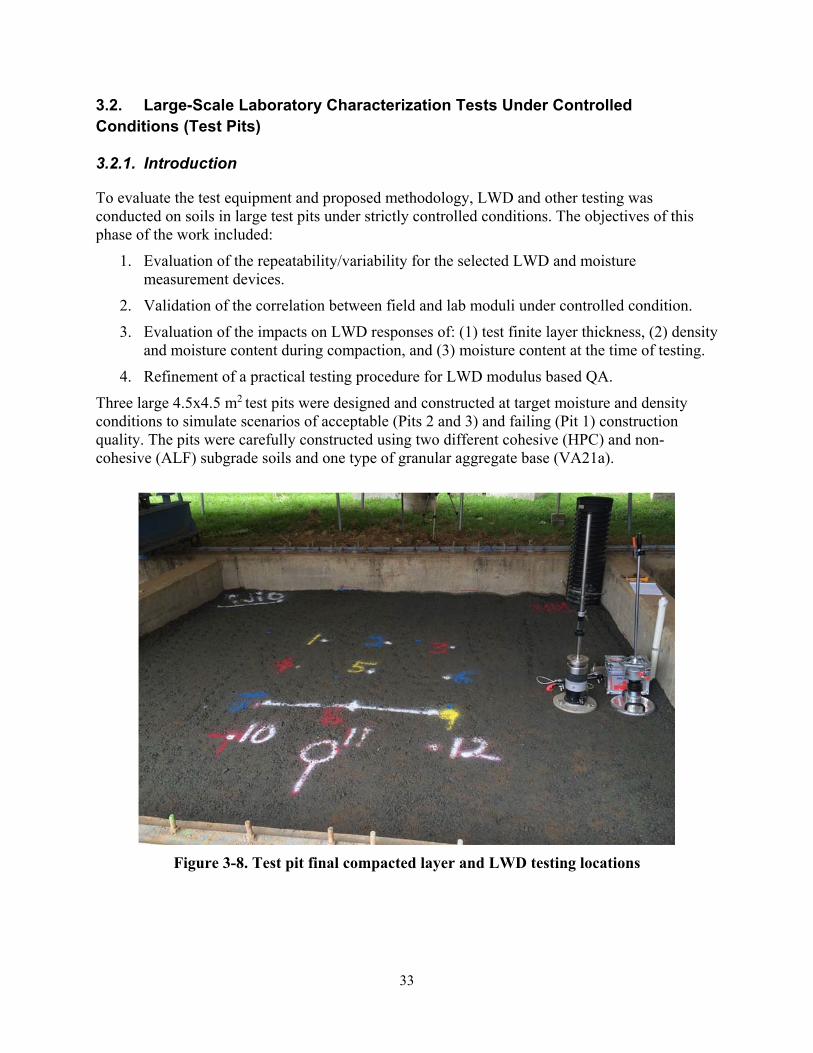
33
3.2. Large-Scale Laboratory Characterization Tests Under Controlled Conditions (Test Pits)
3.2.1. Introduction
To evaluate the test equipment and proposed methodology, LWD and other testing was conducted on soils in large test pits under strictly controlled conditions. The objectives of this phase of the work included:
1. Evaluation of the repeatability/variability for the selected LWD and moisture measurement devices.
2. Validation of the correlation between field and lab moduli under controlled condition.
3. Evaluation of the impacts on LWD responses of: (1) test finite layer thickness, (2) density and moisture content during compaction, and (3) moisture content at the time of testing.
4. Refinement of a practical testing procedure for LWD modulus based QA.
Three large 4.5x4.5 m2 test pits were designed and constructed at target moisture and density conditions to simulate scenarios of acceptable (Pits 2 and 3) and failing (Pit 1) construction quality. The pits were carefully constructed using two different cohesive (HPC) and non-cohesive (ALF) subgrade soils and one type of granular aggregate base (VA21a).
Figure 3-8. Test pit final compacted layer and LWD testing locations
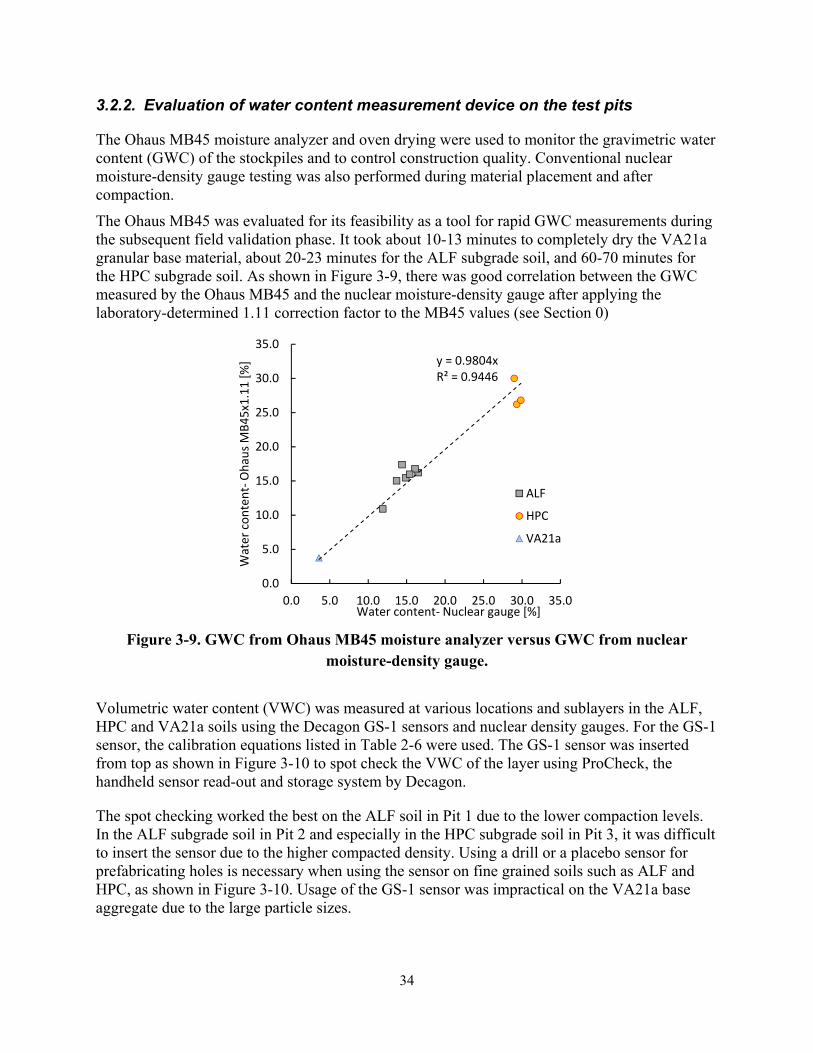
34
3.2.2. Evaluation of water content measurement device on the test pits
The Ohaus MB45 moisture analyzer and oven drying were used to monitor the gravimetric water content (GWC) of the stockpiles and to control construction quality. Conventional nuclear moisture-density gauge testing was also performed during material placement and after compaction.
The Ohaus MB45 was evaluated for its feasibility as a tool for rapid GWC measurements during the subsequent field validation phase. It took about 10-13 minutes to completely dry the VA21a granular base material, about 20-23 minutes for the ALF subgrade soil, and 60-70 minutes for the HPC subgrade soil. As shown in Figure 3-9, there was good correlation between the GWC measured by the Ohaus MB45 and the nuclear moisture-density gauge after applying the laboratory-determined 1.11 correction factor to the MB45 values (see Section 0)
Figure 3-9. GWC from Ohaus MB45 moisture analyzer versus GWC from nuclear
moisture-density gauge.
Volumetric water content (VWC) was measured at various locations and sublayers in the ALF, HPC and VA21a soils using the Decagon GS-1 sensors and nuclear density gauges. For the GS-1 sensor, the calibration equations listed in Table 2-6 were used. The GS-1 sensor was inserted from top as shown in Figure 3-10 to spot check the VWC of the layer using ProCheck, the handheld sensor read-out and storage system by Decagon.
The spot checking worked the best on the ALF soil in Pit 1 due to the lower compaction levels. In the ALF subgrade soil in Pit 2 and especially in the HPC subgrade soil in Pit 3, it was difficult to insert the sensor due to the higher compacted density. Using a drill or a placebo sensor for prefabricating holes is necessary when using the sensor on fine grained soils such as ALF and HPC, as shown in Figure 3-10. Usage of the GS-1 sensor was impractical on the VA21a base aggregate due to the large particle sizes.
y = 0.9804xR² = 0.9446
0.0
5.0
10.0
15.0
20.0
25.0
30.0
35.0
0.0 5.0 10.0 15.0 20.0 25.0 30.0 35.0
Water con
tent‐O
haus M
B45x1.11
[%]
Water content‐ Nuclear gauge [%]
ALF
HPC
VA21a
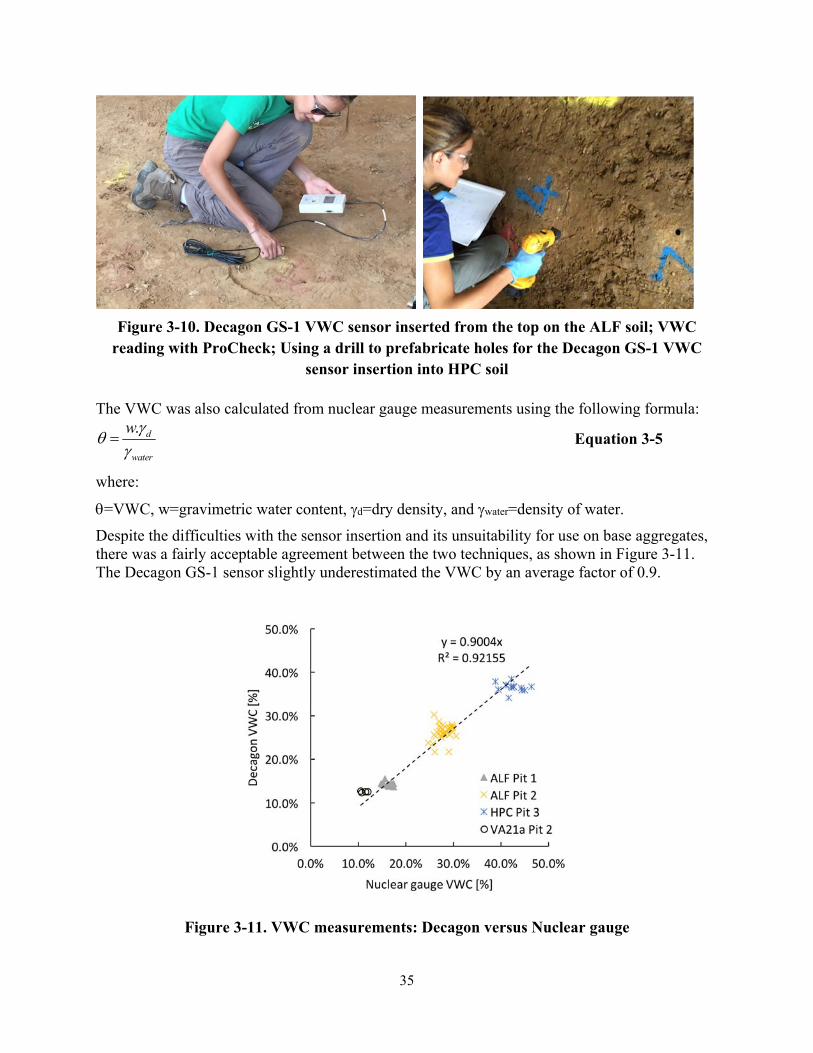
35
Figure 3-10. Decagon GS-1 VWC sensor inserted from the top on the ALF soil; VWC
reading with ProCheck; Using a drill to prefabricate holes for the Decagon GS-1 VWC sensor insertion into HPC soil
The VWC was also calculated from nuclear gauge measurements using the following formula:
. d
water
wJTJ
Equation 3-5
where:
T=VWC, w=gravimetric water content, Jd=dry density, and Jwater=density of water.
Despite the difficulties with the sensor insertion and its unsuitability for use on base aggregates, there was a fairly acceptable agreement between the two techniques, as shown in Figure 3-11. The Decagon GS-1 sensor slightly underestimated the VWC by an average factor of 0.9.
Figure 3-11. VWC measurements: Decagon versus Nuclear gauge
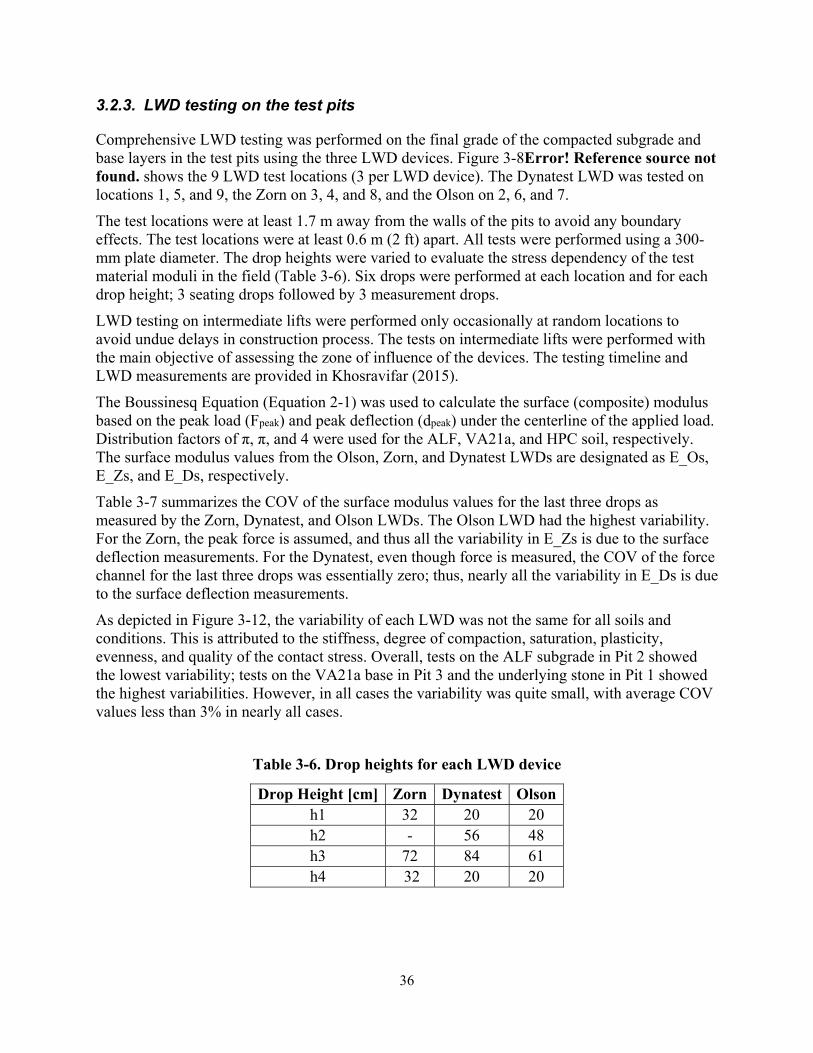
36
3.2.3. LWD testing on the test pits
Comprehensive LWD testing was performed on the final grade of the compacted subgrade and base layers in the test pits using the three LWD devices. Figure 3-8Error! Reference source not found. shows the 9 LWD test locations (3 per LWD device). The Dynatest LWD was tested on locations 1, 5, and 9, the Zorn on 3, 4, and 8, and the Olson on 2, 6, and 7.
The test locations were at least 1.7 m away from the walls of the pits to avoid any boundary effects. The test locations were at least 0.6 m (2 ft) apart. All tests were performed using a 300-mm plate diameter. The drop heights were varied to evaluate the stress dependency of the test material moduli in the field (Table 3-6). Six drops were performed at each location and for each drop height; 3 seating drops followed by 3 measurement drops.
LWD testing on intermediate lifts were performed only occasionally at random locations to avoid undue delays in construction process. The tests on intermediate lifts were performed with the main objective of assessing the zone of influence of the devices. The testing timeline and LWD measurements are provided in Khosravifar (2015).
The Boussinesq Equation (Equation 2-1) was used to calculate the surface (composite) modulus based on the peak load (Fpeak) and peak deflection (dpeak) under the centerline of the applied load. Distribution factors of π, π, and 4 were used for the ALF, VA21a, and HPC soil, respectively. The surface modulus values from the Olson, Zorn, and Dynatest LWDs are designated as E_Os, E_Zs, and E_Ds, respectively.
Table 3-7 summarizes the COV of the surface modulus values for the last three drops as measured by the Zorn, Dynatest, and Olson LWDs. The Olson LWD had the highest variability. For the Zorn, the peak force is assumed, and thus all the variability in E_Zs is due to the surface deflection measurements. For the Dynatest, even though force is measured, the COV of the force channel for the last three drops was essentially zero; thus, nearly all the variability in E_Ds is due to the surface deflection measurements.
As depicted in Figure 3-12, the variability of each LWD was not the same for all soils and conditions. This is attributed to the stiffness, degree of compaction, saturation, plasticity, evenness, and quality of the contact stress. Overall, tests on the ALF subgrade in Pit 2 showed the lowest variability; tests on the VA21a base in Pit 3 and the underlying stone in Pit 1 showed the highest variabilities. However, in all cases the variability was quite small, with average COV values less than 3% in nearly all cases.
Table 3-6. Drop heights for each LWD device
Drop Height [cm] Zorn Dynatest Olsonh1 32 20 20 h2 - 56 48 h3 72 84 61 h4 32 20 20
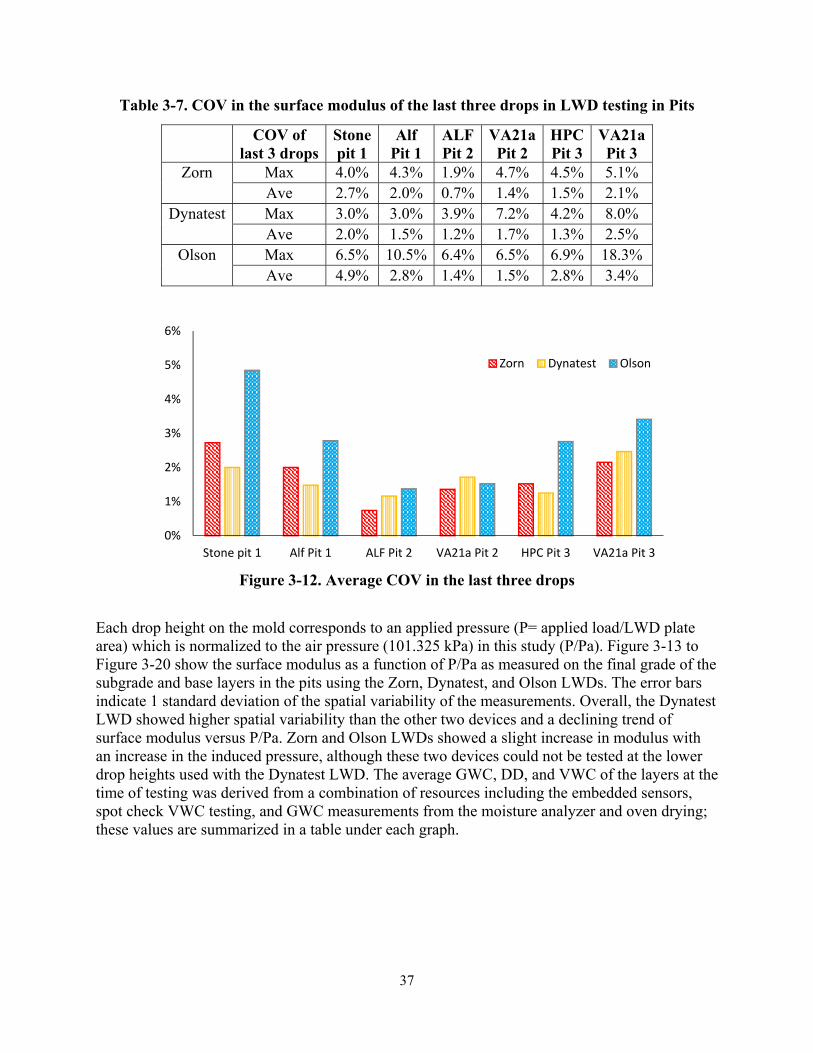
37
Table 3-7. COV in the surface modulus of the last three drops in LWD testing in Pits
COV of last 3 drops
Stonepit 1
Alf Pit 1
ALFPit 2
VA21aPit 2
HPC Pit 3
VA21a Pit 3
Zorn Max 4.0% 4.3% 1.9% 4.7% 4.5% 5.1% Ave 2.7% 2.0% 0.7% 1.4% 1.5% 2.1%
Dynatest Max 3.0% 3.0% 3.9% 7.2% 4.2% 8.0% Ave 2.0% 1.5% 1.2% 1.7% 1.3% 2.5%
Olson Max 6.5% 10.5% 6.4% 6.5% 6.9% 18.3% Ave 4.9% 2.8% 1.4% 1.5% 2.8% 3.4%
Figure 3-12. Average COV in the last three drops
Each drop height on the mold corresponds to an applied pressure (P= applied load/LWD plate area) which is normalized to the air pressure (101.325 kPa) in this study (P/Pa). Figure 3-13 to Figure 3-20 show the surface modulus as a function of P/Pa as measured on the final grade of the subgrade and base layers in the pits using the Zorn, Dynatest, and Olson LWDs. The error bars indicate 1 standard deviation of the spatial variability of the measurements. Overall, the Dynatest LWD showed higher spatial variability than the other two devices and a declining trend of surface modulus versus P/Pa. Zorn and Olson LWDs showed a slight increase in modulus with an increase in the induced pressure, although these two devices could not be tested at the lower drop heights used with the Dynatest LWD. The average GWC, DD, and VWC of the layers at the time of testing was derived from a combination of resources including the embedded sensors, spot check VWC testing, and GWC measurements from the moisture analyzer and oven drying; these values are summarized in a table under each graph.
0%
1%
2%
3%
4%
5%
6%
Stone pit 1 Alf Pit 1 ALF Pit 2 VA21a Pit 2 HPC Pit 3 VA21a Pit 3
Zorn Dynatest Olson
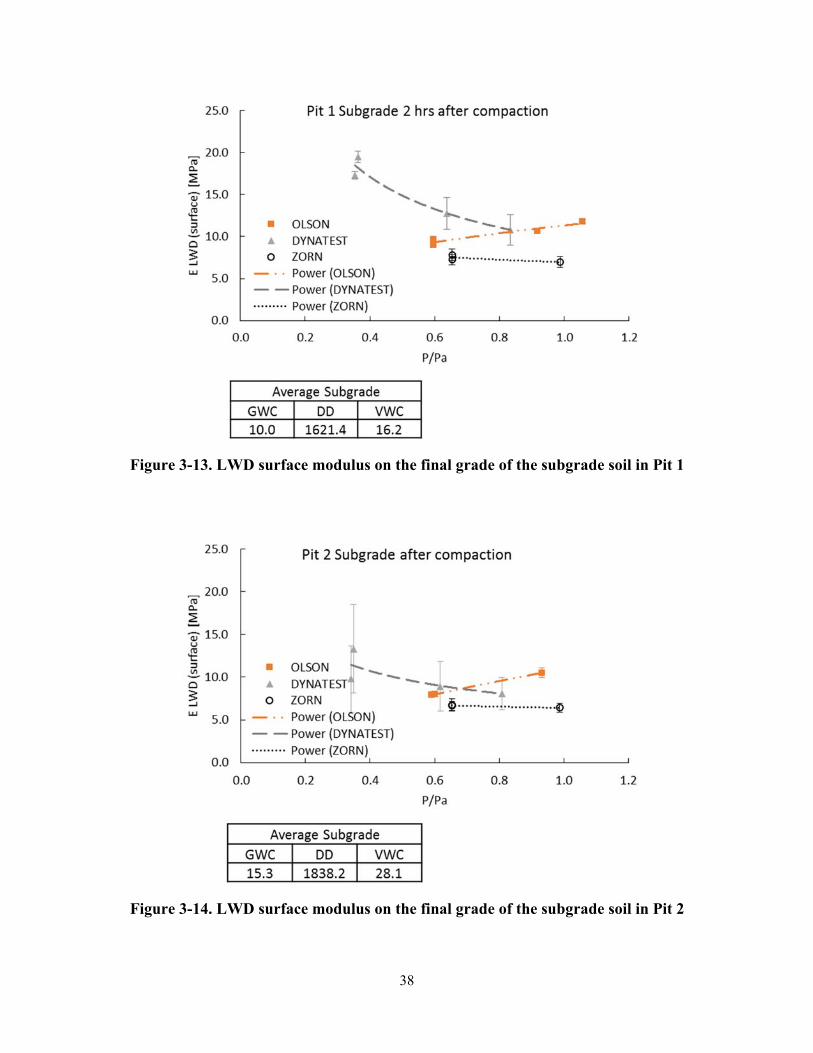
38
Figure 3-13. LWD surface modulus on the final grade of the subgrade soil in Pit 1
Figure 3-14. LWD surface modulus on the final grade of the subgrade soil in Pit 2
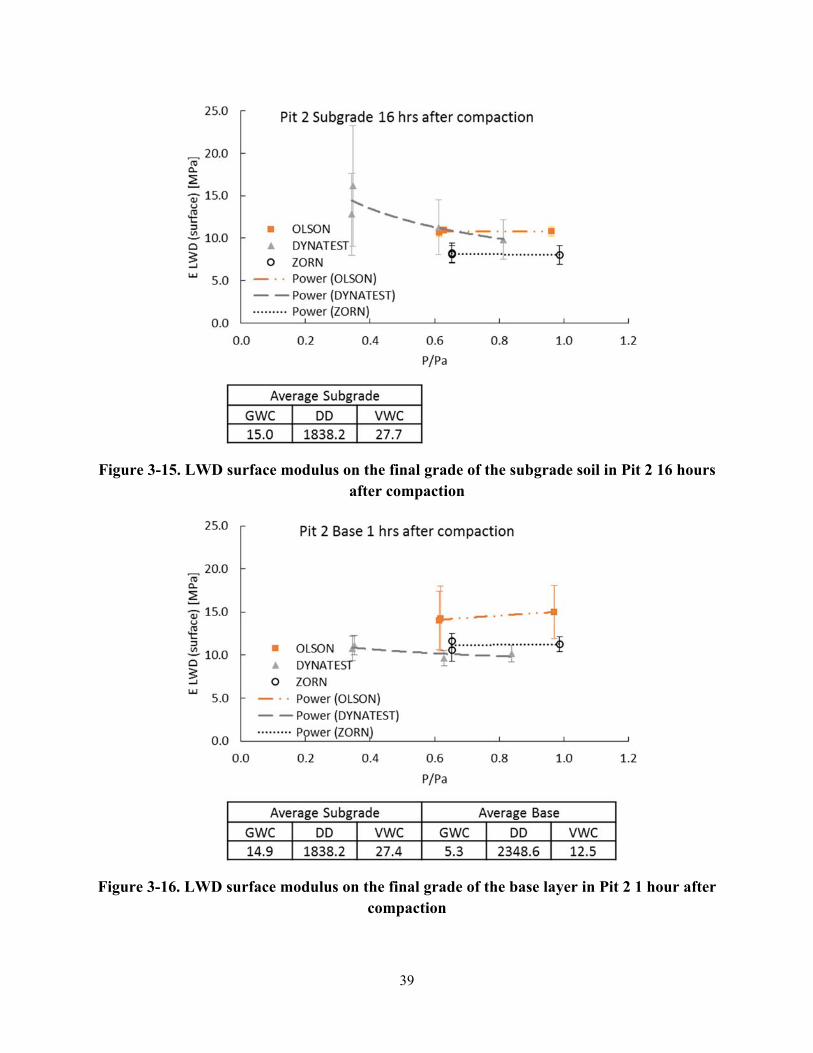
39
Figure 3-15. LWD surface modulus on the final grade of the subgrade soil in Pit 2 16 hours
after compaction
Figure 3-16. LWD surface modulus on the final grade of the base layer in Pit 2 1 hour after
compaction
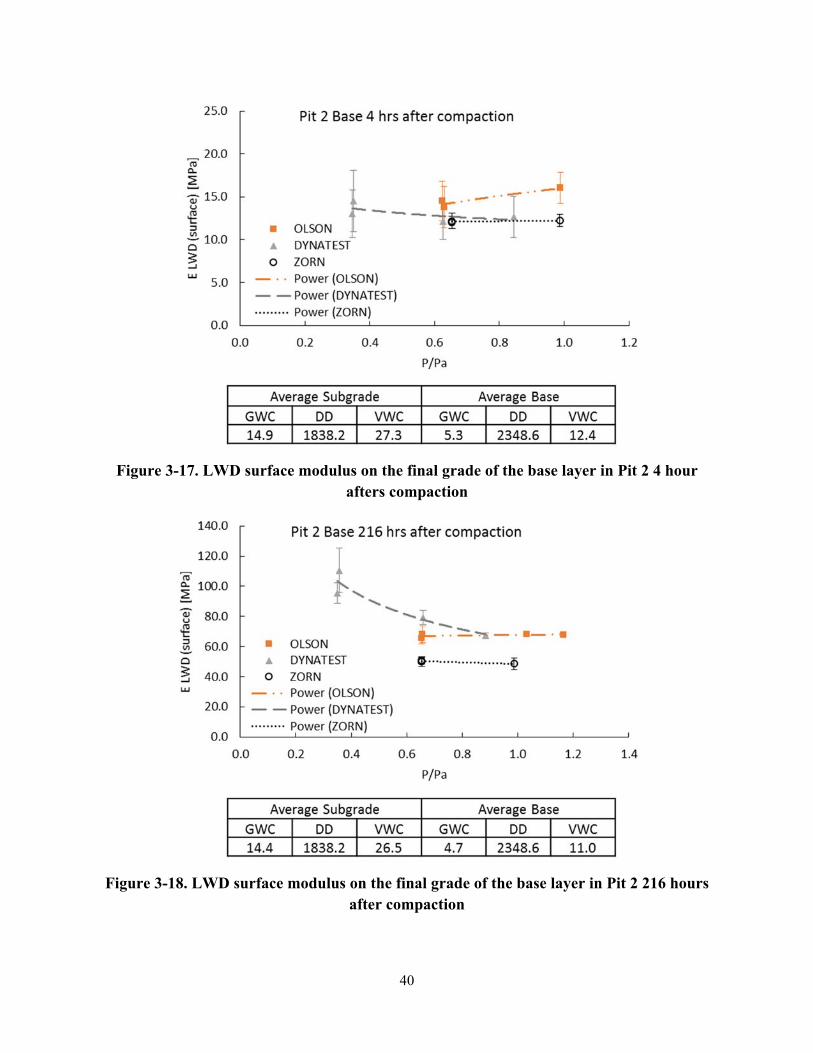
40
Figure 3-17. LWD surface modulus on the final grade of the base layer in Pit 2 4 hour
afters compaction
Figure 3-18. LWD surface modulus on the final grade of the base layer in Pit 2 216 hours
after compaction
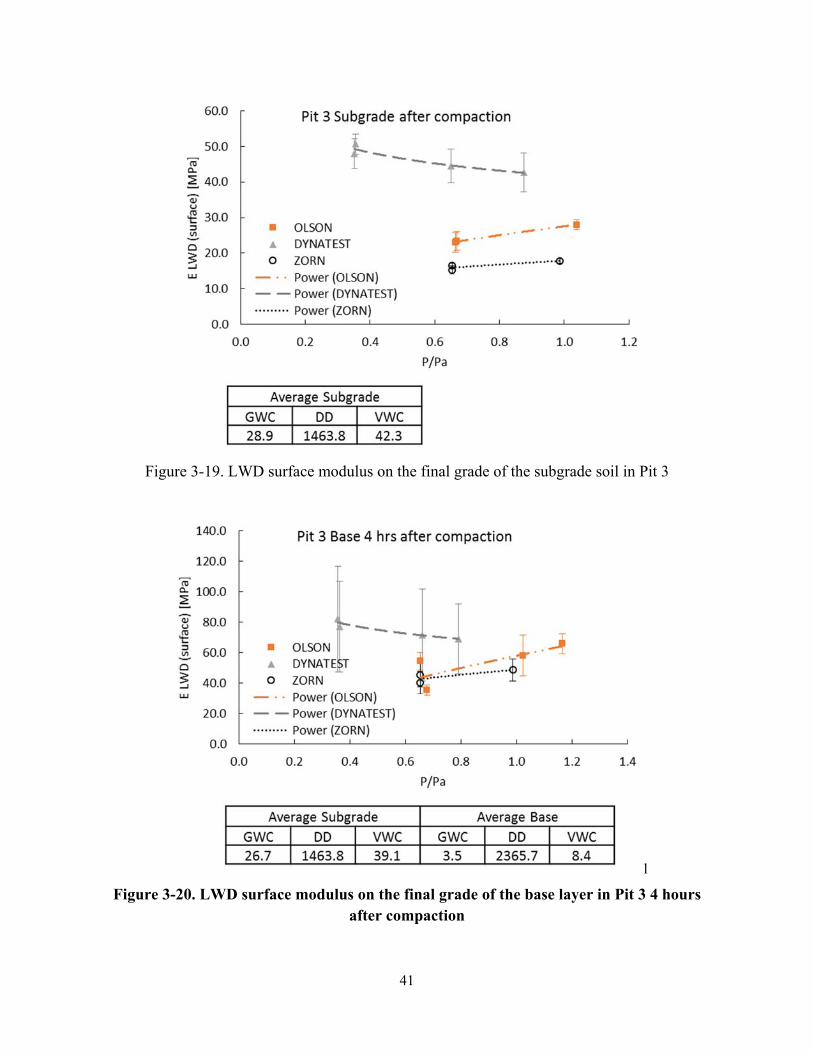
41
Figure 3-19. LWD surface modulus on the final grade of the subgrade soil in Pit 3
l
Figure 3-20. LWD surface modulus on the final grade of the base layer in Pit 3 4 hours after compaction
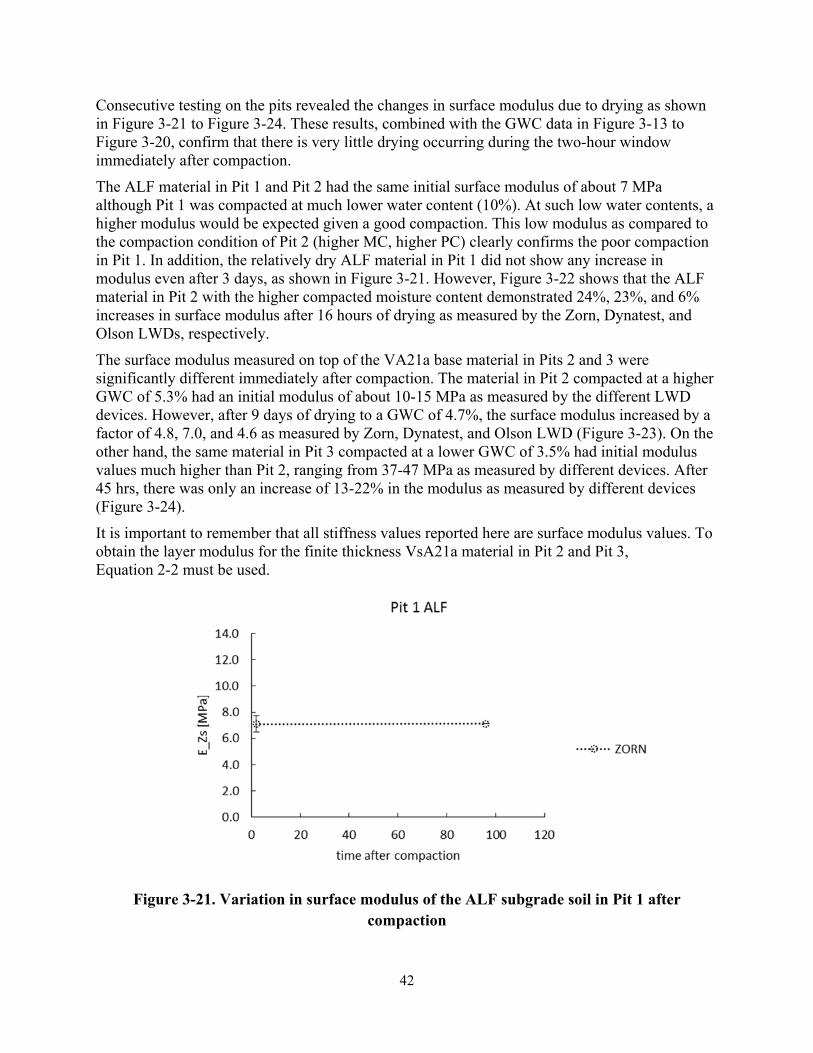
42
Consecutive testing on the pits revealed the changes in surface modulus due to drying as shown in Figure 3-21 to Figure 3-24. These results, combined with the GWC data in Figure 3-13 to Figure 3-20, confirm that there is very little drying occurring during the two-hour window immediately after compaction.
The ALF material in Pit 1 and Pit 2 had the same initial surface modulus of about 7 MPa although Pit 1 was compacted at much lower water content (10%). At such low water contents, a higher modulus would be expected given a good compaction. This low modulus as compared to the compaction condition of Pit 2 (higher MC, higher PC) clearly confirms the poor compaction in Pit 1. In addition, the relatively dry ALF material in Pit 1 did not show any increase in modulus even after 3 days, as shown in Figure 3-21. However, Figure 3-22 shows that the ALF material in Pit 2 with the higher compacted moisture content demonstrated 24%, 23%, and 6% increases in surface modulus after 16 hours of drying as measured by the Zorn, Dynatest, and Olson LWDs, respectively.
The surface modulus measured on top of the VA21a base material in Pits 2 and 3 were significantly different immediately after compaction. The material in Pit 2 compacted at a higher GWC of 5.3% had an initial modulus of about 10-15 MPa as measured by the different LWD devices. However, after 9 days of drying to a GWC of 4.7%, the surface modulus increased by a factor of 4.8, 7.0, and 4.6 as measured by Zorn, Dynatest, and Olson LWD (Figure 3-23). On the other hand, the same material in Pit 3 compacted at a lower GWC of 3.5% had initial modulus values much higher than Pit 2, ranging from 37-47 MPa as measured by different devices. After 45 hrs, there was only an increase of 13-22% in the modulus as measured by different devices (Figure 3-24).
It is important to remember that all stiffness values reported here are surface modulus values. To obtain the layer modulus for the finite thickness VsA21a material in Pit 2 and Pit 3, Equation 2-2 must be used.
Figure 3-21. Variation in surface modulus of the ALF subgrade soil in Pit 1 after
compaction
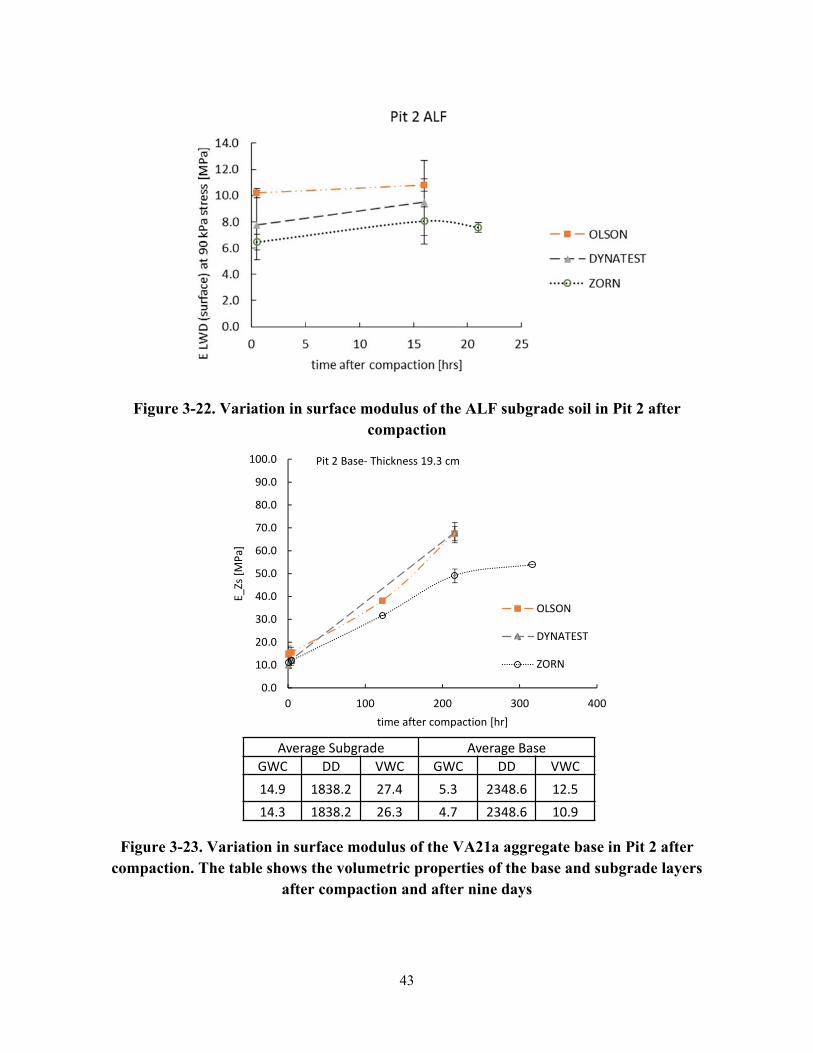
43
Figure 3-22. Variation in surface modulus of the ALF subgrade soil in Pit 2 after
compaction
Figure 3-23. Variation in surface modulus of the VA21a aggregate base in Pit 2 after
compaction. The table shows the volumetric properties of the base and subgrade layers after compaction and after nine days
Average Subgrade Average BaseGWC DD VWC GWC DD VWC14.9 1838.2 27.4 5.3 2348.6 12.514.3 1838.2 26.3 4.7 2348.6 10.9
0.0
10.0
20.0
30.0
40.0
50.0
60.0
70.0
80.0
90.0
100.0
0 100 200 300 400
E_Zs [M
Pa]
time after compaction [hr]
OLSON
DYNATEST
ZORN
Pit 2 Base‐ Thickness 19.3 cm
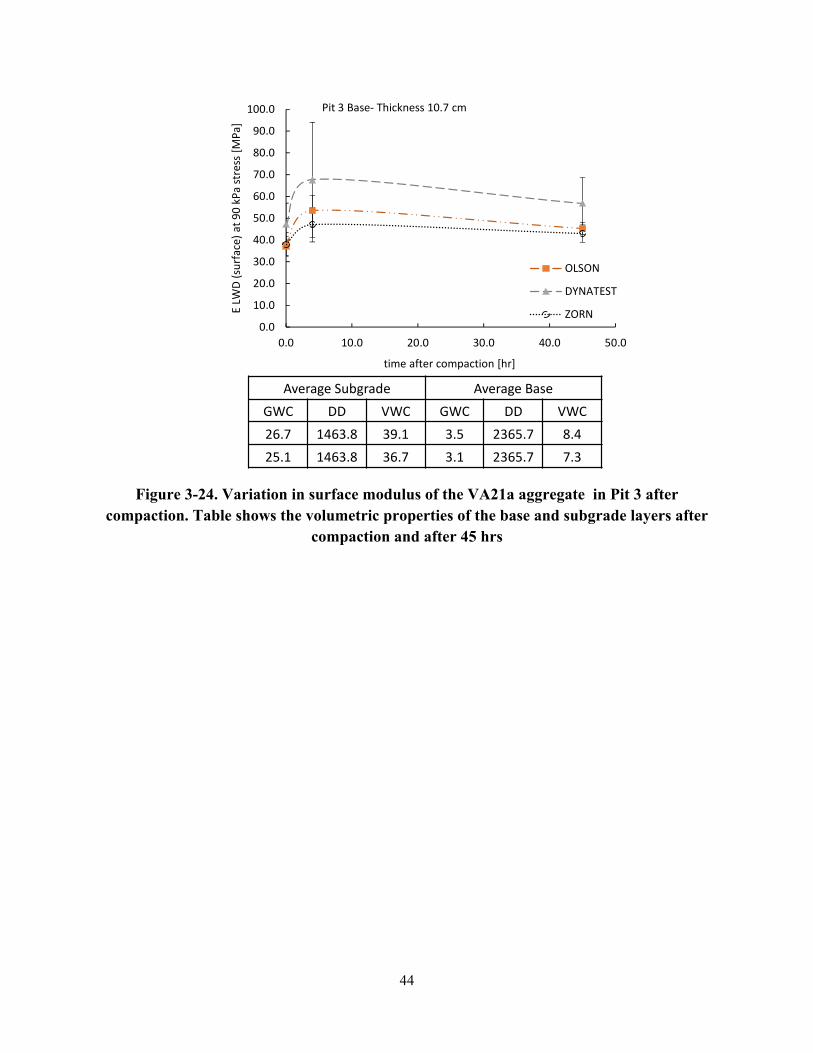
44
Figure 3-24. Variation in surface modulus of the VA21a aggregate in Pit 3 after compaction. Table shows the volumetric properties of the base and subgrade layers after
compaction and after 45 hrs
Average Subgrade Average BaseGWC DD VWC GWC DD VWC26.7 1463.8 39.1 3.5 2365.7 8.425.1 1463.8 36.7 3.1 2365.7 7.3
0.0
10.0
20.0
30.0
40.0
50.0
60.0
70.0
80.0
90.0
100.0
0.0 10.0 20.0 30.0 40.0 50.0
E LW
D (surface) a
t 90 kPa stress [M
Pa]
time after compaction [hr]
OLSON
DYNATEST
ZORN
Pit 3 Base‐ Thickness 10.7 cm
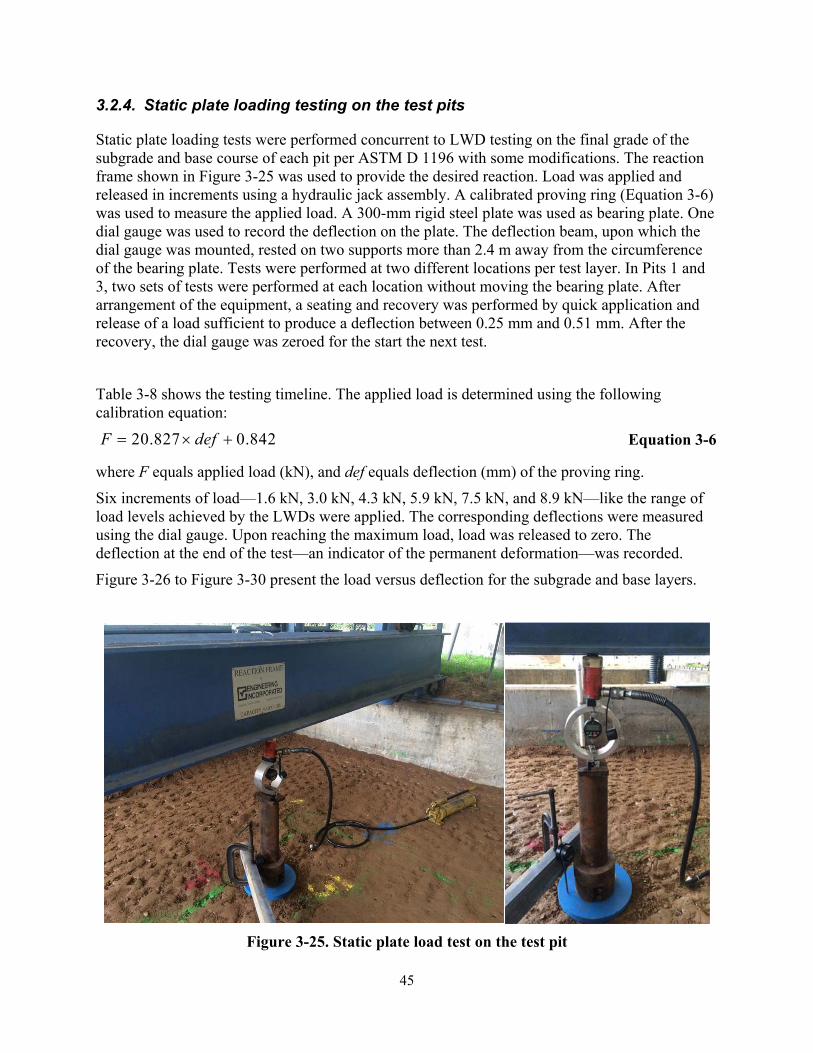
45
3.2.4. Static plate loading testing on the test pits
Static plate loading tests were performed concurrent to LWD testing on the final grade of the subgrade and base course of each pit per ASTM D 1196 with some modifications. The reaction frame shown in Figure 3-25 was used to provide the desired reaction. Load was applied and released in increments using a hydraulic jack assembly. A calibrated proving ring (Equation 3-6) was used to measure the applied load. A 300-mm rigid steel plate was used as bearing plate. One dial gauge was used to record the deflection on the plate. The deflection beam, upon which the dial gauge was mounted, rested on two supports more than 2.4 m away from the circumference of the bearing plate. Tests were performed at two different locations per test layer. In Pits 1 and 3, two sets of tests were performed at each location without moving the bearing plate. After arrangement of the equipment, a seating and recovery was performed by quick application and release of a load sufficient to produce a deflection between 0.25 mm and 0.51 mm. After the recovery, the dial gauge was zeroed for the start the next test.
Table 3-8 shows the testing timeline. The applied load is determined using the following calibration equation:
20.827 0.842F def u � Equation 3-6
where F equals applied load (kN), and def equals deflection (mm) of the proving ring.
Six increments of load—1.6 kN, 3.0 kN, 4.3 kN, 5.9 kN, 7.5 kN, and 8.9 kN—like the range of load levels achieved by the LWDs were applied. The corresponding deflections were measured using the dial gauge. Upon reaching the maximum load, load was released to zero. The deflection at the end of the test—an indicator of the permanent deformation—was recorded.
Figure 3-26 to Figure 3-30 present the load versus deflection for the subgrade and base layers.
Figure 3-25. Static plate load test on the test pit
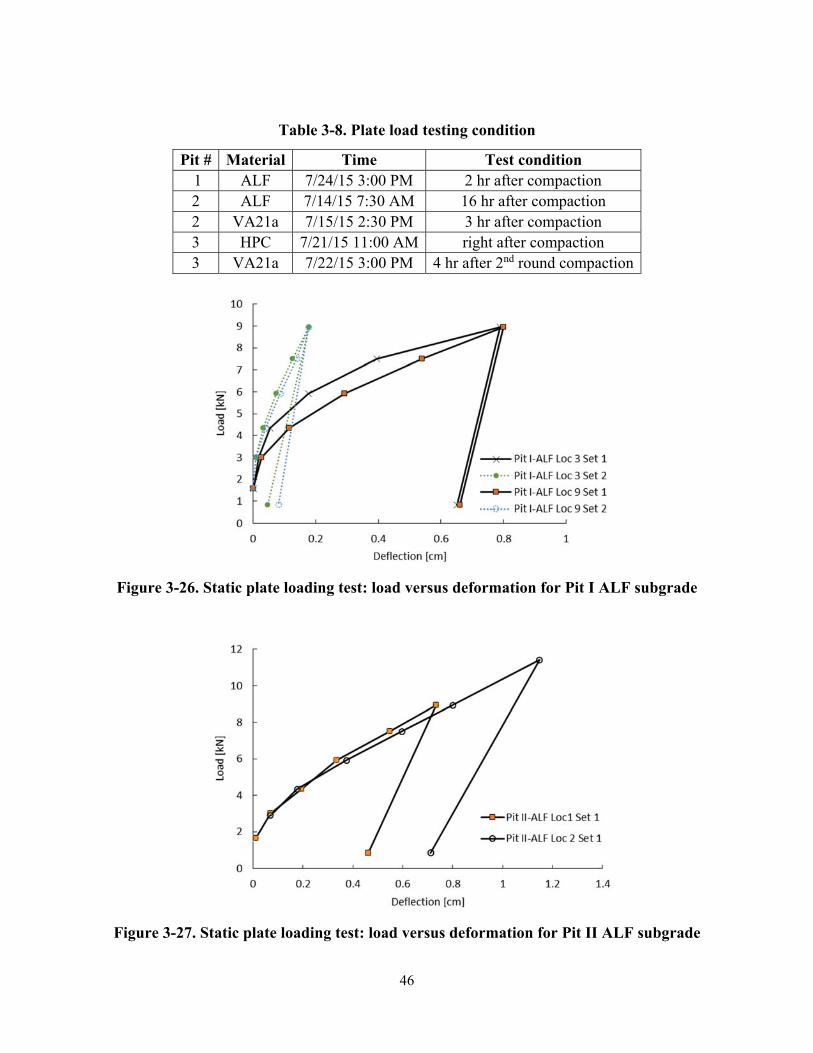
46
Table 3-8. Plate load testing condition
Pit # Material Time Test condition 1 ALF 7/24/15 3:00 PM 2 hr after compaction 2 ALF 7/14/15 7:30 AM 16 hr after compaction 2 VA21a 7/15/15 2:30 PM 3 hr after compaction 3 HPC 7/21/15 11:00 AM right after compaction 3 VA21a 7/22/15 3:00 PM 4 hr after 2nd round compaction
Figure 3-26. Static plate loading test: load versus deformation for Pit I ALF subgrade
Figure 3-27. Static plate loading test: load versus deformation for Pit II ALF subgrade
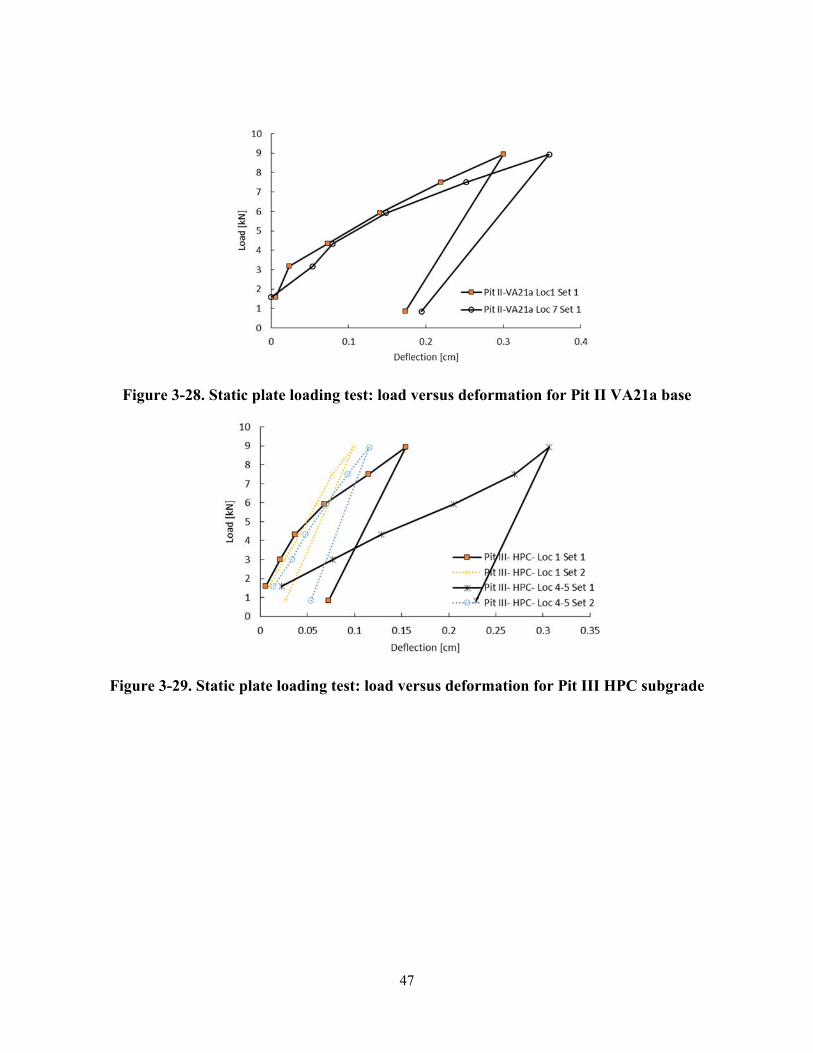
47
Figure 3-28. Static plate loading test: load versus deformation for Pit II VA21a base
Figure 3-29. Static plate loading test: load versus deformation for Pit III HPC subgrade
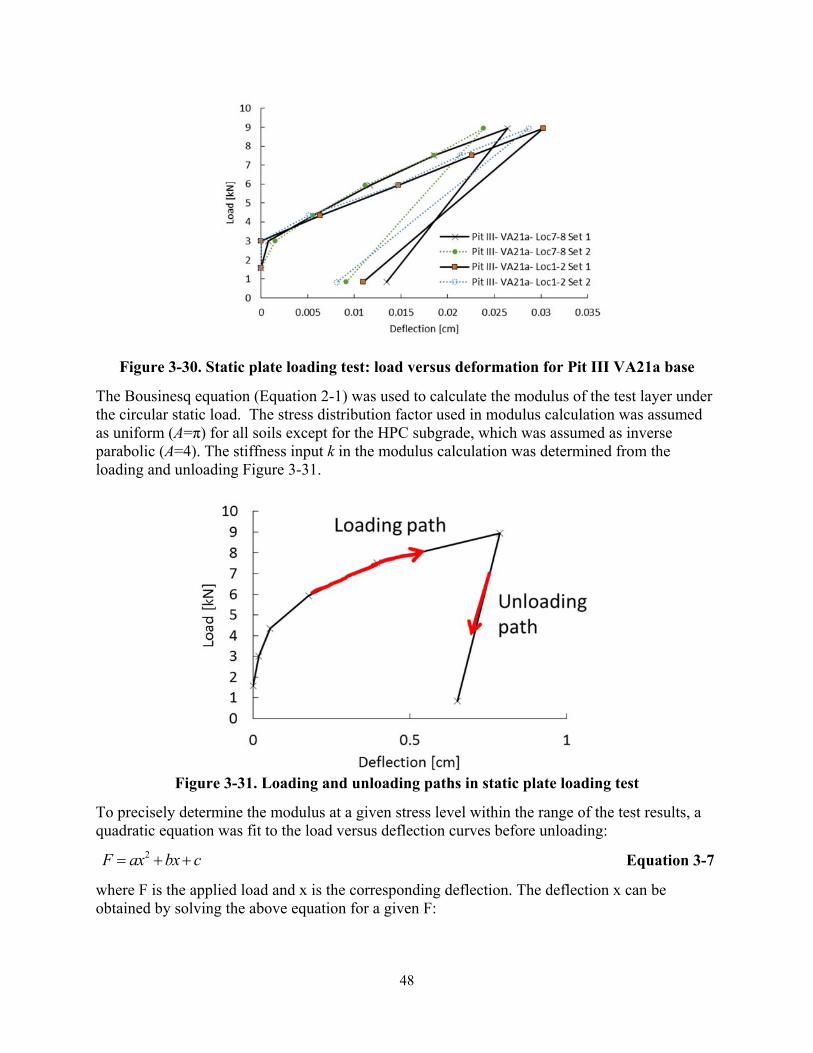
48
Figure 3-30. Static plate loading test: load versus deformation for Pit III VA21a base
The Bousinesq equation (Equation 2-1) was used to calculate the modulus of the test layer under the circular static load. The stress distribution factor used in modulus calculation was assumed as uniform (A=π) for all soils except for the HPC subgrade, which was assumed as inverse parabolic (A=4). The stiffness input k in the modulus calculation was determined from the loading and unloading Figure 3-31.
Figure 3-31. Loading and unloading paths in static plate loading test
To precisely determine the modulus at a given stress level within the range of the test results, a quadratic equation was fit to the load versus deflection curves before unloading:
2F ax bx c � � Equation 3-7
where F is the applied load and x is the corresponding deflection. The deflection x can be obtained by solving the above equation for a given F:
49
2 4 ( )2
b b a c Fx
a� � � �
Equation 3-8
Stiffness, k is determined by taking the differential of this equation:
2dFk ax bdx
� Equation 3-9
By substituting Equation 3-8 into Equation 3-9, k is obtained as a function of force, F.
2 4 ( )k b a c F � � Equation 3-10
The static modulus was then determined during loading at the 6.3 kN load equivalent to a 90 kPa average plate pressure (ES @ 90 kPa) and during unloading (ES-unload). The static plate loading test results including the permanent deformation at the end of the test (dP), resilient deflection (d-R), ES-unload, the coefficients and R2 of the quadratic fit, and ES @ 90 kPa are presented for each test location in Table 3-9. Table 3-10 provides the average loading and unloading moduli, the spatial COV of the test results, and the moisture content (MC) and PC (percentage compaction) of the associated test layer.
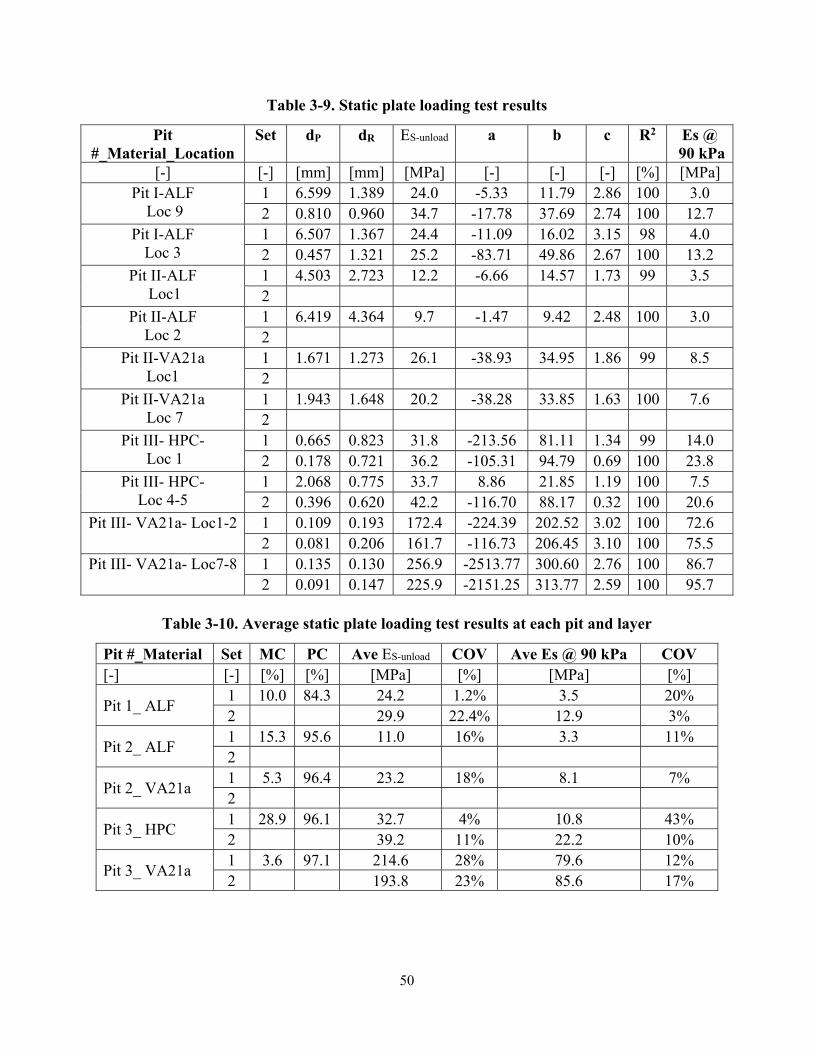
50
Table 3-9. Static plate loading test results
Pit #_Material_Location
Set dP dR ES-unload a b c R2 Es @ 90 kPa
[-] [-] [mm] [mm] [MPa] [-] [-] [-] [%] [MPa] Pit I-ALF
Loc 9 1 6.599 1.389 24.0 -5.33 11.79 2.86 100 3.0 2 0.810 0.960 34.7 -17.78 37.69 2.74 100 12.7
Pit I-ALF Loc 3
1 6.507 1.367 24.4 -11.09 16.02 3.15 98 4.0 2 0.457 1.321 25.2 -83.71 49.86 2.67 100 13.2
Pit II-ALF Loc1
1 4.503 2.723 12.2 -6.66 14.57 1.73 99 3.5 2
Pit II-ALF Loc 2
1 6.419 4.364 9.7 -1.47 9.42 2.48 100 3.0 2
Pit II-VA21a Loc1
1 1.671 1.273 26.1 -38.93 34.95 1.86 99 8.5 2
Pit II-VA21a Loc 7
1 1.943 1.648 20.2 -38.28 33.85 1.63 100 7.6 2
Pit III- HPC- Loc 1
1 0.665 0.823 31.8 -213.56 81.11 1.34 99 14.0 2 0.178 0.721 36.2 -105.31 94.79 0.69 100 23.8
Pit III- HPC- Loc 4-5
1 2.068 0.775 33.7 8.86 21.85 1.19 100 7.5 2 0.396 0.620 42.2 -116.70 88.17 0.32 100 20.6
Pit III- VA21a- Loc1-2 1 0.109 0.193 172.4 -224.39 202.52 3.02 100 72.6 2 0.081 0.206 161.7 -116.73 206.45 3.10 100 75.5
Pit III- VA21a- Loc7-8 1 0.135 0.130 256.9 -2513.77 300.60 2.76 100 86.7 2 0.091 0.147 225.9 -2151.25 313.77 2.59 100 95.7
Table 3-10. Average static plate loading test results at each pit and layer
Pit #_Material Set MC PC Ave ES-unload COV Ave Es @ 90 kPa COV [-] [-] [%] [%] [MPa] [%] [MPa] [%]
Pit 1_ ALF 1 10.0 84.3 24.2 1.2% 3.5 20% 2 29.9 22.4% 12.9 3%
Pit 2_ ALF 1 15.3 95.6 11.0 16% 3.3 11% 2
Pit 2_ VA21a 1 5.3 96.4 23.2 18% 8.1 7% 2
Pit 3_ HPC 1 28.9 96.1 32.7 4% 10.8 43% 2 39.2 11% 22.2 10%
Pit 3_ VA21a 1 3.6 97.1 214.6 28% 79.6 12% 2 193.8 23% 85.6 17%
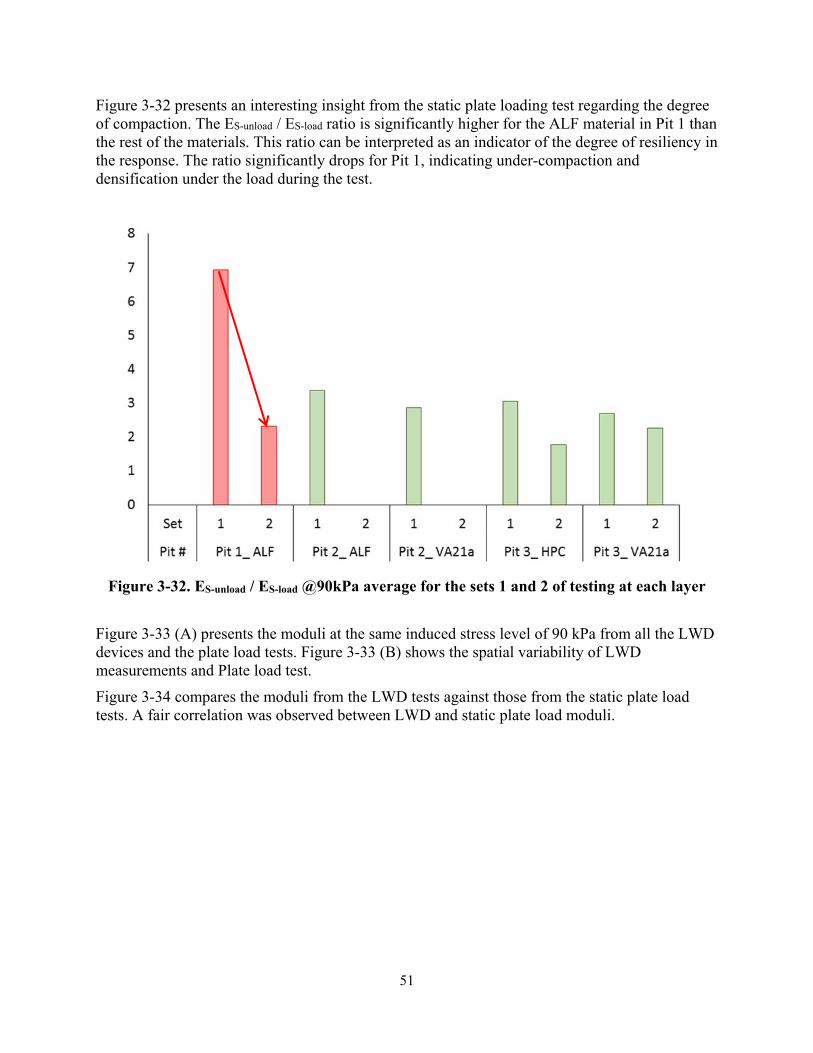
51
Figure 3-32 presents an interesting insight from the static plate loading test regarding the degree of compaction. The ES-unload / ES-load ratio is significantly higher for the ALF material in Pit 1 than the rest of the materials. This ratio can be interpreted as an indicator of the degree of resiliency in the response. The ratio significantly drops for Pit 1, indicating under-compaction and densification under the load during the test.
Figure 3-32. ES-unload / ES-load @90kPa average for the sets 1 and 2 of testing at each layer
Figure 3-33 (A) presents the moduli at the same induced stress level of 90 kPa from all the LWD devices and the plate load tests. Figure 3-33 (B) shows the spatial variability of LWD measurements and Plate load test.
Figure 3-34 compares the moduli from the LWD tests against those from the static plate load tests. A fair correlation was observed between LWD and static plate load moduli.
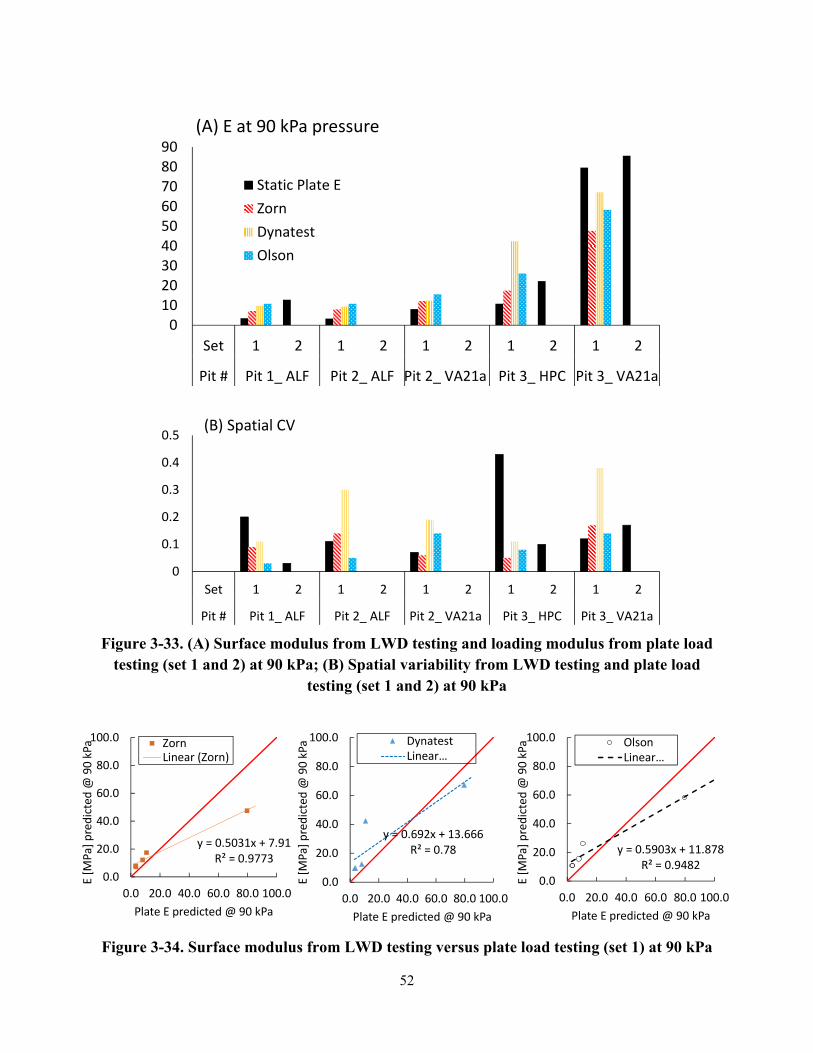
52
Figure 3-33. (A) Surface modulus from LWD testing and loading modulus from plate load
testing (set 1 and 2) at 90 kPa; (B) Spatial variability from LWD testing and plate load testing (set 1 and 2) at 90 kPa
Figure 3-34. Surface modulus from LWD testing versus plate load testing (set 1) at 90 kPa
0102030405060708090
Set 1 2 1 2 1 2 1 2 1 2
Pit # Pit 1_ ALF Pit 2_ ALF Pit 2_ VA21a Pit 3_ HPC Pit 3_ VA21a
(A) E at 90 kPa pressure
Static Plate EZornDynatestOlson
0
0.1
0.2
0.3
0.4
0.5
Set 1 2 1 2 1 2 1 2 1 2
Pit # Pit 1_ ALF Pit 2_ ALF Pit 2_ VA21a Pit 3_ HPC Pit 3_ VA21a
(B) Spatial CV
y = 0.5031x + 7.91R² = 0.9773
0.0
20.0
40.0
60.0
80.0
100.0
0.0 20.0 40.0 60.0 80.0 100.0
E [M
Pa] p
redicted
@ 90 kPa
Plate E predicted @ 90 kPa
ZornLinear (Zorn)
y = 0.692x + 13.666R² = 0.78
0.0
20.0
40.0
60.0
80.0
100.0
0.0 20.0 40.0 60.0 80.0 100.0
E [M
Pa] p
redicted
@ 90 kPa
Plate E predicted @ 90 kPa
DynatestLinear…
y = 0.5903x + 11.878R² = 0.9482
0.0
20.0
40.0
60.0
80.0
100.0
0.0 20.0 40.0 60.0 80.0 100.0
E [M
Pa] p
redicted
@ 90 kPa
Plate E predicted @ 90 kPa
OlsonLinear…
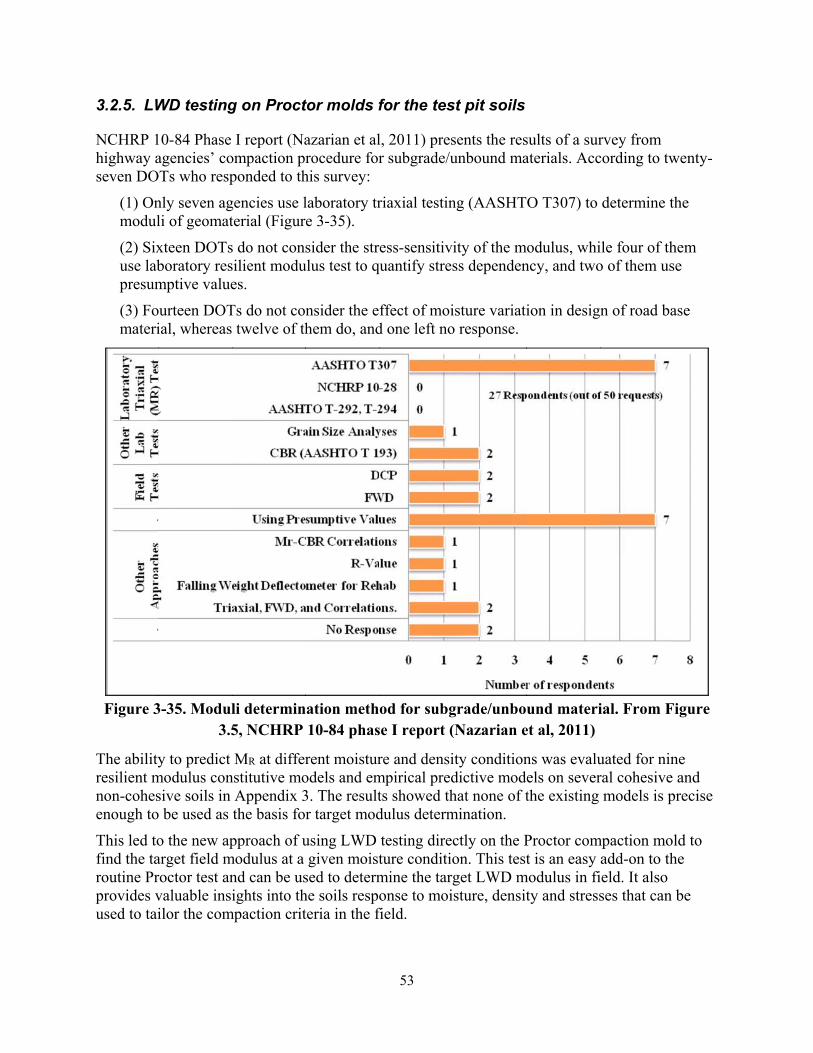
53
3.2.5. LWD testing on Proctor molds for the test pit soils
NCHRP 10-84 Phase I report (Nazarian et al, 2011) presents the results of a survey from highway agencies’ compaction procedure for subgrade/unbound materials. According to twenty-seven DOTs who responded to this survey:
(1) Only seven agencies use laboratory triaxial testing (AASHTO T307) to determine the moduli of geomaterial (Figure 3-35).
(2) Sixteen DOTs do not consider the stress-sensitivity of the modulus, while four of them use laboratory resilient modulus test to quantify stress dependency, and two of them use presumptive values.
(3) Fourteen DOTs do not consider the effect of moisture variation in design of road base material, whereas twelve of them do, and one left no response.
Figure 3-35. Moduli determination method for subgrade/unbound material. From Figure
3.5, NCHRP 10-84 phase I report (Nazarian et al, 2011)
The ability to predict MR at different moisture and density conditions was evaluated for nine resilient modulus constitutive models and empirical predictive models on several cohesive and non-cohesive soils in Appendix 3. The results showed that none of the existing models is precise enough to be used as the basis for target modulus determination.
This led to the new approach of using LWD testing directly on the Proctor compaction mold to find the target field modulus at a given moisture condition. This test is an easy add-on to the routine Proctor test and can be used to determine the target LWD modulus in field. It also provides valuable insights into the soils response to moisture, density and stresses that can be used to tailor the compaction criteria in the field.
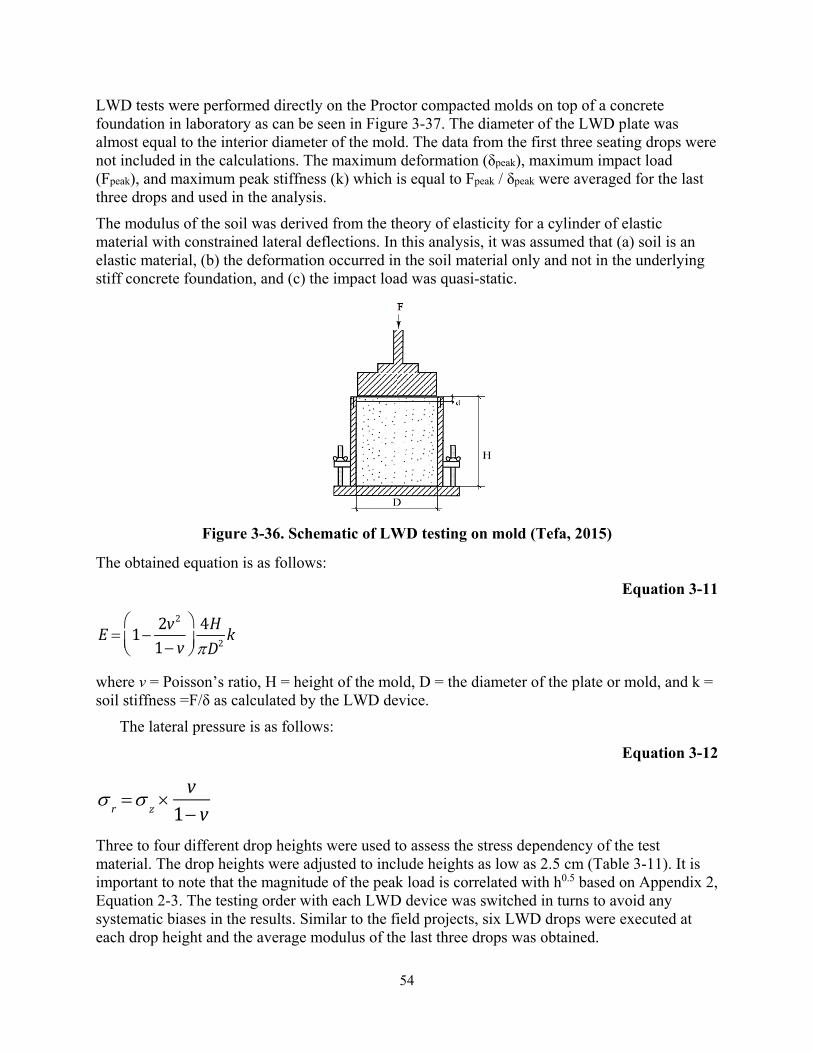
54
LWD tests were performed directly on the Proctor compacted molds on top of a concrete foundation in laboratory as can be seen in Figure 3-37. The diameter of the LWD plate was almost equal to the interior diameter of the mold. The data from the first three seating drops were not included in the calculations. The maximum deformation (δpeak), maximum impact load (Fpeak), and maximum peak stiffness (k) which is equal to Fpeak / δpeak were averaged for the last three drops and used in the analysis.
The modulus of the soil was derived from the theory of elasticity for a cylinder of elastic material with constrained lateral deflections. In this analysis, it was assumed that (a) soil is an elastic material, (b) the deformation occurred in the soil material only and not in the underlying stiff concrete foundation, and (c) the impact load was quasi-static.
Figure 3-36. Schematic of LWD testing on mold (Tefa, 2015)
The obtained equation is as follows:
Equation 3-11
where v = Poisson’s ratio, H = height of the mold, D = the diameter of the plate or mold, and k = soil stiffness =F/δ as calculated by the LWD device.
The lateral pressure is as follows:
Equation 3-12
Three to four different drop heights were used to assess the stress dependency of the test material. The drop heights were adjusted to include heights as low as 2.5 cm (Table 3-11). It is important to note that the magnitude of the peak load is correlated with h0.5 based on Appendix 2, Equation 2-3. The testing order with each LWD device was switched in turns to avoid any systematic biases in the results. Similar to the field projects, six LWD drops were executed at each drop height and the average modulus of the last three drops was obtained.
E 1� 2v21� v
§
©̈
·
¹̧4HSD2 k
V r V z uv
1� v
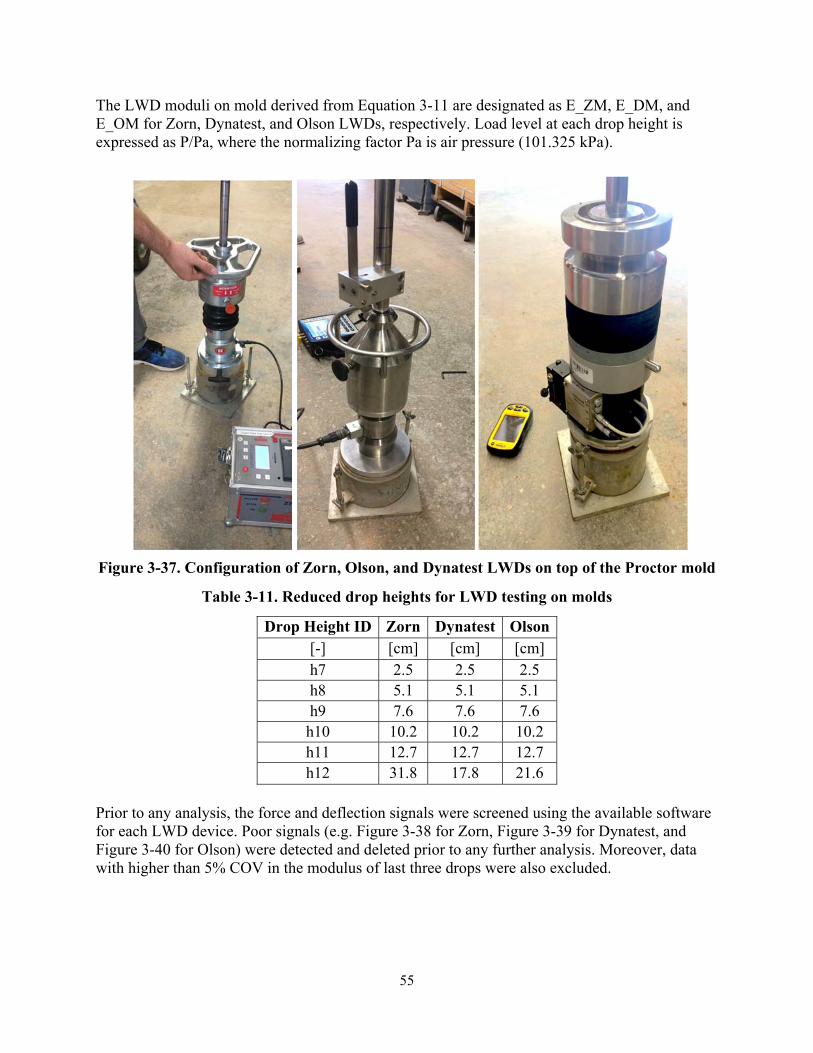
55
The LWD moduli on mold derived from Equation 3-11 are designated as E_ZM, E_DM, and E_OM for Zorn, Dynatest, and Olson LWDs, respectively. Load level at each drop height is expressed as P/Pa, where the normalizing factor Pa is air pressure (101.325 kPa).
Figure 3-37. Configuration of Zorn, Olson, and Dynatest LWDs on top of the Proctor mold
Table 3-11. Reduced drop heights for LWD testing on molds
Drop Height ID Zorn Dynatest Olson[-] [cm] [cm] [cm] h7 2.5 2.5 2.5 h8 5.1 5.1 5.1 h9 7.6 7.6 7.6
h10 10.2 10.2 10.2 h11 12.7 12.7 12.7 h12 31.8 17.8 21.6
Prior to any analysis, the force and deflection signals were screened using the available software for each LWD device. Poor signals (e.g. Figure 3-38 for Zorn, Figure 3-39 for Dynatest, and Figure 3-40 for Olson) were detected and deleted prior to any further analysis. Moreover, data with higher than 5% COV in the modulus of last three drops were also excluded.
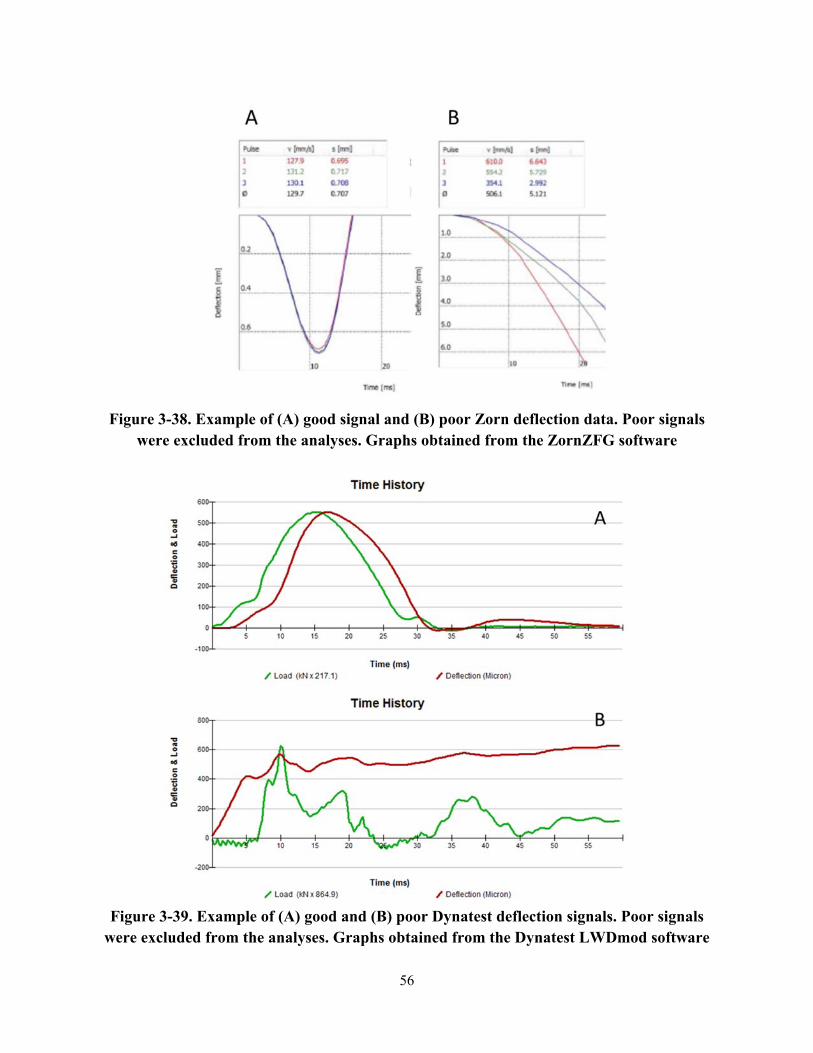
56
Figure 3-38. Example of (A) good signal and (B) poor Zorn deflection data. Poor signals
were excluded from the analyses. Graphs obtained from the ZornZFG software
Figure 3-39. Example of (A) good and (B) poor Dynatest deflection signals. Poor signals
were excluded from the analyses. Graphs obtained from the Dynatest LWDmod software
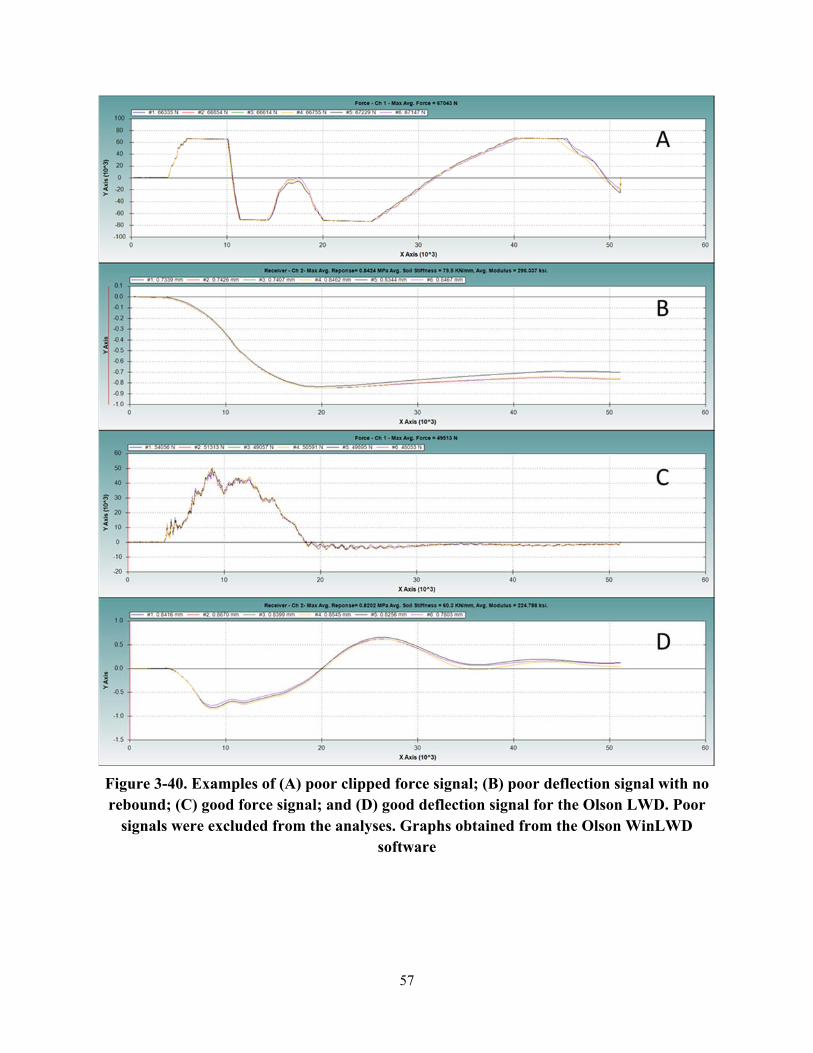
57
Figure 3-40. Examples of (A) poor clipped force signal; (B) poor deflection signal with no rebound; (C) good force signal; and (D) good deflection signal for the Olson LWD. Poor
signals were excluded from the analyses. Graphs obtained from the Olson WinLWD software
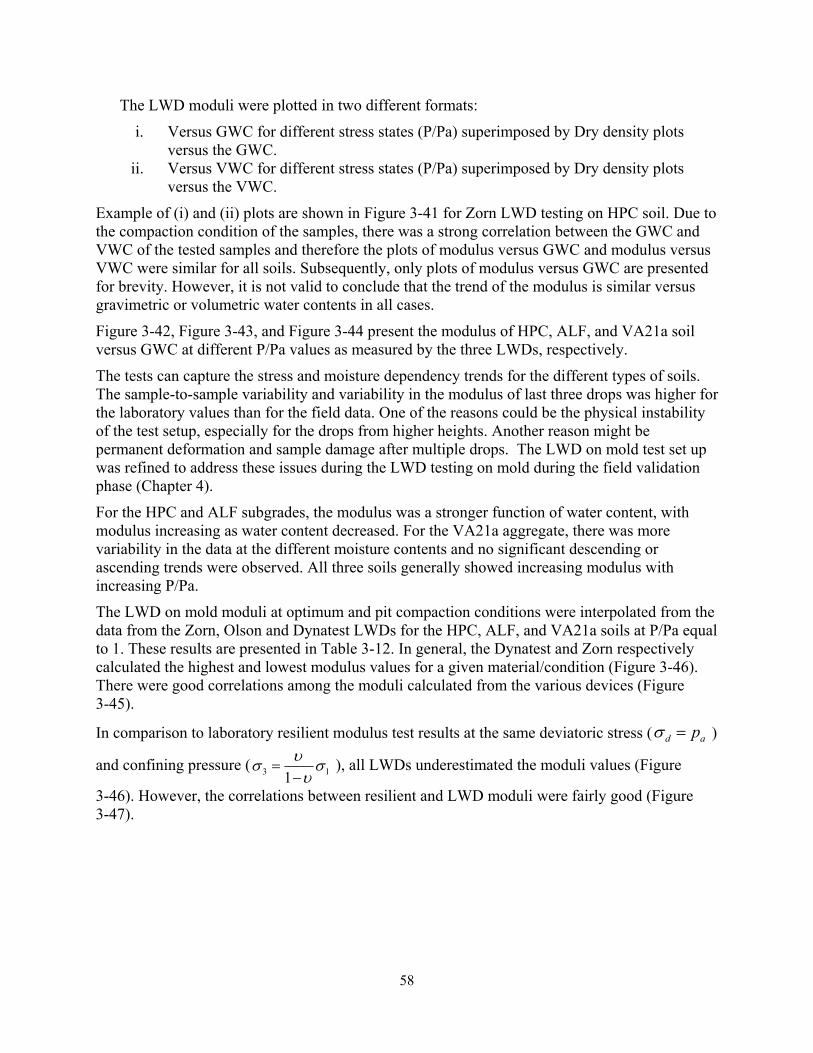
58
The LWD moduli were plotted in two different formats:
i. Versus GWC for different stress states (P/Pa) superimposed by Dry density plots versus the GWC.
ii. Versus VWC for different stress states (P/Pa) superimposed by Dry density plots versus the VWC.
Example of (i) and (ii) plots are shown in Figure 3-41 for Zorn LWD testing on HPC soil. Due to the compaction condition of the samples, there was a strong correlation between the GWC and VWC of the tested samples and therefore the plots of modulus versus GWC and modulus versus VWC were similar for all soils. Subsequently, only plots of modulus versus GWC are presented for brevity. However, it is not valid to conclude that the trend of the modulus is similar versus gravimetric or volumetric water contents in all cases.
Figure 3-42, Figure 3-43, and Figure 3-44 present the modulus of HPC, ALF, and VA21a soil versus GWC at different P/Pa values as measured by the three LWDs, respectively.
The tests can capture the stress and moisture dependency trends for the different types of soils. The sample-to-sample variability and variability in the modulus of last three drops was higher for the laboratory values than for the field data. One of the reasons could be the physical instability of the test setup, especially for the drops from higher heights. Another reason might be permanent deformation and sample damage after multiple drops. The LWD on mold test set up was refined to address these issues during the LWD testing on mold during the field validation phase (Chapter 4).
For the HPC and ALF subgrades, the modulus was a stronger function of water content, with modulus increasing as water content decreased. For the VA21a aggregate, there was more variability in the data at the different moisture contents and no significant descending or ascending trends were observed. All three soils generally showed increasing modulus with increasing P/Pa.
The LWD on mold moduli at optimum and pit compaction conditions were interpolated from the data from the Zorn, Olson and Dynatest LWDs for the HPC, ALF, and VA21a soils at P/Pa equal to 1. These results are presented in Table 3-12. In general, the Dynatest and Zorn respectively calculated the highest and lowest modulus values for a given material/condition (Figure 3-46). There were good correlations among the moduli calculated from the various devices (Figure 3-45).
In comparison to laboratory resilient modulus test results at the same deviatoric stress ( d apV )
and confining pressure ( 3 11XV VX
�
), all LWDs underestimated the moduli values (Figure
3-46). However, the correlations between resilient and LWD moduli were fairly good (Figure 3-47).
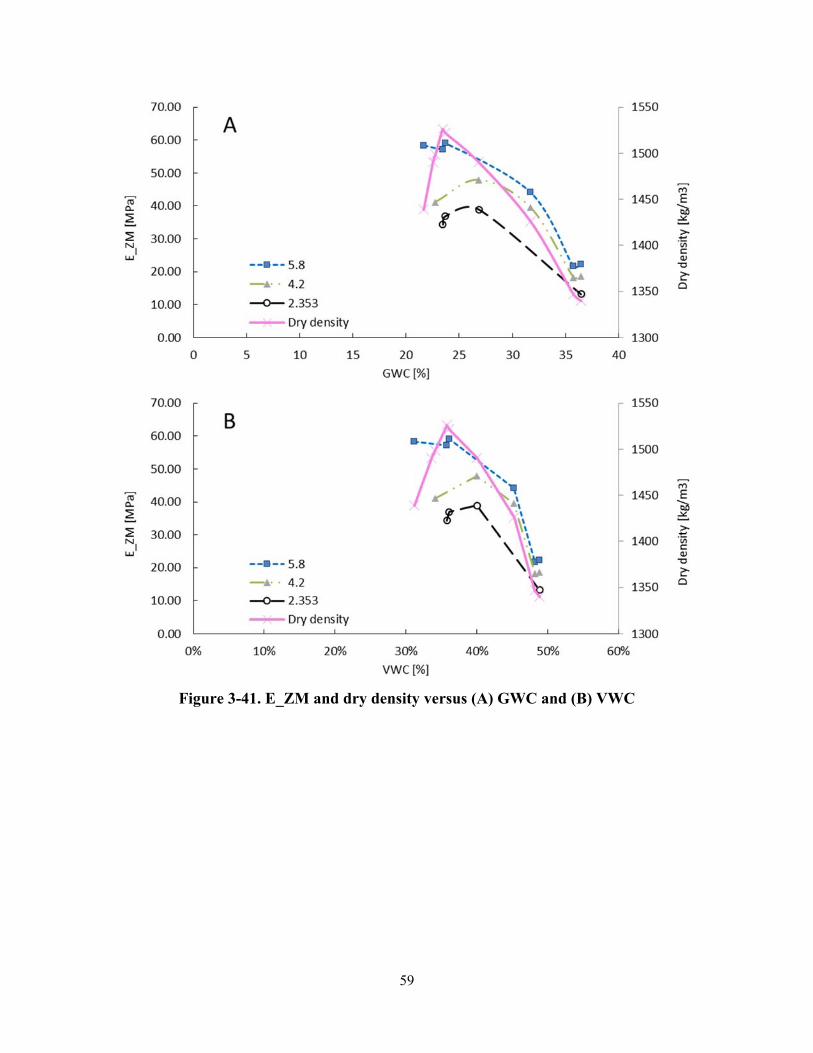
59
Figure 3-41. E_ZM and dry density versus (A) GWC and (B) VWC
60
Figure 3-42. LWD modulus on mold versus GWC and dry density versus GWC for the
HPC subgrade at diferent P/Pa values for (A) Zorn, (B) Olson, and (C) Dynatest LWDs. The legend specifies P/Pa
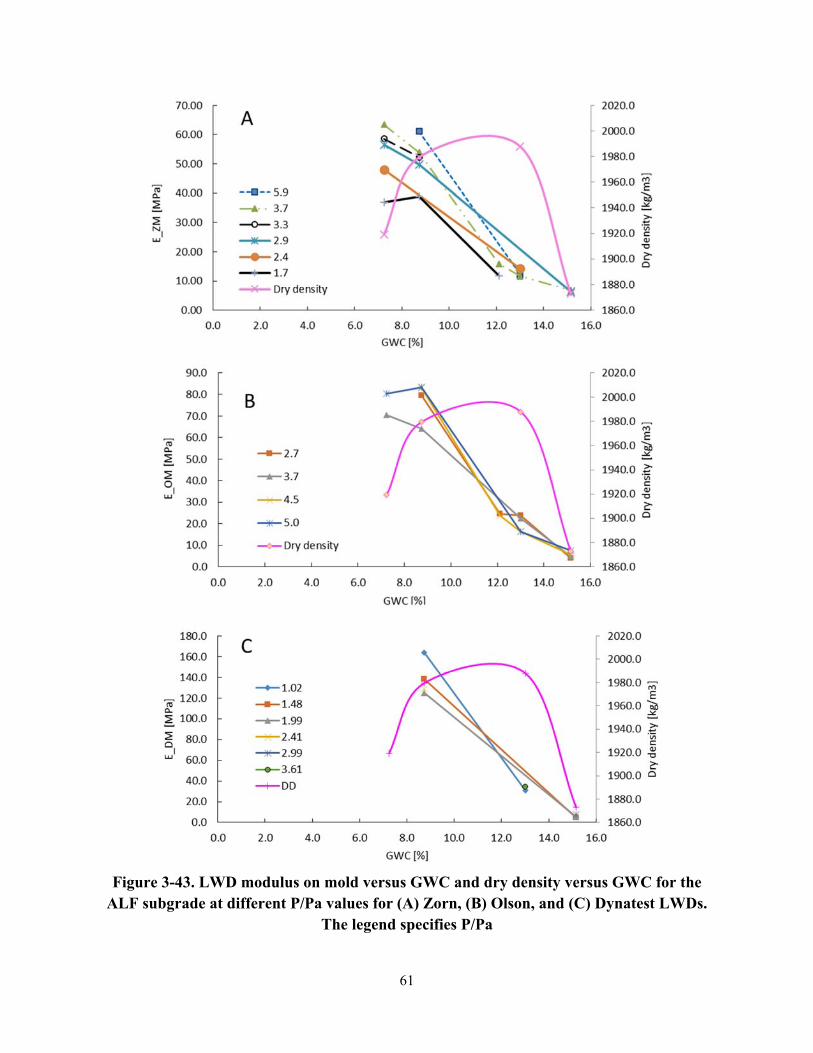
61
Figure 3-43. LWD modulus on mold versus GWC and dry density versus GWC for the
ALF subgrade at different P/Pa values for (A) Zorn, (B) Olson, and (C) Dynatest LWDs. The legend specifies P/Pa
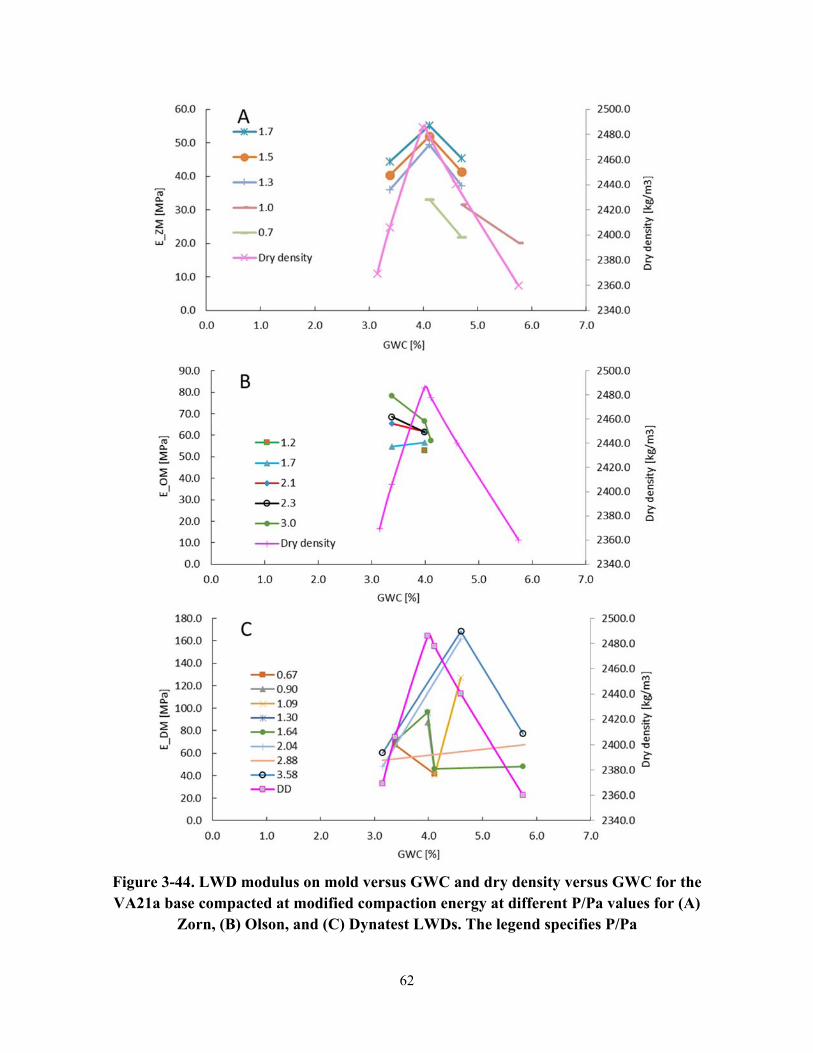
62
Figure 3-44. LWD modulus on mold versus GWC and dry density versus GWC for the VA21a base compacted at modified compaction energy at different P/Pa values for (A)
Zorn, (B) Olson, and (C) Dynatest LWDs. The legend specifies P/Pa
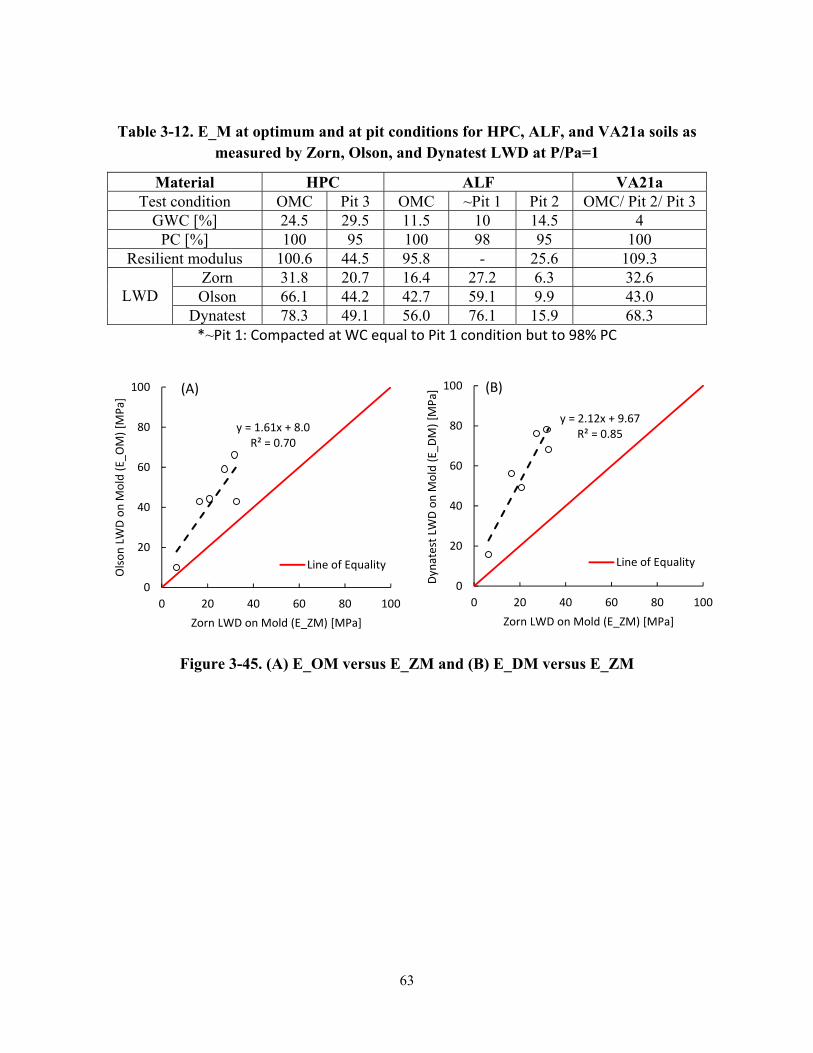
63
Table 3-12. E_M at optimum and at pit conditions for HPC, ALF, and VA21a soils as measured by Zorn, Olson, and Dynatest LWD at P/Pa=1
Material HPC ALF VA21a Test condition OMC Pit 3 OMC ~Pit 1 Pit 2 OMC/ Pit 2/ Pit 3
GWC [%] 24.5 29.5 11.5 10 14.5 4 PC [%] 100 95 100 98 95 100
Resilient modulus 100.6 44.5 95.8 - 25.6 109.3
LWD Zorn 31.8 20.7 16.4 27.2 6.3 32.6 Olson 66.1 44.2 42.7 59.1 9.9 43.0
Dynatest 78.3 49.1 56.0 76.1 15.9 68.3 *~Pit 1: Compacted at WC equal to Pit 1 condition but to 98% PC
Figure 3-45. (A) E_OM versus E_ZM and (B) E_DM versus E_ZM
y = 1.61x + 8.0R² = 0.70
0
20
40
60
80
100
0 20 40 60 80 100
Olso
n LW
D on
Mold (E_O
M) [MPa]
Zorn LWD on Mold (E_ZM) [MPa]
(A)
Line of Equality
y = 2.12x + 9.67R² = 0.85
0
20
40
60
80
100
0 20 40 60 80 100
Dynatest LWD on
Mold (E_D
M) [MPa]
Zorn LWD on Mold (E_ZM) [MPa]
(B)
Line of Equality
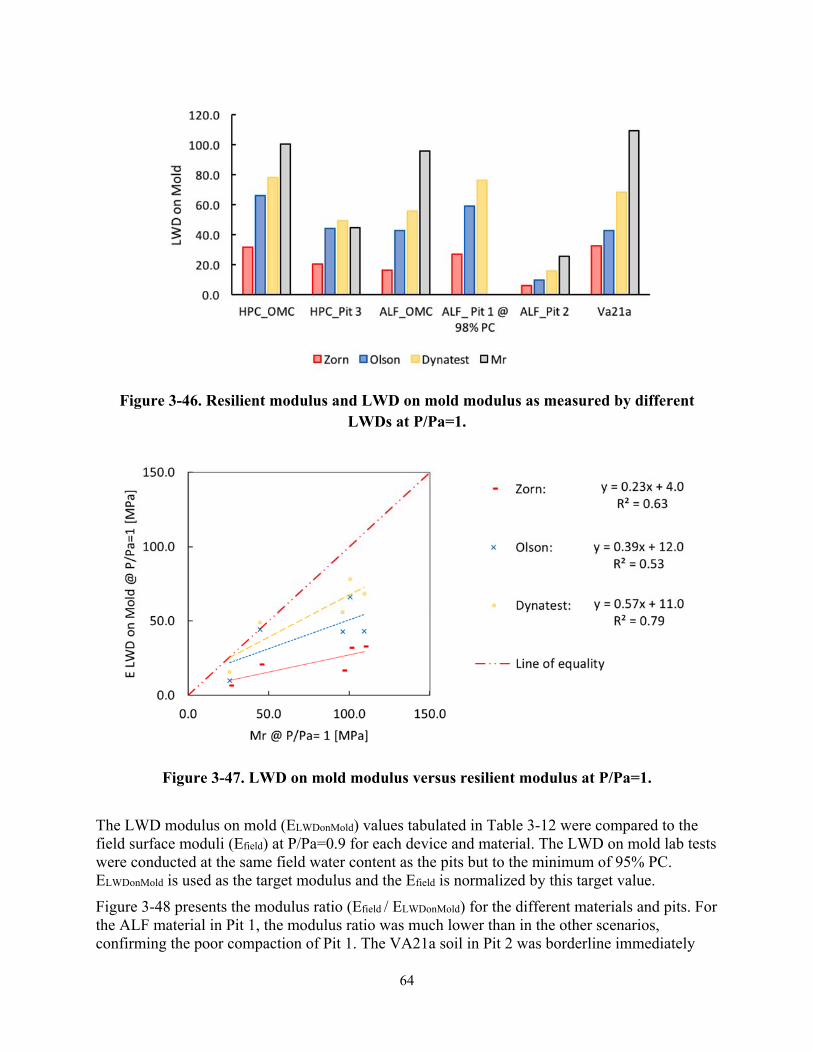
64
Figure 3-46. Resilient modulus and LWD on mold modulus as measured by different
LWDs at P/Pa=1.
Figure 3-47. LWD on mold modulus versus resilient modulus at P/Pa=1.
The LWD modulus on mold (ELWDonMold) values tabulated in Table 3-12 were compared to the field surface moduli (Efield) at P/Pa=0.9 for each device and material. The LWD on mold lab tests were conducted at the same field water content as the pits but to the minimum of 95% PC. ELWDonMold is used as the target modulus and the Efield is normalized by this target value.
Figure 3-48 presents the modulus ratio (Efield / ELWDonMold) for the different materials and pits. For the ALF material in Pit 1, the modulus ratio was much lower than in the other scenarios, confirming the poor compaction of Pit 1. The VA21a soil in Pit 2 was borderline immediately
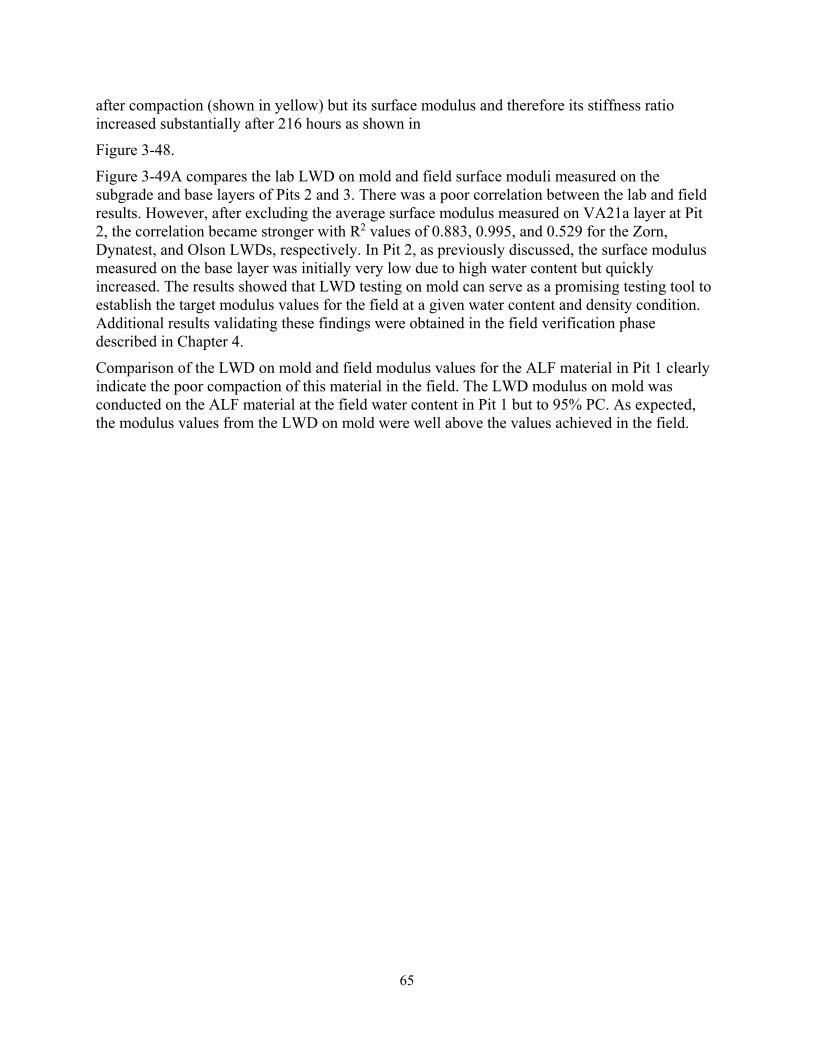
65
after compaction (shown in yellow) but its surface modulus and therefore its stiffness ratio increased substantially after 216 hours as shown in
Figure 3-48.
Figure 3-49A compares the lab LWD on mold and field surface moduli measured on the subgrade and base layers of Pits 2 and 3. There was a poor correlation between the lab and field results. However, after excluding the average surface modulus measured on VA21a layer at Pit 2, the correlation became stronger with R2 values of 0.883, 0.995, and 0.529 for the Zorn, Dynatest, and Olson LWDs, respectively. In Pit 2, as previously discussed, the surface modulus measured on the base layer was initially very low due to high water content but quickly increased. The results showed that LWD testing on mold can serve as a promising testing tool to establish the target modulus values for the field at a given water content and density condition. Additional results validating these findings were obtained in the field verification phase described in Chapter 4.
Comparison of the LWD on mold and field modulus values for the ALF material in Pit 1 clearly indicate the poor compaction of this material in the field. The LWD modulus on mold was conducted on the ALF material at the field water content in Pit 1 but to 95% PC. As expected, the modulus values from the LWD on mold were well above the values achieved in the field.
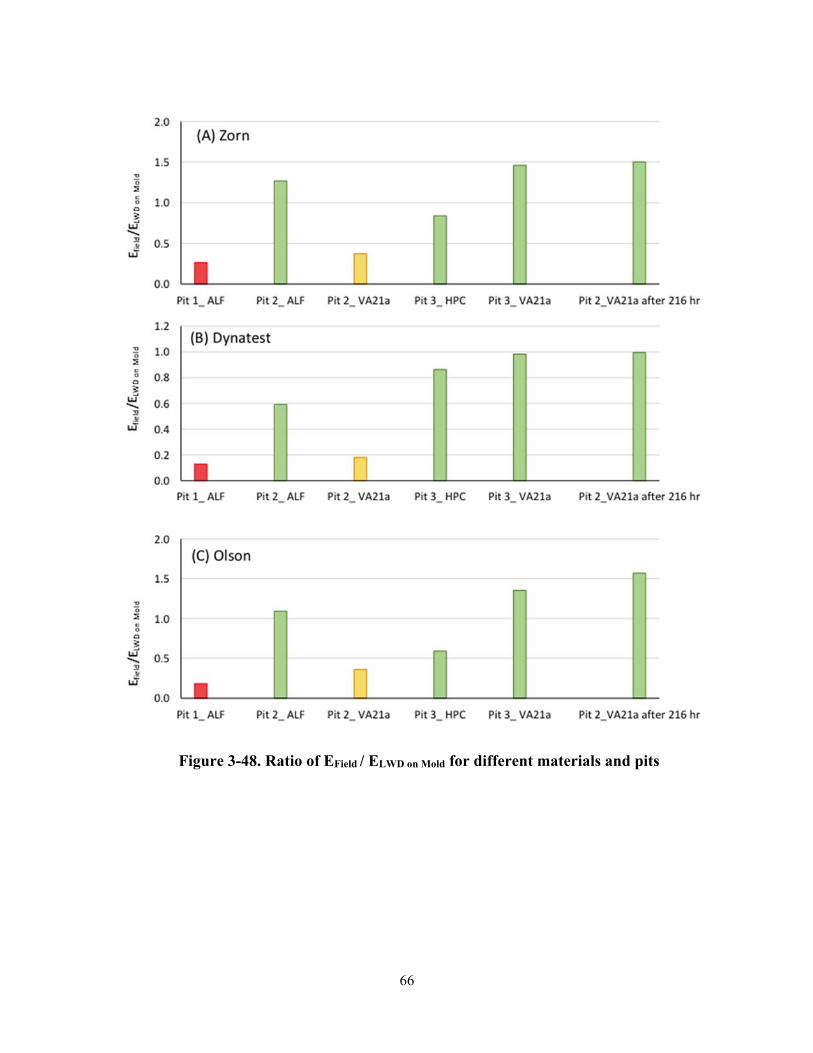
66
Figure 3-48. Ratio of EField / ELWD on Mold for different materials and pits
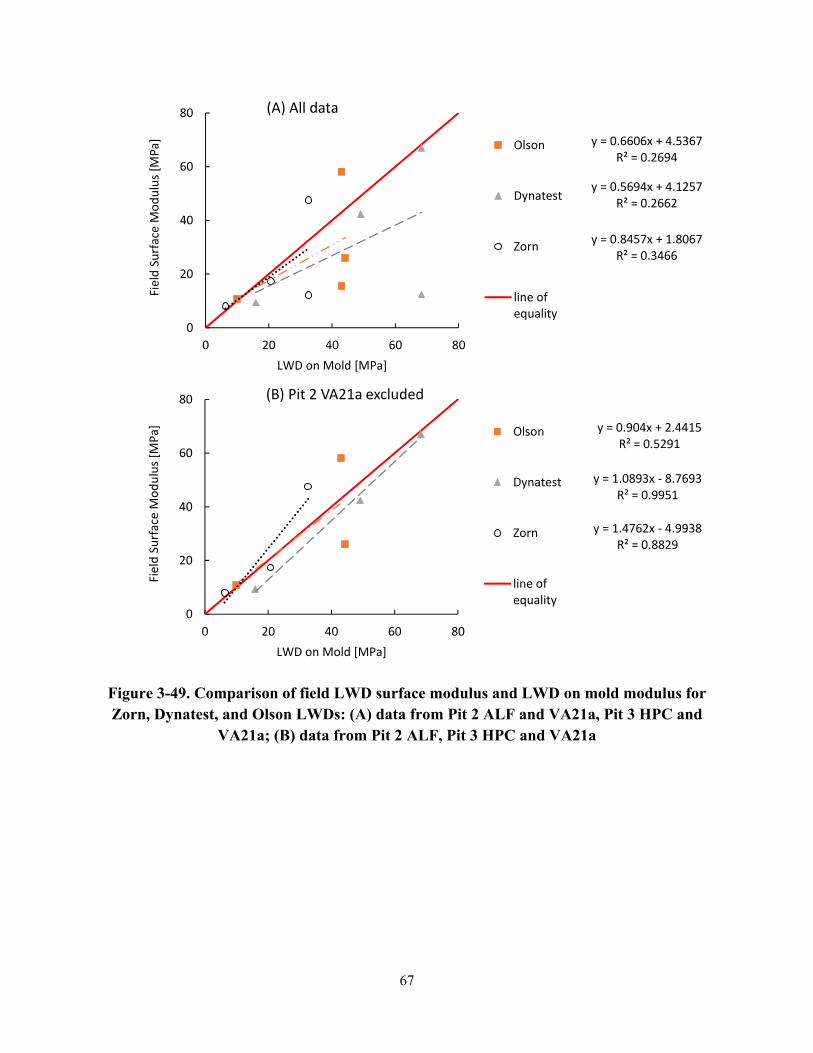
67
Figure 3-49. Comparison of field LWD surface modulus and LWD on mold modulus for Zorn, Dynatest, and Olson LWDs: (A) data from Pit 2 ALF and VA21a, Pit 3 HPC and
VA21a; (B) data from Pit 2 ALF, Pit 3 HPC and VA21a
y = 0.904x + 2.4415R² = 0.5291
y = 1.0893x ‐ 8.7693R² = 0.9951
y = 1.4762x ‐ 4.9938R² = 0.8829
0
20
40
60
80
0 20 40 60 80
Field Surface Mod
ulus [M
Pa]
LWD on Mold [MPa]
(B) Pit 2 VA21a excluded
Olson
Dynatest
Zorn
line ofequality
y = 0.6606x + 4.5367R² = 0.2694
y = 0.5694x + 4.1257R² = 0.2662
y = 0.8457x + 1.8067R² = 0.3466
0
20
40
60
80
0 20 40 60 80
Field Surface Mod
ulus [M
Pa]
LWD on Mold [MPa]
(A) All data
Olson
Dynatest
Zorn
line ofequality
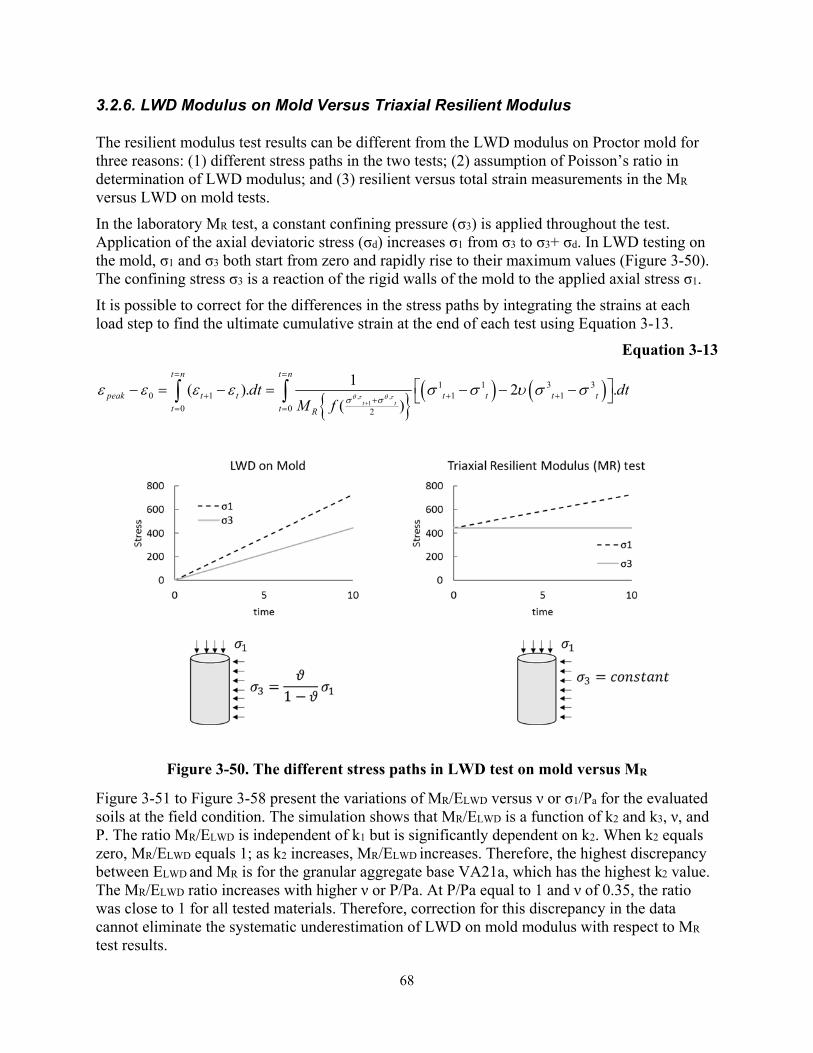
68
3.2.6. LWD Modulus on Mold Versus Triaxial Resilient Modulus
The resilient modulus test results can be different from the LWD modulus on Proctor mold for three reasons: (1) different stress paths in the two tests; (2) assumption of Poisson’s ratio in determination of LWD modulus; and (3) resilient versus total strain measurements in the MR
versus LWD on mold tests.
In the laboratory MR test, a constant confining pressure (σ3) is applied throughout the test. Application of the axial deviatoric stress (σd) increases σ1 from σ3 to σ3+ σd. In LWD testing on the mold, σ1 and σ3 both start from zero and rapidly rise to their maximum values (Figure 3-50). The confining stress σ3 is a reaction of the rigid walls of the mold to the applied axial stress σ1.
It is possible to correct for the differences in the stress paths by integrating the strains at each load step to find the ultimate cumulative strain at the end of each test using Equation 3-13.
Equation 3-13
^ ` � � � �, ,1
1 1 3 30 1 1 1
0 0 2
1( ). 2 .( )t t
t n t n
peak t t t t t tt t R
dt dtM f
T W T WV VH H H H V V X V V
�
� � ��
ª º� � � � �¬ ¼³ ³
Figure 3-50. The different stress paths in LWD test on mold versus MR
Figure 3-51 to Figure 3-58 present the variations of MR/ELWD versus ν or σ1/Pa for the evaluated soils at the field condition. The simulation shows that MR/ELWD is a function of k2 and k3, ν, and P. The ratio MR/ELWD is independent of k1 but is significantly dependent on k2. When k2 equals zero, MR/ELWD equals 1; as k2 increases, MR/ELWD increases. Therefore, the highest discrepancy between ELWD and MR is for the granular aggregate base VA21a, which has the highest k2 value. The MR/ELWD ratio increases with higher ν or P/Pa. At P/Pa equal to 1 and ν of 0.35, the ratio was close to 1 for all tested materials. Therefore, correction for this discrepancy in the data cannot eliminate the systematic underestimation of LWD on mold modulus with respect to MR test results.
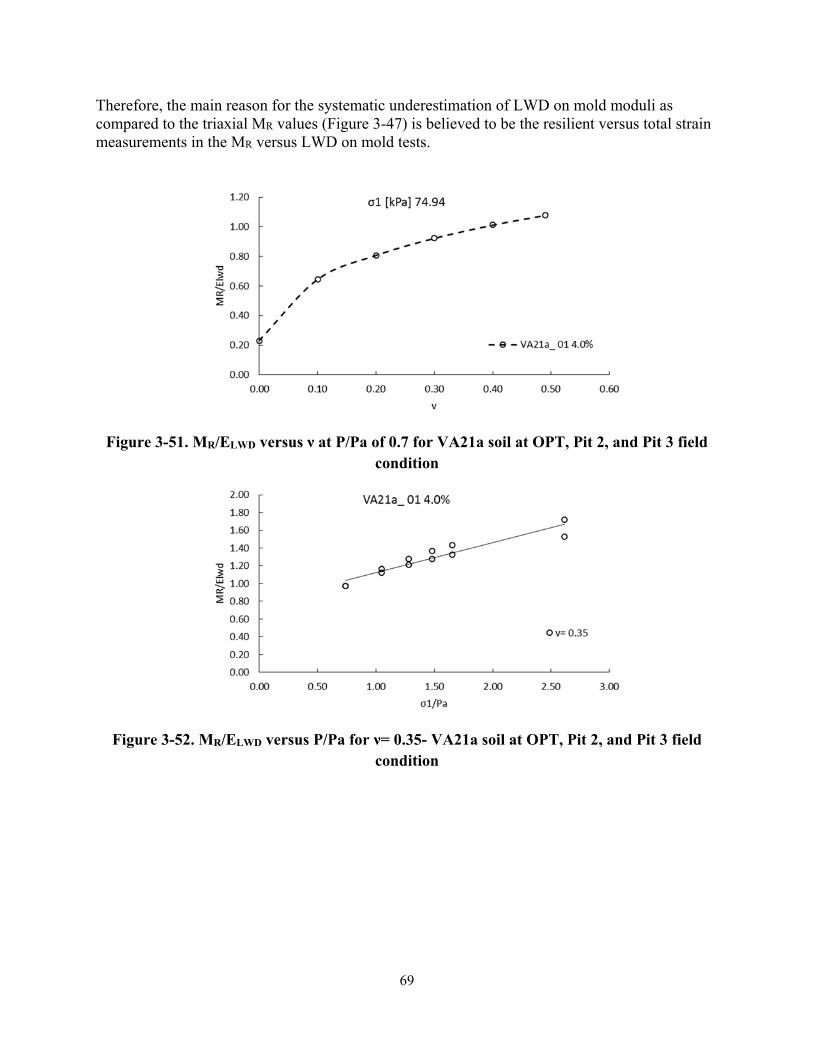
69
Therefore, the main reason for the systematic underestimation of LWD on mold moduli as compared to the triaxial MR values (Figure 3-47) is believed to be the resilient versus total strain measurements in the MR versus LWD on mold tests.
Figure 3-51. MR/ELWD versus ν at P/Pa of 0.7 for VA21a soil at OPT, Pit 2, and Pit 3 field
condition
Figure 3-52. MR/ELWD versus P/Pa for ν= 0.35- VA21a soil at OPT, Pit 2, and Pit 3 field
condition
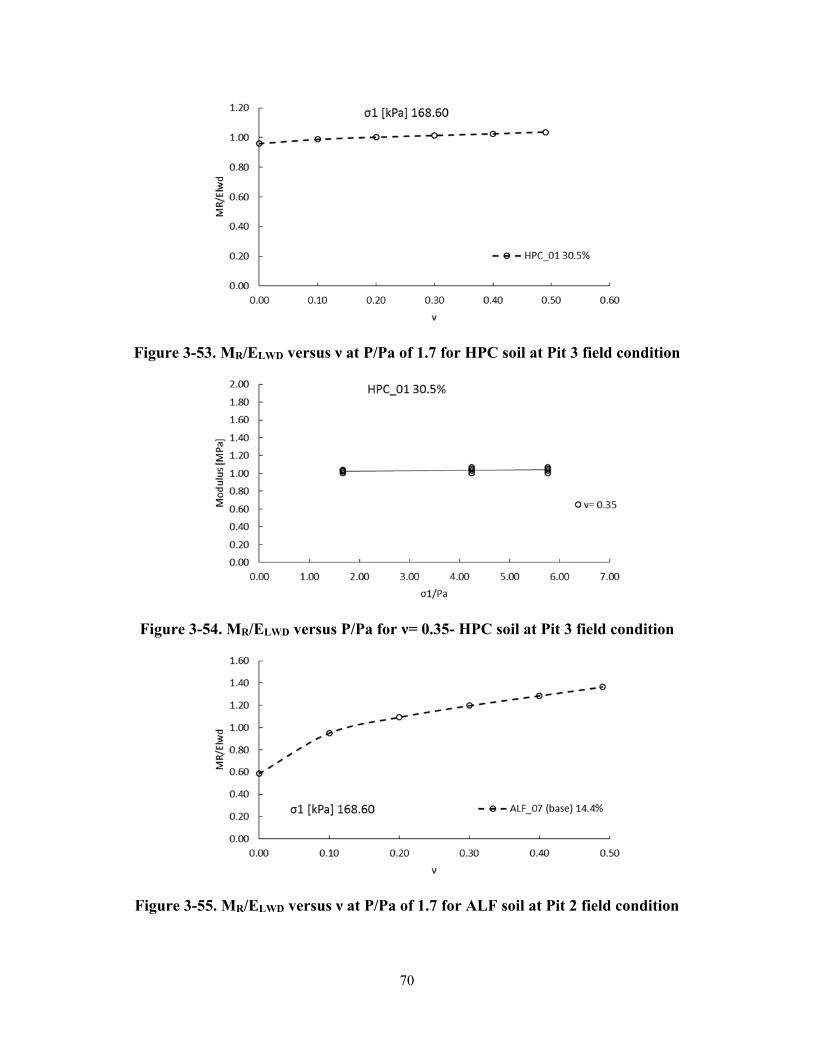
70
Figure 3-53. MR/ELWD versus ν at P/Pa of 1.7 for HPC soil at Pit 3 field condition
Figure 3-54. MR/ELWD versus P/Pa for ν= 0.35- HPC soil at Pit 3 field condition
Figure 3-55. MR/ELWD versus ν at P/Pa of 1.7 for ALF soil at Pit 2 field condition
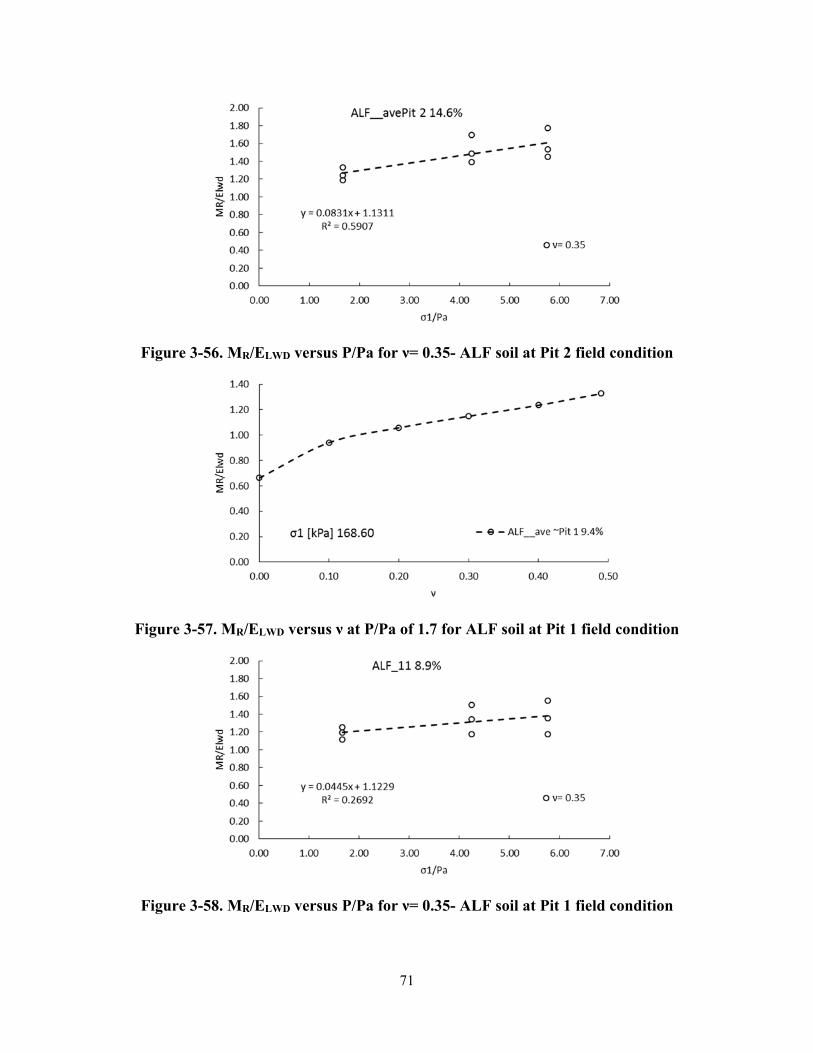
71
Figure 3-56. MR/ELWD versus P/Pa for ν= 0.35- ALF soil at Pit 2 field condition
Figure 3-57. MR/ELWD versus ν at P/Pa of 1.7 for ALF soil at Pit 1 field condition
Figure 3-58. MR/ELWD versus P/Pa for ν= 0.35- ALF soil at Pit 1 field condition
72
3.2.7. Conclusion In this chapter, the dynamic responses of three different LWDs were carefully studied through a unique large-scale controlled experimental setting. Samples were taken for moisture content measurements using the Ohaus MB45 moisture analyzer. Nuclear moisture-density measurements were also performed as the traditional quality check. The nuclear gauge results demonstrated a very uniform and homogeneous construction with less than a 4% coefficient of variation in the dry density in all the test pits. The nuclear gauge testing also confirmed that the target moisture and densities were achieved.
It was found that the Ohaus MB45 moisture analyzer is sufficiently accurate to replace nuclear gauge determination of moisture content. In addition, the Decagon GS1 volumetric water content sensor was found suitable for spot check testing of fine-grained soils in the field.
On the final lift of the subgrade or base layer in each pit, a complete set of stiffness tests were performed using the LWDs and static plate loading. The maximum load, maximum deflection, load vs. time, and deflection vs. time data were recorded, depending on device capabilities.
The LWD results showed that: (1) at the full drop height, the Dynatest LWD (with the intermediate buffer stiffness setting) induced the lowest stresses and the Olson LWD induced the highest stress levels; (2) the Dynatest surface modulus exhibited stress softening for all the evaluated soils while Zorn and Olson demonstrated stress hardening or an increase in modulus with increasing induced stress/drop height; (3) overall, the Dynatest LWD showed the highest spatial variability while the Olson LWD showed the highest variability in the last three drops while tested in one spot.
Static plate load testing was performed concurrent to LWD testing. Results showed a strong correlation between the modulus values measured in the static plate loading test with the values measured by the LWDs with R2 values of 0.88, 0.99, and 0.97 for Dynatest, Zorn, and Olson LWD, respectively. Overall, the LWDs over predicted the modulus relative to the static plate loading value except for the case of the base layer in Pit 3.
Additional material was collected for routine and advanced tests in the laboratory including moisture-density relations, resilient modulus test at optimum and field conditions, and LWD testing on top of the Proctor compaction mold.
Resilient modulus testing was performed on the material compacted at optimum condition as well as at the field construction condition. Material constitutive models rooted in unsaturated soil mechanics were evaluated on several cohesive and non-cohesive soils to test their suitability for LWD based QA work. The results showed that none of the existing models is accurate enough to be used as the basis for target modulus determination. This led to the new approach of using LWD testing directly on the Proctor compaction mold to find the target field modulus at a given moisture condition.
The LWD testing on mold is an easy add-on to the routine Proctor test. The benefits of the test despite its higher variability are significant. The summary of these benefits is as followed:
(1) The test provides valuable insights into the soils response to moisture, density and stresses that can be used to tailor the compaction criteria in field. The HPC subgrade soil showed an increase in modulus with decrease in moisture up to a point (lower than OMC), after which the modulus declined. The ALF subgrade soil, on the other hand, exhibited a
73
continuous increase in modulus with decreasing moisture content. The VA21a granular base material did not demonstrate a clear trend with changes in moisture.
(2) A strong correlation with laboratory resilient modulus test was found from the results. MR values at the same stress levels were higher that LWD testing on mold mainly due to the assumptions of Poisson's ratio. However, the correlation was strong with R2 values of 0.89, 0.79, and 0.73 for Dynatest, Zorn, and Olson LWD, respectively.
(3) The most important benefit gained from the test is to find the target field modulus at a given moisture and density condition. The LWD on mold moduli were interpolated at the appropriate applied stress level and compaction water content of the pits to establish the target LWD modulus. This target modulus was compared to the actual surface modulus achieved in the field. The test can detect the poor compaction of Pit 1 with field moduli much lower than the target modulus and relatively lower modulus ratios (Efield/ELWDonMold). There was a strong correlation between the lab and field moduli values for the three LWD devices in Pit 2 and Pit 3, which had acceptable compaction, except for the initial modulus of the V21a base in Pit 2, which had excessive water content. After excluding the Pit 2 base initial modulus, high R2 values of 1, 0.94, and 0.73 were achieved for the Dynatest, Zorn, and Olson LWDs, respectively. Surface modulus on base of Pit 2 stiffened considerable after compaction. These results all showed the potential benefit of the laboratory LWD test on mold in identifying the field target modulus.
The new approach of using LWD testing on the mold to find the target LWD modulus for the field at a given compaction moisture and density was encouraging, showing a strong correlation between the LWD testing on mold and field moduli at P/Pa of 0.9. Further testing to validate this approach was performed subsequently in the field verification phase (Chapter 4). Overall, this unique large-scale controlled condition experiment provides an excellent high quality resource of field and comprehensive laboratory data, which can serve the future researchers on route to find a rigorous, theoretically sound and straightforward technique for standardizing the LWD measurements for construction QA of unbound pavement materials.
74
Chapter 4
4. FIELD VERIFICATION
4.1. Introduction
Field evaluations and associated laboratory testing was performed for verification of the proposed test equipment and methodology. The objectives of this task include:
(1) Assessment of the practicality and repeatability of the test devices in actual construction practice.
(2) Estimation of the spatial variability of moisture, density, and modulus using the proposed devices and methods.
(3) Validation of the LWD on mold method of target modulus determination under actual field conditions.
(4) Final refinement of a practical QA procedure. �
Based on the outcome of large scale test pit trials, field and laboratory testing were designed at each site including the following tasks:
x Sampling of subgrade and/or base materials for laboratory determination of gradation, plasticity, soil classification, and compacted moisture-density relationship.
x Recording of weather history and soil surface temperature during the construction. x Measurement of in-situ compaction moisture content using portable moisture analyzer. x Measurement of in-situ density and moisture content of the subgrade and/or base material
at 5 to 10 feet intervals using NDG (if available on site) to establish the spatial variability.
x LWD testing at 5 to 10 feet intervals according to the testing plan (Figure 4-1) to establish the spatial variability of the subgrade or base.
x Repeat LWD and NDG tests at 1 and 2 hour intervals (if possible) to capture the effect of drying after compaction.
x Moisture measurements will be accompanied by sampling from the same locations for subsequent laboratory moisture determination.
Details of the investigation program were tailored to the specific conditions at each site. The most important objective of this task is to find the target modulus at the given field moisture and stress state. The LWD on mold tests were performed on the soil samples collected from each test site. Then the target moduli were extrapolated at the corresponding field water content and plate pressure.
The target moduli were compared to the field surface moduli by calculating the Efield/Etarget ratios. For sites at which NDG measurements were available, percent compaction was used as a reference for the quality of compaction and compared to the field to target modulus ratios.
75
4.2. Evaluated Field Projects
The test sites were selected in consultation with the Technical Advisory Committee with the intention of spanning a range of subgrade and base geomaterials having various gradations, plasticity indexes, and moisture characteristics. Unfortunately, the final set of available sites included very few fine-grained subgrade soils. Table 4-1 summarizes the test sites locations, soil types, and classifications. Basic soil parameters, Atterberg limits, soil gradations, and project descriptions are provided in Appendix 4. The test sites will be referenced by their state location name and soil type in this report.
Each site was between approximately 50-200 feet long. Figure 4-1 shows the plan of testing locations. Each compacted lane was divided into 3 sub-lanes and LWD tests were performed in the middle of the sub-lane at 5 to 10 feet intervals. LWD plates were placed at adjacent locations to avoid overlapping.
Geological information for each site was provided by the respective participating agency. The following equipment was used at each site, depending upon availability:
x Zorn LWD x Dynatest LWD x Olson LWD x Nuclear Density Gauge (Troxler 3440 Moisture-Density Gauge) x Kestrel 4300 Construction Weather Tracker x Fluke Infrared Thermometer x Ohaus MB45 Moisture Analyzer
The weather conditions for wind speed, air temperature, humidity and evaporation rate were recorded using the Kestrel weather tracker during the testing at each site. Additionally, the soil surface temperature was measured using the Fluke infrared thermometer at various random locations (Figure 4-2). Table 4-2 presents the average values for the soil surface temperature and weather data.
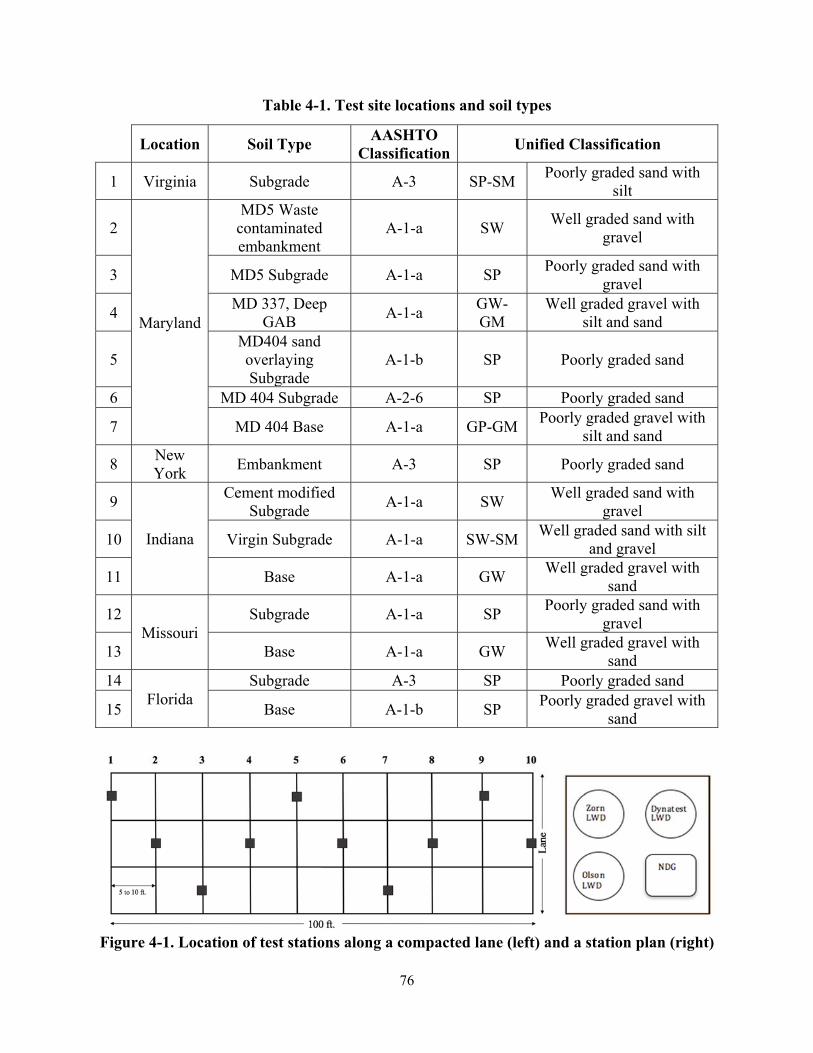
76
Table 4-1. Test site locations and soil types
Location Soil Type AASHTO Classification Unified Classification
1 Virginia Subgrade A-3 SP-SM Poorly graded sand with silt
2
Maryland
MD5 Waste contaminated embankment
A-1-a SW Well graded sand with gravel
3 MD5 Subgrade A-1-a SP Poorly graded sand with gravel
4 MD 337, Deep GAB A-1-a GW-
GM Well graded gravel with
silt and sand
5 MD404 sand overlaying Subgrade
A-1-b SP Poorly graded sand
6 MD 404 Subgrade A-2-6 SP Poorly graded sand
7 MD 404 Base A-1-a GP-GM Poorly graded gravel with silt and sand
8 New York Embankment A-3 SP Poorly graded sand
9
Indiana
Cement modified Subgrade A-1-a SW Well graded sand with
gravel
10 Virgin Subgrade A-1-a SW-SM Well graded sand with silt and gravel
11 Base A-1-a GW Well graded gravel with sand
12 Missouri
Subgrade A-1-a SP Poorly graded sand with gravel
13 Base A-1-a GW Well graded gravel with sand
14 Florida
Subgrade A-3 SP Poorly graded sand
15 Base A-1-b SP Poorly graded gravel with sand
Figure 4-1. Location of test stations along a compacted lane (left) and a station plan (right)
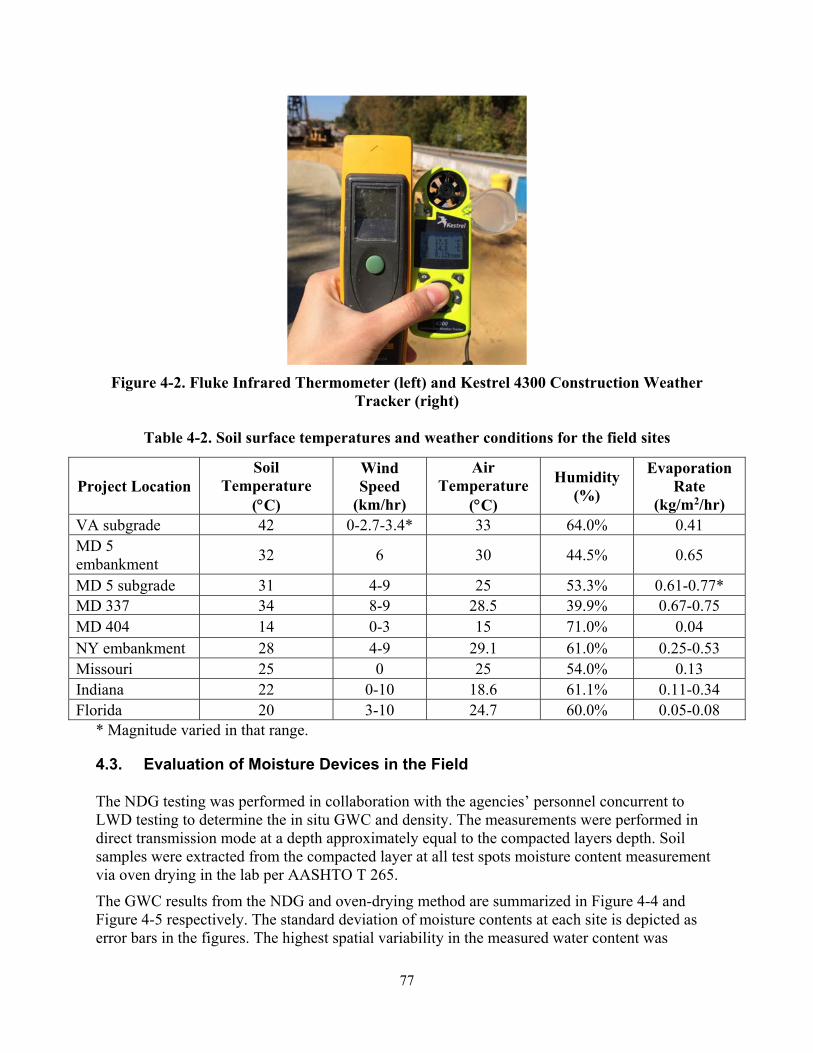
77
Figure 4-2. Fluke Infrared Thermometer (left) and Kestrel 4300 Construction Weather
Tracker (right)
Table 4-2. Soil surface temperatures and weather conditions for the field sites
Project Location Soil
Temperature (qC)
Wind Speed
(km/hr)
Air Temperature
(qC)
Humidity (%)
Evaporation Rate
(kg/m2/hr) VA subgrade 42 0-2.7-3.4* 33 64.0% 0.41 MD 5 embankment 32 6 30 44.5% 0.65
MD 5 subgrade 31 4-9 25 53.3% 0.61-0.77* MD 337 34 8-9 28.5 39.9% 0.67-0.75MD 404 14 0-3 15 71.0% 0.04 NY embankment 28 4-9 29.1 61.0% 0.25-0.53 Missouri 25 0 25 54.0% 0.13 Indiana 22 0-10 18.6 61.1% 0.11-0.34 Florida 20 3-10 24.7 60.0% 0.05-0.08
* Magnitude varied in that range.
4.3. Evaluation of Moisture Devices in the Field
The NDG testing was performed in collaboration with the agencies’ personnel concurrent to LWD testing to determine the in situ GWC and density. The measurements were performed in direct transmission mode at a depth approximately equal to the compacted layers depth. Soil samples were extracted from the compacted layer at all test spots moisture content measurement via oven drying in the lab per AASHTO T 265.
The GWC results from the NDG and oven-drying method are summarized in Figure 4-4 and Figure 4-5 respectively. The standard deviation of moisture contents at each site is depicted as error bars in the figures. The highest spatial variability in the measured water content was
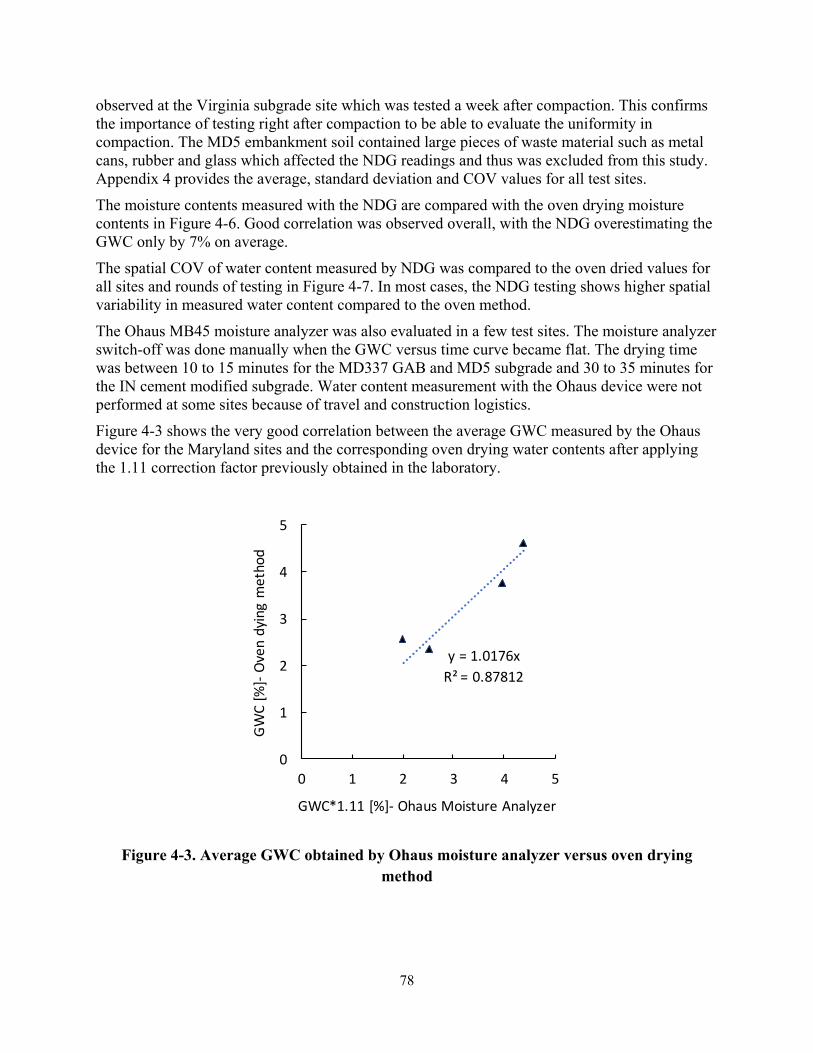
78
observed at the Virginia subgrade site which was tested a week after compaction. This confirms the importance of testing right after compaction to be able to evaluate the uniformity in compaction. The MD5 embankment soil contained large pieces of waste material such as metal cans, rubber and glass which affected the NDG readings and thus was excluded from this study. Appendix 4 provides the average, standard deviation and COV values for all test sites.
The moisture contents measured with the NDG are compared with the oven drying moisture contents in Figure 4-6. Good correlation was observed overall, with the NDG overestimating the GWC only by 7% on average.
The spatial COV of water content measured by NDG was compared to the oven dried values for all sites and rounds of testing in Figure 4-7. In most cases, the NDG testing shows higher spatial variability in measured water content compared to the oven method.
The Ohaus MB45 moisture analyzer was also evaluated in a few test sites. The moisture analyzer switch-off was done manually when the GWC versus time curve became flat. The drying time was between 10 to 15 minutes for the MD337 GAB and MD5 subgrade and 30 to 35 minutes for the IN cement modified subgrade. Water content measurement with the Ohaus device were not performed at some sites because of travel and construction logistics.
Figure 4-3 shows the very good correlation between the average GWC measured by the Ohaus device for the Maryland sites and the corresponding oven drying water contents after applying the 1.11 correction factor previously obtained in the laboratory.
Figure 4-3. Average GWC obtained by Ohaus moisture analyzer versus oven drying method
y = 1.0176xR² = 0.87812
0
1
2
3
4
5
0 1 2 3 4 5
GWC [%]‐Oven dying method
GWC*1.11 [%]‐ Ohaus Moisture Analyzer
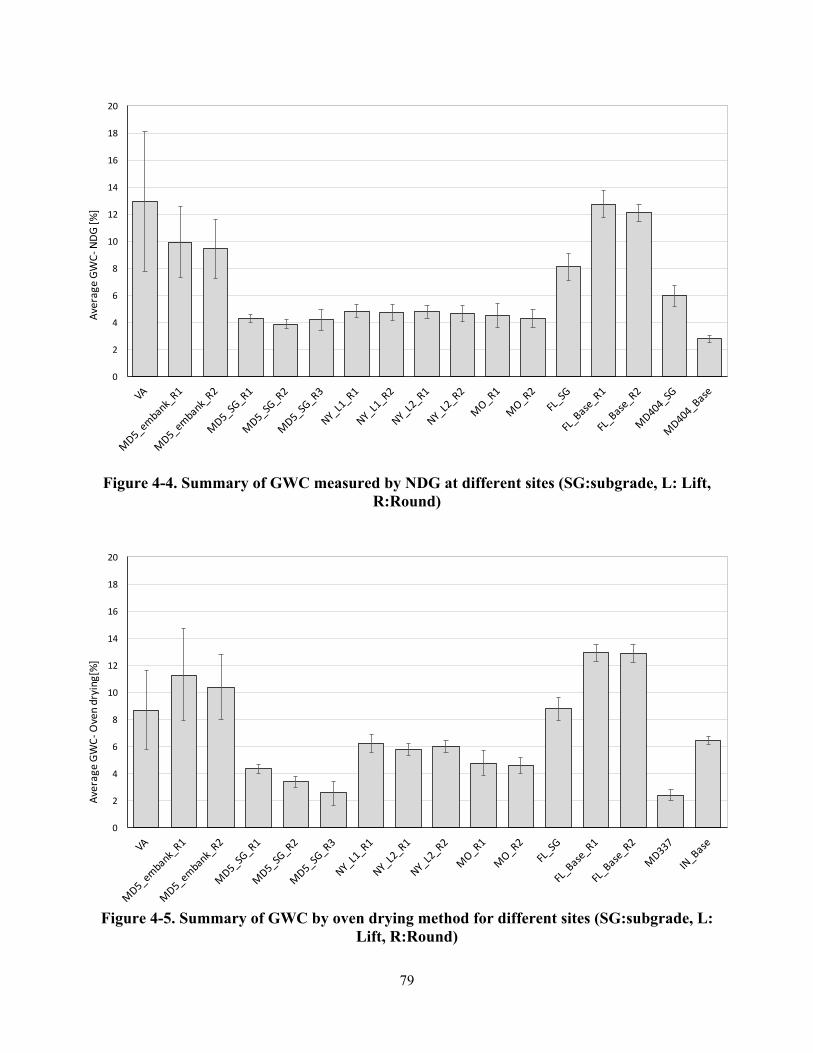
79
Figure 4-4. Summary of GWC measured by NDG at different sites (SG:subgrade, L: Lift, R:Round)
Figure 4-5. Summary of GWC by oven drying method for different sites (SG:subgrade, L:
Lift, R:Round)
0
2
4
6
8
10
12
14
16
18
20Average GW
C‐ND
G [%]
0
2
4
6
8
10
12
14
16
18
20
Average GW
C‐Oven drying[%]
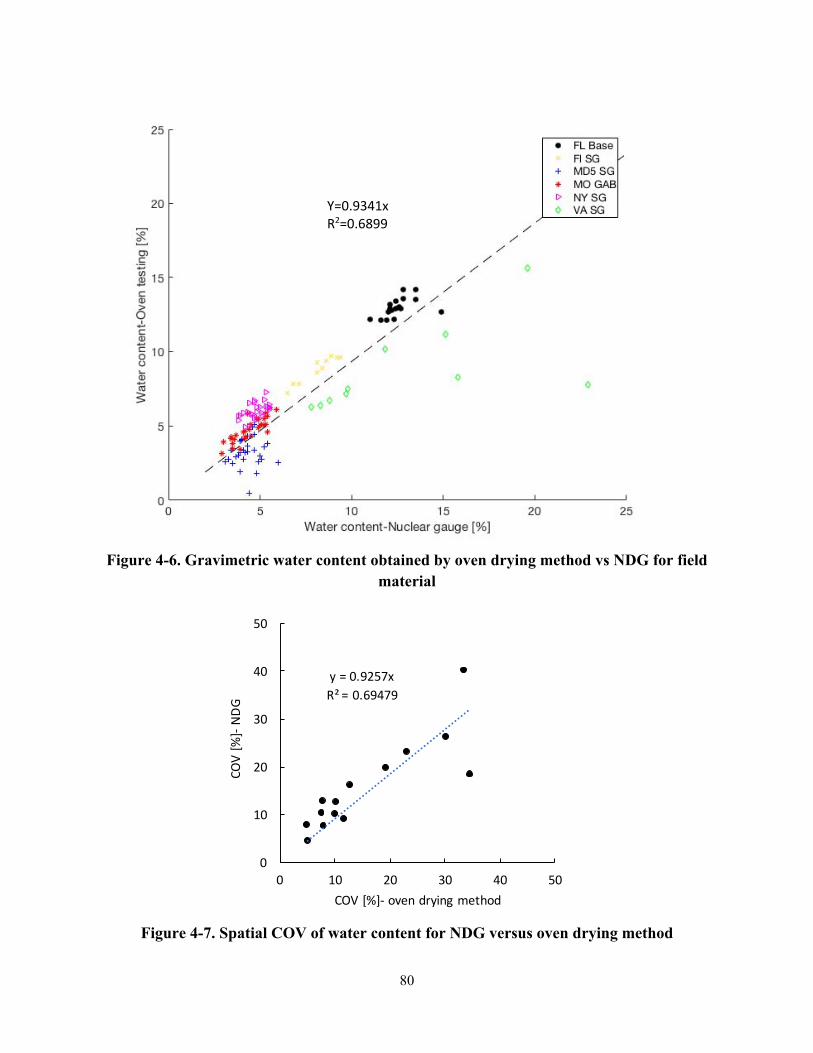
80
Figure 4-6. Gravimetric water content obtained by oven drying method vs NDG for field
material
Figure 4-7. Spatial COV of water content for NDG versus oven drying method
y = 0.9257xR² = 0.69479
0
10
20
30
40
50
0 10 20 30 40 50
COV [%]‐NDG
COV [%]‐ oven drying method
Y=0.9341x R2=0.6899
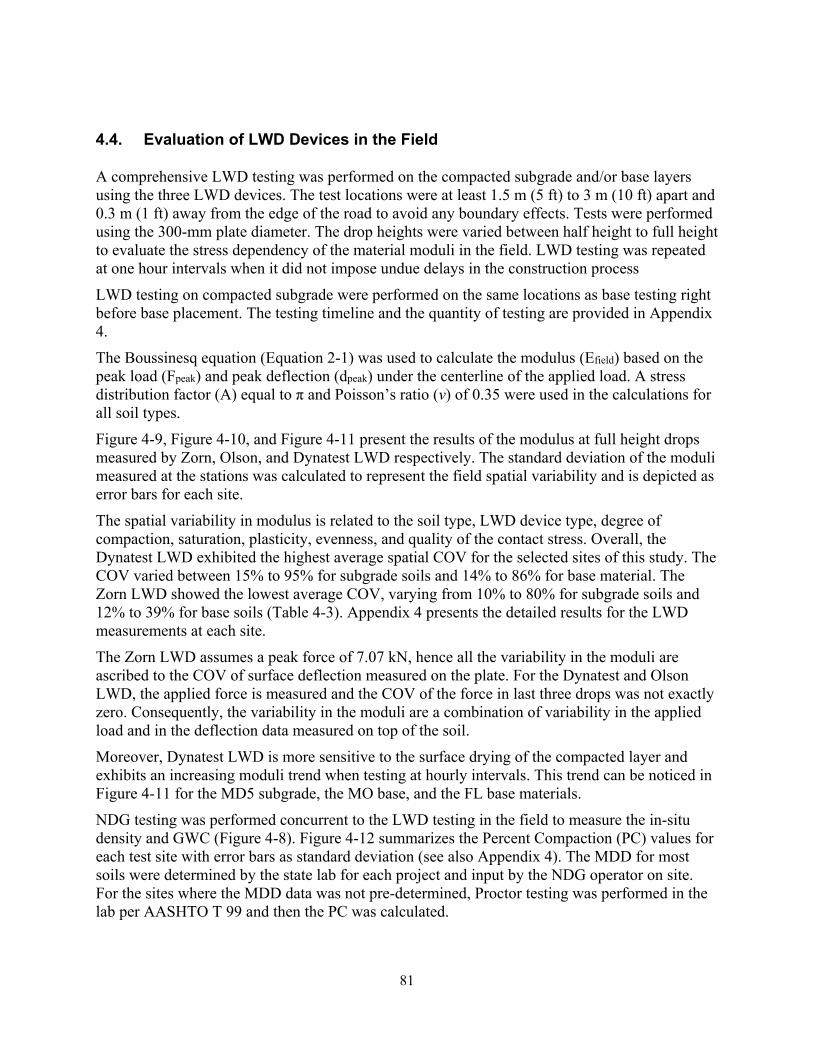
81
4.4. Evaluation of LWD Devices in the Field
A comprehensive LWD testing was performed on the compacted subgrade and/or base layers using the three LWD devices. The test locations were at least 1.5 m (5 ft) to 3 m (10 ft) apart and 0.3 m (1 ft) away from the edge of the road to avoid any boundary effects. Tests were performed using the 300-mm plate diameter. The drop heights were varied between half height to full height to evaluate the stress dependency of the material moduli in the field. LWD testing was repeated at one hour intervals when it did not impose undue delays in the construction process
LWD testing on compacted subgrade were performed on the same locations as base testing right before base placement. The testing timeline and the quantity of testing are provided in Appendix 4.
The Boussinesq equation (Equation 2-1) was used to calculate the modulus (Efield) based on the peak load (Fpeak) and peak deflection (dpeak) under the centerline of the applied load. A stress distribution factor (A) equal to π and Poisson’s ratio (v) of 0.35 were used in the calculations for all soil types.
Figure 4-9, Figure 4-10, and Figure 4-11 present the results of the modulus at full height drops measured by Zorn, Olson, and Dynatest LWD respectively. The standard deviation of the moduli measured at the stations was calculated to represent the field spatial variability and is depicted as error bars for each site.
The spatial variability in modulus is related to the soil type, LWD device type, degree of compaction, saturation, plasticity, evenness, and quality of the contact stress. Overall, the Dynatest LWD exhibited the highest average spatial COV for the selected sites of this study. The COV varied between 15% to 95% for subgrade soils and 14% to 86% for base material. The Zorn LWD showed the lowest average COV, varying from 10% to 80% for subgrade soils and 12% to 39% for base soils (Table 4-3). Appendix 4 presents the detailed results for the LWD measurements at each site.
The Zorn LWD assumes a peak force of 7.07 kN, hence all the variability in the moduli are ascribed to the COV of surface deflection measured on the plate. For the Dynatest and Olson LWD, the applied force is measured and the COV of the force in last three drops was not exactly zero. Consequently, the variability in the moduli are a combination of variability in the applied load and in the deflection data measured on top of the soil.
Moreover, Dynatest LWD is more sensitive to the surface drying of the compacted layer and exhibits an increasing moduli trend when testing at hourly intervals. This trend can be noticed in Figure 4-11 for the MD5 subgrade, the MO base, and the FL base materials.
NDG testing was performed concurrent to the LWD testing in the field to measure the in-situ density and GWC (Figure 4-8). Figure 4-12 summarizes the Percent Compaction (PC) values for each test site with error bars as standard deviation (see also Appendix 4). The MDD for most soils were determined by the state lab for each project and input by the NDG operator on site. For the sites where the MDD data was not pre-determined, Proctor testing was performed in the lab per AASHTO T 99 and then the PC was calculated.
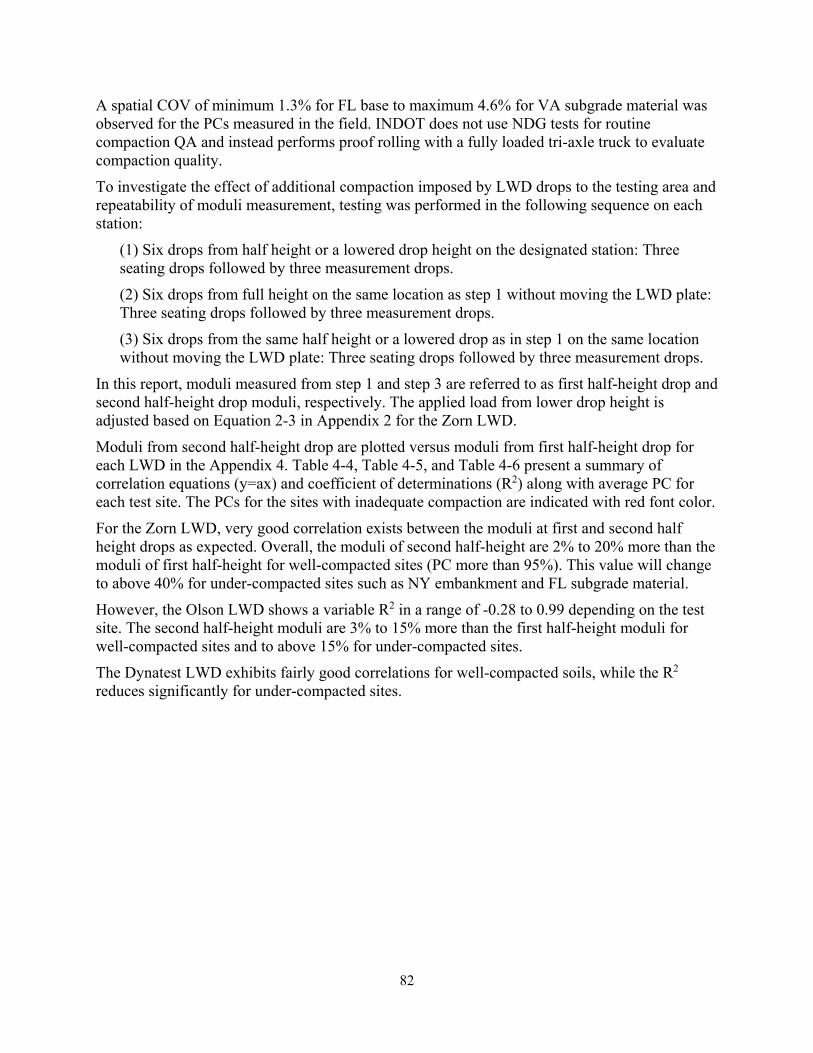
82
A spatial COV of minimum 1.3% for FL base to maximum 4.6% for VA subgrade material was observed for the PCs measured in the field. INDOT does not use NDG tests for routine compaction QA and instead performs proof rolling with a fully loaded tri-axle truck to evaluate compaction quality.
To investigate the effect of additional compaction imposed by LWD drops to the testing area and repeatability of moduli measurement, testing was performed in the following sequence on each station:
(1) Six drops from half height or a lowered drop height on the designated station: Three seating drops followed by three measurement drops.
(2) Six drops from full height on the same location as step 1 without moving the LWD plate: Three seating drops followed by three measurement drops.
(3) Six drops from the same half height or a lowered drop as in step 1 on the same location without moving the LWD plate: Three seating drops followed by three measurement drops.
In this report, moduli measured from step 1 and step 3 are referred to as first half-height drop and second half-height drop moduli, respectively. The applied load from lower drop height is adjusted based on Equation 2-3 in Appendix 2 for the Zorn LWD.
Moduli from second half-height drop are plotted versus moduli from first half-height drop for each LWD in the Appendix 4. Table 4-4, Table 4-5, and Table 4-6 present a summary of correlation equations (y=ax) and coefficient of determinations (R2) along with average PC for each test site. The PCs for the sites with inadequate compaction are indicated with red font color.
For the Zorn LWD, very good correlation exists between the moduli at first and second half height drops as expected. Overall, the moduli of second half-height are 2% to 20% more than the moduli of first half-height for well-compacted sites (PC more than 95%). This value will change to above 40% for under-compacted sites such as NY embankment and FL subgrade material.
However, the Olson LWD shows a variable R2 in a range of -0.28 to 0.99 depending on the test site. The second half-height moduli are 3% to 15% more than the first half-height moduli for well-compacted sites and to above 15% for under-compacted sites.
The Dynatest LWD exhibits fairly good correlations for well-compacted soils, while the R2 reduces significantly for under-compacted sites.
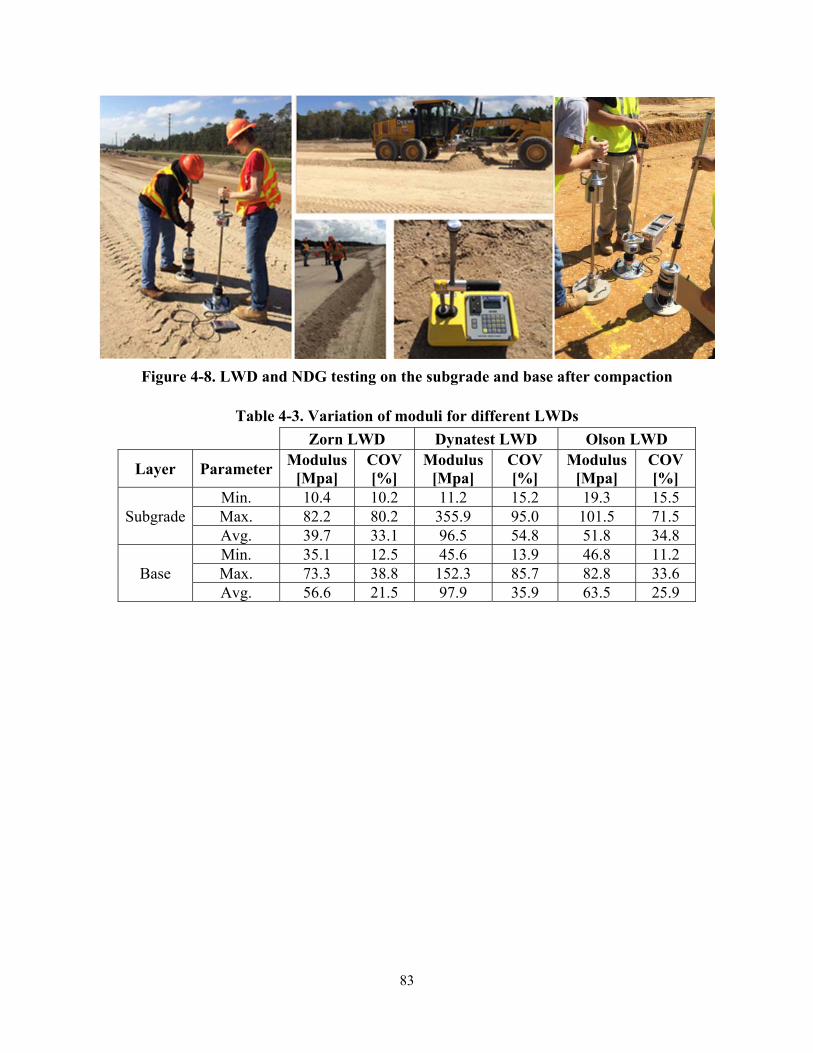
83
Figure 4-8. LWD and NDG testing on the subgrade and base after compaction
Table 4-3. Variation of moduli for different LWDs
Zorn LWD Dynatest LWD Olson LWD
Layer Parameter Modulus [Mpa]
COV [%]
Modulus [Mpa]
COV [%]
Modulus [Mpa]
COV [%]
Subgrade Min. 10.4 10.2 11.2 15.2 19.3 15.5Max. 82.2 80.2 355.9 95.0 101.5 71.5Avg. 39.7 33.1 96.5 54.8 51.8 34.8
Base Min. 35.1 12.5 45.6 13.9 46.8 11.2Max. 73.3 38.8 152.3 85.7 82.8 33.6Avg. 56.6 21.5 97.9 35.9 63.5 25.9
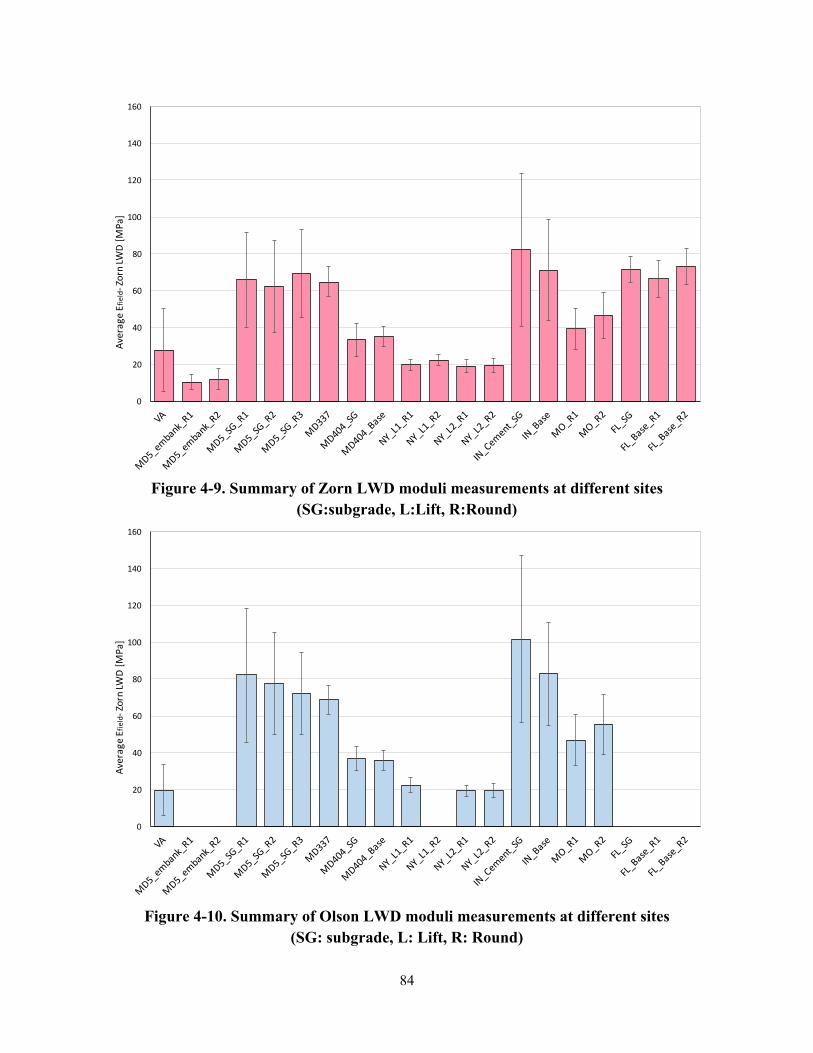
84
Figure 4-9. Summary of Zorn LWD moduli measurements at different sites
(SG:subgrade, L:Lift, R:Round)
Figure 4-10. Summary of Olson LWD moduli measurements at different sites
(SG: subgrade, L: Lift, R: Round)
0
20
40
60
80
100
120
140
160Average Efield‐Zorn LW
D [M
Pa]
0
20
40
60
80
100
120
140
160
Average Efield‐Zorn LW
D [M
Pa]
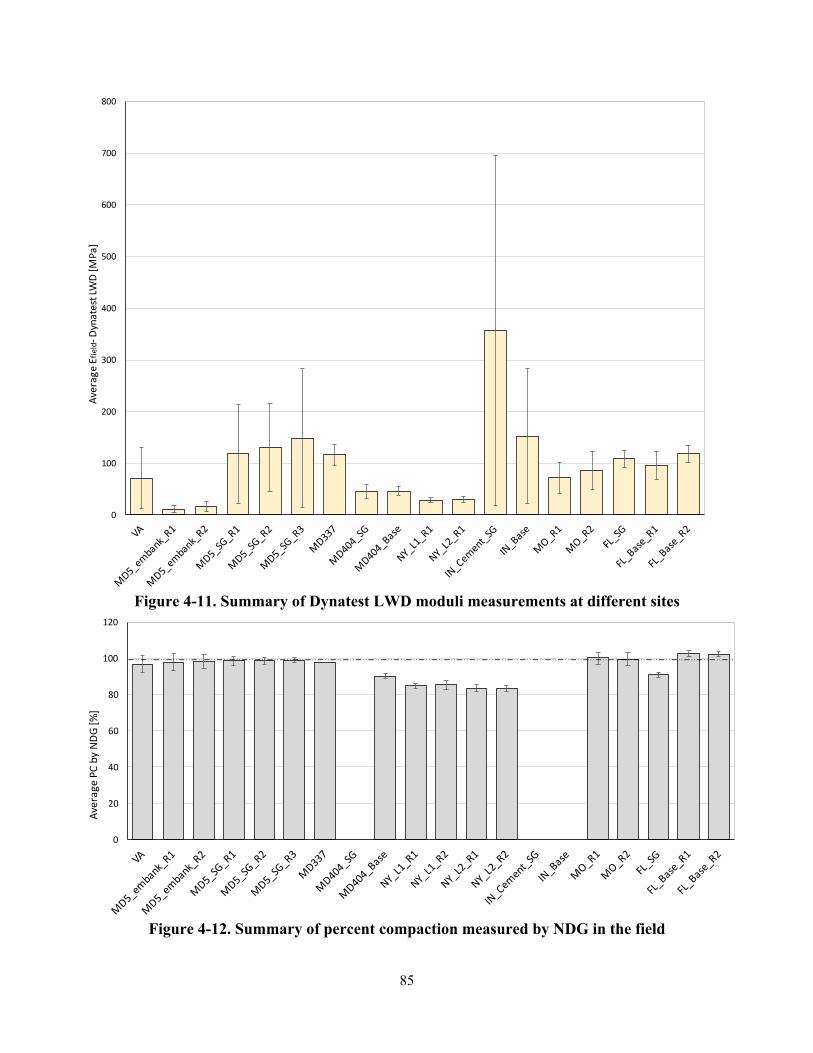
85
Figure 4-11. Summary of Dynatest LWD moduli measurements at different sites
Figure 4-12. Summary of percent compaction measured by NDG in the field
0
100
200
300
400
500
600
700
800Average Efield‐D
ynatest LWD [M
Pa]
0
20
40
60
80
100
120
Average PC
by ND
G [%]
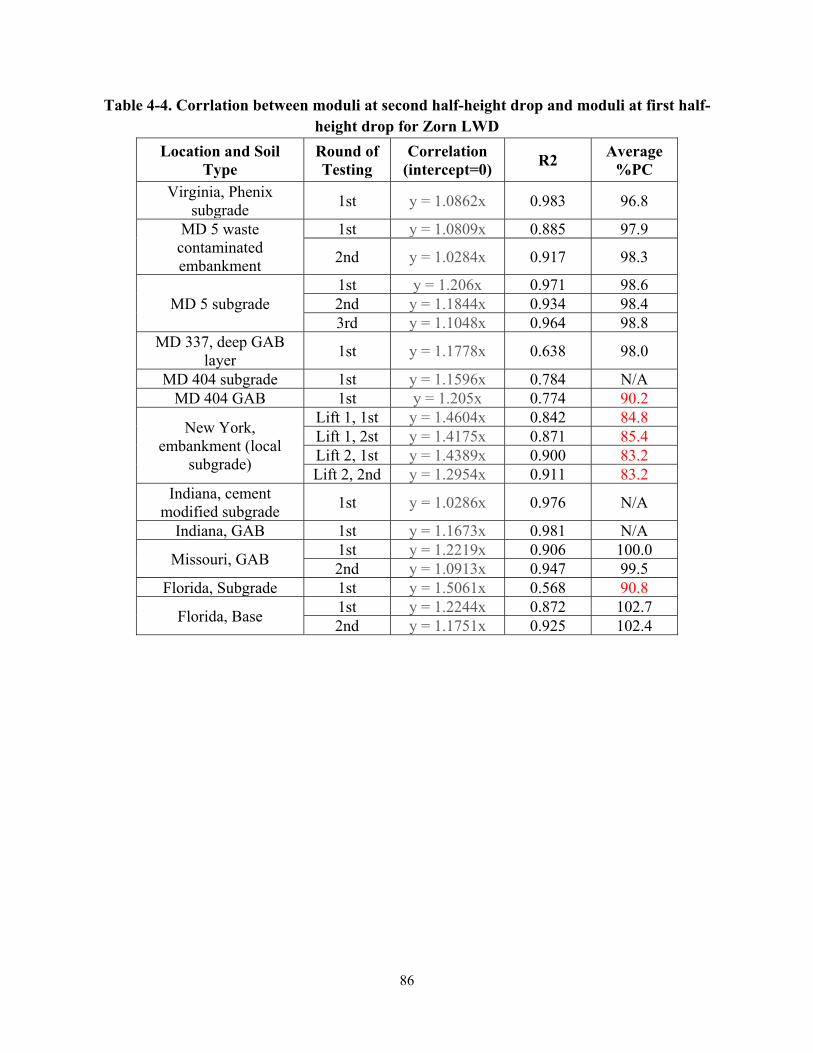
86
Table 4-4. Corrlation between moduli at second half-height drop and moduli at first half-height drop for Zorn LWD
Location and Soil Type
Round of Testing
Correlation (intercept=0) R2 Average
%PC Virginia, Phenix
subgrade 1st y = 1.0862x 0.983 96.8
MD 5 waste contaminated embankment
1st y = 1.0809x 0.885 97.9
2nd y = 1.0284x 0.917 98.3
MD 5 subgrade 1st y = 1.206x 0.971 98.6 2nd y = 1.1844x 0.934 98.4 3rd y = 1.1048x 0.964 98.8
MD 337, deep GAB layer 1st y = 1.1778x 0.638 98.0
MD 404 subgrade 1st y = 1.1596x 0.784 N/A MD 404 GAB 1st y = 1.205x 0.774 90.2
New York, embankment (local
subgrade)
Lift 1, 1st y = 1.4604x 0.842 84.8 Lift 1, 2st y = 1.4175x 0.871 85.4 Lift 2, 1st y = 1.4389x 0.900 83.2 Lift 2, 2nd y = 1.2954x 0.911 83.2
Indiana, cement modified subgrade 1st y = 1.0286x 0.976 N/A
Indiana, GAB 1st y = 1.1673x 0.981 N/A
Missouri, GAB 1st y = 1.2219x 0.906 100.0 2nd y = 1.0913x 0.947 99.5
Florida, Subgrade 1st y = 1.5061x 0.568 90.8
Florida, Base 1st y = 1.2244x 0.872 102.7 2nd y = 1.1751x 0.925 102.4
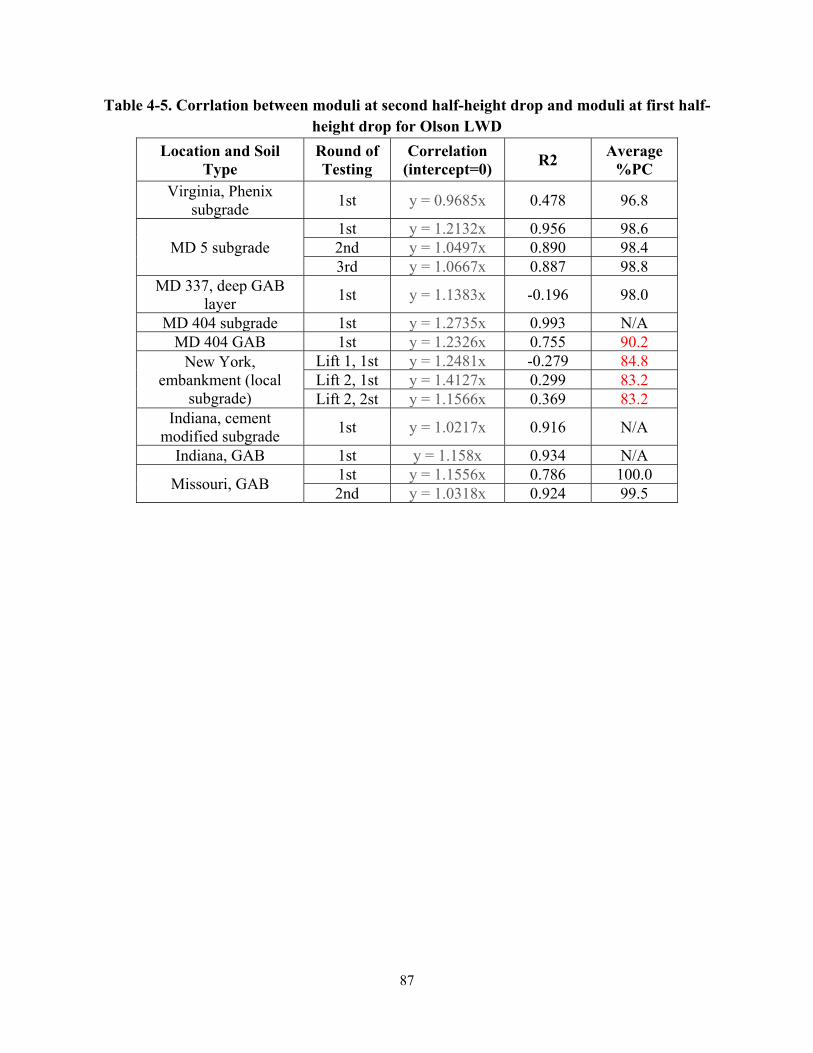
87
Table 4-5. Corrlation between moduli at second half-height drop and moduli at first half-height drop for Olson LWD
Location and Soil Type
Round of Testing
Correlation (intercept=0) R2 Average
%PC Virginia, Phenix
subgrade 1st y = 0.9685x 0.478 96.8
MD 5 subgrade 1st y = 1.2132x 0.956 98.6 2nd y = 1.0497x 0.890 98.4 3rd y = 1.0667x 0.887 98.8
MD 337, deep GAB layer 1st y = 1.1383x -0.196 98.0
MD 404 subgrade 1st y = 1.2735x 0.993 N/A MD 404 GAB 1st y = 1.2326x 0.755 90.2
New York, embankment (local
subgrade)
Lift 1, 1st y = 1.2481x -0.279 84.8 Lift 2, 1st y = 1.4127x 0.299 83.2 Lift 2, 2st y = 1.1566x 0.369 83.2
Indiana, cement modified subgrade 1st y = 1.0217x 0.916 N/A
Indiana, GAB 1st y = 1.158x 0.934 N/A
Missouri, GAB 1st y = 1.1556x 0.786 100.0 2nd y = 1.0318x 0.924 99.5
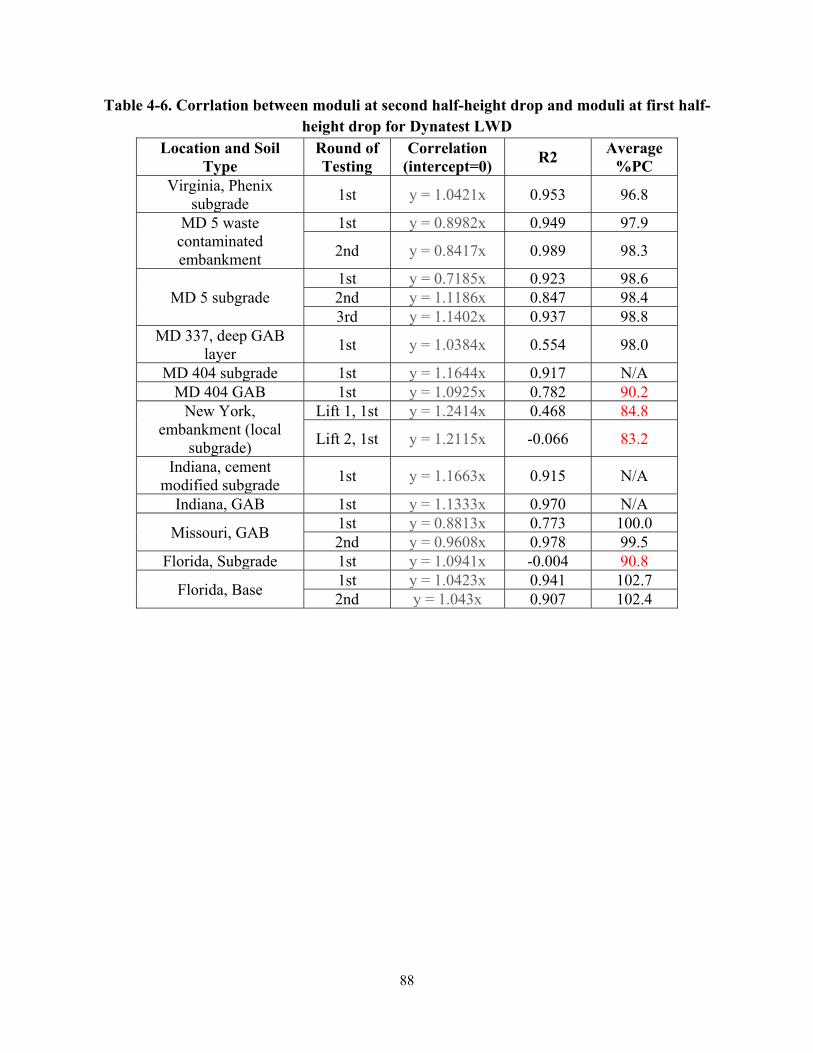
88
Table 4-6. Corrlation between moduli at second half-height drop and moduli at first half-height drop for Dynatest LWD
Location and Soil Type
Round of Testing
Correlation (intercept=0) R2 Average
%PC Virginia, Phenix
subgrade 1st y = 1.0421x 0.953 96.8
MD 5 waste contaminated embankment
1st y = 0.8982x 0.949 97.9
2nd y = 0.8417x 0.989 98.3
MD 5 subgrade 1st y = 0.7185x 0.923 98.6 2nd y = 1.1186x 0.847 98.4 3rd y = 1.1402x 0.937 98.8
MD 337, deep GAB layer 1st y = 1.0384x 0.554 98.0
MD 404 subgrade 1st y = 1.1644x 0.917 N/A MD 404 GAB 1st y = 1.0925x 0.782 90.2
New York, embankment (local
subgrade)
Lift 1, 1st y = 1.2414x 0.468 84.8
Lift 2, 1st y = 1.2115x -0.066 83.2
Indiana, cement modified subgrade 1st y = 1.1663x 0.915 N/A
Indiana, GAB 1st y = 1.1333x 0.970 N/A
Missouri, GAB 1st y = 0.8813x 0.773 100.0 2nd y = 0.9608x 0.978 99.5
Florida, Subgrade 1st y = 1.0941x -0.004 90.8
Florida, Base 1st y = 1.0423x 0.941 102.7 2nd y = 1.043x 0.907 102.4
89
4.5. LWD on Mold Testing for the Field Material
During field evaluation phase, two buckets of soil material were obtained for the subgrade and/or base material at each test site. An appropriate quantity of about 7 kg (~15 lb) was separated from the sample soil for the compaction of each specimen per AASHTO T 248. To keep the material gradation in the mold similar to the actual field gradation, only retained particles on the 1inch sieve was scalped off, which constituted less than 10% of oversized particles.
The LWD on mold testing is used to demonstrate the stress dependency and moisture dependency of soil material under LWD loading. 150mm-diameter Proctor molds were compacted at 3 to 6 different moisture contents per AASHTO T 99, method B or D. The acceptable water content range is obtained from the compaction curve.
LWD tests were performed directly on top of the compacted molds that were stabilized on the laboratory’s concrete foundation.
Total of 6 drops at each drop heights were performed, 6 drops from each drop height. Drop heights for each LWD are listed in Table 4-7. These were marked precisely on the LWD guide rod before testing for the Zorn and Olson LWDs. An adjustable pipe clamp was also used to control the specified drop heights. The Dynatest LWD has a movable release handle and a laser engraved scale on the guide shaft for easy setting of the desired drop height (Figure 4-13).
A collar was designed and attached to the mold after trimming the compacted surface to help keep the LWD loading plate in place (Figure 4-14).
Table 4-7. Drop heights for LWD testing on molds for field soils
Drop Height ID Zorn Dynatest Olson[-] [cm] [cm] [cm] h7 2.5 2.5 2.5 h8 5.1 5.1 5.1 h9 7.6 7.6 7.6 h10 10.2 10.2 10.2 h11 12.7 12.7 12.7 h12 31.8 17.8 21.6
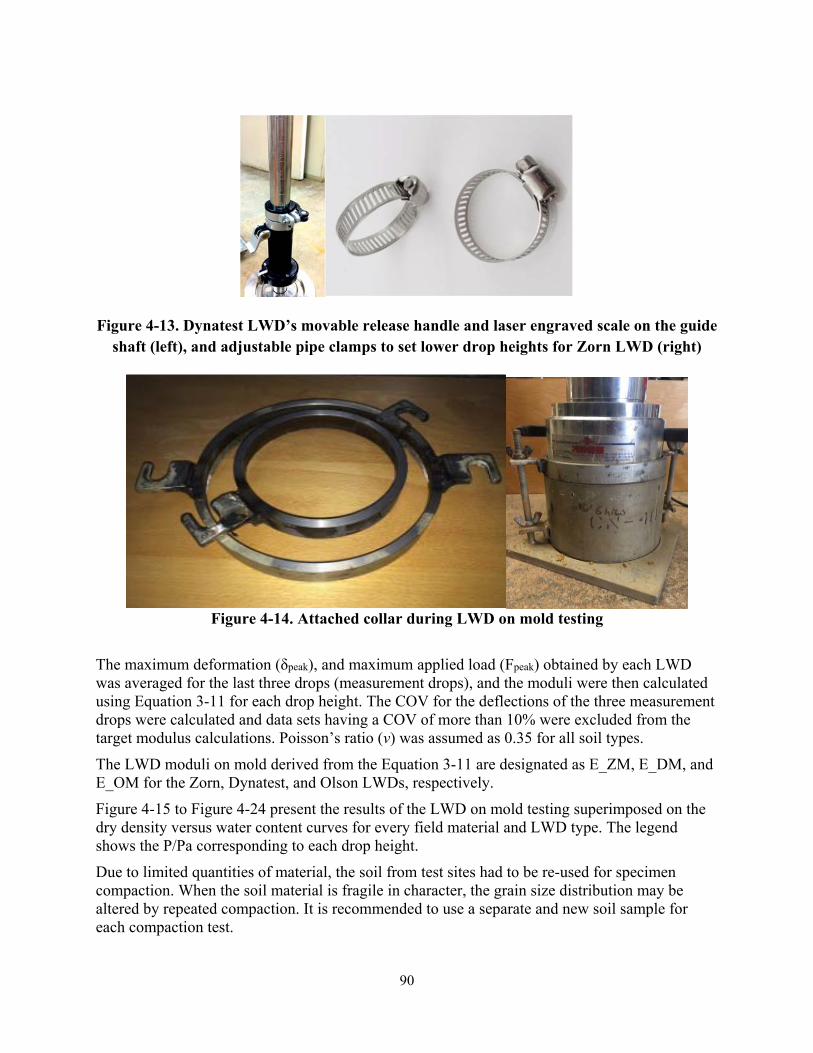
90
Figure 4-13. Dynatest LWD’s movable release handle and laser engraved scale on the guide shaft (left), and adjustable pipe clamps to set lower drop heights for Zorn LWD (right)
Figure 4-14. Attached collar during LWD on mold testing
The maximum deformation (δpeak), and maximum applied load (Fpeak) obtained by each LWD was averaged for the last three drops (measurement drops), and the moduli were then calculated using Equation 3-11 for each drop height. The COV for the deflections of the three measurement drops were calculated and data sets having a COV of more than 10% were excluded from the target modulus calculations. Poisson’s ratio (v) was assumed as 0.35 for all soil types.
The LWD moduli on mold derived from the Equation 3-11 are designated as E_ZM, E_DM, and E_OM for the Zorn, Dynatest, and Olson LWDs, respectively.
Figure 4-15 to Figure 4-24 present the results of the LWD on mold testing superimposed on the dry density versus water content curves for every field material and LWD type. The legend shows the P/Pa corresponding to each drop height.
Due to limited quantities of material, the soil from test sites had to be re-used for specimen compaction. When the soil material is fragile in character, the grain size distribution may be altered by repeated compaction. It is recommended to use a separate and new soil sample for each compaction test.

91
LWD testing for water contents very wet of the OMC was impossible due to substantial permanent deformations and excessive water draining from the mold during the testing. The LWD moduli on mold sometimes increased for specimens compacted wet of OMC due to pore water pressure built up. These data were excluded from the target calculation.
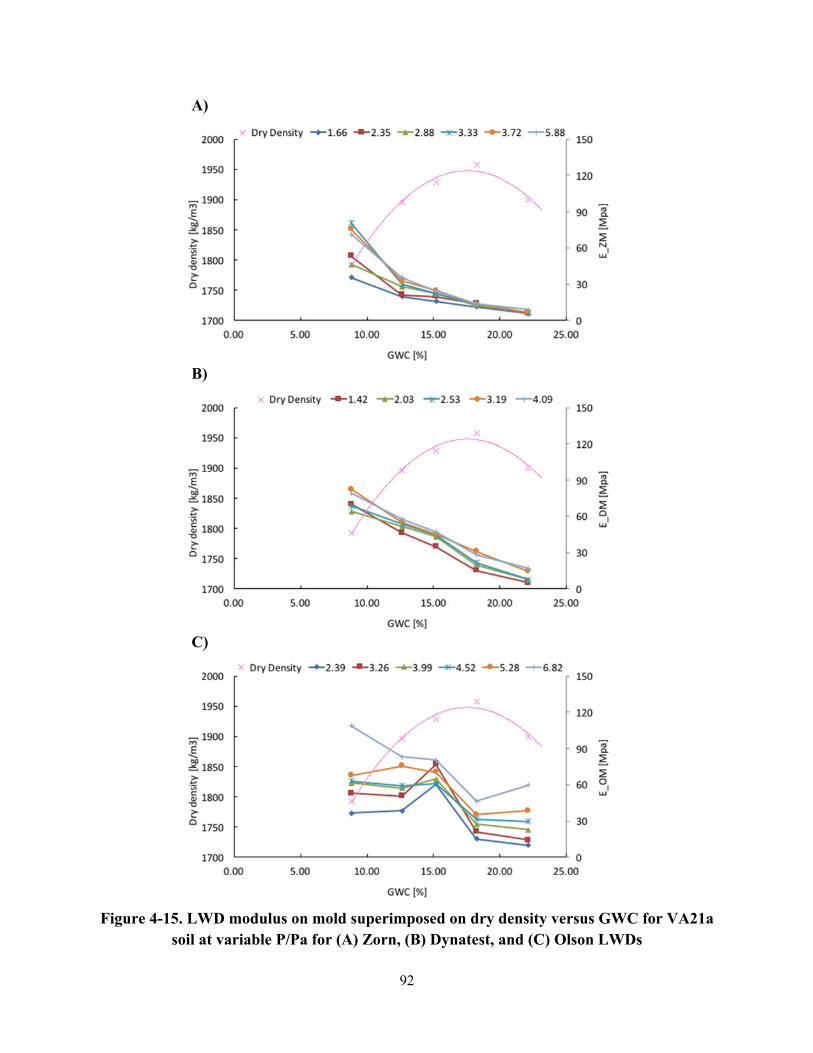
92
A)
B)
C)
Figure 4-15. LWD modulus on mold superimposed on dry density versus GWC for VA21a
soil at variable P/Pa for (A) Zorn, (B) Dynatest, and (C) Olson LWDs
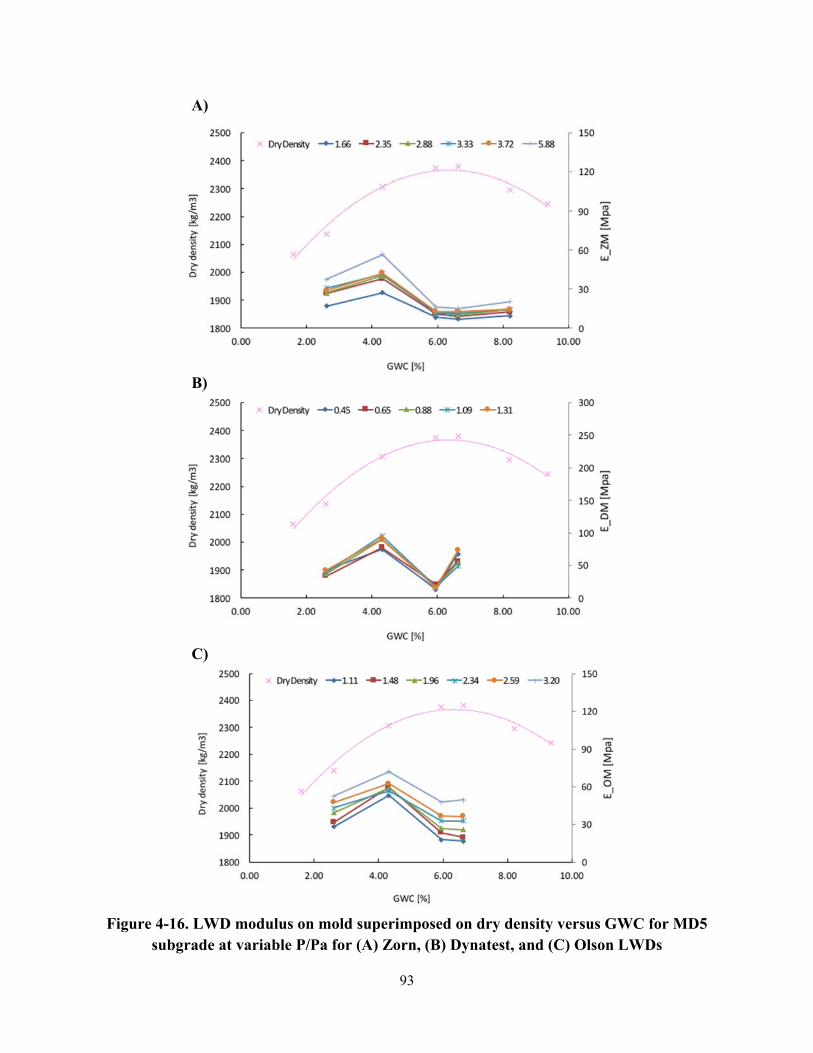
93
A)
B)
C)
Figure 4-16. LWD modulus on mold superimposed on dry density versus GWC for MD5
subgrade at variable P/Pa for (A) Zorn, (B) Dynatest, and (C) Olson LWDs
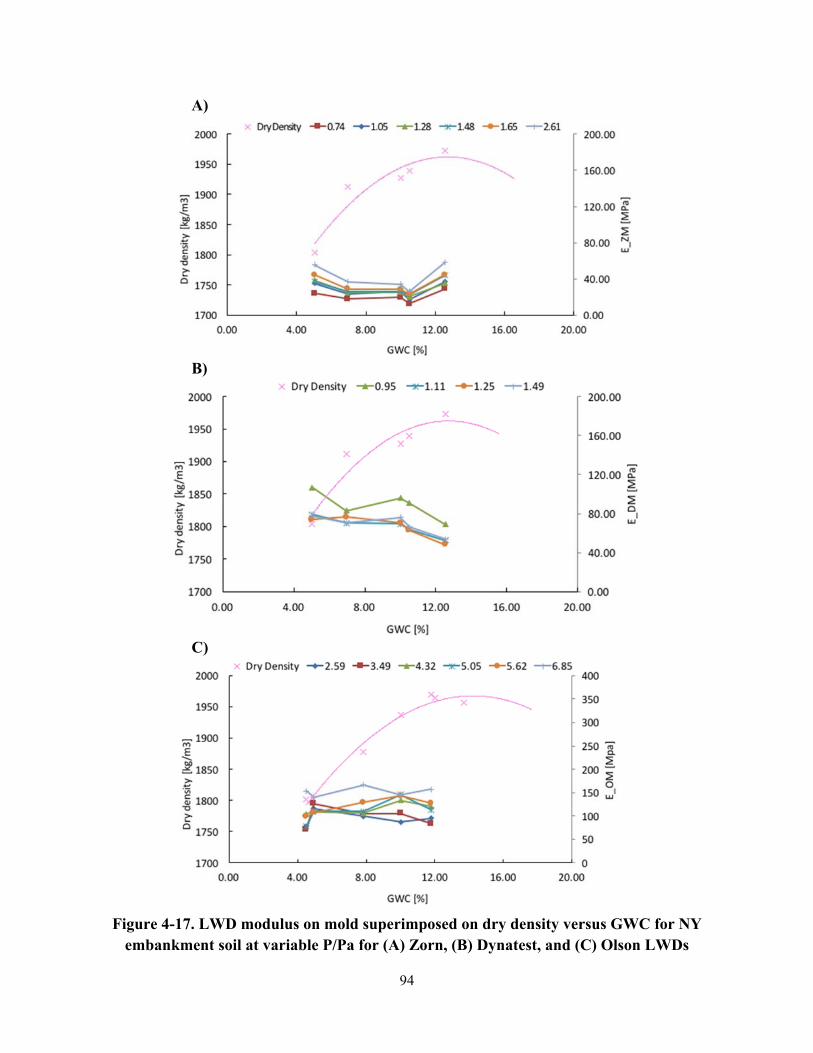
94
A)
B)
C)
Figure 4-17. LWD modulus on mold superimposed on dry density versus GWC for NY
embankment soil at variable P/Pa for (A) Zorn, (B) Dynatest, and (C) Olson LWDs
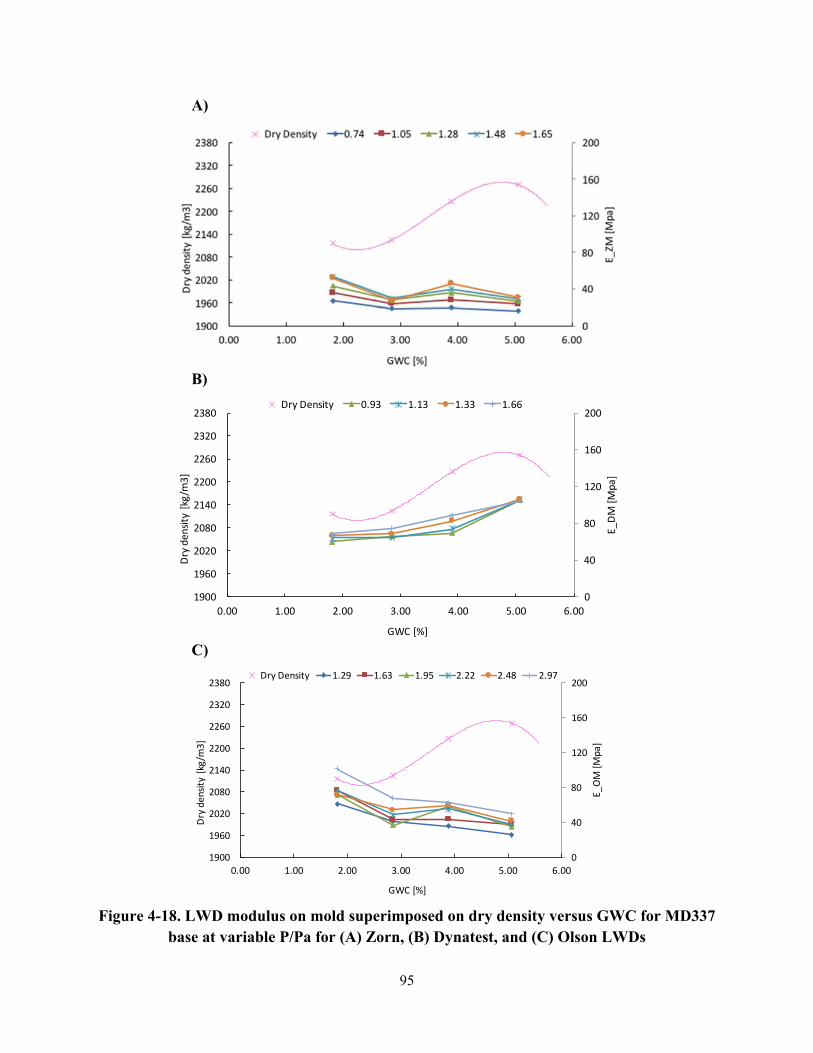
95
A)
B)
C)
Figure 4-18. LWD modulus on mold superimposed on dry density versus GWC for MD337
base at variable P/Pa for (A) Zorn, (B) Dynatest, and (C) Olson LWDs
0
40
80
120
160
200
1900
1960
2020
2080
2140
2200
2260
2320
2380
0.00 1.00 2.00 3.00 4.00 5.00 6.00E_DM
[Mpa]
Dry
density [kg/m3]
GWC [%]
Dry Density 0.93 1.13 1.33 1.66
0
40
80
120
160
200
1900
1960
2020
2080
2140
2200
2260
2320
2380
0.00 1.00 2.00 3.00 4.00 5.00 6.00
E_OM
[Mpa]
Dry
density [kg/m3]
GWC [%]
Dry Density 1.29 1.63 1.95 2.22 2.48 2.97
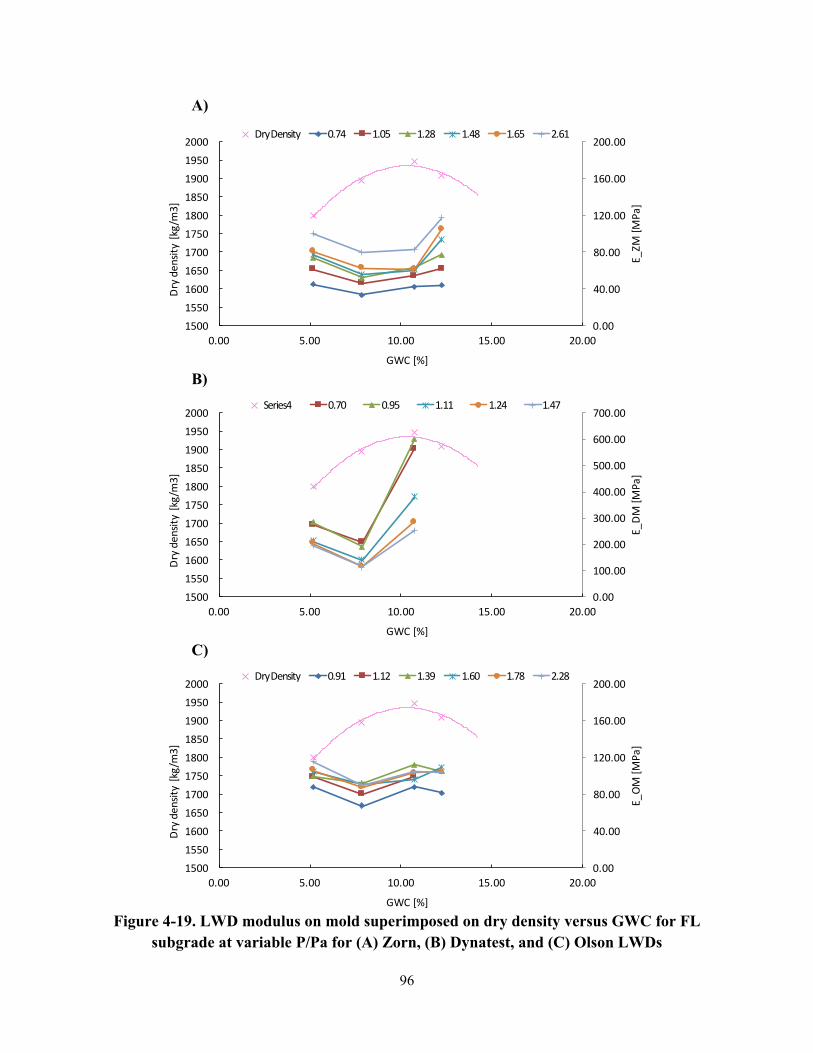
96
A)
B)
C)
Figure 4-19. LWD modulus on mold superimposed on dry density versus GWC for FL
subgrade at variable P/Pa for (A) Zorn, (B) Dynatest, and (C) Olson LWDs
0.00
40.00
80.00
120.00
160.00
200.00
15001550160016501700175018001850190019502000
0.00 5.00 10.00 15.00 20.00
E_ZM
[MPa]
Dry
density [kg/m3]
GWC [%]
Dry Density 0.74 1.05 1.28 1.48 1.65 2.61
0.00
100.00
200.00
300.00
400.00
500.00
600.00
700.00
15001550160016501700175018001850190019502000
0.00 5.00 10.00 15.00 20.00
E_DM
[MPa]
Dry
density [kg/m3]
GWC [%]
Series4 0.70 0.95 1.11 1.24 1.47
0.00
40.00
80.00
120.00
160.00
200.00
15001550160016501700175018001850190019502000
0.00 5.00 10.00 15.00 20.00
E_OM
[MPa]
Dry
density [kg/m3]
GWC [%]
Dry Density 0.91 1.12 1.39 1.60 1.78 2.28
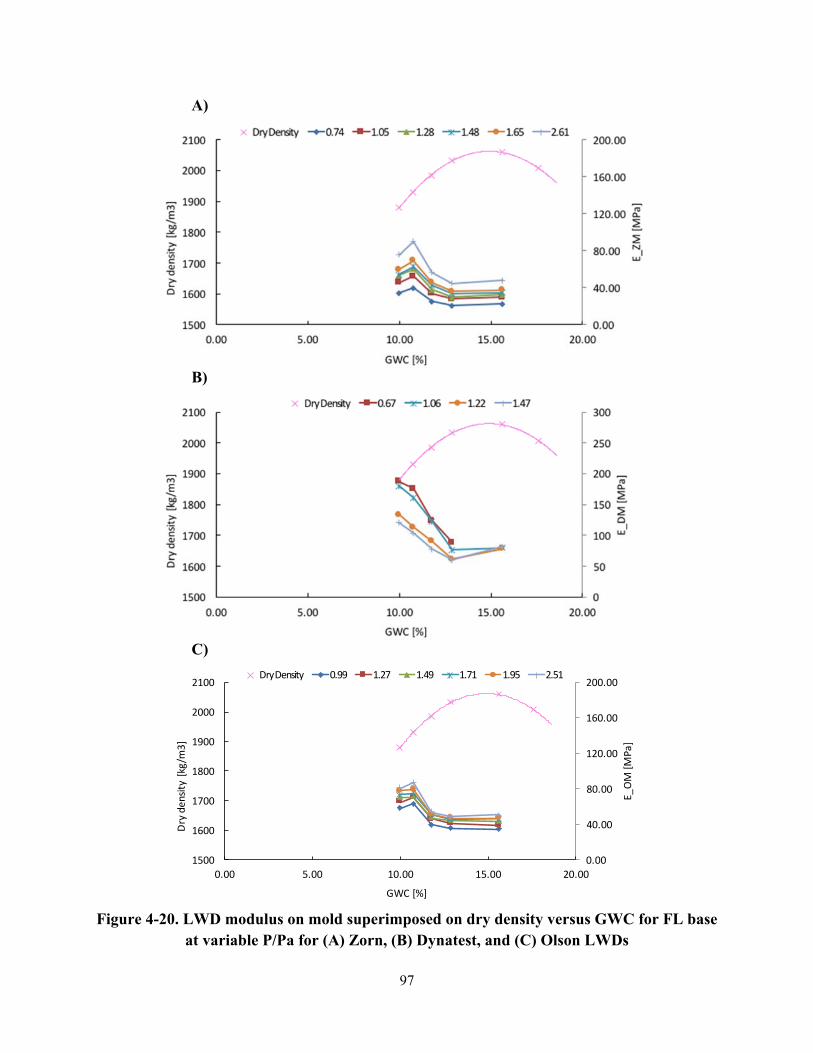
97
A)
B)
C)
Figure 4-20. LWD modulus on mold superimposed on dry density versus GWC for FL base
at variable P/Pa for (A) Zorn, (B) Dynatest, and (C) Olson LWDs
0.00
40.00
80.00
120.00
160.00
200.00
1500
1600
1700
1800
1900
2000
2100
0.00 5.00 10.00 15.00 20.00
E_OM
[MPa]
Dry
density [kg/m3]
GWC [%]
Dry Density 0.99 1.27 1.49 1.71 1.95 2.51
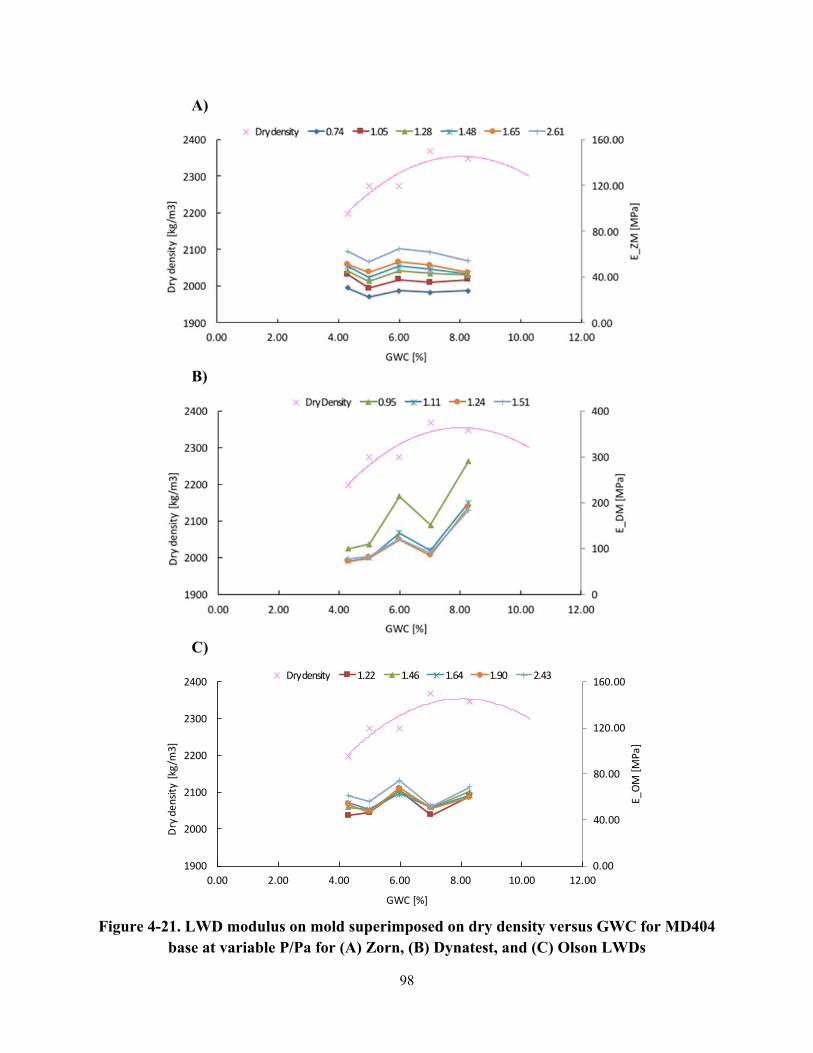
98
A)
B)
C)
Figure 4-21. LWD modulus on mold superimposed on dry density versus GWC for MD404
base at variable P/Pa for (A) Zorn, (B) Dynatest, and (C) Olson LWDs
0.00
40.00
80.00
120.00
160.00
1900
2000
2100
2200
2300
2400
0.00 2.00 4.00 6.00 8.00 10.00 12.00
E_OM
[MPa]
Dry
density [kg/m3]
GWC [%]
Dry density 1.22 1.46 1.64 1.90 2.43
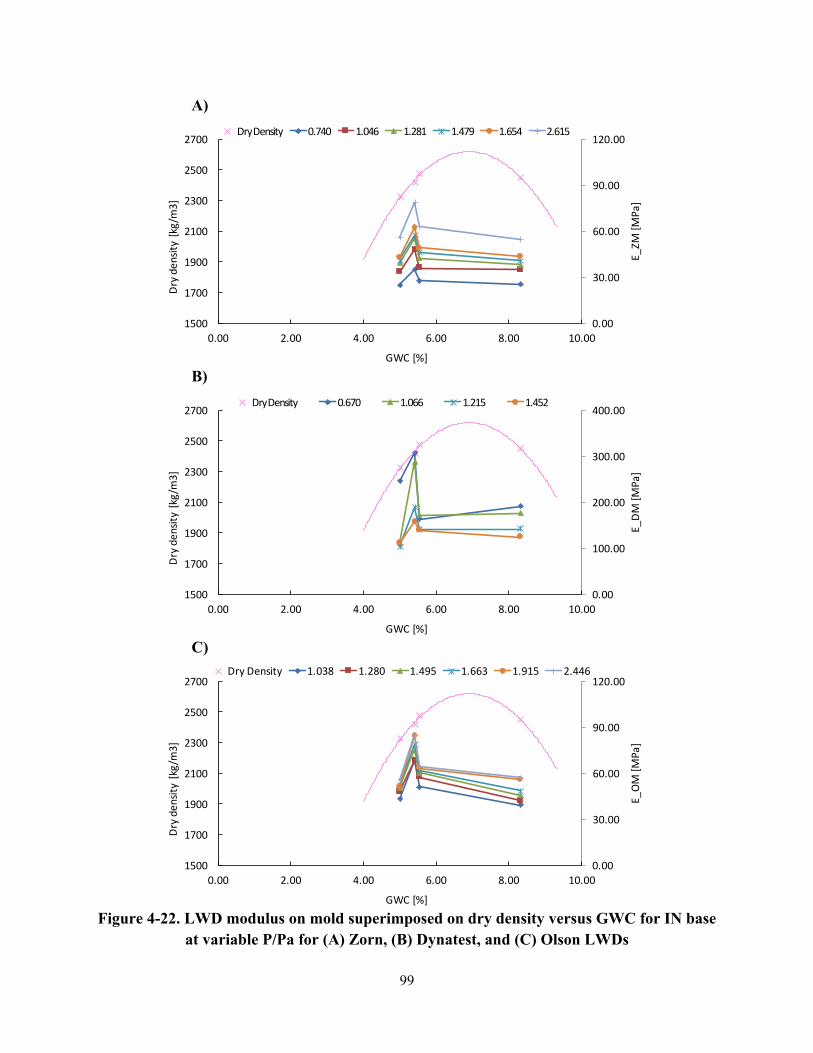
99
A)
B)
C)
Figure 4-22. LWD modulus on mold superimposed on dry density versus GWC for IN base
at variable P/Pa for (A) Zorn, (B) Dynatest, and (C) Olson LWDs
0.00
30.00
60.00
90.00
120.00
1500
1700
1900
2100
2300
2500
2700
0.00 2.00 4.00 6.00 8.00 10.00
E_ZM
[MPa]
Dry
density [kg/m3]
GWC [%]
Dry Density 0.740 1.046 1.281 1.479 1.654 2.615
0.00
100.00
200.00
300.00
400.00
1500
1700
1900
2100
2300
2500
2700
0.00 2.00 4.00 6.00 8.00 10.00
E_DM
[MPa]
Dry
density [kg/m3]
GWC [%]
Dry Density 0.670 1.066 1.215 1.452
0.00
30.00
60.00
90.00
120.00
1500
1700
1900
2100
2300
2500
2700
0.00 2.00 4.00 6.00 8.00 10.00
E_OM
[MPa]
Dry
density [kg/m3]
GWC [%]
Dry Density 1.038 1.280 1.495 1.663 1.915 2.446
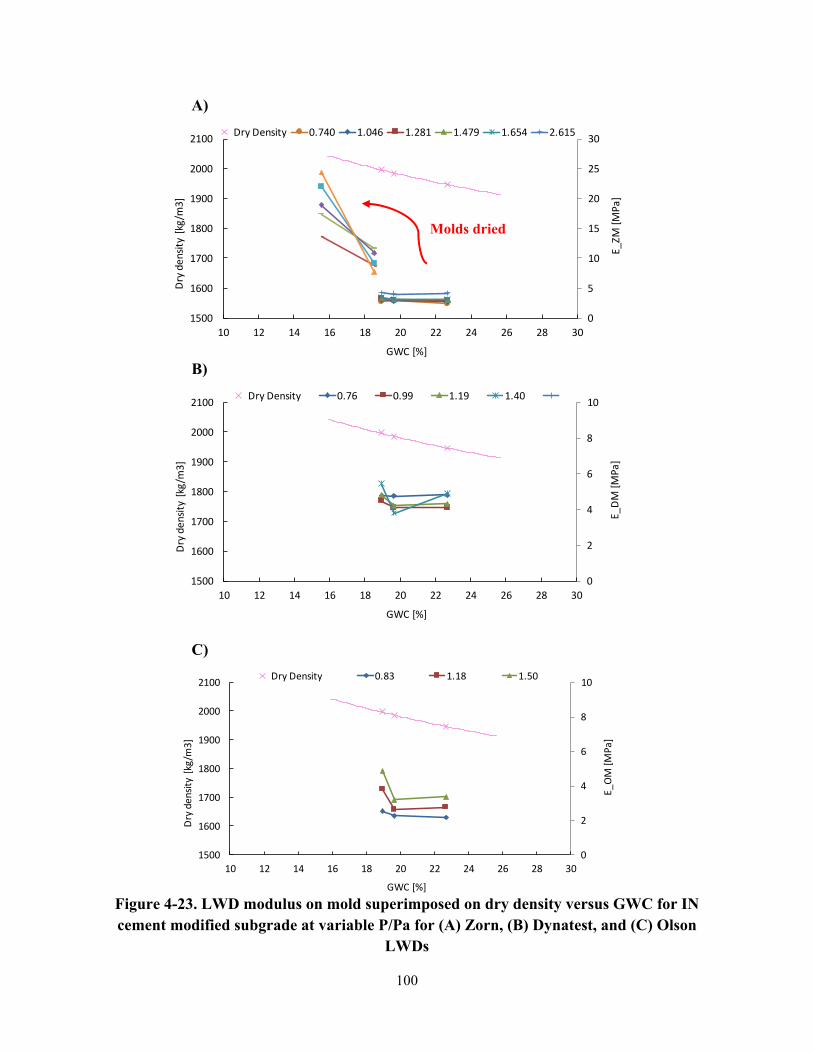
100
A)
B)
C)
Figure 4-23. LWD modulus on mold superimposed on dry density versus GWC for IN cement modified subgrade at variable P/Pa for (A) Zorn, (B) Dynatest, and (C) Olson
LWDs
0
5
10
15
20
25
30
1500
1600
1700
1800
1900
2000
2100
10 12 14 16 18 20 22 24 26 28 30
E_ZM
[MPa]
Dry
density [kg/m3]
GWC [%]
Dry Density 0.740 1.046 1.281 1.479 1.654 2.615
0
2
4
6
8
10
1500
1600
1700
1800
1900
2000
2100
10 12 14 16 18 20 22 24 26 28 30
E_DM
[MPa]
Dry
density [kg/m3]
GWC [%]
Dry Density 0.76 0.99 1.19 1.40
0
2
4
6
8
10
1500
1600
1700
1800
1900
2000
2100
10 12 14 16 18 20 22 24 26 28 30
E_OM
[MPa]
Dry
density [kg/m3]
GWC [%]
Dry Density 0.83 1.18 1.50
Molds dried
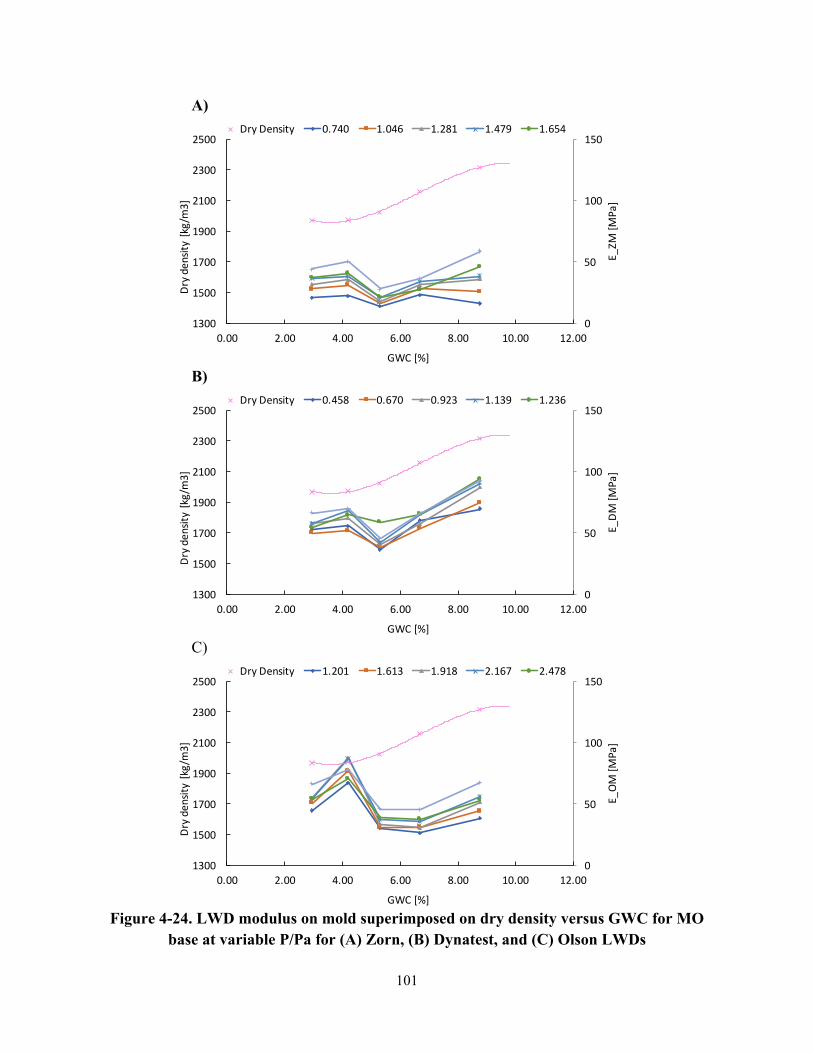
101
A)
B)
C)
Figure 4-24. LWD modulus on mold superimposed on dry density versus GWC for MO
base at variable P/Pa for (A) Zorn, (B) Dynatest, and (C) Olson LWDs
0
50
100
150
1300
1500
1700
1900
2100
2300
2500
0.00 2.00 4.00 6.00 8.00 10.00 12.00
E_ZM
[MPa]
Dry
density [kg/m3]
GWC [%]
Dry Density 0.740 1.046 1.281 1.479 1.654
0
50
100
150
1300
1500
1700
1900
2100
2300
2500
0.00 2.00 4.00 6.00 8.00 10.00 12.00E_DM
[MPa]
Dry
density [kg/m3]
GWC [%]
Dry Density 0.458 0.670 0.923 1.139 1.236
0
50
100
150
1300
1500
1700
1900
2100
2300
2500
0.00 2.00 4.00 6.00 8.00 10.00 12.00
E_OM
[MPa]
Dry
density [kg/m3]
GWC [%]
Dry Density 1.201 1.613 1.918 2.167 2.478
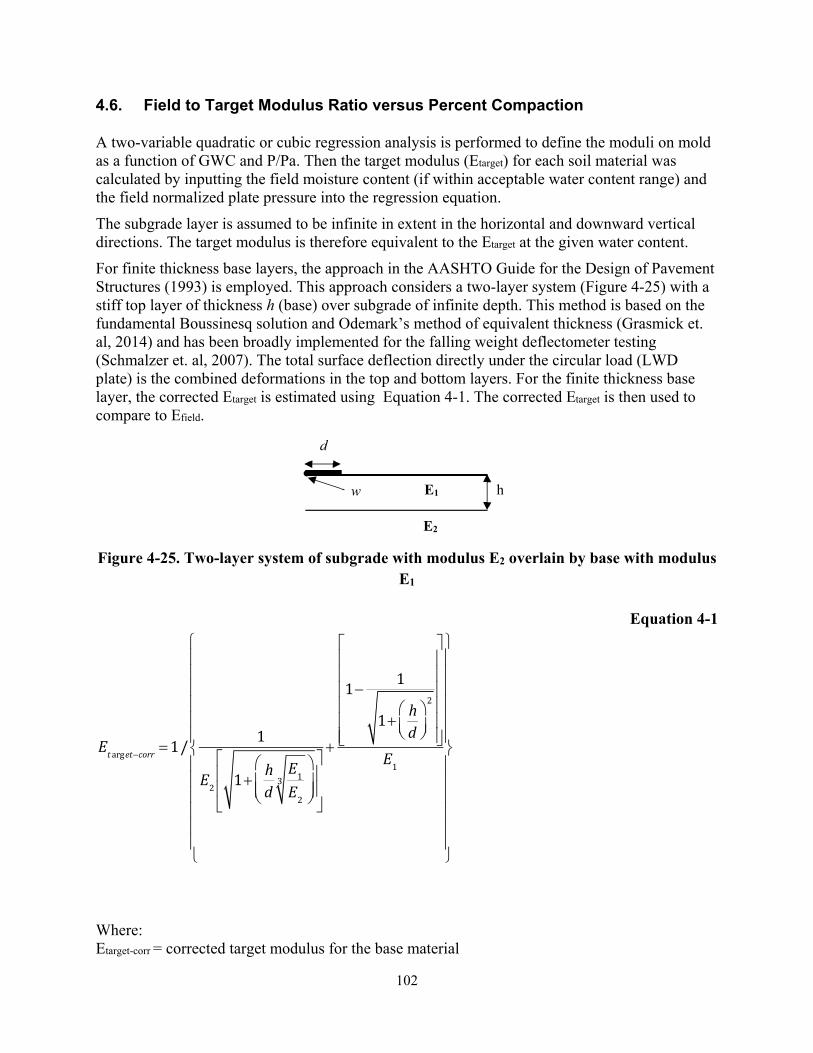
102
4.6. Field to Target Modulus Ratio versus Percent Compaction
A two-variable quadratic or cubic regression analysis is performed to define the moduli on mold as a function of GWC and P/Pa. Then the target modulus (Etarget) for each soil material was calculated by inputting the field moisture content (if within acceptable water content range) and the field normalized plate pressure into the regression equation.
The subgrade layer is assumed to be infinite in extent in the horizontal and downward vertical directions. The target modulus is therefore equivalent to the Etarget at the given water content.
For finite thickness base layers, the approach in the AASHTO Guide for the Design of Pavement Structures (1993) is employed. This approach considers a two-layer system (Figure 4-25) with a stiff top layer of thickness h (base) over subgrade of infinite depth. This method is based on the fundamental Boussinesq solution and Odemark’s method of equivalent thickness (Grasmick et. al, 2014) and has been broadly implemented for the falling weight deflectometer testing (Schmalzer et. al, 2007). The total surface deflection directly under the circular load (LWD plate) is the combined deformations in the top and bottom layers. For the finite thickness base layer, the corrected Etarget is estimated using Equation 4-1. The corrected Etarget is then used to compare to Efield.
Figure 4-25. Two-layer system of subgrade with modulus E2 overlain by base with modulus
E1
Equation 4-1
Where: Etarget-corr = corrected target modulus for the base material
Et arget�corr 1/1
E2 1� hd
E1E2
3§
©¨̈
·
¹¸̧
ª
¬
««
º
¼
»»
�
1� 1
1� hd
§©̈
·¹̧
2
ª
¬
««««««
º
¼
»»»»»»
E1
®
°°°°°°
¯
°°°°°°
½
¾
°°°°°°
¿
°°°°°°
d
h E1
E2
w
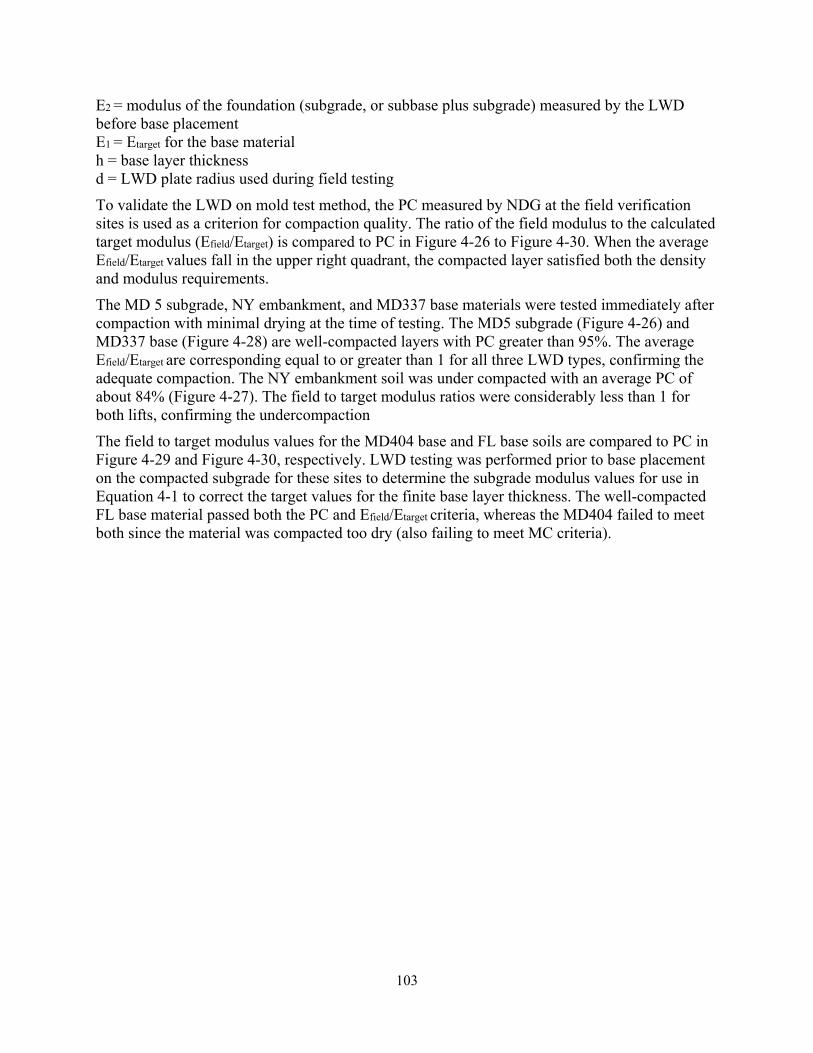
103
E2 = modulus of the foundation (subgrade, or subbase plus subgrade) measured by the LWD before base placement E1 = Etarget for the base material h = base layer thickness d = LWD plate radius used during field testing
To validate the LWD on mold test method, the PC measured by NDG at the field verification sites is used as a criterion for compaction quality. The ratio of the field modulus to the calculated target modulus (Efield/Etarget) is compared to PC in Figure 4-26 to Figure 4-30. When the average Efield/Etarget values fall in the upper right quadrant, the compacted layer satisfied both the density and modulus requirements.
The MD 5 subgrade, NY embankment, and MD337 base materials were tested immediately after compaction with minimal drying at the time of testing. The MD5 subgrade (Figure 4-26) and MD337 base (Figure 4-28) are well-compacted layers with PC greater than 95%. The average Efield/Etarget are corresponding equal to or greater than 1 for all three LWD types, confirming the adequate compaction. The NY embankment soil was under compacted with an average PC of about 84% (Figure 4-27). The field to target modulus ratios were considerably less than 1 for both lifts, confirming the undercompaction
The field to target modulus values for the MD404 base and FL base soils are compared to PC in Figure 4-29 and Figure 4-30, respectively. LWD testing was performed prior to base placement on the compacted subgrade for these sites to determine the subgrade modulus values for use in Equation 4-1 to correct the target values for the finite base layer thickness. The well-compacted FL base material passed both the PC and Efield/Etarget criteria, whereas the MD404 failed to meet both since the material was compacted too dry (also failing to meet MC criteria).
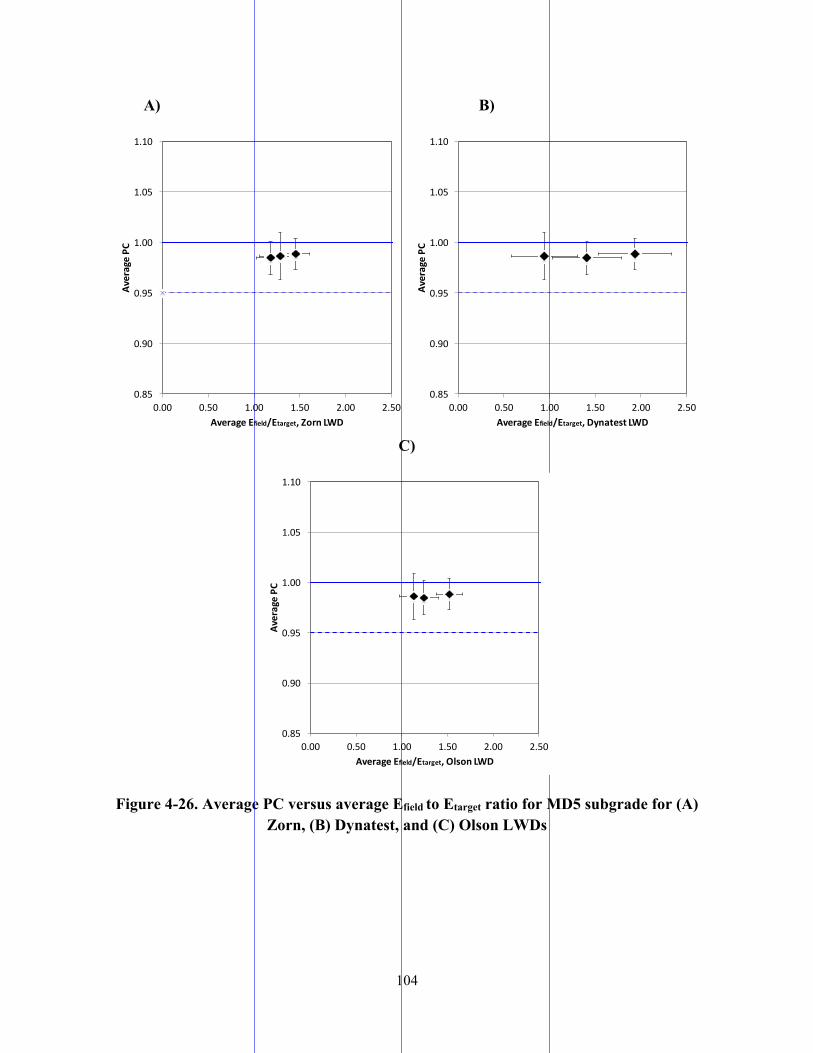
104
A) B)
C)
Figure 4-26. Average PC versus average Efield to Etarget ratio for MD5 subgrade for (A) Zorn, (B) Dynatest, and (C) Olson LWDs
0.85
0.90
0.95
1.00
1.05
1.10
0.00 0.50 1.00 1.50 2.00 2.50
Average PC
Average Efield/Etarget, Zorn LWD
0.85
0.90
0.95
1.00
1.05
1.10
0.00 0.50 1.00 1.50 2.00 2.50Av
erage PC
Average Efield/Etarget, Dynatest LWD
0.85
0.90
0.95
1.00
1.05
1.10
0.00 0.50 1.00 1.50 2.00 2.50
Average PC
Average Efield/Etarget, Olson LWD
105
A) B)
C)
Figure 4-27. Average PC versus average Efield to Etarget ratio for NY embankment soil for (A) Zorn, (B) Dynatest, and (C) Olson LWDs
0.70
0.75
0.80
0.85
0.90
0.95
1.00
1.05
1.10
0.00 0.50 1.00 1.50
Average PC
Average Efield/Etarget , Zorn LWD
Lift 1 Lift 2 PC=100% Efield/Etarget=1 PC=95%
0.70
0.75
0.80
0.85
0.90
0.95
1.00
1.05
1.10
0.00 0.50 1.00 1.50
Average PC
Average Efield/Etarget, Dynatest LWD
Lift 1 Lift 2 PC=100% Efield/Etarget=1 PC=95%
0.70
0.75
0.80
0.85
0.90
0.95
1.00
1.05
1.10
0.00 0.50 1.00 1.50
Average PC
Average Efield/Etarget, Olson LWD
Lift 1 Lift 2 PC=100% Efield/Etarget=1
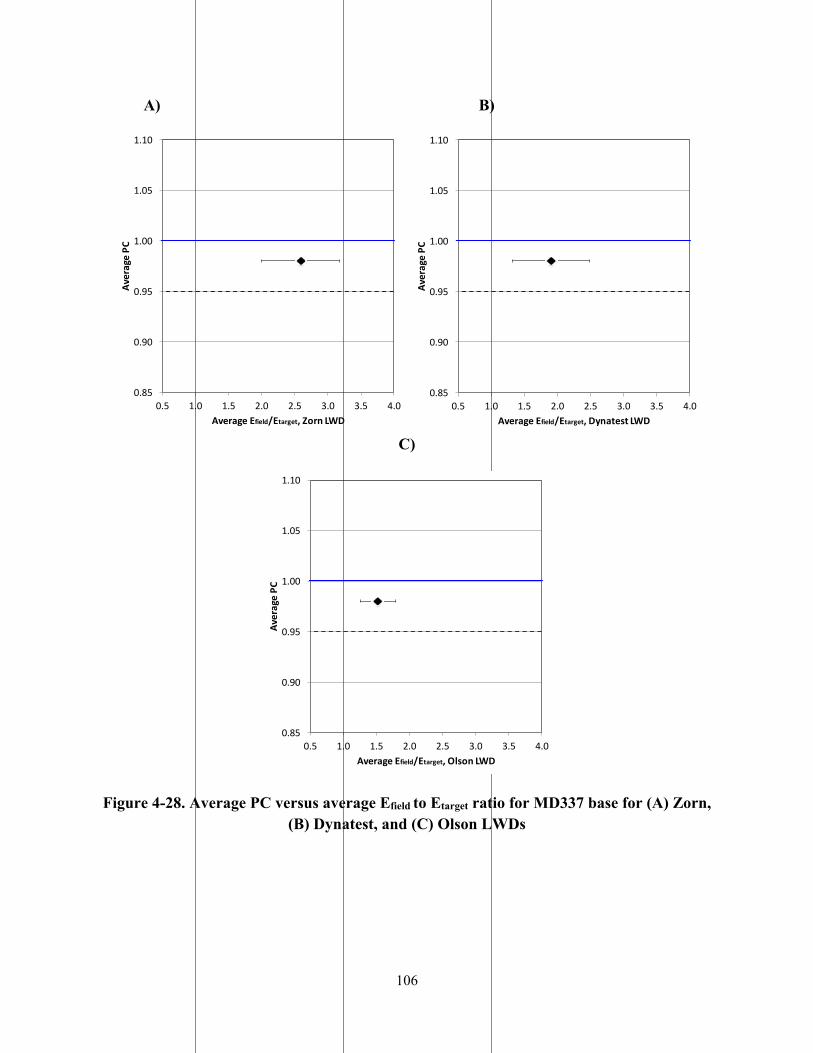
106
A) B)
C)
Figure 4-28. Average PC versus average Efield to Etarget ratio for MD337 base for (A) Zorn,
(B) Dynatest, and (C) Olson LWDs
0.85
0.90
0.95
1.00
1.05
1.10
0.5 1.0 1.5 2.0 2.5 3.0 3.5 4.0
Average PC
Average Efield/Etarget, Zorn LWD
0.85
0.90
0.95
1.00
1.05
1.10
0.5 1.0 1.5 2.0 2.5 3.0 3.5 4.0Av
erage PC
Average Efield/Etarget, Dynatest LWD
0.85
0.90
0.95
1.00
1.05
1.10
0.5 1.0 1.5 2.0 2.5 3.0 3.5 4.0
Average PC
Average Efield/Etarget, Olson LWD
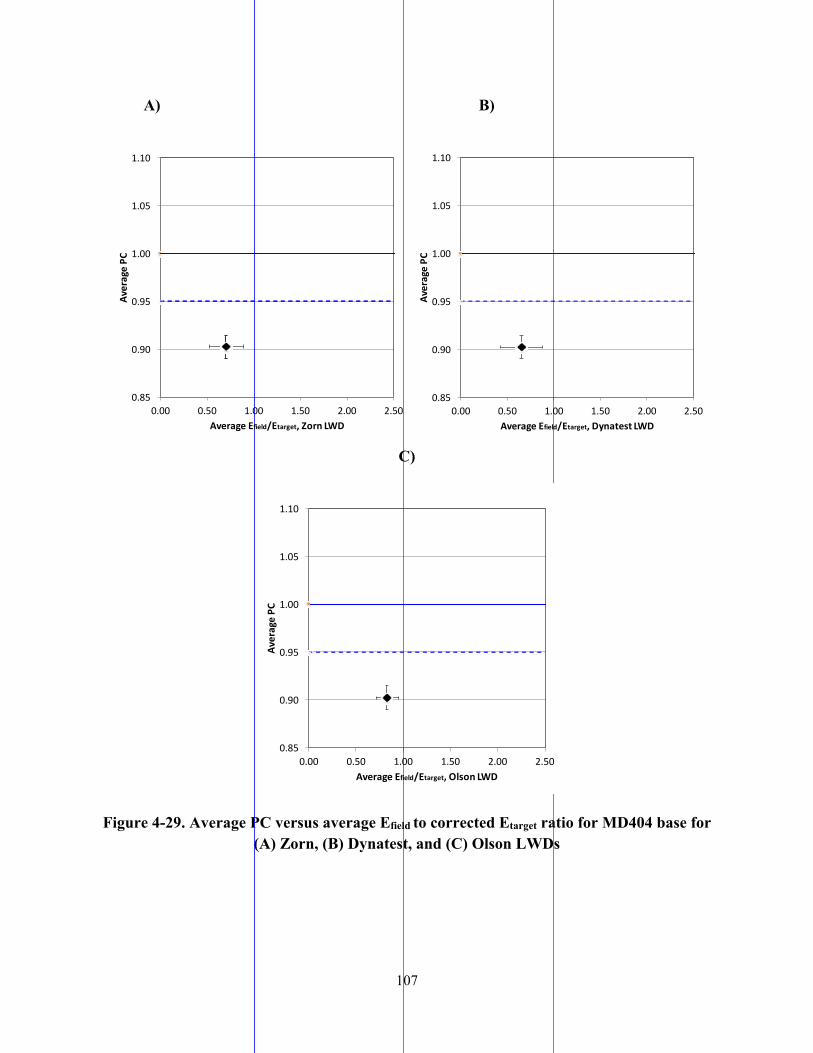
107
A) B)
C)
Figure 4-29. Average PC versus average Efield to corrected Etarget ratio for MD404 base for
(A) Zorn, (B) Dynatest, and (C) Olson LWDs
0.85
0.90
0.95
1.00
1.05
1.10
0.00 0.50 1.00 1.50 2.00 2.50
Average PC
Average Efield/Etarget, Zorn LWD
0.85
0.90
0.95
1.00
1.05
1.10
0.00 0.50 1.00 1.50 2.00 2.50Av
erage PC
Average Efield/Etarget, Dynatest LWD
0.85
0.90
0.95
1.00
1.05
1.10
0.00 0.50 1.00 1.50 2.00 2.50
Average PC
Average Efield/Etarget, Olson LWD
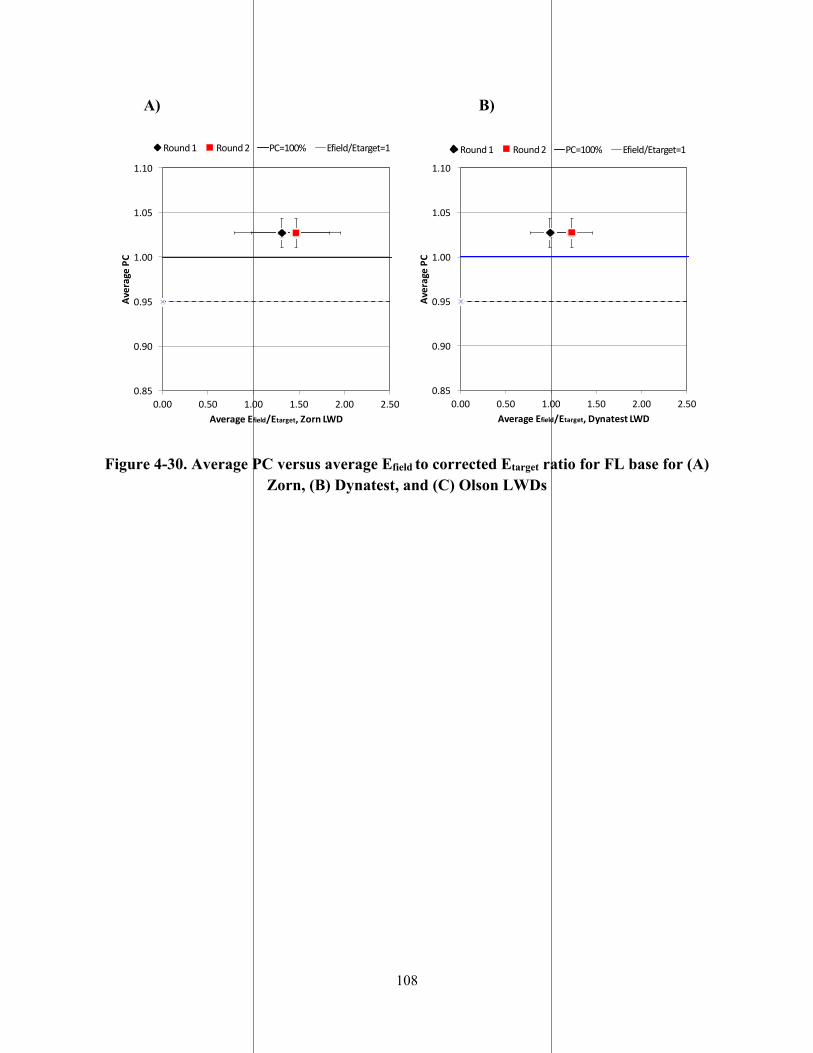
108
A) B)
Figure 4-30. Average PC versus average Efield to corrected Etarget ratio for FL base for (A) Zorn, (B) Dynatest, and (C) Olson LWDs
0.85
0.90
0.95
1.00
1.05
1.10
0.00 0.50 1.00 1.50 2.00 2.50
Average PC
Average Efield/Etarget, Zorn LWD
Round 1 Round 2 PC=100% Efield/Etarget=1
0.85
0.90
0.95
1.00
1.05
1.10
0.00 0.50 1.00 1.50 2.00 2.50
Average PC
Average Efield/Etarget, Dynatest LWD
Round 1 Round 2 PC=100% Efield/Etarget=1
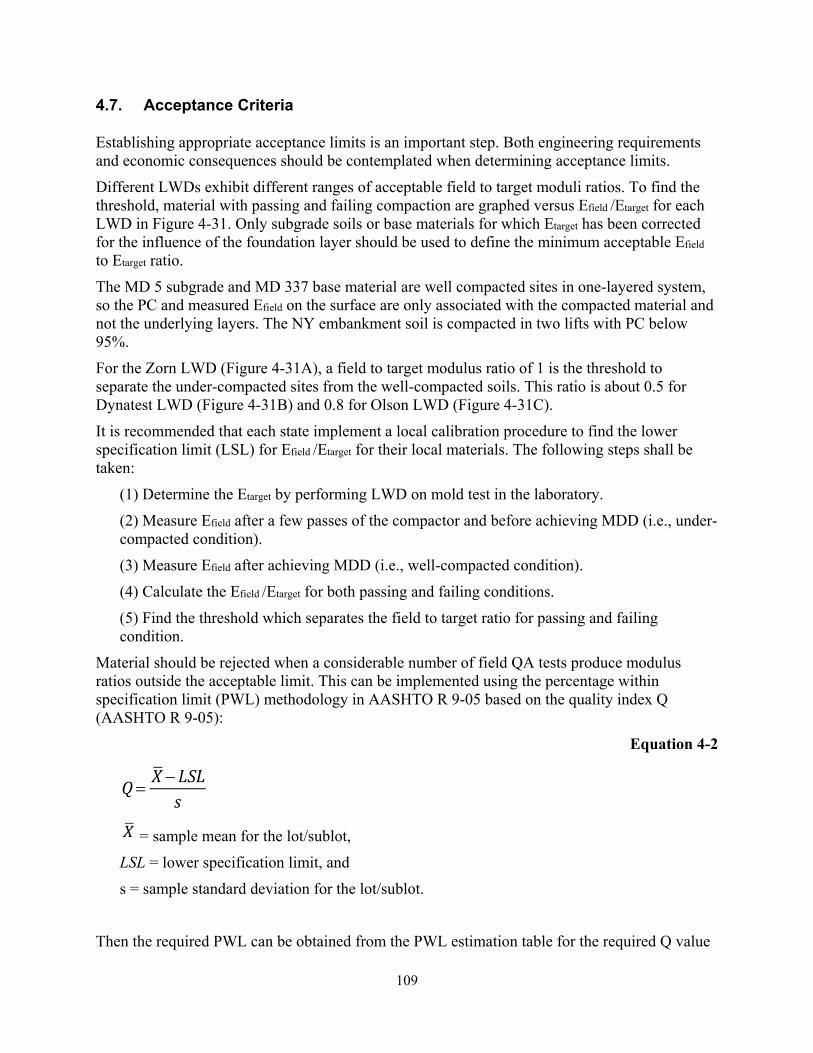
109
4.7. Acceptance Criteria
Establishing appropriate acceptance limits is an important step. Both engineering requirements and economic consequences should be contemplated when determining acceptance limits.
Different LWDs exhibit different ranges of acceptable field to target moduli ratios. To find the threshold, material with passing and failing compaction are graphed versus Efield /Etarget for each LWD in Figure 4-31. Only subgrade soils or base materials for which Etarget has been corrected for the influence of the foundation layer should be used to define the minimum acceptable Efield
to Etarget ratio.
The MD 5 subgrade and MD 337 base material are well compacted sites in one-layered system, so the PC and measured Efield on the surface are only associated with the compacted material and not the underlying layers. The NY embankment soil is compacted in two lifts with PC below 95%.
For the Zorn LWD (Figure 4-31A), a field to target modulus ratio of 1 is the threshold to separate the under-compacted sites from the well-compacted soils. This ratio is about 0.5 for Dynatest LWD (Figure 4-31B) and 0.8 for Olson LWD (Figure 4-31C).
It is recommended that each state implement a local calibration procedure to find the lower specification limit (LSL) for Efield /Etarget for their local materials. The following steps shall be taken:
(1) Determine the Etarget by performing LWD on mold test in the laboratory.
(2) Measure Efield after a few passes of the compactor and before achieving MDD (i.e., under-compacted condition).
(3) Measure Efield after achieving MDD (i.e., well-compacted condition).
(4) Calculate the Efield /Etarget for both passing and failing conditions.
(5) Find the threshold which separates the field to target ratio for passing and failing condition.
Material should be rejected when a considerable number of field QA tests produce modulus ratios outside the acceptable limit. This can be implemented using the percentage within specification limit (PWL) methodology in AASHTO R 9-05 based on the quality index Q (AASHTO R 9-05):
Equation 4-2
= sample mean for the lot/sublot,
LSL = lower specification limit, and
s = sample standard deviation for the lot/sublot.
Then the required PWL can be obtained from the PWL estimation table for the required Q value
Q X �LSLs
X
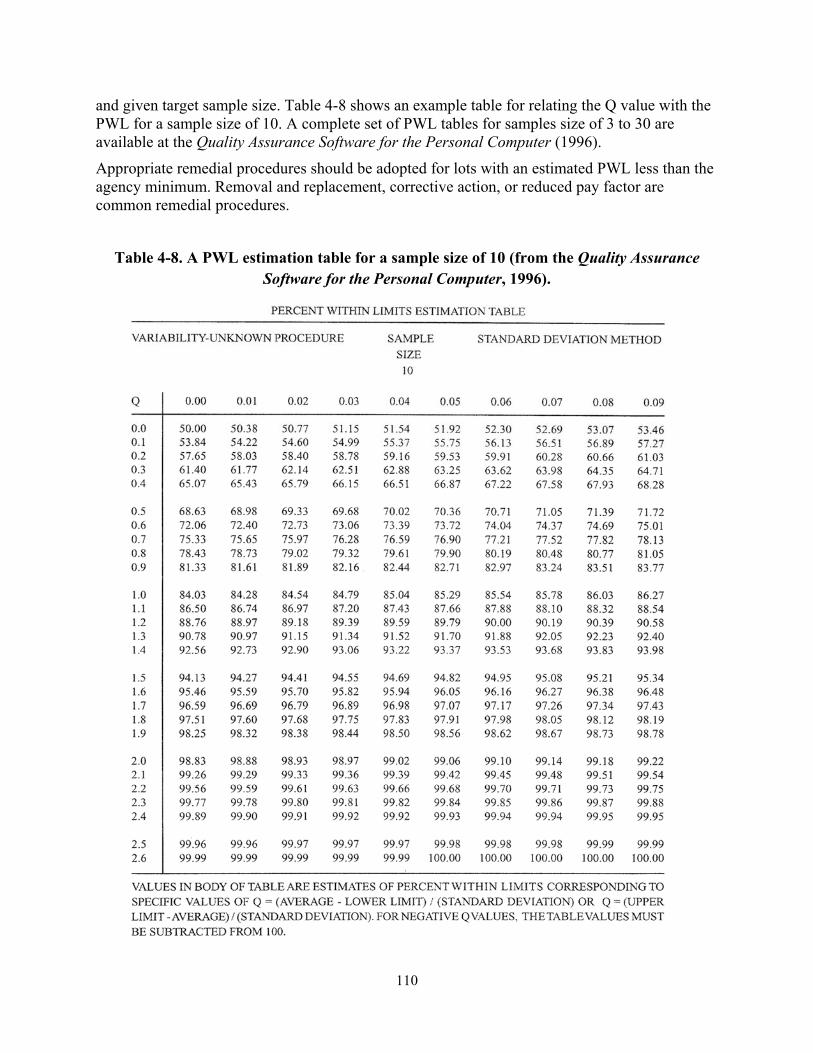
110
and given target sample size. Table 4-8 shows an example table for relating the Q value with the PWL for a sample size of 10. A complete set of PWL tables for samples size of 3 to 30 are available at the Quality Assurance Software for the Personal Computer (1996).
Appropriate remedial procedures should be adopted for lots with an estimated PWL less than the agency minimum. Removal and replacement, corrective action, or reduced pay factor are common remedial procedures.
Table 4-8. A PWL estimation table for a sample size of 10 (from the Quality Assurance Software for the Personal Computer, 1996).
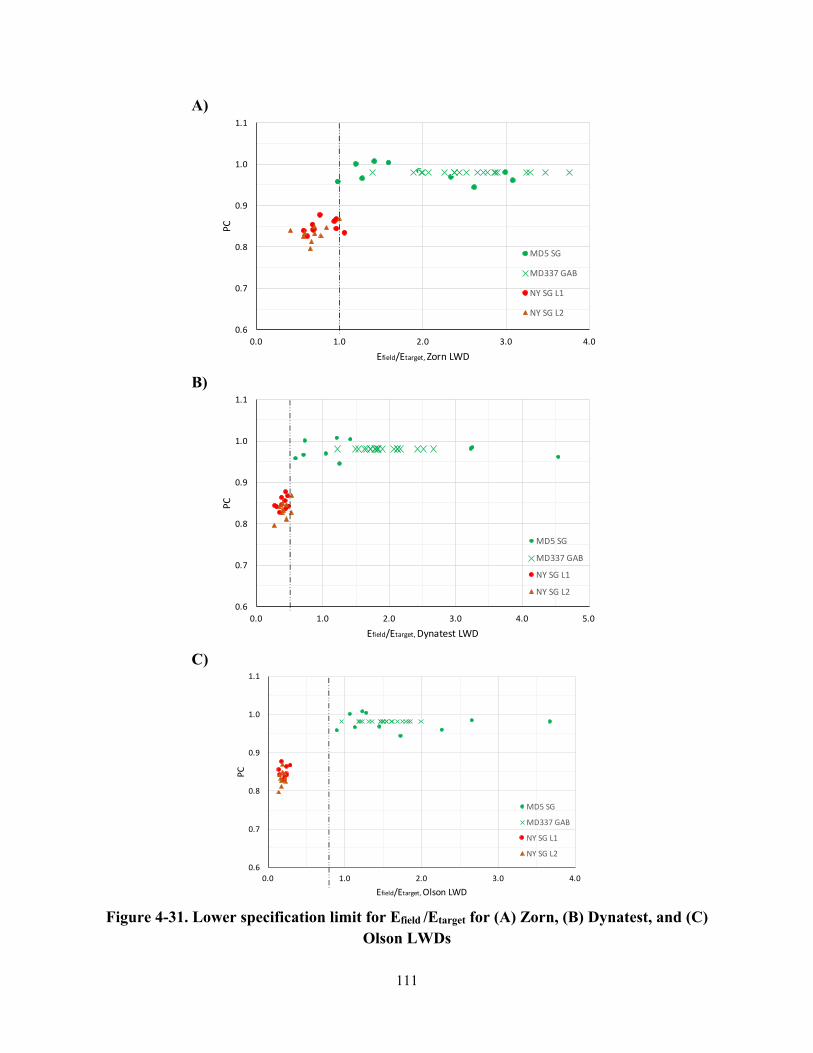
111
A)
B)
C)
Figure 4-31. Lower specification limit for Efield /Etarget for (A) Zorn, (B) Dynatest, and (C)
Olson LWDs
0.6
0.7
0.8
0.9
1.0
1.1
0.0 1.0 2.0 3.0 4.0
PC
Efield/Etarget, Zorn LWD
MD5 SG
MD337 GAB
NY SG L1
NY SG L2
0.6
0.7
0.8
0.9
1.0
1.1
0.0 1.0 2.0 3.0 4.0 5.0
PC
Efield/Etarget, Dynatest LWD
MD5 SG
MD337 GAB
NY SG L1
NY SG L2
0.6
0.7
0.8
0.9
1.0
1.1
0.0 1.0 2.0 3.0 4.0
PC
Efield/Etarget, Olson LWD
MD5 SG
MD337 GAB
NY SG L1
NY SG L2
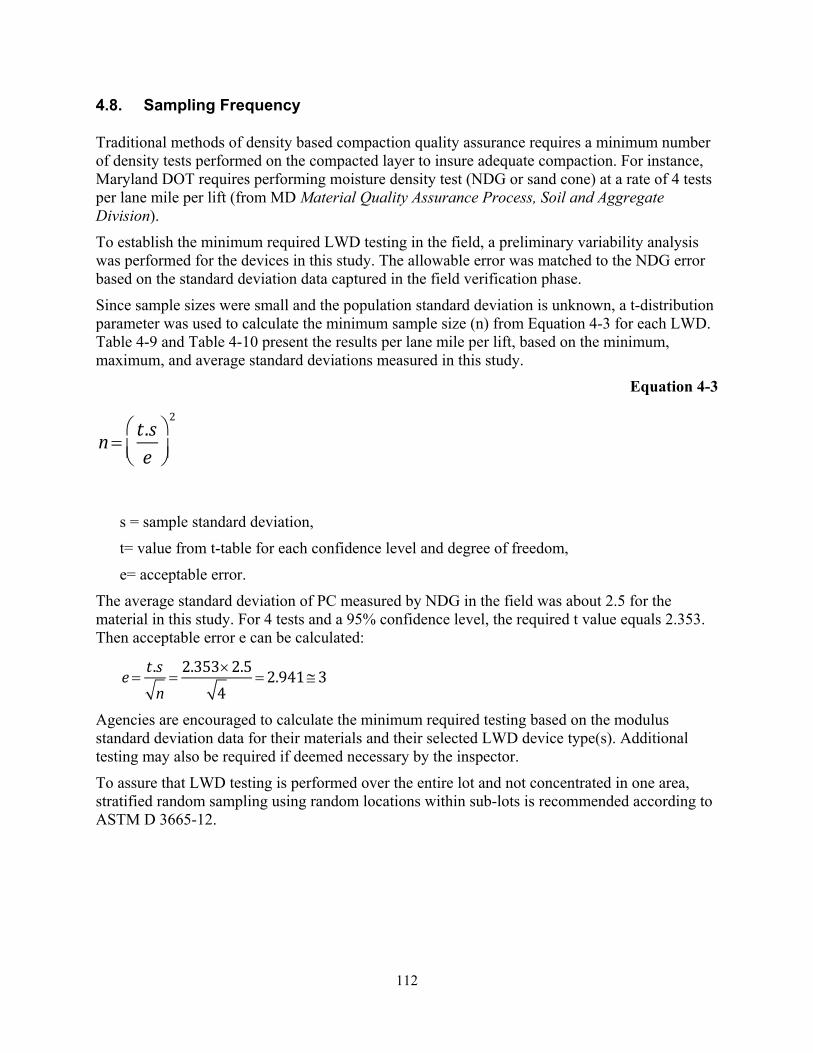
112
4.8. Sampling Frequency
Traditional methods of density based compaction quality assurance requires a minimum number of density tests performed on the compacted layer to insure adequate compaction. For instance, Maryland DOT requires performing moisture density test (NDG or sand cone) at a rate of 4 tests per lane mile per lift (from MD Material Quality Assurance Process, Soil and Aggregate Division).
To establish the minimum required LWD testing in the field, a preliminary variability analysis was performed for the devices in this study. The allowable error was matched to the NDG error based on the standard deviation data captured in the field verification phase.
Since sample sizes were small and the population standard deviation is unknown, a t-distribution parameter was used to calculate the minimum sample size (n) from Equation 4-3 for each LWD. Table 4-9 and Table 4-10 present the results per lane mile per lift, based on the minimum, maximum, and average standard deviations measured in this study.
Equation 4-3
s = sample standard deviation,
t= value from t-table for each confidence level and degree of freedom,
e= acceptable error.
The average standard deviation of PC measured by NDG in the field was about 2.5 for the material in this study. For 4 tests and a 95% confidence level, the required t value equals 2.353. Then acceptable error e can be calculated:
Agencies are encouraged to calculate the minimum required testing based on the modulus standard deviation data for their materials and their selected LWD device type(s). Additional testing may also be required if deemed necessary by the inspector.
To assure that LWD testing is performed over the entire lot and not concentrated in one area, stratified random sampling using random locations within sub-lots is recommended according to ASTM D 3665-12.
n t .se
§
©̈
·
¹̧
2
e t .sn 2.353u2.5
4 2.941#3
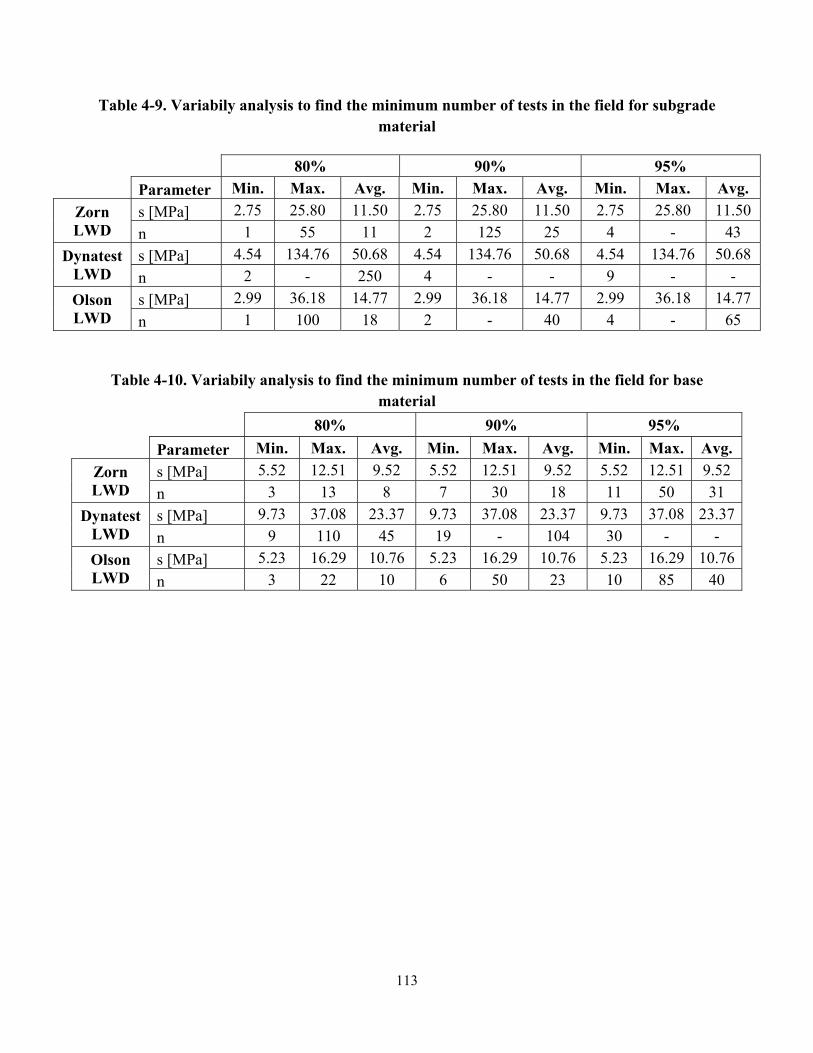
113
Table 4-9. Variabily analysis to find the minimum number of tests in the field for subgrade material
80% 90% 95%
Parameter Min. Max. Avg. Min. Max. Avg. Min. Max. Avg. Zorn LWD
s [MPa] 2.75 25.80 11.50 2.75 25.80 11.50 2.75 25.80 11.50 n 1 55 11 2 125 25 4 - 43
Dynatest LWD
s [MPa] 4.54 134.76 50.68 4.54 134.76 50.68 4.54 134.76 50.68 n 2 - 250 4 - - 9 - -
Olson LWD
s [MPa] 2.99 36.18 14.77 2.99 36.18 14.77 2.99 36.18 14.77 n 1 100 18 2 - 40 4 - 65
Table 4-10. Variabily analysis to find the minimum number of tests in the field for base material
80% 90% 95%
Parameter Min. Max. Avg. Min. Max. Avg. Min. Max. Avg. Zorn LWD
s [MPa] 5.52 12.51 9.52 5.52 12.51 9.52 5.52 12.51 9.52 n 3 13 8 7 30 18 11 50 31
Dynatest LWD
s [MPa] 9.73 37.08 23.37 9.73 37.08 23.37 9.73 37.08 23.37n 9 110 45 19 - 104 30 - -
Olson LWD
s [MPa] 5.23 16.29 10.76 5.23 16.29 10.76 5.23 16.29 10.76n 3 22 10 6 50 23 10 85 40
114
Chapter 5
5. SPECIFICATION DEVELOPMENT
The research findings are summarized in two test procedures suitable for implementation by state DOTs and engineers for modulus-based QA. The specifications are prepared in AASHTO format, which is familiar to the construction community and highway agencies. The goals of the test specifications are ease of implementation and not to increase field workload significantly. The specifications provided herein are written broadly; each agency can tailor them to meet their local needs.
115
5.1. Laboratory Determination of Target Modulus Using LWD Drops on Compacted Proctor Mold
Standard Method of Test for
Laboratory Determination of Target Modulus Using Light-Weight Deflectometer (LWD) Drops on Compacted Proctor Mold AASHTO Designation: TP 123-01 (2017) 1. SCOPE 1.1. This test method describes the procedure to determine the target modulus (or
deflection) required for compaction quality control of geomaterials using Light Weight Deflectometer (LWD) drops on a compacted Proctor mold in the laboratory.
1.2. The same LWD type in terms of brand name, buffer stiffness, and deflection
measurement location (on top of the plate or on top of the soil layer) used for the laboratory target modulus testing must be used during the field testing. This is to eliminate differences between measurements from different devices.
1.3. This procedure shall be performed in the laboratory on representative soil samples
before the field compaction operations. 1.4. Gradation, moisture content inconsistency, and surface texture on the mold can
affect the material moduli results. 1.5. The target surface modulus values can be compared to the field measured
modulus in accordance with the TP 456-01 specification for compaction quality control/quality assurance purposes.
2. REFERENCED DOCUMENTS 2.1. AASHTO Standards:
� T 99, Moisture-Density Relations of Soils Using a 2.5-kg (5.5-lb) Rammer and a 305-mm (12-in.) Drop
� T 180, Moisture-Density Relations of Soils Using a 4.54-kg (10-lb) Rammer and a 457-mm (18-in.) Drop
� T 265, Laboratory Determination of Moisture Content of Soils
116
� T 248, Method of Test for Reducing Samples of Aggregate to Testing Size � TP 456-01, Compaction Quality Control Using Light Weight Deflectometer
2.2. ASTM Standards:
� E 2583-07, Measuring Deflections with a Light Weight Deflectometer (LWD) � E 2835-11, Measuring Deflections using a Portable Impulse Plate Load Test
Device � D 3665-12, Standard Practice for Random Sampling of Construction Materials
3. APPARATUS 3.1. Mold— Solid-wall, metal cylinders with dimensions and specification conforming
to Section 3.1 of T 99 or T 180. Only 152.4-mm (6-in.) diameter molds conforming to Section 3.1.2 T 99 or T 180 shall be used.
3.2. Rammer—A metal rammer conforming to Section 3.2 of T 99 for standard compaction energy or Section 3.2 of T 180 for modified compaction energy.
3.3. LWD— 3.3.1 The LWD testing apparatus should conform to the general requirements of
Section 5 of either ASTM E 2583 for LWDs with load cells or ASTM E 2835 for LWDs without load cells.
3.3.2 The signal conditioning and recording of the LWD testing apparatus should conform to either Sections 8 of ASTM E 2583 for LWDs with load cells or Section 6 of ASTM E 2835 for LWDs without load cells.
3.3.3 The LWD testing apparatus should be regularly calibrated and verified according
to the requirements of Sections 7 of ASTM E 2583 for LWDs with load cells or Sections 7 and 8 of ASTM E 2835 for LWDs without load cells.
3.3.4 The precision and bias of the LWD testing apparatus shall conform to Sections 10.1-10.2 of ASTM E 2583 for LWDs with load cells or Sections 14.1-14.2 of ASTM E 2835 for LWDs without load cells.
3.4. Miscellaneous Equipment— Balances and scales, drying oven, straightedge,
sieves, mixing tools, and containers conforming to the requirements of Sections 3.4 through 3.9 in T 99 or T 180. A sample splitter or a similar tool conforming to the requirements of T 248.
4. PROCEDURE 4.1. This test is to be conducted as an add-on to the Proctor method of moisture-
density relations of soils. Refer to T 99 or T 180, method B or D for the compaction of the specimen with three to five different moisture contents. Below
117
is a highlight of the steps and cautions that should be taken:
4.1.1 Take a sample of approximately 40 kg (~90 lb) required for compaction of the Proctor molds from the construction material according to ASTM D 3665.
4.1.2. Separate an appropriate quantity of about 7 kg (~15 lb) or more from the
representative soil for the compaction of one mold according to T 248. Note 1—Exclude oversize particle if the total retaining is less than 10% on the largest sieve size.
4.1.3. Use standard compaction energy according to methods B or D of T 99 or
modified compaction energy of T 180 to compact the specimen. Moisture content of the specimen can be selected roughly four percentage points below the material optimum moisture content based on experience, then added until the compaction curve is achieved (optional). Note 2—Spread a uniform thickness including particles from all gradations in each layer. Note 3—Avoid compacting and testing on a too damp soil where permanent deformation is observed after dropping the weight or excessive water is drained from the mold during the testing.
4.2. Rest the mold on a stable solid foundation or concrete floor. Carefully place the
LWD with a 150-mm (5.905-in.) diameter loading plate on top of the mold and rotate approximately 45° back and forth to seat the plate. Any lateral movement of the plate with successive drops should be minimized. Note 4—The diameter of the LWD plate is almost equal to mold diameter, so the plate should clear the rim of the mold (Figure 1, Appendix). Note 5—A collar can be attached after trimming the compacted surface to help keep the LWD loading plate in place.
4.3. Hold the LWD rod vertical and conduct six drops at each drop height; Three
seating drops followed by three measurement drops by raising the falling weight to each reduced drop height, then allowing the weight to fall freely without lateral movements. Start from the lowest drop height, then increase the height. Refer to ASTM E 2583, ASTM E 2853, and the LWD device manuals from the manufacturer for further instruction. Note 6—Drops from reduced heights are used to monitor the stress dependency of material and permit interpolation/ extrapolation to the field plate pressure. Table 1 in the Appendix recommends drop heights for Zorn, Dynatest, and Olson LWDs with standard 10 kg (22 lb) drop weights. Note 7— The generated force by the drop should deliver a half-sine or haversine shaped load with pulse duration of between 20 and 40 msecs for the devices with load cells (Section 5.3, ASTM E 2583) and between 10 and 30 msecs for devices without load cells (Section 5.4, ASTM E 2835). The load pulse duration depends on the soil stiffness and can be adjusted by altering the LWD buffer stiffness, plate size, and drop mass weight.
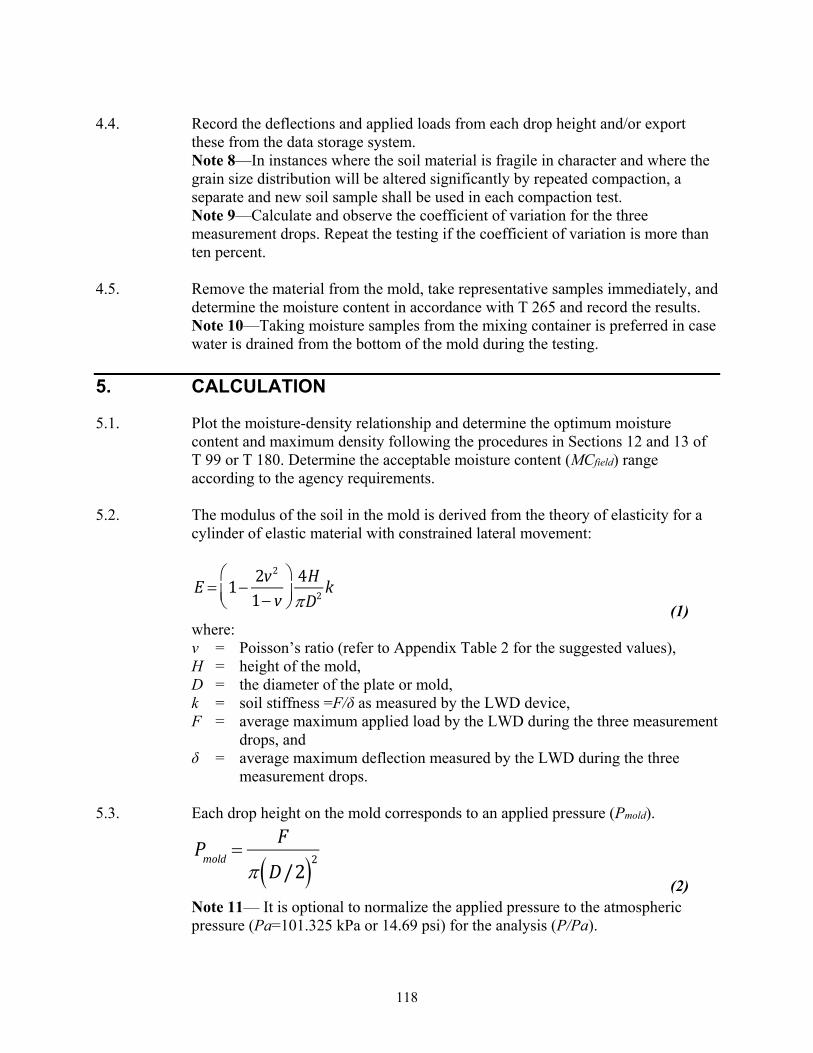
118
4.4. Record the deflections and applied loads from each drop height and/or export
these from the data storage system. Note 8—In instances where the soil material is fragile in character and where the grain size distribution will be altered significantly by repeated compaction, a separate and new soil sample shall be used in each compaction test. Note 9—Calculate and observe the coefficient of variation for the three measurement drops. Repeat the testing if the coefficient of variation is more than ten percent.
4.5. Remove the material from the mold, take representative samples immediately, and
determine the moisture content in accordance with T 265 and record the results. Note 10—Taking moisture samples from the mixing container is preferred in case water is drained from the bottom of the mold during the testing.
5. CALCULATION 5.1. Plot the moisture-density relationship and determine the optimum moisture
content and maximum density following the procedures in Sections 12 and 13 of T 99 or T 180. Determine the acceptable moisture content (MCfield) range according to the agency requirements.
5.2. The modulus of the soil in the mold is derived from the theory of elasticity for a
cylinder of elastic material with constrained lateral movement:
(1) where: v = Poisson’s ratio (refer to Appendix Table 2 for the suggested values), H = height of the mold, D = the diameter of the plate or mold, k = soil stiffness =F/δ as measured by the LWD device, F = average maximum applied load by the LWD during the three measurement
drops, and δ = average maximum deflection measured by the LWD during the three
measurement drops. 5.3. Each drop height on the mold corresponds to an applied pressure (Pmold).
(2) Note 11— It is optional to normalize the applied pressure to the atmospheric pressure (Pa=101.325 kPa or 14.69 psi) for the analysis (P/Pa).
E 1� 2v21� v
§
©̈
·
¹̧4HSD2 k
Pmold F
S D/2� �2
119
Note 12—For LWD devices that do not have a load cell (ASTM E 2835), the magnitude of the peak load for the lower drop heights is estimated as being proportional to the square root of the drop height. Alternatively, the load for LWD devices that do not have a load cell can be calibrated for reduced drop heights.
5.4. A two-variable quadratic regression analysis should be performed to find the
regression coefficients for LWD modulus measured on the mold as a function of the moisture content (MCmold) and plate pressure.
(3) where: a0, a1, a2, a3, a4 = regression coefficients. 5.5. The range of material target moduli values (Etarget) shall be obtained by inputting
the acceptable moisture content range from Section 5.1 and the field plate pressure into the regression equation.
(4) Note 13—Field plate pressure (Pfield) varies depending on the plate size and drop weight and can be determined as follows:
(5) where: Ffield = applied load from the LWD in the field, and Dfield = the diameter of the LWD plate in the field.
5.6. The target modulus can be compared to the measured field modulus (Efield) to assess the compaction quality following TP 456-01 Section 5.
6. REPORT 6.1. The test report shall include the following:
� Acceptable moisture content range in percent to the nearest whole number. � Maximum laboratory dry density value in kilograms per cubic meter to the
nearest 10 kg/m3 or in pounds per cubic foot to the nearest whole number. � The LWD device type used in laboratory testing on Proctor mold, the drop
weight and plate diameter. � LWD device to be used in the field, drop weight and plate diameter. � Material target modulus range for 200-mm (7.87-in.) and/or 300-mm (11.81-
in.) LWD plate sizes. � Any corrections made in the reported values and the reason for the corrections
(e.g. oversized particles, excessive water drainage unstable LWD plate, and/or poor contact with the compacted soil in the mold).
E a0 �a1 uMCmold �a2 uMCmold2 �a3 uPmold �a4 uPmold
2
Etaregt a0 �a1 uMC field �a2 uMC field2 �a3 uPfield �a4 uPfield
2
Pfield Ffield
SDfield
2§
©¨
·
¹¸
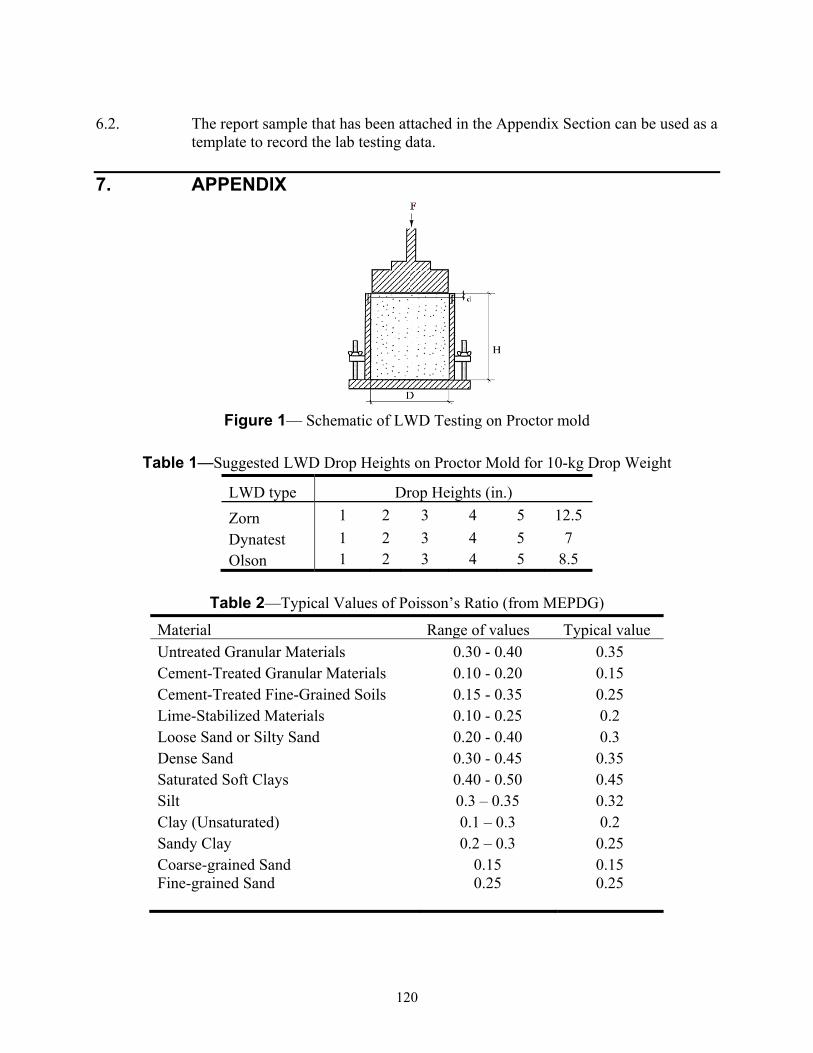
120
6.2. The report sample that has been attached in the Appendix Section can be used as a
template to record the lab testing data.
7. APPENDIX
Figure 1— Schematic of LWD Testing on Proctor mold
Table 1—Suggested LWD Drop Heights on Proctor Mold for 10-kg Drop Weight
LWD type Drop Heights (in.)Zorn 1 2 3 4 5 12.5 Dynatest 1 2 3 4 5 7 Olson 1 2 3 4 5 8.5
Table 2—Typical Values of Poisson’s Ratio (from MEPDG)
Material Range of values Typical value Untreated Granular Materials 0.30 - 0.40 0.35 Cement-Treated Granular Materials 0.10 - 0.20 0.15 Cement-Treated Fine-Grained Soils 0.15 - 0.35 0.25 Lime-Stabilized Materials 0.10 - 0.25 0.2 Loose Sand or Silty Sand 0.20 - 0.40 0.3 Dense Sand 0.30 - 0.45 0.35 Saturated Soft Clays 0.40 - 0.50 0.45 Silt 0.3 – 0.35 0.32 Clay (Unsaturated) 0.1 – 0.3 0.2 Sandy Clay 0.2 – 0.3 0.25 Coarse-grained Sand 0.15 0.15 Fine-grained Sand
0.25 0.25
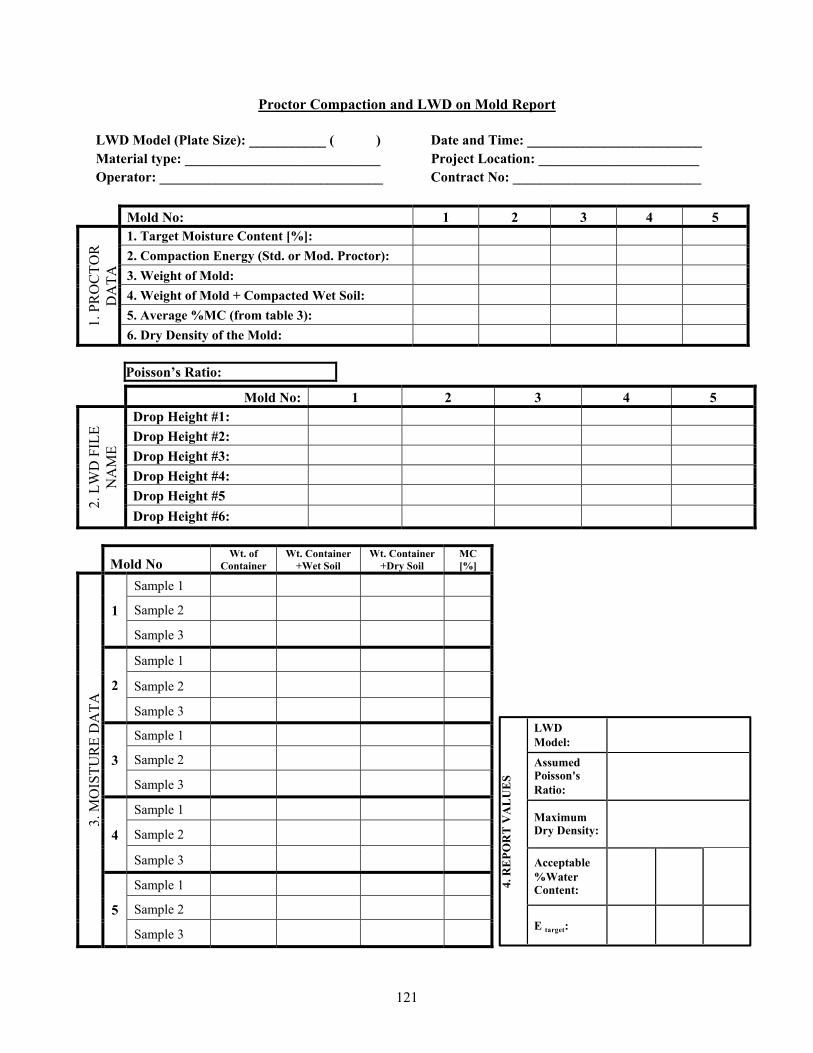
121
Proctor Compaction and LWD on Mold Report LWD Model (Plate Size): ___________ ( ) Date and Time: _________________________ Material type: ____________________________ Project Location: _______________________ Operator: ________________________________ Contract No: ___________________________
Mold No: 1 2 3 4 5
1. P
RO
CTO
R
DA
TA
1. Target Moisture Content [%]: 2. Compaction Energy (Std. or Mod. Proctor): 3. Weight of Mold: 4. Weight of Mold + Compacted Wet Soil: 5. Average %MC (from table 3): 6. Dry Density of the Mold:
Poisson’s Ratio:
Mold No: 1 2 3 4 5
2. L
WD
FIL
E N
AM
E
Drop Height #1: Drop Height #2: Drop Height #3: Drop Height #4: Drop Height #5 Drop Height #6:
Mold No Wt. of
Container Wt. Container
+Wet Soil Wt. Container
+Dry Soil MC [%]
3. M
OIS
TUR
E D
ATA
1
Sample 1 Sample 2 Sample 3
2
Sample 1 Sample 2 Sample 3
3
Sample 1 Sample 2 Sample 3
4
Sample 1 Sample 2 Sample 3
5
Sample 1 Sample 2 Sample 3
4. R
EPO
RT
VA
LU
ES
LWD Model:
Assumed Poisson's Ratio:
Maximum Dry Density:
Acceptable %Water Content:
E target:
122
5.2. Compaction Quality Control Using Light Weight Deflectometer (LWD)
Standard Method of Test for
Compaction Quality Control Using Light Weight Deflectometer (LWD) AASHTO Designation: TP 456-01 (2017) 1. SCOPE 1.1. This specification describes the procedure to assure the compaction quality of a
road base or subgrade by comparing the field surface moduli to the laboratory determined target moduli using a Light Weight Deflectometer (LWD).
1.2. The same LWD type in terms of brand name, buffer stiffness, and deflection
measurement location (on top of the plate or on top of the soil layer) used for the laboratory target modulus testing must be used during the field testing. This is to eliminate differences between measurements from different devices.
1.3. This procedure shall be performed within two hours after compaction to eliminate
the effect of surface drying on the modulus values. This method does not count for post compaction wetting/drying and environmental effects.
1.4. An appropriate in situ method of soil moisture content measurement shall be used
to rapidly determine the moisture content at the time of compaction and testing. 1.5. The target modulus should be corrected for a base or subbase layer of finite
thickness compacted over subgrade. 2. REFERENCED DOCUMENTS 2.1. AASHTO Standards:
� T 265, Laboratory Determination of Moisture Content of Soils � R 9-05, Acceptance Sampling Plans for Highway Construction � AASHTO Guide for the Design of Pavement Structures (1993) � TP 123-01, Laboratory Determination of Target Modulus Using Light-Weight
Deflectometer Drops on Compacted Proctor Mold
2.2. ASTM Standards: � E 2583-07, Measuring Deflections with a Light Weight Deflectometer (LWD) � E 2835-11, Measuring Deflections using a Portable Impulse Plate Load Test
123
Device � D 3665-12, Standard Practice for Random Sampling of Construction Materials � D 4643-00, Determination of Water (Moisture) Content of Soil by the
Microwave Oven Heating � D 4944-11, Field Determination of Water (Moisture) Content of Soil by the
Calcium Carbide Gas Pressure Tester � D 4959-16, Determination of Water Content of Soil by Direct Heating
3. APPARATUS 3.1. LWD— 3.1.1 The LWD testing apparatus should conform to the general requirements of
Section 5 of either ASTM E 2583 for LWDs with load cells or ASTM E 2835 for LWDs without load cells.
3.1.2 The signal conditioning and recording of the LWD testing apparatus should conform to either Sections 8 of ASTM E 2583 for LWDs with load cells or Section 6 of ASTM E 2835 for LWDs without load cells.
3.1.3 The LWD testing apparatus should be regularly calibrated and verified according
to the requirements of Sections 7 of ASTM E 2583 for LWDs with load cells or Sections 7 and 8 of ASTM E 2835 for LWDs without load cells.
3.1.4 The precision and bias of the LWD testing apparatus shall conform to Sections 10.1-10.2 of ASTM E 2583 for LWDs with load cells or Sections 14.1-14.2 of ASTM E 2835 for LWDs without load cells.
3.2. Moisture Content Testing—An appropriate in situ method of soil moisture (water)
content measurement shall be used to rapidly determine the moisture content at the time of compaction and testing. Example equipment for accomplishing this include the Ohaus Moisture Analyzer, Microwave Oven (ASTM D 4643), Field Stove (ASTM D 4959), Speedy Moisture Tester (ASTM D 4944), etc. and a portable power generator if deemed necessary.
3.3. Miscellaneous Equipment—
� A small square shovel or similar tool to level the testing surface. � A soil sampler and sealed containers/bags to collect the moisture content
samples. � Marking spray to designate the LWD testing locations. � Tape measure or measuring wheel.
4. PROCEDURE
4.1. Determine the LWD model, acceptable moisture content range and corresponding
Etarget, and assumed Poisson’s ratio following the TP 123-01 test method in
124
advance of the compaction operation. Input the Poisson’s ratio and the appropriate shape factor from Table 1 into the LWD device. Note 1—Different LWDs report different moduli values. The same LWD type in terms of manufacturer, model, and buffer stiffness used for the laboratory target modulus testing must be used for the field testing.
4.2. Control of moisture content is a critical factor in attaining proper compaction of geomaterials.
4.2.1. Take at least three random moisture samples per sublot per ASTM D 3665 or
similar. One sample shall be taken during placing/spreading of each lift and two samples shall be taken immediately after compaction.
4.2.2. Use the moisture content testing equipment appropriate for field use (Section 3.2)
to measure the moisture content of each sample. 4.2.3. The average moisture content shall comply the acceptance requirement in Section
7.1. 4.2. Identify random LWD testing locations per ASTM D 3665 or similar. The
minimum testing frequency is specified in Section 6.2. Mark and label the LWD testing locations. Note 2—LWD testing shall be performed within two hours of compaction to avoid moisture loss. The average moisture content of the two samples at the time of testing may not deviate more than 2 percentage points from the sample obtained at the time of the layer placement.
4.3. Record the LWD testing locations and any noteworthy remarks. 4.4. Carefully clear and level the area underneath the LWD plate without any
disturbance to the compacted surface. Remove loose oversized rocks. In case of open graded base material, a thin layer of sand can be used to fill in the gaps to provide full contact with the plate.
4.5. Position the load plate and rotate left and right approximately 45 degrees to
achieve intimate contact between the plate and soil surface. 4.6. Perform 6 drops following the manufacturer’s instructions and in general
accordance with ASTM E 2583 for LWDs with load cells and ASTM E 2835 for LWDs without load cells. The first three drops are for the seating and the second three drops are for modulus measurement. Record the reported device data storage file names and moduli values (optional). Note 3—When testing a base layer of finite thickness, it is necessary to perform LWD testing on the surface of the underlying soil before the base material placement. These tests should be performed at the same locations (determined by Section 4.2) on the same day that the base is placed. Then perform the LWD
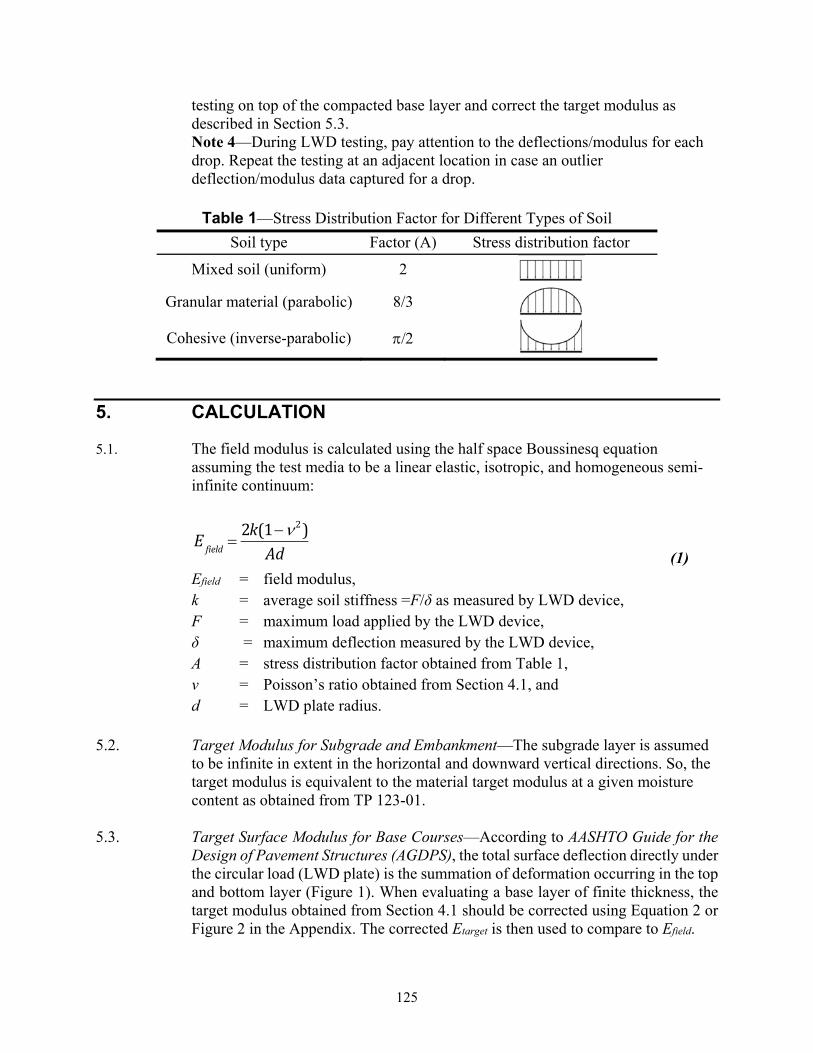
125
testing on top of the compacted base layer and correct the target modulus as described in Section 5.3. Note 4—During LWD testing, pay attention to the deflections/modulus for each drop. Repeat the testing at an adjacent location in case an outlier deflection/modulus data captured for a drop.
Table 1—Stress Distribution Factor for Different Types of Soil
Soil type Factor (A) Stress distribution factor
Mixed soil (uniform) 2 Granular material (parabolic) 8/3 Cohesive (inverse-parabolic) S��
5. CALCULATION 5.1. The field modulus is calculated using the half space Boussinesq equation
assuming the test media to be a linear elastic, isotropic, and homogeneous semi-infinite continuum:
(1) Efield = field modulus, k = average soil stiffness =F/δ as measured by LWD device, F = maximum load applied by the LWD device, δ = maximum deflection measured by the LWD device, A = stress distribution factor obtained from Table 1, ν = Poisson’s ratio obtained from Section 4.1, and d = LWD plate radius.
5.2. Target Modulus for Subgrade and Embankment—The subgrade layer is assumed to be infinite in extent in the horizontal and downward vertical directions. So, the target modulus is equivalent to the material target modulus at a given moisture content as obtained from TP 123-01.
5.3. Target Surface Modulus for Base Courses—According to AASHTO Guide for the
Design of Pavement Structures (AGDPS), the total surface deflection directly under the circular load (LWD plate) is the summation of deformation occurring in the top and bottom layer (Figure 1). When evaluating a base layer of finite thickness, the target modulus obtained from Section 4.1 should be corrected using Equation 2 or Figure 2 in the Appendix. The corrected Etarget is then used to compare to Efield.
E field 2k(1�Q 2)
Ad
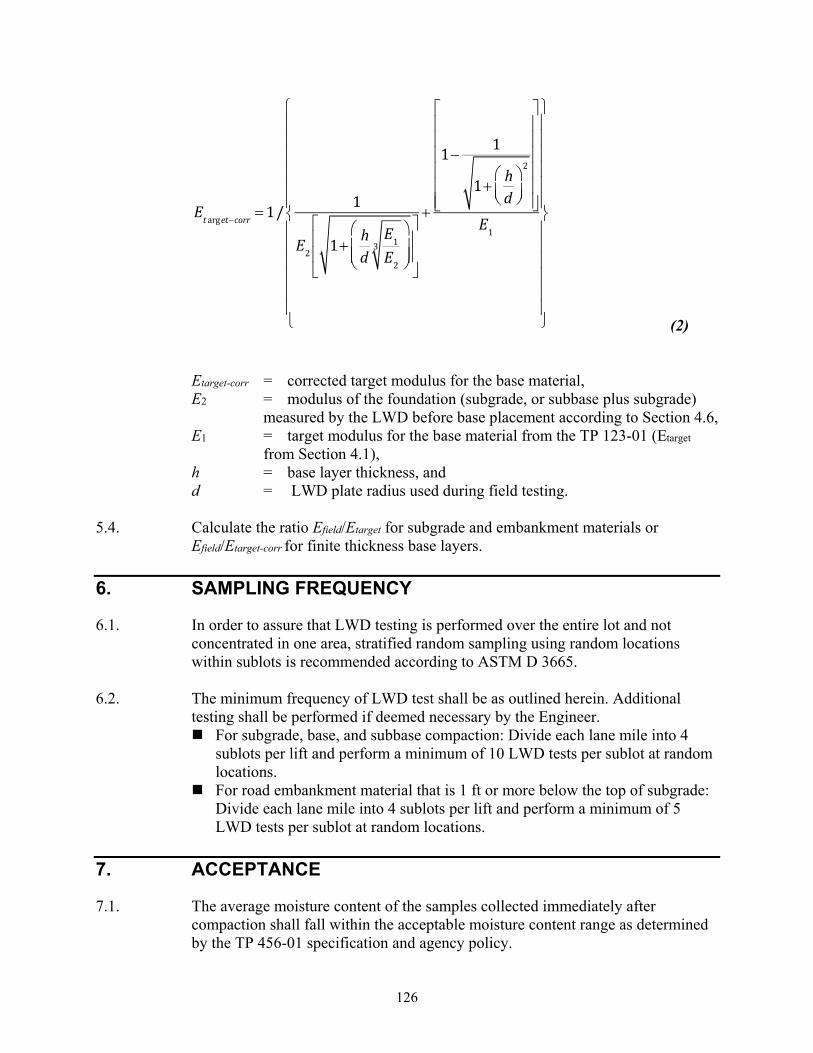
126
(2)
Etarget-corr = corrected target modulus for the base material, E2 = modulus of the foundation (subgrade, or subbase plus subgrade)
measured by the LWD before base placement according to Section 4.6, E1 = target modulus for the base material from the TP 123-01 (Etarget
from Section 4.1), h = base layer thickness, and d = LWD plate radius used during field testing.
5.4. Calculate the ratio Efield/Etarget for subgrade and embankment materials or
Efield/Etarget-corr for finite thickness base layers.
6. SAMPLING FREQUENCY 6.1. In order to assure that LWD testing is performed over the entire lot and not
concentrated in one area, stratified random sampling using random locations within sublots is recommended according to ASTM D 3665.
6.2. The minimum frequency of LWD test shall be as outlined herein. Additional
testing shall be performed if deemed necessary by the Engineer. � For subgrade, base, and subbase compaction: Divide each lane mile into 4
sublots per lift and perform a minimum of 10 LWD tests per sublot at random locations.
� For road embankment material that is 1 ft or more below the top of subgrade: Divide each lane mile into 4 sublots per lift and perform a minimum of 5 LWD tests per sublot at random locations.
7. ACCEPTANCE 7.1. The average moisture content of the samples collected immediately after
compaction shall fall within the acceptable moisture content range as determined by the TP 456-01 specification and agency policy.
Et arget�corr 1/1
E2 1� hd
E1E2
3§
©¨̈
·
¹¸̧
ª
¬
««
º
¼
»»
�
1� 1
1� hd
§©̈
·¹̧
2
ª
¬
««««««
º
¼
»»»»»»
E1
®
°°°°°°
¯
°°°°°°
½
¾
°°°°°°
¿
°°°°°°
127
7.2. The field to target ratios calculated per Section 5.4 shall be evaluated for
acceptance using the percentage of material within specification limits method (PWL) following R 9-05 specification. The preliminary recommendations for lower specification limit shall be 0.5 for the devices that comply with ASTM E 2583 (LWDs with load cells) and 0.8 for the devices complying ASTM E 2835 (LWDs without load cells) or other values as determined by the agencies.
7.3. The lot shall be rejected once a “large” percentage is outside the specification
limit according to R 9 Section 8.12.7. Local agencies may want to perform additional implementation studies to refine the lower specification limit and/or the acceptable PWL. Typically, the lot may be rejected if PWL is less than 50%.
7.4. Appropriate remedial procedures shall be adopted for the materials that do not
meet the acceptance criteria. These materials shall be re-tested for acceptance after corrections.
8. REPORT 8.1. The test report shall include the following:
� Project location and weather description. � Material type, lift number, layer thickness, and construction timeline. � Moisture content measurement device, number of samples, time and locations
of measurement, percent moisture content. � LWD model used during field testing, plate size, drop height, and drop
weight. � Recorded test area coordinates and numbered test locations. � Target modulus correction for finite layered thickness and LWD plate radius. � Test location identification and measured LWD moduli or device file name at
each location.
8.2. The sample report sample included in the Appendix can be used as a template for the test report.
9. SAFETY 9.1. Carefully follow the manufacturer’s instructions on the LWD device assembly
and operation. To prevent any damage to the device, make sure all the parts are firmly attached before dropping the load in the field.
9.2. Keep the back straight and lift the weight with leg muscles to avoid back strain. 9.3 Always secure the safety interlock when pausing the test or transporting the LWD
to new locations. 9.4. Avoid placing the hands below the elevated drop weight.
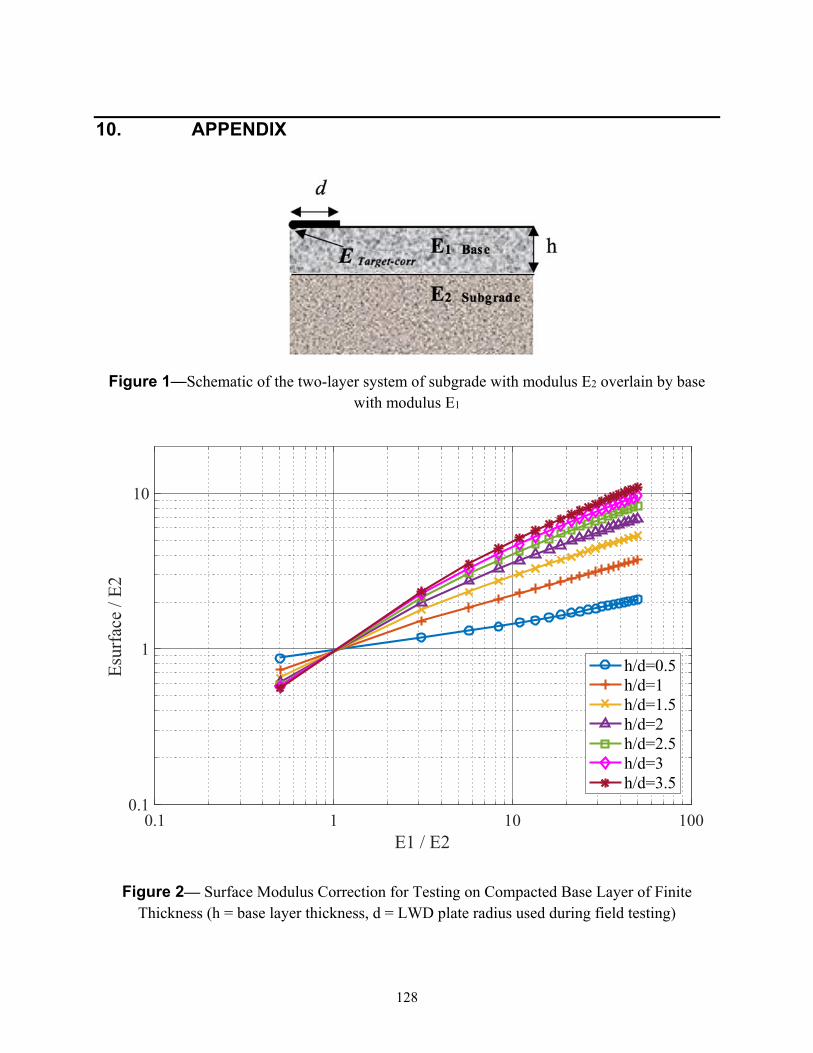
128
10. APPENDIX
Figure 1—Schematic of the two-layer system of subgrade with modulus E2 overlain by base
with modulus E1
Figure 2— Surface Modulus Correction for Testing on Compacted Base Layer of Finite Thickness (h = base layer thickness, d = LWD plate radius used during field testing)
0.1 1 10 100E1 / E2
0.1
1
10
Esur
face
/ E2
h/d=0.5h/d=1h/d=1.5h/d=2h/d=2.5h/d=3h/d=3.5
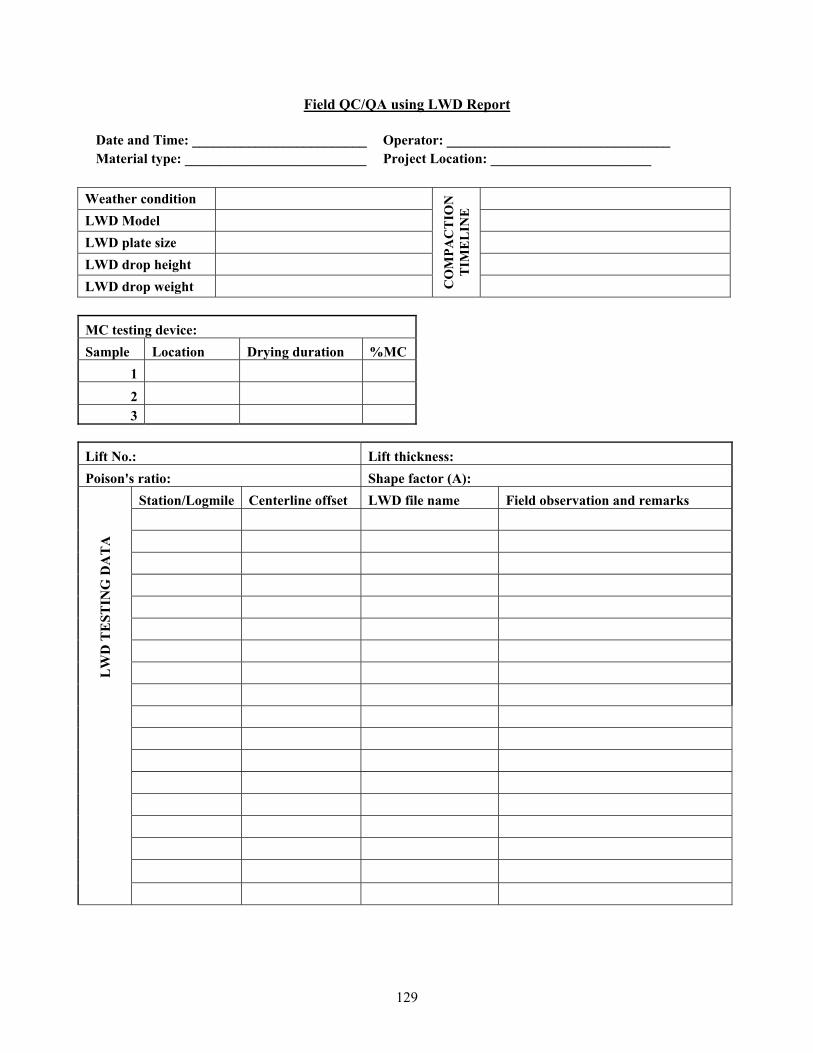
129
Field QC/QA using LWD Report Date and Time: _________________________ Operator: ________________________________ Material type: __________________________ Project Location: _______________________
Weather condition
CO
MPA
CT
ION
T
IME
LIN
E
LWD Model LWD plate size LWD drop height LWD drop weight
MC testing device: Sample Location Drying duration %MC
1 2 3
Lift No.: Lift thickness: Poison's ratio: Shape factor (A):
LW
D T
EST
ING
DA
TA
Station/Logmile Centerline offset LWD file name Field observation and remarks
130
Chapter 6
6. FINAL CONCLUSION AND FUTURE RESEARCH
An extensive review was conducted on the current modulus-based compaction QA methods used in practice at different DOTs and worldwide. Target value determination methods used in Minnesota, Indiana, Florida, and Nebraska were studied in addition to those in the European Union and United Kingdom specifications. The agencies generally used: (1) direct measurement from a test section or calibration area, (2) correlations with resilient modulus testing, (3) correlation with DCP or other in situ testing techniques, and (4) successive LWD drops on the loose uncompacted material at the site to find the target LWD deflection or modulus values.
Available literature on the effect of LWD configuration in the measured deflection as well as the evaluation of moisture content (MC) measurement devices was also reviewed. The literature reports different LWDs measure dissimilar soil deflection and modulus values. Therefore, three types of LWDs, the Zorn ZGF 3.0, Dynatest 3031, and Olson LWD-01models, were selected to span the range of the typical configurations among commercial devices.
Moisture content is a critical factor affecting the modulus of compacted geomaterials in the field and must be measured prior to LWD testing. The nuclear density gauge, Ohaus MB45 moisture analyzer, and Decagon ruggedized GS-1 volumetric water content sensor were evaluated during the initial trials and the large-scale field test pits phase. It was found that the Decagon sensor is difficult to insert when the soil was compacted to a high density and determined to be impractical for base soil with large nominal maximum aggregate sizes. Therefore, only the Ohaus moisture analyzer was evaluated versus NDG and the oven drying method during the field evaluation phase.
A good correlation was observed between the water content measured by the Ohaus MB45 and the nuclear moisture-density gauge for the test pit soils after applying a 1.11 correction factor determined from laboratory calibration. The MC data from Ohaus device also correlated well versus oven dried samples in the field after applying the correction factor. Moreover, new Ohaus device models with higher soil capacity to test larger aggregates in the field are now commercially available.
To evaluate the field LWD modulus data, a target modulus must be defined for QA purposes. This requires characterizing the nonlinear modulus of the soil at various stress conditions and moisture contents. Resilient modulus (MR) testing is usually performed only at the optimum moisture and density condition. Initial MR testing was performed on the soils used for the test pit construction both at optimum conditions and the test pit constructed conditions. Subsequently, the adequacy of several predictive models to find nonlinear MR at other test conditions was evaluated. It was concluded that the accuracy of the predictions was far from acceptable and cannot be used to estimate the field LWD target modulus with confidence.
This inadequacy of the resilient modulus prediction models to make the adjustments required for field MC prompted a new innovative approach to determine the target modulus of the compacted geomaterial. The proposed approach of LWD drops on Proctor molds compacted at different moisture contents can quantify the effect of MC on modulus. Moreover, it eliminates the need to
131
account for the differences in different LWD measurements if the same type/brand of device used for target determination in lab is also used for moduli measurement in the field.
For the large-scale field testing phase, three 4.5mx4.5m test pits were designed and constructed at the Turner Fairbank Highway Research Center to simulate scenarios of acceptable and failing construction quality. The pits were carefully constructed using two different cohesive and non-cohesive subgrade soils and one type of granular aggregate base. LWD deflections captured on the final layer at each pit was initially used to assess the spatial variability measured by the three LWD types. Overall, the Dynatest LWD showed higher spatial variability than the other two devices.
Routine laboratory tests including moisture-density relations plus the LWD testing on the Proctor mold were performed on all test pit soils. The LWD on mold test provides essential insights into the moisture, density and stress dependency of the soil that can be used to tailor the compaction criteria in the field. The LWD on mold moduli were interpolated at the appropriate applied stress level and compaction water content of the pits to establish the target LWD modulus. Also, a strong correlation between LWD on mold moduli and laboratory MR test values was found.
A total of 8 projects in 6 states were visited during the field validation phase to investigate the practicality of the proposed test method and equipment and to develop a detailed and practical specification. The LWD on mold tests were performed on the soil samples collected from each test site. Then the target moduli were estimated at the corresponding field water content and plate pressure and compared to measured moduli in the field by calculating the field to target modulus ratio (Efield/Etarget). LWD on mold target moduli were also corrected for the effect of finite layer thickness.
For the sites at which NDG measurements were available, percent compaction was used as a reference for the quality of compaction and compared to the field to target modulus ratios. It is observed that for the well-compacted material both the PC and Efield/Etarget criteria were passed, whereas the sites with inadequate compaction failed to meet both criterion. This confirms the applicability of the proposed LWD testing methodology for field QA evaluation.
The LWD testing procedure and data collection were refined throughout the field verification phase, which led to the development of two draft test method/specifications for LWD testing in the field and for target modulus determination in the lab. The specifications are written in AASHTO format and provide the additional steps required for the Proctor method of moisture-density relationship determination (AASHTO T-99 and T-180), establishing the target field modulus, and adjusting the target field modulus for finite layer thickness effects when two layers have significantly different moduli in the field. The specifications are written generally so that the agencies can adjust for their local material and equipment conditions.
The steps for calculation of acceptance criteria and the minimum required sampling frequency were illustrated using the collected data from the field sites and the LWD devices used in this study. However, the results must be used with caution as the limited number of materials used in this study does not represent a wide range of material properties. More variety of materials, especially unbound aggregate sources and cohesive soils, is required to validate the method more rigorously.
Overall, the LWD on mold method of target determination provides a smooth transition from density-based methods to modulus-based QA. It is applicable to a variety of geomaterials,

132
including chemically stabilized and non-stabilized subgrades and bases. It is cost efficient and does not increase field work significantly. To effectively implement this QA plan, it is suggested that the agencies calibrate the specification using their existing projects in conjunction with density-based methods using NDGs. It is important to have qualified and trained technicians for collecting and analyzing the LWD data.
133
7. REFERENCES
Andrei, D. (2003). "Development of a predictive model for the resilient modulus of unbound materials." PhD diss., Arizona State University.
Bendat, J. S., & Piersol, A. G. (2011). Random data: analysis and measurement procedures (Vol. 729). John Wiley & Sons.
Bishop, A. W. (1960). The principles of effective stress. Norges Geotekniske Institutt.
Black, W. P. M. (1962). A Method of Estimating the California Bearing Ratio of Cohesive Soils from Plasticity Data*. Geotechnique, 12(4), 271-282.
Christopher, B. R., White, D. J., & Sanchez, R. L. (2013). Proposed Compaction QC/QA Specifications for TVA’s CCP Stacking Facilities: Part 1. Evaluation of Performance Requirements. In 2013 World of Coal Ash (WOCA) Conference (pp. 22-25).
Davich, P., Camargo, F., Larsen, B., Roberson, R., & Siekmeier, J. (2006). Validation of DCP and LWD moisture specifications for granular materials (No. MN/RC-2006-20).
Decagon.com. Gs-1 Manual
Fleming, P. R., Frost, M. W., & Rogers, C. D. F. (2000). A comparison of devices for measuring stiffness in situ.
Fredlund, D. G., & Xing, A. (1994). “Equations for the soil-water characteristic curve.” Canadian Geotechnical Journal, 31(4), 521-532.
Geokon Instruction manual, Model 3500, 3510, 3515, 3600 earth pressure cells.
Glagola, C. R., Rilko, W., Agdas, D., Avila, L., Zheng, X., & Patel, J. (2015). Performance-Based Quality Assurance/Quality Control (QA/QC) Acceptance Procedures for In-Place Soil Testing Phase 3.
Grasmick, J. G., Mooney, M. A., Surdahl, R. W., Voth, M., & Senseney, C. (2014). Capturing a Layer Response during the Curing of Stabilized Earthwork Using a Multiple Sensor Lightweight Deflectometer. Journal of Materials in Civil Engineering, 27(6), 04014183.
Gu, F., Sahin, H., Luo, X., Luo, R., & Lytton, R. L. (2014). “Estimation of Resilient Modulus of Unbound Aggregates Using Performance-Related Base Course Properties.” Journal of Materials in Civil Engineering.
Guzina, B., & Osburn, R. (2002). Effective tool for enhancing elastostatic pavement diagnosis. Transportation Research Record: Journal of the Transportation Research Board, (1806), 30-37.
Highways Agency, (2009), “Design Guidance for Road Pavement Foundations,” Interim Advice Note 73, Highways Agency, London.
Hoffmann, O., Guzina, B., & Drescher, A. (2004). Stiffness estimates using portable deflectometers. Transportation Research Record: Journal of the Transportation Research Board, (1869), 59-66.
134
Hveem, F. N., & Carmany, R. M. (1949). The factors underlying the rational design of pavements. In Highway Research Board Proceedings (Vol. 28).
Khalili, N., and Khabbaz, M. H. (1998). "A unique relationship of chi for the determination of the shear strength of unsaturated soils." Geotechnique 48, no. 5.
Khosravifar, S. (2015). Large-Scale Controlled-Condition Experiment to Evaluate Light Weight Deflectometers for Modulus Determination and Compaction Quality Assurance of Unbound Pavement Materials (Doctoral dissertation).
Khosravifar, S., Asefzadeh, A., & Schwartz, C. W. (2013). Increase of resilient modulus of unsaturated granular materials during drying after compaction. In Geo-Congress 2013: Stability and Performance of Slopes and Embankments III (pp. 434-443). ASCE.
Khosravifar, S., Schwartz, C., & Goulias, D. (2013). Time dependent stiffness increase of foamed asphalt stabilized base material. In Proceedings of ninth international conference on the bearing capacity of roads, railways and airfields (BCRRA 2013), Trondheim, Norway.
Liang, R. Y., Rabab’ah, S., & Khasawneh, M. (2008). “Predicting moisture-dependent resilient modulus of cohesive soils using soil suction concept.” Journal of Transportation Engineering, 134(1), 34-40.
Lytton, R. L. (1995)."Foundations and pavements on unsaturated soils." Proceedings of the first International Conference on Unsaturated Soils, unsat'95, Paris, France. 6-8 September 1995. Volume 3.
Mooney, M. A., & Miller, P. K. (2009). Analysis of lightweight deflectometer test based on in situ stress and strain response. Journal of Geotechnical and Geoenvironmental Engineering.
Morgenstern, N. R. (1979). Properties of compacted soils. In Contribution to panel discussion, Session IV, Proc., 6th Panamerican Conf. on Soil Mechanics and Foundation Engineering (Vol. 3, pp. 349-354).
Nazarian, S., Mazari, M., Abdallah, I. N., Puppala, A. J., & Mohammad, L. N. (2011). Modulus-based construction specification for compaction of earthwork and unbound aggregate. Phase, 1, 10-84.
Nazarian, S., Mazari, M., Abdallah, I., Puppala, A. J., Mohammad, L. N., & Abu-Farsakh, M. Y. (2014). Modulus-Based Construction Specification for Compaction of Earthwork and Unbound Aggregate. NCHRP Project 10-84.
Nazzal, M. (2014). Non-nuclear methods for compaction control of unbound materials (No. Project 20-05, Topic 44-10).
Perera, Y. Y., Zapata, C. E., Houston, W. N., & Houston, S. L. (2005). Prediction of the soil–water characteristic curve based on grain-size-distribution and index properties. Advances in pavement engineering (ed. EM Rathje), Geotechnical Special Publication, 130, 49-60.
Proctor, R. R. (1948). Laboratory Soil Compaction Methods, Penetration Resistance Measurements, and the Indicated Saturated Penetration Resistance. In Proceedings of the second international conference on soil mechanics and foundation engineering (1948), Rotterdam, Netherlands (Vol. 5).
135
Proctor, R., (1945), “Proctor on Military Airfields,” Transactions Number 110, ASCE, Washington, D.C.
Proctor, R., (1948), “Laboratory Soil Compaction Methods, Penetration Resistance Measurements, and the Indicated Saturated Penetration Resistance,” Proceedings, Second International Conference Soil Mechanics and Foundation Engineering, Rotterdam.
Puppala, A. J., Transportation Research Board, & National Cooperative Highway Research Program Synthesis Program. (2009). NCHRP Synthesis 382: Estimating Stiffness of Subgrade and Unbound Materials for Pavement Design. publisher not identified.
Roberson, R., & Siekmeier, J. (2002). Determining material moisture characteristics for pavement drainage and mechanistic empirical design. Research Bulletin. Minnesota Department of Transportation. Office of Materials and Road Research.
Schmalzer, P.N., Rada, G.R., and Miller, J.S. (2007) “Falling Weight Deflectometer (FWD) Testing and Analysis Guidelines Volume I,” Report No. FHWA-FLH-07-001, Federal Highway Administration, Federal Lands Highway Division, Washington, DC.
Senseney, C. T., Grasmick, J., & Mooney, M. A. (2014). Sensitivity of lightweight deflectometer deflections to layer stiffness via finite element analysis. Canadian Geotechnical Journal, 52(999), 1-10.
Senseney, C. T., Krahenbuhl, R. A., & Mooney, M. A. (2012). Genetic algorithm to optimize layer parameters in light weight deflectometer backcalculation. International Journal of Geomechanics, 13(4), 473-476.
Senseney, C., & Mooney, M. (2010). Characterization of Two-Layer Soil System Using a Lightweight Deflectometer with Radial Sensors. Transportation Research Record: Journal of the Transportation Research Board, (2186), 21-28.
Siekmeier, J. A. (2011). Unsaturated Soil Mechanics Implementation During Pavement Construction Quality Assurance. In Proceeding of the 59 th Annual Geotechnical Engineering Conference (pp. 179-188).
Siekmeier, J. A., Young, D., & Beberg, D. (2000). Comparison of the dynamic cone penetrometer with other tests during subgrade and granular base characterization in Minnesota. ASTM Special Technical Publication, 1375, 175-188.
Siekmeier, J., Pinta, C., Merth, S., Jensen, J., Davich, P., Camargo, F., & Beyer, M. (2009). Using the dynamic cone penetrometer and light weight deflectometer for construction quality assurance (No. MN/RC 2009-12).
Stamp, D. H., & Mooney, M. A. (2013). Influence of lightweight deflectometer characteristics on deflection measurement. Geotechnical Testing Journal,36(2), 216-226.
Terzaghi, K., Peck, R. B., & Mesri, G. (1996). Soil mechanics in engineering practice. John Wiley & Sons.
Troxler RoadReader Model 3440 Moisture-Density Gauge, Manual of Operation and Instruction (2015). Troxler Electronic Laboratories, Inc. www.troxlerlabs.com.
Uzan, J. (1985). “Characterization of granular material.” Transportation Research Record 1022, Transportation Research Board, Washington, DC, 52–59.
136
Vanapalli, S. K., Fredlund, D. G., & Pufahl, D. E. (1999). The influence of soil structure and stress history on the soil–water characteristics of a compacted till. Geotechnique, 49(2), 143-159.
Vennapusa, P. K., & White, D. J. (2009). Comparison of light weight deflectometer measurements for pavement foundation materials. ASTM geotechnical testing journal, 32(3), 239-251.
Weed, R. (1996). Quality assurance software for personal computer. Transportation Research Record: Journal of the Transportation Research Board, (1544), 116-124.
Yan, K. Z., Xu, H. B., & Shen, G. H. (2013). “Novel Approach to Resilient Modulus Using Routine Subgrade Soil Properties.” International Journal of Geomechanics