
Standard Life Aberdeen plc Full year results 2018 · Jakarta Bandung Melbourne Taipei Abu Dhabi...
44
Standard Life Aberdeen plc Full year results 2018 Resilient performance in challenging markets with strong positioning for long-term growth 13 March 2019
-
Upload
phungkhanh -
Category
Documents
-
view
214 -
download
0
Transcript of Standard Life Aberdeen plc Full year results 2018 · Jakarta Bandung Melbourne Taipei Abu Dhabi...

Standard Life Aberdeen plc
Full year results 2018Resilient performance in challenging markets with strong positioning for long-term growth
13 March 2019

1
Resilient performance in 2018 against a challenging industry backdrop
Delivering on what is in our control
Strategic progress in achieving our world-class ambitions
Delivering for clients and customers
• Improving investment performance in key areas
• Leading customer service in our retail platforms
• 16m potential customers – Phoenix and Virgin Money
Focus on financial discipline
• Expenses down 10% – C/I ratio 68% (2017: 71%)
• Integration ahead of schedule – now 75% complete
• Additional reduction in expenses of £56m
Investing and building for the future
• Embedding shared values and culture
• Increased pace of innovation with 32 fund launches
• 4 targeted bolt-on acquisitions in ‘new active’
Maximising value and shareholder returns
• Gross inflows up 4% to £75.2bn
• Capital-light – capital requirement down to £1.1bn
• Returning up to £1.75bn to shareholders

Full year results 2018
Resilient performance in challenging markets

3
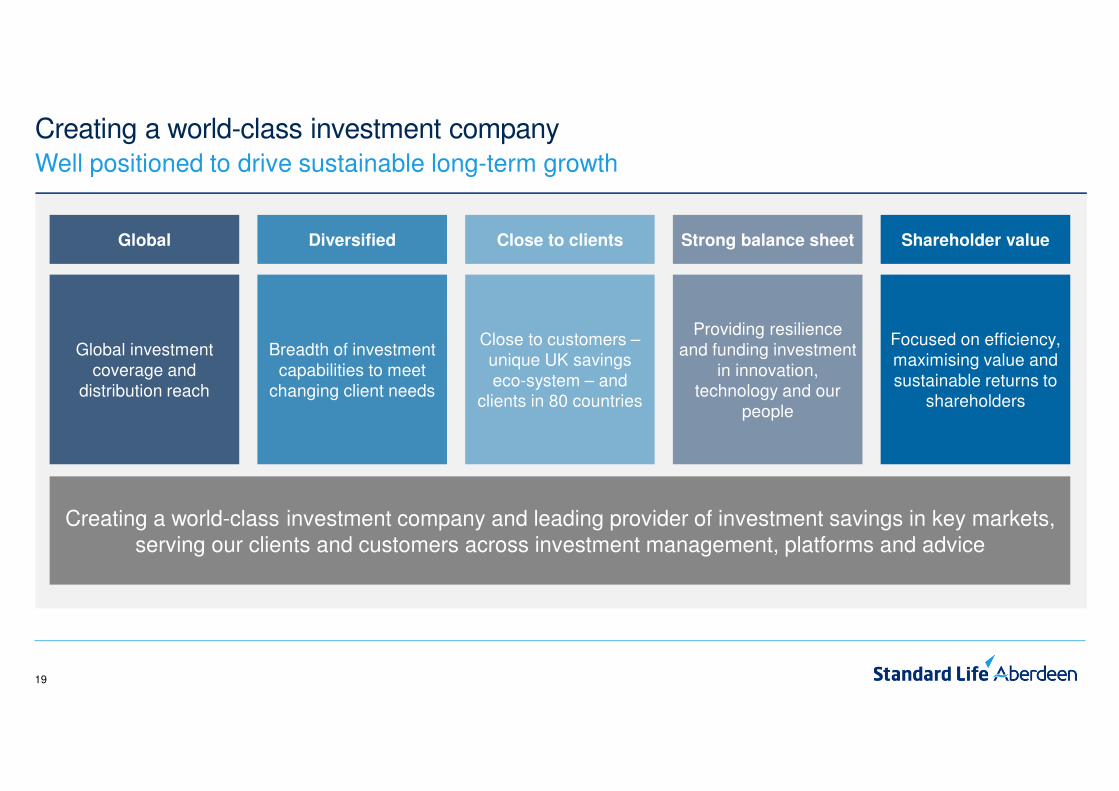
Creating a world-class investment companyWell positioned to drive sustainable long-term growth
Breadth of investment capabilities to meet
changing client needs
Global investment coverage and
distribution reach
Close to customers –unique UK savings eco-system – and
clients in 80 countries
Providing resilience and funding investment
in innovation, technology and our
people
Focused on efficiency,maximising value and sustainable returns to
shareholders
DiversifiedGlobal Close to clients Strong balance sheet Shareholder value
Creating a world-class investment company and leading provider of investment savings in key markets, serving our clients and customers across investment management, platforms and advice

4
Strong platform to compete globallyGlobal investment coverage and proximity to clients
Strategic partners: Mitsubishi UFJ, LBG, HDFC, TEDA, Sumitomo Mitsui, Phoenix Group, John
Hancock, Manulife, Bosera, Challenger, Virgin Money
Global Clients: Clients in around 80 countries
500 global client specialists
Glasgow
Aberdeen
Saint Helier
Copenhagen
Helsinki
Oslo
Miami
Philadelphia
Sao Paolo
Stamford
Bangkok
Kuala Lumpur
Shanghai
Jakarta
BandungMelbourne
Taipei
Abu Dhabi
Luxembourg
Birmingham
Leeds
Dublin
Geneva
Los AngelesBrussels
London
Bristol
Madrid
Zurich
Paris
Frankfurt
Stockholm
Milan
Boston
New York
Toronto
Hong Kong
Seoul
Singapore
Sydney
TokyoAmsterdam
Edinburgh
Aarhus
Bishop Auckland
Crewe
Leamington Spa
Basingstoke
BergenCheadle Hume
Sheffield Ayr
Reading
Global Coverage: 54 unique operating locations
Trondheim

5
Challenging year for the industryWith market conditions deteriorating during 2018
1. Source: Morningstar, mutual fund net flows by asset class excluding money market funds.
Ne
t flo
ws (
$b
n)
Global mutual fund industry quarterly net flows1
(400)
(300)
(200)
(100)
0
100
200
300
400
Q1 2017 Q2 2017 Q3 2017 Q4 2017 Q1 2018 Q2 2018 Q3 2018 Q4 2018

6
Growth in
‘new active’ investing
Shift to passives
Need for scale
Importance of
individual savings
• Growth in passive investing accelerated by the global financial crisis
• Exerting downward pressure on fees
• High demand for solutions, active specialities, private markets, alternatives and ESG
• Representing c80% of the revenue opportunity vs. c10% for passives
• Need for scale to offset lower fees and costs of technology, regulation and innovation
• Breadth of capabilities and global reach to meet needs of global clients
• Shift from defined benefit pensions and lack of state safety nets driving retail savings
• Access to retail customers and technology key to capitalising on this opportunity
Seismic shifts creating challenges across our industryExacerbated by weak investor sentiment in 2018
With opportunities for those able to adapt

7
(£10bn)
£10bn
£30bn
£50bn
£70bn
£90bn
2017 2018
Net outflows continued but were concentrated in a small number of strategies
Net outflows 6.7% of opening AUMA
Broad demand for our wider product suite with gross inflows returning to pre-merger levels
• Net outflows largely reflect movement on long established products and natural run-off from insurance business
• Significant potential from Phoenix already being realised
• Continued growth in Wrap and Elevate with net inflows of £4.2bn
2017 2018
£bn £bn
Absolute return, EM, APAC and Global equities (19.2) (32.7)
Natural run-off from strategic insurance clients (15.2) (5.5)
(34.4) (38.2)
Cash/liquidity (1.7) (1.3)
Other capabilities (3.3) (5.4)
Retail – Wrap and Elevate 7.0 4.2
Eliminations (0.5) (0.2)
Net flows (32.9) (40.9)
Gross inflows
DM equities
Fixed income
Multi-asset ex GARS
Private markets
Real estate
Cash/Liquidity
Wrap and Elevate
Alternatives
Strategic insurance partners
Eliminations
Quantitative
Absolute return, EM, APAC and Global equities £72.4bn
£75.2bn
All figures on a continuing operations basis.
£54.8bn
£63.1bn+15%

8
Retail platform profitability (Wrap, Elevate and Parmenion)
Sustained growth in retail platforms and financial advice capabilityMarket-leading platforms are a source of asset management flows and diversification
Continued growth in platform AUA – now serving 0.5m customers
£80bn
£0bn
Pla
tfo
rm A
UA
Net inflows
All figures on a continuing operations basis.1. Includes Parmenion – assets of £5.2bn (2017: £4.4bn, 2016: £3.0bn) and net flows of £1.1bn (2017: £1.3bn, 2016: £0.8bn). 2. Acquisitions of Elevate and Parmenion including AUA of £11.3bn and £1.9bn respectively.
£4.4bn
2015
£26.5bn
£8.3bn1
2017
£58.4bn1
£5.0bn1
2016
£47.2bn1
2018
£5.3bn1
£59.4bn1
£3.6bn
2014
£21.9bn
2017 2018
Adjusted profit before tax £18m £24m +33%
Change
Fee based revenue £145m £160m +10%
Adjusted operating expenses (£127m) (£136m) +7%
Cost/income ratio 88% 85% -3ppts
Acquisitions
£13.2bn2
Wrap and Elevate are the only platforms with
AKG ‘A’ rated financial strength
Wrap ParmenionElevate
Customers 440k 460k +20k

Full year results 2018
Financial update
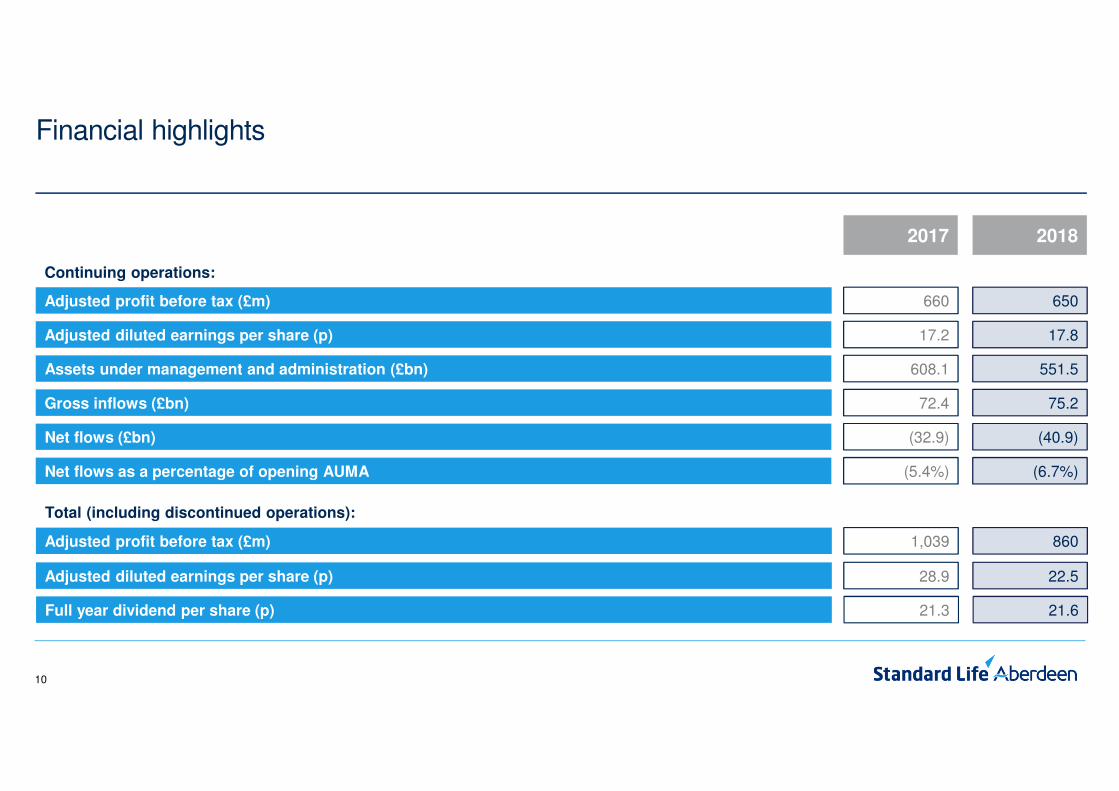
10
Adjusted profit before tax (£m) 650660
Assets under management and administration (£bn) 551.5608.1
Net flows (£bn) (40.9)(32.9)
Gross inflows (£bn) 75.272.4
Adjusted diluted earnings per share (p) 17.817.2
Continuing operations:
Financial highlights
20182017
Adjusted profit before tax (£m) 8601,039
Adjusted diluted earnings per share (p) 22.528.9
Full year dividend per share (p) 21.621.3
Total (including discontinued operations):
Net flows as a percentage of opening AUMA (6.7%)(5.4%)

11
Equates to pro forma adjusted EPS of 20.6p based on the current share count3
Adjusted profit before tax from continuing operations
2017 2018
£m £m
Fee based revenue 2,099 1,868
Adjusted operating expenses (1,551) (1,395)
Adjusted operating profit 548 473Capital management 13 (9)
Share of associates’ and joint ventures’ profit before tax1 99 186Adjusted profit before tax from continuing operations 660 650
Earnings per share2:
Asset management and platforms 15.7p 13.8p
Insurance associates and joint ventures 1.5p 4.0pAdjusted diluted earnings per share from continuing operations 17.2p 17.8p
Discontinued operations 11.7p 4.7pAdjusted diluted earnings per share 28.9p 22.5p
Adjusted profit before tax
Impact of lower revenue largely offset by share of Phoenix profit and reduction in expenses
1. Share of associates’ and joint ventures’ profit before tax comprises the Group’s share of results of HDFC Life, HDFC AMC, Phoenix and Heng An Standard Life Insurance Company Limited. 2. In accordance with IAS 33, earnings per share have not been restated following the share consolidation as there was an overall corresponding change in resources. As a result of the share consolidation and share buyback earnings per share from continuing operations for the year ended 31 December 2018 is not directly comparable with the prior year. Refer to Note 11 of the Group financial statements for information relating to the calculation of diluted earnings per share. 3. Current share count reflects repurchases up to 11 March 2019.

12
Fee revenue margins
Analysis of fee revenue margins
FY 2017 H1 2018 FY 2018
bps1 bps1 bps1
Institutional/Wholesale2 50.93 48.7 48.1
Strategic insurance partners 13.7 13.5 13.1
Retail – Wrap and Elevate 26.2 25.5 25.6
Group fee revenue margin4 33.03 31.5 30.8
All figures are stated on a continuing operations basis.1. FY 2017 and FY 2018 calculated using fee based revenue and monthly average AUM/AUA. H1 2018 calculated using annualised fee based revenue and monthly average AUM/AUA. 2. Includes Wealth/Digital and Parmenion. 3. Adjusted to exclude non-recurring impact of £7m deferred revenue. 4. Includes eliminations.
Modest reduction in fee revenue margins largely driven by mix effects

13
Total adjusting items
2017 2018
£m £m(Reported basis)
Restructuring and corporate transaction expenses (162) (239)
Amortisation and impairment of intangible assets acquired in business combinations and through thepurchase of customer contracts
(138) (1,155)
Profit on disposal of interest in associates 319 185
Impairment of associates - (228)
Other (15) 40
Adjusting items from continuing operations 4 (1,397)
Discontinued operations (44) 1,519
Total adjusting items (40) 122
• Impairment of £880m on goodwill reflects technical accounting required under IFRS and does not impact distributable reserves
• Impairment of associates reflects the market value of Phoenix holding at 31 December 2018 – market value has recovered in 2019

14
Expense saving run rate of £175m ahead of schedule
• Improvement in cost/income ratio to 67.9% (2017: 70.6%)
• Integration now c75% complete with annualised cost efficiencies of at least £350m1 to be achieved by end of 2020:
• 2018 has benefited by c£120m (H1: £40m; H2: £80m)
• Exiting the year with a run rate of £175m
• Already ahead of original target run rate of £150m by August 2019
• Continued focus on financial discipline resulting in a further reduction in expenses of £56m
• The £230m of benefits yet to be realised equates to approximately 7.4p2 of pro forma EPS before any reinvestment in the business
Financial discipline driving a further reduction in expenses of £56m
All figures are stated on a continuing operations basis.
1. Comprises annualised efficiencies from merger related cost synergies (£250m) and simplification of our operating model (£100m). 2. Based on the standard rate of UK Corporation Tax of 19%.
Reduced operating expenses
(£120m)
Targeted cost
efficiencies
AdditionalMiFID II
costs
£12m£1,551m
2017 2018
£1,395m
£8m
Additional operating costs from
bolt-on M&A
(£56m)
Additional reduction
in expenses

15
2018 7.0%£0.4bn
Optimising the balance sheet following the sale of the insurance businessReturning capital while retaining a strong balance sheet
1. Swapped to GBP at 3.2%. 2. Shareholder authority received on 25 June 2018. Subject to applicable regulatory authorities. 3. Value of Share Buyback Programme completed as at 11 March 2019. 4. Investor view.
Optimising the balance sheet
• Reduced external borrowings from £2.3bn to £1.1bn and converted 2028 instrument to CRD IV
• Continuing to focus on optimising our capital structure
• Returning capital to shareholders and reducing share count:
• B share scheme £1.0bn
• Buyback of up to £750m2 (£358m3 completed)
2028 4.25%1
£0.6bn($750m)
2020 6.546%£0.3bn
31 Dec 17
£2.3bn
2027 6.75%£0.5bn
2022 5.5%£0.5bn
31 Dec 18
2022 5.5%£0.5bn
2028 4.25%1
£0.6bn($750m)
£1.1bn
Solvency II compliant debt
CRD IV compliant debt
Pri
ncip
al v
alu
e o
f d
eb
t
£2.5bn
£0bn
Strong balance sheet
• Capital resources take account of deductions including:
• Proposed 2018 final dividend of £345m
• First two tranches of the share buyback programme of £375m
• Proportion of SLAL separation costs of £0.1bn
• Excludes proceeds from offer for sale of up to 4.93% of HDFC Life
• Significantly reduced capital requirements of £1.1bn under CRD IV (2017: SII £3.6bn4) with scope for further optimisation
CRD IV Group regulatory capital position 2018
£bn
Common Equity Tier 1 capital resources 1.1
Tier 2 capital resources 0.6
Total capital resources 1.7
Total capital requirements (1.1)
Surplus regulatory capital 0.6

16
One of the strongest balance sheets in the industry With substantial listed investments and strong net cash resources
All figures are stated on a continuing operations basis.1. Cash/liquid resources from across the group adjusted for the impact of the proposed 2018 final dividend, less nominal value of debt of £1.1bn. 2. Valuation as at 11 March 2019. Value of stakes in Indian listed investments calculated using an exchange rate of R93.0070/£1.
• Strong capital position and £1.2bn1 of net cash/liquid resources to support investment in the business
• Strategic listed investment in Phoenix worth £1.0bn2:• 19.9% stake
• Source of earnings and dividends as well as current and future AUM
• Already benefiting from closer collaboration – £3.6bn (£2.5bn in 2018) of £7bn originally identified now transferred
• Indian listed investments worth £3.5bn2:• 29.9% stake in HDFC AMC worth £1.0bn2 following successful IPO from which we also received c£180m
• 29.2% stake in HDFC Life worth £2.5bn2 before the offer for sale of up to 4.93% of HDFC Life announced on 11 March 2019
Continued strong source of value for shareholders as we reshape the business
17
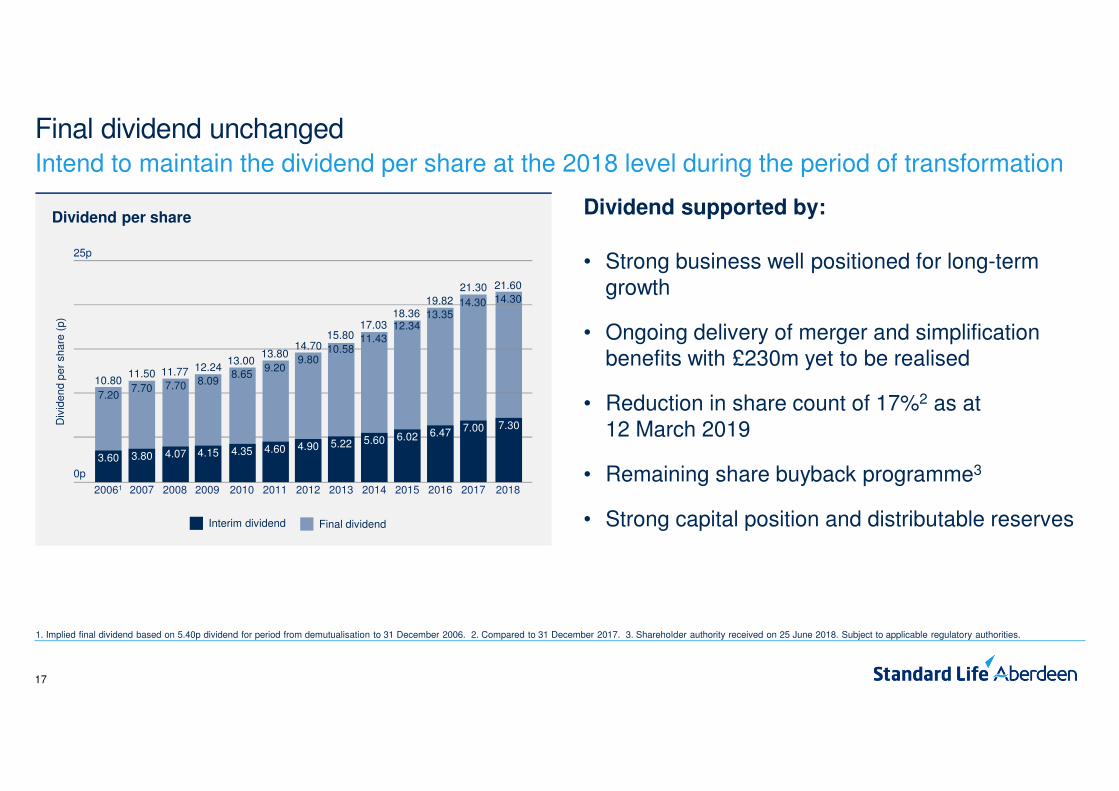
14.30
21.60
Final dividend unchangedIntend to maintain the dividend per share at the 2018 level during the period of transformation
1. Implied final dividend based on 5.40p dividend for period from demutualisation to 31 December 2006. 2. Compared to 31 December 2017. 3. Shareholder authority received on 25 June 2018. Subject to applicable regulatory authorities.
25p
0p
Interim dividend Final dividend
10.80
20061
3.60
7.20
2007
11.50
3.80
7.70
2008
11.77
4.07
7.70
2009
12.24
4.15
8.09
13.00
2010
4.35
8.65
13.80
2011
4.60
9.20
14.70
2012
4.90
9.80
2013
15.80
5.22
10.58
2014
17.03
5.60
11.43
2015
18.36
6.02
12.34
2016
19.82
6.47
13.35
2018
7.30
2017
21.30
7.00
14.30
Dividend supported by:
• Strong business well positioned for long-term growth
• Ongoing delivery of merger and simplification benefits with £230m yet to be realised
• Reduction in share count of 17%2 as at 12 March 2019
• Remaining share buyback programme3
• Strong capital position and distributable reserves
Dividend per share
Div
ide
nd
pe
r sh
are
(p
)

Full year results 2018
Strongly positioned for long-term growth
19
Creating a world-class investment companyWell positioned to drive sustainable long-term growth
Breadth of investment capabilities to meet
changing client needs
Global investment coverage and
distribution reach
Close to customers –unique UK savings eco-system – and
clients in 80 countries
Providing resilience and funding investment
in innovation, technology and our
people
Focused on efficiency,maximising value and sustainable returns to
shareholders
DiversifiedGlobal Close to clients Strong balance sheet Shareholder value
Creating a world-class investment company and leading provider of investment savings in key markets, serving our clients and customers across investment management, platforms and advice

20
Competitive investment performance supporting gross flowsSigns of improving performance
• New combined research platform strengthened by appointment of heads of research
• Research Institute driving macro and longer-term thematic house views
• Stable teams and investing in new talent
• Enhancing our processes while remaining true to our approach – no style drift
• Maintained number of positive consultant-rated institutional strategies at 43 ratings
• 27 top quartile funds over 1 and 3 years in wholesale/retail space1
Performance enhancement plans in place focused on idea generation, capture and implementation
Resilientperformance across most
asset classes
Alternatives; Asia Pacific and Smaller Companies equities; Quantitative; Credit, EMD and Government fixed income; Real Estate; Money Market Funds
Improving performance
Emerging Market Equities; Global Equities and GARS
1. Source: Morningstar, as at 31 December 2018.

21
2018 – a year of almost universal negative asset class returns across the marketIn stark contrast to 2017 where only 1% of assets suffered negative returns
2018 total return indices (rebased)
80
85
90
95
100
105
110
115
Dec 17 Feb 18 Apr 18 Jun 18 Aug 18 Oct 18 Dec 18
2019 YTD total return indices (rebased)
80
85
90
95
100
105
110
115
Dec 18 Jan 19 Feb 19
Global equitiesGlobal investment grade
Global inflation linked bonds
US equities Global propertyGlobal government bonds
Global commoditiesGlobal high yield bonds
Emerging markets 10 year bunds

22
Top 10 in the world3
Real Estate2
£40bnPrivate Markets2
£31bn
ALTERNATIVES / PRIVATE MARKETS
Positioned to benefit from global demand for ‘new active’ investment capabilities‘New active’ set to capture majority of global AUM and revenue growth 2017-20221
1. Source: BCG, July 2018. Figures show global estimated growth in industry AUM and revenue between 2017 and 2022. 2. Includes overlap with insurance clients of: Private Markets – £2bn; Real Estate – £10bn; Multi-asset – £18bn; and Quantitative – £61bn. 3. Source: Willis Tower Watson Global Alternatives Survey 2017.
SOLUTIONS
Insurance Clients
£255bnMulti-asset2
£71bn
ACTIVE SPECIALITIES
Active Equities
£73bnActive FI
£47bn
PASSIVE
Quantitative / Rules-based investing2
£63bn
2017 2022
Industry AUM: Industry revenue:
+$7tn+$20bn2017 2022
Industry AUM: Industry revenue:
+$5tn+$46bn
1st in UK Broad range
Broad range Broad range Strong performance
2017 2022
Industry AUM: Industry revenue:
+$5tn+$18bn 2017 2022
Industry AUM: Industry revenue:
+$9tn+$11bn

23
ESG factors embedded into all investment decisionsEnhancing the value of active management to invest for a better future
Winning new mandates across asset classes and the world
• £400m UK Equity mandate for a local government pension scheme
• €160m Emerging Markets bond mandate for a French pension fund
• €500m Private Equity mandate for a Dutch pension fund
• A$200m Fixed Income mandate for an Australian endowment fund
Long-established track record in ESG to capitalise on its growing
importance to institutional and retail investors
• Actively working with ESG factors since 1992
• Leader in active stewardship and ownership
Extensive and experienced ESG resource leveraging our scale
• Centre of excellence with 20+ professionals
• Global presence across asset classes with 30+ professionals
Embedded across our AUM and with specialist range of
sustainability-driven solutions
• £14bn AUM including ethical, impact and climate related funds
• Our UK Ethical Fund is over 20 years old – outperforming over 5, 10 and 20 years
• $500m Credit mandate for a China-based institution
• $250m US Smaller Companies Equity mandate for a US-based international organisation

24
Enhanced
Index Funds
EDGFLiquid
Alternatives
UK Equity
Impact
Global Private
Markets
China
A Shares
Euro Club
(RE)
Private Equity
SecondariesMyFolio
Global Small
Cap
RE
Secondaries
Global FoF
(RE)
Listed Private
Capital
AS Capital
Global Equity
Artificial
Intelligence Global Eq
Global Equity
Impact
GTAA
Strategies
Private Equity
FoF
A track record of innovation in ‘new active’ investment solutionsIncreased pace of innovation with 32 new fund launches (22 in 2017) and more to come
Euro Logistics
Income PLC
European
Real Estate Funds
Real Assets
Strategies
ARGBS
Total Return
CreditEM Bonds
Diversified
Income Fund
Ground Rent
Fund
Commercial
Real Estate Debt Fund
Smart Beta
Low Vol Equity Income
MyFolio
Income
GEM Equity
Income
European
Economic Infrastructure
Concession
Infrastructure
Pan-European
Residential
US Long
Duration Corp Bond
Secure
Income & Cash Flow
Multi Asset
Income
Global Short
Duration Corp Bond
Global
Loans Fund
US Comingled
Bonds
Short Duration
GILB
Buy &
Maintain Credit
Global High
Yield Bond
Euro SRI
Corporate Bond
PE Fund
Financing
Alt Invest
Strategies Managed A/c
AS Capital
Active Overlay
China
OnshoreBond
Integrated
Liability Plus Solutions
c25% (£63bn) of Institutional/Wholesale AUM from products launched since 2010 – selected examples below:
Accelerated by targeted acquisitions and joint ventures in key areas of market growth:
Hark Capital(Private Markets)
ETF Securities U.S.
Orion Partners(Asia Real Estate)
JV with Investcorp(Infrastructure)
Alpine Woods Capital Investors LLC
US closed-end funds
Enhanced partnership with
Phoenix
Virgin Money / CYBG JV
ALTERNATIVES / PRIVATE MARKETS SOLUTIONS
ACTIVE SPECIALITIES QUANTITATIVE

25
Retail asset growth outpacing institutional demand
Assets are shifting from institutions to individualsCreating opportunities for those that can build close connections to end customers
£10tn
£0tn
UK
asse
ts u
nd
er
ma
na
ge
me
nt1
2017
£5.0tn
2023F
£7.9tn
2013
£3.7tn
74%
26%
69%
31%
64%
36%
Retail and Wholesale Institutional
Democratisation of financial risk driving
demand from retail investors
• Global trend – individuals taking responsibility for their financial futures
• Ongoing shift towards defined contribution pensions in the UK
• Accelerated by flexibility offered by pension freedoms
• Growing need for financial advice and increasing advice gap
6-yr CAGR 6.6%
6-yr CAGR 10.6%
1. Source: BCG GAM Report 2018.

26
Capitalising on growth in individual savings through our UK savings eco-systemLeveraging the strength of our brands, leading platforms and strategic partnerships
Technology
to serve
customers
Connecting
to individual
savers
Investment
solutions for
individuals
Providing award-winning service and capabilities• Over £59bn of AUA across Wrap, Elevate and Parmenion• Growing national advice capability through 1825• Building robo advice capabilities to tackle advice gap
Aberdeen Standard Investments and Aberdeen Standard Capital• Access to breadth of investment expertise across asset classes• Expertise in solutions for individuals including MyFolio, Parmenion
and Aberdeen Standard Capital with £25bn in AUM
Market-leading platforms and advice with potential to reach 30% of UK savers• Working with around 5,000 UK adviser firms and wealth managers • New Phoenix partnership and Virgin Money JV provide access to 16m potential customers• Potential for further significant partnerships
AUA
AUM
Standard Life – No.1 UK non-bank savings brand (4th overall)

27
Delivering for clients and customers
Well positioned for the themes shaping our industry with breadth of ‘new active’ solutions and UK savings eco-
system relevant to changing global client needs
Focus on financial discipline
Ongoing focus on improving efficiency and ahead of schedule to deliver combined merger and simplification
efficiencies of at least £350m
Investing and building for the future
Financial strength to invest in innovation, technology and our people to drive long-term growth in a rapidly
shifting industry
Maximising value and shareholder returns
Remaining buyback programme and strong balance sheet with substantial listed investments
and net cash resources
Strong business well positioned for long-term growthContinued progress towards achieving our world-class ambitions
Clear focus on maximising value and delivering returns to shareholders

Questions

29
Forward-looking statements
This presentation may contain certain “forward-looking statements” with respect to the financial condition, performance, results, strategy, objectives, plans, goals and expectations of Standard Life Aberdeen plc (“Standard Life Aberdeen”) and its affiliates. These forward-looking statements can be identified by the fact that they do not relate only to historical or current facts. Forward-looking statements are prospective in nature and are not based on historical facts, but rather on current expectations and projections of the management of Standard Life Aberdeen about future events, and are therefore subject to risks and uncertainties which could cause actual results to differ materially from the future results expressed or implied by the forward-looking statements. For example, statements containing words such as “may”, “will”, “should”, “could”, “continue”, “aims”, “estimates”, “projects”, “believes”, “intends”, “expects”, “hopes”, “plans”, “pursues”, “seeks”, “targets” and “anticipates”, and words of similar meaning, may be forward-looking. These statements are based on assumptions and assessments made by Standard Life Aberdeen in light of its experience and its perception of historical trends, current conditions, future developments and other factors it believes appropriate. By their nature, all forward-looking statements involve risk and uncertainty because they are based on information available at the time they are made, including current expectations and assumptions, and relate to future events and depend on circumstances which may be or are beyond Standard Life Aberdeen’s control, including among other things: UK domestic and global political, economic and business conditions (such as the UK’s exit from the European Union); market related risks such as fluctuations in interest rates and exchange rates, and the performance of financial markets generally; the impact of competition; the timing, impact and other uncertainties associated with future acquisitions, disposals or combinations undertaken by Standard Life Aberdeen or its affiliates and/or within relevant industries; the value of and earnings from Standard Life Aberdeen’s strategic investments and ongoing commercial relationships (including the value of and earnings from the enhanced strategic partnership between Standard Life Aberdeen and Phoenix); default by counterparties; information technology or data security breaches; natural or man-made catastrophic events; the failure to attract or retain necessary key personnel; the policies and actions of regulatory authorities; and the impact of changes in capital, solvency or accounting standards, and tax and other legislation and regulations (including changes to the regulatory capital requirements that Standard Life Aberdeen is subject to) in the jurisdictions in which Standard Life Aberdeen and its affiliates operate. As a result, Standard Life Aberdeen’s actual future financial condition, performance and results may differ materially from the plans, goals, objectives and expectations set forth in the forward-looking statements. Persons receiving this presentation should not place undue reliance on forward-looking statements. Neither Standard Life Aberdeen nor its affiliates assume any obligation to update or correct any of the forward-looking statements contained in this presentation or any other forward-looking statements it or they may make (whether as a result of new information, future events or otherwise), except as required by law. Past performance is not an indicator of future results and the results of Standard Life Aberdeen and its affiliates in this presentation may not be indicative of, and are not an estimate, forecast or projection of, Standard Life Aberdeen’s or its affiliates’ future results.
Notes
• Unless otherwise stated, all figures in this presentation are on a continuing operations basis which excludes the UK and European insurance business. The sale of this business to Phoenix completed on 31 August 2018.
• Our results for 2018 include our 19.98% share of Phoenix results for the four months ended 31 December 2018. Comparative periods have not been restated and therefore Phoenix is not included prior to 31 August 2018 in either Reported or Pro forma results.
• 2017 comparatives are provided on a pro forma basis as if Standard Life Group and Aberdeen had always been merged.

Appendix

31
Assetmanagement
and platforms
Insuranceassociates and
joint ventures
Totalcontinuing
operations
Discontinued operations
Eliminations Total
2017 2018 2017 2018 2017 2018 2017 2018 2017 2018 2017 2018
£m £m £m £m £m £m £m £m £m £m £m £m
Adjusted operating income 2,099 1,868 - - 2,099 1,868 965 591 (136) (94) 2,928 2,365
Adjusted operating expenses (1,551) (1,395) - - (1,551) (1,395) (579) (376) 136 94 (1,994) (1,677)
Adjusted operating profit 548 473 - - 548 473 386 215 - - 934 688
Capital management 13 (9) - - 13 (9) (7) (5) - - 6 (14)
Share of associates’ and joint ventures’ profit before tax 41 46 58 140 99 186 - - - - 99 186
Adjusted profit before tax (pro forma basis for 20171) 602 510 58 140 660 650 379 210 - - 1,039 860
Adjust for Aberdeen results pre-merger completion (pre-14 August 2017) (185) - - - (185) - - - - - (185) -
Adjusted profit before tax (reported basis1) 417 510 58 140 475 650 379 210 - - 854 860
Tax on adjusted profit (77) (95) - - (77) (95) (31) (77) - - (108) (172)
Share of associates’ and joint ventures’ tax expense (29) (17) (12) (26) (41) (43) - - - - (41) (43)
Adjusted profit after tax 311 398 46 114 357 512 348 133 - - 705 645
Total adjusting items (288) (1,161) 292 (236) 4 (1,397) (44) 1,519 - - (40) 122
Tax on adjusting items 49 54 - 1 49 55 (7) 41 - - 42 96
Profit attributable to non-controlling interests (preference shares and perpetual notes)
(8) (5) - - (8) (5) - (28) - - (8) (33)
Profit for the year attributable to equity holders of SLA plc 64 (714) 338 (121) 402 (835) 297 1,665 - - 699 830
1. The merger of Standard Life plc and Aberdeen Asset Management plc (Aberdeen) completed on 14 August 2017, with the merger accounted for as an acquisition of Aberdeen by Standard Life plc on that date. The Reported results reflect this accounting treatment. Pro forma results for the Group are prepared as if Standard Life plc and Aberdeen had always been merged and are included in these results to assist in explaining trends in financial performance. The difference between the Reported results and Pro forma results is the results of Aberdeen in the period prior to completion of the merger.
Analysis of profit by segment

32
Adjusted profit before tax
All figures are stated on a continuing operations basis.1. One-off adjustment relates to a £5m negative impact following adoption of the new revenue recognition accounting standard IFRS 15.
Adjusted profit before tax
Benefiting from cost control, initial benefits of merger synergies and share of profits from Phoenix
Performancefees and one-off
adjustment1
Lower benefit from
capital management
Recurringrevenues
Additional reduction
in expenses
2017
£660m
2018
£650m
(£22m)
(£22m) £56m
(£209m)
£1m
Increased profits from
Indian assoc. and JVs
£86m
Share of profits from
Phoenix (from 1 Sept
2018)
Additional MiFID II
costs
(£12m)
Additional operating costs from
bolt-on M&A
(£8m)
Targeted cost
synergies
£120m

33
Assets, flows and fee revenue yield
Gross inflows Net flows AUMAFee basedrevenue
Fee revenueyield1
2017 2018 2017 2018 2017 2018 2017 2018 2017 2018
£bn £bn £bn £bn £bn £bn £m £m bps bps
Equities 14.2 11.8 (10.2) (17.6) 97.5 72.9 666 578 67.9 66.9
Fixed income 8.6 6.0 (3.1) (2.8) 48.0 46.7 144 130 29.4 27.7
Multi-asset 13.9 9.3 (6.9) (15.7) 72.4 53.9 432 350 57.7 53.6
Private markets 1.1 1.1 (0.3) (1.3) 16.5 16.0 84 68 46.12 43.1
Alternatives 0.8 0.8 (0.5) (0.4) 8.0 12.3 12 18 16.9 17.4
Real estate 3.6 3.8 (1.0) (0.2) 28.5 29.7 159 154 54.4 53.2
Quantitative 0.2 0.2 (0.5) (0.1) 2.2 2.1 3 3 12.1 12.2
Cash/Liquidity 6.4 7.4 (1.7) (1.3) 17.2 16.5 14 14 7.4 8.0
Asset management (excl. strategic insurance partners) 48.8 40.4 (24.2) (39.4) 290.3 250.1 1,514 1,315 50.92 48.1
Strategic insurance partners 15.6 28.6 (15.2) (5.5) 271.8 255.0 372 347 13.7 13.1
Retail – Wrap and Elevate 10.7 8.5 7.0 4.2 54.0 54.2 129 142 26.2 25.6
Eliminations (2.7) (2.3) (0.5) (0.2) (8.0) (7.8) N/A N/A N/A N/A
Group 72.4 75.2 (32.9) (40.9) 608.1 551.5 2,015 1,804 33.02 30.8
SL Asia 12 12
Retail advice and other3 46 43
Performance fees 26 9
Group fee based revenue 2,099 1,868
1. Calculated using fee based revenue and monthly average AUM/AUA. 2. Adjusted to exclude non-recurring impact of £7m deferred revenue. 3. Includes 1825, Focus and Threesixty.
All figures are stated on a continuing operations basis.

34
Assets under management flows analysis
Gross inflows Redemptions Net flows
2017 2018 2017 2018 2017 2018
£bn £bn £bn £bn £bn £bn
Absolute return, EM, APAC and Global equities 17.6 12.1 (36.8) (44.8) (19.2) (32.7)
Natural run-off from strategic insurance clients 15.6 28.6 (30.8) (34.1) (15.2) (5.5)
33.2 40.7 (67.6) (78.9) (34.4) (38.2)
Cash/liquidity 6.4 7.4 (8.1) (8.7) (1.7) (1.3)
Other capabilities 24.8 20.9 (28.1) (26.3) (3.3) (5.4)
Assets under management flows 64.4 69.0 (103.8) (113.9) (39.4) (44.9)

35
Gross inflows Redemptions Net flows
2017 2018 2017 2018 2017 2018
£bn £bn £bn £bn £bn £bn
Institutional 24.3 19.3 (44.0) (47.0) (19.7) (27.7)
Wholesale 22.1 18.4 (27.7) (30.5) (5.6) (12.1)
Wealth/Digital 2.4 2.7 (1.3) (2.3) 1.1 0.4
Asset management (excl. Strategic insurance partners) 48.8 40.4 (73.0) (79.8) (24.2) (39.4)
Strategic insurance partners 15.6 28.6 (30.8) (34.1) (15.2) (5.5)
Assets under management flows 64.4 69.0 (103.8) (113.9) (39.4) (44.9)
Retail – Wrap and Elevate 10.7 8.5 (3.7) (4.3) 7.0 4.2
Eliminations (2.7) (2.3) 2.2 2.1 (0.5) (0.2)
Assets under management and administration flows 72.4 75.2 (105.3) (116.1) (32.9) (40.9)
Net flows as a % of opening AUMA (5.4%) (6.7%)
Flows by channel analysis
All figures are stated on a continuing operations basis.

36
Quarterly net flows analysis
Q4 2017£bn
Q1 2018£bn
Q2 2018£bn
Q3 2018£bn
Q4 2018£bn
Equities (3.5) (3.7) (3.9) (4.3) (5.7)
Fixed income (0.5) (1.2) (0.9) (0.3) (0.4)
Multi-asset (1.3) (1.5) (2.9) (4.6) (6.7)
Private markets (0.1) (0.5) (0.2) (0.9) 0.3
Alternatives - 0.2 (0.4) 0.4 (0.6)
Real estate (0.1) (0.2) - 0.2 (0.2)
Quantitative - - - (0.2) 0.1
Cash/Liquidity (0.8) 0.2 1.4 (3.5) 0.6
Asset management (excl. strategic insurance partners) (6.3) (6.7) (6.9) (13.2) (12.6)
Strategic insurance partners (3.5) (2.5) (3.1) 1.8 (1.7)
Retail – Wrap and Elevate 1.6 1.5 1.0 1.0 0.7
Eliminations (0.1) (0.1) (0.1) (0.1) 0.1
Total net flows (8.3) (7.8) (9.1) (10.5) (13.5)
All figures are stated on a continuing operations basis.

37
Detailed asset class analysis
Opening AUM as at
1 Jan 2018
Gross
inflows Redemptions Net flows
Market and
other movements
Corporate
actions
Closing AUM as at
31 Dec 2018
£bn £bn £bn £bn £bn £bn £bn
Developed Markets equities 16.3 2.2 (3.6) (1.4) (2.0) - 12.9
Emerging Markets equities 37.0 4.2 (13.4) (9.2) (2.8) - 25.0
Asia Pacific equities 27.7 3.9 (6.8) (2.9) (2.3) - 22.5
Global equities 16.5 1.5 (5.6) (4.1) (1.1) 1.2 12.5
Equities 97.5 11.8 (29.4) (17.6) (8.2) 1.2 72.9
Developed Markets credit 32.9 3.3 (5.6) (2.3) 0.6 0.9 32.1
Developed Markets rates 5.7 0.8 (1.2) (0.4) (0.1) - 5.2
Emerging Markets fixed income 9.4 1.9 (2.0) (0.1) 0.1 - 9.4
Fixed income 48.0 6.0 (8.8) (2.8) 0.6 0.9 46.7
Absolute return 39.8 2.5 (19.0) (16.5) (1.4) - 21.9
Diversified growth/income 1.5 0.7 (0.3) 0.4 (0.2) - 1.7
MyFolio 13.3 2.7 (1.5) 1.2 (0.6) - 13.9
Other multi-asset 6.5 0.7 (1.9) (1.2) 0.2 - 5.5
Parmenion 4.4 2.1 (1.0) 1.1 (0.3) - 5.2
Aberdeen Standard Capital 6.9 0.6 (1.3) (0.7) (0.5) - 5.7
Multi-asset 72.4 9.3 (25.0) (15.7) (2.8) - 53.9
Private equity 12.4 0.9 (1.9) (1.0) 0.9 - 12.3
Private credit and solutions 0.3 0.2 (0.2) - (0.3) - -
Infrastructure equity 3.8 - (0.3) (0.3) 0.2 - 3.7
Private markets 16.5 1.1 (2.4) (1.3) 0.8 - 16.0
Alternatives 8.0 0.8 (1.2) (0.4) 2.6 2.1 12.3
UK real estate 15.8 1.1 (2.3) (1.2) 0.7 - 15.3
European real estate 11.1 2.3 (1.4) 0.9 0.2 - 12.2
Global real estate 0.1 0.2 (0.1) 0.1 - 0.6 0.8
Real estate multi-manager 1.5 0.2 (0.2) - (0.1) - 1.4
Real estate 28.5 3.8 (4.0) (0.2) 0.8 0.6 29.7
Quantitative 2.2 0.2 (0.3) (0.1) - - 2.1
Cash/Liquidity 17.2 7.4 (8.7) (1.3) 0.6 - 16.5
Asset Management (excl. strategic insurance partners) 290.3 40.4 (79.8) (39.4) (5.6) 4.8 250.1

38
Calculation of fee revenue yield
Average AUMA Fee based revenue Fee revenue yield1
2017 2018 2017 2018 2017 2018
£bn £bn £m £m bps bps
Equities 98.1 86.3 666 578 67.9 66.9
Fixed income 49.0 46.9 144 130 29.4 27.7
Multi-asset 74.7 65.4 432 350 57.7 53.6
Private markets 16.7 15.8 84 68 46.12 43.1
Alternatives 7.1 10.5 12 18 16.9 17.4
Real estate 29.2 28.9 159 154 54.4 53.2
Quantitative 2.2 2.1 3 3 12.1 12.2
Cash/Liquidity 19.1 17.3 14 14 7.4 8.0
Asset management (excl. strategic insurance partners) 296.1 273.2 1,514 1,315 50.92 48.1
Strategic insurance partners 271.1 265.0 372 347 13.7 13.1
Retail – Wrap and Elevate 49.2 55.6 129 142 26.2 25.6
Eliminations (7.2) (7.9) N/A N/A N/A N/A
Group fee revenue yield 609.2 585.9 2,015 1,804 33.02 30.8
SL Asia 12 12
Retail advice and other3 46 43
Performance fees 26 9
Group fee based revenue 2,099 1,868
1. Calculated using fee based revenue and monthly average AUM/AUA. 2. Adjusted to exclude non-recurring impact of £7m deferred revenue. 3. Includes 1825, Focus and Threesixty.
All figures are stated on a continuing operations basis.

39
Signs of improvement in equity investment performanceAbsolute return performance stabilising with stronger recent short-term momentum
1. Arithmetic relative performance GBP % annualised.
GARS performance improving after a difficult 2018Improving performance in Long Term Quality equities1
85
90
95
100
105
110
115
Jan 18 Apr 18 Jul 18 Oct 18
• Strong relative performance in volatile markets in H2 (Q4 in particular)
• Good initial momentum in 2019 up over 2%, with three year return now positive
MSCI World (£ Hedged) GARS
• Weaker EM performance in H1 offset by strong performance in H2 benefiting from our focus on Long Term Quality
• Flagship APAC ex Japan outperformed benchmark by >400bps during 2018
- 1.28
+ 0.15
- 1.46
Asia
P
acif
icE
merg
ing
Mark
ets
- 9.96
- 1.63
- 2.30
Glo
bal - 5.16
- 2.91
- 4.38
H1 2018ppts
FY 2018ppts
+ 5.12
+ 1.40
+ 0.50
+ 0.45
- 1.34
- 0.16
- 1.17
+ 0.30
- 2.72
1 YR
3 YRS
5 YRS
1 YR
3 YRS
5 YRS
1 YR
3 YRS
5 YRS
AUM£19.9bn
AUM£24.8bn
AUM£8.8bn
MSCI World + 1.13%GARS - 3.47%
MSCI World - 8.85%GARS - 2.07%
H1 H2
- 5.46%
- 7.81%

40
Insurance associates and joint ventures
• Lower profit from HDFC Life reflects reduced stake following IPO in November 2017 and movements in FX
• Growth in sales and premium income in our joint venture in China driving profit
• Phoenix Group reflects four months share of profits from 19.98% stake acquired on 31 August 2018
Share of insurance associates and JVs adjusted profit before tax
2017 2018
£m £m
HDFC Life 48 42
Heng An SL 10 12
Phoenix Group (from 1 September 2018) - 86
Adjusted profit before tax 58 140

41
HDFC Life – a leading private Indian life insurer
1. HDFC Bank, source: WPP, Kantar Millward Brown, 2018. 2. Source: HDFC Life annual reports, for 12 months ending 31 March. 3. HDFC Life market share sourced from IRDAI. Measured as share of private market overall new business for years ended 31 March 2014-2018. 4. Source: HDFC Life Q3 FY18-19 financial results. 5. Based on total New Business Premiums. 6. Based on individual Annual Premium Equivalent. 7. As at 11 March 2019 using data from the National Stock Exchange of India and an exchange rate of R93.0070/£1. 8. At a floor price of R357.5 per share.
A fast growing business leveraging one of India’s most valuable brands1
• Stake of 29.2% as at 11 March 2019 of which:
• 9ppt locked up until March 2021
• Up to 4.93% offered for sale on 11 March 20198
35% increase in share price since IPO in November 2017Consistently ranked in top 3 private life insurers in India2
Share priceat IPO
Share priceat 11 March 2019
INR400
INR0
R290
R391
HDFC Life market cap7: £8.5bn / 788Rs bnR121bn
2014
INR250bn
INR0bn
2016
R163bn
2018
R236bn
2015
R148bn
2017
2016
R194bn
20%
0%
To
tal p
rem
ium
s2
Sh
are
of p
riva
te life
insu
ran
ce
ma
rke
t 3
13.7%3
15.8%3
17.2%3
19.1%3
Q3 FY18-19Distribution
mix4,5
Q3 FY18-19Product mix4,6
Bancassurance27%
Direct15%
Group50%
Brokers and others2%
Individual agents6%
Participating 20%
Non-participating
21%
Unit-linked 59%
15.8%3

42
HDFC AMC – India’s leading asset manager
1. HDFC Bank, source: WPP, Kantar Millward Brown, 2018. 2. In constant currency. 3. Data source: HDFC AMC financial results. 4. As at 11 March 2019 using data from the National Stock Exchange of India and an exchange rate of R93.0070/£1. 5. On a fully diluted basis.
A fast growing business leveraging one of India’s most valuable brands1
• Remaining stake of 29.9% will be reduced to 24.99% by August 2021 to create necessary free float:
• 29.9% locked up until August 2019
• Of which 7.2ppt5 locked up until August 2021
AUM of £37.0bn with CAGR of 26% over the last 5 years2
R1,089bn
31 Mar 14
INR3,500bn
INR0bn
31 Mar 16
R1,656bn
31 Mar 18
R2,920bn
31 Mar 15
R1,506bn
R2,306bn
31 Mar 17
Asse
ts u
nd
er
ma
na
ge
me
nt3
Q3 FY18-19Distribution
mix3
Q3 FY18-19Product
mix3
Direct40%
Banks14%
IFAs28%
National distributors
18%
Equities48%Fixed
income28%
Cash / liquidity24%
Successful IPO of HDFC AMC completed in August 2018
INR2,000
INR0
R1,100
R1,497
HDFC AMC market cap4: £3.4bn / 318Rs bn
Share priceat IPO
Share priceat 11 March 2019
31 Dec 18
R3,291bn

Standard Life Aberdeen plc is registered in Scotland (SC286832) at 1 George Street, Edinburgh, EH2 2LL.
www.standardlifeaberdeen.com © 2019 Standard Life Aberdeen. All rights reserved.


![FUEL CONCENTRATION AND OPERATING TEMPERATURE … · Bandung 40012, Indonesia dDepartment of Physics, Tamkang University, New Taipei, Taiwan ... (Basri et al. [1]). Qiao et al. [2]](https://static.fdocuments.us/doc/165x107/6063743705407136b71fe4df/fuel-concentration-and-operating-temperature-bandung-40012-indonesia-ddepartment.jpg)