STANDARD DOCUMENT COVER SHEET...(20%) and Globe Telecom, Inc. (40%) and a December 2016 merger with...
225
COVER SHEET P W - 1 2 1 S.E.C. Registration Number B A N K O F T H E P H I L I P P I N E I S L A N D S (Company's Full Name) A Y A L A N O R T H E X C H A N G E , T O W E R 1 A Y A L A A V E . C O R N E R S A L C E D O S T . L E G A S P I V I L L A G E , M A K A T I C I T Y Josenia Jessica Nemeño (632) 246-5902 Contact Person Company Telephone Number 1 2 3 1 1 7 - A 0 4 2 5 Month Day FORM TYPE Month Day Fiscal Year Annual Meeting N/A Secondary License Type, If Applicable C F D Dept. Requiring this Doc. Amended Articles Number/Section Total Amount of Borrowings 12,588 Total No. of Stockholders Domestic Foreign To be accomplished by SEC Personnel concerned File Number LCU Document I.D. Cashier S T A M P S
Transcript of STANDARD DOCUMENT COVER SHEET...(20%) and Globe Telecom, Inc. (40%) and a December 2016 merger with...

COVER SHEET
P W - 1 2 1
S.E.C. Registration Number
B A N K
O F
T H E
P H I L I P P I N E
I S L A N D S
(Company's Full Name)
A Y A L A
N O R T H
E X C H A N G E ,
T O W E R
1
A Y A L A
A V E . C O R N E R S A L C E D O S T .
L E G A S P I
V I L L A G E ,
M A K A T I
C I T Y
Josenia Jessica Nemeño
(632) 246-5902
Contact Person
Company Telephone Number
1 2
3 1
1 7 - A
0 4
2 5
Month
Day
FORM TYPE
Month
Day
Fiscal Year
Annual Meeting
N/A
Secondary License Type, If Applicable
C F D
Dept. Requiring this Doc.
Amended Articles Number/Section
Total Amount of Borrowings
12,588
Total No. of Stockholders
Domestic
Foreign
To be accomplished by SEC Personnel concerned
File Number
LCU
Document I.D.
Cashier
S T A M P S

STANDARD DOCUMENT COVER SHEET FOR SEC FILINGS
All documents should be submitted under a cover page which clearly identifies the company and the specific
document form as follows:
SEC Identification Number PW-121 File Number **
BANK OF THE PHILIPPINE ISLANDS AYALA NORTH EXCHANGE TOWER 1, AYALA AVE. CORNER SALCEDO ST.,
LEGASPI VILLAGE, MAKATI CITY, METRO MANILA (632) 246-5902
December 31, 2018 SEC FORM I7 -A
AMENDMENT DESIGNATION
FOR THE PERIOD ENDED DECEMBER 31, 2018 (if a report, financial statement, GIS, or related amendment or show-cause filing)
NONE EACH ACTIVE SECONDARY LICENSE TYPE AND FILE NUMBER
(state “NONE” if that is the case)
* SEC will assign SEC No. to new companies. ** SEC will assign File No. to new applications or registrations. *** Companies should display the File No. on any filing which is an amendment to an application or
registration


3
Philippines during the preceding twelve (12) months (or for such shorter period that the registrant was required to file such reports);
Yes [ X ] No [ ]
(b) Has been subject to such filing requirements for the past ninety (90) days. Yes [ X ] No [ ] 13. State the aggregate market value of the voting stock held by non-affiliates of the registrant. The aggregate
market value shall be computed by reference to the price at which the stock was sold, or the average bid and asked prices of such stock, as of a specified date within sixty (60) days prior to the date of filing. If a determination as to whether a particular person or entity is an affiliate cannot be made without involving unreasonable effort and expense, the aggregate market value of the common stock held by non-affiliates may be calculated on the basis of assumptions reasonable under the circumstances, provided the assumptions are set forth in this Form. (See definition of "affiliate" in “Annex B”).
Shares Held by Market Value per share Non-Affiliates as of 03/29/19 Total Market Value 4,502,449,501 P84.20 P 379,106,247,984
APPLICABLE ONLY TO ISSUERS INVOLVED IN INSOLVENCY/SUSPENSION OF PAYMENTS PROCEEDINGS
DURING THE PRECEDING FIVE YEARS: 14. Check whether the issuer has filed all documents and reports required to be filed by Section 17 of the Code
subsequent to the distribution of securities under a plan confirmed by a court or the Commission. Yes [ ] No [ ]
DOCUMENTS INCORPORATED BY REFERENCE 15. If any of the following documents are incorporated by reference, briefly describe them and identify the part of SEC Form 17-A into which the document is incorporated: X (a) Any annual report to security holders; (b) Any information statement filed pursuant to SRC Rule 20 and 17.1(b);
(c) Any prospectus filed pursuant to SRC Rule 8.1-1.

4
PART 1 - BUSINESS AND GENERAL INFORMATION
Item 1. Business (A) Description of business
(1) Business Development
Bank of the Philippine Islands (“BPI”) is the Philippines’ third largest banking institution in terms of total assets and equity capital, and is among the highest in the industry in terms of market capitalization. The bank is licensed by the Bangko Sentral ng Pilipinas (“BSP”) to provide universal banking services and has a significant share of total banking system deposits, loans, and investment assets under management. It is recognized as one of the country’s top providers of cross-border remittances, life and non-life bancassurance services, as well as asset finance and leasing. BPI also has a significant capital markets presence, particularly in fixed income and equities underwriting, distribution and brokerage. It is a significant provider of foreign exchange to both retail and corporate clients. The bank also has the country’s second largest branch network. It is a leader and innovator in the use of automated branch processes as well as in the use of electronic channels. The bank operates the country’s second largest ATM network, and is also a major provider of financial services through internet banking, mobile banking, and phone banking.
Historical Background. Founded in 1851, BPI was the first bank formed in the Philippines and was the issuer of the country’s first currency notes in 1855. It opened its first branch in Iloilo in 1897 and pioneered in sugar crop loans. It also financed the first tram service, telephone system, and electric power utility in Manila and the first steamship in the country. As such, BPI and its “escudo” ranks as one of the largest home-grown Philippine brands and carries an extensive legacy.
Recent History. For many years after its founding, BPI was the only domestic commercial bank in the Philippines. BPI’s business was largely focused on deposit taking and extending credit to exporters and local traders of raw materials and commodities, such as sugar, tobacco, coffee, and indigo, as well as funding public infrastructure. In keeping with the regulatory model set by the Glass Steagall Act of 1932, the Bank operated for many years as a private commercial bank. In the early 1980s, the Monetary Board of the Central Bank of the Philippines (now the BSP) allowed BPI to evolve into a fully diversified universal bank, with activities encompassing traditional commercial banking as well as investment and consumer banking. This transformation into a universal bank was accomplished through both organic growth and mergers and acquisitions, with BPI absorbing an investment house, a stock brokerage, a leasing company, a savings bank, a retail finance company, and bancassurance platforms.
BPI consummated three bank mergers since the late 1990s. In 1996, it merged with City Trust Banking Corp., the retail banking arm of Citibank in the Philippines, which enhanced its franchise in consumer banking. In 2000, BPI acquired Far East Bank & Trust Company (FEBTC), then the largest banking merger in the Philippines. This merger established BPI’s dominance in asset management & trust services and branch banking; furthermore, it enhanced the Bank’s penetration of middle market clients. In 2000, BPI also formalized its acquisition of three major insurance companies in the life, non-life and reinsurance fields. In 2005, BPI acquired and merged with Prudential Bank, a medium sized bank with a clientele of middle market entrepreneurs.

5
In March 2011, BPI became the first bank in the Philippines to acquire the trust business of a foreign bank when it purchased the trust and investment management business of ING Bank N.V. Manila. In December 2014, BPI completed a strategic partnership with Century Tokyo Leasing Corp., one of the largest leasing companies in Japan, to form BPI Century Tokyo Lease & Finance Corp., with BPI retaining 51% of ownership. This strategic partnership is expected to help BPI innovate in asset financing products and enhance the service experience of an expanding base of Philippine consumers and corporations seeking asset leasing and rental solutions. On August 2015, BPI completed another strategic partnership with Global Payments, an Atlanta-based, NYSE-listed provider of international payment services. By combining its merchant acquiring network with that of GPN, BPI stands to provide enhanced services to its card customers, as well as to its merchant clients. The partnership with GPN remained 49% owned by BPI.
BPI evolved to its present position as a leader in Philippine banking through a continuous process of improving its array of products and services, while maintaining a balanced and diversified risk profile that helped reinforce the stability of its earnings.
Business Milestones (2016-2018). On August 2016, BPI acquired a 10% minority stake in Rizal Bank Inc. (RBI), a member institution of Center for Agriculture and Rural Development Mutually Reinforcing Institutions (CARD MRI), a group of social development organizations that specialize in microfinance. Effective September 20, 2016, BPI has taken full control over BPI Globe BanKO, Inc. after acquiring the 20% and 40% stake of Ayala Corporation and Globe Telecom, respectively. On December 29, 2016, the Securities and Exchange Commission approved change of the corporate name to BPI Direct BanKo, Inc., A Savings Bank, after BPI Direct absorbed the entire assets and liabilities of BanKO. Also on December 29, 2016, BPI successfully spun off its BPI Asset Management and Trust Group (BPI AMTG) to a Stand-Alone Trust Corporation (SATC) named BPI Asset Management and Trust Corp. (BPI AMTC). BPI AMTC officially commenced its operations on February 1, 2017.
Principal Subsidiaries. The Bank’s principal subsidiaries are:
(1) BPI Family Savings Bank, Inc. (“BFSB”) is BPI’s flagship platform for retail lending, in particular,
housing, auto, and small business loans. It is also one of BPI’s primary vehicles for retail deposits. BFSB was acquired by BPI in 1984;
(2) BPI Capital Corp. (“BPI Cap”) is an investment house focused on corporate finance and the underwriting, distribution, and trading of debt and equity securities. It began operations in December 1994. BPI Cap wholly owns BPI Securities Corp., a stock brokerage;
(3) BPI Direct BanKo, Inc., A Savings Bank (“BanKo”), serves microfinance customers through
branch, electronic, and partnership channels. Founded in February 2000 as BPI Globe BanKO, it

6
is now wholly-owned, following a September 2016 purchase of stakes owned by Ayala Corp. (20%) and Globe Telecom, Inc. (40%) and a December 2016 merger with BPI Direct Savings Bank, Inc.;
(4) BPI International Finance Limited (“BPI IFL”) is a deposit taking company in Hong Kong.
Originally established in August 1974, it provides deposit services as well as client-directed sourcing services for international investments. On November 21, 2018 BPI IFL distributed its shares in BPI Remittance Centre Hong Kong Ltd. (“BERC HK”) as a property dividend to the Parent Bank. BERC HK became an immediate subsidiary of the Parent Bank following this. BERC HK is a Licensed Money Service Operator in Hong Kong servicing the remittance services to beneficiaries residing throughout the Philippines;
(5) BPI Europe Plc. (”BPI Europe”) commenced operations in the United Kingdom in May 2007 as a bank registered in England and Wales. It is a UK-licensed bank authorized by the Prudential Regulation Authority (PRA), and regulated by the PRA and the Financial Conduct Authority (FCA). It started its operations offering retail deposit products and money services, servicing retail customers, primarily targeting the Filipino community;
(6) BPI Century Tokyo Lease & Finance Corp. (“BPI CTL”) is a non-bank financial institution (“NBFI”)
that provides financing services pursuant to the Financing Company Act. BPI CTL is a joint venture with Century Tokyo Leasing Corp., who purchased a 49% stake in 2014. BPI CTL wholly owns BPI Century Tokyo Rental Corp., which offers operating leases;
(7) BPI/MS Insurance Corp. (“BPI MS”) is a non-life insurance company. It is a joint venture with
Mitsui Sumitomo Insurance Co. (who owns a 49% stake), and is the result of a merger of FGU Insurance Co. and FEB Mitsui Marine Insurance Co., which was acquired as a subsidiary of Far East Bank in 2000;
(8) BPI Asset Management and Trust Corporation (“BPI AMTC”) is a Stand Alone Trust Corporation
(SATC) serving both individual and institutional investors with a full suite of local and global investment solutions. BPI AMTC was established after a Certificate of Authority to Operate was issued by the BSP on December 29, 2016 and it started operations on February 1, 2017;
(9) BPI Investment Management Inc. (“BIMI”) is a wholly owned subsidiary of the Bank and serves
as the Bank’s manager and investment advisor to the ALFM mutual funds (which comprise a number of open-end investment companies registered with, and regulated by, the SEC). BIMI is also responsible for formulating and executing the funds’ investment strategies.
(2) Business of Issuer
Principal Products & Services
The Bank offers a wide range of corporate and retail banking products. The Bank has two major categories for products and services. The first category covers its core financial intermediation business, which includes, deposit taking, lending, and securities investments. Revenue from this category is collectively termed as net interest income and accounts for about 71% of net revenues. The second category covers services ancillary to the Bank’s financial

7
intermediation business, and from which it derives transaction-based commissions, service charges and other fees. These include investment banking and corporate finance fees, asset management and trust fees, stock brokerage fees, credit card membership fees, rental of bank assets, income from insurance subsidiaries and service charges or commissions earned on international trade transactions, drafts, fund transfers, and various deposit-related services. Commissions, service charges, and other fees, when combined with trading gains and losses arising from the Bank’s fixed income and foreign exchange operations, constitute non-interest income, which accounts for the remaining 29% of net revenues.
Foreign Offices Contribution
Distribution Network BPI had 856 branches across the country, including 12 kiosk branches, as of end 2018. Kiosks are branches much smaller than traditional full-service branches, but are fully equipped with terminals allowing direct electronic access to product information and customers’ accounts, as well as processing of self-service transactions. Kiosks serve as sales outlets in high foot traffic areas such as supermarkets, shopping malls, transit stations, and large commercial establishments. Additionally, there are 200 BPI Direct BanKo branches and Branch-Lite Units (BLUs) set up in strategic locations in the country. Overseas, BPI has one (1) Hong Kong office (BPI IFL) and two (2) BPI Europe offices in London. BPI maintains a specialized network of overseas offices to service Filipinos working abroad. To date, BPI has 4 Remittance Centers located in Hong Kong and 2 representative offices located in UAE and Japan. BPI also maintains remittance tie-up arrangements with various foreign entities in several countries to widen its network in serving the needs of Filipinos overseas. On the lending side, there are 26 business centers, servicing both corporate and retail clients, across the country to process loan applications, loan releases, and international trade transactions. These centers also provide after-sales servicing of loan accounts. BPI’s network has grown to a total of 3,034 terminals as of end-2018 of which 2,421 are ATMs and 613 are Cash Accept Machines (CAMs). This complements the branch network by providing cash related banking services to customers at any place and time of the day. In addition, the interconnection with Bancnet gives BPI cardholders access to over 20,000 ATMs across the country. BPI’s ATM network is likewise interconnected with Mastercard, China Union Pay (CUP), Discover/Diners, JCB, and Visa. Through the Bank’s extensive physical and digital networks, the
2016 2017 2018
Share in Total Revenue (%) 0.74 1.51 0.56 Hong Kong 0.35 0.37 0.37 USA 0.06 0.86 (0.00) Europe 0.33 0.28 0.20
Share in Total Net Income (%) 0.18 1.57 (0.02) Hong Kong 0.10 0.18 (0.12) USA 0.08 1.43 0.04 Europe (0.00) (0.04) 0.05

8
Bank provides a broad range of value-added services to its clients, enhancing convenience and self-service capabilities, as well as greater accessibility. BPI’s retail digital platforms (BPI Online and BPI Mobile) provide clients a reliable, safe and intuitive digital banking experience. This translates to an ultimate convenience through quick and paperless transactions anytime, anywhere. Aside from the standard banking features (i.e. account inquiry, funds transfer, bills payment), the digital platforms have introduced a new set of innovative features and service. These include:
Transfer via QR Code – making transferring money to unenrolled accounts as easy as taking or uploading a photo;
Expanded Reloading merchants – reloading to all telco networks is now available, as well as other prepaid merchants like Meralco Kuryente Load and Cignal;
Debit Card control - clients can now manage their purchase limits for POS transactions, withdrawal limits, and temporarily or permanently block their debit cards on their own;
Biometric login makes a safer and quicker way to login on the app;
OTP as a primary security feature adds an extra layer of security to validate that transactions are really done by the client; plus
Transfer to other BPI accounts is now available on both the BPI web and app platforms. BPI Phone Banking provides clients with 24/7 self-service banking facilities and a gateway to get live support through the Bank's Contact Center. Using any phone, customers can call 89-100 to inquire about their account balances and latest transactions, transfer funds to other BPI accounts in real time and pay for their various bills. Concerns and queries on any of BPI's products and services are addressed by the highly-trained Phone Banking Specialists any time, any day.
Competition
Mergers, acquisitions and closures continued to reduce the number of players in the industry from a high of 50 upon the liberalization of rules on the entry of foreign banks, down to 45 universal and commercial banks in December 2018. Lending by universal and commercial banks, excluding thrift banks, grew by 14.6% in 2018 or 2.7 percentage points lower versus registered growth in 2017. The top five industry performers were arts, entertainment and recreation, construction, financial and insurance activities, water supply, sewerage, waste management and remediation activities, and mining and quarrying, arts, entertainment and recreation, education, public administration and activities of households as employers and undifferentiated goods-and-services-producing activities of households for own use which grew by 41.1%, 36.1%, 30.5%, 22.3% and 22.1%, respectively. Decent credit demands were also seen from education, agriculture, forestry and fishing, transportation and storage, wholesale and retail trade, repair of motor vehicles, motorcycles, and mining and quarrying. Consumer loans also grew by 14.6% in December 2018 versus the prior year. While the Philippine Economy slightly slowed down from the 6.7% growth recorded in 2017, it is expected to beat its 2018 growth of 6.2% to at least 6.5% in 2019 on sustained investment inflows, easing inflation and election driven spending. The Government’s big ticket infrastructure projects

9
were able to take off backed by the Comprehensive Tax Reform Program which also yielded to increased purchasing power of the income earning populations.
As major banks raised capital in 2018, this enabled the financial sector to actively participate in private and government activities and likewise earned enough capital buffer in the short- to medium-term. The 2% reduction in reserve requirement also helped boost the sector’s lending capacity and supported the capital market development.
BPI on its part will continue to grow its corporate and consumer clients while giving focus on small and medium size lending. The prioritization of SMEs was concretized by launching Business Bank last year. On microfinance, the Bank opened additional 100 BanKo branches and ended 2018 at 200.
Based on required published statements by the BSP as of December 2018, BPI is the third largest bank operating in the country in terms of assets, customer loans, deposits and capital. The Bank ranks second in terms of asset management and trust business. Total assets of BPI, based on Philippine Accounting Standards (PAS) compliant audited financial statements, are higher than the published statements prepared along BSP standards. Patents, Trademarks, Licenses, Franchises, etc.
BPI sells its products and services through the BPI trademark and/or trade name. All its major financial subsidiaries carry the BPI name prefix (e.g., BPI Family Savings Bank, BPI Capital, BPI Securities, BPI Leasing, and BPI Direct BanKo), and so do its major product and service lines.
Following are some of BPI’s trademarks for its products and services:
1. BPI Express Assist (BEA), for its branch queuing facility 2. BPI ATM, for its automated teller machine 3. BPI CAM, for its cash accept machine 4. BPI Debit and BPI Debit Cards, for its debit cards 5. Express Credit, BPI Credit and BPI Credit Cards, for its credit cards 6. Express Cash, My ePrepaid and BPI ePay, for its prepaid cards 7. BPI Express Phone, for its contact center facility 8. BPI Express Online, for its internet-based transaction platform for retail customers 9. BPI Mobile Banking, for its mobile banking facility 10. BPI ExpressLink/BizLink, for its internet-based transaction platform for corporate
customers 11. ExpressLink Mobile, for its mobile banking for corporate customers 12. Express Collect, for its corporate deposit-related services
At BFSB, the product trademarks include the BPI Family Housing Loan with Pay-break and Pay-hinga variants, the BPI Family Auto Loan, and BPI Family Ka-Negosyo Business Loans (BPI Family Ka Negosyo Credit Line, BPI Family Ka-Negosyo Franchising Loan and BPI Family Ka-Negosyo Term Loan). Other product brands of BPI, BFSB and BanKo are Kaya Savings, Jumpstart, PondoKo Savings, Maxi-One, Save-up, Advance Savings, Maxi-Saver, Pamana Savings Account, Pamana Padala, Padala Moneyger, Ka-Negosyo Checking Account, Plan Ahead, the BPI Personal Loan and a loan product specifically offered by BanKo, BanKo NegosyoKo.

10
All the Bank’s Trademark registrations are valid for 10 years with years of expiration varying from year 2018 to 2028. Trademarks intended to be used or maintained by the Bank are so maintained and renewed in accordance with applicable Intellectual Property laws and regulations. The Bank closely monitors the expiry and renewal dates of its trademarks to protect the Bank’s brand equity. In terms of business licenses, BPI has an expanded commercial banking license while BFSB and BanKo have savings bank licenses. BPI Cap has an investment house license and is a registered Government Securities Eligible Dealer (GSED) with Broker Dealer of Securities and Mutual Fund Distributor. BPI CTL has a finance company license. BPI AMTC has a trust license, securities custodian license and is a PERA-accredited administrator while BIMI has an investment company adviser license, mutual fund distributor license, and is a registered transfer agent. BPI MS was granted by the Insurance Commission a Certificate of Authority to transact and sell non-life insurance products. For foreign business licenses, BPI Europe has a UK banking license authorized by the Prudential Regulation Authority. Meanwhile, BPI IFL is licensed by the Hong Kong Monetary Authority as a deposit-taking company. It was further granted by the Hong Kong Securities and Futures Commission with licenses to engage in securities dealing and advising, and asset management.
Related Parties In the ordinary course of business, the Bank has entered into various transactions with its Directors, Officers, Stockholders and their Related Interest, or DOSRI, including loan transactions. BPI and all its subsidiaries have always been in compliance with the General Banking Act, BSP Circulars and regulations on DOSRI loans and transactions. As of December 31, 2018, DOSRI loans amounted to 0.60% of loans and advances as per Note 26 of the 2018 Audited Financial Statements.
Government Regulations Under the General Banking Act, the Monetary Board of the BSP is responsible for regulating and supervising financial intermediaries like BPI. The implementation and enforcement of the BSP regulations is primarily the responsibility of the supervision and examination sector of the BSP. The General Banking Act was revised in 2000. The revisions allow (1) the issuance of tier 2 capital and its inclusion in the capital ratio computation, and (2) the 100% acquisition of a local bank by a foreign bank. The second item removes the advantage of a local bank over a foreign bank in the area of branching. In 2005, the BSP issued Circular No. 494 covering the guidelines in adopting the provision of Philippine Financial Reporting Standards (PFRS) and Philippine Accounting Standards (PAS) effective the annual financial reporting period beginning 1 January 2005. These new accounting standards aim to promote fairness, transparency and accuracy in financial reporting.
In July 2007, the risk-based Capital Adequacy Ratio (CAR) under the Basel II accord, which assigns risk weights for credit, market and operational risks, was implemented by the BSP through BSP Circular No. 538. The circular, which covers all universal and commercial banks including their subsidiary banks and quasi-banks, also maintained the 10% minimum capital adequacy ratio for

11
both solo and consolidated basis. Subsequently, the Internal Capital Adequacy Assessment Process (ICAAP) guidelines were issued in 2009 for adoption by January 2011. On January 6, 2012, the BSP announced that universal and commercial banks will be required to adopt the capital adequacy standards under Basel III starting January 1, 2014. On January 15, 2013, the BSP issued Circular No. 781, which prescribes the new capital adequacy standards in accordance with Basel III. This circular took effect in January 1, 2014.
On March 29, 2012, the BSP issued Circular No. 753 mandating the unification of the statutory/legal and liquidity reserves requirements on Peso deposits and Peso deposit substitutes. As such, effective the week of April 6, 2012, non-foreign currency deposit, unit deposit liabilities, including Peso demand, savings and time deposits, negotiable orders of withdrawal of accounts, and deposit substitutes, are subject to required reserves equivalent of 18%. Likewise, a universal bank is required to set up reserves of 15% against Peso-denominated “Trust and Other Fiduciary Accounts (TOFA) — Others.” On June 27, 2014, the BSP issued Circular No. 839 which set prudential real estate stress test limits of Common Equity Tier 1 (CET1) capital ratio of 6% and risk-based capital adequacy ratio (CAR of 10% for universal/commercial banks (U/KBs), thrift banks (TBs) on a solo and consolidated basis on their aggregate real estate exposures (REEs). The stress test will be undertaken on a U/KB’s or TB’s REEs and other real estate property under an assumed write-off rate of 25%. On October 29, 2014, the BSP issued Circular No. 856 requiring Domestic Systematically Important Banks (DSIBs) to submit data requirements for identification of DSIBs, starting with 2014 data. DSIBs will also be required to comply with the additional higher loss absorbency, phased-in from January 1, 2017, with full implementation by January 1, 2019. This circular took effect on December 31, 2014. On June 9, 2015, the BSP issued Circular No. 881, requiring banks to maintain a minimum leverage ratio (Tier 1 capital / Exposure Measure) of 5.0% on both solo and consolidated bases. Starting December 31, 2014 and every quarter thereafter until December 31, 2016, concerned banks shall submit the Basel III Leverage Ratio reporting template, including required disclosure template, on both solo and consolidated bases for monitoring purposes. Final guidelines shall be issued in view of the changes to the framework as well as migration from monitoring of the leverage ratio to a Pillar 1 requirement starting January 1, 2017.
In October 2015, BSP Circular No. 888, Amendments to Regulations on Dividend Declaration and Interest Payments on Tier 1 Capital Instruments, was issued, which amends the section on recording of dividends. The liability for dividends declared shall be taken up in the bank’s books upon its declaration. Prior to the release of BSP Circular No. 888, the liability for recording dividends declared is taken up in the books upon receipt of BSP approval thereof or if no such approval is received, after thirty (30) banking/business days from the date the required report on dividend declaration was received by the appropriate department of the Supervision and Examination Sector, whichever comes earlier. On March 10, 2016, the BSP issued Circular Nos. 904 and 905.

12
BSP Circular No. 904 requires DSIBs to submit their first recovery plan on June 30, 2016 and for the recovery plan to form an integral part of the ICAAP to be submitted every 31 March of each year.
BSP issued Circular No. 905 requires banks to maintain a minimum Liquidity Coverage Ratio (LCR) on a daily basis with required BSP reporting of quarterly on a consolidated basis and monthly on a solo basis. The LCR shall be implemented on a phased-in arrangement with prescribed minimum set initially at 90% in 2018 and shall rise to the minimum required level of 100% on January 1, 2019.
On May 27, 2016, the BSP issued Circular No. 912 which contains the guidelines on the adoption of the full provisions of PFRS 9 Financial Instruments effective January 1, 2018 and on the closure of early adoption window of the PFRS 9 Financial Instruments. On June 2, 2016, BSP announced thru Circular No. 913, the formal shift in its monetary operations to an interest rate corridor (IRC) system starting June 3, 2016. The IRC is a system for guiding short-term market rates towards the BSP policy interest rate which is the overnight reverse repurchase (RRP) rate. The IRC system consists of the following instruments: standing liquidity facilities, namely, the overnight lending facility (OLF) and the overnight deposit facility (ODF); the overnight RRP facility; and a term deposit auction facility (TDF). On January 20, 2017, BSP issued BSP Circular No. 941, Amendments to the Regulations on Past Due and Non-Performing Loans, which amends the regulatory definition of past due accounts, restructured loans non-performing loans and other related provisions, effective January 1, 2018. In general, this provides a 30-day cure period within which to allow the borrowers to catch up on their late payments without being considered as past due, subject to meeting certain criteria as provided in the memo. On December 19, 2017, Republic Act No. 10963, otherwise known as the “Tax Reform for Acceleration and Inclusion” (TRAIN) was signed into law. This is the first package of the Comprehensive Tax Reform Program (CTRP), which amends various provisions of the 1997 National Internal Revenue Code. Sections 51 to 70 of TRAIN law amends certain sections of NIRC covering documentary stamp tax (DST). Other than DST on debt instruments which increased by 50%, all other increases are 100%. The law will take effect starting January 1, 2018. On January 4, 2018, BSP issued the BSP Circular No. 989, also known as the “Guidelines on the Conduct of Stress Testing Exercises” was issued. This circular provides the overarching governance standards and risk management expectations on stress testing practices in the banking industry. The BSP is issuing the stress testing guidelines as part of its continuing initiatives to further strengthen risk governance and contribute to the sustained safety and soundness of the industry. Stress testing allows banks to prepare for events with severe financial impact. In particular, based on the results of stress testing, banks may adopt proactive measures such as the implementation of capital build up initiatives or enhancement of risk management practices all aimed at improving their resilience in times of actual crisis. On January 22, 2018, BSP issued the BSP Circular No. 990, Amendments to the Basel III Leverage Ratio Framework. Banks/QBs concerned shall submit the Basel lll Leverage Ratio reporting template, including required disclosure templates, on both solo and consolidated bases for

13
monitoring purposes. During the monitoring period, public disclosure of information relative to leverage ratio shall not be required. The monitoring of the leverage ratio shall be implemented as a pillar 1 minimum requirement effective on 01 July 2018. Upon migration to a Pillar 1 requirement, the Basel lll Leverage Ratio report shall be submitted quarterly along with the Basel lll CAR report on both solo and consolidated bases.
In 2018, the BSP announced two reserve requirement reductions which mandated the 100-basis-point reduction in the reserve requirement ratios of all banks and non-bank financial institutions with quasi-banking functions, through:
BSP Circular No. 997 on February 15, 2018, with reserve requirement currently at twenty (20) percent, effective March 02, 2018; and
BSP Circular No. 1004 on May 24, 2018, with reserve requirement currently at twenty (19) percent, effective June 1, 2018.
This operational adjustment aims to support the BSP’s shift toward a more market-based implementation of monetary policy as well as its broad financial market reform agenda. The reduction will apply to the reservable liabilities of all banks and non-bank financial institutions with quasi-banking functions. On June 6, 2018, BSP issued BSP Circular No. 1007, Implementing Guidelines on the adoption of the Basel III Framework on Liquidity Standards - Net Stable Funding Ratio (NSFR). Bank/QB shall maintain a stable funding profile, at least 100% at all times, in relation to the composition of its assets and off-balance sheet activities in order to promote long-term resilience against liquidity risk. The NSFR framework shall apply to all universal and commercial banks (UBs/KBs) and their subsidiary banks and QBs on both solo and consolidated bases. Banks/QBs shall undergo an observation period from July 1 to December 31, 2018 and shall take effect on 01 January 2019. On August 14, 2018, BSP issued Circular No. 1011, Guidelines on the Adoption of the PFRS 9 – Financial Instruments. It is the thrust of the BSP to align its financial reporting requirements with standards and practices that are widely accepted internationally to promote fairness, transparency, and accountability in the financial industry. In this light, the Monetary Board in its Resolution No. 1226 dated 26 July 2018, approved guidelines governing the adoption of PFRS 9. To ensure consistency of application and comparability of financial reports, BSP Supervised Financial Institutions (BSFIs) shall adopt the ff.: (a) accounting treatment of government grants, preparation of (b) prudential reports and (c) audited financial statements, (d) guidelines on the adoption of PFRS 9 financial instruments, (e) enforcement actions, and (f) transitory provisions. On August 23, 2018, SEC released SEC memorandum circular MC No.12-2018, Guidelines on the issuance of Green Bonds under the ASEAN Green Bonds standards in the Philippines, whereas Green Bonds are specific purpose bonds where proceeds will be exclusively applied to finance or refinance, in part or in full, new and/or existing eligible Green Projects, and that comply with the ASEAN Green Bond Standards. Effectivity date take effect fifteen (15) days after its publication in a newspaper of general circulation.
On December 6, 2018, the BSP also released Circular No. 1024 on the Philippine Adoption of the Basel III Countercyclical Buffer. The countercyclical buffer (“CCyB”) extends the size of the capital conservation buffer by a percentage set annually by the regulators. It aims to achieve a broader

14
macroprudential goal of protecting the banking sector from the build-up of systemic vulnerabilities. At the moment, CCyB for Philippine banks is set to 0%.
Research and Development Activities BPI spent the following for the last three years:
In Million Pesos % of Revenues
2016 428.7 0.6
2017 595.3 0.8
2018 802.1 1.0
Employees Below is a breakdown of the manpower complement of BPI in 2018 as well as the approved headcount for 2019.
December 31, 2018 Actual December 31, 2019 Plan
Officers Staff Total Officers Staff Total
Unibank 6,541 11,749 18,290 7,096 12,599 19,695
Consumer 4,176 10,228 14,404 4,592 11,077 15,669
Corporate 840 792 1,632 930 792 1,722
Investment 418 248 666 418 248 666
Support 1,107 481 1,588 1,156 482 1,638
Insurance Companies 120 501 621 120 501 621
TOTAL 6,661 12,250 18,911 7,216 13,100 20,316
Majority or 90% of the staff are members of various unions and are subject to Collective Bargaining Agreements (CBAs). The current CBA of the parent company was concluded and signed last May 31, 2016 for Provincial Union and September 16, 2016 for Metro Manila Union, which covers the period of April 1, 2016 to March 31, 2019. Currently there are ongoing negotiations for the parent company. The period covered is April 1, 2019 until March 31, 2021 CBA for BFSB was concluded and signed last December 13, 2018. The BFSB CBA covers the period November 1, 2018 to October 31, 2020.
Risk Management
The Bank espouses a comprehensive risk management and capital management framework, which integrates the management of all its financial and non-financial risk exposures. The framework conforms not only to the Bank’s own rigorous standards, but also the Bangko Sentral ng Pilipinas directives in promoting an effective ICAAP and other risk management processes; and ensures that the Bank has adequate liquidity and capital levels to mitigate risks, as well as robust business continuity and crisis resiliency standards in place. The framework focuses on three (3) key components of: Sound risk management governance;

15
Effective risk processes, information systems, and controls; and
Timely and reliable risk data.
BPI’s Board of Directors fulfills its risk management function through the Risk Management Committee (RMC). At the management level, the Risk Management Office (RMO) is headed by the Chief Risk Officer (CRO). The CRO is responsible in leading the formulation of risk management policies, methodologies, and metrics in alignment with the overall business strategy of the Bank, ensuring that risks are prudently and rationally undertaken and within the Bank’s risk appetite, as well as commensurate and disciplined to maximize returns on capital. The CRO and the RMO facilitate risk management learning programs and promote best practices on an enterprise-wide basis.
The Bank’s risk exposures are identified, measured, and monitored, and controlled according to three (3) major classifications: Credit Risk, the largest single risk for most local banks, arises from the Bank’s core lending
and investing businesses, and involves the thorough credit evaluation, appropriate approval, management and continuous monitoring of exposure risks, such as borrower (or counterparty) risk, facility risk, concentrations and industry risk relating to each loan account. In BPI, the entire credit risk management process is governed by stringent underwriting policies and rating parameters, and lending procedures and standards which are regularly reviewed and updated given regulatory requirements and market developments. The Bank’s loan portfolio is continuously monitored and reviewed as to overall asset quality, concentration and utilization of limits. The Bank continuously experiences growth in loan volumes but is able to manage overall low credit risk and maintain asset quality (as evidenced by generally low NPLs and adequate reserves cover), and did so in general compliance with regulatory and prudential requirements relating to credit risk management (e.g. RPT and DOSRI restrictions, single borrower’s limits, and credit concentration, internal and regulatory stress tests, among others).
Market and Liquidity Risks arise from the Bank’s business in managing interest rate and
liquidity gaps, as well as in the trading and distribution of fixed income, foreign exchange, and derivative instruments (as allowed by regulation). Price risk and liquidity risk are managed using a set of established policies and metrics guided by the Bank's market risk management framework set by the Board/RMC. Price risk is the risk that the Bank's earnings will decline immediately (or over time) because of volatility in interest rates, FX rates, or equity prices. The Bank employs various methodologies such as value-at-risk (VaR), loss limits, balance sheet value-at-risk, and earnings at-risk, supplemented by regular stress tests. Liquidity exposures on funding mainly come from the mismatches of asset, liability, and exchange contract maturities. The Bank manages liquidity risk by setting a minimum cumulative liquidity gap (MCLG – smallest net cumulative cash inflow or the largest net cumulative cash outflow), conducting internal and regulatory liquidity stress tests, and testing an established contingency funding plan. The Bank’s market and liquidity risk exposures are generally well within the RMC (Board-level) approved VaR, stop loss, and other risk limits at the BPI Parent and consolidated group levels.
Operational and IT Risks arise from the Bank’s people and processes, its information

16
technology, threats to the security of its facilities, personnel, or data, models, business interruption risk, reputational risk, and compliance obligations to regulatory or taxing authorities, amongst others. Operational and IT risk management in the Bank involves the formulation of policies, setting and monitoring of key risk indicators, overseeing the thoroughness of bank-wide risk and control self-assessments and loss incident management; and in the process, creating and maintaining a sound business operating environment that ensures and protects the integrity of the Bank’s assets, transactions, reputation, records and data of the Bank and its customers, the enforceability of the Bank’s claims, and compliance with all pertinent legal and regulatory parameters. The Bank’s actual operational losses are generally less than 1% of the Bank’s annual gross income, which is well within the Bank’s appetite for operational and IT risks.
BPI also has a Board-approved IT risk governance structure that espouses the three lines of defense. Identification, assessment, monitoring and addressing IT Risks is the primary responsibility of the business and operating units, including the Bank's Information Systems Group, through tools such as Risk Assessments, Key Risk Indicator (KRI) monitoring, Loss Event Data (LED) collection and analysis. There is an IT Risk Committee and IT Steering Committee that meets regularly, where IT risk issues are discussed at management level. The second line of defense is performed by the Risk Management Office, under which the Operational and Information Technology Risk Management unit develops and deploys the tools (such as Risk Assessments, KRIs, LED) used to identify, assess and monitor IT risks, and provides the RMC with reports on the Bank's IT risk profile. The Bank also has an Enterprise Information Security Management team which develops strategies and provides oversight in mitigating risks to the confidentiality, integrity, and availability of the Bank’s information assets and information systems. The Bank also has in place business continuity and disaster recovery plans to ensure the recovery and availability of all critical organizational assets and customer-servicing infrastructure. Incident Management processes are in place to properly manage incidents. A Crisis Resiliency Committee and process is in place to prevent incidents from escalating to catastrophic proportions. Robust BCP sites are situated in strategic locations for critical head office services to meet the increasing demand on business continuity preparedness of the bank’s operations. The Board-level RMC is regularly apprised of IT risks through comprehensive reporting and discussions during monthly meetings. To further strengthen information security awareness, the Board is continually briefed on current cybercrime landscapes, emerging risks and industry trends, as well as mitigating measures implemented by the Bank.
Risk management is carried out by a dedicated team of skilled risk managers and senior officers who have extensive prior operational experience working within the Bank. The Bank’s risk managers regularly monitor key risk indicators and report exposures against carefully-established credit, market, liquidity and operational and IT risk metrics and limits approved by the RMC. Finally, independent reviews are regularly conducted by the Bank’s Internal Audit group, regulatory examiners, and external auditors to ensure that risk controls and mitigants are in place and functioning effectively as intended.

17
Compliance
Business or compliance risk, which can be defined as “the risk of regulatory or legal sanctions, material financial loss, or loss to reputation a bank may suffer as a result of its failure to comply with laws, regulations, rules, related self-regulatory organization standards, and codes of conduct applicable to its banking activities”, is addressed and managed within the Bank through its compliance function and its component system and program. As the Bank’s second line of defense, the compliance function has also evolved in recent years to adapt to the shift towards more technology-heavy strategies, as it seeks to deliver the compliance risk management outcomes required in an era of digital transformation. While remaining a key advisory function, it has embraced a more forward-thinking, risk-based and stress-tested approach to continuously monitor, evaluate and improve its ability to ensure compliance in a banking landscape that is subject to disruption and rapid change. The Bank’s compliance system is critically important in identifying, evaluating, and addressing the regulatory and reputational risks while the enterprise-wide compliance program helps the Bank to look at and across business lines and activities of the organization as a whole and to consider how activities in one area of the Bank may affect the business or compliance risks of other business lines and the entire group/enterprise. The compliance program also helps the Board and management in understanding where such regulatory and reputational risks in the organization are concentrated, provide comparisons of the level and changing nature of risks, and identify those control processes that most need enhancement. Oversight of the management of the Bank’s business risk and implementation of its compliance function is the responsibility of our Board of Directors, through the Audit Committee and the Corporate Governance Committee with respect to corporate governance compliance. At the management level, the compliance function is carried out by the Compliance Office, headed by the Chief Compliance Officer, who is not a member of the Board of Directors. The Compliance Office oversees the implementation of the Bank's enterprise-wide compliance programs. These programs take into account the size and complexity of the Bank, the relevant rules and regulations that affect its operations, and the business risks that may arise due to non-compliance. By using regulatory and self-assessment compliance matrices, compliance measures are formulated to mitigate identified business risks and tested to ensure effectiveness. The Compliance Office is currently organized to cover Regulatory Compliance, Corporate Governance, Anti-Money Laundering Compliance and FATCA Compliance and the Data Privacy Office. Considering the rapid developments in the regulatory sphere as well as the growing complexity of bank products, services and transactions, the Compliance Office evolves in its coverage of compliance practice areas to anticipate and meet forward challenges. Enhancement of our compliance function’s scope and domain is redefined for new and emerging sources of compliance risk. The Compliance Office is also empowered by the accountability to it of 21 Group Compliance Officers, or GCOs, who are embedded in operational units throughout the Bank. The GCOs are charged with enforcing compliance office initiatives, as well as providing timely reports to the compliance office. Overall enforcement is through self-regulation within the business units, and independent testing and reviews conducted by the Compliance Office and Internal Audit. Results of these reviews are

18
elevated to the Board’s Audit Committee and Corporate Governance Committee, with respect to governance issues. The Compliance Office promotes adherence and awareness to laws, rules and regulations by electronically posting information and documents in a compliance database that is accessible to all employees. Regular meetings are conducted by the Compliance Office with the GCOs to discuss the impact of new regulations, decide on the required compliance measures and amend compliance matrices as necessary. Through continued liaison and dialogue with regulators, the Compliance Office ensures the prompt dissemination of new regulations and other developments affecting bank operations.
Financial Consumer Protection In 2015, the Bank established its Customer Experience Management Office (CXMO) as part of the BPI Financial Consumer Protection Program required under BSP Circular No. 857.
In compliance with the circular, BPI’s CXMO created the Customer Assistance Program (CAP) to build an enabling environment and to define safety nets for recognition and protection of consumer rights. The CAP promotes a culture of fair dealing and embeds responsible business practices in the Bank’s operations, in accordance with the BSP’s consumer protection regulations and standards of conduct. The CAP also equips Bank employees with the required education and training, and institutionalizes appropriate communication avenues as well as mechanisms for consumers to be able to provide feedback, ask questions, obtain information and clarifications, file complaints, or seek redress effectively and efficiently.
The CXMO is led by the Head of Customer Care and reports, functionally, to the Board through the Executive Committee and, administratively, to the Chief Operations Officer, who also heads the Bank’s Enterprise Services Group. The CXMO reports to the senior management and the Board every month.
The Bank complies with product and service information and labeling regulations and voluntary codes for consumer protection such as the Banking Code for Consumer Protection of the Bank Marketing Association of the Philippines (BMAP) and its Council of Advisors and product governance such Markets in Financial Instruments Directives II (MiFID II). BPI has also taken corrective and remedial action in case of any deficiencies or areas for improvement. In 2018, there were no confirmed incidents of non-compliance.
2016 2017 2018
Complaints (in Thousands) 306.0 437.5 424.4
Transactions (in Millions) 1,341.4 1,442.1 1,540.7
Data Privacy
Republic Act No. 10173, known as the Data Privacy Act of 2012, requires government and private sector entities to apply the principles of Transparency, Legitimate Purpose and Proportionality in their processing of personal data so that the data is only used in relevant and specifically stated ways, is not stored for longer than necessary, is kept safe and secure, is used only within the confines

19
of the law and is stored following people’s data protection rights. Cybersecurity and data privacy and protection have, today, become corporate governance and risk management concerns.
BPI has established a comprehensive Data Privacy Program utilizing a combination of policies, organizational structure, access controls and technologies designed for risk reduction. The Bank has a Data Privacy Office, headed by a Board-appointed Data Privacy Officer (DPO), a lead senior management officer. The key focus of the DPO is to oversee data privacy compliance and manage data protection risks for the organization consistent with the Data Privacy Act rules and regulations, issuances by the National Privacy Commission and other applicable laws. Management has also appointed Compliance Officers for Privacy (COP) for major business units of the Bank.
Item 2. Properties In view of the planned re-development of the BPI Head Office building located at 6768 Ayala Avenue, Makati City, BPI’s executive office and select business and support units have temporarily relocated to the Ayala North Exchange Tower 1, Ayala Avenue corner Salcedo St., Legaspi Village, Makati City. The rest of the business and support units have also temporarily relocated to BPI Buendia Center and various other sites in Makati, San Juan, Quezon City, and Muntinlupa. Of the Bank’s 856 local branches, 694 operate as BPI branches: 358 in Metro Manila/Greater Metro Manila Area and 336 in the provincial area. The parent bank owns 31% of these branches and leases the remaining 69%. Total annual lease expenses amounted to P992 million in 2018. Expiration dates of the lease contracts vary from branch to branch. BFSB’s Head Office is located at BFB Center, Paseo De Roxas, corner Dela Rosa St., Makati City. It operates 162 branches of which 19% are bank owned while 81% are leased. Total annual lease amounted to P187 million.
These office and branches are maintained in good condition for the benefit of both the employees and the transacting public. The Bank enforces standards for branch facade, layout, number and types of equipment and upkeep of the premises. The Bank also continuously reconfigures the mix of its traditional branches, and kiosk branches as it adjusts to the needs of its customers. To date, the Bank has not identified any property to acquire. All of the bank-owned properties are free from any lien. Total lease expense for 2018 for BPI and its subsidiaries amounted to P1,809 million as per Note 20 of the 2018 Audited Financial Statements. In 2018, monthly lease payments vary from one property to another, ranging from a low of P7.7 thousand to a high of P1.9 million, the average of which was P163 thousand.
Item 3. Legal Proceedings The Bank does not have any material pending legal proceedings to which the registrant or any of its subsidiaries or affiliates is a party or of which any of their property is the subject.

20
Item 4. Submission of Matters to a Vote of Security Holders None PART II - OPERATIONAL AND FINANCIAL INFORMATION
Item 5. Market for Issuer’s Common Equity and Related Stockholders Matters Market Information The common shares of BPI have been listed on the Philippine Stock Exchange (PSE) since 1966 under the ticker symbol BPI. The table below shows the high and low prices of BPI shares transacted at the PSE for each quarter within the last two (2) fiscal years.
Period In Pesos
High Low
Year Ended December 31, 2017 1
st Quarter 102.40 88.50
2nd
Quarter 107.00 103.50 3
rd Quarter 107.40 99.45
4th
Quarter 108.10 95.60
Year Ended December 31, 2018 1
st Quarter 120.98 106.10
2nd
Quarter 111.84 86.00 3
rd Quarter 101.00 79.50
4th
Quarter 94.95 79.50
The high and low prices of BPI at the Philippine Stock Exchange on March 29, 2019 were P84.80 and P84.20, respectively, with a closing price of P84.20. In May 2018, the Bank raised P50 billion from its stock rights offering (SRO). The SRO involved the issuance of 558,659,210 new common shares (a ratio of 1:7.0594 common shares held or 14.2% of BPI shares outstanding), with an offer price of P89.50 per share, to shareholders as of record date.
Holders of Common Equity There were approximately 12,588 common shareholders of BPI as of December 31, 2018. Please refer to Exhibit C for the top twenty (20) shareholders with their corresponding shares and percentage ownership of BPI. Please see Exhibit D for a Statistical Report by Sharelots as of December 31, 2018.

21
Dividends As approved by the Company’s Board of Directors, the Bank’s dividend policy is to declare cash dividends to its common stockholders on a regular basis as may be determined by the Board of Directors. As its dividend payout history shows, the Bank has consistently paid at least P1.80 per share in annual dividends; however, the Bank evaluates its dividend payments from time to time in accordance with business and regulatory requirements, and cannot make explicit warranties about the quantum of future dividend payments.
Cash dividends declared and paid during the years ending December 31, 2017 & 2018 are as follows:
Date Declared Date of Payment
Amount of Dividends
Per Share Total
(in Million Pesos)
December 14, 2016 January 20, 2017 0.90 3,543
June 15, 2017 July 27, 2017 0.90 3,545
December 15, 2017 January 19, 2018 0.90 3,546
June 20, 2018 July 25, 2018 0.90 4,052
December 19, 2018 January 29, 2019 0.90 4,052
There are no known restrictions or impediments to the company’s ability to pay dividends on common equity, whether current or future. Dividend declaration is ultimately the responsibility of the Bank and the BPI Board of Directors which has the authority to declare dividends as it may deem appropriate. Banks that meet the prequalification criteria including capital adequacy requirements and applicable laws and regulations of the BSP can declare and pay dividends without prior BSP verification. Details of the dividend declaration, BSP approval and manner of payment are reflected in Note 18 of the 2018 Audited Financial Statements. Recent Sales of Unregistered or Exempt Securities Details on shares issued to/subscribed by the Company’s executives as a result of the Executive Stock Option Plan (ESOP) and the Executive Stock Purchase Plan (ESPP) are reflected in Note 18 of the 2018 Audited Financial Statements.
Item 6. Management Discussion and Analysis of Financial Condition and Results of Operations (Last Three Years: 2016, 2017, and 2018)
The highlights of the balance sheet and income statement of BPI for each year and the compounded growth rate over the three-year period (2016 - 2018) are shown below:
In Million Pesos 2015 2016 2017 2018 CAGR
Assets 1,516,356 1,725,696 1,903,905 2,085,228 11.2%
Deposits 1,275,699 1,431,300 1,562,200 1,585,746 7.5%

22
Loans (Net) 872,861 1,040,720 1,202,338 1,354,896 15.8%
Capital 150,284 165,134 180,688 248,521 18.3%
The compounded annual growth rate (CAGR) of the Bank’s asset levels from 2016 to 2018 was 11.2%, driven by the 7.5% increase in deposits. Loans likewise increased over the same period by 7.5%. Capital growth of 18.3% owing to the impact of the May 2018 P50 billion SRO.
2016 Total resources reached P1.73 trillion, P209.3 billion, or 13.8% higher than last year’s P1.52 trillion. Total deposits increased P155.6 billion, or 12.2% to P1.4 trillion due to increases in savings, time and demand deposits by P112.4 billion, or 15.9%, P26.3 billion, or 7.4%, and P16.9 billion or 7.9%, respectively. Bills payable grew P41.0 billion, or 195.9% on higher external borrowings. Accrued taxes, interest and other expenses rose by P1.2 billlion or 20.5% on higher accrual of year end taxes and operating expenses. Due to Bangko Sentral ng Pilipinas and other banks increased by P239 million or 55.5% due to higher obligations to BSP and external borrowings. Deferred credits and other liabilities declined by P2.5 billion, or 7.3% due to lower domestic bills purchased and foreign acceptances outstanding. Manager’s checks and demand draft outstanding decreased P729 million, or 8.8% due to lower balance of manager’s checks issued. Capital funds amounted to P165.1 billion, P14.9 billion, or 9.9% higher than last year’s P150.3 billion. Surplus increased P14.8 billion, or 17.7% from this year’s profits net of cash dividends paid. Reserves also increased P148 million, or 5.8% due to additional reserves set up for the trust business this year. Accumulated other comprehensive loss, however, increased P314 million, or 6.6% on account of the higher actuarial losses on the Bank’s defined benefit plan. On the asset side, loans and advances increased P167.9 billion, or 19.2% driven by higher loan demand from corporate and consumer loans. Due from Bangko Sentral ng Pilipinas grew P24.6 billion, or 11.4% on higher special deposit account and reserves with BSP. Held-to-maturity securities rose P23.7 billion or 9.7% due to additional investments. Trading securities expanded by P6.5 billion, or 80.6%, due to increase in holding of securities intended for trading. Interbank loans receivable and securities purchased under agreements to resell increased P2.3 billion, or 18.1% due to increase in RRP volume and interbank term loans with foreign banks and financial institutions. Other resources, net also increased P1.4 billion, or 13.2% on account of higher miscellaneous assets. Deferred income tax assets, net grew P1.1 billion, or 17.3% on account of the impairment losses setup for the year. Bank premises, furniture, fixtures and equipment, net likewise increased by P983 million, or 7.7% due to higher depreciation on building and equipment. Investments in subsidiaries and associates, net went up P365 million, or 5.7% on account of the increase in the Bank’s share in the net income from BPI - Philam and Global Payments Asia Pacific - Phils. Inc. On the other hand, available for sale securities, net declined P18.0 billion, or 42.5% due to decrease in position taking in foreign holdings. Derivative financial assets declined P1.5 billion, or 33.9% on account of the lower positive fair value of certain derivative positions. Assets held for sale, net and Investment properties, net both declined by P718 million, or 16.4%, and P64 million, or 8.7%, following the continued sell down of foreclosed properties.

23
2017 Total resources ended at P1.90 trillion, P178.2 billion, or 10.3% higher than last year’s P1.73 trillion. Total deposits expanded by P130.9 billion, or 9.1% to P1.56 trillion due to balances growth in time, savings and demand deposits of P69.8 billion, or 18.4%, P40.4 billion, or 4.9%, and P20.7 billion or 8.9%, respectively. Bills payable grew P21.5 billion, or 34.8% on higher external borrowings. Deferred credits and other liabilities increased by P7.8 billion, or 24.3% due to higher foreign acceptances outstanding and miscellaneous liabilities. Derivative financial liabilities grew P1.7 billion or 53.9%, due to higher market valuation of certain derivative products. Due to Bangko Sentral ng Pilipinas and other banks increased by P548 million or 81.8% due to higher obligations to BSP and external borrowings. On the other hand, Manager’s checks and demand draft outstanding decreased P557 million, or 7.3% due to lower balance of manager’s checks issued. Capital funds expanded by P15.6 billion, or 9.4% to P180.7 billion, from year-end 2016. Surplus contributed to the capital growth by P17.8 billion, or 18.1%, as a result of accumulated profits net of cash dividend payments. Reserves were down by P2.5 billion, or 90.6%, as a result of the incorporation of the Bank’s trust business. The required reserves for the trust business is now being carried by BPI AMTC. On the asset side, loans and advances increased P161.6 billion, or 15.5% driven by higher loan demand from corporate loans. Due from Bangko Sentral ng Pilipinas likewise increased P16.4 billion, or 6.9% on higher volume of placement in BSP deposits and reserves. Other resources, net grew P3.5 billion, or 28.2% on account of higher miscellaneous assets. Interbank loans receivable and securities purchased under agreements to resell went up P3.4 billion, or 22.0% due to increase in RRP volume and interbank term loans with foreign banks and financial institutions. Derivative financial assets expanded by P2.0 billion, or 66.4%, due to higher positive fair value on certain derivative positions. Bank premises, furniture, fixtures and equipment, net increased by P1.2 billion, or 9.0% due to building renovations and leasehold improvements. Assets attributable to insurance operations increased by P1.1 billion, or 6.6%, due to the Bank’s non-life insurance subsidiary’s higher securities investments and insurance receivables. Deferred income tax assets, net grew P548 million, or 7.3% due to higher allowance for probable loss. On the other hand, Trading securities declined by P9.3 billion, or 63.5%, due to decrease in holding of securities intended for trading. Due from Other Banks, likewise declined by P8.6 billion, or 37.5%, on lower working balances and placements maintained with correspondent banks. Investment properties, net decreased by P534 million, or 79.8%, due to reclassification of an investment property to bank premises as the Bank decided to use the property for its operations. Investments in subsidiaries and associates, net went down P432 million, or 6.3% on account of the decrease in the Bank’s share in the net income from BPI - Philam. 2018
Total resources reached P2.09 trillion, P181.3 billion, or 9.5% higher than last year’s P1.90 trillion. Total deposits grew P23.5 billion, or 1.5% to P1.59 trillion, on the back of savings and demand deposit growth of P23.0 billion, or 2.7%, and P4.0 billion or 1.6%, respectively. Other borrowed funds increased by P83.4 billion, or 99.8% largely due to the 2018 dollar and peso bond issuances. Deferred credits and other liabilities increased by P3.1 billion, or 7.9% due to higher accounts payable obligations. Due to Bangko Sentral ng Pilipinas and other banks increased by P2.8 billion or 227.5% due to higher

24
obligations to BSP. Accrued taxes, interest and other expenses rose by P1.9 billion or 27.3% on higher accrual of year end taxes and interest payable. Derivative Financial Liabilities declined by P0.9 billion, or 18.7% due to lower market valuation of certain derivative products. Capital funds amounted to P248.5 billion, P67.8 billion, or 37.5% higher than last year’s P180.7 billion. Share capital and share premium contributed to the capital growth by P5.6 billion, or 14.3% and P44.4 billion, or 149.2%, respectively, due to the May 2018 Stock Rights Offer. Surplus also increased P11.0 billion, or 9.5% due to higher accumulated profits net of cash dividends for the period. Reserves likewise increased by P3.8 billion, or 1,150.0% representing appropriation of general loan loss provisions in excess of PFRS9 loan loss provisions under BSP Circ. 1011. Accumulated other comprehensive loss also decreased by P2.9 billion, or 57.2% due to transition to PFRS 9. On the asset side, loans and advances increased P152.6 billion, or 12.7% driven by higher loan demand from corporate and credit card loans. Interbank loans receivable and securities purchased under agreements to resell amounted to P34.3 billion, an increase of P15.7 billion, or 84.7% on account of higher volume of RRP placements and interbank term loans. Financial assets at fair value through OCI likewise increased P13.9 billion, or 59.6% on higher deployment activities post-EMTN, peso bond issuance and liquidity assets build up towards year-end. Cash and Other Cash items grew P8.4 billion, or 23.9% on account of higher cash requirement for the period as compared to year-end 2017. Trading securities increased by P7.4 billion, or 138.0%, due to market view of declining rates. Other resources, net amounted to P22.1 billion, P6.3 billion, or 40.2% on account of higher miscellaneous assets. Bank premises, furniture, fixtures and equipment, net increased by P1.2 billion, or 7.9% due to land and building premises, renovations and leasehold improvements. Deferred income tax assets, net grew P444 million, or 5.5% on account of the impairment losses setup for the period.
On the other hand, Assets held for sale decreased by P215 million, or 6.0%, due to higher sell down of foreclosed properties. Investments in subsidiaries and associates, net declined P727 million, or 11.4% on account of the decrease in the Bank’s share in the net income from BPI-Philam. Derivative financial assets decreased by P0.9 billion, or 19.0%, due to lower fair value on certain derivative positions. Due from Other Banks, declined by P1.9 billion, or 13.4%, on lower working balances and placements maintained with foreign correspondent banks. Due from Bangko Sentral ng Pilipinas (BSP) likewise decreased by P30.0 billion, or 11.7% due to cut in reserve requirements.
Asset Quality. The Bank’s loan portfolio mix is broken down into large corporates at 76%, SMEs at 6%, and consumer at 18% as compared to last year’s 74%, 7%, and 19%, respectively.
In January 2018, the Bank adopted the expected credit loss (ECL) models required under the Philippine Financial Reporting Standards (PFRS 9) as the basis for the provisioning for loan losses. Reporting under this new standard, allowance for Impairment of P22.9 billion was up by P2.2 billion from last year’s P20.7 billion and also higher than 2016’s P18.7 billion.
The Bank also adopted BSP Circular No. 941 which amended regulations on past due and nonperforming loans (NPL). Under this new reporting classification, the Bank ended the year with an NPL ratio of 1.85%. Prior years December 2017 and December 2016 followed BSP circular 772 (30-day net NPL ratio, net of fully reserved accounts) and ended at the same ratio of 0.5%. The Bank’s NPL ratio was slightly below industry average of 1.81% as of December 2018.

25
BPI shall prudently manage its lending activity and will always be mindful of the credit risks, potential or otherwise, that may be posed by the shifting environment. It will regularly assess its portfolio quality and ensure adequate collateral and reserve coverage. It will continue to resolve outstanding delinquent loans through collection or restructuring, where appropriate.
Liquidity. Despite tightness in system liquidity in 2018, BPI still derived 90% of its funding from deposits. Compared to the 95% in 2017, the 5% shift in mix is attributable to the increase in other borrowings, namely, the Bank’s issuance of USD600 million in senior unsecured bonds in August 2018, and the issuance of P25 billion in peso fixed rate bonds in December 2018.
Its loan to deposit ratio was 85% in 2018, up from 77% in 2017.
Results of Operations
In Million Pesos 2015 2016 2017 2018 CAGR
Net Interest Income 38,641 42,377 48,039 55,843 13.1%
Non-Interest Income 20,718 24,174 22,981 22,681 3.1%
Impairment Losses 3,976 4,800 3,795 4,923 7.4%
Operating Expenses 31,870 34,941 38,533 43,602 11.0%
Net Income 18,234 22,050 22,416 23,078 8.2%
The Bank’s net income from 2016 to 2018 increased by a CAGR of 8.2% as net interest income and non-interest income increased by 13.1% and 3.1%, respectively. However, these improvements in revenues were partly reduced by the higher impairment losses and operating expenses whose 3-year CAGRs were up 7.4% and 11.0%, respectively.
2016 vs. 2015. For the year 2016, the Bank earned a net income of P22.1 billion, representing a P3.8 billion, or 20.9% increase relative to P18.2 billion earned in 2015. This increase was driven by the P7.2 billion growth in revenues and decline in income taxes by P603 million. This strong performance was partly tempered by the increase in operating expenses and impairment losses by P3.1 billion, or 9.6%, and P824 million, or 20.7%, respectively. Revenue growth came from increases in both net interest income (up by P3.7 billion) and non-interest income (up by P3.5 billion). Net interest income of P42.4 billion increased 9.7% from last year’s P38.6 billion on the back of P179.1 billion average asset base expansion.
Interest income increased P6.0 billion, or 11.5%, to P58.3 billion from previous year’s P52.3 billion. Interest income on loans and advances increased by P6.7 billion, or 15.9%, due to the P142.3 billion increase in average loan volume, partly tempered by the 14 basis points drop in loan yield. On the other hand, interest income on available-for-sale securities declined by P288 million, or 38.0%, due to decline in both volume and yield. Interest income on trading securities also decreased P61 million, or 25.3%, on account of lower yields despite higher average volume. GRT increased P257 million, or 14.9%, as a result of the overall increase in interest income.

26
Interest expense of P15.9 billion increased P2.3 billion, or 16.7%, from last year’s P13.7 billion. Interest expense on deposits increased P2.0 billion or 14.8% as both the average deposit base and cost grew by P162.8 billion and 3 bps, respectively. Interest expense on bills payable and other borrowings also increased P302 million, or 91.0%, due to higher volume.
Other income increased P3.5 billion, or 16.7%, to P24.2 billion from prior year’s P20.7 billion. Growth was driven by a surge in trading gain on securities, which increased by P4.1 billion or 311.9% as 2016 includes a gain from the sale of certain held-to-maturity securities reclassified to available-for-sale securities. Fees and commissions increased P468 million, or 6.2%, on higher service charges and underwriting fees. Income from foreign exchange trading increased by P406 million, or 26.3%, from gains on proprietary positions. Income attributable to insurance operations increased P251 million or 22.6% on higher investment income earned and lower actuarial reserves of the Bank’s insurance subsidiaries. Other operating income ended at P9.0 billion, P1.7 billion, or 15.9% lower than last year, owing largely to the decline in profit from assets sold. Other expenses at P34.9 billion, increased P3.1 billion, or 9.6% from last year’s P31.9 billion. Other operating expenses increased P1.1 billion, or 10.9%, on increased regulatory costs, product-related insurance premiums, third party fees and commissions, litigation expenses, and transaction related costs. Compensation and fringe benefits grew by P1.0 billion, or 8.0% due to higher salaries on account of manpower expansion and CBA-related costs booked in 2016. Occupancy and equipment-related expenses increased P962 million, or 10.5% on account of increased depreciation and technology-related costs. Impairment losses stood at P4.8 billion, P824 million, or 20.7% higher than the previous year due to increased loan loss provisioning. Provision for income tax declined P603 million, or 11.7% to P4.5 billion. Current taxes decreased P317 million, or 5.5%, in spite of the increase in taxable income due to the tax-free portion of the securities’ sales. Deferred taxes decreased P286 million, or 47.8% on account of provisioning and accounts with timing difference. Income attributable to non-controlling interest increased P84 million, or 59.6%, on higher income of BPI Century Tokyo Leasing and on BanKo’s lower loss this year compared to last year. Comprehensive Income Total comprehensive income was at P21.7 billion, P5.0 billion, or 30.2% higher than last year’s P16.7 billion on the back of increases on Net income before minority interest at P3.9 billion, or 21.2% and other comprehensive income at P1.3 billion or 78.1%. Net change in fair value reserve on available-for-sale securities increased P1.1 billion or 203.2% on account of higher market valuation of the Bank’s investment securities. Share in other comprehensive income of associates increased P377 million, or 83.6% due to the upward market valuation of the investments of the bancassurance affiliate. Fair value reserve on investments of insurance subsidiaries, also increased P203 million, or 60.8%, as a result of higher market valuation of the insurance subsidiaries’ investment funds.

27
Actuarial losses on defined benefit plan, net of tax effect increased P197 million, or 51.6% as impacted by the change in financial assumption. Currency translation differences declined by P190 million, or 246.8% due to the general strengthening of the Philippine peso against the British pound. Comprehensive income attributable to non-controlling interest increased P119 million, or 180.3% due to higher market valuation of the insurance subsidiaries’ investments. 2017 vs. 2016. Net income for full year 2017 ended at of P22.4 billion, P366 million, or 1.7% higher than same period last year of P22.1 billion. Total revenues grew by P4.5 billion, but was partly tempered by increases recorded in other expenses and provision for income tax which were up by P3.6 billion, and P1.4 billion, respectively. Net interest income at P48.0 billion, increased 13.4% from last year’s P42.4 billion on the back of P178.5 billion average asset base expansion.
Interest income increased P7.5 billion, or 12.9%, to P65.8 billion from previous year’s P58.3 billion. Interest income on loans and advances were up by P7.7 billion, or 15.8%, due to the P147.7 billion increase in average loan volume, partly tempered by the 3 basis points drop in loan yield. Interest income on trading securities also increased P21 million, or 11.7%, on account of higher volume and yield. On the other hand, interest income on available-for-sale securities declined by P111 million, or 23.7%, largely on account of lower volume. GRT increased P219 million, or 11.0%, as a result of higher interest income.
Interest expense was up by P1.9 billion to P17.8 billion, from last year’s P15.9 billion. This increase was primarily driven by interest expense on deposits, which grew by P1.4 billion, or 8.9% on account of the average asset base expansion partly tempered by lower deposit cost. Interest expense on bills payable and other borrowings also increased P516 million, or 81.4%, driven by higher volume and cost.
Other income at P23.0 billion, was lower by P1.2 billion, or 4.9%, from P24.2 billion last year. Other operating income increased by P2.4 billion, or 27.0% mainly due to higher credit card income and profit from assets sold. Income from foreign exchange trading increased by P396 million, or 20.3%, from gains on proprietary positions and retail sales. The drop in other income was accounted for by the P4.4 billion, or 81.4%, decline in trading gain (loss) on securities as the Bank booked a one-off gain derived from the sale of the reclassified portion of certain held-to-maturity securities to AFS in 2016. Other expenses at P38.5 billion, increased P3.6 billion, or 10.3% from last year’s P34.9 billion. Other operating expenses increased P2.0 billion, or 17.4%, on product-related insurance premiums, third party fees and commissions, litigation expenses, and transaction related costs. Occupancy and equipment-related expenses grew by P1.2 billion, or 11.7% owing to increase in rent expense, depreciation and amortization costs, and significant spending on technology. Impairment losses stood at P3.8 billion, P1.0 billion, or 20.9% lower than the previous year, as loan provisioning was slowed down.

28
Provision for income tax at P6.0 billion, up P1.4 billion, or 31.3% from P4.5 billion. Current taxes rose by P1.0 billion, or 18.4%, due to higher proportions of Bank pre-tax earnings that are exposed to ordinary corporate income tax. Deferred taxes decreased P422 million, or 47.7% on account of the impairment losses set up for the year, and accounts with timing difference. Income attributable to non-controlling interest increased P95 million, or 42.2%, on account of higher income from the Bank’s non-life insurance subsidiary.
Comprehensive Income Total comprehensive income was at P22.4 billion, P670 million, or 3.1% higher than last year’s P21.7 billion on the back of increases on Net income before minority interest at P461 million, or 2.1% and other comprehensive income at P337 million or 95.2%. Net change in fair value reserve on available-for-sale securities increased P170 million or 31.3% on account of higher market valuation of the Bank’s investment securities. Fair value reserve on investments of insurance subsidiaries, also increased P327 million, or 249.6%, as a result of higher market valuation of the insurance subsidiaries’ investment funds. Currency translation differences likewise increased by P239 million, or 211.5% due to the general weakening of the Philippine peso. Share in other comprehensive loss of associates increased P178 million, or 240.5% due to the downward market valuation of the investments of the bancassurance affiliate. Actuarial losses on defined benefit plan, net of tax effect decreased P307 million, or 53.0% as impacted by the change in financial assumption. Comprehensive income attributable to non-controlling interest increased P128 million, or 69.2% due to higher market valuation of the insurance subsidiaries’ investments. 2018 vs. 2017. For the year 2018, the Bank earned a net income of P23.1 billion, representing a P661.3 million, or 3.0% increase relative to P22.4 billion earned in 2017. This increase was driven by the P7.5 billion growth in revenues, which was partly tempered by the increase in operating expenses and impairment losses by P5.1 billion, or 13.2%, and P1.1 billion, or 29.7%, respectively. Net interest income of P55.8 billion increased 16.2% from last year’s P48.0 billion on the back of P158.0 billion average asset base expansion.
Interest income increased P14.3 billion, or 21.8%, to P80.2 billion from previous year’s P65.8 billion. Interest income on loans and advances increased by P14.8 billion, or 27.1%, as both the loan average volume and yield rose by P173.9 billion, and 48 bps, respectively. Interest income on financial assets grew P430 million also due to the increase in average volume and yield of P11.6 billion and 34 bps, respectively. On the other hand, interest income on deposits with BSP and other banks declined by P876 million, or 42.8%, due to decline in both average volume and yield by P41.5 million, and 37 bps, respectively.
Interest expense of P24.3 billion increased P6.5 billion, or 36.7%, from last year’s P17.8 billion. Interest expense on deposits increased P4.9 billion or 29.3% as both the average deposit base and cost grew by P67.5 billion and 18 bps, respectively. Interest expense on bills payable and

29
other borrowings also increased P1.7 billion, or 144.4%, due to higher volume and cost attributable to the new bond issuances in 2018.
Other income at P22.7 billion, was lower by P300 million, or 1.3%, from P23.0 billion last year. The drop in other income was accounted for by the P264 million, or 22.1%, decline in trading gain on securities due to market volatility. Income attributable to insurance operations also decreased by the P190 million, or 13.5%, due to the life insurance subsidiary’s lower investment income arising from mark-to-market losses and the non-life business’ higher claims expenses. On the positive, fees and commissions increased by P572 million, or 6.9%, on increased service charges. Other expenses at P43.6 billion, increased P5.1 billion, or 13.2% from last year’s P38.5 billion. Other operating expenses increased P1.8 billion, or 13.9%, on product-related insurance premiums, rewards and other selling expenses, third party fees and commissions, and transaction related costs. Occupancy and equipment-related expenses grew by P1.8 billion, or 15.9% owing to increase in rental, depreciation and amortization costs, and significant spending on IT-related services. Compensation and fringe benefits also increased at P15.3 billion, up by P1.4 billion, or 10.2% on account of BanKo’s manpower expansion for its new offices.
Impairment losses stood at P4.9 billion, P1.1 billion, or 29.7% higher than the previous year, due to increased loan loss provisioning. Provision for income tax at P6.7 billion, up P714 million, or 12.0% increase from P6.0 billion last year. Current taxes rose by P986 million, or 15.4%, due to higher core intermediation fees subject to regular corporate income tax. Deferred taxes decreased P272 million, or 58.8% on account of the impairment losses set up for the year, and accounts with timing difference.
Income attributable to non-controlling interest decreased P68 million, or 21.4%, on account of lower income from the Bank’s non-life insurance and leasing subsidiaries.
Comprehensive Income Total comprehensive income was at P21.9 billion, P529 million, or 2.4% lower than last year’s P22.4 billion as other comprehensive income declined P1.3 billion, overshadowing the increase in net income before minority interest of P593 million. Net change in fair value reserve on FVOCI securities, net of tax effect decreased P1.5 billion or 210.8% on account of lower market valuation of the Bank’s investment securities. Currency translation differences likewise decreased by P152 million, or 120.3% due to the general weakening of the Philippine peso. Fair value reserve on investments of insurance subsidiaries, also decreased by P596 million, or 303.8%, as a result of lower market valuation of the insurance subsidiaries’ investment funds. Share in other comprehensive loss of associates decreased P1.0 billion, or 408.2% due to the downward market valuation of the investments of the bancassurance affiliate. These decreases were partly tempered by the P885 million, or 324.6% increase in actuarial gains (losses) on defined benefit plan, net of tax effect as impacted by the change in financial assumption; and the P1.1 billion, or 212.7% increase in share in other comprehensive gain (loss) of associates due to the remeasurement/fair valuation of BPI-Philam’s liabilities, property, and equipment.

30
Comprehensive income attributable to non-controlling interest decreased P150 million, or 48.0% due to lower market valuation of the insurance’s subsidiaries’ investments.
Key Performance Indicators
2016 2017 2018
Return on Equity (%) 13.8 12.7 10.2
Return on Assets (%) 1.4 1.3 1.2
Net Interest Margin (%) 2.8 2.9 3.1
Operating Efficiency Ratio (%) 52.5 54.3 55.5
Capital Adequacy Ratio (%)* 13.0 12.7 16.1
*Basel Ill Framework
The Bank’s key financial performance ratios for the last three years showed consistent profitability and adequate capitalization. The same ratios are also used to evaluate the performance of the bank’s subsidiaries.
Return on equity (ROE), the ratio of net income to average equity at 10.2% was lower, compared to last year’s 12.7% due to the faster growth in average equity at 28.6% versus growth in net income of 3.0%.
Return on assets (ROA), the ratio of net income to average assets, also improved to 1.2%, was slightly lower than 2017 at 1.3% due to faster growth in average assets at 9.0% as compared to growth in net income.
Net interest margin (NIM), the ratio of net interest income to average interest bearing assets, at 3.1%, improved by 21 basis points on the combined impact of the increase in yields and growth in average interest earning assets.
Operating efficiency (cost to income) ratio, the ratio of operating expenses to income, increased to 55.5% from last year’s 54.3% as increase in operating expenses outpaced revenue growth.
Capital adequacy ratio (CAR), computed using the standard risk weights assigned to the Bank’s assets compared with its qualifying capital, measures the capability of Bank’s capital funds to cover its various business risks. The Bank’s CAR under the Basel III framework was recorded at 16.1% versus 12.7% in the previous year, due to the increase in qualifying capital, on account of the May 2018 SRO. This year’s CAR and Common Equity Tier 1 (CET 1) ratios remained above the BSP requirements. The Bank’s capital is composed largely of CET 1 capital.

31
Material Event/s and Uncertainties: Other than the disclosure enumerated above, the Bank has nothing to report on the following:
a) Any known trends, demands, commitments, events or uncertainties that will have a material impact on its liquidity.
b) Events that will trigger direct or contingent financial obligation that is material to the company,
including any default or acceleration of an obligation.
c) Material off-balance sheet transactions, arrangements, obligations (including contingent obligations), and other relationships of the bank with unconsolidated entities or other persons created during the reporting period.
d) Any material commitments for capital expenditures.
e) Any known trends, events or uncertainties that have had or that are reasonably expected to
have a material favorable or unfavorable impact on net sales/revenues/income from continuing operations.
f) Any significant elements of income or loss that did not arise from the Bank’s continuing
operations.
g) Any seasonal aspects that had a material effect on the financial condition or results of operations
Future Prospects Near Term Prospects
The Philippine economy may expand by at least 6.5% in 2019 on the back of a sustained surge in capital goods spending. Should oil prices stabilize in 2019, growth may even accelerate further as household spending is expected to recover from the 2018 slowdown and as overall spending activity picks up ahead of the May 2019 mid-term elections. On the production side, the construction industry may benefit from the government’s “Build, Build, Build” program, especially if the groundbreaking of big ticket projects (Subway, airport, etc.) finally kicks in this year. A manageable widening of the trade deficit is expected to translate to a modest depreciation of the Philippine Peso with additional pressure from global trade disputes and financial market volatility among major markets. Inflation is expected to return to the 2.0% to 4.0% target in 2019 as a result of moderating global oil prices. BSP is expected to keep its policy rate steady at 4.75% throughout 2019 and will likely prioritize a minimum 2 percentage point reduction of the ratio of required reserves on deposits (RRR) of commercial and universal banks.

32
Against the backdrop of a stabilizing scenario in 2019, the Bank is poised to take advantage of the recovery in household and overall spending. With inflation decelerating to within BSP targets, the Bank has been prudent and strategic in maximizing the window of favorable loan repricing. In 2017, there was an intentional slowdown in the Bank’s consumer lending business growth to focus on improving internal processes and developing internal systems. In particular, these improvements covered innovative auto and housing loan facilities, highly automated loan processing systems, and prudent risk management. With the new and improved processes in place, the Bank is now better equipped to expand its retail loans base, rising to meet the demand for primary homes and vehicles of the growing young middle class. In light of the mid-term election spending, the Bank’s newly created Business Banking segment is ready to service the unique financial needs of the Bank’s SME clients, particularly those suppliers of campaign and electoral materials. Moreover, the Bank’s Corporate segment continues to provide a full suite of banking products to large corporates and multinationals, not only to those involved in the government’s Build, Build, Build program.
To manage our exposure to market volatility and currency fluctuation while capturing opportunities, the Bank’s Treasury arm has various strategies. The foreign exchange desk has been steadily shifting from trading to proprietary flows while the Bank’s recent USD bond issuance also allows for a more diverse funding profile to match our clients’ foreign currency needs. The Bank’s Remittances desk has also introduced new services to complement the Overseas Filipinos’ natural activity in foreign exchange markets. In light of the current system liquidity tightness, one of the Bank’s top priorities is Current Account and Savings Account (CASA) growth. To improve CASA deposits, a dual-pronged approach will be employed: (1) capitalizing on the Bank’s extensive physical and digital distribution network, and (2) continuing to provide innovative deposit-based products to acquire new clients and attract deposits. Branch network expansion will be in key areas where the Bank previously has no presence, which show potential for increasing consumer spending and infrastructure investments. This expansion will be balanced and complemented by the outlays in the Bank’s digital infrastructure for more efficient digitalized banking processes that will spur financial inclusion in the country.
Medium to Long Term Prospects
Household consumption and investment spending may continue to drive economic growth in the coming years. The country has a young population that supports consumer demand, thereby preventing a situation similar to aging countries where growth is sluggish. Capital spending from the private sector is expected to remain substantial given the need to expand the productive capacity of corporates in order to meet rising consumer demand. However, a crucial element in the country’s long term development is the improvement in public infrastructure. Economic activity will be constrained if transport and logistics costs remain high. The government’s infrastructure initiatives will allow the economy to grow at a faster rate in the long run. To capitalize on the Philippines’ stable economic growth, the Bank’s medium term strategic imperatives focus on financial inclusion and digitalization.

33
The Bank’s microfinance arm, BanKo, was created to contribute to the nation’s prosperity by reaching out to a wider swath of the population, recognizing the need for the unbanked market to have access to credit. Primarily a platform to serve Self-Employed Micro-Entrepreneurs (SEMEs), the Bank has begun to provide these clients with affordable and appropriate financial products and services, and empowering them with financial advice and solutions that promote the growth and expansion of their enterprises. The Bank recognizes the importance of building strong digital capabilities both in digital distribution platforms to exponentially increase client access points, and also in the back office to increase productivity and automation, as well as reduce costs. Significant investments have been made in the following key areas: (1) developing an omni-channel experience, (2) providing a 360-degree view of the client, (3) implementing a workforce retraining program, (4) focusing on cybersecurity, and (5) building resiliency. Digitalization will be the Bank’s core focus over the next five years, with the aim of continuously enhancing overall customer experience, and maintain a cost advantage over other banks in the Philippines.
Item 7. Financial Statements Please refer to Exhibit A for the 2018 Audited Financial Statements as audited by the principal accountant, the Accounting Firm of Isla Lipana & Co., and signed by the Partner Mr. Zaldy D. Aguirre, which also include the required Schedules under Annex 68-E. Audit and Audit-Related Fees BPI has paid the following fees, inclusive of taxes, to its external auditors in the past two (2) years:
(In Million Pesos) Audit Fees Audit-related Fees
2016 paid in 2017 P 13.145 P 4.703
2017 paid in 2018 P 13.185 P 2.348
Approved for 2018 (not yet paid)
P 19.415 -
The audit and audit-related fees cover services by the external auditor that are reasonably related to the performance of the audit or review of the Bank’s annual financial statements, including for the Bank’s subsidiaries. There were no non-audit fees for other services not related to the audit of the annual financial statements. The year-on-year increase in audit fees was due to the cost of validation work of by our external auditor relative to the Bank’s adoption of PFRS 9. This validation was necessary to ensure that the Bank’s models and assumptions are in compliance with the accounting standard and regulatory requirements.
The Audit Committee charter, as also stated in the Bank’s Manual on Corporate Governance, provides that the Audit Committee is empowered by the Board to approve all audit and non-audit services, including its fees, to be provided by the external auditor to the Bank and its subsidiaries, and to review the external audit fees and recommend it for approval by the Board.

34
Item 8. Changes in and Disagreements with Accountants on Accounting and Financial Disclosure There are no disagreements with Isla Lipana & Co. on accounting and financial disclosures.
PART III – CONTROL AND COMPENSATION INFORMATION
Item 9. Directors and Executive Officers of the Issuer A-1. The Board of Directors and Executive Officers (as of December 31, 2018) Following is the list of current directors serving the term 2018 – 2019:
1. JAIME AUGUSTO ZÓBEL DE AYALA, Filipino, 60 years old, has been a member of the Board of Directors of BPI since March 1990 and Chairman since March 2004. He also served as Vice-Chairman from 1995 to March 2004. Mr. Zóbel is currently Chairman of the Bank’s Executive Committee and member of the Nomination Committee. Mr. Zobel served as Vice-Chairman from 1995 to March 2004. Mr. Zobel serves in Board of the following Philippine Stock Exchange (PSE) – listed companies, namely: Chairman and Chief Executive Officer of Ayala Corporation, Chairman of Globe Telecom, Inc. and Integrated Micro-Electronics, Inc., and Vice-Chairman of Ayala Land, Inc. and Manila Water Company, Inc. He is also the Chairman of AC Education, Ayala Retirement Fund Holdings, Inc., AC Industrial Technology Holdings, Inc., AC Ventures Holdings Corp., AC Infrastructure Holdings Corporation and Asiacom Philippines, Inc.; Co-Chairman of Ayala Foundation, Inc. and Ayala Group Club, Inc.; Director of Alabang Commercial Corporation, Ayala International Pte. Ltd., AC Energy, Inc., Ayala Healthcare Holdings, Inc., Light Rail Manila Holdings, Inc. and AG Holdings Limited.
Outside the Ayala group, he is a member of various international and local business and sociocivic organizations, including the JP Morgan International Council, JP Morgan Asia Pacific Council, Mitsubishi Corporation International Advisory Council, and Council on Foreign Relations. He sits on the board of the Singapore Management University, the Global Advisory Board of University of Tokyo, and on various advisory boards of Harvard University, including the Global Advisory Council, HBS Board of Dean’s Advisors, and HBS Asia-Pacific Advisory Board, which he chairs. He is Chairman Emeritus of the Asia Business Council, Co-Vice Chairman of the Makati Business Club, Chairman of Endeavor Philippines, and a board member of Eisenhower Fellowships. He was awarded the Presidential Medal of Merit in 2009, the Philippine Legion of Honor with rank of Grand Commander in 2010, and the Order of Mabini with rank of Commander in 2015 by the President of the Philippines in recognition of his outstanding public service. In 2017, he was recognized as a United Nations Sustainable Development Goals Pioneer by the UN Global Compact for his work in sustainable business strategy and operations. The first recipient of the award from the Philippines, he was one of 10 individuals recognized for championing sustainability and the pursuit of the 17 SDGs in business. Mr. Zobel graduated with B.A. in Economics (Cum Laude) from Harvard College in 1981 and obtained an MBA from the Harvard Graduate School of Business in 1987.

35
Other Philippine Stock Exchange-Listed Companies: Ayala Corporation – Chairman and Chief Executive Officer Globe Telecom, Inc. – Chairman of the Board Integrated Micro-Electronics, Inc. – Chairman of the Board Ayala Land, Inc. – Vice-Chairman of the Board Manila Water Company, Inc. – Vice-Chairman of the Board
2. FERNANDO ZOBEL DE AYALA, Filipino, 59 years old, has been a member of the Board of Directors
(Non-Executive Director) of BPI since October 1994 and was elected Vice Chairman in April 2013. He also serves as Chairman of the Bank’s Personnel and Compensation Committee, Vice-Chairman of the Executive Committee, and member of the Nomination Committee. He is also a member of the Board of BPI Asset Management and Trust Corporation and Chairman of the Board of Trustees of BPI Foundation, Inc.
Mr. Zobel is the President and Chief Operating Officer of Ayala Corporation; Chairman of Ayala Land, Inc. and Manila Water Company, Inc.; Director of Globe Telecom, Inc. and Integrated Micro-Electronics, Inc.; and an Independent Director of Pilipinas Shell Petroleum Corp, all PSE-listed companies. He is Chairman of AC International Finance Ltd. and AC Energy Holdings, Inc.; Co-Chairman of Ayala Foundation, Inc.; Director of LiveIt Investments, Ltd., Ayala International Holdings Limited, and Honda Cars Philippines, Inc.
Mr. Zobel is a member of the Board of Georgetown University and INSEAD. He is a member of the World Presidents' Organization and the Chief Executives Organization. He is a Board member of the Habitat for Humanity International and chairs the steering committee of its Asia Pacific Capital Campaign. He also serves on the board of the Asia Society and is a member of the Asia Philanthropy Circle, a board member of the Philippine National Museum and Pilipinas Shell Foundation.
He holds a liberal arts degree from Harvard College and a CIM from INSEAD, France. Other Philippine Stock Exchange-Listed Companies: Ayala Corporation – Director and President and Chief Operating Officer Globe Telecom, Inc. – Co-Vice Chairman of the Board Integrated Micro-Electronics, Inc. – Director Ayala Land, Inc. – Chairman of the Board Manila Water Company, Inc. – Chairman of the Board Pilipinas Shell Petroleum Corp. – Independent Director
3. CEZAR P. CONSING, Filipino, 59 years old, has been since 2013, President and Chief Executive Officer of Bank of the Philippine Islands (BPI), and a Senior Managing Director of Ayala Corporation, BPI’s controlling shareholder. He has served on BPI’s board of directors for 17 years (1995 - 2000, 2004 - 2007, 2010 - present), including 5 years representing J.P. Morgan & Co., then BPI’s second largest shareholder, and 3 years as an independent director. Mr. Consing serves as chairman of BPI’s thrift bank, investment bank, UK bank, property and casualty insurance, leasing, and rental subsidiaries, and vice chairman of its foundation; and is also a board director of BPI’s life insurance, asset management and micro finance subsidiaries. Mr. Consing is a member of BPI’s executive committee, and is chairman of its credit and management committees.

36
Mr. Consing serves as Chairman of the publicly listed National Reinsurance Corporation, President and board director of Bancnet, Inc., and board director of LGU Guarantee Corporation, three industry consortium institutions where BPI is a minority shareholder. Outside his association with BPI, Mr. Consing serves on the boards of four private companies: The Rohatyn Group, Sqreem Technologies, FILGIFTS.com and Endeavor Philippines. He has also served as an independent board director of three public companies: Jollibee Foods Corporation (2010 - present), CIMB Group Holdings (2006 - 2013) and First Gen Corporation (2005 - 2013). He is also a board director of the US-Philippines Society and a trustee of the Manila Golf Club Foundation. Mr. Consing has been a member of the Trilateral Commission since 2014. Mr. Consing first worked for BPI, in corporate planning and corporate banking, from 1980-1985. He worked for J.P. Morgan & Co., based in Hong Kong and Singapore, from 1985-2004, rising to co-head or head the firm's investment banking business in Asia Pacific from 1997 - 2004, the last five years as President of J.P. Morgan Securities (Asia Pacific) Ltd. As a senior Managing Director of J.P. Morgan, Mr. Consing was a member of the firm's global investment banking management committee and its Asia Pacific management committee. Mr. Consing was a partner at The Rohatyn Group from 2004 - 2013, headed its Hong Kong office and its private investing business in Asia, and was a board director of its real estate, and energy and infrastructure private equity investing subsidiaries. Mr. Consing received an A.B. Economics degree (Accelerated Program), magna cum laude, from De La Salle University, Manila, in 1979. At university, he was a member of the student council, the student newspaper and the varsity track and field team. In recent years, he has served on the advisory committees of the university and its school of economics. Mr. Consing obtained an M.A. in Applied Economics from the University of Michigan, Ann Arbor, in 1980. Other Philippine Stock Exchange-Listed Companies: National Reinsurance Corporation of the Philippines – Chairman of the Board Jollibee Foods Corporation – Independent Director
4. GERARDO C. ABLAZA, JR., Filipino, 65 years old, was elected as Director (Non-Executive) of BPI in
April 2017. He is a member of the Bank’s Personnel & Compensation Committee and a Director of BPI Family Savings Bank, Inc. and BPI Capital Corporation. Mr. Ablaza is currently a Management Consultant at the Ayala Corporation and a member of the Board of Directors in a number of Ayala’s subsidiaries including PSE-listed Manila Water Company, Inc. (Non-Executive Director), AC Energy, AC Health, AC Infrastructures and Ayala Foundation. From 1998 to April 2009, he was President and CEO of Globe Telecom, Inc. During this period, he took the company from being the fourth-ranked mobile services provider to the second-largest full-service telecom operator with a subscriber base of 25 million in 2008. From 2010 to 2017, he was the President and CEO of Manila Water Company and was responsible for overseeing the financial and operational growth within Manila Water’s service areas in the Metro Manila East Zone and in its expansion areas. In 2004, Mr. Ablaza was recognized by CNBC as the Asia Business Leader of the Year, making him the first Filipino CEO to win the award. He was also awarded by Telecom Asia as the Best Asian Telecom CEO. In 2013, he was recognized for his consistent leadership and innovation across the

37
banking, investment, telecommunications and utility service industries through the Citi Distinguished Alumni Award for Leadership and Ingenuity. He was the first Filipino to be awarded with such an honor. In June 2015, he became a member of the International Advisory Panel of the Institute for Water Policy under the Lee Kuan Yew School of Public Policy in Singapore. In 2017, he became a member of the Board of Directors and Executive Committee of Advance Info Services, PLC based in Thailand. Mr. Ablaza graduated summa cum laude from the De La Salle University in 1974 with a degree in Liberal Arts, major in Mathematics (Honors Program). As one of the most accomplished graduates of his alma mater, he sits as a member of the Board of Trustees in various De La Salle schools in the country. Other Philippine Stock Exchange-Listed Companies: Manila Water Company, Inc. – Non-Executive Director
5. ROMEO L. BERNARDO*, Filipino, 64 years old, has served as a member of the Board of Directors of
BPI since February 1998. He became an Independent Director in August 2002 up to present. He is the Chairman of the Bank’s Nomination Committee and a member of the Personnel & Compensation, Related Party Transaction, and Risk Management Committees. He also serves as Independent Director of BPI Capital Corporation, BPI/MS Insurance Corporation, BPI-Philam Life Assurance Corporation and BPI Asset Management and Trust Corporation. Mr. Bernardo serves as an Independent Director of the following PSE-listed companies: Aboitiz Power Corporation, National Reinsurance Corporation of the Philippines, and RFM Corporation. He is also a Non-Executive Director of Globe Telecom, Inc. He is the Chairman of the Board of Directors (Independent) of Ayala Life Fixed-Income Fund; the Peso, Dollar, Euro, Growth, Money Market Bond Funds. He also serves as Vice Chairman of The Foundation for Economic Freedom and is a Board Director of Finex Foundation. He is likewise a public advocate of good corporate and national governance and frequently writes on the subject in his capacity as Vice-Chairman and Co-Founder of the Foundation for Economic Freedom and the Philippine Partner of GlobalSource Partners, Inc., a worldwide association of country-based experts providing insights on global emerging markets. Mr. Bernardo is a former undersecretary of the Department of Finance and founded his consultancy practice, Lazaro Bernardo Tiu & Associates in 1997. He has been advisor to various multilateral institutions such as the World Bank, International Finance Corporation, Asian Development Bank, and Japan International Cooperation Agency. He has also worked with government institutions and the National Economic Development Authority (NEDA) in policy matters involving pension reform, capital markets reform, and fiscal and debt management. Mr. Bernardo graduated with a B.S. Business Economics degree (magna cum laude), from the University of the Philippines in 1974. He obtained his M.A. Development Economics (Valedictorian) at Williams College, Williamstown, Massachusetts in 1977. Other Philippine Stock Exchange-Listed Companies: Aboitiz Power Corporation – Independent Director National Reinsurance Corporation of the Philippines – Independent Director RFM Corporation – Independent Director Globe Telecom, Inc. – Non-Executive Director

38
6. IGNACIO R. BUNYE*, Filipino, 74 years old, was elected as Independent Director of BPI in April 2016. He is the Chairman of the Bank’s Related Party Transaction Committee and a member of the Corporate Governance Committee. He serves as an Independent Director of BPI Asset Management and Trust Corporation and BPI Direct BanKo, Inc., A Savings Bank. Mr. Bunye was a member of the Monetary Board of the Bangko Sentral ng Pilipinas from 2008 to 2014. He previously held the positions of Presidential Political Adviser in 2008, Presidential Spokesperson in 2003, and Press Secretary in 2002. He also worked for the Bank’s Treasury and Corporate Finance departments from 1983 before he began his government service in the City of Muntinlupa (then a municipality) as officer-in-charge and mayor between 1986 and 1998. During his twelve-year stewardship in Muntinlupa, Mr. Bunye founded the Muntinlupa Polytechnic College (now Pamantasan ng Lungsod ng Muntinlupa) and laid the foundation for the establishment of the Ospital ng Muntinlupa. In a concurrent capacity, he also served as Chairman of the Metropolitan Manila Authority (now Metropolitan Manila Development Authority) between 1991 and 1992, and was a member of the House of Representatives representing Muntinlupa between 1998 and 2001. A former print and broadcast journalist, he now writes a regular weekly column for Manila Bulletin, Tempo, People’s Tonight, Sun Star, BusinessWeek Mindanao, Panay News and Filipino Reporter (in New York).
Mr. Bunye is a member of the Philippine Integrated Bar. He obtained his Bachelor of Arts degree and Bachelor of Laws degree from the Ateneo de Manila University in 1964 and 1969 respectively. He passed the Philippine Bar Examination in 1969. Significant awards and recognition received by Mr. Bunye include the Asian Institute of Management Honor and Prestige Award, the Bangko Sentral Service Excellence Medal, the Gran Oden de Isabela Catolica, and the Order of Lakandula.
7. OCTAVIO VICTOR R. ESPIRITU*, Filipino, 75 years old, Independent Director, has been a member of
the Board of Directors of BPI since April 2000. He is the Chairman of the Bank’s Risk Management Committee and a member of the Audit Committee. Mr. Espiritu is an Independent Director of International Container Terminal Services, Inc., a PSE-listed company, a member of the Board of Directors of Philippine Dealing System Holdings Corporation and Subsidiaries; Philippine Stratbase Consultancy, Inc., Pueblo de Oro Golf & Country Club, and The Country Club, Inc. Mr. Espiritu was the former President and Chief Executive Officer of Far East Bank & Trust Company, and also the President of the Bankers Association of the Philippines for three consecutive terms. He was the Chairman of the Board of Trustees of Ateneo de Manila University for 14 years. He graduated with an A.B. Economics degree from the Ateneo de Manila University in 1963 and obtained his M.A. Economics degree from Georgetown University, U.S.A in 1966. Other Philippine Stock Exchange-Listed Companies: International Container Terminal Services, Inc. – Independent Director

39
8. REBECCA G. FERNANDO, Filipino, 70 years old, served as Director of BPI from 1995 to 2007. She was again re-elected Director of BPI in 2009 up to the present. Ms. Fernando is a member of the following Committees in BPI: Executive Committee, Related Party Transaction Committee and Retirement/Pension Committee. She is also a member of the Board of Directors of BPI Capital Corporation, BPI Family Savings Bank, Inc., and BPI Asset Management and Trust Corporation. Ms. Fernando is the Financial Consultant and Member of the Finance Boards of The Roman Catholic Archbishop of Manila and of The Roman Catholic Archbishop of Antipolo. She graduated with a BSBA degree major in accounting from the University of the Philippines in 1970. She took further studies for an MBA at the University of the Philippines and attended an Executive Program on Transnational Business at the Pacific Asian Management Institute at the University of Hawaii. She is a Certified Public Accountant.
9. DELFIN C. GONZALEZ, JR., Filipino, 69 years old, was elected as a Non-Executive Director of BPI in April 2016. He is a member of the Bank’s Personnel & Compensation Committee and Retirement/ Pension Committee and the Board’s representative in the IT Steering Committee. Mr. Gonzalez was the Chief Finance Officer of Ayala Corporation from 2010 to 2015, and previously served in the same capacity at Globe Telecom Inc. from 2000 to 2010, and San Miguel Corporation from 1975 to 1999. Mr. Gonzalez is an independent financial consultant and the Chairman and President of D.C. Gonzalez Inc. He is also a member of the Board of Trustees of De La Salle Santiago Zobel School. He graduated with a Bachelor of Science degree in Chemical Engineering from De La Salle College in 1971, and obtained his Master’s degree in Business Administration from the Harvard Business School in 1975. Mr. Gonzalez is not a Director in any other publicly-listed company.
10. JOSE TEODORO K. LIMCAOCO, Filipino, 57 years old, was elected as Director of BPI in February 2019. Previously, he served as President of BPI Family Savings Bank from 2010-2015 and President of BPI Capital Corporation from 2007-2010. He was also Officer-in-Charge for Ayala Life Assurance, Inc. in 2009 and Director/Chairman of Ayala Plans, Inc. in 2010-2011. He is currently the Chief Finance Officer, Chief Risk Officer, Chief Sustainability Officer and Finance Group Head of Ayala Corporation, a PSE-listed company and Director of Globe Telecom, Inc., and Integrated Micro-Electronics, Inc. He is an Independent Director of SSI Group, Inc., Chairman of Darong Agricultural and Development Corporation and Zapfam Inc., President and CEO of AC Ventures Holdings, Inc., (formerly Water Capital Works, Inc.), AYC Finance Limited, Bestfull Holdings Limited, and Purefoods International Limited. He is the Vice Chairman of Lagdigan Land Corporation, President of Liontide Holdings, Inc. and of Philwater Holdings Company, Inc. He is a Director of Ayala Hotels, Inc., AC Energy, Inc., Ayala Healthcare Holdings, Inc., AC Infrastructure Holdings Corporation, Ayala Aviation Corporation. AC Education, Inc., Asiacom Philippines, Inc., AG Counselors Corporation, Michigan Holdings, Inc., AC Industrial Technology Holdings, Inc. (formerly Ayala Automotive Holdings Corporation), A.C.S.T. Business Holdings, Inc., LICA Management Inc. and Just For Kids, Inc. He is the Treasurer of Ayala Retirement Fund Holdings, Inc.

40
Mr. Limcaoco joined Ayala Corporation as a Managing Director in 1998. Prior to his appointment as CFO in April 2015, he held various responsibilities including Trustee and Treasurer of Ayala Foundation, Inc., President of myAyala.com, and CFO of Azalea Technology Investments, Inc. He served as the President of the Chamber of Thrift Banks from 2013-2015. He was named as the ING-Finex CFO of the Year in 2018. He has held prior positions with JP Morgan & Co. and with BZW Asia. He graduated from Stanford University with a BS Mathematical Sciences (Honors Program) in 1984 and from the Wharton School of the University of Pennsylvania with an MBA (Finance and Investment Management) in 1988. Other Philippine Stock Exchange-Listed Companies: Globe Telecom, Inc. – Non-Executive Director Integrated Micro-Electronics, Inc. – Non-Executive Director
11. XAVIER P. LOINAZ*, Filipino, 75 years old, Mr. Loinaz has been a member of the Board of Directors of the Bank since 1982 and has served as an Independent Director since March 2009. He held the position of President and Chief Executive Officer of the Bank for 22 years from 1982 to 2004. He is the Chairman of the Bank’s Audit Committee and a member of the Nomination Committee. He is also an Independent Director of BPI Family Savings Bank, Inc. and BPI/MS Insurance Corporation.
Mr. Loinaz is an Independent Director of Ayala Corporation, a PSE-listed company since April 2017. He is the Chairman and President of XPL Manitou Properties, Inc. and Vice-Chairman of XPL MTJL Properties Inc. He is a member of the Board of Directors/Trustees of DAOI Condominium Corporation and E. Zobel Foundation; Chairman of the Board of Alay Kapwa Kilusan Pangkalusugan. He was President of the Bankers Association of the Philippines for two terms from 1989 to 1991.
He graduated with an A.B. Economics degree from the Ateneo de Manila University in 1963, and obtained his MBA Finance at the Wharton School of Pennsylvania in 1965. Other Philippine Stock Exchange-Listed Companies: Ayala Corporation – Independent Director
12. AURELIO R. MONTINOLA III, Filipino, 67 years old, has been a member of the Board of Directors of
BPI since 2004. Mr. Montinola also served as President and Chief Executive Officer of BPI for eight years from 2005 to 2013, and BPI Family Savings Bank, Inc. for twelve years from 1992 to 2004. He is a member of the Bank’s Executive, Risk Management, Personnel & Compensation and Nomination Committees. Among the several BPI subsidiaries and affiliates, Mr. Montinola serves as member of the Board of Directors of the following: BPI Capital Corporation, BPI Direct BanKo, Inc., BPI Family Savings Bank, Inc., BPI/MS Insurance Corporation, and BPI-Philam Life Assurance Corporation. Mr. Montinola is the Chairman of Far Eastern University, Inc. and an Independent Director of Roxas and Company, Inc., both PSE-listed companies. Among others, he is also the Chairman of the Roosevelt Colleges, Inc., East Asia Computer Center Inc., Amon Trading Corporation, and the Kabang Kalikasan ng Pilipinas Foundation, Inc. He is also a member of the Board of Trustees of BPI Foundation Inc. and Philippine Business for Education Inc. where he sits as Vice-Chairman.

41
Significant awards received by Mr. Montinola include Management Man of the Year 2012 (Management Association of the Philippines), Asian Banker Leadership Award (twice), and Legion d’Honneur (Chevalier) from the French Government. He obtained his Bachelor of Science in Management Engineering degree at the Ateneo de Manila University in 1973 and his MBA from the Harvard Business School in 1977.
Other Philippine Stock-Exchange-Listed Companies: Far Eastern University, Incorporated – Chairman of the Board Roxas and Company, Inc. – Independent Director
13. MERCEDITA S. NOLLEDO, Filipino, 78 years old, has been a member of the Board of Directors of BPI since 1991. She is the Chairman of the Bank’s Retirement & Pension Committees and a member of the Bank’s Executive and Corporate Governance Committees. Ms. Nolledo is also a Director in the following BPI subsidiaries and affiliates: BPI Investment Management, Inc., where she sits as Chairman; BPI Family Savings Bank, Inc., BPI Capital Corporation and BPI Asset Management and Trust Corporation. Ms. Nolledo is a Non-Executive Director of Xurpas, Inc. and an Independent Director of D&L Industries, Inc., both PSE-listed companies. She serves as Director of the following companies: Ayala Land Commercial REIT, Inc., Michigan Holdings, Inc., and Anvaya Cove Beach and Nature Club, Inc. She is a member of the Board of Trustees of Ayala Foundation, Inc. and BPI Foundation, Inc. as well as Vice-President of Sonoma Properties, Inc. She was a member of the Board of Directors of Ayala Corporation from 2004 until September 2010. Ms. Nolledo graduated with the degree of Bachelor of Science in Business Administration major in Accounting (magna cum laude) from the University of the Philippines in 1960 and placed second at the Certified Public Accountant Licensure Board Examination administered in the same year. In 1965, she obtained her Bachelor of Laws degree (cum laude) also from the University of the Philippines where she also placed second at the Bar Examination held in the same year.
Other Philippine Stock Exchange-Listed Companies: Xurpas, Inc. – Non-Executive Director D&L Industries, Inc. – Independent Director
14. ANTONIO JOSE U. PERIQUET*, Filipino, 58 years old, has been an Independent Director of BPI since
April 2012. He is a member of the Bank’s Executive Committee and is the Chairman/Independent Director of BPI Asset Management and Trust Corporation. He serves as an Independent Director of BPI Capital Corporation and BPI Family Savings Bank, Inc. Mr. Periquet is an Independent Director of the following PSE-listed companies: ABS-CBN Corporation, ABS-CBN Holdings Corporation, Ayala Corporation, DMCI Holdings, Inc., Max’s Group of Companies, and Philippine Seven Corporation. He is also an Independent Director of Albizia ASEAN Tenggara Fund, Chairman of the Campden Hill Group, Inc. and Pacific Main Holdings.
He is a trustee of Lyceum University of the Philippines and a member of the Dean’s Global Advisory Council at the University of Virginia’s Darden School of Business.

42
Mr. Periquet graduated from the Ateneo de Manila University with an AB Economics degree in 1982. He also holds a Master of Science degree in Economics from Oxford University and an MBA from the University of Virginia. Other Philippine Stock Exchange-Listed Companies: ABS-CBN Corporation – Independent Director ABS-CBN Holdings Corporation – Independent Director Ayala Corporation – Independent Director DMCI Holdings, Inc. – Independent Director Max’s Group of Companies – Independent Director Philippine Seven Corporation – Independent Director
15. DOLORES B. YUVIENCO*, Filipino, 71 years old, was elected as Director of BPI on April 2014 and as
Independent Director in April 2016. She is a member of the Audit Committee and Chair of the Corporate Governance Committee of BPI. In April 2018, Ms. Yuvienco was elected as Independent Director of First Consolidated Bank (Thrift Bank), and was chosen to chair the Nomination and Governance Committee. Ms. Yuvienco worked for 41 years with the Bangko Sentral ng Pilipinas (formerly known as Central Bank of the Philippines) under various capacities until her compulsory retirement in March 2013. She held the post of Assistant Governor in the Supervision and Examination Sector when she retired. Her exposure at the BSP was largely in bank supervision where her responsibilities ranged from the crafting of policies/regulations on banking supervision to onsite examination and off-site monitoring of BSP-supervised entities. As a ranking official in the BSP, she had opportunities to meet and share ideas with her counterparts in other central banks in the region. Owing to her experience, she was tapped as a resource speaker in various training programs of the Southeast Asian Center for Banking in Kuala Lumpur. Ms. Yuvienco graduated from St. Theresa’s College, Quezon City in 1967, with a degree of Bachelor of Science in Commerce, major in Accounting. She took up post graduate studies at the University of the Philippines Diliman. She is a Certified Public Accountant and a Career Executive Service Professional.
*Independent Director as defined in Sec. 38 of the Securities Regulation Code and BSP Circular Nos. 296 and 749. Per Article V of the Amended By-Laws of the Bank, all nominations for election of Directors by the stockholders shall be submitted in writing to the Board of Directors through the Corporate Secretary, together with the written acceptance of the nominee, not later than the date prescribed by law, rules and regulations or at such earlier or later date as the Board of Directors may fix. No nominee shall qualify to be elected as Director unless this requirement is complied with. In accordance with this, the nominations are subsequently processed and evaluated by the Nomination Committee of the Bank in a meeting called for that purpose in compliance with SRC Rule 38.

43
The Executive Officers
1. CEZAR P. CONSING* President & Chief Executive Officer
[Please see above.]
*Member of the Board of Directors of BPI
2. MARIA THERESA MARCIAL JAVIER Executive Vice-President/CFO
Filipino, 48 years old, Ms. Marcial is the Chief Financial Officer and Head of Strategy Group of BPI. She is responsible for strategic and corporate planning, accounting and financial control, capital management, investor relations, corporate legal affairs, and management of bank assets. Ms. Marcial joined the bank in 1995 and has 24 years of banking experience with expertise in investment management and trust business, corporate banking, debt and equity capital markets, and strategic planning. She is a member of BPI’s Management Committee, Asset & Liability Committee, Credit Committee, and chairs the Capital Expenditure Committee. She previously served on the BPI Trust Committee and the board of BPI Investment Management, Inc. Prior to her banking career, Ms. Marcial worked for the National Economic and Development Authority and Agricultural Policy Credit Council. She previously served as President of Fund Managers Association of the Philippines, and the Trust Officers Association of the Philippines, Vice-Chairman of Capital Markets Development Committee of FINEX, and Alternate Governor of the Market Governance Board of Philippine Dealing and Exchange Corporation. Ms. Marcial is a Fellow of Foundation for Economic Freedom and is a Member of the National Advisory Council of World Wide Fund for Nature (WWF) Philippines. Ms. Marcial obtained her Master’s Degree in Economics in 1995 from the University of the Philippines Diliman and BS Economics (cum laude) from the University of the Philippines Los Baños in 1990. She completed the Advanced Management Program at Harvard Business School in 2010 and the CFA Institute Investment Management Workshop also at Harvard Business School in 2006.
3. RAMON L. JOCSON Executive Vice-President Filipino, 59 years old, Mr. Jocson is currently an EVP and the COO of BPI. He is concurrently the Head of BPI's Enterprise Services Segment (ESS), which serves as the enterprise backbone of the organization that includes Human Resources, Centralized Operations, Information Systems, Digital Channels, Business Transformation, Facilities Services, Corporate Affairs and Communications, and Customer Experience Management Office. He chairs the Bank’s IT Steering Committee and is a member of the Bank’s Management Committee. He is currently the Vice-Chairman of the CyberSecurity Committee of the Bankers Association of the Philippines.

44
Mr. Jocson began his career in Manila in 1982, joining IBM Philippines as a Systems Analyst, and subsequently taking on more responsibility as he assumed different positions, including Information Systems Manager, Systems Engineering Manager and Manager of Quality. In 1995, he was assigned in Singapore where he led IBM’s Applications/Systems Integration business in ASEAN and South Asia. In 1996, he was appointed as Managing Director for IBM Philippines. In 2000, he took on a new assignment as Vice President and GM of IBM Global Services, ASEAN and South Asia. He was then appointed as Vice President and GM of IBM Global Services for Industrial Sector for Asia Pacific in 2005. In 2007, he took on the role of Vice President and GM of Application Services for the Growth Market Unit, where he led IBM’s Applications Management and Application Integration Services in Asia Pacific, Central and Eastern Europe, Latin America and Middle East/Africa. He was then appointed as VP & GM of Integrated Technology Services for Asia Pacific in 2010. In 2013, he was appointed as VP & GM of IBM Global Services for Central and Eastern Europe based in Prague, Czech Republic. In this capacity, he was responsible for IBM’s services portfolio in Russia/CIS, Turkey, Poland & Baltics, Central Europe and South East Europe. From January 2015 he was in Singapore as IBM Asia Pacific VP & GM for Strategic Outsourcing, until he joined BPI in September 2015. He was also a member of IBM’s Growth & Transformation Team, which is composed of the top senior leaders in IBM which worked directly with the Chairman on key/strategic initiatives. He has served on several external boards, including the Economic Development Board of Singapore, Philamlife and iPeople.
Mr. Jocson obtained his B.S. Industrial Engineering degree from the University of the Philippines in 1982. He also has an MBA from the Ateneo Graduate School of Business.
4. ANTONIO V. PANER Executive Vice-President, Treasurer Filipino, 60 years old, Mr. Paner serves as Treasurer and head of the Bank’s Global Markets Segment. As such, he is responsible for managing the Bank’s interest rate and liquidity gaps, as well as its fixed income and currency market-making, trading, and distribution activities– in the Philippines and abroad. Mr. Paner is Chairman of the Bank’s Asset & Liability Committee and is a member of the Management Committee and Asset Management Investment Council. He also serves on the board of BPI Europe Plc. Mr. Paner joined BPI in 1985, upon acquisition of Family Savings Bank and performed various Treasury and Trust positions until 1989. Between 1989 and 1996, he worked at Citytrust, then the consumer banking arm of Citibank in the Philippines, which BPI acquired in 1996. At BPI, he has been responsible for various businesses of the bank, including Risk Taking, Portfolio Management, Money Management, Asset Management, Remittance and Private Banking. Mr. Paner served as President of the Money Market Association of the Philippines (MART) in 1998 and remains an active member up to present. He is currently the Vice Chairman of the Bankers Association of the Philippines’ (BAP) Open Market Committee. He is also a member of the Makati Business Club, Management Association of the Philippines, British Chamber of Commerce, and the Philippine British Business Council.

45
He obtained an A.B. Economics degree from Ateneo de Manila University in 1979 and completed various courses in Business and Finance, including Strategic Financial Management in 2006. In 2009, he completed the Advanced Management Program at Harvard Business School.
5. SIMON R. PATERNO
Executive Vice-President Filipino, 60 years old, Mr. Paterno serves as head of BPI’s Financial Products & Alternative Channels. As such, he is responsible for building and managing BPI’s service capabilities across all asset, liability, payments, and bancassurance platforms. He also serves on the Bank’s Management, Asset & Liability, Credit Committees, as well as on the Boards of AF Payments, Zalora Philippines, BPI Century Tokyo Lease and Finance Corporation, BPI Century Tokyo Rental Corporation, BPI/MS Insurance Corporation and BPI Direct Banko where he is the Chairman. Prior to joining BPI, Mr. Paterno represented CIMB in its search for a Philippine bank investment, having joined the group in late 2012 as CEO-designate of Bank of Commerce, which was targeted for acquisition by CIMB. Between 2004 and 2012, he was Managing Director and Country Manager of Credit Suisse, where he also founded and served as Chairman of Credit Suisse Securities Philippines, Inc., the firm’s securities broker/dealer subsidiary. Between 2002 and 2004, Mr. Paterno was President & CEO of Development Bank of the Philippines and concurrently Chairman of the LGU Guarantee Corp. and other DBP subsidiaries. Prior to DBP, Mr. Paterno was a Managing Director at J.P. Morgan, where he spent 18 years in various capacities, rising from Head of Philippine banking to Head for sovereign clients in all of Asia. During the Asian Financial Crisis, he led the project teams that advised the Indonesian Bank Restructuring Agency (IBRA) and its Malaysian counterpart, Danaharta. In his career, Mr. Paterno worked on some of the most significant sovereign financing transactions in the Philippines: restructuring of its foreign debt (1991), debut eurobond (1992), Brady exchanges (1994), Domestic Bond Exchanges (2006), and Debt Exchange Warrants (2008). Mr. Paterno received his MBA from Stanford University in 1984 and his AB Honors Program in Economics (cum laude) from the Ateneo de Manila University in 1980.
6. JUAN CARLOS L. SYQUIA Executive Vice-President
Filipino, 52 years old, is Head of the Corporate Client Segment of the Bank. He was the former President of BPI Capital Corporation and Co-Head for Investment Banking for the Bank. He has over 28 years of work experience in the financial services industry. Prior to joining BPI Capital Corporation in June 2016, Mr. Syquia was the Country Head of Corporate Clients for Standard Chartered Bank in the Philippines serving in that role from late 2011. In that role, he was principally responsible for wholesale banking coverage strategy of the bank in the Philippines.

46
Mr. Syquia spent 17 years with the ING Group where he started with the Baring Brothers & Co. group in 1994. Within the banking group of ING, he took on various roles in relationship management, corporate finance origination, and investment banking execution. His last role in ING Bank was as the Head of Corporate Finance at ING Bank Manila. In 2007, he moved to a regional role as Head of Strategy and Business Development at ING Asia Pacific Ltd., the regional hub of ING Group’s life insurance and asset management practice.
Mr. Syquia is a product of the Bank’s Officer Training Program which he completed in 1990 during his first stint at the Bank of the Philippine Islands. In 1991, he was assigned in Cebu where he was half of a two-man team that established the Corporate Banking Division desk in Cebu. He carries an MBA Degree (Honors) with a concentration in Finance and International Business from Fordham University, NY, as well as an AB degree in Management Economics from the Ateneo de Manila University.
List of Other Executive Officers as of December 31, 2018
NAME AGE POSITION OFFICE
Abola, Joaquin Ma. B. 52 Senior Vice President Financial Products and Alternative Channels
Alonso, Joseph Anthony M. 53 Senior Vice President Credit Group
Ang, Olga S. 57 Senior Vice President Retail Clients
Calleja, Michael D. 58 Senior Vice President Enterprise Services
Chuidian, Tomas S. 52 Senior Vice President Financial Products and Alternative Channels
Cruz, Luis Geminiano E. 49 Senior Vice President Corporate Clients
Cruz, Ma Luisa L. 59 Senior Vice President Credit Group
Cruz, Rosemarie B. 56 Senior Vice President Office of the Chairman and President
Dimayuga, Raul Marcelo D. 56 Senior Vice President Retail Clients
Garcia, Maria Paz A. 52 Senior Vice President Financial Products and Alternative Channels
Gasmen, Dino R. 52 Senior Vice President Global Markets
Gayares, Marita Socorro D. 57 Senior Vice President Strategy and Development
Gomez, Jesus Angelo O. 44 Senior Vice President Financial Products and Alternative Channels
Javier, Maria Cristina U.1 60 Senior Vice President Corporate Clients
Javier, Maria Theresa M. 2
48 Senior Vice President Strategy And Development
Jereza, Jose Raul E. IV 47 Senior Vice President Retail Clients
King, Angelie O. 57 Senior Vice President Retail Clients
Luchangco, Eric Roberto M. 48 Senior Vice President Financial Products and Alternative Channels
Maranan, Florendo G. 59 Senior Vice President Enterprise Services
Marquez, Pilar Bernadette C. 1
60 Senior Vice President Enterprise Services
Mercado, Eugenio P. 55 Senior Vice President Enterprise Services
Ocampo, Marie Josephine M. 56 Senior Vice President Financial Products and Alternative Channels
Parungao, Joseph Philip Anthony S. 54 Senior Vice President Financial Products and Alternative Channels
Pertierra, Rafael J. 58 Senior Vice President Enterprise Services
Remo, Maria Corazon S. 1
60 Senior Vice President Enterprise Services
Santamaria, Mary Catherine Elizabeth P. 51 Senior Vice President Retail Clients
Syquia, Juan Carlos L. 2
52 Senior Vice President Corporate Clients
Tagaza, Manuel C. 56 Senior Vice President Financial Products And Alternative Channels

47
Untalan, Barbara Ann C. 51 Senior Vice President Corporate Clients
Veloso, Roland Gerard Jr. R. 55 Senior Vice President Business Bank 1
retired and on extension contract 2
promoted to Executive Vice President effective January 1, 2019
A-2. Significant Employees
The Bank values its human resources and considers its entire workforce as significant employees. It expects each employee to do his share in achieving the company’s set goals and objectives.
A-3. Family Relationships
The Chairman of the Board of Directors, Mr. Jaime Augusto Zobel de Ayala, and Mr. Fernando Zobel de Ayala, the Vice-Chairman of the Board, are brothers.
A-4. Legal Proceedings
To the knowledge of the Bank, none of its nominees for election as Directors and its Executive Officers have been subject of the following legal proceedings during the last five (5) years:
i. any bankruptcy petition filed by or against any business of which such director or officer was a general partner or executive officer either at the time of the bankruptcy or within two years prior to that time;
ii. any conviction by final judgment, in a criminal proceeding, domestic or foreign, or being subject to a pending criminal proceeding, domestic or foreign;
iii. any order, judgment, or decree, not subsequently reversed, suspended or vacated, of any court of competent jurisdiction, domestic or foreign, permanently or temporarily enjoining, barring, suspending or otherwise limiting his involvement in any type of business, securities, commodities or banking activities; and
iv. being found by domestic or foreign court of competent jurisdiction (in a civil action), the Commission or comparable foreign body, or a domestic or foreign Exchange or other organized trading, market or self-regulatory organization, to have violated a securities or commodities law or regulation and the judgment has not been reversed, suspended, or vacated.
A-5 Resignation of Directors
To date, no director has resigned from, or declined to stand for election or re-election to the Board since the date of the 2018 annual meeting of stockholders due to any disagreement with the Bank relative to its operations, policies and practices.
Item 10. Executive Compensation
Names arranged By Rank/ By Surname
Position
2017
Salary Bonuses Fees and Other Compensation
Cezar P. Consing President & CEO
Joseph Albert L. Gotuaco EVP
Dennis Gabriel M. Montecillo EVP

48
Antonio V. Paner EVP & Treasurer
Simon R. Paterno EVP
All above-named Officers as a group 143,596,043 82,213,000
All other unnamed Officers as a group 7,205,109,275 917,237,221
All Directors 70,320,000*
Names arranged By Rank/ By Surname
Position
2018
Salary Bonuses Fees and Other Compensation
Cezar P. Consing President & CEO
Ramon L. Jocson EVP
Antonio V. Paner EVP & Treasurer
Simon R. Paterno EVP
Juan Carlos L. Syquia SVP
All above-named Officers as a group 185,719,878 85,327,500
All other unnamed Officers as a group 7,622,471,109 970,492,665
All Directors 71,810,000*
Names arranged By Rank/ By Surname
Position
2019 Estimate
Salary Bonuses Fees and Other Compensation
Cezar P. Consing President & CEO
Ramon L. Jocson EVP
Antonio V. Paner EVP & Treasurer
Simon R. Paterno EVP
Juan Carlos L. Syquia EVP
All above-named Officers as a group 234,935,841 99,360,250
All other unnamed Officers as a group 7,997,102,429 1,197,368,809
All Directors 74,830,000*
*Includes P25.5 million, P27 million, P30 million for the years 2017, 2018 and 2019 respectively representing per-diem of
Directors for Board & Committee meetings attended.
Compensation of Directors
Article V of the Bank’s Amended By-Laws provides:
"Each director shall be entitled to receive from the Bank, pursuant to a resolution of the Board of Directors, fees and other compensation for his services as director. The Board of Directors shall have the sole authority to determine the amount, form and structure of the fees and other compensation of the directors. In no case shall the total yearly compensation of directors exceed one percent (1%) of the net income before income tax of the Bank during the preceding year.
The Personnel and Compensation Committee of the Bank shall have the responsibility for recommending to the Board of Directors the fees and other compensation for directors. In

49
discharging this duty, the Committee shall be guided by the objective of ensuring that compensation should fairly pay directors for work required in a company of the Bank's size and scope."
For 2018, the Board of Directors’ fees and other compensation amounted to P71.81 million, which was equivalent to less than 1% of the Bank’s net income before tax.
Standard Arrangement
Other than the usual per diem arrangement for Board and Board Committee meetings and the abovementioned fees and compensation of Directors, there is no Standard Arrangement with regards to compensation of directors, directly or indirectly for any other services provided by the said directors, for the last completed fiscal year.
Item 11. Security Ownership of Certain Beneficial Owners and Management
1. Security Ownership of Certain Record and Beneficial Owners of more than 5% as of December 31, 2018
Title of Class
Name/Address of Record Owner & Relationship w/
Issuer
Name of Beneficial Owner & Relationship
w/ Record Owner Citizenship No. of Shares
Percent of Holdings
Common
PCD Nominee Corp. (Non-Filipino) PCD Nominee Corp. (Filipino) 37/F Tower 1, The Enterprise Center 6766 ayala Avenue corner Paseo de Roxas, Makati City PCD Participants that own more than 5% of the voting securities Deutsche Bank Manila- Clients A/C 26/F Ayala Tower One & Exchange Plaza, Ayala Triangle, Ayala Avenue Makati City, Phils. 1226. The Hongkong and Shanghai
Various Stockholders/Clients Various Stockholders/Clients
Various Stockholders/ Clients hold 11.0134% or 495,875,029 shares Various/Stockholders/ Clients holds 9.7657%
Various
Filipino
Various
Various
1,037,239,747
628,049,101
1,665,288,848
23.0372%
13.9491% 36.9863%

50
Banking Corporation Limited HSBC Securities Services 12/F The Enterprise Center Tower I, 6766 Ayala Avenue cor. Paseo de Roxas, Makati City 1226
or 439,697,395 shares
Common Ayala Corporation 33
rd Floor Ayala Tower One
and Exchange Plaza, Ayala Triangle, Ayala Avenue Makati City Stockholder
Ayala Corporation Filipino 1,000,261,934 22.2160%
Common
Liontide Holdings, Inc. 33
rd Floor Ayala Tower One
and Exchange Plaza, Ayala Triangle, Ayala Avenue Makati City Stockholder
Liontide Holdings, Inc.
Filipino 904,194,682 20.0823%
Common AC International Finance Limited* c/o Ayala Corporation 34
th Floor, Tower I,
Ayala Triangle, Ayala Avenue Makati City Stockholder
Ayala Corporation Cayman Islands
390,269,162 8.6779%
Common Roman Catholic Archbishop of Manila 121 Arzobispo street Intramuros, Manila Stockholder
Roman Catholic Archbishop of Manila
Filipino 327,904,251 7.2828%
*Under a Voting Trust Agreement dated October 12, 2012
PCD Nominee Corporation (PCD) now known as Philippine Depository and Trust Corporation (PDTC) - Non-Filipino & Filipino, holds 36.9863% interest. PDTC is the registered owner of the shares beneficially owned by participants in the PDTC. The Board of Directors of each participant has the power to decide on how the shares are to be voted.
Ayala Corporation (AC) holds 22.2160% interest. Mermac Inc. owns 47.04% of common shares
and 56.47% on total voting shares while the Mitsubishi Corporation owns 8.65% of common shares and 9.97% of total voting shares, respectively, of the outstanding shares of Ayala Corporation. The Board of Directors of Ayala Corporation has the power to decide on how Ayala Corporation shares in BPI are to be voted.

51
Liontide Holdings, Inc. (formerly Ayala DBS Holdings, Inc.) holds 20.0823% interest. Ayala Corporation owns 84.16% of the outstanding voting shares of (78.07% of effective economic interest in) Liontide Holdings, Inc. The Board of Directors of Liontide Holdings, Inc. has the power to decide on how Liontide Holdings, Inc. shares in BPI are to be voted.
AC International Finance Limited (AC International) holds 8.6679% interest. The Board of
Directors of AC International has the power to decide on how AC International shares in BPI are to be voted pursuant to a Voting Trust Agreement dated October 12, 2012.
The Roman Catholic Archbishop of Manila Group (RCAM) holds 7.2828% interest. The
Archbishop of Manila has the power to decide on how RCAM shares in BPI are to be voted.
1. Security Ownership of Directors and Management as of December 31, 2018
Title of Class
Name of Beneficial Owner Position
Dec 2017 Dec 2018 Nature of
Ownership Citizenship No. of
Shares % of
Holdings No. of Shares
% of Holdings
Common Jaime Augusto Zobel de Ayala Chairman 312 0.00% 9,628 0.00% Direct Filipino
Common Fernando Zobel de Ayala Vice-Chair 120 0.00% 137 0.00% Direct Filipino
Common Cezar P. Consing Director & President
1,000,391 0.02% 2,159,099 0.05% Direct Filipino
Common Gerardo C. Ablaza, Jr. Director 193 0.00% 193 0.00% Direct Filipino
Common Romeo L. Bernardo Director 12 0.00% 12 0.00% Direct Filipino
Common Ignacio R. Bunye Director 10 0.00% 118,032 0.03% Direct Filipino
Common Octavio V. Espiritu Director 1,173,102 0.03% 1,255,110 0.03% Direct Filipino
Common Rebecca G. Fernando Director 18 0.00% 20 0.00% Direct Filipino
Common Delfin C. Gonzalez, Jr. Director 15,010 0.00% 25,935 0.00% Direct Filipino
Common Xavier P. Loinaz Director 3,449,557 0.09% 3,938,203 0.09% Direct Filipino
Common Aurelio R. Montinola III Director 1,572,159 0.04% 1,794,863 0.04% Direct Filipino
Common Mercedita S. Nolledo Director 51,487 0.00% 59,502 0.00% Direct Filipino
Common Antonio Jose U. Periquet Director 22,093 0.00% 25,221 0.00% Direct Filipino
Common Dolores B. Yuvienco Director 1,310 0.00% 5,813 0.00% Direct Filipino
Common Mary Astrid S. Tuminez* Director 10 0.00% - 0.00% Direct Filipino
Common Antonio V. Paner EVP & Treasurer
129,483 0.00% 153,489 0.00% Direct Filipino
Common Ramon L. Jocson EVP & COO 10 0.00% 13,783 0.00% Direct Filipino
Common Ma. Theresa M. Javier** EVP & CFO 13,925 0.00% 20,994 0.00% Direct Filipino
Common Simon R. Paterno EVP 10 0.00% 5,675 0.00% Direct Filipino
Common Juan Carlos L. Syquia** EVP - 0.00% 1,982 0.00% Direct Filipino
Aggregate Shareholdings of Directors & Officers as a Group 7,329,212 0.18% 9,557,691 0.21%
*Resigned effective June 21, 2018
**Mr. Juan Carlos L. Syquia and Ms. Maria Theresa M. Javier were promoted to the rank of EVP effective January 1, 2019.

52
None of the members of the Bank’s Board of Directors and management owns 2.0% or more of the outstanding capital stock of the Bank.
2. Voting Trust Holders of 5% Or More
Ayala Corporation has a Voting Trust Agreement with AC International Finance Limited. 3. Minimum Public Ownership
As of December 31, 2018, listed securities held by the public were at 39.1% of BPI’s issued and
outstanding shares. This is well above the minimum required public float level of 10%.
Item 12. Certain Relationships and Related Transactions
In the normal course of the business, the Parent Bank transacts with related parties consisting of its subsidiaries and associates. Likewise, the BPI Group has transactions with Ayala Corporation (AC) and its subsidiaries (Ayala Group), where all transactions are dealt with on an arm’s length basis. AC is a substantial stockholder of BPI as at reporting date. These transactions such as loans and advances, deposit arrangements, trading of government securities and commercial papers, sale of assets, lease of bank premises, investment advisory/management, service arrangements and advances for operating expenses are made in normal banking activities and have terms and conditions that are generally comparable to those offered to non-related parties or to similar transactions in the market. Significant related party transactions and outstanding balances as at and for the year ended December 31, 2018 are summarized below:
Consolidated
2018
Transactions for the year
Outstanding Balances Terms and Conditions
(In Millions of Pesos)
Loans and Advances from: These are loans and advances granted to related parties that are generally secured with interest rates ranging from 3.87% to 8.25% (including those pertaining to foreign currency-denominated loans) and with maturity periods ranging from 5 days to 15 years.
Subsidiaries (81) 53
Associates 190 387
Ayala Group 5,026 32,579
Other related parties 159 461
5,294 33,480
Deposits from: These are demand, savings and time deposits bearing the following average interest rates: Demand – 0.22% to 0.31%
Subsidiaries 373 8,722
Associates 38 417
Ayala Group 12,263 16,804

53
Key management personnel 162 543 Savings – 0.62% to 0.68% Time – 2.61% to 4.37% 12,836 26,486
A more detailed discussion on related party transactions can be found on Note 26 of the 2018 Audited Financial Statements.
PART IV – CORPORATE GOVERNANCE
Item 13. Corporate Governance I. Corporate Governance Framework. We anchor our corporate governance framework on: (i) qualified and competent leadership, (ii) rigorous internal controls, (iii) an effective risk culture and (iv) strong accountability to shareholders. The Bank’s corporate governance framework is defined by its Articles of Incorporation, Amended By-Laws and Manual on Corporate Governance, and takes into account the nature, size, complexity, business activities and requirements of the Bank as well as its group operations. Banking practices, guided by BPI’s Board and Committee charters, the Manual of Corporate Governance, Code of Business Conduct and Ethics and internal operating manuals, reflect the integrity and ethics that define the Bank’s decision-making, conduct and behavior, and are consistent with statutory laws, rules and regulations of the Bangko Sentral ng Pilipinas (BSP), Securities Exchange Commission (SEC), Anti-Money Laundering Council, Philippine Deposit Insurance Corporation, among others. As a publicly listed company, BPI recognizes that robust corporate governance policies and practices promote a fair and sound market valuation of BPI shares and maintain the confidence of customers and investors alike. BPI strives to be jointly compliant with corporate governance and listed company disclosure requirements and standards of the SEC and the Philippine Stock Exchange. As an issuer in capital markets, the Bank also has a policy of continuous disclosure and transparency and utilizes disclosure mechanisms of the various exchanges in which its capital market issuances are traded. BPI also actively pursues alignment with best practices of counterparts in the region. The Bank strongly supports initiatives to strengthen regional capital market development and integration, especially through adoption of rigorous benchmarking methodology of the ASEAN Corporate Governance Scorecard. In addition, considering BPI’s role in the group as parent and publicly-listed company, the Board maintains an effective, high- level risk management and oversight process across other companies in the group to ensure consistent adoption of or alignment with the aforementioned corporate governance policies and systems. II. Board Governance (a) Advisory Council. As part of the Bank’s efforts to strengthen stewardship further, the Bank has a three member Advisory Council to the Chairman, created in 2016, composed of senior thought leaders, captains of industry and luminaries in their respective fields. (b) Board of Directors. Our fifteen-member Board plays a key role in setting our governance standards to meet our stakeholders’ expectations. In 2018, Non-Executive Directors (NEDs) which includes 7 Independent Directors (IDs), comprising a majority or 14 out of the 15, were elected to the Board in April. The only Executive Director (ED) is the President and CEO. The size of our Board is deemed appropriate given the complexity of operations of the Bank and the entire BPI group, the geographical spread of our business, and the significant time demands placed on the Directors.

54
Chairman and Vice-Chairman. The Board has a Chairman and Vice-Chairman, both of whom are non-executive directors. The Chairman, who is not the CEO of the Bank in the past three years, is separately appointed from the President and CEO. Said positions are currently held by two individuals who are not related to each other and have roles and responsibilities that are also separate and distinct, as detailed in the Manual on Corporate Governance. The Chairman guides the Board through its decision-making process and ensures that the Board operates effectively as a team. The Chairman also forges a very positive and constructive working relationship between the Board and management. With the Chairman at the helm, the Board sets BPI’s strategy and risk appetite, and approves capital and operating plans presented by management for sustainable achievement of strategic objectives. In the absence of the Chairman of the Board, the Vice-Chairman assumes and performs all the powers and duties of the Chairman of the Board. Lead Independent Director. The Board does not appoint a Lead Independent Director as current regulations of the Bangko Sentral ng Pilipinas require the appointment of a Lead Independent Director only in the exceptional case where the positions of Chairman of the Board of Directors and CEO, with prior approval of the Monetary Board, are held by one (1) person. Diversity and Independence. Our leadership model ensures an appropriate balance of power, accountability and independence in decision-making. As disclosed on the company website, the Board Diversity Policy, adopted in 2015 to institute diversity at the board level; the 2018 Board of Directors elected in April 2018 included four women, two of whom are also Independent Directors, comprising 27% of the Board. Seven Independent Directors were elected to the 2018 Board, higher than the regulatory requirement to have at least one-third (1/3) but not less than two (2) Independent Directors as members of the board. This constitutes 47% or almost a majority, which is key to fairness and integrity, and allows the board to strike a balance between public, corporate and all stakeholder interests. (c) Board Charter. The Board Charter articulates the governance and oversight responsibilities exercised by the Board, its roles and functions, composition, and committees subject to provisions of BPI's Articles of Incorporation, Amended By-Laws and applicable laws. It is incorporated in BPI’s Manual on Corporate Governance and is reviewed together with the annual review of the Manual. (d) Board Committees. To heighten the efficiency of board operations, the Board has established Committees that assist in exercising its authority for oversight of internal control, risk management, and performance monitoring. In 2018, the Bank had eight board-level committees: Executive, Risk Management, Audit, Corporate Governance, Personnel and Compensation, Nominations, Retirement and Pension, and Related Party Transactions Committees. Board-level committee memberships were also evaluated and calibrated to improve on the committees’ focused oversight and high level engagement with management. The respective charters stating committee purpose, membership, structure, operations, reporting processes and other information are disclosed in regulatory reports, posted on the company website and reviewed by the committees annually. Annual performance reviews are conducted by all board-level committees. (e) Corporate Secretary. The Board is assisted in its duties by a Corporate Secretary who is not a member of the Board of Directors and is a senior, strategic-level corporate officer who plays a leading role in the Bank's corporate governance, serving as an adviser to the directors on their responsibilities and obligations. The Board has separate and independent access to the Corporate Secretary. All directors and board committees also have unrestricted access to company records and information in addition to receipt of regular detailed financial and operational reports from senior management. Our Corporate Secretary is suitably trained and experienced in legal, accountancy or company secretarial practices and is professionally qualified for these responsibilities. Our

55
Corporate Secretary also possesses the legal skills of a chief legal officer whose training is complemented by business, organizational, human relations and administrative work skills. Our Corporate Secretary is also Corporate Secretary of various BPI subsidiaries and affiliates. (f) External Advice. Considering the increasing complexity of market transactions and rapid rate of change in the regulatory sphere, our Board of Directors, if so requested by the Chairman or other directors, can call on external specialists or consultants for advice, briefings or assistance on specialized areas of focus such as accounting standards, related party transactions, capital, tax, listing, mergers and acquisitions, valuation, etc. Management can arrange for the external auditor, management services company or consultants to present to the Board and the Bank. (g) Nominations. As we are a financial institution imbued with public interest, fit and proper qualifications for membership in our Board of Directors are dictated by our Amended By-Laws, Manual on Corporate Governance, the Corporation Code, and relevant regulations of the Bangko Sentral and the SEC. As a publicly listed company, we also ensure that Board composition and director qualifications also meet pertinent governance regulations, requirements, and standards of the PSE. As disclosed in the Manual on Corporate Governance, candidates for directorship may be recommended by shareholders to the Nominations Committee through the Office of the Corporate Secretary. Among other qualifications, candidates must be fit and proper for the position of a director, taking into consideration integrity/probity, physical/mental fitness, relevant education/financial literacy/training, possession of competencies relevant to the job such as knowledge and experience, skills, diligence and independence of mind and sufficiency of time to carry out responsibilities. Candidates recommended by shareholders are evaluated in the same manner as director candidates identified by any other means. The Committee itself may likewise identify and recommend qualified individuals for nomination and election to the board and may make use of professional search firms or other external sources to search for qualified candidates to the board. Separate qualifications and disqualifications for Independent Directors based on regulations, are enumerated in the Bank’s Manual on Corporate Governance. Directors must remain qualified throughout the term. All of the Bank’s annual reports contain comprehensive profiles of the Board of Directors which disclose the age, qualifications, date of appointment, relevant experience and directorships both in the BPI group as well as in other companies, listed or otherwise. In compliance with SEC Memo. Cir. No. 11, s2014, the Bank also posts biographical details of the Board of Directors and Senior Management on the company website. (h) Election and Term of Directors. Board members are elected by BPI stockholders who are entitled to one vote per share at the Bank’s Annual Stockholders Meeting. Voting for the election of members of the Board of Directors is considered on a poll, by shares of stock, that is, one share entitles the holder to one vote, two shares to two votes. Votes may be cumulated as provided for in the Corporation Code. The fifteen nominees receiving the highest number of votes are declared elected. The Bank’s Amended By-Laws state that elections for the Board of Directors will be held yearly during the Annual Stockholders Meeting. Directors are to hold office for a term of one (1) year immediately upon their election and until the next election when their successor shall have been elected and qualified in accordance with the Amended By-Laws and Corporation Code. No meeting of stockholders shall be competent to transact business unless a majority of the outstanding and subscribed capital stock entitled to vote is represented, except to adjourn from day to day or until such time as may be deemed proper. The Rules of Conduct, voting and vote tabulation procedures are explained during the Annual Stockholders Meeting. The Office of the Corporate Secretary tabulates all votes received and the Bank’s external auditor validates the results. Voting results are likewise disclosed on the various exchanges where BPI’s capital market issuances are traded and the company’s website as soon as possible after the meeting. The election/appointment of directors/officers must also be confirmed by the Monetary Board of the BSP. Elected/appointed directors/officers must submit required certifications and other documentary proof of

56
qualifications for the confirmation of their election/appointment. The nomination and election processes and their effectiveness are reviewed annually by the Nomination Committee during its review of the committee charter and its self-assessment, by its members, of committee performance. In adherence to Recommendation 2.6 of the SEC CG Code for PLCs, these nomination and election policies are disclosed in BPI’s Manual on Corporate Governance as well as on the company website. (i) Meetings and Attendance. The BPI Board meets regularly for the effective discharge of its obligations. Regular board meetings are convened monthly. Board of Directors meetings are scheduled at the beginning of the year to cover the full term of the newly elected or re-elected members of the Board, reckoned from the date of the current year’s Annual Stockholders Meeting to that of the following year. Special meetings may be called for as needed. Items placed on the board agenda are those that have the most fundamental importance and broad policy implications for the Bank. Directors are free to suggest items for inclusion in the agenda, and are free to raise at any board meeting subjects that are not on the agenda for that meeting. At the Chairman’s discretion, any agenda items may also be referred for discussion in the respective committees. The Chairman presides over meetings of the Board. The Vice Chairman presides in the absence of the Chairman. Board and committee meetings are conducted consistent with the Bank’s Amended By-Laws. Discussions during the board meetings are open and independent views are given due consideration. When necessary, the Board holds executive sessions to discuss highly sensitive matters. Board reference materials are made available to the directors at least five business days in advance of the scheduled meeting. As an innovation to board governance, all materials for Board and Board committee meetings are uploaded through a secure system onto individual tablet devices specifically provided to the Board members to ensure immediate receipt and quick access. Independent and Non-Executive Directors of the Bank also meet at least once a year without the presence of the executive director or management. In 2018, average attendance of re-elected and newly-elected members at the Board of Director’s 17 meetings was 93%. When exigencies prevent a Director from physically attending a Board or Board committee meeting, facilities for telephone conferencing are made available. In those instances when a Director is unable to attend meetings even through teleconferencing due to prior commitments or unavoidable events, said Director provides input to the chairman so that his views can be known and considered. (j) Continuing Education. The Bank ensures that it has in place a formal board and director development program. For new directors, there is a deliberate, systematic and rapid familiarization with the organization and the operations of the board, Articles of Incorporation and Amended By-Laws, Manual of Corporate Governance, Board Charter as well as the Code of Conduct, standards of Conflict of interest and policies such as Insider Trading, Whistleblowing, Data Privacy and Related Party Transactions. The Bank, through its various units, also provides continuing director education in relation to current developments; these include regulatory initiatives like Data Privacy, the Anti-Money Laundering and Terrorist Financing Prevention Program, Foreign Account Tax Compliance Act, Securities Regulations Code, SEC memorandum circulars, and BSP regulations, among others. All of the Bank’s directors undergo the requisite corporate governance seminar provided by an SEC or Bangko Sentral-accredited institution. On September 10, 2018, members of the Board, including senior officers of the Bank, attended the Annual CG Training Program conducted by the Institute of Corporate Directors (ICD). Other directors attended the Advanced CG Training conducted by the ICD on October 5, 2018. (k) Remuneration. Our remuneration decisions for the Board and management are aligned with risk incentives and support sustainable, long-term value creation. Apart from ensuring that Board and management pay appropriately reflects industry conditions and financial performance, the Bank likewise rebalances returns back to shareholders through a robust dividend policy. Under the Bank’s Amended By-Laws, as approved by the shareholders, the Board of Directors, as a whole, determines the level of remuneration and/or benefits for directors sufficient to attract and retain directors and compensate them for their time commitments and responsibilities of their role. Our Personnel and Compensation Committee recommends to the Board the fees

57
and other compensation for directors, ensuring that compensation fairly remunerates directors for work required in a company of BPI’s size and scope. As provided by our Amended By-Laws and pursuant to a Board resolution, each director is entitled to receive fees and other compensation for his services as director. The Board has the sole authority to determine the amount, form, and structure of the fees and other compensation of the directors. In no case shall the total yearly compensation of the Board exceed 1% of the Bank’s net income before income tax during the preceding year. Board members receive per diems for each occasion of attendance at meetings of the Board or of a board committee. All fixed or variable remuneration paid to directors may be given as approved by stockholders during the Annual Stockholders Meeting, upon recommendation of the Personnel and Compensation Committee. Other than the usual per diem arrangement for Board and Committee meetings and the aforementioned compensation of Directors, there is no standard arrangement as regards compensation of directors, directly or indirectly, for any other service provided by the directors for the last completed fiscal year. Board members with executive responsibilities within the BPI group are compensated as full-time officers of the company, not as Non-Executive Directors. No director participates in discussions of the remuneration scheme for himself or herself. Historically, total compensation paid annually to all directors has been significantly less than the cap of 1% of the total net income stipulated by the Bank’s Amended By-Laws. The remuneration policy is reviewed annually to ensure that it remains competitive and consistent with the Bank’s high performance culture, objectives, and long-term outlook, risk assessment and strategies. This relationship between remuneration and performance aligns remuneration of the Board with the long-term interests of the Bank. (l) Performance Evaluation. The Board conducts an annual board effectiveness review under the guidance of the Corporate Governance Committee, which ascertains alignment of leadership fundamentals and issues, and validates the Board’s appreciation of its roles and responsibilities across four levels: the Board, Board Committees, individual Directors and the President and CEO. Performance evaluation criteria is built around the Board and Committee Charters as well as broad leadership and best practice standards in each of the levels. Such an exercise will be conducted in early 2019 to assess the 2018 performance of the Board. The Corporate Governance Committee processes and tabulates the results of the self-assessments and communicates them to the Board. Areas for improvement are discussed by the Board, in order to agree on remedial actions. The Corporate Governance Committee may also develop recommendations and action plans for the Board, whenever necessary and desirable. In adherence to Recommendation 6.1 SEC CG Code for PLCs the Board may also consider the use of an independent, external facilitator in the conduct of the Board self-assessment. (m) Succession Planning. Our Board is regularly refreshed in a continuing cycle. The Nomination Committee and the Corporate Governance Committee work within a general board succession plan framework to ensure that: 1) appropriate governance processes are in place and ongoing, for identifying, assessing and monitoring future needs of the Board; 2) there is continuity and transfer of knowledge in the Board so that it may effectively fulfill its role and responsibilities to BPI, as that may evolve over time, and; 3) the Board is taking a prudent and structured approach to managing succession risk. (BSP Cir. 969 and Recommendation 2.4 SEC CG Code for PLCs) The Corporate Governance Committee assists the Nomination Committee in the annual review and assessment of the structure, size and composition of the Board and Board-level committees. The committees take into consideration the Bank’s current strategy and business, regulatory requirements on independence and diversity, as well as comparative benchmark and peer group analysis. The Corporate Governance Committee also utilizes a Skills and Expertise Matrix to proactively shape board composition, identify competency gaps, if any, and build the desired or required competency profile against which candidate directors will be assessed. Using a point system, succession planning priorities are then determined to guide the Nomination Committee in the assessment of candidates and in managing current and future requirements of the Board. The Board understands the importance of succession planning and, through its Personnel and Compensation Committee (PerCom), manages the talent pipeline and assembles the right executive and leadership appetency capable of

58
navigating the Bank through strategic, market, technology and regulatory shifts. In consultation with the Board and the President and CEO, either the PerCom evaluates and nominates potential successors to the President and CEO, as well as ensures there is a sufficient pool of qualified internal candidates to fill other senior and leadership positions. The Bank’s effective succession planning has ensured leadership continuity within the last two decades, witnessing three President and CEO changes, marked by early planning and mentoring, smooth organizational and operational transitioning and prudent but progressive institutional building at BPI and across the BPI group. We believe that it is crucial to have a good balance between continuity and fresh perspectives on the Board. In much the same way, our Board is regularly refreshed in a continuing cycle. The Nomination Committee and the Corporate Governance Committee work within a general board succession plan framework to ensure that the Board is able to fulfill its fiduciary duties so that the Bank remains relevant, agile, and anticipatory of future programs and directions. (n) Retirement Policy. The Bank believes that imposing uniform and fixed limits on director tenure is counter-productive as it may force the arbitrary retirement of valuable directors. It is the Bank’s strong view that with age often comes unmatched wisdom and experience, expert business judgment, invaluable industry and community relations and authority, and that the best interests of the Bank are served by its being able to retain directors that make very meaningful contributions to the Board and the organization regardless of age. The Bank, therefore, sets the retirement age for Directors at 80 years of age but which the Board may opt to waive depending on specific conditions. Term limits of Independent Directors are set at a maximum cumulative term of nine (9) years as prescribed in the Manual of Regulations for Banks and SEC Mem.Cir.No. 9, Series of 2011 and No. 4, Series of 2017. Retirement of senior management is done with the requisite succession planning and in accordance with the Bank’s policies and implementing guidelines of its retirement plan for all employees, the Bank’s Amended By-Laws, Labor Code and the Corporation Code of the Philippines. Currently, the retirement age for employees of the Bank is set at 60 years of age. III. Risk, Control, and Compliance Oversight and Management Relations (n) Audit. Based on Internal Audit assurance activities, Internal Audit provides reasonable assurance to the Audit Committee, Board of Directors and Senior Management that the Bank’s systems of internal controls, corporate governance, and risk management processes are adequate and generally effective. This unit reports directly to the Board through its Audit Committee. It collaborates with other assurance providers such as the Risk Management Office, Compliance Office, external auditors, and other oversight units. Through this system for the comprehensive monitoring and review of risks and compliance in the institution, the Board ensures that the Bank and all business units proactively manage the risk and compliance exposures impacting the business. The Internal Audit Division is headed by a Chief Audit Executive who is appointed by the Board and reports functionally to the Board of Directors through the Audit Committee and administratively to the President and CEO. The Audit Committee recommends to the Board the appointment of a Bangko Sentral-accredited external auditor for the purpose of preparing or issuing an audit report or related work. The appointment or re-appointment of the Bank’s external auditor is subject to the approval and endorsement by the Audit Committee, for subsequent confirmation and approval by the Board of Directors and finally the Stockholders. (o) Risk Management. In the same way, the Board’s Risk Management Committee, with the assistance of management’s Risk Management Office and its Chief Risk Officer, reviews and recommends the Bank’s enterprise risk and capital management framework to ensure that it conforms not only to the Bank’s own rigorous standards, but also to Bangko Sentral directives promoting an effective Internal Capital Adequacy Assessment Process. The Chief Risk Officer is appointed by the Risk Management Committee, with approval and confirmation of the Board. The CRO is responsible for leading the formulation of risk management policies, methodologies, and metrics in alignment with the overall strategy of the Bank, ensuring that risks are prudently

59
and rationally undertaken and within the Bank’s risk appetite, as well as commensurate and disciplined to maximize returns on capital. The CRO and the RMO facilitate risk management learning programs and promote best practices on an enterprise- wide basis. The RMC also assesses the annual performance of the Chief Risk Officer and risk management functions taking into account how it carried out its duties and responsibilities. (p) Compliance. Oversight of the management of the Bank’s business risk and implementation of its compliance function is the responsibility of our Board of Directors, through the Audit Committee. At the management level, the compliance function is carried out by the Compliance Office, led by our Chief Compliance Officer (CCO). Designated by the Chairman of the Board, our CCO is not a member of the Board of Directors and has the rank of at least a Vice President. The CCO’s qualifications are subject to the applicable provisions of the Manual of Regulations for Banks, particularly considering fit and proper criteria such as integrity/probity, competence, education, diligence, experience and training. The CCO annually attends corporate governance training. (q) Strategy Process. The Bank’s vision, mission, strategic objectives, key policies and procedures for management of the company are clearly established and communicated down the line. The Board of Directors creates the framework within which the executive team, under the President and CEO, can lead the business and deliver the agreed strategy. The Board conducts a periodic review of the foregoing and has continuing oversight in its implementation. The management team articulates the agreed strategy in periodic planning exercises and distills business plans in formal budgets. Periodic performance reviews are conducted against budgets and past performance. Management acts in accordance with well-defined operating policies and procedures, and ensures accuracy and transparency of operational and financial reporting to protect the Bank’s reputation for integrity and fair dealing. The management team strives to achieve accountability in revenue performance, efficiency in expenditure of resources, and high quality in delivery of services and achievement of customer satisfaction. Management is periodically reviewed and rewarded according to performance relative to innovation, initiatives, assigned targets, and feedback from customers, peers, and Board. The President heads a management team who lead supervise work of the Bank’s business units, which includes but is not limited to the Chief Finance Officer, Chief Risk Officer, Chief Audit Executive, and Chief Compliance Officer who provide focused and strategic, functional leadership and expertise. Management level committees are in place to deal with operational functions from a strategic level and serve as counterpoints to senior and mid-level managers. IV. Corporate Governance Policies and Practices (r) Manual on Corporate Governance. The Bank has a Manual on Corporate Governance which documents the framework of policies, rules, systems and processes in the corporation that governs the performance by the Board of Directors and Management of their respective duties and responsibilities to stockholders and other stakeholders. A certification on the Bank’s full compliance with the Manual, signed and issued by the Chief Compliance Officer, is posted on the Corporate Governance section of the company website. The Manual on Corporate Governance, reviewed annually, was last amended in early 2018, and amendments were approved by the Board of Directors on March 7, 2018. When updated or amended, the Manual is resubmitted to the SEC. The Manual is also posted on the company website. (s) Code of Conduct. BPI has Codes of Business Conduct and Ethics for its directors, officers and employees that provide the key practices and behaviors derived from the BPI Credo and Core Values, that guides what they say and do, in order that the right decisions are taken in performing their respective roles and responsibilities across various functions in the Bank and in handling relationships with all stakeholders.

60
Employee Code of Business Conduct and Ethics. The Code is applicable to and mandatory for all BPI employees at all levels, including officers, as are the core values embodied in the Bank’s Credo. As no code could address every situation an employee may encounter, all employees, including officers, are required to follow both the spirit and the letter of the Code, its policies, and procedures. All BPI officers and employees must abide and fulfill their duty and personal responsibility to read, understand and comply with the Code. Director’s Code of Conduct. BPI has a Code of Conduct for its Board of Directors, adopted in September 2017, which applies to and is binding on all directors of the Bank. The Director’s Code is intended to provide guidance to directors, whether executive, non-executive or independent, with policies on standards for conduct of the business of the Bank, the protection of the rights of the Bank and its stakeholders, maintaining BPI’s reputation for integrity and fostering compliance with applicable laws and regulations. The Director’s Code, therefore, sets forth policy in several basic areas that commonly require directors to exercise sound and informed judgment, recognize and deal with ethical issues, report possible unethical conduct, and foster a culture of openness, fair dealing, diligence and accountability. Compliance with the Codes. All employees, including senior officers and directors, acknowledge annually through a Statement of Affirmation that they have read and understood the employee Code of Conduct and/or the Director’s Code, respectively, as well as the Manual on Corporate Governance, and fully comply and adhere to principles, standards and policies therein. (t) Conflict of Interest. BPI does not tolerate those who place their interest above that of our institution, our clients, or our business partners. We have in place standards on conflict-of- interest that elevate the interest of the Bank above that of the personal interests of Directors, officers, and employees. These standards prohibit Directors, officers, and employees from using their position of authority or rank to directly or indirectly derive personal gain or advantage. Our standards on conflict of interest expect all Directors, officers and employees to refrain from any conduct that could be viewed unfavorably by our clients, co-employees, competitors, suppliers, investors, regulators, or the public. The standards also require full cooperation and provision of complete and accurate information from employees during government, regulatory or internal enquiries, investigations and audits. The standards also cover specific conflict-of-interest situations such as receipt of gifts from third parties, respect for trade secrets, and use of non-public information, and use of company funds, assets and information. (u) Whistleblower Policy. This policy covers all employees of BPI and all wrongful acts that adversely impact the Bank and its stakeholders. Under the policy, it is the responsibility of all personnel to comply with rules and regulations of the Bank and to report violations or suspected violations in accordance with the policy. Anybody who knowingly aids, abets, or conceals or otherwise deliberately permits the commission of any irregular or fraudulent act directed against the Bank shall be considered as guilty as the principal perpetrators of the fraud or irregularity. Hence, all employees have a duty to cooperate with investigations initiated under the policy. No action will be taken against anyone for reporting such violations in good faith, or participating or assisting in investigations of a suspected violation. Any act of retaliation against a whistleblower is a violation of the Whistleblower Policy and Code of Business Conduct and Ethics. (v) Related Party Transactions Policy. This policy guards against internal conflicts of interest between the company and/or its group and their directors, officers and significant shareholders and ensures that transactions such as loans and advances, deposit arrangements, trading of government securities and commercial papers, sale of assets, lease of bank premises, investment advisory/management, service arrangements and advances for operating expenses are made in the normal course of banking activities with terms and conditions that are generally comparable to those offered to non-related parties or to similar transactions in the market. Vetting transactions with related parties is done either by the board-level Related Party Transaction Committee (RPTC)

61
or Management Vetting Committee (MVC), depending on materiality, prior to implementation. The two committees provide guidance and vet on credit and non-credit related party transactions of significant amounts (P50Mn and above for RPTC and below P50Mn for MVC). Related party transactions are properly disclosed in BPI’s audited financial statements, and applicable fillings in accordance with relevant rules and issuances of SEC, BSP, etc. (w) Insider Trading Policy. This policy, in general, prohibits covered persons, i.e., directors, officers, employees of BPI and BPI’s subsidiaries, and other parties who are considered to have knowledge, made aware of or have access to inside information or material non-public information, from buying or selling BPI stocks for their own personal account to benefit themselves or others, especially during the blackout trading period. All directors and senior management (SVP and up), Treasurer, Corporate Secretary and Assistant Corporate Secretary, are also required to report to the Compliance Office within ten (10) days from the end of each quarter their trades of shares of BPI stock during such quarter. In compliance with the SEC, all directors and senior management file within three (3) business days the required SEC Form 23A/B. Officers and directors are expected to strictly comply with the Policy and to be knowledgeable of BPI’s related policies, standards or internal procedures such as on information barriers, which impact on compliance with the Insider Trading Policy. A breach of the Insider Trading Policy may result in internal disciplinary action and any violation of related securities laws may also subject the Bank and/or the director to civil liability and possibly monetary penalties. (x) ABC Policy, Anti-Money Laundering and Financial Crime Policies.The Bank puts the highest premium on sound, responsible and effective corporate governance and does not tolerate bribery, corruption or improper payments of any kind. It advocates that Directors, officers and employees do not tolerate corruption or any form of bribery nor provide or accept improper inducements in the course of any business dealing. Aligned with the Bank’s commitment to act fairly and with integrity in all business dealings and relationships, the Anti- Bribery and Anti-Corruption Policy complements the BPI’s financial crime policies/programs such as the Money Laundering and Terrorist Financing Prevention Program and Whistleblower Policy. Guidance on the Bank’s Anti-Corruption and Anti-Bribery program is supplemented by the Bank’s Standards on Conflict of Interest under Request or Acceptance of Fees, Commissions, Gifts. Monitoring and compliance with the Code of Conduct and related policies are undertaken by departments or units of the Bank such as Human Resources and Corporate Governance, Compliance Division. (y) Data Privacy Policy. BPI has a strong Data Privacy Policy in place, which complies with the requirements of the Data Privacy Act and the National Privacy Commission (NPC). BPI’s Data Privacy Policy, posted on the company website, is supported by a comprehensive program utilizing a combination of policies, organizational structure, access controls and technologies designed for risk reduction. The Bank has a Data Privacy Office, headed by a Board-appointed Data Privacy Officer (DPO), a lead senior management officer. The key focus of the DPO is to oversee data privacy compliance and manage data protection risks consistent with Data Privacy Act rules and regulations, issuances by the NPC and other applicable laws. Management has also appointed Compliance Officers for Privacy for major business units of the Bank. (z) Employee Welfare, Health and Safety. Having engaged and competent employees is BPI’s goal for delivering best-in-class customer experiences and for achieving its vision of being recognized as the most trusted partner and financial advisor. The Bank strives to be an employer of choice among Philippine financial institutions. We have a wide array of training and development programs and activities designed along the Bank’s business objectives, aimed at honing the skills and capabilities of our employees in carrying out their daily duties, as well as preparing them to assume higher responsibilities as the next leaders of the organization. The Bank has adopted a compensation policy that it believes is competitive with industry standards in the Philippines. Regular employees are provided with a comprehensive pay and benefits package, which is reviewed

62
periodically and adjusted to retain current employees and attract new talent. Tied to this is a performance management system that calls for the alignment of individual key results, competencies, and development plans with the Bank’s overall business targets and strategy. Officers and employees undergo regular performance evaluations based on their individual accomplishments vis-a-vis their responsibilities, as well as that of the business unit or the Bank. The Bank has an Executive Stock Purchase Plan (ESPP), a major initiative under its long-term incentive program, which aligns management’s interest with shareholders and the long-term prospects of the Bank. Moreover, we strive to provide a safe, secure and conducive working environment for our employees, to continually safeguard their health and rights and provide equal opportunity for everyone to realize their fullest potential and make them agents of uplifting change for their communities. (Recommendation 2.9 of the SEC CG Code for PLCs) V. Investor Relations, Continuous Disclosure and Transparency (aa) Investor Relations. Through its Investor Relations Unit, the Bank employs a program of proactive, uniform, appropriate and timely communication and reporting, in the spirit of full disclosure and in compliance with the Securities Regulation Code and Bangko Sentral, SEC and PSE rules, regulations and disclosure guidelines. The Bank provides company presentations in the Annual Stockholders Meeting and conducts analyst and media or press briefings apart from maintaining the relevant disclosures on its website. The Board has a policy of continuous disclosure and transparency and commits at all times to fully disclose all material information about the company for the benefit of the stockholder and other stakeholders. Such information includes earnings results, materially significant acquisition or disposal of assets, board changes, related party transactions which are not in the ordinary course of business, shareholding of directors and major changes to ownership/voting rights, group structures, intra- group relations, ownership data, and beneficial ownership. As a listed company, BPI files structured and unstructured disclosures through the, appropriate Exchange mechanisms for listed companies and submits mandated regulatory reports to the SEC. The Bank also maintains an official company website in accordance with the SEC-prescribed format and template to ensure a comprehensive, cost-efficient, transparent, timely manner of disseminating relevant information to the public. BPI also maintains official company sites on social media-based platforms. (bb) Annual Stockholders Meeting (ASM). The ASM is held annually and is organized in an easy to reach and cost-efficient venue and location in Metro Manila. The ASM allows shareholders to advise and adopt resolutions on important matters affecting the Bank, such as: ratification of all acts and resolutions of the Board of Directors and Management, approval of the annual report of the President and Bank’s statement of condition, amendments to the Articles of Incorporation or By-Laws, election of Board of Directors and external auditor as well as measures to amend the shareholders' equity. Last year’s ASM was held on Thursday, April 19, 2018, 9:00 A.M., at Ballroom 2, Fairmont Makati, 1 Raffles Drive, Makati Avenue, Makati City. Notice of the ASM. The Notice is sent to shareholders well before the meeting date to allow shareholders to review the meeting’s agenda and provide shareholders with sufficient information regarding issues to be decided at the meeting; the Definitive Information Statement, or SEC Form 20-IS is issued in accordance with BPI's Amended By-Laws and SRC 20. Last year, the Notice was sent out to stockholders of record by March 8, 2018, 42 days before the ASM. Voting and Voting Results. All items in the agenda requiring stockholder approval need the affirmative vote of at least a majority of the issued and outstanding voting stock. Stockholders may vote in person or in absentia by proxy executed in writing by the stockholder or by a duly authorized attorney-in-fact. Voting is considered on a poll, by shares of stock, that is, one share entitles the holder to one vote. Cumulative voting as provided for in the Corporation Code may be applied in the election of the Board of Directors and directors are elected

63
individually. The Rules of Conduct, voting and vote tabulation procedures are likewise explained during the meeting. The Office of the Corporate Secretary tabulates all votes received and the Bank’s external auditor validates the results. Voting results are disclosed on PSE EDGE and company’s website. Shareholder Participation. BPI proactively encourages the full participation of all shareholders, including institutional shareholders, at the ASM each year. Shareholders are encouraged to ask questions at the ASM to ensure accountability and identification with the Board of Directors’ and Management’s strategy and goals for the business of BPI. Minutes of the Annual Stockholders’ Meeting. The Minutes includes all information pertinent to the meeting and is promptly disclosed on the company website within the period mandated by the SEC. Minutes of the 2018 ASM were posted on the company website within five (5) calendar days from the date of the ASM. (cc) Annual and Quarterly Reports. Our Annual, Quarterly and Current Reports are our primary disclosure mechanisms used to impart knowledge about the Bank to all our stakeholders in an informative, structured and cost-effective manner. The Annual and Quarterly accountability reports effectively detail our performance during the period under review and put that performance in context of the objectives of the Bank, its strategies and future direction. The Current accountability reports similarly provide timely updates on significant corporate actions undertaken by the Bank. The Annual, Quarterly and Current Reports are regularly submitted to the SEC pursuant to Section 17 of the SRC, which also prescribes format and content. The Annual, Quarterly and Current Reports are also disclosed on the websites of the various exchanges where BPI capital market issues are traded and on the company’s website. The Annual, Quarterly and Current Reports may be viewed at www.bpiexpressonline.com. VI. Sustainability, Stakeholder Engagement and ESG Reporting (dd) Sustainability and Stakeholder Engagement. The Bank operates on a sustainability framework of shared values which emphasizes importance of all stakeholders and how their interests are integrated into the business of BPI. Stakeholder engagement takes on various forms and is carried out through a range of information, communication and consultative activities and disclosures. For employees: learning and development programs; long-term, merit-based performance incentive mechanisms such as executive stock purchase plans and regular subscription plans. For communities: extending credit and financial services to underserved and unbanked sectors; improving financial literacy initiatives and factoring ESG dimensions into its business and risk models and loan products and services. For clients: financial wellness, financial inclusion and sustainable development investments. For suppliers: a supplier policy based on the principle of transparency - equal opportunity for qualified suppliers and contractors while ensuring a properly managed supply chain from the point-of- view of sustainability and good governance. For creditors: counterparties are protected by fairness, accountability and transparency; policies and procedures are in place safeguarding creditor’s rights as required by the BSP. (ee) Environmental, Social and Governance Reporting. BPI considers the most appropriate way to report non-financial information to ensure that its ESG reporting provides internal and external stakeholders with the non-financial information needed to understand the context that the Bank operates in today. ESG reporting may be through a stand-alone sustainability report, an integrated annual report, and company website. It has adopted a globally-recognized standard/ framework, G4 Framework by the Global Reporting Initiative, for its ESG reporting.

64
VII. Corporate Governance Awards and Recognition 2016 Institutional Investors’ Award for Corporate Governance. In 2016, BPI was recognized as one of the 15 awardees of the inaugural Institutional Investors’ Award for Corporate Governance at the FMAP Investors' Forum. A joint initiative of the Fund Managers Association of the Philippines, the Institute of Corporate Directors, the Trust Officers Association of the Philippines and Philippine Investment Funds Association, the award is given by Institutional Investors to listed companies based largely on their ASEAN CG Scorecard rating. 2018 Top Performing Company under the ASEAN Corporate Governance Scorecard (ACGS) for the year 2017. In July 2018, BPI was awarded as a Top Performing Company under the ASEAN Corporate Governance Scorecard (ACGS) for the year 2017. BPI ranked in the Top Five of the Financial Sector and was one of only three banks to do so, out of 16 publicly-listed banks. The Financial Sector received the highest total average score and was also recognized for the quality of disclosures, besting the six other sector categories of the Philippine Stock Exchange. A total of 245 companies out of the 325 currently listed on the PSE, are assessed under the ACGS based on their market capitalization. PART V – EXHIBITS AND SCHEDULES
Item 14. Exhibits and Reports on SEC Form 17 -C
a. Exhibits
Securities Regulation Code Forms (1) Publication of Notice re: Filing NA (2) Underwriting Agreement NA (3) Plan of Acquisition, Reorganization, Arrangement, Liquidation, or Succession NA (4) (A) Articles of Incorporation NA (B) By-laws NA (5) Instruments Defining the Rights of Security Holders, including indentures NA (6) Opinion re: Legality NA (7) Opinion re: Tax Matters NA (8) Voting Trust Agreement NA (9) Material Contracts NA (10) Annual Report to Security Holders Exhibit A (11) Material Foreign Patents NA (12) Letter re: Unaudited Interim Financial Information NA (13) Letter re: Change in Certifying Accountant NA (14) Letter re: Director Resignation NA (15) Letter re: Change in Accounting Principles NA (16) Report Furnished to Security Holders NA (17) Other Documents or Statements to Security Holders NA (18) Subsidiaries of the Registrants Exhibit B (19) Published Report Regarding Matters Submitted to Vote of Security Holders NA (20) Consents of Experts and Independent Counsel NA

65
(21) (A) Power of Attorney NA (B) Power of Attorney-Foreign Registrant NA (22) Statement of Eligibility of Trustee NA (23) Exhibits to be filed with Commercial Papers/Bonds Issues NA (24) Exhibits to be filed with Stock Options Issues NA (25) Exhibits to be filed by Investment Companies NA (26) Notarized Curriculum Vitae and Photographs of Officers and Members of the Board of Directors NA (27) Copy of the BOI Certificate for BOI Registered Companies NA (28) Authorization re: Registrant’s Bank Accounts NA (29) Additional Exhibits NA
Annex A – Financial Assets Exhibit A Sch. B - Amounts Receivable from Directors, Officers, Employees, Related Parties and Principal Stockholders Exhibit A Sch. C – Amounts Receivable from Related Parties which are Eliminated during the Consolidation of Financial Statements Exhibit A Sch. D – Intangible Assets Exhibit A Sch. E - Long-Term Debt Exhibit A Sch. F – Indebtedness to Related Parties Exhibit A Sch. G – Guarantees of Securities of Other Issuers Exhibit A Sch. H – Capital Stock Exhibit A Top 20 Shareholders Exhibit C Statistical Report by Sharelots as of December 31, 2018 Exhibit D
Annual Corporate Governance Report Exhibit E
b. Reports on SEC Form 17-C
Items reported under SEC Form 17-C in 2018:
(1) Declaration of regular cash dividend of ninety centavos (P0.90) per share for the first semester
of the year 2018 approved by the Board of Directors last June 20, 2018, reported last June 20, 2018.
(2) Declaration of regular cash dividend of ninety centavos (P0.90) per share for the second
semester of the year 2018 approved by the Board of Directors last December 19, 2018, reported last December 19, 2018.
(3) Approval of the holding of the 2018 Annual Stockholders’ Meeting last December 19, 2018.


EXHIBIT A
(Audited Financial Statements)


Bank of the Philippine Islands Financial Statements As at December 31, 2018 and 2017 and for each of the three
years in the period ended December 31, 2018


(2)
The consolidated financial statements comprise the financial statements of the Parent Bank and the following subsidiaries:
Subsidiaries Country of
incorporation Principal activities % of ownership 2018 2017
BPI Family Savings Bank, Inc. Philippines Banking 100 100 BPI Capital Corporation Philippines Investment house 100 100 BPI Direct BanKo, Inc., A Savings Bank Philippines Banking 100 100 BPI Asset Management and Trust Corporation Philippines Trust 100 100 BPI International Finance Limited Hong Kong Financing 100 100 BPI Europe Plc. England and Wales Banking (deposit) 100 100 BPI Securities Corp. Philippines Securities dealer 100 100 BPI Payments Holdings Inc. Philippines Financing 100 100 Filinvest Algo Financial Corp. Philippines Financing 100 100 BPI Investment Management, Inc. Philippines Investment management 100 100 Santiago Land Development Corporation Philippines Land holding 100 100 BPI Operations Management Corp. Philippines Operations management 100 100 BPI Computer Systems Corp. Philippines Business systems service 100 100 BPI Forex Corp. Philippines Foreign exchange 100 100 BPI Express Remittance Corp. USA USA Remittance 100 100 BPI Remittance Centre (HK) Ltd. Hong Kong Remittance 100 100 Green Enterprises S. R. L. in Liquidation Italy Remittance 100 100 First Far - East Development Corporation Philippines Real estate 100 100 FEB Stock Brokers, Inc. Philippines Securities dealer 100 100 BPI Express Remittance Spain S.A Spain Remittance 100 100 FEB Speed International Philippines Remittance 100 100 AF Holdings & Management Corp. Philippines Financial management
consultancy 100 100 Ayala Plans, Inc. Philippines Pre-need 98.67 98.67 FGU Insurance Corporation Philippines Non-life insurance 94.62 94.62 BPI Century Tokyo Lease and Finance
Corporation Philippines Leasing 51 51 BPI Century Tokyo Rental Corporation Philippines Rental 51 51 CityTrust Securities Corporation Philippines Securities dealer 51 51 BPI/MS Insurance Corporation Philippines Non-life insurance 50.85 50.85
Note 2 - Assets and Liabilities Attributable to Insurance Operations Details of assets and liabilities attributable to insurance operations at December 31 are as follows:
2018 2017 (In Millions of Pesos)
Assets Cash and cash equivalents (Note 4) 89 316 Insurance balances receivable, net 5,596 5,849 Investment securities
Financial assets at fair value through profit or loss 1,788 - Financial assets at fair value through OCI 6,522 - Financial assets at amortized cost 202 - Available-for-sale securities - 5,970 Held-to-maturity securities - 2,674
Investment in associates 167 167 Accounts receivable and other assets, net 2,106 2,286 Land, building and equipment 112 144 16,582 17,406

(3)
2018 2017 (In Millions of Pesos) Liabilities Reserves and other balances 12,909 13,416 Accounts payable, accrued expenses and other payables 1,147 1,097 14,056 14,513
Details of income attributable to insurance operations before income tax and minority interest for the years ended December 31 are as follows:
2018 2017 2016 (In Millions of Pesos)
Premiums earned and related income 3,750 3,624 3,356 Investment and other income 755 864 959 4,505 4,488 4,315 Benefits, claims and maturities 2,049 2,006 2,025 Decrease in actuarial reserve liabilities (379) (524) (462) Commissions 800 789 726 Management and general expenses 799 791 656 Other expenses 13 13 10 3,282 3,075 2,955 Income before income tax and minority interest 1,223 1,413 1,360
Note 3 - Business Segments Operating segments are reported in accordance with the internal reporting provided to the chief executive officer, who is responsible for allocating resources to the reportable segments and assessing their performance. All operating segments used by the BPI Group meet the definition of a reportable segment under Philippine Financial Reporting Standards (PFRS) 8, Operating Segments. The BPI Group has determined the operating segments based on the nature of the services provided and the different clients/markets served representing a strategic business unit. The BPI Group’s main operating business segments follow:
Consumer banking - this segment addresses the individual and retail markets. It covers deposit taking and servicing, consumer lending such as home mortgages, auto loans and credit card finance as well as the remittance business. It includes the entire transaction processing and service delivery infrastructure consisting of the BPI, BPI Family Savings Bank and BPI Direct BanKo, Inc., A Savings Bank network of branches and ATMs as well as phone and internet-based banking platforms.
Corporate banking - this segment addresses both high-end corporations as well as middle market clients. It covers deposit taking and servicing, the entire lending, leasing, trade and cash management services provided by the BPI Group to corporate and institutional customers.
Investment banking - this segment includes the various business groups operating in the investment markets and dealing in activities other than lending and deposit taking. These services cover corporate finance, securities distribution, asset management, trust and fiduciary services as well as proprietary trading and investment activities.
The performance of the Parent Bank is assessed as a single unit using financial information presented in the separate or Parent only financial statements. Likewise, the chief executive officer assesses the performance of its insurance business as a separate segment from its banking and allied financial undertakings. Information on the assets, liabilities and results of operations of the insurance business is fully disclosed in Note 2.

(4)
The BPI Group and the Parent Bank mainly derive revenue (more than 90%) within the Philippines, accordingly, no geographical segment is presented. The segment report forms part of management’s assessment of the performance of the segment, among other performance indicators. There were no changes in the reportable segments during the year. Transactions between the business segments are carried out at arm’s length. Funds are ordinarily allocated between segments, resulting in funding cost transfers disclosed in inter-segment net interest income. Interest charged for these funds is based on the BPI Group’s cost of capital. Internal charges and transfer pricing adjustments have been reflected in the performance of each business. Revenue-sharing agreements are used to allocate external customer revenues to a business segment on a reasonable basis. Inter-segment revenues however, are deemed insignificant for financial reporting purposes, thus, not reported in segment analysis below. The BPI Group’s management reporting is based on a measure of operating profit comprising net interest income, impairment charge, fees and commission income, other income and operating expenses. Segment assets and liabilities comprise majority of operating assets and liabilities, measured in a manner consistent with that shown in the statements of condition, but exclude items such as taxation. The segment assets, liabilities and results of operations of the reportable segments of the BPI Group as at and for the years ended December 31 are as follows:
2018
Consumer
banking Corporate banking
Investment banking
Total per management
reporting
(In Millions of Pesos) Net interest income 33,973 11,019 16,148 61,140
Impairment charge 1,712 3,206 6 4,924
Net interest income after impairment charge 32,261 7,813 16,142 56,216
Fees, commissions and other income, net 12,292 3,260 5,280 20,832
Total income 44,553 11,073 21,422 77,048
Compensation and fringe benefits 12,554 2,132 1,002 15,688
Occupancy and equipment - related expenses 8,570 1,977 231 10,778
Other operating expenses 14,484 3,006 1,716 19,206
Total operating expenses 35,608 7,115 2,949 45,672
Operating profit 8,945 3,958 18,473 31,376
Share in net income of associates 700
Income tax expense 6,670
Total assets 534,234 1,113,367 409,797 2,057,398
Total liabilities 1,124,800 552,969 137,872 1,815,641

(5)
2017
Consumer
banking Corporate banking
Investment banking
Total per management
reporting (In Millions of Pesos) Net interest income 28,083 10,195 13,384 51,662 Impairment charge 2,085 1,710 5 3,800 Net interest income after impairment charge 25,998 8,485 13,379 47,862 Fees, commissions and other income, net 12,148 2,657 6,694 21,499 Total income 38,146 11,142 20,073 69,361 Compensation and fringe benefits 9,311 1,335 1,020 11,666 Occupancy and equipment - related expenses 4,242 1,210 125 5,577 Other operating expenses 13,512 2,706 1,652 17,870 Total operating expenses 27,065 5,251 2,797 35,113 Operating profit 11,081 5,891 17,276 34,248 Share in net income of associates 772 Income tax expense 5,956 Total assets 476,749 1,007,058 389,085 1,872,892 Total liabilities 1,063,069 550,367 85,946 1,699,382
2016
Consumer
banking Corporate banking
Investment banking
Total per management
reporting (In Millions of Pesos) Net interest income 29,225 9,724 6,374 45,323 Impairment charge 3,072 1,692 7 4,771 Net interest income after impairment charge 26,153 8,032 6,367 40,552 Fees, commissions and other income, net 10,334 2,446 10,119 22,899 Total income 36,487 10,478 16,486 63,451 Compensation and fringe benefits 9,133 1,279 1,035 11,447 Occupancy and equipment - related expenses 4,146 1,135 55 5,336 Other operating expenses 12,056 1,535 1,477 15,068 Total operating expenses 25,335 3,949 2,567 31,851 Operating profit 11,152 6,529 13,919 31,600 Share in net income of associates 814 Income tax expense 4,535 Total assets 536,231 770,413 386,550 1,693,194 Total liabilities 1,459,741 14,587 61,326 1,535,654

(6)
Reconciliation of segment results to consolidated results of operations:
2018
Total per management
reporting
Consolidation adjustments/
Others
Total per consolidated
financial statements
(In Millions of Pesos) Net interest income 61,140 (5,297) 55,843
Impairment charge 4,924 (1) 4,923
Net interest income after impairment charge 56,216 (5,296) 50,920
Fees, commissions and other income, net 20,832 1,849 22,681
Total income 77,048 (3,447) 73,601
Compensation and fringe benefits 15,688 (373) 15,315
Occupancy and equipment - related expenses 10,778 2,368 13,146
Other operating expenses 19,206 (4,065) 15,141
Total operating expenses 45,672 (2,070) 43,602
Operating profit 31,376 (1,377) 29,999
Share in net income of associates (included in Other income) 700 - 700
Income tax expense 6,670 - 6,670
Total assets 2,057,398 27,830 2,085,228
Total liabilities 1,815,641 18,049 1,833,690
2017
Total per management
reporting
Consolidation adjustments/
Others
Total per consolidated
financial statements
(In Millions of Pesos) Net interest income 51,662 (3,623) 48,039 Impairment charge 3,800 (5) 3,795 Net interest income after impairment charge 47,862 (3,618) 44,244 Fees, commissions and other income, net 21,499 1,482 22,981 Total income 69,361 (2,136) 67,225 Compensation and fringe benefits 11,666 2,231 13,897 Occupancy and equipment - related expenses 5,577 5,767 11,344 Other operating expenses 17,870 (4,578) 13,292 Total operating expenses 35,113 3,420 38,533 Operating profit 34,248 (5,556) 28,692 Share in net income of associates (included in Other income) 772 - 772 Income tax expense 5,956 - 5,956 Total assets 1,872,892 31,013 1,903,905 Total liabilities 1,699,382 20,972 1,720,354

(7)
2016
Total per management
reporting
Consolidation adjustments/
Others
Total per consolidated
financial statements
(In Millions of Pesos) Net interest income 45,323 (2,946) 42,377 Impairment charge 4,771 29 4,800 Net interest income after impairment charge 40,552 (2,975) 37,577 Fees, commissions and other income, net 22,899 1,275 24,174 Total income 63,451 (1,700) 61,751 Compensation and fringe benefits 11,447 2,016 13,463 Occupancy and equipment - related expenses 5,336 4,820 10,156 Other operating expenses 15,068 (3,746) 11,322 Total operating expenses 31,851 3,090 34,941 Operating profit 31,600 (4,790) 26,810 Share in net income of associates (included in Other income) 814 - 814 Income tax expense 4,535 - 4,535 Total assets 1,693,194 32,502 1,725,696 Total liabilities 1,535,654 22,358 1,558,012
“Consolidation adjustments/Others” pertain to balances of insurance operations, support units and inter-segment elimination in accordance with the BPI Group’s internal reporting. Note 4 - Cash and Cash Equivalents The account at December 31 consists of:
Consolidated Parent
2018 2017 2018 2017 (In Millions of Pesos) Cash and other cash items 43,536 35,132 42,419 34,160 Due from Bangko Sentral ng Pilipinas (BSP) 225,907 255,948 202,487 227,122 Due from other banks 12,477 14,406 8,615 10,894 Interbank loans receivable and securities purchased under agreements
to resell (Note 5) 31,261 16,327 19,601 8,403 Cash and cash equivalents attributable to insurance operations (Note 2) 89 316 - - 313,270 322,129 273,122 280,579

(8)
Note 5 - Interbank Loans Receivable and Securities Purchased under Agreements to Resell (SPAR) The account at December 31 consists of transactions with:
Consolidated Parent
2018 2017 2018 2017 (In Millions of Pesos)
BSP 24,791 7,297 14,000 - Other banks 9,552 11,309 8,686 10,535 34,343 18,606 22,686 10,535 Accrued interest receivable 30 21 23 10 34,373 18,627 22,709 10,545 Allowance for impairment (50) (41) (50) (41) 34,323 18,586 22,659 10,504
As at December 31, 2018, Interbank loans receivable and SPAR maturing within 90 days from the date of acquisition amounting to P31,261 million (2017 - P16,327 million) for BPI Group and P19,601 million (2017 - P8,403 million) for the Parent Bank are classified as cash equivalents in the statements of cash flows (Note 4). This account is expected to be realized as follows:
Consolidated Parent
2018 2017 2018 2017 (In Millions of Pesos)
Current (within 12 months) 34,253 18,164 22,589 10,082 Non-current (over 12 months) 120 463 120 463 34,373 18,627 22,709 10,545
Government bonds are pledged by the BSP as collateral under reverse repurchase agreements. The aggregate face value of securities pledged is equivalent to the total balance of outstanding placements as at reporting date.
The range of average interest rates (%) of interbank loans receivable and SPAR for the years ended December 31 are as follows:
Consolidated Parent
2018 2017 2018 2017 Peso-denominated 2.65 - 5.40 2.96 - 3.07 3.12 - 7.37 3.04 - 3.35 US dollar-denominated 1.50 - 2.34 0.73 - 1.04 1.50 - 2.34 0.73 - 1.04
Note 6 - Financial Assets at Fair Value through Profit or Loss (FVTPL) The account at December 31 consists of:
Consolidated Parent
Note 2018 2017 2018 2017 (In Millions of Pesos)
Debt securities Government securities 8,953 4,973 5,515 3,806 Commercial papers of private companies 3,497 29 800 -
Listed equity securities 238 330 - - Derivative financial assets 7 4,033 4,981 4,031 4,975 16,721 10,313 10,346 8,781
Financial assets at FVTPL are classified as current as of December 31, 2018 and 2017.

(9)
Note 7 - Derivative Financial Instruments
Derivatives held by the BPI Group for non-hedging purposes mainly consist of the following:
Foreign exchange forwards represent commitments to purchase or sell one currency against another at an agreed forward rate on a specified date in the future. Settlement can be made via full delivery of forward proceeds or via payment of the difference (non-deliverable forward) between the contracted forward rate and the prevailing market rate on maturity.
Foreign exchange swaps refer to spot purchase or sale of one currency against another with an offsetting agreement to sell or purchase the same currency at an agreed forward rate in the future.
Interest rate swaps refer to agreement to exchange fixed rate versus floating interest payments (or vice versa) on a reference notional amount over an agreed period of time.
Cross currency swaps refer to an exchange of notional amounts on two currencies at a given exchange rate where the parties on the transaction agree to pay a stated interest rate on the received notional amount and accept a stated interest rate on the delivered notional amount, payable and receivable or net settled (non-deliverable swaps) periodically over the term of the transaction.
The BPI Group’s credit risk represents the potential cost to replace the swap contracts if counterparties fail to fulfill their obligation. This risk is monitored on an ongoing basis with reference to the current fair value, a proportion of the notional amount of the contracts and the liquidity of the market. To control the level of credit risk taken, the BPI Group assesses counterparties using the same techniques as for its lending activities. The notional amounts of certain types of financial instruments provide a basis for comparison with instruments recognized on the statements of condition. They do not necessarily represent the amounts of future cash flows involved or the current fair values of the instruments and therefore are not indicative of the BPI Group’s exposure to credit or price risks. The derivative instruments become favorable (assets) or unfavorable (liabilities) as a result of fluctuations in market interest rates or foreign exchange rates relative to their terms. The contract/notional amount and fair values of derivative financial instruments held for trading as at December 31 are set out below: Consolidated
Contract/ Fair Values Notional Amount Assets Liabilities 2018 2017 2018 2017 2018 2017 (In Millions of Pesos)
Foreign exchange derivatives Currency swaps 100,711 153,784 1,077 2,312 830 2,117 Currency forwards 72,917 179,999 250 1,153 219 1,290 Interest rate derivatives Interest rate swap 244,715 206,493 2,702 1,478 2,839 1,377 Interest rate futures 554 - - - 3 - Warrants 9,149 - 4 - - - Credit default swaps - 499 - - - 4 Embedded credit derivatives (PAS 39) - 8,688 - 38 - - 428,046 549,463 4,033 4,981 3,891 4,788

(10)
Parent
Contract/ Fair Values Notional Amount Assets Liabilities 2018 2017 2018 2017 2018 2017 (In Millions of Pesos)
Foreign exchange derivatives Currency swaps 100,711 153,784 1,077 2,312 827 2,117 Currency forwards 72,917 179,999 250 1,153 219 1,290 Interest rate derivatives Interest rate swap 244,715 206,493 2,702 1,478 2,839 1,377 Interest rate futures 554 - - - 3 - Warrants 9,149 - 2 - - - Credit default swaps - 499 - - - 4 Embedded credit derivatives (PAS 39) - 8,688 - 32 - - 428,046 549,463 4,031 4,975 3,888 4,788
Note 8 - Financial Assets at Fair Value through Other Comprehensive Income (FVOCI) Details of the account at December 31, 2018 are as follows:
PFRS 9
Consolidated Parent
(In Millions of Pesos) Debt securities
Government securities 32,718 27,814
Commercial papers of private companies 2,695 2,090
35,413 29,904
Accrued interest receivable 118 89
35,531 29,993
Equity securities
Listed 1,129 406
Unlisted 546 184
1,675 590
37,206 30,583

(11)
Financial assets previously classified as available-for-sale (AFS) as at December 31, 2017 are as follows:
PAS 39 Consolidated Parent (In Millions of Pesos)
Debt securities Government securities 14,406 5,420 Commercial papers of private companies 4,742 4,193
19,148 9,613 Accrued interest receivable 70 56
19,218 9,669 Equity securities
Listed 3,755 447 Unlisted 661 232 4,416 679 Allowance for impairment (321) (209)
23,313 10,139 In previous years, the BPI Group reclassified certain available-for-sale securities to held-to-maturity category. The reclassification was triggered by management’s change in intention over the securities in light of volatile market prices due to rising interest rates. Until December 31, 2017, under PAS 39, fair value losses recognized in other comprehensive income at the dates of reclassification were amortized over the remaining lives of the instruments using the effective interest rate method. The relevant balances relating to the reclassified available-for-sale securities as at December 31, 2017 are summarized as follows:
The net change in fair value reserve that would have been recognized in other comprehensive income if the available-for-sale securities had not been reclassified amounts to P759 million net loss for the year ended December 31, 2017. There are no other gains or losses recognized in profit or loss apart from the amortization of fair value loss on securities. Upon adoption of PFRS 9, these securities are carried at amortized cost consistent with the business model of the BPI Group. Consequently, the cumulative loss previously recognized in other comprehensive income is adjusted against the carrying amount of the securities to establish their amortized cost on January 1, 2018 (transition date).
Date of reclassification Amount reclassified Fair value loss at
reclassification date Unamortized fair
value loss
(In Millions of Pesos) November 11, 2015 P6.9 billion 505 468 January 9, 2014 P63.5 billion 4,534 3,064 November 12, 2008 P9.2 billion 1,757 13

(12)
The account is expected to be realized as follows:
Consolidated Parent
2018 2017 2018 2017 (In Millions of Pesos) Current (within 12 months) 27,910 13,288 23,074 1,991 Non-current (over 12 months) 9,296 10,346 7,509 8,357 37,206 23,634 30,583 10,348
The range of average effective interest rates (%) of financial assets at FVOCI (2017 - AFS) for the years ended December 31 follows:
Consolidated Parent
2018 2017 2018 2017 Peso-denominated 1.18 - 4.20 0.53 - 0.85 1.65 - 5.43 1.15 - 2.28 Foreign currency-denominated 2.09 - 2.85 2.10 - 2.26 2.33 - 2.85 2.10 - 2.31
Interest income from debt instruments recognized in the statements of income for the year ended December 31, 2018 amounts to P278 million (2017 - P200 million; 2016 - P467 million) and P160 million (2017 - P323 million; 2016 - P442 million) for the BPI Group and Parent Bank, respectively. Dividend income from equity instruments recognized in the statements of income for the year ended December 31, 2018 amounts to P64 million (2017 - P53 million; 2016 - P55 million) and P41 million (2017 - P26 million; 2016 - P17 million) for the BPI Group and Parent Bank, respectively.
Note 9 - Investment Securities at Amortized cost, net Details of the account as at December 31, 2018 are as follows:
PFRS 9
Consolidated Parent
(In Millions of Pesos) Government securities 196,957 180,044
Commercial papers of private companies 86,826 83,964
283,783 264,008
Accrued interest receivable 3,790 3,491
287,573 267,499
Allowance for impairment (2) (2)
287,571 267,497

(13)
Investment securities previously classified as held-to-maturity (HTM) as at December 31, 2017 are as follows:
PAS 39 Consolidated Parent (In Millions of Pesos)
Government securities 206,098 186,816 Commercial papers of private companies 67,584 65,138 273,682 251,954 Accrued interest receivable 3,790 3,428 277,472 255,382
HTM investments were neither past due nor impaired as at December 31, 2017. The account is expected to be realized as follows (amounts gross of allowance for impairment):
Consolidated Parent
2018 2017 2018 2017 (In Millions of Pesos)
Current (within 12 months) 30,159 13,182 28,038 11,849 Non-current (over 12 months) 257,414 264,290 239,461 243,533 287,573 277,472 267,499 255,382
The range of average effective interest rates (%)for the years ended December 31 follows:
Consolidated Parent
2018 2017 2018 2017 Peso-denominated 3.53 - 3.90 3.46 - 3.65 3.55 - 3.93 3.42 - 3.61 Foreign currency-denominated 2.80 - 3.16 2.78 - 2.93 2.84 - 3.19 2.80 - 2.96
Interest income from these investment securities recognized in the statements of income for the year ended December 31, 2018 amounts to P9,035 million (2017 - P8,631 million; 2016 - P8,576 million) and P8,514 million (2017 - P7,912 million; 2016 - P7,830 million) for the BPI Group and Parent Bank, respectively.
Note 10 - Loans and Advances, net
Details of this account at December 31 are as follows:
Consolidated Parent
2018 2017 2018 2017 Corporate loans (In Millions of Pesos) Large corporate customers 1,043,855 913,529 1,019,626 891,551 Small and medium enterprise 87,998 85,324 62,058 56,358 Retail loans Credit cards 60,843 49,142 59,228 47,829 Real estate mortgages 126,088 115,772 12 22 Auto loans 51,845 53,343 - - Others 5,145 4,707 14 4,106 1,375,774 1,221,817 1,140,938 999,866 Accrued interest receivable 8,454 5,458 5,963 4,070 Unearned discount/income (6,430) (4,274) (4,978) (3,154) 1,377,798 1,223,001 1,141,923 1,000,782 Allowance for impairment (22,902) (20,663) (15,967) (13,913) 1,354,896 1,202,338 1,125,956 986,869
There were no changes in the classification and measurement of loans and advances from PAS 39 to PFRS 9.

(14)
Loans and advances aggregating P31,520 million (2017 - P280 million) are used as security for bills payable (Note 16) of the Parent Bank. Loans and advances include amounts due from related parties (Note 26). Following the adoption of PFRS 9 on January 1, 2018, the BPI Group has recognized expected credit loss (ECL) provisions (included in Miscellaneous liabilities in Note 17) on undrawn loan commitments. Details are shown below:
Consolidated Parent Corporate Retail Total Corporate Retail Total
(In Millions of Pesos) Undrawn committed credit facility 117,640 118,264 235,904 117,640 115,841 233,481
ECL provisions (65) (688) (753) (65) (658) (723)
117,575 117,576 235,151 117,575 115,183 232,758
Loans and advances are expected to be realized as follows:
Consolidated Parent
2018 2017 2018 2017 (In Millions of Pesos) Current (within 12 months) 554,183 521,688 515,723 489,240 Non-current (over 12 months) 823,615 701,313 626,200 511,542 1,377,798 1,223,001 1,141,923 1,000,782
The BPI Group, through BPI Century Tokyo Lease and Finance Corporation, mainly leases out vehicle and equipment under various finance lease agreements which typically run for a non-cancellable period of two to five years. The lease contracts generally include a lessee’s option to purchase the leased asset after the lease period at a price that generally lies between 5% to 20% of the fair value of the asset at the inception of the lease. In the event that the residual value of the leased asset exceeds the guaranteed deposit liability at the end of the lease term, the BPI Group receives additional payment from the lessee prior to the transfer of the leased asset. On the other hand, the BPI Group sets up a liability to the lessee for any excess of the guaranteed deposit liability over residual value of the leased asset. Details of finance lease receivables (included in “Corporate loans” category above) arising from lease contracts are as follows:
Consolidated
2018 2017 (In Millions of Pesos)
Total future minimum lease collections 11,203 9,102 Unearned finance income (1,321) (1,003) Present value of future minimum lease collections 9,882 8,099 Allowance for impairment (304) (251) 9,578 7,848

(15)
Details of future gross minimum lease payments receivable follow:
Consolidated 2018 2017 (In Millions of Pesos) Not later than one year 4,299 3,371 Later than one year but not later than five years 6,270 5,323 More than five years 634 408 11,203 9,102 Unearned finance income (1,321) (1,003) 9,882 8,099
There are no contingent rents arising from lease contracts outstanding at December 31, 2018 and 2017.
The range of average interest rates (%) of loans and advances for the years ended December 31 follows:
Consolidated Parent
2018 2017 2018 2017 Commercial loans Peso-denominated loans 4.11 - 5.52 3.97 - 4.19 3.98 - 5.44 3.76 - 4.02 Foreign currency-denominated loans 3.61 - 4.86 2.94 - 3.36 3.61 - 4.86 2.94 - 3.36 Real estate mortgages 6.61 - 6.97 6.60 - 7.09 7.04 - 8.00 6.67 - 8.00 Auto loans 7.46 - 10.93 9.27 - 9.41 - -
Relevant information for BSP prudential reporting Details of the loans and advances portfolio of the BPI Group at December 31 are as follows: a) Concentration as to industry/economic sector (in %)
Consolidated Parent
2018 2017 2018 2017 Real estate, renting and other related activities 23.08 22.59 16.00 15.46 Manufacturing 16.28 16.23 19.26 19.41 Wholesale and retail trade 12.56 11.50 14.16 12.96 Consumer 8.16 8.78 5.08 5.30 Financial institutions 6.09 7.56 7.28 9.11 Agriculture and forestry 2.74 3.31 3.26 3.98 Others 31.09 30.03 34.96 33.78 100.00 100.00 100.00 100.00
b) As to collateral
Consolidated Parent
2018 2017 2018 2017 (In Millions of Pesos)
Secured loans Real estate mortgage 220,587 195,432 97,170 79,768 Chattel mortgage 54,731 64,420 9 168 Others 172,503 313,441 168,260 305,296 447,821 573,293 265,439 385,232 Unsecured loans 921,523 644,250 870,521 611,480 1,369,344 1,217,543 1,135,960 996,712
Other collaterals include hold-out deposits, mortgage trust indentures, government and corporate securities and bonds, quedan/warehouse receipts, standby letters of credit, trust receipts, and deposit substitutes.

(16)
Non-performing loans net of allowance for credit losses are as follows:
Consolidated Parent
2018 2017 2018 2017 (In Millions of Pesos)
Non-performing loans (NPL) 25,391 16,255 12,985 8,038 Accounts with specific allowance for credit losses (12,597) (10,479) (8,861) (5,395) Net NPL 12,794 5,776 4,124 2,643
BSP Circular 941 Amendments to Regulations on Past Due and Non-Performing Loans states that loans, investments, receivables, or any financial asset shall be considered non-performing, even without any missed contractual payments, when it is considered impaired under existing accounting standards, classified as doubtful or loss, in litigation, and if there is an evidence that full repayment of principal and interest is unlikely without foreclosure of collateral. All other loans, even if not considered impaired, shall be considered non-performing if any principal and/or interest are unpaid for more than ninety (90) days from contractual due date, or accrued interests for more than ninety (90) days have been capitalized, refinanced, or delayed by agreement. Microfinance and other small loans with similar credit characteristics shall be considered non-performing after contractual due date or after it has become past due. Restructured loans shall be considered non-performing. However, if prior to restructuring, the loans were categorized as performing, such classification shall be retained. Note 11 - Bank Premises, Furniture, Fixtures and Equipment, net The movement analysis of the account is shown below: Consolidated
2018
Land
Buildings and leasehold
improvements
Furniture and
equipment Equipment for lease Total
(In Millions of Pesos) Cost
January 1, 2018 3,023 9,591 15,278 5,502 33,394
Additions - 1,443 2,052 1,875 5,370
Disposals (1) (145) (840) (1,765) (2,751)
Transfers 6 - 6 (32) (20)
December 31, 2018 3,028 10,889 16,496 5,580 35,993
Accumulated depreciation
January 1, 2018 - 4,849 11,749 1,739 18,337
Depreciation - 479 1,831 1,269 3,579
Amortization - 276 - - 276
Disposals - (93) (541) (1,800) (2,434)
Transfers - - 1 (18) (17)
December 31, 2018 - 5,511 13,040 1,190 19,741
Net book value, December 31, 2018 3,028 5,378 3,456 4,390 16,252

(17)
2017
Land
Buildings and leasehold
improvements
Furniture and
equipment Equipment for lease Total
(In Millions of Pesos) Cost
January 1, 2017 3,075 6,910 14,357 4,852 29,194 Additions - 1,354 1,770 2,387 5,511 Disposals (65) (189) (848) (1,734) (2,836) Transfers 13 1,798 (2) - 1,809 December 31, 2017 3,023 9,873 15,277 5,505 33,678
Accumulated depreciation January 1, 2017 - 3,110 10,687 1,588 15,385 Depreciation - 309 1,600 1,125 3,034 Amortization - 284 - - 284 Disposals - (111) (537) (971) (1,619) Transfers - 1,540 (2) - 1,538 December 31, 2017 - 5,132 11,748 1,742 18,622
Net book value, December 31, 2017 3,023 4,741 3,529 3,763 15,056 Parent
2018
Land
Buildings and leasehold
improvements
Furniture and
equipment Total (In Millions of Pesos)
Cost
January 1, 2018 2,661 8,582 13,850 25,093
Additions (1) 1,178 1,590 2,767
Disposals - (145) (732) (877)
Transfers 17 - - 17
December 31, 2018 2,677 9,615 14,708 27,000
Accumulated depreciation
January 1, 2018 - 4,492 10,696 15,188
Depreciation - 439 1,634 2,073
Amortization - 203 - 203
Disposals - (94) (516) (610)
December 31, 2018 - 5,040 11,814 16,854
Net book value, December 31, 2018 2,677 4,575 2,894 10,146

(18)
2017
Land
Buildings and leasehold
improvements
Furniture and
equipment Total (In Millions of Pesos)
Cost January 1, 2017 2,660 6,047 13,156 21,863 Additions - 1,023 1,452 2,475 Disposals - (78) (757) (835) Transfers - 1,823 - 1,823 December 31, 2017 2,660 8,815 13,851 25,326 Accumulated depreciation January 1, 2017 - 2,722 9,746 12,468 Depreciation - 270 1,437 1,707 Amortization - 233 - 233 Disposals - (41) (487) (528) Transfers - 1,541 - 1,541 December 31, 2017 - 4,725 10,696 15,421 Net book value, December 31, 2017 2,660 4,090 3,155 9,905
Depreciation is included in “Occupancy and equipment-related expenses” category in the statements of income. In 2018, the Parent Bank realized a gain of P969 million (Note 19) from the disposal of certain properties. Note 12 - Investments in Subsidiaries and Associates, net This account at December 31 consists of investments in shares of stock:
Consolidated Parent
2018 2017 2018 2017 (In Millions of Pesos)
Carrying value (net of impairment) Investments at equity method 5,659 6,386 - - Investments at cost method - - 9,942 9,043
5,659 6,386 9,942 9,043 Investments in associates accounted for using the equity method in the consolidated statements of condition follow:
Place of business/
country of incorporation
Percentage of ownership interest
Acquisition cost
Name of entity 2018 2017 2018 2017
(in %) (In Millions of
Pesos) BPI-Philamlife Assurance Corporation Philippines 47.67 47.67 371 371 AF Payments, Inc. (AFPI) Philippines 20.00 20.00 750 690 National Reinsurance Corporation of the Philippines* Philippines 13.69 13.69 204 204 Beacon Property Ventures, Inc. Philippines 20.00 20.00 72 72 CityTrust Realty Corporation Philippines 40.00 40.00 2 2 Global Payments Asia-Pacific Philippines,
Incorporated Philippines 49.00 49.00 1,342 1,342 2,741 2,681
*The Parent Bank has a significant influence due to its representation on the governing body of National Reinsurance Corporation of the Philippines

(19)
Details and movements of investments in associates accounted for using the equity method in the consolidated financial statements follow:
2018 2017 (In Millions of Pesos) Acquisition cost At January 1 2,681 2,589 Additions 60 100 Return of capital - (8) At December 31 2,741 2,681 Accumulated equity in net income At January 1 3,239 2,989 Share in net income for the year 700 772 Dividends received (675) (522) At December 31 3,264 3,239 Accumulated share in other comprehensive income (loss) At January 1 466 1,240 Share in other comprehensive loss for the year (672) (774) At December 31 (206) 466 Allowance for impairment (140) -
5,659 6,386 AFPI is an associate of BPI Payments Holdings Inc., a subsidiary of the Parent Bank. In 2018, the BPI Group recognized an allowance for impairment on its investment in AFPI in view of the latter’s recurring losses. No associate is deemed individually significant for financial reporting purposes. Accordingly, the relevant unaudited financial information of associates as at and for the years ended December 31 has been aggregated as follows:
2018 2017 (In Millions of Pesos) Total assets 122,616 125,471 Total liabilities 105,960 107,209 Total revenues 18,618 33,538 Total net income 1,425 1,486

(20)
The details of equity investments accounted for using the cost method in the separate financial statements of the Parent Bank follow:
Acquisition cost
Allowance for impairment Carrying value
2018 2017 2018 2017 2018 2017 (In Millions of Pesos)
Subsidiaries BPI Europe Plc. 1,910 1,910 - - 1,910 1,910 BPI Asset Management and Trust Corporation
(BPI AMTC) 1,502 600 - - 1,502 600 BPI Direct BanKo, Inc., A Savings Bank 1,009 1,009 - - 1,009 1,009 Ayala Plans, Inc. 863 863 - - 863 863 BPI Capital Corporation 623 623 - - 623 623 BPI Payments Holdings Inc. (BPHI) 503 443 (299) - 204 443 BPI Century Tokyo Lease and Finance Corporation 329 329 - - 329 329 FGU Insurance Corporation 303 303 - - 303 303 BPI Forex Corp. 195 195 - - 195 195 BPI Express Remittance Corp. USA 191 191 - - 191 191 BPI Family Savings Bank, Inc. 150 150 - - 150 150 BPI Remittance Centre (HK) Ltd. (BERK HK) 132 - - - 132 - First Far-East Development Corporation 91 91 - - 91 91 Green Enterprises S.R.L. in Liquidation 54 54 - - 54 54 FEB Stock Brokers, Inc. 25 25 - - 25 25 BPI Computer Systems Corp. 23 23 - - 23 23 BPI Express Remittance Spain S.A 26 26 - - 26 26 Others 321 321 - (104) 321 217
Associates 1,991 1,991 - - 1,991 1,991 10,241 9,147 (299) (104) 9,942 9,043
No non-controlling interest arising from investments in subsidiaries is deemed material to the BPI Group. In 2018, the Parent Bank made an additional capital infusion to BPHI amounting to P60 million (2017 - P103 million). Likewise, the Parent Bank in 2018, recognized impairment loss of P299 million on its investment in BPHI due financial losses incurred by BPHI’s associate, AFPI, as disclosed above. On October 17, 2018, the Parent Bank made additional investment to BPI AMTC via transfer of contractual customer relationships (included in “Intangible assets” in Note 14) valued at P902 million. On November 21, 2018, BPI International Finance Limited (included in “Others” subsidiaries in the table above) distributed its shares in BERC HK valued at P132 million as a property dividend to the Parent Bank. BERK HK became an immediate subsidiary of the Parent Bank following the property dividend declaration. The Parent Bank reversed in 2018 previously recognized impairment loss of P104 million on its investments in other smaller subsidiaries due to improvement in the investees’ operations.

(21)
Note 13 - Deferred Income Taxes The significant components of deferred income tax assets and liabilities at December 31 are as follows:
Consolidated Parent
2018 2017 2018 2017 (In Millions of Pesos) Deferred income tax assets
Allowance for credit and impairment losses 7,833 7,286 5,329 4,736 Pension liability 661 738 454 683 Provisions 329 328 248 254 Net operating loss carry over (NOLCO) - 129 - - Others 225 160 195 34
Total deferred income tax assets 9,048 8,641 6,226 5,707 Deferred income tax liabilities
Unrealized gain on property appraisal (491) (507) (491) (507) Others (21) (43) (12) (20)
Total deferred income tax liabilities (512) (550) (503) (527) Deferred income tax assets, net 8,536 8,091 5,723 5,180
Movements in net deferred income tax assets are summarized as follows:
Consolidated Parent
2018 2017 2018 2017 (In Millions of Pesos)
At January 1 8,091 7,543 5,180 4,571 Amounts recognized in statements of income 734 462 776 462 Amounts recognized in other comprehensive income (289) 86 (233) 147 At December 31 8,536 8,091 5,723 5,180
Details of deferred income tax items recognized in the statements of income are as follows:
Consolidated Parent 2018 2017 2016 2018 2017 2016 (In Millions of Pesos)
Allowance for impairment (547) (443) (377) (593) (563) (57) Provisions (1) (27) (301) 6 (9) (245) Pension 68 174 (52) 9 (65) 36 NOLCO 129 (66) - - - - Others (383) (100) (154) (198) 175 (173) (734) (462) (884) (776) (462) (439)

(22)
Details of the outstanding NOLCO at December 31 are as follows:
Consolidated Parent Year of Incurrence Year of Expiration 2018 2017 2018 2017
(In Millions of Pesos) 2017 2020 69 69 - - 2016 2019 202 202 - - 2015 2018 197 197 - - 2014 2017 - 361 - -
468 829 - - Used portion/ expired during the year (468) (361) - - NOLCO not recognized - (37) - - - 431 - - Tax rate 30% 30% 30% 30% Deferred income tax asset on NOLCO - 129 - -
Note 14 - Other Assets, net The account at December 31 consists of the following:
Consolidated Parent
2018 2017 2018 2017 (In Millions of Pesos)
Sundry debits 3,392 945 3,292 939 Intangible assets 3,070 2,454 2,416 2,413 Accounts receivable 2,761 2,781 2,509 5,233 Residual value of equipment for lease 2,601 2,242 - - Prepaid expenses 1,343 1,530 1,007 1,166 Rental deposits 671 563 573 484 Accrued trust and other fees 540 1,158 131 726 Creditable withholding tax 408 416 79 92 Investment properties 129 135 118 135 Miscellaneous assets 8,108 4,504 6,853 3,673 23,023 16,728 16,978 14,861 Allowance for impairment (824) (848) (665) (701) 22,199 15,880 16,313 14,160
Sundry debits pertain to float items arising from timing differences in recording transactions which are expected to clear within seven days.
Investment properties have aggregate fair value of P1,786 million as at December 31, 2018 (2017 - P1,281 million). The fair value of investment property is determined on the basis of valuation performed by duly accredited appraisers. The property valuation was determined mainly using the market data approach (Level 2). All investment properties generate rental income. Income from investment properties (included in “Rental income” in Note 19) recognized in the statements of income amounts to P83 million in 2018 (2017 - P16 million; 2016 - P243 million). Direct operating expenses (including repairs and maintenance) arising from these investment properties amount to P6 million in 2018 (2017 - P12 million; 2016 - P190 million).

(23)
The allowance for impairment as at December 31, 2018 and 2017 mainly pertains to accounts receivable. The reconciliation of the allowance for impairment at December 31 is summarized as follows:
Consolidated Parent
2018 2017 2018 2017 (In Millions of Pesos)
At January 1 848 1,190 701 990 Provision for (reversal of) impairment losses 89 (295) (69) (240) Transfer/reallocation (34) - 110 - Write-off (79) (47) (77) (49) At December 31 824 848 665 701
Other assets are expected to be realized as follows:
Consolidated Parent
2018 2017 2018 2017 (In Millions of Pesos)
Current (within 12 months) 17,143 11,524 14,434 11,996 Non-current (over 12 months) 5,880 5,204 2,544 2,865 23,023 16,728 16,978 14,861
Note 15 - Deposit Liabilities The account at December 31 consists of:
Consolidated Parent
2018 2017 2018 2017 (In Millions of Pesos)
Demand 256,279 252,238 245,620 241,100 Savings 883,650 860,612 778,246 751,351 Time 445,817 449,350 323,341 331,512 1,585,746 1,562,200 1,347,207 1,323,963
Deposit liabilities include amounts due to related parties (Note 26). Deposit liabilities are expected to be settled as follows:
Consolidated Parent
2018 2017 2018 2017 (In Millions of Pesos)
Current (within 12 months) 602,031 818,811 534,119 726,560 Non-current (over 12 months) 983,715 743,389 813,088 597,403 1,585,746 1,562,200 1,347,207 1,323,963

(24)
In 2017, the Parent Bank issued the first tranche of long-term negotiable certificates of deposit (LTNCD) amounting to P12.2 billion from the P30-billion facility approved by the BSP. The LTNCDs pay interest on a quarterly basis at a rate 3.7% per annum and carry a tenor of 5.5 years maturing on May 24, 2023. The proceeds from the LTNCD issuance is included in “Time deposits” category. Related interest expense on deposit liabilities is presented below:
Consolidated Parent
2018 2017 2016 2018 2017 2016 (In Millions of Pesos)
Demand 687 616 557 630 557 514 Savings 7,384 6,723 6,774 6,061 5,489 5,497 Time 13,184 9,321 7,970 8,954 5,367 3,605 21,255 16,660 15,301 15,645 11,413 9,616
Under existing BSP regulations, the BPI Group should comply with a simplified minimum reserve requirement on statutory/legal and liquidity reserves. Further, BSP requires all reserves be kept at the central bank. The reserve requirement ratio imposed on universal and commercial banks decreased to 18% from 20% effective June 1, 2018 under BSP Circular No. 1004. The BPI Group is in full compliance with the simplified reserve requirement as at December 31, 2018 and 2017. The required statutory/legal and liquidity reserves as reported to BSP at December 31 follows:
Consolidated Parent
2018 2017 2018 2017 (In Millions of Pesos) Required reserves (included in Due from BSP) 214,196 233,509 195,883 215,088
Note 16 - Bills Payable and Other Borrowed Funds The account at December 31 consists of:
Consolidated Parent
2018 2017 2018 2017 (In Millions of Pesos)
Bills payable Local banks 58,810 37,064 46,761 25,810 Foreign banks 51,813 46,453 47,841 44,912
Other borrowed funds 56,278 - 56,278 - 166,901 83,517 150,880 70,722
Bills payable Bills payable include funds borrowed from Land Bank of the Philippines (LBP), Development Bank of the Philippines (DBP) and BSP which were relent to customers of the BPI Group in accordance with the financing programs of LBP, DBP and BSP and credit balances of settlement bank accounts. The average payment term of these bills payable is 0.39 years and 0.95 years for 2018 and 2017, respectively. Loans and advances of the BPI Group arising from these financing programs serve as security for the related bills payable (Note 10). The range of average interest rates (%) of bills payable for the years ended December 31 follows:
Consolidated Parent
2018 2017 2018 2017 Private firms and local banks - Peso-denominated 2.75 - 7.35 3.22 - 4.10 2.75 - 5.06 4.26 - 4.66 Foreign banks - Foreign currency-denominated 1.32 - 4.20 1.69 - 1.82 1.32 - 3.26 1.69 - 1.82

(25)
Other borrowed funds On September 19, 2018, the BOD of the Parent Bank approved the establishment of a Peso Bond and Commercial Paper Program in the aggregate amount of up to P50,000 million. On December 6, 2018, the Parent Bank issued P25,000 million with a coupon of 6.7970% per annum, payable quarterly to mature on March 6, 2020. Likewise on June 21, 2018, the Parent Bank has established a Medium Term Note Programme in the aggregate amount of up to US$2,000 million. Under this Programme, the Parent Bank issued on September 4, 2018 US$600 million in 5-year Senior Unsecured Fixed Rate Reg S Notes with a coupon of 4.25% to mature on September 4, 2023. The proceeds from the above debt issuances are presented above as “Other borrowed funds”. Interest expense for the years ended December 31 is summarized as follows:
Consolidated Parent
2018 2017 2016 2018 2017 2016 (In Millions of Pesos)
Bills payable 2,517 1,150 634 2,013 885 406 Other borrowed funds 575 - - 575 - - 3,092 1,150 634 2,588 885 406
Bills payable and other borrowed funds are expected to be settled as follows:
Consolidated Parent
2018 2017 2018 2017 (in millions of pesos)
Current (within 12 months) 99,381 63,671 84,086 50,877 Non-current (over 12 months) 67,520 19,846 66,794 19,845 166,901 83,517 150,880 70,722
The movement in bills payable and other borrowed funds is summarized as follows:
Consolidated Parent
2018 2017 2018 2017 (In Millions of Pesos)
At January 1 83,517 61,973 70,722 52,257 Additions 706,779 365,417 651,065 331,286 Maturities (623,196) (344,043) (570,594) (313,005) Amortization of discount 121 71 120 71 Exchange differences (320) 99 (433) 113 At December 31 166,901 83,517 150,880 70,722

(26)
Note 17 - Deferred Credits and Other Liabilities The account at December 31 consists of the following:
Consolidated Parent
2018 2017 2018 2017 (In Millions of Pesos)
Bills purchased - contra 12,872 12,505 12,862 12,499 Accounts payable 8,096 5,534 5,635 3,339 Dividends payable 4,053 3,546 4,052 3,545 Deposits on lease contracts 2,438 2,136 - - Outstanding acceptances 2,394 2,992 2,394 2,992 Withholding tax payable 674 599 514 459 Due to the Treasurer of the Philippines 650 636 575 562 Other deferred credits 810 418 67 83 Miscellaneous liabilities 11,133 11,613 9,694 9,733 43,120 39,979 35,793 33,212
Bills purchased - contra represents liabilities arising from the outright purchases of checks due for clearing as a means of immediate financing offered by the BPI Group to its clients. Miscellaneous liabilities include pension liability, insurance, allowance for impairment of undrawn committed credit facilities and other employee-related payables. The account is expected to be settled as follows:
Consolidated Parent
2018 2017 2018 2017 (In Millions of Pesos)
Current (within 12 months) 41,343 36,192 34,753 31,375 Non-current (over 12 months) 1,777 3,787 1,040 1,837 43,120 39,979 35,793 33,212
Note 18 - Capital Funds a) Share capital Details of authorized share capital of the Parent Bank follow:
2018 2017 2016 (In Millions of Pesos,
except par value per share) Authorized capital (at P10 par value per share) Common shares 49,000 49,000 49,000 Preferred A shares 600 600 600 49,600 49,600 49,600

(27)
Details of outstanding common shares follow:
2018 2017 2016 (In Number of Shares)
Issued common shares At January 1 3,939,412,661 3,937,043,603 3,932,220,179 Issuance of shares during the year 563,036,840 2,369,058 4,823,424 At December 31 4,502,449,501 3,939,412,661 3,937,043,603 Subscribed common shares 6,341,738 5,785,721 6,213,433
On April 25, 2018, BPI completed its P50 billion stock rights offer, which paved the way for the issuance of 558,659,210 new common shares at P89.50 per share. The new shares were issued to shareholders as of record date April 6, 2018, at a ratio of 1:7.0594, or 1 new common share for every 7 shares held, or 14.2% of BPI’s outstanding common shares. These new shares were listed on the Philippine Stock Exchange (PSE) on May 4, 2018. BPI’s shares are listed and traded in the PSE since October 12, 1971. On February 10, 2014, additional 370,370,370 common shares were listed as a result of the stock rights offer. As at December 31, 2018, 2017 and 2016, the Parent Bank has 12,588, 11,488, and 11,596 common shareholders, respectively. There are no preferred shares issued and outstanding at December 31, 2018, 2017 and 2016. b) Reserves The account consists of:
Consolidated Parent
2018 2017 2016 2018 2017 2016 (In Millions of Pesos)
General loan loss provision (GLLP) 3,867 - - 3,867 - - Executive stock option plan amortization 105 130 100 76 108 84 Reserve for trust business 90 90 2,577 - - 2,577 Reserve for self-insurance 34 34 34 34 34 34 4,096 254 2,711 3,977 142 2,695
In 2018, the BSP issued Circular 1011 which mandates among others, banks to set up GLLP equal to 1% of all outstanding Stage 1 on-balance sheet loans, except for accounts considered as credit risk-free under existing regulations. Under the said Circular, if the PFRS 9 loan loss provision is lower than the required GLLP, the deficiency shall be recognized as an appropriation of retained earnings or surplus. Accordingly, the BPI Group appropriated P3,867 million representing the excess of GLLP over PFRS 9 loan loss provision out of surplus earnings to meet the requirement of the BSP. In compliance with existing BSP regulations, 10% of the Parent Bank’s income from trust business is appropriated to surplus reserve. This yearly appropriation is required until the surplus reserve for trust business reaches 20% of the Parent Bank’s regulatory net worth. Starting 2017, the 10% appropriation is based on the income of BPI AMTC following its spin-off. Reserve for self-insurance represents the amount set aside to cover losses due to fire, defalcation by and other unlawful acts of personnel and third parties.

(28)
Details of and movements in reserves for the years ended December 31 follow:
Consolidated Parent
2018 2017 2016 2018 2017 2016 (In Millions of Pesos)
Surplus reserves At January 1 254 2,711 2,563 142 2,695 2,555 Transfer from surplus to reserves 3,867 90 103 3,867 - - Stock option plan (25) 31 45 (32) 25 37 Transfer from reserves to surplus - (2,578) - - (2,578) 103 At December 31 4,096 254 2,711 3,977 142 2,695
The BOD of the Parent Bank approved to grant the Executive Stock Option Plan (ESOP) and Executive Stock Purchase Plan (ESPP) to qualified beneficiaries/participants up to the following number of shares for future distribution:
Date Approved ESOP shares Approved ESPP shares December 11, 2018 4,168,000 11,500,000 December 13, 2017 3,560,000 7,500,000 December 14, 2016 3,560,000 4,500,000 December 18, 2015 3,575,000 8,000,000
The ESOP has a three-year vesting period from grant date while the ESPP has a five-year payment period. The exercise price for ESOP is equal to the volume weighted average of BPI share price for the 30-trading days immediately prior to the grant date. The weighted average fair value of options granted determined using the Black-Scholes valuation model was P6.50, P17.41 and P13.83 for the years ended December 31, 2018, 2017 and 2016, respectively. Movements in the number of share options under the ESOP are summarized as follows:
2018 2017 2016 At January 1 11,338,333 9,100,000 9,225,000 Granted 3,480,000 3,485,000 - Exercised (2,786,665) (746,667) (16,667) Cancelled (258,334) (500,000) (108,333) At December 31 11,773,334 11,338,333 9,100,000 Exercisable 5,120,000 6,745,000 3,033,333
The impact of ESOP is not considered material to the financial statements, thus, the disclosures were limited only to the information mentioned above. The subscription price for ESPP is equivalent to 15% below the volume weighted average of BPI share price for the 30-trading days immediately prior to the grant date. The subscription dates for ESPP were on January 7, 2019, February 15, 2017, and January 25, 2016.

(29)
c) Accumulated other comprehensive loss Details of and movements in the account follow:
Consolidated Parent
2018 2017 2016 2018 2017 2016 (In Millions of Pesos)
Fair value reserve on available-for-sale securities
At January 1 (3,125) (3,838) (4,381) (3,275) (3,724) (4,226) Effect of PFRS 9 adoption 3, 125 - - 3,275 Unrealized fair value loss before tax - 264 (507) - 23 (133) Amount recycled to profit or loss - 447 1,072 - 424 623 Deferred income tax effect - 2 (22) - 2 12 At December 31 - (3,125) (3,838) - (3,275) (3,724)
Fair value reserve on financial assets at FVOCI Effect of PFRS 9 adoption 757 - - 210 - - Unrealized fair value loss before tax (364) - - (12) - - Amount recycled to profit or loss (390) - - (128) - - Deferred income tax effect (36) - - (1) - - At December 31 (33) - - 69 - -
Share in other comprehensive income (loss) of insurance subsidiaries At January 1 45 (158) (67) - - - Effect of PFRS 9 adoption 229 - - - Share in other comprehensive income
(loss) for the year, before tax (316) 175 (108) - - - Deferred income tax effect 6 28 17 - - - At December 31 (36) 45 (158) - - -
Share in other comprehensive income of associates At January 1 479 1,259 1,333 - - - Share in other comprehensive loss for the
year (685) (780) (74) - - - At December 31 (206) 479 1,259 - - -
Translation adjustment on foreign operations At January 1 (678) (804) (691) - - - Translation differences (26) 126 (113) - - - At December 31 (704) (678) (804) - - -
Remeasurements of defined benefit obligation, net At January 1 (1,809) (1,537) (958) (1,421) (1,083) (654) Actuarial gains (losses) for the year 877 (387) (827) 616 (358) (613) Deferred income tax effect (265) 115 248 (185) 20 184 At December 31 (1,197) (1,809) (1,537) (990) (1,421) (1,083) (2,176) (5,088) (5,078) (921) (4,696) (4,807)

(30)
d) Dividend declarations Cash dividends declared by the BOD of the Parent Bank in the years 2016 to 2018 follow:
Date declared
Amount of dividends
Per share Total
(in millions of pesos) June 15, 2016 0.90 3,543 December 14, 2016 0.90 3,543 June 15, 2017 0.90 3,545 December 15, 2017 0.90 3,546 June 20, 2018 0.90 4,052 December 19, 2018 0.90 4,052
e) Earnings per share (EPS) The calculation of EPS is shown below:
Consolidated Parent
2018 2017 2016 2018 2017 2016 (In Millions of Pesos, except earnings per share amounts)
a) Net income attributable to equity holders of the Parent Bank 23,078 22,416 22,050 15,428 22,097 20,885
b) Weighted average number of common shares outstanding during the year 4,316 3,939 3,937 4,316 3,939 3,937
c) Basic EPS (a/b) 5.35 5.69 5.60 3.57 5.61 5.30 The basic and diluted EPS are the same for the years presented as the impact of stock options outstanding is not significant to the calculation of weighted average number of common shares. Note 19 - Other Operating Income Details of other operating income follow:
Consolidated Parent
2018 2017 2016 2018 2017 2016 (In Millions of Pesos)
Credit card income 3,197 2,953 1,423 3,126 2,894 1,412 Trust and asset management fees 2,818 3,516 3,376 - 190 2,202 Rental income 1,898 1,672 1,660 254 219 328 Gain on sale of assets 1,243 1,204 668 658 302 299 Dividend income 76 68 56 904 9,492 6,083 Others 1,155 1,380 1,266 977 1,074 1,008 10,387 10,793 8,449 5,919 14,171 11,332
Dividend income recognized by the Parent Bank substantially pertains to dividend distributions of subsidiaries. Other income includes recoveries on charged-off assets and revenues from service arrangements with customers and related parties.

(31)
Note 20 - Leases The BPI Group and the Parent Bank (as lessee) have various lease agreements which mainly pertain to branch premises that are renewable under certain terms and conditions. The rentals (included in Occupancy and equipment-related expenses) under these lease contracts are as follows:
Consolidated Parent
(In Millions of Pesos) 2018 1,809 1,503
2017 1,495 1,211 2016 1,337 1,097
The future minimum lease payments under non-cancellable operating leases of the BPI Group are as follows:
2018 2017 (In Millions of Pesos)
No later than 1 year 107 90 Later than 1 year but no later than 5 years 214 186 More than 5 years 57 69 378 345
Note 21 - Operating Expenses Details of compensation and fringe benefits expenses follow:
Consolidated Parent
2018 2017 2016 2018 2017 2016 (In Millions of Pesos)
Salaries and wages 12,624 11,642 11,332 9,702 8,891 8,998 Retirement expense (Note 24) 755 720 755 608 574 602 Other employee benefit expenses 1,936 1,535 1,376 1,524 1,226 1,113 15,315 13,897 13,463 11,834 10,691 10,713
Details of other operating expenses follow:
Consolidated Parent
2018 2017 2016 2018 2017 2016 (In Millions of Pesos)
Insurance 4,105 3,940 3,426 2,789 2,448 2,160 Advertising 1,310 1,215 1,144 1,123 1,002 955 Travel and communication 1,002 902 812 825 748 687 Taxes and licenses 791 714 620 539 491 369 Management and other
professional fees 606 501 495 626 419 424 Office supplies 592 328 324 490 267 271 Supervision and examination fees 587 542 606 441 401 526 Litigation expenses 526 598 512 255 348 279 Amortization expense 293 296 312 11 289 308 Shared expenses - - - 26 16 12 Others 5,329 4,256 3,071 4,132 3,197 2,157 15,141 13,292 11,322 11,257 9,626 8,148
Other expenses mainly include fees and incentives paid to agents, outsourcing fees, freight charges and other business expense such as those incurred in staff meetings, donations, periodicals and magazines.

(32)
Note 22 - Income Taxes A reconciliation between the income tax expense at the statutory tax rate and the effective income tax for the years ended December 31 follows:
Consolidated
2018 2017 2016
Amount Rate (%) Amount
Rate (%) Amount
Rate (%)
(In Millions of Pesos) Statutory income tax 9,000 30.00 8,608 30.00 8,043 30.00 Effect of items not subject to statutory tax rate: Income subjected to lower tax rates (517) (1.72) (696) (2.42) (764) (2.85) Tax-exempt income (1,582) (5.27) (4,350) (15.16) (3,942) (14.70) Others, net (231) (0.77) 2,394 8.34 1,198 4.47 Effective income tax 6,670 22.24 5,956 20.76 4,535 16.92
Parent
2018 2017 2016
Amount Rate (%) Amount
Rate (%) Amount
Rate (%)
(In Millions of Pesos) Statutory income tax 6,134 30.00 7,765 30.00 7,267 30.00 Effect of items not subject to statutory tax rate: Income subjected to lower tax rates (519) (2.54) (606) (2.34) (669) (2.76) Tax-exempt income (495) (2.42) (2,907) (11.23) (2,577) (10.64) Others, net (103) (0.50) (466) (1.80) (683) (2.82) Effective income tax 5,017 24.54 3,786 14.63 3,338 13.78
Note 23 - Basic Quantitative Indicators of Financial Performance The key financial performance indicators follow (in %):
Consolidated Parent
2018 2017 2018 2017 Return on average equity 10.21 12.75 8.50 16.81 Return on average assets 1.20 1.27 0.96 1.54 Net interest margin 3.11 2.91 2.87 2.65

(33)
Note 24 - Retirement Plans The BPI Group maintains both defined benefit and defined contribution retirement plans. Assets of both retirement plans are held in trust and governed by local regulations and practices in the Philippines. The key terms of these pension plans are discussed below. a) Defined benefit retirement plan BPI Group (excluding insurance operations) BPI has a unified plan which covers all subsidiaries except insurance entities. Under this plan, the normal retirement age is 60 years. Normal retirement benefit consists of a lump sum benefit equivalent to 200% of the basic monthly salary of the employee at the time of his retirement for each year of service, if he has rendered at least 10 years of service, or to 150% of his basic monthly salary, if he has rendered less than 10 years of service. For voluntary retirement, the benefit is equivalent to 112.50% of the employee’s basic monthly salary for a minimum of 10 years of service with the rate factor progressing to a maximum of 200% of basic monthly salary for service years of 25 or more. Death or disability benefit, on the other hand, shall be determined on the same basis as in voluntary retirement. The net defined benefit cost and contributions to be paid by the entities within the BPI Group are determined by an independent actuary. Non-life insurance subsidiary BPI/MS has a separate trusteed defined benefit plan. Under the plan, the normal retirement age is 60 years. Normal retirement benefit consists of a lump sum benefit equivalent to 175% of the basic monthly salary of the employee at the time of his retirement for each year of service, if he has rendered as least 10 years of service, or to 150% of his basic monthly salary, if he has rendered less than 10 years of service. Death or disability benefit for all employees of the non-life insurance subsidiary shall be determined on the same basis as in normal or voluntary retirement as the case may be. Following are the amounts recognized based on recent actuarial valuations: (a) Pension liability as at December 31 recognized in the statements of condition
Consolidated Parent
2018 2017 2018 2017 (In Millions of Pesos) Present value of defined benefit obligation 10,892 12,718 9,171 10,508 Fair value of plan assets (9,851) (10,710) (8,195) (9,003) Pension liability recognized in the statements
of condition 1,041 2,008 976 1,505 Pension liability is shown as part of “Miscellaneous liabilities” within Deferred credits and other liabilities (Note 17).

(34)
The movements in plan assets are summarized as follows:
Consolidated Parent
2018 2017 2018 2017 (In Millions of Pesos) At January 1 10,710 10,084 9,003 8,543 Contributions 781 685 627 542 Interest income 616 525 513 445 Benefit payments (1,206) (1,051) (1,072) (840) Remeasurement - return on plan assets (1,050) 467 (876) 443 Transfer to defined contribution plan - - - (130) At December 31 9,851 10,710 8,195 9,003
The carrying values of the plan assets represent their fair value as at December 31, 2018 and 2017. The plan assets are comprised of the following:
Consolidated Parent
2018 2017 2018 2017 (In Millions of Pesos) Debt securities 3,054 3,786 2,540 3,183 Equity securities 4,630 4,763 3,852 4,003 Others 2,167 2,161 1,803 1,817 9,851 10,710 8,195 9,003
The plan assets of the unified retirement plan include investment in BPI’s common shares with aggregate fair value of P451 million at December 31, 2018 (2017 - P510 million). An officer of the Parent Bank exercises the voting rights over the plan’s investment in BPI’s common shares. The movements in the present value of defined benefit obligation are summarized as follows:
Consolidated Parent
2018 2017 2018 2017 (In Millions of Pesos) At January 1 12,718 11,952 10,508 9,905 Interest cost 712 607 582 501 Current service cost 659 619 539 507 Remeasurement - change in assumptions
and experience adjustment (1,991) 587 (1,386) 561 Benefit payments (1,206) (1,051) (1,072) (840) Transfers to defined contribution plan - - - (130) Other movements - 4 - 4 At December 31 10,892 12,718 9,171 10,508
The BPI Group has no other transactions with the plan other than the regular funding contributions.

(35)
(b) Expense recognized in the statements of income
Consolidated Parent
2018 2017 2016 2018 2017 2016 (In Millions of Pesos) Current service cost 659 619 649 539 507 535 Net interest cost 96 82 76 69 56 53 Settlement loss - 9 163 - 9 123 Past service cost - (5) (197) - (5) (162) 755 705 691 608 567 549
The principal assumptions used for the actuarial valuations of the unified plan are as follows:
Consolidated Parent
2018 2017 2018 2017 Discount rate 8.66% 5.87% 8.66% 5.84% Future salary increases 5.00% 5.00% 5.00% 5.00%
Assumptions regarding future mortality and disability experience are based on published statistics generally used for local actuarial valuation purposes.
The defined benefit plan typically exposes the BPI Group to a number of risks such as investment risk, interest rate risk and salary risk. The most significant of which relate to investment and interest rate risk. The present value of the defined benefit obligation is determined by discounting the estimated future cash outflows using interest rates of government bonds that are denominated in the currency in which the benefits will be paid, and that have terms to maturity approximating the terms of the related pension liability. A decrease in government bond yields will increase the defined benefit obligation although this will also be partially offset by an increase in the value of the plan’s fixed income holdings. Hence, the present value of defined benefit obligation is directly affected by the discount rate to be applied by the BPI Group. However, the BPI Group believes that due to the long-term nature of the pension liability and the strength of the BPI Group itself, the mix of debt and equity securities holdings of the plan is an appropriate element of the BPI Group’s long term strategy to manage the plan efficiently. The BPI Group ensures that the investment positions are managed within an asset-liability matching framework that has been developed to achieve long-term investments that are in line with the obligations under the plan. The BPI Group’s main objective is to match assets to the defined benefit obligation by investing primarily in long-term debt securities with maturities that match the benefit payments as they fall due. The asset-liability matching is being monitored on a regular basis and potential change in investment mix is being discussed with the trustor, as necessary to better ensure the appropriate asset-liability matching. The BPI Group contributes to the plan depending on the suggested funding contribution as calculated by an independent actuary engaged by management. The expected contributions for the year ending December 31, 2019 for the BPI Group and the Parent Bank amount to P659 million and P539 million, respectively. The weighted average duration of the defined benefit obligation under the BPI unified retirement plan as at December 31, 2018 is 8 years (2017 - 8 years).

(36)
The projected maturity analysis of retirement benefit payments as at December 31 are as follows:
Consolidated Parent
2018 2017 2018 2017 (In Millions of Pesos) Up to one year 1,310 383 1,076 317 More than 1 year to 5 years 3,632 4,905 3,036 3,863 More than 5 years to 10 years 7,437 6,398 6,388 5,531 More than 10 years to 15 years 11,116 8,844 9,310 7,333 More than 15 years to 20 years 8,014 7,507 6,869 6,189 Over 20 years 27,103 16,150 21,193 12,326
The sensitivity of the defined benefit obligation as at December 31 to changes in the weighted principal assumptions follows: Consolidated 2018
Impact on defined benefit obligation
Change in assumption
Increase in assumption Decrease in assumption
Discount rate 0.5% Decrease by 3.34% Increase by 3.57% Salary growth rate 1.0% Increase by 7.59% Decrease by 6.73% 2017
Impact on defined benefit obligation Change in assumption
Increase in assumption Decrease in assumption
Discount rate 0.5% Decrease by 3.90% Increase by 4.18% Salary growth rate 1.0% Increase by 7.66% Decrease by 6.81% Parent 2018
Impact on defined benefit obligation
Change in assumption
Increase in assumption Decrease in assumption
Discount rate 0.5% Decrease by 3.90% Increase by 4.17% Salary growth rate 1.0% Increase by 8.86% Decrease by 7.86% 2017
Impact on defined benefit obligation Change in
assumption Increase in assumption Decrease in assumption
Discount rate 0.5% Decrease by 3.92% Increase by 4.21% Salary growth rate 1.0% Increase by 7.71% Decrease by 6.86% The above sensitivity analyses are based on a change in an assumption while holding all other assumptions constant. In practice, this is unlikely to occur, and changes in some of the assumptions may be correlated. When calculating the sensitivity of the defined benefit obligation to significant actuarial assumptions, the same method (present value of the defined benefit obligation calculated with the projected unit credit method at the end of the reporting period) has been applied as when calculating the retirement liability recognized within the statements of condition.

(37)
b) Defined contribution retirement plan All non-unionized employees hired on or after the January 1, 2016 are automatically under the new defined contribution plan. Employees hired prior to the effective date shall have the option to elect to become members of the new defined contribution plan. Under the normal or late retirement, employees are entitled to a benefit equal to the total of the following amounts:
The higher between (a) cumulative fund balance equivalent to 8% of the basic monthly salary and (b) the minimum legal retirement benefit under the Labor Code
Employee contributions fund The defined contribution retirement plan has a defined benefit minimum guarantee equivalent to a certain percentage of the monthly salary payable to an employee at normal retirement age with the required credited years of service based on the provisions of Republic Act (“RA”) No. 7641. Accordingly, the liability for the defined benefit minimum guarantee is actuarially calculated similar to the defined benefit plan. The funding status of the defined contribution plan is shown below:
Consolidated Parent
2018 2017 2018 2017 (In Millions of Pesos) Fair value of plan assets 1,254 916 930 707 Present value of defined benefit obligation (298) (239) (219) (172) 956 677 711 535 Effect of asset ceiling 956 677 711 535 - - - -
The movements in the present value of the defined benefit obligation follow:
Consolidated Parent
2018 2017 2018 2017 (In Millions of Pesos) At January 1 239 235 172 192 Interest cost 15 12 10 10 Current service cost 48 43 31 29 Benefit payments (20) 3 (18) - Transfer to the Plan - - - (36) Remeasurement - change in assumptions and
experience adjustment 16 (54) 24 (23) At December 31 298 239 219 172
The movements in the fair value of plan assets follow:
Consolidated Parent
2018 2017 2018 2017 (In Millions of Pesos) At January 1 916 660 707 536 Contribution paid by employer 183 152 139 116 Interest income 62 40 48 32 Benefit payments (20) - (18) - Transfer to the plan - - 54 (36) Remeasurement - return on plan assets 113 64 - 59 At December 31 1,254 916 930 707

(38)
Total retirement expense for the year ended December 31, 2018 under the defined contribution plan for the BPI Group and Parent Bank is P43 million (2017 - P39 million) and P27 million (2017 - P26 million). The components of plan assets of the defined contributions as at December 31, 2018 are as follows:
Consolidated Parent
2018 2017 2018 2017 (In Millions of Pesos) Debt securities 966 707 716 545 Equity securities 213 155 214 120 Others 75 54 - 42 1,254 916 930 707
The weighted average duration of the defined contribution retirement plan for the BPI Group and Parent Bank is 19 years (2017 - 20 years). Note 25 - Asset Management Business At December 31, 2018, the net asset value of trust and fund assets managed by the BPI Group through BPI AMTC amounts to P591 billion (2017 - P591 billion). As required by the General Banking Act, BPI AMTC has deposited government securities with the BSP valued at P349 million (2017 - P306 million). Note 26 - Related Party Transactions In the normal course of business, the Parent Bank transacts with related parties consisting of its subsidiaries and associates. Likewise, the BPI Group has transactions with Ayala Corporation (AC) and subsidiaries (Ayala Group), on an arm's length basis. AC is a significant stockholder of BPI as at reporting date. The Parent Bank has a Board-level Related Party Transaction Committee that vets and endorses all significant related party transactions, including those involving directors, officers, stockholders and their related interests (DOSRI), for which the latter shall require final Board approval. The Committee consists of three directors, majority of whom are independent directors including the Chairman, and two non-voting members from management, namely, the Chief Audit Executive and the Chief Compliance Officer. Transactions with related parties have terms and conditions that are generally comparable to those offered to non-related parties or to similar transactions in the market.

(39)
A summary of significant related party transactions and outstanding balances as at and for the years ended December 31 is shown below (transactions with subsidiaries have been eliminated in the consolidated financial statements): Consolidated
2018
Transactions for the year
Outstanding balances
Terms and conditions
(In Millions of Pesos) Loans and advances from:
Subsidiaries (81) 53 These are loans and advances granted to related parties that are generally secured with interest rates ranging from 3.87% to 8.25% (including those pertaining to foreign currency-denominated loans) and with maturity periods ranging from 5 days to 15 years. Additional information on DOSRI loans are discussed below.
Associates 190 387
Ayala Group 5,026 32,579
Other related parties 159 461
5,294 33,480 Deposits from:
Subsidiaries 373 8,722 These are demand, savings and time deposits bearing the following average interest rates: Demand - 0.22% to 0.31% Savings - 0.62% to 0.68% Time - 2.61% to 4.37%
Associates 38 417
Ayala Group 12,263 16,804
Key management personnel 162 543
12,836 26,486
2017 Transactions
for the year Outstanding
balances
Terms and conditions (In Millions of Pesos) Loans and advances from:
Subsidiaries 59 134 These are loans and advances granted to related parties that are generally secured with interest rates ranging from 1.37% to 7.64% (including those pertaining to foreign currency-denominated loans) and with maturity periods ranging from 4 days to 14 years. Additional information on DOSRI loans are discussed below.
Associates 152 197 Ayala Group (609) 27,553 Key management personnel - - Other related parties (592) 302
(990) 28,186 Deposits from:
Subsidiaries 1,111 8,349 These are demand, savings and time deposits bearing the following average interest rates: Demand - 0.23% to 0.25% Savings - 0.70% to 0.79% Time - 2.15% to 2.22%
Associates (469) 379 Ayala Group (7,665) 4,541 Key management personnel (959) 381
(7,982) 13,650

(40)
2016 Transactions
for the year Outstanding
balances
Terms and conditions (In Millions of Pesos) Loans and advances from:
Subsidiaries 3 75 These are loans and advances granted to related parties that are generally secured with interest rates ranging from 1.63% to 7.64% (including those pertaining to foreign currency-denominated loans) and with maturity periods ranging from 5 days to 14 years. Additional information on DOSRI loans are discussed below.
Associates 45 45 Ayala Group (1,034) 28,162 Key management personnel - - Other related parties (552) 894
(1,538) 29,176 Deposits from:
Subsidiaries 146 7,238 These are demand, savings and time deposits bearing the following average interest rates: Demand - 0.23% to 0.27% Savings - 0.81% Time - 2.13% to 2.26%
Associates 135 848 Ayala Group 845 12,206 Key management personnel (545) 1,340
581 21,632 Parent
2018
Transactions for the year
Outstanding balances
Terms and conditions
(In Millions of Pesos) Loans and advances from:
Subsidiaries (81) 53 These are loans and advances granted to related parties that are generally secured with interest rates ranging from 3.87% to 8.25% (including those pertaining to foreign currency-denominated loans) and with maturity periods ranging from 5 days to 15 years. Additional information on DOSRI loans are discussed below.
Associates 190 387
Ayala Group 5,026 32,579
Key management personnel - -
Other related parties 159 461
5,294 33,480 Deposits from:
Subsidiaries 388 8,631 These are demand, savings and time deposits bearing the following average interest rates: Demand - 0.21% to 0.30% Savings - 0.58% to 0.64% Time - 2.33 to 4.67%
Associates 55 414
Ayala Group 10,446 14,974
Key management personnel 103 463
10,992 24,482

(41)
2017 Transactions
for the year Outstanding
balances
Terms and conditions (In Millions of Pesos) Loans and advances from:
Subsidiaries 59 134 These are loans and advances granted to related parties that are generally secured with interest rates ranging from 1.37% to 7.64% (including those pertaining to foreign currency-denominated loans) and with maturity periods ranging from 4 days to 14 years. Additional information on DOSRI loans are discussed below.
Associates 152 197 Ayala Group (609) 27,553 Key management personnel - - Other related parties (592) 302
(990) 28,186 Deposits from:
Subsidiaries 1,098 8,243 These are demand, savings and time deposits bearing the following average interest rates: Demand - 0.21% to 0.24% Savings - 0.66% to 0.75% Time - 1.68% to 1.80%
Associates (482) 359 Ayala Group (7,452) 4,528 Key management personnel (772) 360
(7,608) 13,490
2016 Transactions
for the year Outstanding
balances
Terms and conditions (In Millions of Pesos) Loans and advances from:
Subsidiaries 3 75 These are loans and advances granted to related parties that are generally secured with interest rates ranging from 1.63% to 7.64% (including those pertaining to foreign currency-denominated loans) and with maturity periods ranging from 5 days to 14 years. Additional information on DOSRI loans are discussed below.
Associates 45 45 Ayala Group (1,034) 28,162 Key management personnel - - Other related parties (552) 894
(1,538) 29,176 Deposits from:
Subsidiaries 141 7,145 These are demand, savings and time deposits bearing the following average interest rates: Demand - 0.22% to 0.25% Savings - 0.76% to 0.77% Time - 1.43% to 1.48%
Associates 130 841 Ayala Group 1,231 11,980 Key management personnel (641) 1,132
861 21,098

(42)
The aggregate amounts included in the determination of income before income tax (prior to elimination) that resulted from transactions with each class of related parties are as follows: Consolidated
2018 2017 2016 (In Millions of Pesos) Interest income
Subsidiaries 84 39 43 Associates 14 - - Ayala Group 1,346 966 790 Other related parties 20 15 31
1,464 1,020 864 Other income
Subsidiaries 1,801 1,485 946 Associates 1,222 977 885 Ayala Group 203 247 66
3,226 2,709 1,897 Interest expense
Subsidiaries 84 38 41 Associates 2 1 8 Ayala Group 119 21 74 Key management personnel 3 1 15
208 61 138 Other expenses
Subsidiaries 1,698 1,371 836 Associates 51 34 36 Ayala Group 501 319 269
2,250 1,724 1,141 Retirement benefits
Key management personnel 47 44 44 Salaries, allowances and other short-term benefits
Key management personnel 800 744 749 Directors’ remuneration 93 87 77

(43)
Parent
2018 2017 2016 (In Millions of Pesos) Interest income
Subsidiaries 1 3 2 Associates 14 - - Ayala Group 1,346 966 790 Other related parties 20 15 31
1,381 984 823 Other income
Subsidiaries 1,620 1,433 893 Associates 1,035 977 777 Ayala Group 137 155 -
2,792 2,565 1,670 Interest expense
Subsidiaries 84 34 39 Associates 2 1 8 Ayala Group 98 20 65 Key management personnel 3 1 14
187 56 126 Other expenses
Subsidiaries 145 27 21 Ayala Group 501 319 259
646 346 280 Retirement benefits
Key management personnel 40 37 37 Salaries, allowances and other short-term benefits
Key management personnel 697 629 604 Directors’ remuneration 77 73 67
Other income mainly consists of rental income and revenue from service arrangements with related parties. Other expenses mainly consist of rental expenses and management fees. Details of DOSRI loans are as follows:
Consolidated Parent
2018 2017 2018 2017 (In Millions of Pesos)
Outstanding DOSRI loans 8,248 4,376 8,248 4,335
In percentages (%) Consolidated Parent 2018 2017 2018 2017 % to total outstanding loans and advances 0.60 0.36 0.73 0.44 % to total outstanding DOSRI loans Unsecured DOSRI loans 21.51 29.63 21.51 29.85 Past due DOSRI loans - 0.03 - 0.03 Non-performing DOSRI loans - 0.02 - 0.02
The BPI Group is in full compliance with the General Banking Act and the BSP regulations on DOSRI loans. At December 31, 2018 and 2017.

(44)
As at December 31, 2018, allowance for credit losses amounting to P40 million (2017 - P139 million) have been recognized against receivables from related parties. Note 27 - Critical Accounting Estimates and Judgments The BPI Group makes estimates and assumptions that affect the reported amounts of assets and liabilities. Estimates and judgments are continually evaluated and are based on historical experience and other factors, including expectations of future events that are believed to be reasonable under the circumstances. It is reasonably possible that the outcomes within the next financial year could differ from assumptions made at reporting date and could result in the adjustment to the carrying amount of affected assets or liabilities. A. Critical accounting estimates (i) Measurement of the expected credit loss for loans and advances under PFRS 9 The measurement of the expected credit loss (ECL) for loans and advances is an area that requires the use of complex models and significant assumptions about future economic conditions and credit behavior (e.g. the likelihood of customers defaulting and the resulting losses). A number of significant judgements are also required in applying the accounting requirements for measuring ECL, such as:
Determining criteria for significant increase in credit risk; Choosing appropriate models and assumptions for the measurement of ECL;
Establishing the number and relative weightings of forward-looking scenarios for each type of product and the associated ECL; and
Establishing groups of similar financial assets for the purposes of measuring ECL. Forward-looking scenarios Three distinct macroeconomic scenarios (baseline, upside and downside) are considered in the BPI Group’s estimation of expected credit losses in Stage 1 and Stage 2. These scenarios are based on assumptions supported by economic theories and historical experience. The downside scenario reflects a negative macroeconomic event occurring within the first 12 months, with conditions deteriorating for up to two years, followed by a recovery for the remainder of the period. This scenario is grounded in historical experience and assumes a monetary policy response that returns the economy to a long-run, sustainable growth rate within the forecast period. The probability of each scenario is determined using expert judgment and recession probability tools provided by reputable external service providers. The baseline case incorporates the BPI Group’s outlook for the domestic and global economy. The best and worst case scenarios take into account certain adjustments that will lead to a more positive or negative economic outcome. Other forward-looking considerations not otherwise incorporated within the above scenarios, such as the impact of any regulatory, legislative or political changes is likewise considered, if material.

(45)
The most significant period-end assumptions used for the ECL estimate are set out below. The scenarios “base”, “upside” and “downside” were used for all portfolios. At December 31, 2018
Base Scenario Upside Scenario Downside Scenario Next 12
Months 2 to 5 years (Average)
Next 12 Months
2 to 5 years (Average)
Next 12 Months
2 to 5 years (Average)
Real GDP growth (%) 7.0 6.4 7.3 7.3 4.1 -1.2 Inflation Rate (%) 4.1 3.2 3.5 2.7 6.1 8.8 PDST-R2 5Y (%) 7.0 6.7 6.7 6.4 8.1 10.7 US Treasury 5Y (%) 3.2 2.4 2.7 2.2 6.0 3.7 Exchange Rate 54.638 57.796 53.620 52.812 55.829 66.661
At January 1, 2018
Base Scenario Upside Scenario Downside Scenario Next 12
Months 2 to 5 years (Average)
Next 12 Months
2 to 5 years (Average)
Next 12 Months
2 to 5 years (Average)
Real GDP growth (%) 6.5 6.7 7.7 7.9 2.0 -6.4 Inflation Rate (%) 2.8 2.6 2.1 2.0 9.6 23.6 PDST-R2 5Y (%) 5.0 6.7 4.9 6.2 18.5 36.2 US Treasury 5Y (%) 2.7 4.3 2.5 3.8 8.1 8.2 Exchange Rate 53.231 53.861 48.831 48.133 65.470 146.286
Sensitivity analysis
The loan portfolios have different sensitivities to movements in macroeconomic variables, so the above three scenarios have varying impact on the expected credit losses of BPI Group’s portfolios. The allowance for impairment is calculated as the weighted average of expected credit losses under the baseline, upside and downside scenarios. The impact of weighting these multiple scenarios was an increase in the allowance for impairment by P1,850 million from the baseline scenario as of December 31, 2018.
Transfers between stages
Transfers from Stage 1 and Stage 2 are based on the assessment of significant increase in credit risk (‘SICR’) from initial recognition, as described in Note 31.3.2.2. The impact of moving from 12 months expected credit losses to lifetime expected credit losses, or vice versa, varies by product and is dependent on the expected remaining life at the date of the transfer. Stage transfers may result in significant fluctuations in expected credit losses. Assuming all Stage 2 accounts are considered as Stage 1, allowance for impairment would have decreased by P1,436 million as at December 31, 2018. (ii) Impairment of loans and advances under PAS 39 The BPI Group reviews its loan portfolios to assess impairment on a regular basis. In determining whether an impairment loss should be recorded in profit or loss, the BPI Group makes judgments as to whether there is any observable data indicating that there is a measurable decrease in the estimated future cash flows from a portfolio of loans before the decrease can be identified with an individual loan in that portfolio. This evidence may include observable data indicating that there has been an adverse change in the payment status of borrowers in a group, or national or local economic conditions that correlate with defaults on assets in the group. Management uses estimates based on historical loss experience for loans with credit risk characteristics and objective evidence of impairment similar to those in the portfolio when scheduling its future cash flows. The methodology and assumptions used for estimating both the amount and timing of future cash flows are reviewed regularly to reduce any differences between loss estimates and actual loss experience. To the extent that the net present value of estimated cash flows of individually impaired accounts and the estimated impairment for collectively assessed accounts differs by +/- 5%, impairment provision for the year ended December 31, 2017 would be an estimated P466 million higher or lower.

(46)
(iii) Fair value of derivatives and other financial instruments (Notes 7 and 28.4) The fair values of financial instruments that are not quoted in active markets are determined by using generally accepted valuation techniques. Where valuation techniques (for example, discounted cash flow models) are used to determine fair values, they are validated and periodically reviewed by qualified personnel independent of the area that created them. Inputs used in these models are from observable data and quoted market prices in respect of similar financial instruments. All models are approved by the BOD before they are used, and models are calibrated to ensure that outputs reflect actual data and comparative market prices. Changes in assumptions about these factors could affect reported fair value of financial instruments. The BPI Group considers that it is impracticable to disclose with sufficient reliability the possible effects of sensitivities surrounding the fair value of financial instruments that are not quoted in active markets. (iv) Pension liability on defined benefit plan (Note 24) The BPI Group estimates its pension benefit obligation and expense for defined benefit pension plans based on the selection of certain assumptions used by actuaries in calculating such amounts. Those assumptions include, among others, the discount rate and future salary increases. The BPI Group determines the appropriate discount rate at the end of each year. This is the interest rate that should be used to determine the present value of estimated future cash outflows expected to be required to settle the retirement obligations. The present value of the defined benefit obligations of the BPI Group at December 31, 2018 and 2017 are determined using the market yields on Philippine government bonds with terms consistent with the expected payments of employee benefits. Plan assets are invested in either equity securities, debt securities or other forms of investments. Equity markets may experience volatility, which could affect the value of pension plan assets. This volatility may make it difficult to estimate the long-term rate of return on plan assets. Actual results that differ from the BPI Group’s assumptions are reflected as remeasurements in other comprehensive income. The BPI Group’s assumptions are based on actual historical experience and external data regarding compensation and discount rate trends. The sensitivity analysis on key assumptions is disclosed in Note 24. (v) Useful lives of bank premises, furniture, fixtures and equipment (Note 11) The BPI Group determines the estimated useful lives of its bank premises, furniture, fixtures and equipment based on the period over which the assets are expected to be available for use. The BPI Group annually reviews the estimated useful lives of bank premises, furniture, fixtures and equipment based on factors that include asset utilization, internal technical evaluation, technological changes, environmental and anticipated use of assets tempered by related industry benchmark information. It is possible that future results of operations could be materially affected by changes in these estimates brought about by changes in the factors mentioned. The BPI Group considers that it is impracticable to disclose with sufficient reliability the possible effects of sensitivities surrounding the carrying values of bank premises, furniture, fixtures and equipment. (vi) Impairment of investments subsidiaries and associates (Note 12) Impairment assessment on investments in subsidiaries (at the Parent Bank’s level) and associates (at the BPI Group level) is performed whenever events or changes in circumstances indicate that the carrying amount of an asset may not be recoverable. Impairment loss is recognized whenever the carrying amount of the asset exceeds its recoverable amount. The recoverable amount is computed based on the higher of the asset’s fair value less cost to sell or value-in-use. Recoverable amounts are estimated for individual nonfinancial assets or, if it is not possible, for the cash-generating unit to which the nonfinancial asset belongs. The carrying values of its investments in subsidiaries and associates and the related allowance for impairment losses are disclosed in Note 12.

(47)
B. Critical accounting judgments (i) Classification of investment securities (Note 9) The BPI Group follows the guidance of PFRS 9 starting January 1, 2018 in classifying financial assets at initial recognition whether it will be subsequently measured at fair value through other comprehensive income, at amortized cost, or at fair value through profit or loss. The BPI Group determines the classification based on the contractual cash flow characteristics of the financial assets and on the business model it uses to manage these financial assets. The BPI Group determines whether the contractual cash flows associated with the financial asset are solely payments of principal and interest (the “SPPI”). If the instrument fails the SPPI test, it will be measured at fair value through profit or loss. Prior to January 1, 2018, the BPI Group followed the guidance of PAS 39 in classifying its financial assets. Key judgment was applied particularly in classifying non-derivative financial assets with fixed or determinable payments and fixed maturity as held-to-maturity at amortized cost. In making this judgment, the BPI Group has assessed its intention and ability to hold such investments to maturity. (ii) Realization of deferred income tax assets (Note 13) Management reviews at each reporting date the carrying amounts of deferred tax assets. The carrying amount of deferred tax assets is reduced to the extent that the related tax assets cannot be utilized due to insufficient taxable profit against which the deferred tax assets will be applied. Management believes that sufficient taxable profit will be generated to allow all or part of the deferred income tax assets to be utilized. Note 28 - Financial Risk Management The BOD carries out its risk management function through the Risk Management Committee (RMC) of the BOD. The RMC is tasked with nurturing a culture of risk management across the enterprise. The RMC sets the risk appetite; proposes and approves risk management policies, frameworks, and guidelines; and regularly reviews risk management structures, metrics, limits, and issues across the BPI Group, in order to meet and comply with regulatory and international standards on risk measurement and management. At the management level, the Risk Management Office (RMO) is headed by the Chief Risk Officer (CRO). The CRO is ultimately responsible in leading the formulation of risk management policies and methodologies in alignment with the overall business strategy of BPI, ensuring that risks are prudently and rationally undertaken and within its risk appetite, as well as commensurate and disciplined to maximize returns on shareholders' capital. Risk management is carried out by a dedicated team of skilled risk managers and senior officers who have extensive prior operational experience. BPI’s risk managers regularly monitor key risk indicators and report exposures against carefully established financial and business risk metrics and limits approved by the RMC. Finally, independent reviews are regularly conducted by the Internal Audit group and regulatory examiners to ensure that risk controls and mitigants are in place and functioning effectively as intended. The possibility of incurring losses is, however, compensated by the possibility of earning more than expected income. Risk-taking is, therefore, not entirely negative to be avoided. Risk-taking actions present opportunities if risks are fully identified and accounted, deliberately taken, and are kept within prudent and rationalized limits. The most important financial risks that the BPI Group manages are credit risk, liquidity risk and market risk.

(48)
28.1 Credit risk The BPI Group takes on exposure to credit risk, which is the risk that may arise if a borrower or counterparty fails to meet its obligations in accordance with agreed terms. Credit risk is the single largest risk for the BPI Group’s business; management therefore carefully manages its exposure to credit risk as governed by relevant regulatory requirements and international benchmarks. Credit risk may also arise due to substantial exposures to a particular counterparty which the BPI Group manages by adopting proper risk controls and diversification strategies to prevent undue risk concentrations from excessive exposures to particular counterparties, industries, countries or regions. The most evident source of credit risk is loans and advances; however, other sources of credit risk exist throughout the activities of the BPI Group, including in credit-related activities recorded in the banking, investment securities in the trading books and off-balance sheet transactions. 28.1.1 Credit risk management The Credit Policy and Risk Management division supports the Credit Committees in coordination with various business lending and operations units in managing credit risk, and reports are regularly provided to Senior Management and the Board of Directors. A rigorous control framework is applied in the determination of ECL models. The BPI Group has policies and procedures that govern the calculation of ECL. All ECL models are regularly reviewed by the Risk Management Office to ensure that necessary controls are in place and the models are applied accordingly. The review and validation are performed by groups that are independent of the team that prepares the calculations, e.g., Risk Models Validation and Internal Auditors. Expert judgements on measurement methodologies and assumptions are reviewed by a group of internal experts from various functions. The BPI Group employs a range of policies and practices to mitigate credit risk. The BPI Group monitors its portfolio based on different segmentation to reflect the acceptable level of diversification and concentration. Credit concentration arises from substantial exposures to particular counterparties. Concentration risk in credit portfolios is inherent in banking and cannot be totally eliminated. However, said risk may be reduced by adopting proper risk control and diversification strategies to prevent undue risk concentrations from excessive exposures to particular counterparties, industries, countries or regions. The BPI Group structures the levels of credit risk it undertakes by placing limits on the amount of risk accepted in relation to one borrower, or groups of borrowers, and to geographical and industry segments. Such risks are monitored on a regular basis and subjected to annual or more frequent review, when deemed necessary. Limits on large exposures and credit concentration are approved by the BOD through the RMC. The exposure to any one borrower is further restricted by sub-limits covering on- and off-balance sheet exposures. Actual exposures against limits are monitored regularly. Settlement risk arises in any situation where a payment in cash, securities, foreign exchange currencies, or equities is made in the expectation of a corresponding receipt in cash, securities, foreign exchange currencies, or equities. Daily settlement limits are established for each counterparty to cover the aggregate of all settlement risk arising from the BPI Group’s market transactions on any single day. For certain securities, the introduction of the delivery versus payment facility in the local market has brought down settlement risk significantly.

(49)
The BPI Group employs a range of policies and practices to mitigate credit risk. Some of these specific control and risk mitigation measures are outlined below: (a) Collateral or guarantees
One of the most traditional and common practice in mitigating credit risk is requiring security particularly for loans and advances. The BPI Group implements guidelines on the acceptability of specific classes of collateral for credit risk mitigation. The BPI Group assesses the valuation of the collateral obtained as part of the loan origination process. This assessment is reviewed periodically. The common collateral types for loans and advances are:
Mortgages over physical properties (e.g., real estate and personal);
Mortgages over financial assets (e.g., guarantees); and
Margin agreement for derivatives, for which the BPI Group has also entered into master netting agreements
In order to minimize credit loss, the BPI Group seeks additional collateral from the counterparty when impairment indicators are observed for the relevant individual loans and advances. The BPI Group’s policies regarding obtaining collateral have not significantly changed during the reporting period and there has been no significant change in the overall quality of the collaterals held by the BPI Group since the prior period. (b) Derivatives The BPI Group maintains market limits on net open derivative positions (i.e., the difference between purchase and sale contracts). Credit risk is limited to the net current fair value of instruments, which in relation to derivatives is only a portion of the contract, or notional values used to express the volume of instruments outstanding. This credit risk exposure is managed as part of the overall lending limits with customers, together with potential exposures from market movements. Collateral or other security is not usually obtained for credit risk exposures on these instruments (except where the BPI Group requires margin deposits from counterparties). (c) Master netting arrangements The BPI Group further restricts its exposure to credit losses by entering into master netting arrangements with certain counterparties with which it undertakes a significant volume of transactions. Master netting arrangements do not generally result in an offset of balance sheet assets and liabilities, as transactions are usually settled on a gross basis. However, the credit risk associated with favorable contracts (asset position) is reduced by a master netting arrangement to the extent that if a default occurs, all amounts with the counterparty are terminated and settled on a net basis. The BPI Group’s overall exposure to credit risk on derivative instruments subject to master netting arrangements can change substantially within a short period, as it is affected by each transaction subject to the arrangement.
(d) Credit-related commitments Documentary and commercial letters of credit - which are written undertakings by the BPI Group on behalf of a customer authorizing a third party to draw drafts on the BPI Group up to a stipulated amount under specific terms and conditions - are collateralized by the underlying shipments of goods to which they relate and therefore carry less risk than a direct loan.

(50)
28.1.2 Credit risk rating The BPI Group uses internal credit risk gradings that reflect its assessment of the probability of default of individual counterparties. The BPI Group use internal rating models tailored to the various categories of counterparty. Borrower and loan specific information collected at the time of application (such as disposable income, and level of collateral for retail exposures; and turnover and industry type for wholesale exposures) is fed into this rating model. In addition, the models enable expert judgement from the Credit Review Officer to be fed into the final internal credit rating for each exposure. This allows for considerations which may not be captured as part of the other data inputs into the model. The BPI Group has put in place a credit classification system to promptly identify deteriorating exposures and to determine the appropriate credit losses. Classification is being done on the basis of BPI Group’s existing internal credit risk rating system, credit models or determined using reputable external rating agencies. The following are the considerations observed by the BPI Group in classifying its exposures:
Standard monitoring refers to accounts which do not have a greater-than-normal risk and do not possess the characteristics of special monitoring and defaulted loans. The counterparty has the ability to satisfy the obligation in full and therefore minimal loss, if any, is anticipated.
Special monitoring are accounts which need closer and frequent monitoring to prevent any further deterioration of the credit. The counterparty is assessed to be vulnerable to highly vulnerable and its capacity to meet its financial obligations is dependent upon favorable business, financial, and economic conditions.
Default refers to accounts which exhibit probable to severe weaknesses wherein possibility of non-repayment of loan obligation is ranging from high to extremely high severity.
The mapping of internal credit risk ratings (CRRs) with the BPI Group’s standard account classification is shown below: i. Corporate (including cross-border loans) and SMEs loans
The BPI Group’s internal credit risk rating system comprises a 30-scale rating with eighteen (18) ‘pass’ rating levels for large corporate accounts; 14-scale rating system with ten (10) ‘pass’ rating grades for SME; and 26-scale rating system with thirteen (13) pass ratings for cross-border accounts mapped based on reputable external rating agency. The BPI Group uses the following set of classification:
Classifications Large Corporate loans Cross-Border Loans SME Loans
Standard monitoring
AAA to B- or unrated and based on prescribed days past
due (dpd) threshold
Investment Grade (IG) or Non-IG with no SICR; or based on prescribed dpd threshold
AAA to B- or unrated and based on
prescribed dpd threshold
Special monitoring CCC to C or based on prescribed dpd threshold
Non-IG with SICR but assessed to be non-impaired; based on prescribed dpd threshold
CCC to C or based on prescribed dpd
threshold
Default Adversely Classified Accounts (ACA) or based on prescribed dpd
threshold or Item in Litigation (IL)
Default, with objective evidence of impairment; or based on prescribed dpd threshold
ACA or based on prescribed dpd threshold or IL

(51)
ii. Retail loans
The BPI Group uses automated scoring models to assess the level of risk for retail accounts. Behavioral indicators are considered in conjunction with other forward-looking information (e.g., industry forecast) to assess the level of risk of a loan. After the date of initial recognition, the payment behavior of the borrower is monitored on a periodic basis to develop a behavioral score which is mapped to a PD.
Classifications Credit cards Personal, auto and
housing loans SEME
Standard monitoring Current to 29 dpd Current to 30 dpd Current to 7 dpd
Special monitoring 30 to 89 dpd 31 to 90 dpd Not applicable
Default 90 dpd and up or IL >90, IL, Loss 8 dpd and up
iii. Treasury and other investment debt securities Investments in high grade securities and bills are viewed as a way to gain better credit quality mix and at the same time, maintain a readily available source to meet funding requirements. The level of credit risk for treasury and other investment debt securities and their associated probability of default (PD) are determined using reputable external ratings and/or available and reliable qualitative and quantitative information. In the absence of credit ratings, a comparable issuer or guarantor rating is used. Should there be a change in the credit rating of the chosen comparable, evaluation is made to ascertain whether the rating change is applicable to the security being assessed for impairment.
Classifications Credit Risk Grade following S&P or its equivalent
Standard monitoring IG (AAA to BBB-)
Special monitoring Non-IG (BB+ to C)
Default Default (D)
iv. Other financial assets at amortized cost
For other financial assets (accounts receivable, accrued interest and fees receivable, sales contract receivable, rental deposits), the BPI Group applies the PFRS 9 simplified approach to measuring expected credit losses which uses a lifetime expected credit loss methodology. These financial assets are grouped based on shared risk characteristics and aging profile. For some of these, impairment is assessed individually at a counterparty level. 28.1.3 Maximum exposure to credit risk Credit risk exposures relating to loans and advances are as follows:
Consolidated Parent
2018 2017 2018 2017 (In Millions of Pesos) Corporate and SME loans, net 1,122,610 986,332 1,074,782 938,337 Retail loans, net 232,286 216,006 51,174 48,532 1,354,896 1,202,338 1,125,956 986,869

(52)
The carrying amount of loans and advances above also represents the BPI Group’s maximum exposure to credit risk. The following tables contain an analysis of the credit risk exposure of each financial instrument for which an ECL allowance is recognized. Credit quality of loans and advances, net Consolidated Corporate and SME loans
2018 2017
ECL Staging
Total Stage 1
12-month ECL Stage 2
Lifetime ECL Stage 3
Lifetime ECL Total (In Millions of Pesos) Credit grade Standard monitoring 1,034,673 23,243 - 1,057,916 937,103 Special monitoring 48,392 16,077 - 64,469 52,765 Default - - 13,564 13,564 8,877 Gross carrying amount 1,083,065 39,320 13,564 1,135,949 998,745 Loss allowance (5,768) (1,843) (5,728) (13,339) (12,413) Carrying amount 1,077,297 37,477 7,836 1,122,610 986,332
Retail loans
2018 2017
ECL Staging
Total Stage 1
12-month ECL Stage 2
Lifetime ECL Stage 3
Lifetime ECL Total (In Millions of Pesos) Credit grade Standard monitoring 217,645 8,531 - 226,176 209,621 Special monitoring 1,002 5,727 - 6,729 6,598 Default - - 8,944 8,944 8,037 Gross carrying amount 218,647 14,258 8,944 241,849 224,256 Loss allowance (4,114) (1,405) (4,044) (9,563) (8,250) Carrying amount 214,533 12,853 4,900 232,286 216,006
Undrawn committed credit facilities
2018
ECL Staging
Stage 1
12-month ECL Stage 2
Lifetime ECL Stage 3
Lifetime ECL Total
(In Millions of Pesos) Credit grade Standard monitoring 232,257 74 - 232,331 Special monitoring 3,246 264 - 3,510 Default - - 63 63 Gross carrying amount 235,503 338 63 235,904
Loss allowance (710) (30) (13) (753) Carrying amount 234,793 308 50 235,151

(53)
Parent Corporate and SME loans
2018 2017
ECL Staging
Total Stage 1
12-month ECL Stage 2
Lifetime ECL Stage 3
Lifetime ECL Total (In Millions of Pesos) Credit grade Standard monitoring 995,540 22,727 - 1,018,267 896,166 Special monitoring 43,147 14,737 - 57,884 46,122 Default - - 9,772 9,772 6,538 Gross carrying amount 1,038,687 37,464 9,772 1,085,923 948,826 Loss allowance (5,108) (1,734) (4,299) (11,141) (10,489) Carrying amount 1,033,579 35,730 5,473 1,074,782 938,337
Retail loans
2018 2017
ECL Staging
Total Stage 1
12-month ECL Stage 2
Lifetime ECL Stage 3
Lifetime ECL Total (In Millions of Pesos) Credit grade Standard monitoring 51,886 338 - 52,224 48,223 Special monitoring 203 935 - 1,138 1,089 Default - - 2,638 2,638 2,645 Gross carrying amount 52,089 1,273 2,638 56,000 51,956 Loss allowance (1,839) (482) (2,505) (4,826) (3,424) Carrying amount 50,250 791 133 51,174 48,532
Undrawn committed credit facilities
2018
ECL Staging
Stage 1
12-month ECL Stage 2
Lifetime ECL Stage 3
Lifetime ECL Total
(In Millions of Pesos) Credit grade Standard monitoring 229,849 69 - 229,918 Special monitoring 3,242 258 - 3,500 Default - - 63 63 Gross carrying amount 233,091 327 63 233,481
Loss allowance (682) (28) (13) (723) Carrying amount 232,409 299 50 232,758

(54)
The tables below present the gross amount of loans and advances that were Stage 2 accounts (PFRS 9) and past due but not impaired (PAS 39). Consolidated
2018 (PFRS 9) 2017 (PAS 39) Corporate
and SME loans Retail loans Total
Corporate and SME
loans Retail loans Total (In Millions of Pesos) In Millions of Pesos) Current 35,632 5,697 41,329 - - - Past due up to 30 days 175 2,834 3,009 645 507 1,152 Past due 31 - 90 days 3,513 5,727 9,240 348 1,446 1,794 Past due 91 - 180 days - - - 913 7 920 Over 180 days - - - 375 - 1,475
39,320 14,258 53,578 2,281 1,960 5,341 Parent
2018 (PFRS 9) 2017 (PAS 39) Corporate
and SME loans Retail loans Total
Corporate and SME
loans Retail loans Total (In Millions of Pesos) (In Millions of Pesos) Current 34,696 241 34,937 - - - Past due up to 30 days 47 97 144 392 63 455 Past due 31 - 90 days 2,721 935 3,656 149 1,006 1,155 Past due 91 - 180 days - - - 391 - 391 Over 180 days - - - 118 - 118
37,464 1,273 38,737 1,050 1,069 2,119 Treasury and other investment securities Credit risk exposures relating to treasury and other investment securities are as follows:
Consolidated Parent
2018 2017 2018 2017 (In Millions of Pesos) Due from BSP 225,907 255,948 202,487 227,122 Due from other banks 12,477 14,406 8,615 10,894 Interbank loans receivable and SPAR 34,323 18,586 22,659 10,504 Financial assets at FVTPL 16,483 9,983 10,346 8,781 Financial assets at FVOCI 35,531 - 29,993 - Investment securities at amortized cost 287,571 - 267,497 - Available-for-sale - debt securities - 19,218 - 9,669 Held-to-maturity securities - 277,472 - 255,382 612,292 595,613 541,597 522,352

(55)
Credit quality of treasury and other investment securities Consolidated
2018 2017
ECL Staging
Total Stage 1
12-month ECL Stage 2
Lifetime ECL Stage 3
Lifetime ECL Total (In Millions of Pesos) Credit grade Standard monitoring
Due from BSP 225,907 - - 225,907 255,948 Due from other banks 12,480 - - 12,480 14,406 Interbank loans receivable and
SPAR 34,306 - - 34,306 18,627 Financial assets at FVTPL 16,483 - - 16,483 9,983 Financial assets at FVOCI 35,531 - - 35,531 - Investment securities at
amortized cost 287,573 - - 287,573
- Available-for-sale - debt
securities - - -
-
19,218 Held-to-maturity securities - - - - 277,472
Default Interbank loans receivable and
SPAR - - 67 67 - Gross carrying amount 612,280 - 67 612,347 595,654 Loss allowance (5) - (50) (55) (41) Carrying amount 612,275 - 17 612,292 595,613
Parent
2018 2017
ECL Staging
Total Stage 1
12-month ECL Stage 2
Lifetime ECL Stage 3
Lifetime ECL Total (In Millions of Pesos) Credit grade Standard monitoring
Due from BSP 202,487 - - 202,487 227,122 Due from other banks 8,615 - - 8,615 10,894 Interbank loans receivable and
SPAR 22,642 - - 22,642
10,545 Financial assets at FVTPL 10,346 - - 10,346 8,781 Financial assets at FVOCI 29,993 - - 29,993 - Investment securities at
amortized cost 267,499 - - 267,499
- Available-for-sale - debt
securities - -
- -
9,669 Held-to-maturity securities - - - - 255,382
Default Interbank loans receivable and
SPAR - - 67 67
- Gross carrying amount 541,582 - 67 541,649 522,393 Loss allowance (2) - (50) (52) (41) Carrying amount 541,580 - 17 541,597 522,352

(56)
Other financial assets Other financial assets that are exposed to credit risk are as follows:
Consolidated Parent
2018 2017 2018 2017 (In Millions of Pesos) Other financial assets Accounts receivable, net 1,916 2,030 1,315 4,618 Other accrued interest and fees receivable 671 634 573 598 Sales contracts receivable, net 541 279 360 279
Rental deposits 360 563 131 484 Others, net 2,179 1,170 2,047 1,172 5,667 4,676 4,426 7,151
The carrying amounts of the above financial assets represent the BPI Group’s maximum exposure to credit risk. The BPI Group’s other financial assets (shown under Other assets, net) generally arise from transactions with various unrated counterparties with good credit standing. The BPI Group the applies the PFRS 9 simplified approach to measuring expected credit losses which uses a lifetime expected loss methodology for other financial assets. To measure the expected credit losses, other financial assets have been grouped based on shared credit risk characteristics and the days past due. The expected loss rates are based on the payment profiles of receivables over a period of 36 month before December 31, 2018 or January 1, 2018 and corresponding historical credit losses experienced within these periods. The impact of forward-looking variables on macroeconomic factors is considered insignificant in calculating ECL provisions for other financial assets. Off-balance sheet items Credit risk exposures relating to off-balance sheet items are as follows:
Consolidated Parent
2018 2017 2018 2017 (In Millions of Pesos) Undrawn loan commitments 300,721 160,030 295,744 157,338 Unused letters of credit 22,064 17,971 22,064 17,971 Others 685 1,189 685 1,189 323,470 179,190 318,493 176,498

(57)
28.1.4 Credit impaired loans and advances The BPI Group closely monitors collaterals held for financial assets considered to be credit-impaired, as it becomes more likely that the BPI Group will take possession of collateral to mitigate potential credit losses. Financial assets that are credit-impaired and related collateral held in order to mitigate potential losses are shown below: Consolidated
2018 (PFRS 9) 2017 (PAS 39) Gross
exposure Impairment allowance
Carrying amount Gross exposure
(In Millions of Pesos) Credit-impaired assets Corporate and SME loans 13,564 5,728 7,836 9,191 Retail loans 8,944 4,044 4,900 2,040 Total credit-impaired assets 22,508 9,772 12,736 11,231 Fair value of collateral 12,611 6,444
Parent
2018 (PFRS 9) 2017 (PAS 39) Gross
exposure Impairment allowance
Carrying amount Gross exposure
(In Millions of Pesos) Credit-impaired assets Corporate and SME loans 9,772 4,299 5,473 6,630 Retail loans 2,638 2,505 133 1,936 Total credit-impaired assets 12,410 6,804 5,606 8,566 Fair value of collateral 7,704 6,252
The BPI Group acquires assets by taking possession of collaterals held as security for loans and advances. As at December 31, 2018, the BPI Group’s foreclosed collaterals have carrying amount of P3,363 million (2017 - P3,578 million). The related foreclosed collaterals have aggregate fair value of P9,859 million (2017 - P9,864 million). Foreclosed collaterals include real estate (land, building, and improvements), auto and chattel. Repossessed properties are sold as soon as practicable and are classified as Assets held for sale in the statements of condition. 28.1.5 Loss allowance The loss allowance recognized in the period is impacted by a variety of factors, as described below:
Transfers between Stage 1 and Stages 2 or 3 due to financial instruments experiencing significant increases (or decreases) of credit risk or becoming credit-impaired in the period, and the consequent “step up” (or “step down”) between 12-month and Lifetime ECL;
Additional allowances for new financial instruments recognized during the period, as well as releases for financial instruments de-recognized in the period;
Impact on the measurement of ECL due to changes in PDs, EADs and LGDs in the period;
Impacts on the measurement of ECL due to changes made to models and assumptions;
Foreign exchange translations for assets denominated in foreign currencies and other movements; and
Financial assets derecognized during the period and write-offs of allowances related to assets that were written off during the period.

(58)
The following tables summarize the changes in the loss allowance for loans and advances between the beginning and the end of the annual period:
Consolidated
Stage 1 Stage 2 Stage 3
Corporate and SME loans 12-month
ECL Lifetime ECL Lifetime
ECL Total
(In Millions of Pesos) Loss allowance, at January 1, 2018 6,905 1,136 4,372 12,413 Provision for impairment for the year
Transfers: Transfer in (out of) Stage 1 (1,344) 1,661 1,701 2,018 Transfer in (out of) Stage 2 161 (661) 161 (339) Transfer in (out of) Stage 3 - - (3) (3)
New financial assets originated 3,761 - - 3,761 Financial assets derecognized during the period (1,951) (250) (515) (2,716) Changes in model assumptions (1,782) (49) 331 (1,500) (1,155) 701 1,675 1,221
Write-offs and other movements 18 6 (319) (295) Loss allowance, at December 31, 2018 5,768 1,843 5,728 13,339
Stage 1 Stage 2 Stage 3
Retail loans 12-month
ECL Lifetime ECL Lifetime
ECL Total
(In Millions of Pesos) Loss allowance, at January 1, 2018 3,148 1,188 3,925 8,261 Provision for impairment for the year
Transfers: Transfer in (out of) Stage 1 (686) 983 1,866 2,163 Transfer in (out of) Stage 2 36 (509) 392 (81) Transfer in (out of) Stage 3 18 42 (337) (277)
New financial assets originated 861 - - 861 Financial assets derecognized during the period (145) (95) (661) (901) Changes in model assumptions 1,085 (210) 643 1,518 1,169 211 1,903 3,283
Write-offs and other movements (203) 6 (1,784) (1,981) Loss allowance, at December 31, 2018 4,114 1,405 4,044 9,563
Parent
Stage 1 Stage 2 Stage 3
Corporate and SME loans 12-month
ECL Lifetime ECL Lifetime
ECL Total
(In Millions of Pesos) Loss allowance, at January 1, 2018 6,332 1,029 3,128 10,489 Provision for impairment for the year
Transfers: Transfer in (out of) Stage 1 (1,053) 1,575 1,223 1,745 Transfer in (out of) Stage 2 133 (621) 104 (384) Transfer in (out of) Stage 3 - - - -
New financial assets originated 3,286 - - 3,286 Financial assets derecognized during the period (1,824) (213) (311) (2,348) Changes in models assumptions (1,783) (42) 388 (1,437) (1,241) 699 1,404 862
Write-offs and other movements 17 6 (233) (210) Loss allowance, at December 31, 2018 5,108 1,734 4,299 11,141

(59)
Stage 1 Stage 2 Stage 3
Retail loans 12-month
ECL Lifetime ECL Lifetime
ECL Total
(In Millions of Pesos) Loss allowance, at January 1, 2018 929 205 2,290 3,424 Provision for impairment for the year
Transfers: Transfer in (out of) Stage 1 (309) 413 1,255 1,359 Transfer in (out of) Stage 2 16 (119) 194 91 Transfer in (out of) Stage 3 1 1 (22) (20)
New financial assets originated 137 - - 137 Financial assets derecognized during the period (41) (20) (496) (557) Changes in models assumptions 1,106 2 686 1,794
910 277 1,617 2,804 Write-offs and other movements - - (1,402) (1,402) Loss allowance, at December 31, 2018 1,839 482 2,505 4,826
In 2018, the BPI Group’s corporate loan portfolio expanded by 15% consistent with its organic loan growth strategy resulting to an increase in loss allowance. The reconciliation of allowance for impairment by class at December 31, 2017 follows:
Consolidated Parent
PAS 39
Corporate and SME
loans Retail loans Total
Corporate and SME
loans Retail loans Total (In Millions of Pesos) In Millions of Pesos) At January 1 10,968 7,708 18,676 8,890 2,838 11,728 Provision for (reversal of)
impairment losses 1,765 2,552 4,317 1,896 1,984 3,880 Write-off and other
movements (320) (2,010) (2,330) (297) (1,398) (1,695) 12,413 8,250 20,663 10,489 3,424 13,913
No movement analysis of allowance for impairment for treasury and other investment debt securities and other financial assets subject to impairment as the related loss allowance is deemed insignificant for financial reporting purposes. Write-off policy The BPI Group writes off financial assets when it has exhausted all practical recovery efforts and has concluded there is no reasonable expectation of recovery. Indicators that there is no reasonable expectation of recovery include (i) ceasing enforcement activity and (ii) where the BPI Group’s recovery method is foreclosing on collateral and the value of the collateral is such that there is no reasonable expectation of recovering in full. The BPI Group may write-off financial assets that are still subject to enforcement activity. The write-off of loans is approved by the BOD in compliance with the BSP requirements. Loans written-off in 2018 are fully covered with allowance.

(60)
28.1.6 Concentrations of risks of financial assets with credit risk exposure The BPI Group’s main credit exposure at their carrying amounts, as categorized by industry sectors follow: Consolidated
PFRS 9 Financial
institutions Consumer Manufacturing Real estate Others Less -
allowance Total (In Millions of Pesos) Due from BSP 225,907 - - - - - 225,907 Due from other banks 12,480 - - - - (3) 12,477 Interbank loans receivable
and SPAR 34,373 - - - - (50) 34,323 Financial assets at FVTPL 4,682 99 3 3 11,696 - 16,483 Financial assets at FVOCI 2,411 - 52 - 33,068 - 35,531 Investment securities at
amortized cost, net 65,164 680 4,714 1,777 215,238 (2) 287,571 Loans and advances, net 85,441 110,627 226,604 317,595 637,531 (22,902) 1,354,896 Other financial assets - - - - 6,225 (558) 5,667
At December 31, 2018 430,458 111,406 231,373 319,375 903,758 (23,515) 1,972,855
PAS 39 Financial
institutions Consumer Manufacturing Real estate Others Less -
allowance Total (In Millions of Pesos) Due from BSP 255,948 - - - - - 255,948 Due from other banks 14,406 - - - - - 14,406 Interbank loans receivable
and SPAR 18,586 - - - - - 18,586 Financial assets at FVTPL
Derivative financial assets 4,786 10 155 - 24 - 4,975 Trading securities - debt
securities - - 1 28 4,973 5,002 Available-for-sale securities 4,672 - 90 103 14,353 - 19,218 Held-to-maturity securities 52,583 704 3,911 1,657 218,617 - 277,472 Loans and advances, net 92,472 107,355 198,550 276,262 548,362 (20,663) 1,202,338 Other financial assets - - - - 5,233 (557) 4,676 At December 31, 2017 443,453 108,069 202,707 278,050 791,562 (21,220) 1,802,621
Parent
PFRS 9 Financial
institutions Consumer Manufacturing Real estate Others Less -
allowance Total (In Millions of Pesos) Due from BSP 202,487 - - - - - 202,487 Due from other banks 8,615 - - - - - 8,615 Interbank loans receivable
and SPAR 22,709 - - - - (50) 22,659 Financial assets at FVTPL 4,679 99 2 - 5,566 - 10,346 Financial assets at FVOCI 1,952 - 52 - 27,989 - 29,993 Investment securities at amortized cost, net 63,541 - 4,487 1,777 197,694 (2) 267,497 Loans and advances, net 83,098 57,991 219,927 182,685 598,222 (15,967) 1,125,956 Other financial assets - - - - 4,816 (390) 4,426
At December 31, 2018 387,081 58,090 224,468 184,462 834,287 (16,409) 1,671,979

(61)
PAS 39 Financial
institutions Consumer Manufacturing Real estate Others Less -
allowance Total (In Millions of Pesos) Due from BSP 227,122 - - - - - 227,122 Due from other banks 10,894 - - - - - 10,894 Interbank loans receivable
and SPAR 10,504 - - - - - 10,504 Financial assets at FVTPL
Derivative financial assets 4,786 10 155 - 24 - 4,975
Trading securities - debt securities - - - - 3,806 - 3,806
Available-for-sale securities 4,157 - 50 - 5,462 - 9,669
Held-to-maturity securities 50,717 - 3,838 1,657 199,170 - 255,382 Loans and advances, net 91,123 52,184 194,294 154,682 508,499 (13,913) 986,869 Other financial assets - - - - 7,563 (412) 7,151 At December 31, 2017 399,303 52,194 198,337 156,339 724,524 (14,325) 1,516,372
Financial assets at FVTPL, financial assets at FVOCI (2017 - available-for-sale) and investments securities at amortized cost (2017 - held-to-maturity securities) under “Others” category include local and US treasury bills. Likewise, Loans and advances under the same category pertain to loans granted to borrowers belonging to various industry sectors. 28.2 Market risk The BPI Group is exposed to market risk - the risk that the fair value or future cash flows of a financial instrument will fluctuate because of changes in market prices. Market risk is managed by the RMO guided by policies and procedures approved by the RMC and confirmed by the Executive Committee/BOD. Market risk management Market risk management is incumbent on the BOD through the RMC. Market risk management in BPI covers managing exposures to trading risk, foreign exchange risk, counterparty credit risk, interest rate risk of the banking book and liquidity risk. At the management level, the BPI Group’s market risk exposures are managed by the RMO, headed by the Parent Bank’s CRO who reports directly to the RMC. In addition, the Internal Audit is responsible for the independent review of risk assessment measures and procedures and the control environment. The BPI Group reviews and controls market risk exposures of both its trading and non-trading portfolios. Trading portfolios include those positions arising from the BPI Group’s market-making transactions. Non-trading portfolios primarily arise from the interest rate management of the BPI Group’s retail and commercial banking assets and liabilities. The BPI Group has exposures in interest rate swaps, currency swaps and structured notes as part of its trading and position taking activities. Derivatives while used to hedge open exposures to mitigate price risk inherent in the BPI Group's portfolios do not qualify as accounting hedges. Value-at-Risk (VaR) measurement is an integral part of the BPI Group’s market risk control system. This metric estimates, at 99% confidence level, the maximum loss that a trading portfolio may incur over a trading day. This metric indicates as well that there is 1% statistical probability that the trading portfolios’ actual loss would be greater than the computed VaR. In order to ensure model soundness, the VaR is periodically subject to model validation and back testing. VaR is supplemented by other risk metrics and measurements that would provide preliminary signals to Treasury and to the management to assess the vulnerability of Bank’s positions. To control the risk, the RMC sets risk limits for trading portfolios which are consistent with the BPI Group’s goals, objectives, risk appetite, and strategies.

(62)
Stress tests indicate the potential losses that could arise in extreme conditions that would have detrimental effect to the Bank’s positions. The Bank periodically performs stress testing (price risk and liquidity risk) to assess the Bank’s condition on assumed stress scenarios. Contingency plans are frequently reviewed to ensure the Bank’s preparedness in the event of real stress. Results of stress tests are reviewed by Senior Management and by the RMC. The average daily VaR for the trading portfolios are as follows:
Consolidated Parent
2018 2017 2018 2017 (In Millions of Pesos)
Local fixed-income 33 48 25 38 Foreign fixed-income 168 47 154 37 Foreign exchange 44 51 9 11 Derivatives 95 67 95 67 Equity securities 28 14 - - Mutual fund 7 3 - - 375 230 283 153

(63)
28.2.1 Foreign exchange risk Foreign exchange risk is the risk that the fair value or future cash flows of financial instrument will fluctuate because of changes in foreign exchange rates. It arises on financial instruments that are denominated in a foreign currency. As at reporting date, the BPI Group is mainly exposed to movements of US Dollar (USD) against the Philippine Peso. The table below summarizes the BPI Group’s exposure to foreign currency exchange rate risk at December 31. Consolidated
2018 (PFRS 9) 2017 (PAS 39)
USD Others* Total USD Others* Total (In Millions of Pesos) As at December 31, 2018 Financial Assets Cash and other cash items 2,742 752 3,494 2,328 304 2,632 Due from other banks 6,749 2,620 9,369 9,620 2,496 12,116 Interbank loans receivable and
SPAR 6,639 146 6,785 10,047 175 10,222 Financial assets at FVTPL 8,491 119 8,610 2,687 383 3,070 Financial assets at FVOCI -
debt securities 25,385 172 25,557 - - - Investment securities at amortized cost 127,260 1,507 128,767 - - -
Available-for-sale - debt securities - - - 7,933 827 8,760
Held-to-maturity securities - - - 109,117 1,702 110,819 Loans and advances, net 145,995 4,970 150,965 136,100 4,431 140,531 Others financial assets 1,230 106 1,336 504 105 609 Total financial assets 324,491 10,392 334,883 278,336 10,423 288,759 Financial Liabilities Deposit liabilities 241,547 6,692 248,239 238,610 6,892 245,502 Derivative financial liabilities 1,967 118 2,085 1,429 285 1,714 Bills payable 82,692 458 83,150 46,820 585 47,405 Due to BSP and other banks 1,250 - 1,250 578 - 578 Manager’s checks and
demand drafts outstanding 87 61 148 469 5 474 Other financial liabilities
Accounts payable 119 3 122 201 1 202 Total financial liabilities 327,662 7,332 334,994 288,107 7,768 295,875 Net on-balance sheet position (3,171) 3,060 (111) (9,771) 2,655 (7,116) “Others” category includes financial instruments denominated in JPY, EUR and GBP.

(64)
Parent
2018 (PFRS 9) 2017 (PAS 39)
USD Others* Total USD Others* Total
(In Millions of Pesos) As at December 31, 2018 Financial Assets Cash and other cash items 2,552 751 3,303 2,128 299 2,427 Due from other banks 4,874 2,269 7,143 7,238 - 7,238 Interbank loans receivable and
SPAR 5,260 - 5,260 8,240 - 8,240 Financial assets at FVTPL 5,144 119 5,263 2,687 383 3,070 Financial assets at FVOCI -
debt securities 25,132 172 25,304 - - - Investment securities at amortized cost 117,143 220 117,363 - - -
Available-for-sale - debt securities - - - 5,250 827 6,077
Held-to-maturity securities - - - 99,360 412 99,772 Loans and advances, net 144,486 4,787 149,273 134,977 3,841 138,818 Others financial assets 1,220 90 1,310 491 79 570 Total financial assets 305,811 8,408 314,219 260,371 5,841 266,212 Financial Liabilities Deposit liabilities 227,621 6,442 234,063 225,244 6,637 231,881 Derivative financial liabilities 1,967 115 2,082 1,429 285 1,714 Bills payable 79,178 - 79,178 43,562 - 43,562 Due to BSP and other banks 1,250 - 1,250 578 - 578 Manager’s checks and
demand drafts outstanding 81 61 142 461 5 466 Other financial liabilities 20,947 1,500 22,447
Accounts payable 117 2 119 198 1 199 Total financial liabilities 331,161 8,120 339,281 271,472 6,928 278,400 Net on-balance sheet position (25,350) 288 (25,062) (11,101) (1,087) (12,188) “Others” category includes financial instruments denominated in JPY, EUR and GBP.
Presented below is a sensitivity analysis demonstrating the impact on pre-tax income of reasonably possible change in the exchange rate between US Dollar and Philippine Peso. The fluctuation rate is based on the historical movement of US Dollar year on year.
Year
Change in currency
Effect on pre-tax income (in millions of pesos)
Consolidated Parent 2018 +/- 1.92% -/+ 71 -/+ 95
2017 +/- 1.17% -/+ 114 -/+ 130

(65)
28.2.2 Interest rate risk Interest rate risk is the risk that cash flows or fair value of a financial instruments will fluctuate due to movements in market interest rates. Interest rate risk in the banking book arises from the BPI Group’s core banking activities. The BPI Group is subject to re-pricing risk arising from financial assets and liabilities that have different maturities and are re-priced taking into account the prevailing market interest rates. The BPI Group employs two methods to measure the potential impact of interest rate risk in Group’s financial positions - (i) one that focuses on the economic value of the banking book, and (ii) one that focuses on net interest earnings. The RMC sets limits on the two interest rate risk metrics which are monitored monthly by the Market Risk Division of the RMO. Balance Sheet Value-at-Risk (BSVaR) The BSVaR is a metric to measure the impact of interest rate movements on the economic value of banking book. The BSVaR is founded on re-pricing gaps, or the difference between the amounts of rate-sensitive financial assets and liabilities. The BSVaR, therefore, estimates the “riskiness of the balance sheet” and compares the degree of risk taking activity in the banking books from one period to the next. The BSVaR assumes a static balance sheet, i.e., there will be no new transactions moving forward and no portfolio rebalancing will be undertaken in response to future changes in market rates. In consideration of the static framework and the fact that incomes from the banking book is accrued rather than generated from marking-to-market, the probable loss that is estimated by the BSVaR is not realized in accounting income. Prescribed limits for the BPI Group and each legal entity are based on estimated equity duration, assumed movement of market rates (in basis points) and estimated equity value. As at December 31, the average BSVaR, computed on a monthly basis, for the banking or non-trading book are as follows:
Consolidated Parent
2018 2017 2018 2017 (In Millions of Pesos)
BSVaR 15,507 10,586 13,483 9,310 Earnings-at-Risk (EaR) The EaR is a metric that measures the potential deterioration in the BPI Group’s net interest income due to changes in interest rates. The BPI Group’s earnings are affected when movements in borrowing and lending rates are not perfectly synchronized, which create a gap due to such mismatch. Based on the banking book positions as at particular valuation dates, the BPI Group projects interest inflows from its financial assets, and interest outflows on its financial liabilities, in the next 12 months. Net interest income - the difference between interest receipts and payments - is projected in this exercise. On a group level, the BPI Group is positively gapped hence increase in rates becomes beneficial to the BPI Group. As of December 31, 2018, the net interest income impact of movement in interest rates amounts to P806 million (2017 - P406 million).

(66)
The table below summarizes the BPI Group’s exposure to interest rate risk, categorized by the earlier of contractual repricing or maturity dates. Consolidated
Repricing PFRS 9
Up to 1 year
Over 1 up to 3 years
Over 3 years
Non-repricing
Total
(In Millions of Pesos) As at December 31, 2018 Financial Assets
Cash and other cash items - - - 43,536 43,536
Due from BSP - - - 225,907 225,907
Due from other banks - - - 12,477 12,477
Interbank loans receivable and SPAR - - - 34,323 34,323
Financial assets at FVTPL 70 1,172 1,125 14,116 16,483
Financial assets at FVOCI - - - 35,531 35,531
Investment securities at amortized cost - 1 - 287,570 287,571
Loans and advances, net 828,847 130,082 270,105 125,862 1,354,896
Other financial assets - - - 5,667 5,667
Total financial assets 828,917 131,255 271,230 784,989 2,016,391
Financial Liabilities Deposit liabilities 602,032 831,505 152,209 - 1,585,746
Derivative financial liabilities 43 1,204 1,279 1,365 3,891
Bills payable and other borrowed funds 20,915 10,516 - 135,470 166,901
Due to BSP and other banks - - - 3,988 3,988
Manager’s checks and demand drafts outstanding - - - 6,931 6,931
Other financial liabilities - - - 19,313 19,313
Total financial liabilities 622,990 843,225 153,488 167,067 1,786,770
Total interest gap 205,927 (711,970) 117,742 617,922 229,661

(67)
Repricing
PAS 39
Up to 1 year Over 1 up to 3
years
Over 3 years Non-
repricing
Total (In Millions of Pesos) As at December 31, 2017 Financial Assets Cash and other cash items - - - 35,132 35,132 Due from BSP - - - 255,948 255,948 Due from other banks - - - 14,406 14,406 Interbank loans receivable and SPAR - - - 18,586 18,586 Financial assets at FVTPL Derivative financial assets 73 327 1,110 3,465 4,975
Trading securities - debt securities - - - 5,002 5,002 Available-for-sale - debt securities 1,991 245 - 16,982 19,218 Held-to-maturity securities - 1 - 277,471 277,472 Loans and advances, net 744,317 79,649 267,120 111,252 1,202,338 Other financial assets - - - 4,676 4,676 Total financial assets 746,381 80,222 268,230 742,920 1,837,753 Financial Liabilities Deposit liabilities 818,811 556,700 186,689 - 1,562,200 Derivative financial liabilities 46 263 1,072 3,407 4,788 Bills payable - 19,846 - 63,671 83,517 Due to BSP and other banks - - - 1,218 1,218 Manager’s checks and demand drafts
outstanding - - - 7,022 7,022 Other financial liabilities - - - 15,461 15,461 Total financial liabilities 818,857 576,809 187,761 90,779 1,674,206 Total interest gap (72,476) (496,587) 80,469 652,141 163,547

(68)
Parent
Repricing PFRS 9
Up to 1 year
Over 1 up to 3 years
Over 3 years
Non-repricing
Total
(In Millions of Pesos) As at December 31, 2018 Financial Assets
Cash and other cash items - - - 42,419 42,419
Due from BSP - - - 202,487 202,487
Due from other banks - - - 8,615 8,615
Interbank loans receivable and SPAR - - - 22,659 22,659
Financial assets at FVTPL 70 1,172 1,125 7,979 10,346
Financial assets at FVOCI - - - 29,993 29,993
Investment securities at amortized cost - 1 - 267,496 267,497
Loans and advances, net 757,320 81,133 224,477 63,026 1,125,956
Other financial assets - - - 4,426 4,426
Total financial assets 757,390 82,306 225,602 649,100 1,714,398
Financial Liabilities
Deposit liabilities 534,119 708,636 104,452 - 1,347,207
Derivative financial liabilities 43 1,204 1,279 1,362 3,888
Bills payable and other borrowed funds 20,915 10,516 - 119,449 150,880
Due to BSP and other banks - - - 3,988 3,988
Manager’s checks and demand drafts outstanding - - - 5,354 5,354
Other financial liabilities - - - 13,408 13,408
Total financial liabilities 555,077 720,356 105,731 143,561 1,524,725
Total interest gap 202,313 (638,050) 119,871 505,539 189,673

(69)
Repricing PAS 39
Up to 1 year
Over 1 up to 3 years
Over 3 years
Non-repricing
Total
(In Millions of Pesos) As at December 31, 2017 Financial Assets Cash and other cash items - - - 34,160 34,160 Due from BSP - - - 227,122 227,122 Due from other banks - - - 10,894 10,894 Interbank loans receivable and SPAR - - - 10,504 10,504 Financial assets at FVTPL
Derivative financial assets 73 327 1,110 3,465 4,975 Trading securities - debt securities - - - 3,806 3,806
Available-for-sale - debt securities 1,991 245 - 7,433 9,669 Held-to-maturity securities - 1 - 255,381 255,382 Loans and advances, net 679,036 37,490 216,993 53,350 986,869 Other financial assets - - - 7,151 7,151 Total financial assets 681,100 38,063 218,103 613,266 1,550,532 Financial Liabilities Deposit liabilities 726,560 494,304 103,099 - 1,323,963 Derivative financial liabilities 46 263 1,072 3,407 4,788 Bills payable - 19,846 - 50,876 70,722 Due to BSP and other banks - - - 1,218 1,218 Manager’s checks and demand drafts
outstanding - - - 5,762 5,762 Other financial liabilities - - - 11,118 11,118 Total financial liabilities 726,606 514,413 104,171 72,381 1,417,571 Total interest gap (45,506) (476,350) 113,932 540,885 132,961
28.3 Liquidity risk Liquidity risk is the risk that the BPI Group will be unable to meet its payment obligations associated with its financial liabilities when they fall due, and to replace funds when they are withdrawn. The consequence may be the failure to meet obligations to repay depositors and fulfill commitments to lend. The BPI Group’s liquidity profile is observed and monitored through its metric, the Minimum Cumulative Liquidity Gap (MCLG). The MCLG is the smallest net cumulative cash inflow (if positive) or the largest net cumulative cash outflow (if negative) over the next three (3) months. The MCLG indicates the biggest funding requirement in the short term and the degree of liquidity risk present in the current cash flow profile of the BPI Group. A red flag is immediately raised and reported to management and the RMC when the MCLG level projected over the next 3 months is about to breach the RMC-prescribed MCLG limit. 28.3.1 Liquidity risk management process The BPI Group’s liquidity management process, as carried out within the BPI Group and monitored by the RMC includes:
Day-to-day funding, managed by monitoring future cash flows to ensure that requirements can be met. This includes replenishment of funds as they mature or as borrowed by customers;
Maintaining a portfolio of highly marketable assets that can easily be liquidated as protection against any unforeseen interruption to cash flow;
Monitoring liquidity gaps against internal and regulatory requirements;
Managing the concentration and profile of debt maturities; and
Performing periodic liquidity stress testing on the BPI Group’s liquidity position by assuming a faster rate of withdrawals in its deposit base.

(70)
Monitoring and reporting take the form of cash flow measurement and projections for the next day, week and month as these are key periods for liquidity management. The starting point for these projections is an analysis of the contractual maturity of the financial liabilities (Notes 28.3.3 and 28.3.4) and the expected collection date of the financial assets. The BPI Group also monitors unmatched medium-term assets, the level and type of undrawn lending commitments, the usage of overdraft facilities and the impact of contingent liabilities such as standby letters of credit. 28.3.2 Funding approach Sources of liquidity are regularly reviewed by the BPI Group to maintain a wide diversification by currency, geography, counterparty, product and term. 28.3.3 Non-derivative cash flows The tables below present the maturity profile of non-derivative financial instruments based on undiscounted cash flows, including interest, which the BPI Group uses to manage the inherent liquidity risk. The maturity analysis is based on the remaining period from the end of the reporting period to the contractual maturity date or, if earlier, the expected date the financial asset will be realized or the financial liability will be settled. Consolidated
PFRS 9
Up to 1 year Over 1 up to
3 years
Over 3 years
Total (In Millions of Pesos) As at December 31, 2018 Financial Assets
Cash and other cash items 43,536 - - 43,536
Due from BSP 225,923 - - 225,923
Due from other banks 12,477 - - 12,477
Interbank loans receivable and SPAR 35,028 12 135 35,175
Financial assets at FVTPL 8,740 1,231 4,170 14,141
Financial assets at FVOCI 29,154 1,601 7,730 38,485
Investment securities at amortized cost 42,442 59,550 251,643 353,635
Loans and advances, net 580,825 205,331 604,684 1,390,840
Other financial assets 5,667 - - 5,667
Total financial assets 983,792 267,725 868,362 2,119,879
Financial Liabilities
Deposit liabilities 923,895 878,739 195,585 1,998,219
Bills payable and other borrowed funds 97,507 77,117 475 175,099
Due to BSP and other banks 3,988 - - 3,988
Manager’s checks and demand drafts outstanding 6,931 - - 6,931
Other financial liabilities 19,313 - - 19,313
Total financial liabilities 1,051,634 955,856 196,060 2,203,550
Total maturity gap (67,842) (688,131) 672,302 (83,671)

(71)
PAS 39
Up to 1 year Over 1 up to
3 years
Over 3 years
Total (In Millions of Pesos) As at December 31, 2017 Financial Assets Cash and other cash items 35,132 - - 35,132 Due from BSP 255,965 - - 255,965 Due from other banks 14,406 - - 14,406 Interbank loans receivable and SPAR 19,457 217 306 19,980 Financial assets at FVTPL
Trading securities - debt securities 1,959 601 3,140 5,700 Available-for-sale - debt securities 10,489 2,931 7,734 21,154 Held-to-maturity securities 29,157 58,551 260,276 347,984 Loans and advances, net 661,461 179,426 532,172 1,373,059 Other financial assets 4,676 - - 4,676 Total financial assets 1,032,702 241,726 803,628 2,078,056 Financial Liabilities Deposit liabilities 714,564 733,100 142,546 1,590,210 Bills payable 64,511 20,207 - 84,718 Due to BSP and other banks 1,218 - - 1,218 Manager’s checks and demand drafts
outstanding 7,022 - - 7,022 Other financial liabilities 15,461 - - 15,461 Total financial liabilities 802,776 753,307 142,546 1,698,629 Total maturity gap 229,926 (511,581) 661,082 379,427
Parent
PFRS 9
Up to 1 year
Over 1 up to 3 years
Over 3 years
Total
(In Millions of Pesos) As at December 31, 2018 Financial Assets
Cash and other cash items 42,419 - - 42,419
Due from BSP 202,487 - - 202,487
Due from other banks 8,615 - - 8,615
Interbank loans receivable and SPAR 22,705 12 135 22,852
Financial assets at FVTPL 2,530 1,229 4,169 7,928
Financial assets at FVOCI 23,926 1,392 7,390 32,708
Investment securities at amortized cost 39,473 50,821 239,775 330,069
Loans and advances, net 520,744 145,807 479,908 1,146,459
Other financial assets, net 4,426 - - 4,426
Total financial assets 867,325 199,261 731,377 1,797,963
Financial Liabilities
Deposit liabilities 814,358 726,595 116,373 1,657,326
Bills payable and other borrowed funds 85,037 76,747 - 161,784
Due to BSP and other banks 3,988 - - 3,988
Manager’s checks and demand drafts outstanding 5,354 - - 5,354
Other financial liabilities 13,408 - - 13,408
Total financial liabilities 922,145 803,342 116,373 1,841,860
Total maturity gap (54,820) (604,081) 615,004 (43,897)

(72)
PAS 39
Up to 1 year
Over 1 up to 3 years
Over 3 years
Total
(In Millions of Pesos) As at December 31, 2017 Financial Assets Cash and other cash items 34,160 - - 34,160 Due from BSP 227,122 - - 227,122 Due from other banks 10,894 - - 10,894 Interbank loans receivable and SPAR 10,140 217 306 10,663 Financial assets at FVTPL
Trading securities - debt securities 1,697 197 2,449 4,343 Available-for-sale - debt securities 2,344 2,400 6,538 11,282 Held-to-maturity securities 26,387 52,523 242,121 321,031 Loans and advances, net 604,818 129,349 415,758 1,149,925 Other financial assets, net 7,151 - - 7,151 Total financial assets 924,713 184,686 667,172 1,776,571 Financial Liabilities Deposit liabilities 607,581 626,359 105,246 1,339,186 Bills payable 51,553 20,207 - 71,760 Due to BSP and other banks 1,218 - - 1,218 Manager’s checks and demand drafts
outstanding 5,762 - - 5,762 Other financial liabilities 11,118 - - 11,118 Total financial liabilities 677,232 646,566 105,246 1,429,044 Total maturity gap 247,481 (461,880) 561,926 347,527
28.3.4 Derivative cash flows
(a) Derivatives settled on a net basis
The BPI Group’s derivatives that are settled on a net basis consist of interest rate swaps, non-deliverable forwards and non-deliverable swaps. The table below presents the contractual undiscounted cash flows of interest rate swaps based on the remaining period from December 31 to the contractual maturity dates that are subject to offsetting, enforceable master netting arrangements and similar agreements.
Consolidated and Parent
PFRS 9
Up to 1 year Over 1 up to
3 years Over 3 years
Total
2018 (In Millions of Pesos) Interest rate swap contracts - held for trading
- Inflow 99 1,285 1,317 2,701
- Outflow (59) (1,296) (1,485) (2,840)
- Net inflow 40 (11) (168) (139)
Non-deliverable forwards and swaps - held for trading - Inflow 36,071 2,103 3,680 41,854
- Outflow (35,972) (2,120) (3,680) (41,772)
- Net outflow 99 (17) - 82

(73)
PAS 39
Up to 1 year
Over 1 up to 3 years
Over 3 years
Total
2017 (In Millions of Pesos) Interest rate swap contracts - held for trading
- Inflow 73 319 1,114 1,506 - Outflow (46) (245) (1,090) (1,381) - Net inflow 27 74 24 125
Non-deliverable forwards and swaps - held for trading - Inflow 30,387 - - 30,387 - Outflow (30,661) - - (30,661) - Net outflow (274) - - (274)
(b) Derivatives settled on a gross basis
The BPI Group’s derivatives that are settled on a gross basis include foreign exchange derivatives mainly currency forwards and currency swaps. The table below presents the contractual undiscounted cash flows of foreign exchange derivatives based on the remaining period from reporting date to the contractual maturity dates. Consolidated and Parent
Up to 1 year
Over 1 up to 3 years
Over 3 years Total
(In Millions of Pesos) Foreign exchange derivatives - held for trading
2018 (PFRS 9) - Inflow 127,002 4,184 - 131,186
- Outflow (127,082) (4,136) - (131,218)
- Net inflow (outflow) (80) 48 - (32)
2017 (PAS 39) - Inflow 178,511 99 - 178,610 - Outflow (178,183) (100) - (178,283) - Net inflow (outflow) 328 (1) - 327

(74)
28.4 Fair value of financial assets and liabilities
The following tables present the carrying value and fair value hierarchy of the BPI Group’s assets and liabilities at December 31: Consolidated
Carrying Amount
Fair value 2018 (PFRS 9) Level 1 Level 2 Total
Recurring measurements (In Millions of Pesos) Financial assets Financial assets at FVTPL Derivative financial assets 4,033 - 4,033 4,033
Trading assets
- Debt securities 12,450 11,656 794 12,450
- Equity securities 238 238 - 238
Financial assets at FVOCI -
- Debt securities 35,531 35,089 442 35,531
- Equity securities 1,675 1,129 546 1,675
53,927 48,112 5,815 53,927
Financial liabilities
Derivative financial liabilities 3,891 - 3,891 3,891
Non-recurring measurements
Assets held for sale, net 3,363 - 9,859 9,859
Carrying Amount
Fair value 2018 (PFRS 9) Level 1 Level 2 Total
Fair values disclosed (In Millions of Pesos) Financial assets
Cash and other cash items 43,536 - 43,536 43,536
Due from BSP 225,907 - 225,907 225,907
Due from other banks 12,477 - 12,480 12,480
Interbank loans receivable and SPAR 34,323 - 34,373 34,373
Investment securities at amortized cost 287,571 254,850 3,802 258,652
Loans and advances, net 1,354,896 - 1,362,803 1,362,803
Other financial assets 5,667 - 5,667 5,667 Financial liabilities
Deposit liabilities 1,585,746 - 1,585,746 1,585,746
Bills payable and other borrowed funds 166,901 - 163,545 163,545
Due to BSP and other banks 3,988 - 3,988 3,988
Manager’s checks and demand drafts outstanding
6,931 - 6,931 6,931
Other financial liabilities 19,313 - - 19,313 Non-financial assets
Investment properties 129 - 1,786 1,786

(75)
Carrying Amount
Fair value 2017 (PAS 39) Level 1 Level 2 Total Recurring measurements (In Millions of Pesos) Financial assets Financial assets at FVTPL Derivative financial assets 4,975 - 4,975 4,975 Trading securities - Debt securities 5,002 4,973 29 5,002 - Equity securities 330 330 - 330
Available-for-sale securities - Debt securities 19,218 16,981 2,237 19,218 - Equity securities 4,095 3,755 661 4,416
33,620 26,039 7,908 33,941 Financial liabilities
Derivative financial liabilities 4,788 - 4,788 4,788 Non-recurring measurements
Assets held for sale, net 3,578 - 9,864 9,864
Carrying Amount
Fair value 2017 (PAS 39) Level 1 Level 2 Total Fair values disclosed (In Millions of Pesos) Financial assets
Cash and other cash items 35,132 - 35,132 35,132 Due from BSP 255,948 - 255,948 255,948 Due from other banks 14,406 - 14,406 14,406 Interbank loans receivable and SPAR 18,586 - 18,586 18,586 Investment securities at amortized cost 277,472 264,379 3,922 268,301 Loans and advances, net 1,202,338 - 1,250,321 1,250,321 Other financial assets 4,676 - 4,676 4,676
Financial liabilities Deposit liabilities 1,562,200 - 1,562,200 1,562,200 Bills payable 83,517 - 83,154 83,154 Due to BSP and other banks 1,218 - 1,218 1,218 Manager’s checks and demand drafts
outstanding 7,022 - 7,022 7,022 Other financial liabilities 15,461 - 15,461 15,461
Non-financial assets Investment properties 135 - 1,281 1,281
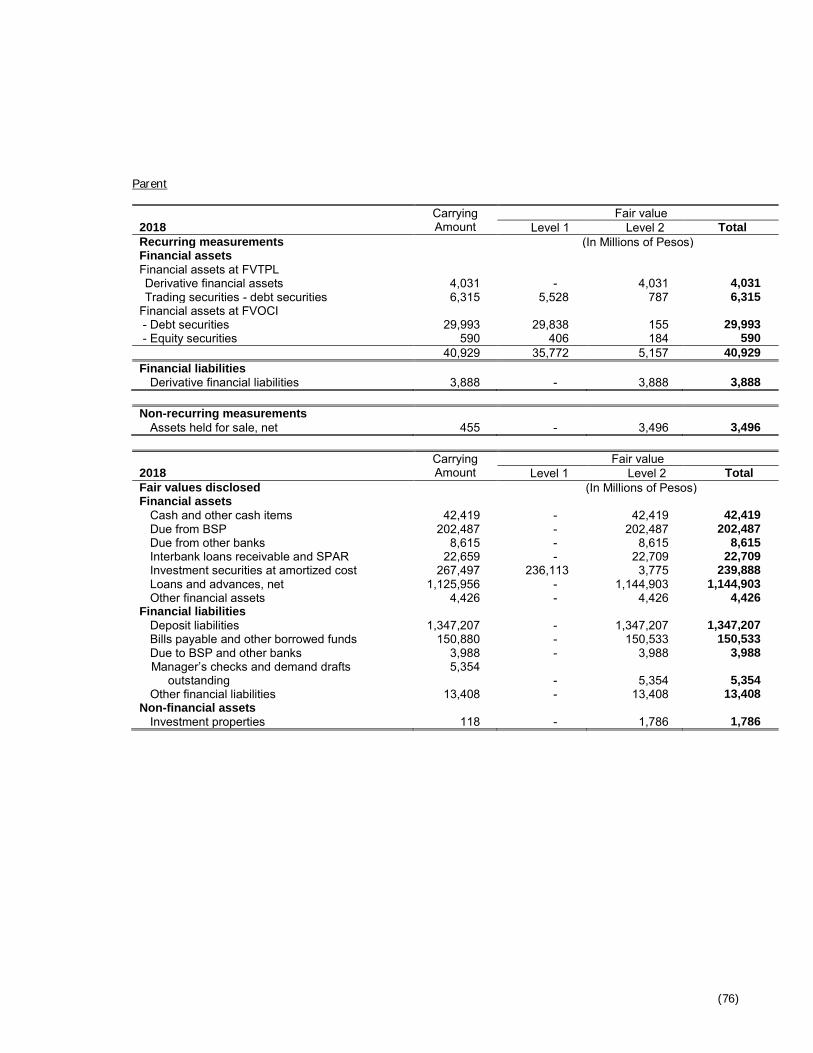
(76)
Parent
Carrying Amount
Fair value 2018 Level 1 Level 2 Total
Recurring measurements (In Millions of Pesos) Financial assets
Financial assets at FVTPL
Derivative financial assets 4,031 - 4,031 4,031
Trading securities - debt securities 6,315 5,528 787 6,315
Financial assets at FVOCI
- Debt securities 29,993 29,838 155 29,993
- Equity securities 590 406 184 590
40,929 35,772 5,157 40,929
Financial liabilities
Derivative financial liabilities 3,888 - 3,888 3,888
Non-recurring measurements
Assets held for sale, net 455 - 3,496 3,496
Carrying Amount
Fair value 2018 Level 1 Level 2 Total
Fair values disclosed (In Millions of Pesos) Financial assets
Cash and other cash items 42,419 - 42,419 42,419
Due from BSP 202,487 - 202,487 202,487
Due from other banks 8,615 - 8,615 8,615
Interbank loans receivable and SPAR 22,659 - 22,709 22,709
Investment securities at amortized cost 267,497 236,113 3,775 239,888
Loans and advances, net 1,125,956 - 1,144,903 1,144,903
Other financial assets 4,426 - 4,426 4,426 Financial liabilities
Deposit liabilities 1,347,207 - 1,347,207 1,347,207
Bills payable and other borrowed funds 150,880 - 150,533 150,533
Due to BSP and other banks 3,988 - 3,988 3,988
Manager’s checks and demand drafts outstanding
5,354 - 5,354 5,354
Other financial liabilities 13,408 - 13,408 13,408 Non-financial assets
Investment properties 118 - 1,786 1,786

(77)
Carrying Amount
Fair value 2017 Level 1 Level 2 Total Recurring measurements (In Millions of Pesos) Financial assets Financial assets at FVTPL Derivative financial assets 4,975 - 4,975 4,975 Trading securities - debt securities 3,806 3,806 - 3,806
Available-for-sale securities - Debt securities 9,669 7,433 2,236 9,669 - Equity securities 470 447 232 679 18,920 11,686 7,443 19,129 Financial liabilities
Derivative financial liabilities 4,788 - 4,788 4,788
Non-recurring measurements Assets held for sale, net 609 - 656 656
Carrying Amount
Fair value 2017 Level 1 Level 2 Total Fair values disclosed (In Millions of Pesos) Financial assets
Cash and other cash items 34,160 - 34,160 34,160 Due from BSP 227,122 - 227,122 227,122 Due from other banks 10,894 - 10,894 10,894 Interbank loans receivable and SPAR 10,504 - 10,504 10,504 Held-to-maturity securities 255,382 242,297 3,922 246,219 Loans and advances, net 986,869 - 1,008,730 1,008,730 Other financial assets 7,151 - 7,151 7,151
Financial liabilities Deposit liabilities 1,323,963 - 1,323,963 1,323,963 Bills payable 70,722 - 70,284 70,284 Due to BSP and other banks 1,218 - 1,218 1,218
Manager’s checks and demand drafts outstanding 5,762 - 5,762 5,762 Other financial liabilities 11,118 - 11,118 11,118
Non-financial assets Investment properties 135 - 1,281 1,281
The BPI Group has no financial instruments, other assets or liabilities with non-recurring fair value measurements or with fair values disclosed that fall under the Level 3 category as at December 31, 2018 and 2017. There were no transfers between Level 1 and Level 2 during the years ended December 31, 2018 and 2017.

(78)
28.5 Insurance risk management The non-life insurance entities decide on the retention, or the absolute amount that they are ready to assume insurance risk from one event. The retention amount is a function of capital, experience, actuarial study and risk appetite or aversion. In excess of the retention, these entities arrange reinsurances either thru treaties or facultative placements. They also accredit reinsurers based on certain criteria and set limits as to what can be reinsured. The reinsurance treaties and the accreditation of reinsurers require BOD’s approval.
Note 29 - Capital management
Capital management is understood to be a facet of risk management. The primary objective of the BPI Group is the generation of recurring acceptable returns to shareholders’ capital. To this end, the BPI Group’s policies, business strategies and activities are directed towards the generation of cash flows that are in excess of its fiduciary and contractual obligations to its depositors, and to its various funders and stakeholders. Cognizant of its exposure to risks, the BPI Group understands that it must maintain sufficient capital to absorb unexpected losses, to stay in business for the long haul, and to satisfy regulatory requirements. The BPI Group further understands that its performance, as well as the performance of its various units, should be measured in terms of returns generated vis-à-vis allocated capital and the amount of risk borne in the conduct of business. Effective January 1, 2014, the BSP, through its Circular 781, requires each bank and its financial affiliated subsidiaries to adopt new capital requirements in accordance with the provisions of Basel III. The new guidelines are meant to strengthen the composition of the bank's capital by increasing the level of core capital and regulatory capital. The Circular sets out minimum Common Equity Tier 1 (CET1) ratio and Tier 1 Capital ratios of 6% and 7.5%, respectively. A capital conservation buffer of 2.5%, comprised of CET1 capital, was likewise imposed. The minimum required capital adequacy ratio remains at 10% which includes the capital conservation buffer. Information on the regulatory capital is summarized below:
Consolidated Parent
2018 2017 2018 2017 (In Millions of Pesos) Tier 1 capital 244,276 177,172 243,519 176,842 Tier 2 capital 13,116 11,682 10,795 10,180 Gross qualifying capital 257,392 188,854 254,314 187,022 Less: Regulatory adjustments/required deductions 23,152 22,371 68,491 59,246 Total qualifying capital 234,240 166,483 185,823 127,776 Risk weighted assets 1,455,746 1,306,907 1,252,790 1,122,119 CAR (%) 16.09 12.74 14.83 11.39 CET1 (%) 15.19 11.84 13.97 10.48
The BPI Group has fully complied with the CAR requirement of the BSP.
Likewise, the BPI Group manages the capital of its non-life insurance subsidiaries, pre-need subsidiary and securities dealer subsidiaries in accordance with the capital requirements of the relevant regulatory agency, such as Insurance Commission, Philippine SEC and PSE. These subsidiaries have fully complied with the relevant capital requirements. As part of the reforms of the PSE to expand capital market and improve transparency among listed firms, PSE requires listed entities to maintain a minimum of ten percent (10%) of their issued and outstanding shares, exclusive of any treasury shares, held by the public. The Parent Bank has fully complied with this requirement.

(79)
Note 30 - Commitments and Contingencies
At present, there are lawsuits, claims and tax assessments pending against the BPI Group. In the opinion of management, after reviewing all actions and proceedings and court decisions with legal counsels, the aggregate liability or loss, if any, arising therefrom will not have a material effect on the BPI Group’s financial position or financial performance.
BPI and some of its subsidiaries are defendants in legal actions arising from normal business activities. Management believes that these actions are without merit or that the ultimate liability, if any, resulting from them will not materially affect the financial statements. In the normal course of business, the BPI Group makes various commitments that are not presented in the financial statements. The BPI Group does not anticipate any material losses from these commitments. Note 31 - Summary of Significant Accounting Policies The principal accounting policies applied in the preparation of these financial statements are set out below. These policies have been consistently applied to all the years presented, unless otherwise stated. 31.1 Basis of preparation The financial statements of the BPI Group have been prepared in accordance with Philippine Financial Reporting Standards (PFRS). The term PFRS in general includes all applicable PFRS, Philippine Accounting Standards (PAS), and interpretations of the Philippine Interpretations Committee (PIC), Standing Interpretations Committee (SIC) and International Financial Reporting Interpretations Committee (IFRIC) which have been approved by the Financial Reporting Standards Council (FRSC) and adopted by the SEC. As allowed by the SEC, the pre-need subsidiary of the Parent Bank continues to follow the provisions of the Pre-Need Uniform Chart of Accounts (PNUCA) prescribed by the SEC and adopted by the Insurance Commission. The financial statements comprise the statement of condition, statement of income and statement of comprehensive income shown as two statements, statement of changes in capital funds, statement of cash flows and the notes. These financial statements have been prepared under the historical cost convention, as modified by the revaluation of financial assets at fair value through profit or loss, financial assets at FVOCI (AFS in 2017), and plan assets of the BPI Group’s defined benefit plans. The preparation of financial statements in conformity with PFRS requires the use of certain critical accounting estimates. It also requires management to exercise its judgment in the process of applying the BPI Group’s accounting policies. Changes in assumptions may have a significant impact on the financial statements in the period the assumptions changed. Management believes that the underlying assumptions are appropriate and that the financial statements therefore fairly present the financial position and results of the BPI Group. The areas involving a higher degree of judgment or complexity, or areas where assumptions and estimates are significant to the financial statements are disclosed in Note 27.

(80)
31.2 Changes in accounting policy and disclosures
(a) New standards adopted by the BPI Group The BPI Group has adopted the following standards effective January 1, 2018:
PFRS 15, ‘Revenue from contracts with customers’ replaces PAS 18, ‘Revenue’ which covers contracts for goods and services and PAS 11, ‘Construction contracts’ which covers construction contracts. The new standard is based on the principle that revenue is recognized when control of a good or service transfers to a customer - so the notion of control replaces the existing notion of risks and rewards. A new five-step process must be applied before revenue can be recognized: (1) identify contracts with customers, (2) identify the separate performance obligation, (3) determine the transaction price of the contract, (4) allocate the transaction price to each of the separate performance obligations, and (5) recognize the revenue as each performance obligation is satisfied. The adoption of PFRS 15 did not have a material impact on the financial statements of the BPI Group.
PFRS 9, ‘Financial instruments’ replaces the provisions of PAS 39 that relate to the recognition, classification and measurement of financial assets and financial liabilities, derecognition of financial instruments, impairment of financial assets and hedge accounting.
PFRS 9 adoption The adoption of PFRS 9 resulted in changes in accounting policies and adjustments to the amounts previously recognized in the financial statements. The BPI Group did not early adopt any provisions of PFRS 9 in previous periods. As permitted by the transitional provisions of PFRS 9, the BPI Group elected not to restate comparative figures. Resulting adjustments to the carrying amounts of financial assets and liabilities at the date of transition were recognized in the opening balance of Surplus and Reserves as of January 1, 2018. The adoption of PFRS 9 has resulted in changes mainly in the BPI Group’s accounting policies for recognition, classification and measurement and impairment of financial assets. There were no changes in the classification of financial liabilities. PFRS 9 also significantly amends other standards dealing with financial instruments such as PFRS 7, Financial Instruments: Disclosures. The BPI Group shifted from incurred loss model under PAS 39 to expected credit loss model in the determination of impairment provisions for financial assets not carried at fair value through profit or loss upon adoption of PFRS 9. The adoption did not result to significant adjustments on the level of allowance for credit losses recognized as at December 31, 2017.

(81)
Set out below are disclosures relating to the impact of the adoption of PFRS 9 on the BPI Group. Classification and measurement of financial assets
The measurement category and the carrying amount of financial assets in accordance with PAS 39 and PFRS 9 at January 1, 2018 are as follows: Consolidated
PAS 39 PFRS 9 December 31, 2017 January 1, 2018
Financial assets Measurement category
Carrying amount
Measurement category
Carrying amount
Cash and other cash items Amortized cost 35,132 Amortized cost 35,132 Due from Bangko Sentral ng Pilipinas Amortized cost 255,948 Amortized cost 255,948 Due from other banks Amortized cost 14,406 Amortized cost 14,406 Interbank loans receivable and securities
purchased under agreements to resell Amortized cost 18,586 Amortized cost 18,586 Derivative assets FVTPL 4,981 FVTPL 4,981 Trading securities
Equity FVTPL 330 FVOCI 330 Debt FVTPL 5,002 FVTPL 10,078
Investment securities Equity FVOCI (AFS) 4,095 FVOCI 4,416 Debt FVOCI (AFS) 19,218 FVOCI 21,893 Amortized cost (HTM) 277,472 Amortized cost 273,386
Loans and advances, net Amortized cost 1,202,338 Amortized cost 1,202,326 Other financial assets Amortized cost 4,676 Amortized cost 4,676
Parent
PAS 39 PFRS 9 December 31, 2017 January 1, 2018
Financial assets Measurement category
Carrying amount
Measurement category
Carrying amount
Cash and other cash items Amortized cost 34,160 Amortized cost 34,160 Due from Bangko Sentral ng Pilipinas Amortized cost 227,122 Amortized cost 227,122 Due from other banks Amortized cost 10,894 Amortized cost 10,894 Interbank loans receivable and securities
purchased under agreements to resell Amortized cost 10,504 Amortized cost 10,504 Derivative assets FVTPL 4,945 FVTPL 4,945 Trading securities - debt FVTPL 3,806 FVTPL 6,041 Investment securities
Equity FVOCI (AFS) 470 FVOCI 679 Debt FVOCI (AFS) 9,669 FVOCI 9,823
Amortized cost (HTM) 255,382 Amortized cost 256,226 Loans and advances, net Amortized cost 986,869 Amortized cost 986,869 Other financial assets Amortized cost 7,151 Amortized cost 7,151

(82)
Reconciliation of statement of condition balances from PAS 39 to PFRS 9
On January 1, 2018, the BPI Group performed a detailed analysis of its business models for managing financial assets including their cash flow characteristics. Please refer to Note 31.3 for more detailed information regarding the new classification requirements of PFRS 9. The financial assets affected by the adoption of the new standard are shown below. The reconciliation of the carrying amounts of these financial assets from their previous measurement category in accordance with PAS 39 to their new measurement categories upon transition to PFRS 9 on January 1, 2018 follow: Consolidated
FVTPL - Trading
securities
Investment debt securities at
FVOCI
Investment securities at
amortized cost Loans and
advances, net
(In Millions of Pesos) Closing balance,
December 31, 2017 - PAS 39 5,332 23,313 277,472 1,202,338
Reclassifications from: AFS to FVTPL a 5,076 (5,076) - - AFS to amortized cost b - (4,565) 7,910 - HTM to FVOCI c - 12,637 (11,996) -
ECL provision - - - (12) 5,076 2,996 (4,086) (12) Opening balance,
January 1, 2018 - PFRS 9 10,408 26,309 273,386 1,202,326
Parent
FVTPL - Trading
securities
Investment securities at FVOCI (Available-
for-sale in 2017)
Investment securities at amortized cost
(HTM in 2017)
(In Millions of Pesos) Closing balance,
December 31, 2017 - PAS 39 3,806 10,139 255,382
Reclassifications from: AFS to FVTPL a 2,235 (2,235) - AFS to amortized cost b - (4,515) 7,776 HTM to FVOCI c - 7,113 (6,932)
2,235 363 844 Opening balance,
January 1, 2018 - PFRS 9 6,041 10,502 256,226

(83)
The impact on the relevant equity items as at January 1, 2018 is as follows: Consolidated
Surplus
Accumulated other comprehensive
loss (In Millions of Pesos) Closing balances, December 31, 2017 - PAS 39 116,415 (5,088) Reclassifications from:
AFS to FVTPL a 30 (30) AFS to amortized cost b (401) 3,592 HTM to FVOCI c - 641 HTM to FVOCI (attributable to insurance corporations) c - 229
Remeasurement of equity securities at FVOCI d 321 (321) ECL provision (12) - Opening balances, January 1, 2018 - PFRS 9 116,353 (977)
Parent
Surplus Accumulated other
comprehensive loss (In Millions of Pesos) Closing balances, December 31, 2017 - PAS 39 73,679 (4,696) Reclassifications from:
AFS to FVTPL a (12) 12 AFS to amortized cost b (375) 3,501 HTM to FVOCI c - 181
Remeasurement of equity securities at FVOCI d 209 (209) Opening balances, January 1, 2018 - PFRS 9 73,501 (1,211)
a. The BPI Group holds debt securities which were classified previously as AFS. In 2018, these securities were
classified as financial assets at FVTPL consistent with the PFRS 9 business model of the BPI Group. Likewise, the BPI Group holds certain credit-linked notes where the host contracts were previously classified as AFS while the embedded derivative component was measured at fair value through profit or loss in 2017. Upon adoption of PFRS 9, these credit-linked notes are classified entirely at fair value through profit or loss as they failed to meet the “solely payments of principal and interest” requirements under PFRS 9.
b. The BPI Group holds securities which were classified previously as AFS. Consequently, these securities were
classified as financial assets at amortized cost consistent with the PFRS 9 business model of the BPI Group. Likewise, the amount also includes adjustment to reinstate certain reclassified AFS securities (see Note 9) back to amortized cost using their original effective interest rates consistent with the business model of the BPI Group.
c. The BPI Group holds securities which were classified previously as HTM. Consequently, these securities were
classified as financial assets at FVOCI consistent with the PFRS 9 business model of the BPI Group. d. The BPI Group has elected to irrevocably designate strategic investments in a small portfolio of non-trading
equity securities at FVOCI as permitted under PFRS 9. These securities were previously classified as AFS and carried at cost as allowed by PAS 39. Consequently, these unlisted equities are remeasured to fair value in accordance with PFRS 9. The changes in fair value of such securities will no longer be reclassified to profit or loss when they are disposed of.
In addition to the above, the following debt instruments have been reclassified to new categories under PFRS 9, as their previous categories under PAS 39 were ‘retired’, with no changes to their measurement basis: (i) Those previously classified as available-for-sale and now classified as measured at FVOCI; and (ii) Those previously classified as held-to-maturity and now classified as measured at amortized cost.

(84)
For financial assets that have been reclassified to the amortized cost category, the table below shows their fair values as at December 31, 2018 and the fair value gain or loss that would have been recognized if these financial assets had not been reclassified as part of the transition to PFRS 9:
Consolidated Parent (In Millions of Pesos) Fair value as at December 31, 2018 4,396 4,448 Fair value loss that would have been recognized during the year if the
financial asset had not been reclassified (117) (115) In addition to PFRS 9 and 15, the following amendments have also been adopted by the BPI Group effective January 1, 2018:
Amendments to PFRS 2, Share-based payments
IFRIC 22, Foreign currency transactions and advance consideration
The adoption of the above amendments did not have a material impact on the financial statements of the BPI Group. (b) New standards, amendments and interpretations not yet adopted The following new accounting standards and interpretations are mandatory for annual periods after December 31, 2018 and have not been early adopted by the BPI Group: PFRS 16, Leases (effective for annual periods beginning on or after January 1, 2019) PFRS 16 will replace the current guidance in PAS 17, Leases. PFRS 16 which will become effective on January 1, 2019 will affect primarily the accounting by lessees and will result in the recognition of almost all leases in the balance sheet. PFRS 16 removes the current distinction between operating and financing leases and requires recognition of an asset (the right-of-use asset) and a lease liability to pay rentals for virtually all lease contracts. Under PFRS 16, a contract is, or contains, a lease if the contract conveys the right to control the use of an identified asset for a period of time in exchange for consideration. An optional exemption exists for short-term and low-value leases. The adoption of PFRS 16 will affect the accounting of certain assets currently held by the BPI Group under operating lease arrangements. The financial impact is yet to be determined by the BPI Group management. Philippine Interpretation IFRIC-23, Uncertainty over Income Tax Treatments (effective for annual periods beginning on or after January 1, 2019) It has been clarified previously that PAS 12, not PAS 37, Provisions, Contingent Liabilities and Contingent Assets, applies to accounting for uncertain income tax treatments. IFRIC 23 explains how to recognize and measure deferred and current income tax assets and liabilities where there is uncertainty over a tax treatment. An uncertain tax treatment is any tax treatment applied by an entity where there is uncertainty over whether that treatment will be accepted by the tax authority. For example, a decision to claim a deduction for a specific expense or not to include a specific item of income in a tax return is an uncertain tax treatment if its acceptability is uncertain under tax law. IFRIC 23 applies to all aspects of income tax accounting where there is an uncertainty regarding the treatment of an item, including taxable profit or loss, the tax bases of assets and liabilities, tax losses and credits and tax rates. The adoption of the above interpretation will not have a material impact on the financial statements of the BPI Group.

(85)
PFRS 17, Insurance Contracts (effective for annual periods beginning on or after January 1, 2022) PFRS 17 was issued in May 2017 as replacement for PFRS 4, Insurance Contracts. PFRS 17 represents a fundamental change in the accounting framework for insurance contracts requiring liabilities to be measured at a current fulfilment value and provides a more uniform measurement and presentation approach for all insurance contracts. It requires a current measurement model where estimates are re-measured each reporting period. Contracts are measured using the building blocks of (1) discounted probability-weighted cash flows, (2) an explicit risk adjustment, and (3) a contractual service margin (“CSM”) representing the unearned profit of the contract which is recognized as revenue over the coverage period. The standard allows a choice between recognizing changes in discount rates either in the income statement or directly in other comprehensive income. The choice is likely to reflect how insurers account for their financial assets under PFRS 9. An optional, simplified premium allocation approach is permitted for the liability for the remaining coverage for short duration contracts, which are often written by non-life insurers. The new rules will affect the financial statements and key performance indicators of all entities that issue insurance contracts or investment contracts with discretionary participation features. The Insurance Commission, in coordination with Philippine Insurers and Reinsurers Association, is currently reviewing the impact of PFRS 17 across the entire industry and has established a project team to manage the implementation approach. The BPI Group is assessing the quantitative impact of PFRS 17 as of reporting date. Likewise, the following amendments are not mandatory for December 31, 2018 reporting period and have not been early adopted by the BPI Group:
Amendments to PAS 28, Long-term Interests in Associates and Joint Ventures
Amendments to PFRS 9, Prepayment Features with Negative Compensation
Amendments to PAS 9, Plan Amendment, Curtailment or Settlement The adoption of the above amendments is not expected to have a material impact on the financial statements of the BPI Group. 31.3 Financial instruments A financial instrument is any contract that gives rise to a financial asset of one entity and a financial liability or equity instrument of another entity. The BPI Group recognizes a financial instrument in the statements of condition when, and only when, the BPI Group becomes a party to the contractual provisions of the instrument. 31.3.1 Measurement methods Amortized cost and effective interest rate The amortized cost is the amount at which the financial asset or financial liability is measured at initial recognition minus the principal repayments, plus or minus the cumulative amortization using the effective interest method of any difference between that initial amount and the maturity amount and, for financial assets, adjusted for any loss allowance. The effective interest rate is the rate that exactly discounts estimated future cash payments or receipts through the expected life of the financial asset or financial liability to the gross carrying amount of a financial asset (i.e. its amortized cost before any impairment allowance) or to the amortized cost of a financial liability. The calculation does not consider expected credit losses and includes transaction costs, premiums or discounts and fees and points paid or received that are integral to the effective interest rate, such as origination fees. For purchased or originated credit-impaired (‘POCI’) financial assets – assets that are credit-impaired (see definition on Note 31.3.2.2) at initial recognition – the BPI Group calculates the credit-adjusted effective interest rate, which is calculated based on the amortized cost of the financial asset instead of its gross carrying amount and incorporates the impact of expected credit losses in estimated future cash flows.

(86)
When the BPI Group revises the estimates of future cash flows, the carrying amount of the respective financial assets or financial liability is adjusted to reflect the new estimate discounted using the original effective interest rate. Any changes are recognized in profit or loss. Interest income Interest income is calculated by applying the effective interest rate to the gross carrying amount of financial assets, except for:
POCI financial assets, for which the original credit-adjusted effective interest rate is applied to the amortized cost of the financial asset.
Financial assets that are not ‘POCI’ but have subsequently become credit-impaired (or ‘Stage 3’), for which interest revenue is calculated by applying the effective interest rate to their amortized cost (i.e. net of the expected credit loss provision).
Initial recognition and measurement Financial assets and financial liabilities are recognized when the entity becomes a party to the contractual provisions of the instrument. Regular way purchases and sales of financial assets are recognized on trade-date, the date on which the BPI Group commits to purchase or sell the asset. At initial recognition, the BPI Group measures a financial asset or financial liability at its fair value plus or minus, in the case of a financial asset or financial liability not at fair value through profit or loss, transaction costs that are incremental and directly attributable to the acquisition or issue of the financial asset or financial liability, such as fees and commissions. Transaction costs of financial assets and financial liabilities carried at fair value through profit or loss are expensed in profit or loss. Immediately after initial recognition, an expected credit loss allowance (ECL) is recognized for financial assets measured at amortized cost and investments in debt instruments measured at FVOCI, as described in Note 31.3.2.1 below, which results in the loss provision being recognized in profit or loss when an asset is newly originated. When the fair value of financial assets and liabilities differs from the transaction price on initial recognition, the BPI Group recognizes the difference as follows:
When the fair value is evidenced by a quoted price in an active market for an identical asset or liability (i.e. a Level 1 input) or based on a valuation technique that uses only data from observable markets, the difference is recognized as a gain or loss.
In all other cases, the difference is deferred and the timing of recognition of deferred day one profit or loss is determined individually. It is either amortized over the life of the instrument, deferred until the instrument’s fair value can be determined using market observable inputs, or realised through settlement.
Policies from January 1, 2018 (PFRS 9) 31.3.2 Financial assets 31.3.2.1 Classification and subsequent measurement From January 1, 2018, the BPI Group has applied PFRS 9 and classifies its financial assets in the following measurement categories: at fair value through profit or loss, fair value through other comprehensive income and at amortized cost.
The classification requirements for debt and equity instruments are described below: Debt instruments Debt instruments are those instruments that meet the definition of a financial liability from the issuer’s perspective, such as loans and advances, due from BSP and other banks, government and corporate bonds and other financial receivables.

(87)
Classification and subsequent measurement of debt instruments depend on the BPI Group’s business model for managing the asset and the cash flow characteristics of the asset. Based on these factors, the BPI Group classifies its debt instruments into one of the following three measurement categories:
Amortized cost Assets that are held for collection of contractual cash flows where those cash flows represent solely payments of principal and interest (‘SPPI’), and that are not designated at fair value through profit or loss, are measured at amortized cost. The carrying amount of these assets is adjusted by any expected credit loss allowance recognized and measured. Interest income from these financial assets is included in ‘Interest income’ using the effective interest rate method. Amortized cost financial assets include cash and other cash items, due from BSP, due from other banks, interbank loans receivables and SPAR, loans and advances, and other financial receivables.
Fair value through other comprehensive income (FVOCI) Financial assets that are held for collection of contractual cash flows and for selling the assets, where the assets’ cash flows represent solely payments of principal and interest, and that are not designated at FVTPL, are measured at fair value through other comprehensive income (FVOCI). Movements in the carrying amount are taken through other comprehensive income, except for the recognition of impairment gains or losses, interest revenue and foreign exchange gains and losses on the instrument’s amortized cost which are recognized in the statements of income. When the financial asset is derecognized, the cumulative gain or loss previously recognized in other comprehensive income is reclassified from equity to profit or loss. Interest income from these financial assets is included in ‘Interest income’ using the effective interest rate method.
Fair value through profit or loss (FVTPL) Assets that do not meet the criteria for amortized cost or FVOCI are measured at fair value through profit or loss. A gain or loss on a debt investment that is subsequently measured at fair value through profit or loss and is not part of a hedging relationship is recognized in profit or loss and presented in the statements of income within ‘Trading gain on securities’ in the period in which it arises, unless it arises from debt instruments that were designated at fair value or which are not held for trading, in which case they are presented separately.
Business model: The business model reflects how the BPI Group manages the assets in order to generate cash flows. That is, whether the BPI Group’s objective is solely to collect the contractual cash flows from the assets or is to collect both the contractual cash flows and cash flows arising from the sale of assets. If neither of these is applicable, then the financial assets are classified and measured at fair value through profit or loss. Factors considered by the BPI Group in determining the business model for a group of assets include past experience on how the cash flows for these assets were collected, how the asset’s performance is evaluated and reported to key management personnel, how risks are assessed and managed and how managers are compensated. SPPI: Where the business model is to hold assets to collect contractual cash flows or to collect contractual cash flows and sell, the BPI Group assesses whether the financial instruments’ cash flows represent solely payments of principal and interest (the ‘SPPI test’). In making this assessment, the BPI Group considers whether the contractual cash flows are consistent with a basic lending arrangement i.e. interest includes only consideration for the time value of money, credit risk, other basic lending risks and a profit margin that is consistent with a basic lending arrangement. Where the contractual terms introduce exposure to risk or volatility that are inconsistent with a basic lending arrangement, the related financial asset is classified and measured at fair value through profit or loss. The BPI Group reclassifies debt investments when and only when its business model for managing those assets changes. The reclassification takes place from the start of the first reporting period following the change. Such changes are expected to be very infrequent and none occurred during the period.

(88)
Equity instruments Equity instruments are instruments that meet the definition of equity from the issuer’s perspective; that is, instruments that do not contain a contractual obligation to pay and that evidence a residual interest in the issuer’s net assets. The BPI Group subsequently measures all equity investments at fair value through profit or loss, except where the BPI Group’s management has elected, at initial recognition, to irrevocably designate an equity investment at fair value through other comprehensive income. The BPI Group’s policy is to designate equity investments as FVOCI when those investments are held for purposes other than to generate investment returns. When this election is used, fair value gains and losses are recognized in other comprehensive income and are not subsequently reclassified to profit or loss, even on disposal. Impairment losses (and reversal of impairment losses) are not reported separately from other changes in fair value. Dividends, when representing a return on such investments, continue to be recognized in profit or loss as “Other operating income” when the BPI Group’s right to receive payments is established. Gains and losses on equity investments at fair value through profit or loss are included in the “Trading gain on securities” in the statements of income. 31.3.2.2 Impairment of amortized cost and FVOCI financial assets The BPI Group assesses impairment as follows:
individually for loans that exceed specified thresholds. Where there is objective evidence of impairment, individually assessed provisions will be recognised; and
collectively for loans below the specified thresholds noted above or if there is no objective evidence of impairment. These loans are included in a group of loans with similar risk characteristics and collectively assessed for impairment. If there is objective evidence that the group of loans is collectively impaired, collectively assessed provisions will be recognised.
Expected credit losses The BPI Group assesses on a forward-looking basis the ECL associated with its debt instrument assets carried at amortized cost and FVOCI and with the exposure arising from loan commitments. The BPI Group recognizes a loss allowance for such losses at each reporting date. The measurement of ECL reflects:
An unbiased and probability-weighted amount that is determined by evaluating a range of possible outcomes;
The time value of money; and
Reasonable and supportable information that is available without undue cost or effort at the reporting date about past events, current conditions and forecasts of future economic conditions.
PFRS 9 outlines a ‘three-stage’ model for impairment based on changes in credit quality since initial recognition as summarized below:
A financial instrument that is not credit-impaired on initial recognition is classified in “Stage 1” and has its credit risk continuously monitored by the BPI Group.
If a significant increase in credit risk since initial recognition is identified, the financial instrument is moved to “Stage 2” but is not yet deemed to be credit-impaired. The BPI Group determines SICR based on prescribed benchmarks approved by the Board of the Directors.
If the financial instrument is credit-impaired, the financial instrument is then moved to “Stage 3”.
Financial instruments in Stage 1 have their ECL measured at an amount equal to the portion of lifetime expected credit losses that results from default events possible within the next 12 months. Instruments in Stages 2 or 3 have their ECL measured based on expected credit losses on a lifetime basis.
A pervasive concept in measuring ECL in accordance with PFRS 9 is that it should consider forward-looking information.
POCI financial assets are those financial assets that are credit impaired on initial recognition. Their ECL is always measured on a lifetime basis (Stage 3). There are no POCI as at December 31, 2018.

(89)
The following diagram summarizes the impairment requirements under PFRS 9 (other than purchased originated credit-impaired financial assets):
Change in credit quality since initial recognition
Stage 1 Stage 2 Stage 3 (Initial recognition) (Significant increase in credit risk
since initial recognition) (Credit-impaired assets)
12-month expected credit losses Lifetime expected credit losses Lifetime expected credit losses For expected credit loss provisions modelled on a collective basis, a grouping of exposures is performed on the basis of shared risk characteristics, such that risk exposures within a group are homogeneous. Determination of significant increase in credit risk (SICR) The BPI Group compares the probabilities of default occurring over its expected life as at the reporting date with the probability of default occurring over its expected life on the date of initial recognition to determine significant increase in credit risk. Since comparison is made between forward-looking information at reporting date against initial recognition, the deterioration in credit risk may be triggered by the following factors:
substantial deterioration in credit quality as measured by the applicable internal or external ratings, credit score or shift from investment grade category to non-investment grade category;
adverse changes in business, financial and/or economic conditions of the borrower;
early warning signs of worsening credit where the ability of the counterparty to honor his obligation is dependent upon favorable business or economic condition;
the account has become past due beyond 30 days where an account is classified under special monitoring category (refer to Note 28.1.2 for the description of special monitoring); and
expert judgment for the other quantitative and qualitative factors which may result to SICR as defined by the BPI Group.
Measuring ECL -Inputs, assumptions and estimation techniques The ECL is measured on either a 12-month or lifetime basis depending on whether a significant increase in credit risk has occurred since initial recognition or whether an asset is considered to be credit-impaired. Expected credit losses are the discounted product of the PD, EAD and LGD, defined as follows:
The PD represents the likelihood that the borrower will default (as per “Definition of default and credit-impaired” above), either over the next 12 months (12M PD), or over the remaining life (lifetime PD) of the asset.
EAD is based on the amounts the BPI Group expects to be owed at the time of default, over the next 12 months (12M EAD) or over the remaining life (lifetime EAD). For example, for a revolving commitment, the BPI Group includes the current drawn balance plus any further amount that is expected to be drawn up to the current contractual limit by the time of default, should it occur.
The 12-month and lifetime EADs are determined based on the expected payment profile, which varies by product type.
- For amortizing products and bullet repayment loans, this is based on the contractual repayments owed by
the borrower over a 12-month or lifetime basis. - For committed credit lines, the exposure at default is predicted by taking current drawn balance and
adding a “credit conversion factor” which allows for the expected drawdown of the remaining limit by the time of default.

(90)
LGD represents the BPI Group’s expectation of the extent of loss on a defaulted exposure. LGD varies by type of counterparty, type and seniority of claim and availability of collateral or other credit support. LGD is expressed as a percentage loss per unit of exposure at the time of default. The LGDs are determined based on the factors which impact the recoveries made post-default.
- For secured products, this is primarily based on collateral type and projected collateral values, historical
discounts to market/book values due to forced sales, time to repossession and recovery costs observed. - For unsecured products, LGDs are typically set at product level due to the limited differentiation in
recoveries achieved across different borrowers. These LGDs are influenced by collection strategies and historical recoveries.
The ECL is determined by multiplying the PD, LGD and EAD together for each individual exposure or collective segment. This effectively calculates an ECL for each future year, which is then discounted back to the reporting date and summed. The discount rate used in the ECL calculation is the original effective interest rate or an approximation thereof. The lifetime PD is developed by applying a maturity profile to the current 12M PD. The maturity profile looks at how defaults develop on a portfolio from the point of initial recognition throughout the life of the loans. The maturity profile is based on historical observed data and is assumed to be the same across all assets within a portfolio and credit grade band. Forward-looking economic information is also included in determining the 12-month and lifetime PD. These assumptions vary by product type. The assumptions underlying the ECL calculation—such as how the maturity profile of the PDs and how collateral values change—are monitored and reviewed regularly. There have been no significant changes in estimation techniques or significant assumptions made during the reporting period from the time of the adoption of PFRS 9 on January 1, 2018 to the reporting date. Forward-looking information incorporated in the ECL models The BPI Group incorporates historical and current information, and forecasts forward-looking events and key economic variables that are assessed to impact credit risk and expected credit losses for each portfolio. Macroeconomic variables that affect a specific portfolio’s non-performing loan rate(s) are determined through statistical modelling and the application of expert judgement. The BPI Group’s economics team establishes possible global and domestic economic scenarios. With the use of economic theories and conventions, expert judgement and external forecasts, the economics team develops assumptions to be used in forecasting variables in the next five (5) years, subsequently reverting to long run-averages. The probability-weighted ECL is calculated by running each scenario through the relevant ECL models and multiplying it by the appropriate scenario weighting. The estimation and application of forward-looking information requires significant judgment. As with any economic forecasts, the projections and likelihood of occurrences are subject to a high degree of inherent uncertainty and therefore the actual outcomes may be significantly different to those projected. The scenarios and their attributes are reassessed at each reporting date. Information regarding the forward-looking economic variables and the relevant sensitivity analysis is disclosed in Note 27. Financial assets with low credit risk Loss allowance for financial assets at amortized cost and FVOCI that have low credit risk is limited to 12-month expected credit losses. Management considers “low credit risk” for listed government bonds to be an investment grade credit rating with at least one major rating agency. Other debt instruments are considered to be low credit risk when they have a low risk of default and the issuer has a strong capacity to meet its contractual cash flow obligations in the near term.

(91)
Definition of default and credit-impaired assets The BPI Group considers a financial instrument in default or credit-impaired, when it meets one or more of the following criteria: Quantitative criteria The borrower is more than 90 days past due on its contractual payments (with the exception of credit cards and micro-finance loans where a borrower is required to be 90 days past due and over 7 days past due, respectively, to be considered in default). Qualitative criteria The counterparty is experiencing significant financial difficulty which may lead to non-payment of loan as may be indicated by any or combination of the following events:
The counterparty is in long-term forbearance;
The counterparty is insolvent;
The counterparty is in breach of major financial covenant(s) which lead(s) to event of default;
An active market for the security has disappeared;
Granting of concession that would not be otherwise considered due to economic or contractual reasons relating to the counterparty’s financial difficulty;
It is becoming probable that the counterparty will enter bankruptcy or other financial reorganization; and
Financial assets are purchased or originated at a deep discount that reflects the incurred credit losses. The criteria above have been applied to all financial instruments held by the BPI Group and are consistent with the definition of default used for internal credit risk management purposes. The default definition has been applied consistently to model the probability of default, exposure at default (EAD), and loss given default (LGD) throughout the BPI Group’s expected credit loss calculations. The BPI Group’s definition of default is substantially consistent with non-performing loan definition of the BSP. For cross-border, treasury and debt securities, these are classified as defaulted based on combination of BSP and external credit rating agency definitions. Policies applicable prior to January 1, 2018 (PAS 39) 31.3.3 Financial assets 31.3.3.1 Classification The BPI Group classifies its financial assets in the following categories: financial assets at fair value through profit or loss, loans and receivables, held-to-maturity securities and available-for-sale securities. The classification depends on the purpose for which the financial assets are acquired. Management determines the classification of its financial assets at initial recognition. (a) Financial assets at fair value through profit or loss This category has two sub-categories: financial assets held for trading and those designated at fair value through profit or loss at inception. A financial asset is classified as held for trading if it is acquired principally for the purpose of selling or repurchasing it in the near term or if it is part of a portfolio of identified financial instruments that are managed together and for which there is evidence of a recent actual pattern of short-term profit-taking. Financial assets held for trading (other than derivatives) are shown as “Trading securities” in the statements of condition. Derivatives are also categorized as held for trading unless they are designated as hedging instruments.

(92)
Financial assets designated at fair value through profit or loss at inception are those that are managed and their performance is evaluated on a fair value basis, in accordance with a documented investment strategy. Information about these financial assets is provided internally on a fair value basis to the BPI Group’s key management personnel. The BPI Group has no financial assets that are specifically designated at fair value through profit or loss. (b) Loans and receivables Loans and receivables are non-derivative financial assets with fixed or determinable payments: (i) that are not quoted in an active market, (ii) with no intention of being traded, and (iii) that are not designated as available-for-sale. Significant accounts falling under this category include loans and advances, cash and other cash items, due from BSP and other banks, interbank loans receivable and securities purchased under agreements to resell and accounts receivable included under other assets. (c) Held-to-maturity securities Held-to-maturity securities are non-derivative financial assets with fixed or determinable payments and fixed maturities that the BPI Group’s management has the positive intention and ability to hold to maturity. (d) Available-for-sale securities Available-for-sale securities are non-derivative financial assets that are either designated in this category or not classified in any of the other categories. 31.3.3.2 Subsequent measurement
Available-for-sale securities and financial assets at fair value through profit or loss are subsequently carried at fair value. Loans and receivables and held-to-maturity securities are subsequently carried at amortized cost. Amortized cost is the amount at which the financial instrument was recognized at initial recognition less any principal repayments, plus accrued interest, and for financial assets less any write-down for incurred impairment losses. Accrued interest includes amortization of transaction costs deferred at initial recognition and of any premium or discount to maturity amount using the effective interest method. Accrued interest income, including both accrued coupon and amortized discount or premium (including fees deferred at origination, if any), are not presented separately and are included in the carrying values of the related items in the statements of condition. Gains and losses arising from changes in the fair value of financial assets at fair value through profit or loss are included in the statements of income (as “Trading gain/loss on securities”) in the year in which they arise. Changes in the fair value of monetary and non-monetary securities classified as available-for-sale are recognized directly in other comprehensive income, until the financial asset is derecognized or impaired at which time the cumulative fair value adjustments previously recognized in other comprehensive income should be recognized in profit or loss. However, interest is calculated on these securities using the effective interest method and foreign currency gains and losses on monetary assets classified as available-for-sale are recognized in profit or loss. Dividends on equity instruments are recognized in profit or loss when the BPI Group’s right to receive payment is established.

(93)
31.3.3.3 Reclassification The BPI Group may choose to reclassify a non-derivative financial asset held for trading out of the held-for-trading category if the financial asset is no longer held for the purpose of selling it in the near term. Financial assets other than loans and receivables are permitted to be reclassified out of the held-for-trading category only in rare circumstances arising from a single event that is unusual and highly unlikely to recur in the near term. In addition, the BPI Group may choose to reclassify financial assets that would meet the definition of loans and receivables out of the held-for-trading or available-for-sale categories if the BPI Group has the intention and ability to hold these financial assets for the foreseeable future or until maturity at the date of reclassification. Reclassifications are made at fair value as of the reclassification date. Fair value becomes the new cost or amortized cost as applicable, and no reversals of fair value gains or losses recorded before reclassification date are subsequently made. Effective interest rates for financial assets reclassified to loans and receivables and held-to-maturity categories are determined at the reclassification date. Further increases in estimates of cash flows adjust effective interest rates prospectively. Reclassification and sale of held-to-maturity securities other than an insignificant amount, would taint the entire portfolio and result in reclassification to available-for-sale category, except on sales and reclassifications that:
are so close to maturity that changes in market interests rates would not significantly affect fair value;
occur after the entity has collected substantially all of the asset’s original principal; or
are attributable to an isolated, non-recurring event that could not have been reasonably expected. 31.3.3.4 Impairment of financial assets (a) Assets carried at amortized cost The BPI Group assesses at each reporting date whether there is objective evidence that a financial asset or group of financial assets is impaired. A financial asset or a group of financial assets is impaired and impairment losses are incurred only if there is objective evidence of impairment as a result of one or more events that occurred after the initial recognition of the asset (a ‘loss event’) and that loss event (or events) has an impact on the estimated future cash flows of the financial asset or group of financial assets that can be reliably estimated. The criteria that the BPI Group uses to determine that there is objective evidence of an impairment loss include:
Delinquency in contractual payments of principal or interest;
Cash flow difficulties experienced by the borrower;
Breach of loan covenants or conditions;
Initiation of bankruptcy proceedings;
Deterioration of the borrower’s competitive position; and
Deterioration in the value of collateral.
The BPI Group first assesses whether objective evidence of impairment exists individually for financial assets that are individually significant, and collectively for financial assets that are not individually significant. If the BPI Group determines that no objective evidence of impairment exists for an individually assessed financial asset, whether significant or not, it includes the asset in a group of financial assets with similar credit risk characteristics and collectively assesses them for impairment. Financial assets that are individually assessed for impairment and for which an impairment loss is or continues to be recognized are not included in a collective assessment of impairment.

(94)
The amount of impairment loss is measured as the difference between the asset’s carrying amount and the present value of estimated future cash flows (excluding future credit losses that have not been incurred) discounted at the financial asset’s original effective interest rate (recoverable amount). The calculation of recoverable amount of a collateralized financial asset reflects the cash flows that may result from foreclosure less costs of obtaining and selling the collateral, whether or not foreclosure is probable. If a loan or held-to-maturity investment has a variable interest rate, the discount rate for measuring any impairment loss is the current effective interest rate determined under the contract. The carrying amount of the asset is reduced through the use of an allowance account and the amount of loss is recognized in profit or loss. For purposes of a collective evaluation of impairment, financial assets are grouped on the basis of similar credit risk characteristics (i.e., on the basis of the BPI Group’s grading process that considers asset type, industry, geographical location, collateral type, past-due status and other relevant factors). Those characteristics are relevant to the estimation of future cash flows for groups of such assets by being indicative of the debtors’ ability to pay all amounts due according to the contractual terms of the assets being evaluated. Future cash flows in a group of financial assets that are collectively evaluated for impairment are estimated on the basis of the contractual cash flows of the assets in the BPI Group and historical loss experience for assets with credit risk characteristics similar to those in the BPI Group. Historical loss experience is adjusted on the basis of current observable data to reflect the effects of current conditions that did not affect the period on which the historical loss experience is based and to remove the effects of conditions in the historical period that do not currently exist. The methodology and assumptions used for estimating future cash flows are reviewed regularly to reduce any differences between loss estimates and actual loss experience. When a loan is uncollectible, it is written off against the related allowance for loan impairment. Such loans are written off after all the necessary procedures have been completed and the amount of loss has been determined. If in a subsequent period, the amount of impairment loss decreases and the decrease can be related objectively to an event occurring after the impairment was recognized (such as an improvement in the debtor’s credit rating), the previously recognized impairment loss is reversed by adjusting the allowance account. Subsequent recoveries of amounts previously written-off are credited to impairment loss in the statements of income. (b) Assets classified as available-for-sale The BPI Group assesses at each reporting date whether there is an objective evidence that a security classified as available-for-sale is impaired. For debt securities, the BPI Group uses the criteria mentioned in (a) above. For an equity security classified as available-for-sale, a significant or prolonged decline in the fair value below cost is considered in determining whether the securities are impaired. Generally, the BPI Group treats ‘significant’ as 20% or more and ‘prolonged’ as greater than six months. The cumulative loss (difference between the acquisition cost and the current fair value less any impairment loss on that financial asset previously recognized in profit or loss) is removed from other comprehensive income and recognized in profit or loss when the asset is determined to be impaired. If in a subsequent period, the fair value of a debt instrument previously impaired increases and the increase can be objectively related to an event occurring after the impairment loss was recognized, the impairment loss is reversed through profit or loss. Reversal of impairment losses recognized previously on equity instruments is made directly to other comprehensive income. (c) Renegotiated loans Loans that are either subject to individual or collective impairment assessment and whose terms have been renegotiated are no longer considered to be past due but are treated as new loans.

(95)
The Group sometimes renegotiates or otherwise modifies the contractual cash flows of loans to customers. When this happens, the Group assesses whether or not the new terms are substantially different to the original terms. The Group does this by considering, among others, the following factors:
If the borrower is in financial difficulty, whether the modification merely reduces the contractual cash flows to amounts the borrower is expected to be able to pay.
Whether any substantial new terms are introduced, such as a profit share/equity-based return that substantially affects the risk profile of the loan.
Significant extension of the loan term when the borrower is not in financial difficulty. Significant change in the interest rate.
Change in the currency the loan is denominated in.
Insertion of collateral, other security or credit enhancements that significantly affect the credit risk associated with the loan.
31.3.4 Modification of loans (PFRS 9 and PAS 39) The BPI Group sometimes renegotiates or otherwise modifies the contractual cash flows of loans to customers. When this happens, the BPI Group assesses whether or not the new terms are substantially different to the original terms. The BPI Group does this by considering, among others, the following factors:
If the borrower is in financial difficulty, whether the modification merely reduces the contractual cash flows to amounts the borrower is expected to be able to pay.
Significant extension of the loan term when the borrower is not in financial difficulty.
Significant change in the interest rate. Change in the currency the loan is denominated in.
Insertion of collateral, other security or credit enhancements that significantly affect the credit risk associated with the loan.
If the terms are substantially different, the BPI Group derecognizes the original financial asset and recognizes a ‘new’ asset at fair value and recalculates a new effective interest rate for the asset. The date of renegotiation is consequently considered to be the date of initial recognition for impairment calculation purposes, including for the purpose of determining whether a significant increase in credit risk has occurred. However, the BPI Group also assesses whether the new financial asset recognized is deemed to be credit-impaired at initial recognition, especially in circumstances where the renegotiation was driven by the debtor being unable to make the originally agreed payments. Differences in the carrying amount are also recognized in the statements of income as a gain or loss on derecognition. 31.3.5 Derecognition of financial assets other than modification (PFRS 9 and PAS 39) Financial assets, or a portion thereof, are derecognized when the contractual rights to receive the cash flows from the assets have expired, or when they have been transferred and either (i) the BPI Group transfers substantially all the risks and rewards of ownership, or (ii) the BPI Group neither transfers nor retains substantially all the risks and rewards of ownership and the BPI Group has not retained control. The BPI Group enters into transactions where it retains the contractual rights to receive cash flows from assets but assumes a contractual obligation to pay those cash flows to other entities and transfers substantially all of the risks and rewards. These transactions are accounted for as ‘pass through’ transfers that result in derecognition if the BPI Group:
Has no obligation to make payments unless it collects equivalent amounts from the assets;
Is prohibited from selling or pledging the assets; and
Has an obligation to remit any cash it collects from the assets without material delay.
Collateral (shares and bonds) furnished by the BPI Group under standard repurchase agreements and securities lending and borrowing transactions are not derecognized because the BPI Group retains substantially all the risks and rewards on the basis of the predetermined repurchase price, and the criteria for derecognition are therefore not met.

(96)
31.3.6 Financial liabilities (PFRS 9 and PAS 39) 31.3.6.1 Classification The BPI Group classifies its financial liabilities in the following categories: financial liabilities at fair value through profit or loss and financial liabilities at amortized cost. (a) Financial liabilities at fair value through profit or loss This category comprises two sub-categories: financial liabilities classified as held for trading, and financial liabilities designated by the BPI Group as at fair value through profit or loss upon initial recognition. A financial liability is classified as held for trading if it is acquired or incurred principally for the purpose of selling or repurchasing it in the near term or if it is part of a portfolio of identified financial instruments that are managed together and for which there is evidence of a recent actual pattern of short-term profit-taking. Derivatives are also categorized as held for trading unless they are designated and effective as hedging instruments. Gains and losses arising from changes in fair value of financial liabilities classified as held for trading are included in the statements of income and are reported as “Trading gains/losses on securities”. The BPI Group has no financial liabilities that are designated at fair value through profit loss. (b) Other liabilities measured at amortized cost Financial liabilities that are not classified as at fair value through profit or loss fall into this category and are measured at amortized cost. Financial liabilities measured at amortized cost include deposits from customers and banks, bills payable, amounts due to BSP and other banks, manager’s checks and demand drafts outstanding, subordinated notes and other financial liabilities under deferred credits and other liabilities. 31.3.6.2 Subsequent measurement and derecognition
Financial liabilities at fair value through profit or loss are subsequently carried at fair value. Other liabilities are measured at amortized cost using the effective interest method. Financial liabilities are derecognized when they have been redeemed or otherwise extinguished (i.e. when the obligation is discharged or is cancelled or has expired). Collateral (shares and bonds) furnished by the BPI Group under standard repurchase agreements and securities lending and borrowing transactions is not derecognized because the BPI Group retains substantially all the risks and rewards on the basis of the predetermined repurchase price, and the criteria for derecognition are therefore not met. 31.3.7 Loan commitments Loan commitments are those contracts that the BPI Group is required to provide a loan with pre-specified terms to the customer. These contracts, which are not issued at below-market interest rate and are not settled net in cash or by delivering or issuing another financial instrument, are not recorded in the statement of financial position. Starting January 1, 2018, loss allowance is calculated on these commitments as described in Note 28.1. 31.3.8 Derivative financial instruments (PFRS 9 and PAS 39) Derivatives are initially recognized at fair value on the date on which a derivative contract is entered into and are subsequently re-measured at their fair value. Fair values are obtained from quoted market prices in active markets including recent market transactions, and valuation techniques (for example for structured notes), including discounted cash flow models and options pricing models, as appropriate. All derivatives are carried as assets when fair value is positive and as liabilities when fair value is negative. Derivatives are initially recognized at fair value on the date on which the derivative contract is entered into and are subsequently remeasured at fair value. All derivatives are carried as assets when fair value is positive and as liabilities when fair value is negative.

(97)
The BPI Group’s derivative instruments do not qualify for hedge accounting. Changes in the fair value of any derivative instrument that do not qualify for hedge accounting are recognized immediately in the statements of income under “Trading gain on securities”. 31.3.8.1 Embedded derivatives From January 1, 2018 (PFRS 9) Certain derivatives are embedded in hybrid contracts, such as the conversion option in a convertible bond. If the hybrid contract contains a host that is a financial asset, then the BPI Group assesses the entire contract for classification and measurement in accordance with the policy outlined in Note 31.3.2 above. Otherwise, the embedded derivatives are treated as separate derivatives when:
Their economic characteristics and risks are not closely related to those of the host contract;
A separate instrument with the same terms would meet the definition of a derivative; and
The hybrid contract is not measured at fair value through profit or loss. These embedded derivatives are separately accounted for at fair value, with changes in fair value recognized in the statement of profit or loss unless the BPI Group chooses to designate the hybrid contracts at fair value through profit or loss. Prior to January 1, 2018 (PAS 39 ) When derivatives are embedded on other financial instruments or host contracts, such combinations are known as hybrid instruments with the effect that some of the cash flows of a hybrid instrument vary in a way similar to a stand-alone derivative. If the host contract is not carried at fair value with changed in fair value reported in the Consolidated Statements of Income, the embedded derivative is generally required to be separated from the host contract and accounted for separately as at FVTPL if the economic characteristics and risks of the embedded derivative are not closely related to those of the host contract. All embedded derivatives are presented on a combined basis with the host contracts although they are separated for measurement purposes when conditions requiring separation are met. 31.3.9 Fair value measurement The fair value measurement did not change on adoption of PFRS 9. Fair value is the price that would be received to sell an asset or paid to transfer a liability in an orderly transaction between market participants at the measurement date. The fair value of a non-financial asset is measured based on its highest and best use. The asset’s current use is presumed to be its highest and best use. The fair value of financial and non-financial liabilities takes into account non-performance risk, which is the risk that the entity will not fulfill an obligation. The BPI Group classifies its fair value measurements using a fair value hierarchy that reflects the significance of the inputs used in making the measurements. The fair value hierarchy has the following levels:
Level 1 - Quoted prices (unadjusted) in active markets for identical assets or liabilities. This level includes listed equity securities and debt instruments on exchanges (for example, PSE, Philippine Dealing and Exchange Corp., etc.).
Level 2 - Inputs other than quoted prices included within Level 1 that are observable for the asset or liability, either directly (that is, as prices) or indirectly (that is, derived from prices). This level includes the majority of the over-the-counter (“OTC”) derivative contracts. The primary source of input parameters like LIBOR yield curve or counterparty credit risk is Bloomberg.

(98)
Level 3 - Inputs for the asset or liability that are not based on observable market data (unobservable inputs). This level includes equity investments and debt instruments with significant unobservable components. This hierarchy requires the use of observable market data when available. The BPI Group considers relevant and observable market prices in its valuations where possible. The BPI Group has no assets or liabilities classified under Level 3 as at December 31, 2018 and 2017.
The appropriate level is determined on the basis of the lowest level input that is significant to the fair value measurement. (a) Financial instruments For financial instruments traded in active markets, the determination of fair values of financial assets and financial liabilities is based on quoted market prices or dealer price quotations. This includes listed equity securities and quoted debt instruments on major exchanges and broker quotes mainly from Bloomberg. A financial instrument is regarded as quoted in an active market if quoted prices are readily and regularly available from an exchange, dealer, broker, industry group, pricing service or regulatory agency, and those prices represent actual and regularly occurring market transactions on an arm’s length basis. If the above criteria are not met, the market is regarded as being inactive. Indications that a market is inactive are when there is a wide bid-offer spread or significant increase in the bid-offer spread or there are few recent transactions. For all other financial instruments, fair value is determined using valuation techniques. In these techniques, fair values are estimated from observable data in respect of similar financial instruments, using models to estimate the present value of expected future cash flows or other valuation techniques, using inputs (for example, LIBOR yield curve, foreign exchange rates, volatilities and counterparty spreads) existing at reporting dates. The BPI Group uses widely recognized valuation models for determining fair values of non-standardized financial instruments of lower complexity, such as options or interest rate and currency swaps. For these financial instruments, inputs into models are generally market observable. For more complex instruments, the BPI Group uses internally developed models, which are usually based on valuation methods and techniques generally recognized as standard within the industry. Valuation models are used primarily to value derivatives transacted in the OTC market, unlisted debt securities (including those with embedded derivatives) and other debt instruments for which markets were or have become illiquid. Some of the inputs to these models may not be market observable and are therefore estimated based on assumptions. The fair value of OTC derivatives is determined using valuation methods that are commonly accepted in the financial markets, such as present value techniques and option pricing models. The fair value of foreign exchange forwards is generally based on current forward exchange rates, with the resulting value discounted back to present value. In cases when the fair value of unlisted equity instruments cannot be determined reliably, under PAS 39, the instruments are carried at cost less impairment. However, under PFRS 9, all investments in equity instruments and contracts on those instruments must be measured at fair value. However, in limited circumstances, cost may be an appropriate estimate of fair value. That may be the case if insufficient more recent information is available to measure fair value, or if there is a wide range of possible fair value measurements and cost represents the best estimate of fair value within that range. The fair value for loans and advances as well as liabilities to banks and customers are determined using a present value model on the basis of contractually agreed cash flows, taking into account credit quality, liquidity and costs. The fair values of contingent liabilities and irrevocable loan commitments correspond to their carrying amounts.

(99)
(b) Non-financial assets or liabilities The BPI Group uses valuation techniques that are appropriate in the circumstances and applies the technique consistently. Commonly used valuation techniques are as follows:
Market approach - A valuation technique that uses observable inputs, such as prices, broker quotes and other relevant information generated by market transactions involving identical or comparable assets or group of assets.
Income approach - A valuation technique that converts future amounts (e.g., cash flows or income and expenses) to a single current (i.e., discounted) amount. The fair value measurement is determined on the basis of the value indicated by current market expectations about those future amounts.
Cost approach - A valuation technique that reflects the amount that would be required currently to replace the service capacity of an asset (often referred to as current replacement cost).
The fair values were determined in reference to observable market inputs reflecting orderly transactions, i.e. market listings, published broker quotes and transacted deals from similar and comparable assets, adjusted to determine the point within the range that is most representative of the fair value under current market conditions. The fair values of BPI Group’s investment properties and foreclosed assets (shown as Assets held for sale) fall under level 2 of the fair value hierarchy. The BPI Group has no non-financial assets or liabilities classified under Level 3 as at December 31, 2018 and 2017. 31.3.10 Interest income and expense Interest income and expense are recognized in profit or loss for all interest-bearing financial instruments using the effective interest method. The effective interest method is a method of calculating the amortized cost of a financial asset or a financial liability and of allocating the interest income or interest expense over the relevant period. The effective interest rate is the rate that exactly discounts estimated future cash payments or receipts through the expected life of the financial instrument or, when appropriate, a shorter period to the net carrying amount of the financial asset or financial liability. When calculating the effective interest rate, the BPI Group estimates cash flows considering all contractual terms of the financial instrument but does not consider future credit losses. The calculation includes all fees paid or received between parties to the contract that are an integral part of the effective interest rate, transaction costs and all other premiums or discounts. Once a financial asset or a group of similar financial assets has been written down as a result of an impairment loss, interest income is recognized using the rate of interest used to discount the future cash flows for the purpose of measuring impairment loss. 31.3.11 Dividend income Dividend income is recognized in profit or loss when the BPI Group’s right to receive payment is established. 31.3.12 Transaction costs Transaction costs are expensed as incurred for financial instruments classified or designated as FVTPL. For other financial instruments, transaction costs are capitalized on initial recognition. For financial assets and financial liabilities measured at amortized cost, capitalized transaction costs are amortized through net income over the estiamted life of the instrument using the effective interest method. For financial assets measured at FVOCI (AFS financial assets under PAS 39) the do not have fixed or determinable payments and no fixed maturity, capitalized transaction costs are recognized in net income when the asset is derecognized or becomes impaired.

(100)
31.3.13 Offsetting of financial instruments Financial assets and liabilities are offset and the net amount reported in the statements of condition when there is a legally enforceable right to offset the recognized amounts and there is an intention to settle on a net basis, or realize the asset and settle the liability simultaneously. As at December 31, 2018 and 2017, there are no financial assets and liabilities that have been offset. 31.3.14 Cash and cash equivalents Cash and cash equivalents consist of Cash and other cash items, Due from BSP, Due from other banks, and Interbank loans receivable and securities purchased under agreements to resell with maturities of less than three months from the date of acquisition and that are subject to insignificant risk of changes in value. 31.3.15 Repurchase and reverse repurchase agreements (PFRS 9 and PAS 39) Securities sold subject to repurchase agreements (‘repos’) are reclassified in the financial statements as pledged assets when the transferee has the right by contract or custom to sell or repledge the collateral; the counterparty liability is included in deposits from banks or deposits from customers, as appropriate. The difference between sale and repurchase price is treated as interest and accrued over the life of the agreements using the effective interest method. Securities purchased under agreements to resell (‘reverse repos’) are recorded as loans and advances to other banks and customers and included in the statements of condition under “Interbank loans receivable and securities purchased under agreements to resell”. Securities lent to counterparties are also retained in the financial statements. 31.4 Consolidation The subsidiaries financial statements are prepared for the same reporting year as the consolidated financial statements. Refer to Note 1 for the list of the Parent Bank’s subsidiaries. (a) Subsidiaries Subsidiaries are all entities over which the BPI Group has control. The BPI Group controls an entity when it is exposed to, or has rights to, variable returns from its involvement with the entity and has the ability to affect those returns through its power over the entity. The BPI Group also assesses existence of control where it does not have more than 50% of the voting power but is able to govern the financial and operating policies by virtue of de-facto control. De-facto control may arise in circumstances where the size of the BPI Group’s voting rights relative to the size and dispersion of holdings of other shareholders give the BPI Group the power to govern the financial and operating policies. Subsidiaries are fully consolidated from the date on which control is transferred to the BPI Group. They are de-consolidated from the date that control ceases. The BPI Group applies the acquisition method of accounting to account for business combinations. The consideration transferred for the acquisition of a subsidiary is the fair values of the assets transferred, the liabilities incurred to the former owners of the acquiree and the equity interests issued by the BPI Group. The consideration transferred includes the fair value of any asset or liability resulting from a contingent consideration arrangement. Acquisition-related costs are expensed as incurred. Identifiable assets acquired and liabilities and contingent liabilities assumed in a business combination are measured initially at their fair values at the acquisition date. On an acquisition-by-acquisition basis, the BPI Group recognizes any non-controlling interest in the acquiree either at fair value or at the non-controlling interest’s proportionate share of the acquiree’s identifiable net assets. If the business combination is achieved in stages, the acquisition date carrying value of the acquirer’s previously held equity interest in the acquiree is remeasured to fair value at the acquisition date through profit or loss.

(101)
Any contingent consideration to be transferred by the BPI Group is recognized at fair value at the acquisition date. Subsequent changes to the fair value of the contingent consideration that is deemed to be an asset or liability is recognized in accordance with PFRS 9 (PAS 39 in 2017) either in profit or loss or as a change to other comprehensive income. Contingent consideration that is classified as equity is not re-measured, and its subsequent settlement is not accounted for within equity. The excess of the aggregate of the consideration transferred, the amount of any non-controlling interest in the acquiree and the acquisition-date fair value of any previous equity interest in the acquiree over the fair value of the BPI Group’s share of the identifiable net assets acquired is recorded as goodwill. If the total of consideration transferred, non-controlling interest recognized and previously held interest measured is less than the fair value of the net assets of the subsidiary acquired in the case of a bargain purchase, the difference is recognized directly in profit or loss. Inter-company transactions, balances and unrealized gains on transactions between group companies are eliminated. Unrealized losses are also eliminated. Accounting policies of subsidiaries have been changed where necessary to ensure consistency with the policies adopted by the BPI Group, except for the pre-need subsidiary which follows the provisions of the PNUCA as allowed by the SEC. When the BPI Group ceases to have control, any retained interest in the entity is re-measured to its fair value at the date when control is lost, with the change in carrying amount recognized in profit or loss. The fair value is the initial carrying amount for purposes of subsequently accounting for the retained interest as an associate, joint venture or financial asset. In addition, any amounts previously recognized in other comprehensive income in respect of that entity are accounted for as if the BPI Group had directly disposed of the related assets or liabilities. This may mean that amounts previously recognized in other comprehensive income are reclassified to profit or loss. (b) Transactions with non-controlling interests Transactions with non-controlling interests that do not result in loss of control are accounted for as equity transactions - that is, as transactions with the owners in their capacity as owners. For purchases from non-controlling interests, the difference between any consideration paid and the relevant share acquired of the carrying value of net assets of the subsidiary is recorded in equity. Gains or losses on disposals to non-controlling interests are also recorded in equity. Interests in the equity of subsidiaries not attributable to the Parent Bank are reported in consolidated equity as non-controlling interests. Profits or losses attributable to non-controlling interests are reported in the statements of income as net income (loss) attributable to non-controlling interests. (c) Associates Associates are all entities over which the BPI Group has significant influence but not control, generally accompanying a shareholding of between 20% and 50% of the voting rights. Investments in associates in the consolidated financial statements are accounted for using the equity method of accounting. Under the equity method, the investment is initially recognized at cost and the carrying amount is increased or decreased to recognize the investor’s share of the profit or loss of the investee after the date of acquisition. The BPI Group’s investment in associates includes goodwill identified on acquisition (net of any accumulated impairment loss). If the ownership interest in an associate is reduced but significant influence is retained, a proportionate share of the amounts previously recognized in other comprehensive income is reclassified to profit or loss where appropriate. The BPI Group’s share of its associates’ post-acquisition profits or losses is recognized in profit or loss, and its share of post-acquisition movements in reserves is recognized in other comprehensive income. The cumulative post-acquisition movements are adjusted against the carrying amount of the investment. When the BPI Group’s share of losses in an associate equals or exceeds its interest in the associate, including any other unsecured receivables, the BPI Group does not recognize further losses, unless it has incurred legal or constructive obligations or made payments on behalf of the associate.

(102)
The BPI Group determines at each reporting date whether there is any objective evidence that the investment in the associate is impaired. If this is the case, the BPI Group calculates the amount of impairment as the difference between the recoverable amount of the associate and its carrying value and recognizes the amount adjacent to ‘share of profit (loss) of an associate’ in profit or loss. Unrealized gains on transactions between the BPI Group and its associates are eliminated to the extent of the BPI Group’s interest in the associates. Unrealized losses are also eliminated unless the transaction provides evidence of an impairment of the asset transferred. Accounting policies of associates have been changed where necessary to ensure consistency with the policies adopted by the BPI Group. 31.5 Investments in subsidiaries and associates Investments in subsidiaries and associates in the Parent Bank’s separate financial statements are accounted for using the cost method in accordance with PAS 27. Under this method, income from investment is recognized in profit or loss only to the extent that the investor receives distributions from accumulated profits of the investee arising after the acquisition date. Distributions received in excess of such profits are regarded as a recovery of investment and are recognized as reduction of the cost of the investment. The Parent Bank recognizes a dividend from a subsidiary or associate in profit or loss in its separate financial statements when its right to receive the dividend is established. The Parent Bank determines at each reporting date whether there is any indicator of impairment that the investment in the subsidiary or associate is impaired. If this is the case, the Parent Bank calculates the amount of impairment as the difference between the recoverable amount and carrying value and the difference is recognized in profit or loss. Investments in subsidiaries and associates are derecognized upon disposal or when no future economic benefits are expected to be derived from the subsidiaries and associates at which time the cost and the related accumulated impairment loss are removed in the statements of condition. Any gains and losses on disposal is determined by comparing the proceeds with the carrying amount of the investment and recognized in profit or loss. 31.6 Segment reporting Operating segments are reported in a manner consistent with the internal reporting provided to the chief executive officer who allocates resources to, and assesses the performance of the operating segments of the BPI Group. All transactions between business segments are conducted on an arm’s length basis, with intra-segment revenue and costs being eliminated upon consolidation. Income and expenses directly associated with each segment are included in determining business segment performance. In accordance with PFRS 8, the BPI Group has the following main banking business segments: consumer banking, corporate banking and investment banking. Its insurance business is assessed separately from these banking business segments (Note 3). 31.7 Bank premises, furniture, fixtures and equipment Land and buildings comprise mainly of branches and offices. All bank premises, furniture, fixtures and equipment are stated at historical cost less accumulated depreciation. Historical cost includes expenditure that is directly attributable to the acquisition of an asset which comprises its purchase price, import duties and any directly attributable costs of bringing the asset to its working condition and location for its intended use. Subsequent costs are included in the asset’s carrying amount or are recognized as a separate asset, as appropriate, only when it is probable that future economic benefits associated with the item will flow to the BPI Group and the cost of the item can be measured reliably. All other repairs and maintenance are charged to profit or loss during the year in which they are incurred.

(103)
Land is not depreciated. Depreciation for buildings and furniture and equipment is calculated using the straight-line method to allocate cost or residual values over the estimated useful lives of the assets, as follows:
Building 25-50 years Furniture and equipment 3-5 years Equipment for lease 2-8 years
Leasehold improvements are depreciated over the shorter of the lease term (ranges from 5 to 10 years) and the useful life of the related improvement (ranges from 5 to 10 years). Major renovations are depreciated over the remaining useful life of the related asset. The assets’ residual values and useful lives are reviewed, and adjusted if appropriate, at each reporting date. Assets are reviewed for impairment whenever events or changes in circumstances indicate that the carrying amount may not be recoverable. An asset’s carrying amount is written down immediately to its recoverable amount if the asset’s carrying amount is greater than its estimated recoverable amount. The recoverable amount is the higher of an asset’s fair value less costs to sell and value in use. There are no bank premises, furniture, fixtures and equipment that are fully impaired as at December 31, 2018 and 2017. An item of Bank premises, furniture, fixtures and equipment is derecognized upon disposal or when no future economic benefits are expected to arise from the continued use of the asset. Any gain or loss arising on derecognition of the asset (calculated as the difference between the net disposal proceeds and the carrying amount of the item) is included in profit or loss in the period the item is derecognized. 31.8 Investment properties Properties that are held either to earn rental income or for capital appreciation or both, and that are not significantly occupied by the BPI Group are classified as investment properties. Transfers to, and from, investment property are made when, and only when, there is a change in use, evidenced by: (a) Commencement of owner-occupation, for a transfer from investment property to owner-occupied property; (b) Commencement of development with a view of sale, for a transfer from investment property to real properties
held-for-sale and development; (c) End of owner occupation, for a transfer from owner-occupied property to investment property; or (d) Commencement of an operating lease to another party, for a transfer from real properties held-for-sale and
development to investment property. Transfers to and from investment property do not result in gain or loss. Investment properties comprise land and building. Investment properties are measured initially at cost, including transaction costs. Subsequent to initial recognition, investment properties are stated at cost less accumulated depreciation and impairment losses, if any. Depreciation on investment property is determined using the same policy as applied to Bank premises, furniture, fixtures, and equipment. Impairment test is conducted when there is an indication that the carrying amount of the asset may not be recovered. An impairment loss is recognized for the amount by which the property’s carrying amount exceeds its recoverable amount, which is the higher of the property’s fair value less costs to sell and value in use. An item of investment property is derecognized upon disposal or when no future economic benefits are expected to arise from the continued use of the asset. Any gains and losses arising on derecognition of the asset (calculated as the difference between the net disposal proceeds and the carrying amount of the item) is included in profit or loss in the period the item is derecognized.

(104)
31.9 Foreclosed assets Assets foreclosed shown as Assets held for sale in the statements of condition are accounted for at the lower of cost and fair value less cost to sell similar to the principles of PFRS 5. The cost of assets foreclosed includes the carrying amount of the related loan. Impairment loss is recognized for any subsequent write-down of the asset to fair value less cost to sell. Foreclosed assets not classified as Assets held for sale are accounted for in any of the following classification using the measurement basis appropriate to the asset as follows: (a) Investment property is accounted for using the cost model under PAS 40; (b) Bank-occupied property is accounted for using the cost model under PAS 16; and (c) Financial assets are accounted for under PFRS 9 starting January 1, 2018 (PAS 39 was applied until
December 31, 2017). 31.10 Intangible assets (a) Goodwill Goodwill represents the excess of the cost of an acquisition over the fair value of the BPI Group’s share in the net identifiable assets of the acquired subsidiary/associate at the date of acquisition. Goodwill on acquisitions of subsidiaries is included under Other assets, net in the statements of condition. Goodwill on acquisitions of associates is included in Investments in subsidiaries and associates. Separately recognized goodwill is carried at cost less accumulated impairment losses. Gains and losses on the disposal of a subsidiary/associate include carrying amount of goodwill relating to the subsidiary/associate sold. Goodwill is an indefinite-lived intangible asset and hence not subject to amortization. Goodwill is allocated to cash-generating units for the purpose of impairment testing. Each cash-generating unit is represented by each primary reporting segment. Goodwill impairment reviews are undertaken annually or more frequently if events or changes in circumstances indicate a potential impairment. The carrying value of goodwill is compared to the recoverable amount, which is the higher of value in use and the fair value less costs to sell. Any impairment is recognized immediately as an expense and is not subsequently reversed. (b) Contractual customer relationships Contractual customer relationships acquired in a business combination are recognized at fair value at the acquisition date. The contractual customer relationships have finite useful lives of ten years and are carried at cost less accumulated amortization. Amortization is calculated using the straight-line method over the expected life of the customer relationship. Contractual customer relationships are included under Other assets, net in the statements of condition. (c) Computer software Acquired computer software licenses are capitalized on the basis of the costs incurred to acquire and bring to use the specific software. These costs are amortized on a straight-line basis over the expected useful lives (three to five years). Computer software is included under Other assets, net in the statements of condition.

(105)
Costs associated with maintaining computer software programs are recognized as an expense as incurred. Development costs that are directly attributable to the design and testing of identifiable and unique software products controlled by the BPI Group are recognized as intangible assets when the following criteria are met:
it is technically feasible to complete the software product so that it will be available for use;
management intends to complete the software product and use or sell it; there is an ability to use or sell the software product;
it can be demonstrated how the software product will generate probable future economic benefits;
adequate technical, financial and other assets to complete the development and to use or sell the software product are available; and
the expenditure attributable to the software product during its development can be reliably measured.
Directly attributable costs that are capitalized as part of the software product include the software development employee costs and an appropriate portion of relevant overheads. Other development expenditures that do not meet these criteria are recognized as an expense when incurred. Development costs previously recognized as an expense are not recognized as an asset in a subsequent period. 31.11 Impairment of non-financial assets Assets that have indefinite useful lives - for example, goodwill or intangible assets not ready for use - are not subject to amortization and are tested annually for impairment and more frequently if there are indicators of impairment. Assets that have definite useful lives are subject to amortization and are reviewed for impairment whenever events or changes in circumstances indicate that the carrying amount may not be recoverable. An impairment loss is recognized for the amount by which the asset’s carrying amount exceeds its recoverable amount. The recoverable amount is the higher of an asset’s fair value less costs to sell and value in use. For purposes of assessing impairment, assets are grouped at the lowest levels for which there are separately identifiable cash flows (cash-generating units). Non-financial assets other than goodwill that suffered impairment are reviewed for possible reversal of impairment at each reporting date. 31.12 Borrowings and borrowing costs The BPI Group’s borrowings consist mainly of bills payable and other borrowed funds. Borrowings are recognized initially at fair value, being their issue proceeds, net of transaction costs incurred. Borrowings are subsequently carried at amortized cost; any difference between the proceeds (net of transaction costs) and the redemption value is recognized in profit or loss over the period of the borrowings using the effective interest method. Borrowing costs that are directly attributable to the acquisition, construction or production of a qualifying asset are capitalized as part of the cost of the asset. All other borrowing costs are expensed as incurred. The BPI Group has no qualifying asset as at December 31, 2018 and 2017. Borrowings derecognized when the obligation specified in the contract is discharged, cancelled or expired. The difference between the carrying amount of a financial liability that has been extinguished or transferred to another party and the consideration paid, including any non-cash assets transferred or liabilities assumed, is recognized in te Statements of Income as other income. 31.13 Fees and commission income Starting January 1, 2018, the BPI Group has applied PFRS 15 where revenue is recognized when (or as) The BPI Group satisfies a performance obligation by transferring a promised good or service to a customer (i.e. an asset). An asset is transferred when (or as) the customer obtains control of that asset. The recognition of revenue can be either over time or at a point in time depending on when the performance obligation is satisfied.

(106)
When control of a good or service is transferred over time, that is, when the customer simultaneously receives and consumes the benefits, the BPI Group satisfies the performance obligation and recognizes revenue over time. Otherwise, revenue is recognized at the point in time at the point of transfer control of the good or service to the customer. Variable consideration is measured using either the expected value method or the most likely amount method depending on which method the BPI Group expects to better predict the amount of consideration to which it will be entitled. This is the estimated amount of variable consideration, or the portion, if any, of that amount for which it is highly probable that a significant reversal in the amount of cumulative revenue recognized will not occur. Where there is a single performance obligation, the transaction price is allocated in its entirety to that performance obligation. Where there are multiple performance obligations, the transaction price is allocated to the performance obligation to which it relates based on stand-alone selling prices. The BPI Group recognizes revenue based on the price specified in the contract, net of the estimated rebates/discounts and include variable consideration, if there is any. Accumulated experience is used to estimate and provide for the discounts and revenue is only recognized to the extent that it is highly probable that a significant reversal will not occur. The BPI Group does not expect to have any contracts where the period between the transfer of the promised goods or services to the customer and payment by the customer exceeds one year. As a consequence, the BPI Group does not adjust any of the transaction prices for the time value of money. There are no warranties and other similar obligation and refunds agreed with customers. Until December 31, 2017, the BPI Group recognizes revenue under PAS 18. Fees and commissions are generally recognized on an accrual basis when the service has been provided. Commission and fees arising from negotiating or participating in the negotiation of a transaction for a third party (i.e. the arrangement of the acquisition of shares or other securities, or the purchase or sale of businesses) are recognized on completion of underlying transactions. Portfolio and other management advisory and service fees are recognized based on the applicable service contracts, usually on a time-proportionate basis. Asset management fees related to investment funds are recognized ratably over the period in which the service is provided. 31.14 Credit card income Credit card arrangements involve numerous contracts between various parties. The BPI Group has determined that the more significant contracts within the scope of PFRS 15 are (1) the contract between the BPI Group and the credit card holder (‘Cardholder Agreement’) under which the BPI Group earn miscellaneous fees (e.g., late payment fees, over-limit fees, foreign exchange fees, etc.) and (2) an implied contract between the BPI Group and merchants who accept the credit cards in connection with the purchase of their goods and/or services (‘Merchant Agreement’) under which the BPI Group earn interchange fees. The Cardholder Agreement obligates the Bank, as the card issuer, to perform activities such as redeem loyalty points by providing goods, cash or services to the cardholder; provide ancillary services such as concierge services, travel insurance, airport lounge access and the like; process late payments; provide foreign exchange services and others. The amount of fees stated in the contract represents the transaction price for that performance obligation. The implied contract between the BPI Group and the merchant results in the BPI Group receiving an interchange fee from the merchant. The interchange fee represents the transaction price associated with the implied contract between the BPI Group and the merchant because it represents the amount of consideration to which the BPI Group expects to be entitled in exchange for transferring the promised service (i.e., purchase approval and payment remittance) to the merchant. The performance obligation associated with the implied contract between the BPI Group and the merchant is satisfied upon performance and simultaneous consumption by the customer of the underlying service (i.e. purchase approval and payment remittance). Therefore, the interchange fee is recognized as revenue each time the BPI Group approves a purchase and remits payment to the merchant.

(107)
31.15 Foreign currency translation (a) Functional and presentation currency Items in the financial statements of each entity in the BPI Group are measured using the currency of the primary economic environment in which the entity operates (the “functional currency”). The financial statements are presented in Philippine Peso, which is the Parent Bank’s functional and presentation currency. (b) Transactions and balances Foreign currency transactions are translated into the functional currency using the exchange rates prevailing at the dates of the transactions or valuation where items are remeasured. Foreign exchange gains and losses resulting from the settlement of such transactions and from the translation at year-end exchange rates of monetary assets and liabilities denominated in foreign currencies are recognized in profit or loss. Non-monetary items measured at historical cost denominated in a foreign currency are translated at exchange rates as at the date of initial recognition. Non-monetary items in a foreign currency that are measured at fair value are translated using the exchange rates at the date when the fair value is determined. Changes in the fair value of monetary securities denominated in foreign currency classified as financial assets at FVOCI are analyzed between translation differences resulting from changes in the amortized cost of the security, and other changes in the carrying amount of the security. Translation differences are recognized in profit or loss, and other changes in carrying amount are recognized in other comprehensive income. Translation differences on non-monetary financial instruments, such as equities held at fair value through profit or loss, are reported as part of the fair value gain or loss recognized under “Trading gain/loss on securities” in the statements of income. Translation differences on non-monetary financial instruments, such as equities classified as financial assets at FVOCI, are included in Accumulated other comprehensive income (loss) in the capital funds. (c) Foreign subsidiaries The results and financial position of BPI’s foreign subsidiaries (none of which has the currency of a hyperinflationary economy) that have a functional currency different from the presentation currency are translated into the presentation currency as follows: (i) assets and liabilities are translated at the closing rate at reporting date; (ii) income and expenses are translated at average exchange rates (unless this average is not a reasonable
approximation of the cumulative effect of the rates prevailing on the transaction dates, in which case income and expenses are translated at the dates of the transactions); and
(iii) all resulting exchange differences are recognized as a separate component (Currency translation differences) of Accumulated other comprehensive income (loss) in the capital funds. When a foreign operation is sold, such exchange differences are recognized in profit or loss as part of the gain or loss on sale.
31.16 Accrued expenses and other liabilities Accrued expenses and other liabilities are recognized in the period in which the related money, goods or services are received or when a legally enforceable claim against the BPI Group is established. 31.17 Provisions for legal or contractual obligations Provisions are recognized when all of the following conditions are met: (i) the BPI Group has a present legal or constructive obligation as a result of past events; (ii) it is probable that an outflow of resources will be required to settle the obligation; and (iii) the amount has been reliably estimated. Provisions are not recognized for future operating losses. Where there are a number of similar obligations, the likelihood that an outflow will be required in settlement is determined by considering the class of obligations as a whole. A provision is recognized even if the likelihood of an outflow with respect to any one item is included in the same class of obligations may be small.

(108)
Provisions are measured at the present value of the expenditures expected to be required to settle the obligation using a pre-tax rate that reflects the current market assessments of the time value of money and the risk specific to the obligation. The increase in the provision due to the passage of time is recognized as interest expense. 31.18 Income taxes (a) Current income tax Income tax payable is calculated on the basis of the applicable tax law in the respective jurisdiction and is recognized as an expense for the year except to the extent that current tax is related to items (for example, current tax on financial assets at FVOCI) that are charged or credited in other comprehensive income or directly to capital funds. The BPI Group has substantial income from its investment in government securities subject to final withholding tax. Such income is presented at its gross amount and the final tax paid or withheld is included in Provision for income tax - Current. (b) Deferred income tax
Deferred income tax is recognized on temporary differences arising between the tax bases of assets and liabilities and their carrying amounts in the financial statements. The deferred income tax is not accounted for if it arises from initial recognition of an asset or liability in a transaction, other than a business combination, that at the time of the transaction affects neither accounting nor taxable profit or loss. Deferred income tax is determined using tax rates (and laws) that have been enacted or substantively enacted at the reporting date and are expected to apply when the related deferred income tax asset is realized or the deferred income tax liability is settled. Deferred income tax assets are recognized for all deductible temporary differences, carry-forward of unused tax losses (net operating loss carryover or NOLCO) and unused tax credits (excess minimum corporate income tax or MCIT) to the extent that it is probable that future taxable profit will be available against which the temporary differences, unused tax losses and unused tax credits can be utilized. Deferred income tax liabilities are recognized in full for all taxable temporary differences except to the extent that the deferred tax liability arises from the initial recognition of goodwill. The BPI Group reassesses at each reporting date the need to recognize a previously unrecognized deferred income tax asset. Deferred income tax assets are recognized on deductible temporary differences arising from investments in subsidiaries, and associates and joint arrangements only to the extent that it is probable the temporary difference will reverse in the future and there is sufficient taxable profit available against which the temporary difference can be utilized. Deferred income tax liabilities are provided on taxable temporary differences arising from investments in subsidiaries, and associates and joint arrangements, except for deferred income tax liability where the timing of the reversal of the temporary difference is controlled by the BPI Group and it is probable that the temporary difference will not reverse in the foreseeable future. Generally the BPI Group is unable to control the reversal of the temporary difference for associates except when there is an agreement in place that gives the BPI Group the ability to control the reversal of the temporary difference. Deferred income tax assets and liabilities are offset when there is a legally enforceable right to offset current tax assets against current tax liabilities and when the deferred income taxes assets and liabilities relate to income taxes levied by the same taxation authority on either the taxable entity or different taxable entities where there is an intention to settle the balances on a net basis.

(109)
31.19 Employee benefits (a) Short-term benefits The BPI Group recognizes a liability net of amount already paid and an expense for services rendered by employees during the accounting period. Short-term benefits given by to its employees include salaries and wages, social security contributions, short-term compensated absences and bonuses, and non-monetary benefits. Short-term employee benefit obligations are measured on an undiscounted basis and are expensed as the related service is provided. (b) Defined benefit retirement plan The BPI Group has a defined benefit plan that shares risks among entities within the group. A defined benefit plan is a pension plan that defines an amount of pension benefit that an employee will receive on retirement, usually dependent on one or more factors such as age, years of service and compensation. The liability recognized in the statements of condition in respect of defined benefit pension plan is the present value of the defined benefit obligation at the reporting date less the fair value of plan assets. The defined benefit obligation is calculated annually by independent actuaries using the projected unit credit method. The present value of the defined benefit obligation is determined by discounting the estimated future cash outflows using interest rates of government bonds that are denominated in the currency in which the benefits will be paid, and that have terms to maturity approximating the terms of the related pension liability. Defined benefit costs comprise of service cost, net interest on the net defined benefit liability or asset and remeasurements of net defined liability or asset. Service costs which include current service costs, past service costs and gains or losses on non-routine settlements are recognized as expense in the statements of income. Past service costs are recognized when the plan amendment or curtailment occurs. Net interest on the net defined benefit liability or asset is the change during the period in the net defined benefit liability or asset that arises from the passage of time which is determined by applying the discount rate based on government bonds to the net defined benefit liability or asset. Net interest on the net defined benefit liability or asset is recognized as interest income or expense in the statements of income. Actuarial gains and losses arising from experience adjustments and changes in actuarial assumptions are charged or credited to equity in other comprehensive income in the period in which they arise. For individual financial reporting purposes, the unified plan assets are allocated among the BPI Group entities based on the level of the defined benefit obligation attributable to each entity to arrive at the net liability or asset that should be recognized in the individual financial statements. (c) Defined contribution retirement plan The BPI Group also maintains a defined contribution plan that covers certain full-time employees. Under its defined contribution plan, the BPI Group pays fixed contributions based on the employees’ monthly salaries. The BPI Group, however, is covered under RA No. 7641, otherwise known as The Philippine Retirement Pay Law, which provides for its qualified employees a defined benefit minimum guarantee. The defined benefit minimum guarantee is equivalent to a certain percentage of the monthly salary payable to an employee at normal retirement age with the required credited years of service based on the provisions of RA No. 7641. Accordingly, the BPI Group accounts for its retirement obligation under the higher of the defined benefit obligation relating to the minimum guarantee and the obligation arising from the defined contribution plan.

(110)
For the defined benefit minimum guarantee plan, the liability is determined based on the present value of the excess of the projected defined benefit obligation over the projected defined contribution obligation at the end of the reporting period. The defined benefit obligation is calculated annually by a qualified independent actuary using the projected unit credit method. The BPI Group and Parent Bank determine the net interest expense (income) on the net defined benefit liability (asset) for the period by applying the discount rate used to measure the defined benefit obligation at the beginning of the annual period to the net defined benefit liability (asset) then, taking into account any changes in the net defined benefit liability (asset) during the period as a result of contributions and benefit payments. Net interest and other expenses related to the defined benefit plan are recognized in the statements of income. The defined contribution liability is measured at the fair value of the defined contribution assets upon which the defined contribution benefits depend, with an adjustment for margin on asset returns, if any, where this is reflected in the defined contribution benefits. Actuarial gains and losses arising from the remeasurements of the net defined contribution liability are recognized immediately in the other comprehensive income. (d) Share-based compensation The BPI Group engages in equity-settled share-based payment transactions in respect of services received from certain employees. The fair value of the services received is measured by reference to the fair value of the shares or share options granted on the date of the grant. The cost of employee services received in respect of the shares or share options granted is recognized in profit or loss (with a corresponding increase in reserve in capital funds) over the period that the services are received, which is the vesting period. The fair value of the options granted is determined using option pricing models which take into account the exercise price of the option, the current share price, the risk-free interest rate, the expected volatility of the share price over the life of the option and other relevant factors. When the stock options are exercised, the proceeds received, net of any directly attributable transaction costs, are credited to share capital (par value) and share premium for the excess of exercise price over par value. (e) Profit sharing and bonus plans The BPI Group recognizes a liability and an expense for bonuses and profit-sharing, based on a formula that takes into consideration the profit attributable to the Parent Bank’s shareholders after certain adjustments. The BPI Group recognizes a provision where contractually obliged or where there is a past practice that has created a constructive obligation. 31.20 Capital funds Share capital, comprising common shares, is classified as equity. Share premium includes any premiums or consideration received in excess of par value on the issuance of share capital. Incremental costs directly attributable to the issue of new shares or options are shown in capital funds as a deduction from the proceeds, net of tax.

(111)
31.21 Earnings per share (EPS) Basic EPS is calculated by dividing income applicable to common shares by the weighted average number of common shares outstanding during the year with retroactive adjustments for stock dividends. In case of a rights issue, an adjustment factor is being considered for the weighted average number of shares outstanding for all periods before the rights issue. Diluted EPS is computed in the same manner as basic EPS, however, net income attributable to common shares and the weighted average number of shares outstanding are adjusted for the effects of all dilutive potential common shares. 31.22 Dividends on common shares Dividends on common shares are recognized as a liability in the BPI Group’s financial statements in the period in which the dividends are approved by the BOD. 31.23 Fiduciary activities The BPI Group commonly acts as trustee and in other fiduciary capacities that result in the holding or placing of assets on behalf of individuals, trusts, retirement benefit plans and other institutions. These assets and income arising thereon are excluded from these financial statements, as they are not assets of the BPI Group (Note 25). 31.24 Leases (a) BPI Group is the lessee
(i) Operating lease
Leases in which a significant portion of the risks and rewards of ownership are retained by another party, the lessor, are classified as operating leases. Payments, including prepayments, made under operating leases (net of any incentives received from the lessor) are charged to “Occupancy and equipment-related expenses” in the statements of income on a straight-line basis over the period of the lease. When an operating lease is terminated before the lease period has expired, any payment required to be made to the lessor by way of penalty is recognized as an expense in the period in which the termination takes place.
(ii) Finance lease Leases of assets, where the BPI Group has substantially all the risks and rewards of ownership, are classified as finance leases. Finance leases are capitalized at the commencement of the lease at the lower of the fair value of the leased property and the present value of the minimum lease payments. Each lease payment is allocated between the liability and finance charges so as to achieve a constant rate on the finance balance outstanding. The interest element of the finance cost is charged to profit or loss over the lease period so as to produce a constant periodic rate of interest on the remaining balance of the liability for each period.
(b) BPI Group is the lessor
(i) Operating lease Properties (land and building) leased out under operating leases are included in “Investment properties” in the statements of condition. Rental income under operating leases is recognized in profit or loss on a straight-line basis over the period of the lease.
(ii) Finance lease
When assets are leased out under a finance lease, the present value of the lease payments is recognized as a receivable. The difference between the gross receivable and the present value of the receivable is recognized as unearned finance income. Lease income under finance lease is recognized over the term of the lease using the net investment method before tax, which reflects a constant periodic rate of return.

(112)
31.25 Insurance and pre-need operations (a) Non-life insurance The more significant accounting policies observed by the non-life insurance subsidiaries follow: (a) gross premiums written from short-term insurance contracts are recognized at the inception date of the risks underwritten and are earned over the period of cover in accordance with the incidence of risk using the 24th method; (b) acquisition costs are deferred and charged to expense in proportion to the premium revenue recognized; reinsurance commissions are deferred and deducted from the applicable deferred acquisition costs, subject to the same amortization method as the related acquisition costs; (c) a liability adequacy test is performed which compares the subsidiaries’ reported insurance contract liabilities against current best estimates of all contractual future cash flows and claims handling, and policy administration expenses as well as investment income backing up such liabilities, with any deficiency immediately charged to profit or loss; (d) amounts recoverable from reinsurers and loss adjustment expenses are classified as assets, with an allowance for estimated uncollectible amounts; and (e) financial assets and liabilities are measured following the classification and valuation provisions of PFRS 9. (b) Pre-need The more significant provisions of the PNUCA as applied by the pre-need subsidiary follow: (a) premium income from sale of pre-need plans is recognized as earned when collected; (b) costs of contracts issued and other direct costs and expenses are recognized as expense when incurred; (c) pre-need reserves which represent the accrued net liabilities of the subsidiary to its plan holders are actuarially computed based on standards and guidelines set forth by the Insurance Commission; the increase or decrease in the account is charged or credited to other costs of contracts issued in profit or loss; and (d) insurance premium reserves which represent the amount that must be set aside by the subsidiary to pay for premiums for insurance coverage of fully paid plan holders, are actuarially computed based on standards and guidelines set forth by the Insurance Commission. 31.26 Related party relationships and transactions Related party relationship exists when one party has the ability to control, directly, or indirectly through one or more intermediaries, the other party or exercises significant influence over the other party in making financial and operating decisions. Such relationship also exists between and/or among entities which are under common control with the reporting enterprise, or between and/or among the reporting enterprise and its key management personnel, directors, or its shareholders. In considering each possible related party relationship, attention is directed to the substance of the relationship, and not merely the legal form. 31.27 Comparatives Except when a standard or an interpretation permits or requires otherwise, all amounts are reported or disclosed with comparative information. Where PAS 8 applies, comparative figures have been adjusted to conform with changes in presentation in the current year. There were no changes to the presentation made during the year. 31.28 Reclassification Certain amounts have been reclassified in the statements of condition in the prior year to conform to the current year’s presentation of other assets. 31.29 Subsequent events (or Events after the reporting date) Post year-end events that provide additional information about the BPI Group’s financial position at the reporting date (adjusting events) are reflected in the financial statements. Post year-end events that are not adjusting events are disclosed in the notes to financial statements when material.

(113)
Note 32 - Supplementary information required by the Bureau of Internal Revenue On December 28, 2010, Revenue Regulations (RR) No. 15-2010 became effective and amended certain provisions of RR No. 21-2002 prescribing the manner of compliance with any documentary and/or procedural requirements in connection with the preparation and submission of financial statements and income tax returns. Section 2 of RR No. 21-2002 was further amended to include in the Notes to Financial Statements information on taxes, duties and license fees paid or accrued during the year in addition to what is mandated by PFRS. Below is the additional information required by RR No. 15-2010 that is relevant to the Parent Bank. This information is presented for purposes of filing with the Bureau of Internal Revenue (BIR) and is not a required part of the basic financial statements. (i) Documentary stamp tax
Documentary stamp taxes paid through the Electronic Documentary Stamp Tax System for the year ended December 31, 2018 consist of:
(In Millions of Pesos) Amount Deposit and loan documents 6,990 Trade finance documents 639 Mortgage documents 467 Shares of stocks 56 Others 7 8,159
(ii) Withholding taxes
Withholding taxes paid/accrued and/or withheld for the year ended December 31, 2018 consist of:
(In Millions of Pesos) Amount
Paid Accrued Total Income taxes withheld on compensation 1,566 177 1,743
Final income taxes withheld on interest on deposits and yield on deposit substitutes 2,178 244 2,422
Final income taxes withheld on income payment 643 29 672
Creditable income taxes withheld (expanded) 409 53 462
Fringe benefit tax 145 34 179
VAT withholding tax 47 12 59
4,988 549 5,537
(iii) All other local and national taxes
All other local and national taxes paid/accrued for the year ended December 31, 2018 consist of:
(In Millions of Pesos) Amount
Paid Accrued Total Gross receipts tax 3,014 407 3,421
Real property tax 128 - 128
Municipal taxes 168 - 168
Others 6 - 6
3,316 407 3,723

(114)
Local and national taxes imposed by the government which are incurred under the normal courses of business are part of “Taxes and Licenses” within Other Operating Expense (Note 21).
(iv) Tax cases and assessments As at reporting date, the Parent Bank has pending cases filed in courts and with the tax authorities contesting certain tax assessments and for various claims for tax refund. Management is of the opinion that the ultimate outcome of the said cases will not have a material impact on the financial statements of the Parent Bank.

BANK OF THE PHILIPPINE ISLANDS
Financial Indicators As at December 31, 2018 and 2017
2018 2017
Liquidity Ratio 62.04% 66.11%
Debt-to-Equity Ratio 67.17% 46.22%
Asset-to-Equity Ratio 839.06% 1053.69%
Interest Rate Coverage Ratio 242.92% 284.99%
Return on Equity Ratio 10.21% 12.75%
Return on Assets 1.20% 1.27%
Cost to Income Ratio 55.53% 54.26%
Cost to Assets Ratio 2.27% 2.19%
Capital to Assets Ratio 11.92% 9.49%
Net Interest Margin 3.11% 2.91%

pwc Statements Required by Rule 68 ~rities Regulation Code (SRC),
To the Board of Directors and Shareholders of Bank .of the Philippine Islands BP1 BUiilding, Ayala Avenue Makati1 City
Isla Lipana & Co.
We have audited the financial statements of Bank of the Philippine Islands, as at and for the year ended December 31, 2018, on which we have rendered the attached report dated February 22, 2019. The supplementary information shown in the Reconciliation of Retained Earnings Available for Dividend Declaration, Map of the Conglomerate or Group of Companies within which the Bank of the Philippine Islands belongs and the Schedule of Philippine Financial Reporting Standards effective as at December 31, 2018, as additional components required by Part I, Section 4 of Rule 68 of the Securities Regulation Code, and Schedules A, B, C, D, E, F, G and H, as required by Part ll, Section 6 of Rule 68 of the Securities Regulation Code, is presented for purposes of filing with the Securities and Exchange Commission and is not a required part of the basic financial statements. Such supplementary information is the 11esponsibility of management and has been subjected to the auditing procedures applied in the audit of the basic financial statements. In our opinion, the supplementary information has been prepared in accordance with Rule 68 of the Securities Regulation Code.
Isla Li.pana & Co. ~
r::.c. -~ aldy D. Aguirre
Partne:r CPA Cert No. 105660 P.T.R. No. 0024447, issued on January 8, 2019, Makati City SECA.N. (individual) as general auditors 1176-AR-2, Category A; effective until June 20, 2021 SECA.N. (firm) as general auditors 0009-FR-s, Category A; effective until June 20, 2021 TIN 22.1-755-698 BIR A.N. o8-000745-77-2018, issued on January 29, 2018; effective until January 28, 2021 BOA/ PRC Reg. No. 0142, effective until September 30, 2020
Makati City February 22, 2019
Ts/a Upc111a & Co., 29th Floor, Pltilamlife Tower, 8767 Paseo de Roxas. 1226 Makoti City, Philippines 1: +63 (2) 845 2728, F: +63 (2) 845 2806, www.pwc.com/ ph
Isla Ltpana & Co. ts lhe Philippine member flrm of the PwC network. PwC refers to the Phllipptoe member firm. and may sometimes refer to the PwC network Eaclt mernber ftrm ts a stiparate legal onttty Please see www.pwc com/structure lor turther detatls.

Reconciliation of Retained Earnings Available for Dividend Declaration For the Year Ended December 31, 2018
(In Millions of Pesos)
BANK OF THE PHILIPPINE ISLANDS BPI Building
6768 Ayala Avenue, Corner Paseo de Roxas Makati City
Unappropriated Retained Earnings, based on audited financial statements, December 31, 2017 73,679 Impact of PFRS 9 adoption (178)
Add: Net income actually earned/realized during the period 15,428
Less: Non-actual/unrealized income net of tax - Equity in Net income of associate/joint venture - Unrealized foreign exchange gain - net (except Cash
253
and Cash Equivalents) Unrealized actuarial gain - Unrealized trading gain 399 Fair value adjustment of Investment Property resulting to gain - Adjustment due to deviation from PFRS/GAAP-gain - Other unrealized gains or adjustments to the retained earnings as
-
a result of certain transactions accounted for under PFRS
652
Add: Non-actual losses Depreciation on revaluation increment (after tax) -
Adjustment due to deviation from PFRS/GAAP - loss - Loss on fair value adjustment of investment property (after tax) - Subtotal -
Net income actually earned during the period 14,776
Add (Less): Dividend declarations during the period (8,104) Appropriations of Retained Earnings during the period (3,867) Reversals of appropriations - Effects of prior period adjustments/others - Treasury shares -
(11,971)
Total Retained Earnings, End Available for Dividend 76,306

BANK OF THE PHILIPPINE ISLANDS
BPI FAMILY SAVINGS BANK, INC. 100%
BPI DIRECT BANKO, INC. A SAVINGS BANK 100%
BPI OPERATIONS MGT. CORP. 100%
AYALA PLANS. 98.67%
BPI INVESTMENT MGT.,
INC. 100%
BPI PAYMENTS HOLDINGS INC. 100%
BPI FOREX CORP. 100%
BPI COMPUTER SYSTEMS
CORP. 100%
FIRST FAR-EAST DEV’T CORP. 100%
FEB STOCK BROKERS, INC. 100%
SANTIAGO LAND DEVELOPMENT CORP.
100%
FEB SPEED INT’L 100%
BPI EXPRESS REMITTANCE CORP
USA 100%
BPI EXPRESS REMITTANCE SPAIN
S.A. 100%
GREEN ENTERPRISES S.R.L in LIQUIDATION 100%
BPI ASSET MANAGEMENT and
TRUST CORPORATION 100%
BPI CAPITAL CORP 100%
BPI SECURITIES CORP 100%
BPI CENTURY TOKYO LEASE & FINANCE CORP 51%
BPI CENTURY TOKYO RENTAL CORP. 100%
CITYTRUST SECURITIES CORP. 100%
BPI INT’L FINANCE LIMITED 100%
BPI/MS INSURANCE CORP. 41.40%
FGU INSURANCE CORP 94.62%
BPI REMITTANCE CENTRE (HK) LTD. 100%
BPI/MS INSURANCE CORP. 9.45%
FCS INSURANCE AGENCY 24.92%
BPI EUROPE PLC 100%
FILINVEST ALGO
FINANCIAL CORP. 100%
AF HOLDINGS & MANAGEMENT CORP 100%
BEACON PROPERTY VENTURES, INC. 20%
NATIONAL REINSURANCE CORP. OF THE
PHILIPPINES 13.69%
GLOBAL PAYMENTS ASIA- PACIFIC PHILIPPINES INC.
49%
CITYTRUST REALTY CORP. 40%
AF PAYMENTS, INC 20%
BPI PHILAM LIFE ASSURANCE
CORPORATION 47.67%

Bank of the Philippine Islands
Schedule of Philippine Financial Reporting Standards effective as at December 31, 2018
The following table summarizes the effective standards, amendments and interpretations as at December 31, 2018:
Not Not Adopted Adopted Applicable
Framework for the Preparation and Presentation of Financial Statements Conceptual Framework Phase A: Objectives and qualitative characteristics .;'
PFRSs Practice Statement Management Commentary .;'
Philippine Financial Reporting Standards
PFRS1 First-time Adoption of Philippine Financial .;'
(Revised) Reporting Standards
Amendments to PFRS 1 and PAS 27: Cost of an .;'
Investment in a Subsidiary, Jointly Controlled Entity or Associate
Amendment to PFRS 1: Limited Exemption from .;'
Comparative PFRS 7 Disclosures for First-time Adopters
Amendments to PFRS 1: Severe Hyperinflation and .;'
Removal of Fixed Date for First-time Adopters
Amendments to PFRS 1: Government Loans .;'
PFRS2 Share-based Payment .;'
Amendments to PFRS 2: Vesting Conditions and ,;'
Cancellations
Amendments to PFRS 2: Group Cash-settled .;'
Share-based Payment Transactions
Amendments to PFRS 2: Classification and .;'
Measurement of Share-based Payment Transactions
PFRS3 Business Combinations .;'
(Revised) Amendments to PFRS 3: Definition of a business·x- .;'
PFRS4 Insurance Contracts .;'
Amendments to PAS 39 and PFRS 4: Financial .;'
Guarantee Contracts

Bank of the Philippine Islands Schedule of Philippine Financial Reporting Standards Effective as at December 31, 2018 Page 2
Guarantee Contracts
Amendments to PFRS 4: Applying PFRS 9, Financial Instruments with PFRS 4, Insurance Contracts
PFRS5 Non-current Assets Held for Sale and Discontinued Operations
PFRS6 Exploration for and Evaluation of Mineral Resources
PFRS7 Financial Instruments: Disclosures
Amendments to PAS 39 and PFRS 7: Reclassification of Financial Assets
Amendments to PAS 39 and PFRS 7: Reclassification of Financial Assets - Effective Date and Transition
Amendments to PFRS 7: Improving Disclosures about Financial Instruments
Amendments to PFRS 7: Disclosures - Transfers of Financial Assets
Amendments to PFRS 7: Disclosures - Offsetting Financial Assets and Financial Liabilities
Amendments to PFRS 9, PFRS 7 and PAS 39: Hedge Accounting
Amendments to PFRS 9 and PFRS 7: Mandatory Effective Date and Transition Disclosures
PFRSS Operating Segments
PFRS9 Financial Instruments
Amendments to PFRS 9, PFRS 7 and PAS 39: Hedge Accounting
Amendments to PFRS 9 and PFRS 7: Mandatory Effective Date and Transition Disclosures
Amendments to PFRS 9: Prepayment Features with Negative Compensation*
PFRS10 Consolidated Financial Statements
Amendments to PFRS 10, PFRS 12 and PAS 28: Application of the Consolidation Exception for Investment Entities
Not Not Adopted Adopted Applicable
.,/
.,/
.,/
.,/
.,/
.,/
.,/
.,/
.,/
.,/
.,/
.,/
.,/
.,/
.,/
.,/
.,/
.,/
.,/

Bank of the Philippine Islands Schedule of Philippine Financial Reporting Standards Effective as at December 31, 2018 Page 3
Amendments to PFRS 10 and PAS 28: Sale or Contribution of Assets between an Investor and its Associate or Joint Venture*
PFRS 11 Joint Arrangements
Amendments to PFRS 11: Acquisition of an Interest in a Joint Operation
PFRS12 Disclosure of Interests in Other Entities
Amendments to PFRS 10, PFRS 12 and PAS 28: Application of the Consolidation Exception for Investment Entities
PFRS13 Fair Value Measurement
PFRS14 Regulatory Deferral Accounts
PFRS15 Revenue from Contracts with Customers
Amendments to PFRS 15: Clarifications to PFRS 15
PFRS16 Leases*
PFRS17 Insurance contracts·*
Philippine Accounting Standards
PASt Presentation of Financial Statements (Revised)
Amendment to PAS 1: Capital Disclosures
Amendments to PAS 32 and PAS 1: Puttable Financial Instruments and Obligations Arising on Liquidation
Amendments to PAS 1: Presentation of Items of Other Comprehensive Income
Amendments to PAS 1: Disclosure Initiative
Amendments to PAS 1 and PAS 8: Definition of material*
PAS2 Inventories
PAS7 Statement of Cash Flows
Amendments to PAS 7: Disclosure Initiative
PASS Accounting Policies, Changes in Accounting Estimates and Errors
Not Not Adopted Adopted Applicable
,/
,/
,/
,/
,/
,/
,/
,/
,/
,/
,/
,/
,/
,/
,/
,/
,/
,/
,/
,/
,/

Bank of the Philippine Islands Schedule of Philippine Financial Reporting Standards Effective as at December 31, 2018 Page4
Amendments to PAS 1 and PAS 8: Definition of material*
PAS1o Events after the Reporting Period
PAS12 Income Taxes
Amendment to PAS 16 - Deferred Tax: Recovery of Underlying Assets
Amendments to PAS 12: Recognition of Deferred Tax Assets for Unrealized Losses
PAS16 Property, Plant and Equipment
Amendments to PAS 16 and PAS 38: Acceptable Methods of Depreciation and Amortization
Amendments to PAS 16 and PAS 41: Bearer Plants
PAS17 Leases
PAS19 Employee Benefits (Revised)
Amendments to PAS 19: Contributions from Employees or Third Parties
Amendments to PAS 19: Plan Settlement, Curtailment or Settlement*
PAS2o Accounting for Government Grants and Disclosure of Government Assistance
PAS21 The Effects of Changes in Foreign Exchange Rates
Amendment to PAS 21: Net Investment in a Foreign Operation
PAS23 Borrowing Costs (Revised)
PAS24 Related Party Disclosures (Revised)
PAS26 Accounting and Reporting by Retirement Benefit Plans
PAS27 Separate Financial Statements (Revised)
Amendments to PAS 27= Use of Equity Method in Separate Financial Statements
Not Not Adopted Adopted Applicable
./
./
./
./
./
./
./
./
./
./
./
./
./
./
./
./
./
./
./
./

Bank of the Philippine Islands Schedule of Philippine Financial Reporting Standards Effective as at December 31, 2018 Pages
PAS28 Investments in Associates and Joint Ventures (Revised)
Amendments of PFRS 10, PFRS 12 and PAS 28: Application of the Consolidation Exception for Investment Entities
Amendments to PFRS 10 and PAS 28: Sale or Contributions of Assets between an Investor and its Associate or Joint Venture
Amendment to PAS 28: Measuring an associate or joint venture at fair value
Amendments to PAS 28: Long-term Interests in Associates and Joint Ventures*
PAS29 Financial Reporting in Hyperinflationary Economies
PAS32 Financial Instruments: Presentation
Amendments to PAS 32 and PAS 1: Puttable Financial Instruments and Obligations Arising on Liquidation
Amendment to PAS 32: Classification of Rights Issues
Amendments to PAS 32: Offsetting Financial Assets and Financial Liabilities
PAS33 Earnings per Share
PAS34 Interim Financial Reporting
PAS36 Impairment of Assets
Amendment to PAS 36: Recoverable Amount Disclosures
PAS37 Provisions, Contingent Liabilities and Contingent Assets
PAS38 Intangible Assets
Amendments to PAS 16 and PAS 38: Acceptable Methods of Depreciation and Amortization
PAS40 Investment Property
Amendment to PAS 40: Transfers of Investment Property
PAS41 Agriculture
Not Not Adopted Adopted Applicable
./
./
./
./
./
./
./
./
./
./
./
./
./
./
./
./
./
./
./
./

Bank of the Philippine Islands Schedule of Philippine Financial Reporting Standards Effective as at December 31, 2018 Page 6
Amendments to PAS 16 and PAS 41: Bearer Plants
Philippine Interpretations
IFRIC 1 Changes in Existing Decommissioning, Restoration and Similar Liabilities
IFRIC 2 Members' Share in Co-operative Entities and Similar Instruments
IFRIC4 Determining Whether an Arrangement Contains a Lease
IFRIC5 Rights to Interests arising from Decommissioning, Restoration and Environmental Rehabilitation Funds
IFRIC 6 Liabilities arising from Participating in a Specific Market- Waste Electrical and Electronic Equipment
IFRIC 7 Applying the Restatement Approach under PAS 29 Financial Reporting in Hyperinflationary Economies
IFRIC 10 Interim Financial Reporting and Impairment
IFRIC 12 Service Concession Arrangements
IFRIC 14 The Limit on a Defined Benefit Asset, Minimum Funding Requirements and their Interaction
Amendments to IFRIC 14: Prepayments of a Minimum Funding Requirement
IFRIC 16 Hedges of a Net Investment in a Foreign Operation
IFRIC 17 Distributions of Non-cash Assets to Owners
IFRIC 18 Transfers of Assets from Customers
IFRIC 19 Extinguishing Financial Liabilities with Equity Instruments
IFRIC 20 Stripping Costs in the Production Phase of a Surface Mine
IFRIC 21 Levies
IFRIC 22 Foreign Currency Transactions and Advance Consideration*
IFRIC 23 Uncertainty over Income Tax Treatments*
SIC-7 Introduction of the Euro
Not Not Adopted Adopted Applicable
./
./
./
./
./
./
./
./
./
./
./
./
./
./
./
./
./
./
./
./

Bank of the Philippine Islands Schedule of Philippine Financial Reporting Standards Effective as at December 31, 2018
Page 7
Not Not Adopted Adopted Applicable
SIC-10 Government Assistance- No Specific Relation to ../
Operating Activities
SIC-15 Operating Leases - Incentives ../
SIC-25 Income Taxes - Changes in the Tax Status of an ../
Entity or its Shareholders
SIC-27 Evaluating the Substance of Transactions Involving ../
the Legal Form of a Lease
SIC-29 Service Concession Arrangements: Disclosures ../
SIC-32 Intangible Assets- Web Site Costs ../
The standards, amendments and interpretations marked with an asterisk (*) have been issued but are not yet effective for the December 31, 2018 financial statements. Unless otherwise stated, these standards, amendments and interpretations have not been early adopted.
The standards, amendments and interpretations that are labeled as "Not Applicable" are either already effective or not yet effective as at December 31, 2018 but will never be relevant/applicable to the Company or are currently not relevant to the Company because it has currently no related transactions.

BANK OF THE PHILIPPINE ISLANDS As at December 31, 2018
(in Millions of Pesos)
Schedule A - Financial Assets
Number of shares
or principal amount of bonds
and notes Amount shown in the
balance sheet
Income received and
accrued Due from Bangko Sentral ng Pilipinas 225,907
1,173
Due from other banks 12,477 Interbank loans receivable and Securities
purchase under agreements to resell
34,323 Sub-total 272,707 Financial assets at fair value through profit or
loss - Trading securities (*)
12,688 Financial assets at fair value through profit
or loss - Derivative financial assets
4,033 Sub-total 16,721 303 Financial assets at fair value through other comprehensive income (*)
37,206 278
Investment Securities at amortized cost (*) 287,571 9,035 Loans and advances, net 1,354,896 69,401 Others 5,667 - TOTAL 1,974,768 80,190
(*) Please refer succeeding pages for the detailed information on these financial assets.

BANK OF THE PHILIPPINE ISLANDS As of December 31, 2018
(In millions of Pesos)
Schedule B: Amounts Receivable from Directors, Officers, Employees, Related Parties and Principal Stockholders (Other than Related Parties)
Name and Designation of debtor
Balance at
beginning of period Additions
Amount Collected
Amount written
off Current Not
Current
Balance at end of period
Nothing to report. Transactions with these parties are made under the normal course of business.

BANK OF THE PHILIPPINE ISLANDS December 31, 2018 (In Millions of Pesos)
SCHEDULE C - AMOUNTS RECEIVABLE FROM RELATED PARTIES WHICH ARE ELIMINATED DURING THE CONSOLIDATION OF FINANCIAL STATEMENTS.
Name and designation of debtor
Balance at
beginning of period Additions
Amounts Collected
Amounts written-
off Current Not
Current
Balance at end
of period
BANK OF THE PHILIPPINE ISLANDS 60 - 55 - 5 - 5 BPI CAPITAL CORPORATION 1 61 65 - (2) - (2) BPI CENTURY TOKYO LEASE AND
FINANCE CORP. 24 - 23 - 1 - 1 BPI CENTURY TOKYO RENTAL CORP. 2 - - - 1 - 1 BPI DIRECT BANKO, INC. 29 333 - - 362 - 362 BPI FAMILY SAVINGS BANK, INC. 115 - 89 - 26 - 26 BPI INVESTMENT MANAGEMENT INC. 4 - 4 - - - - BPI SECURITIES CORP. 8 28 - - 35 - 35 BPI ASSET MANAGEMENT AND TRUST
CORP. 113 89 - - 202 - 202 AYALA PLANS 2 - 2 - 0 - 0 Total 358 511 238 - 631 - 631

BANK OF THE PHILIPPINE ISLANDS December 31, 2018 (In Millions of Pesos)
Schedule D - Intangible Assets
Description
Beginning balance (net of allowance for impairment)
Additions at cost
Charged to cost and expenses
Charged to other
accounts
Other changes additions
(deductions)
Ending balance (net of
allowance for impairment)
Contractual customer relationship 902 - 277 - - 625
IT-related 1,275 1,502 609 - - 2,168 Others 3 - - - - 3
Total 2,180 1,502 886 - - 2,796

BANK OF THE PHILIPPINE ISLANDS December 31, 2018
Schedule E - Long-term Debt
Title of issue and type of obligation
Amount authorized by indenture
Amount shown under caption
“Current portion of long-term debt” in related balance
sheet
Amount shown under caption “Long-term
debt” in related balance sheet
Nothing to report.

BANK OF THE PHILIPPINE ISLANDS
December 31, 2018
Schedule F - Indebtedness to Related Parties (Long-Term Loans from Related Companies)
Name of related party Balance at beginning of period Balance at end of period
Nothing to report.

BANK OF THE PHILIPPINE ISLANDS
December 31, 2018
Schedule G - Guarantees of Securities of Other Issuers
Name of Issuing entity of securities guaranteed by the
company for which this statement is filed
Title of issue of each class of securities
guaranteed
Total amount guaranteed and
outstanding
Amount owned by person for which statement is filed
Nature of guarantee
Nothing to report.

BANK OF THE PHILIPPINE ISLANDS
December 31, 2018
Schedule H - Capital Stock
Title of Issue
Number of Shares
Authorized
Number of shares issued
and outstanding as shown under
related balance sheet caption
Number of shares reserved
for options, warrants,
conversion and other rights *
Number of shares held by related
parties
Directors, officers and employees Others
Common Shares 49,000,000,000 3,939,412,661 11,338,333 1,991,790,789 24,583,401 1,923,038,471 Preferred A Shares 600,000,000 - - - -
* Shares granted but not yet exercised

EXHIBIT B
(List of Subsidiaries)

Exhibit B
BANK OF THE PHILIPPINE ISLANDS List of Subsidiaries
As of December 31, 2018
1. AYALA PLANS, INC. 2. BPI ASSET MANAGEMENT AND TRUST CORPORATION 3. BPI CAPITAL CORP. 4. BPI CENTURY TOKYO LEASE & FINANCE CORP. 5. BPI COMPUTER SYSTEMS CORP. 6. BPI DIRECT BANKO, INC., A SAVINGS BANK 7. BPI EUROPE PLC. 8. BPI EXPRESS REMITTANCE CORP. USA 9. BPI EXPRESS REMITTANCE SPAIN S.A. 10. BPI FAMILY SAVINGS BANK, INC. 11. BPI FOREIGN EXCHANGE CORP. 12. BPI INT’L FINANCE LIMITED 13. BPI INVESTMENT & MGT. INC. 14. BPI OPERATIONS MGT. CORP. 15. BPI/MS INSURANCE CORP. 16. BPI PAYMENTS HOLDINGS INC. 17. BPI REMITTANCE CENTRE (HK) LTD. 18. FEB SPEED INT’L 19. FEB STOCK BROKERS INC. 20. FGU INSURANCE CORP. 21. FILINVEST ALGO FINANCIAL CORP. 22. FIRST FAR EAST DEV’T CORP. 23. GREEN ENTERPRISES S.R.L. 24. SANTIAGO LAND DEV’T CORP.

EXHIBIT C
(Top 20 Stockholders)

BPI STOCK TRANSFER OFFICEBANK OF THE PHILIPPINE ISLANDS
TOP 20 STOCKHOLDERSAS OF DECEMBER 31, 2018
Page 1 of 1
RANK STOCKHOLDER NUMBER STOCKHOLDER NAME NATIONALITY CERTIFICATE CLASS OUTSTANDING SHARES PERCENTAGE TOTAL
1 16000970 NOF A 1,037,239,747 23.0372%
16000969 FIL A 628,049,101 13.9491% 1,665,288,848
2 01002970 FIL A 1,000,261,934 22.2160% 1,000,261,934
3 1200000093 FIL A 904,194,682 20.0823% 904,194,682
4 0100000075 CAY A 390,269,162 8.6679% 390,269,162
5 18001784 FIL A 327,904,251 7.2828% 327,904,251
6 13003196 FIL A 92,684,989 2.0585% 92,684,989
7 13002789 FIL A 7,653,853 0.1700% 7,653,853
8 23000146 FIL A 7,550,868 0.1677% 7,550,868
9 0200000002 FIL A 4,174,243 0.0927% 4,174,243
10 0500000028 FIL A 4,074,360 0.0905% 4,074,360
11 12001567 FIL A 3,938,203 0.0875% 3,938,203
12 0200000126 FIL A 3,684,130 0.0818% 3,684,130
13 2300000007 FIL A 2,930,000 0.0651% 2,930,000
14 19000127 FIL A 2,535,146 0.0563% 2,535,146
15 0200000079 FIL A 2,219,054 0.0493% 2,219,054
16 0200000110 FIL A 2,139,590 0.0475% 2,139,590
17 06000781 FIL A 1,958,595 0.0435% 1,958,595
18 08001264 FIL A 1,935,413 0.0430% 1,935,413
19 08000955 FIL A 1,419,463 0.0315% 1,419,463
20 20000965 FIL A 1,323,215 0.0294% 1,323,215
4,428,139,999
PCD NOMINEE CORPORATION (NON-FILIPINO)
37F TOWER 1, THE ENTERPRISE CENTER,
6766 AYALA AVE. COR. PASE DE ROXAS,
MAKATI CITY 1226
PCD NOMINEE CORPORATION (FILIPINO)
C/O OFFICE OF THE TREASURER/ CFO
37F TOWER 1, THE ENTERPRISE CENTER,
6766 AYALA AVE. COR. PASE DE ROXAS,
1226 MAKATI CITY
AYALA CORPORATION
33RD FLR. AYALA TOWER ONE &
EXCHANGE PLAZA, AYALA TRIANGLE
AYALA AVE., MAKATI CITY
ATTENTION: MANAGING DIRECTOR AND TREASURY
LIONTIDE HOLDINGS INC.
C/O OFFICE OF THE TREASURER/CFO
33/F TOWER ONE AND EXCHANGE PLAZA, AYALA TRIANGLE,
AYALA AVENUE, MAKATI CITY
AC INTERNATIONAL FINANCE LIMITED
C/O OFFICE OF THE TREASURER/CFO
AYALA CORP. 34/F TOWER ONE AYALA TRIANGLE
AYALA AVENUE, MAKATI CITY
ROMAN CATHOLIC ARCHBISHOP OF MANILA
OFFICE OF THE TREASURER/CFO, C/O VP CARLOS B.
AQUINO, BPI CORSEC OFFICE 19/F BPI BLDG.,
AYALA AVE., MAKATI CITY
MICHIGAN HOLDINGS, INC.
33RD FLR. TOWER ONE
AYALA TRIANGLE, AYALA AVE.
MAKATI CITY
ATTN: MANAGING DIRECTOR AND TRESURY
MERCURY GRP. OF COMPANIES, INC
C/O OFFICE OF THE TREASURER/CFO
NO. 7 MERCURY AVENUE
LIBIS, QUEZON CITY 1110
ESTATE OF VICENTE M. WARNS
18 PILI, SOUTH FORBES
MAKATI CITY
BPI GROUP OF COMPANIES RETIREMENT FUND
C/O ENRICO A RECTO OR DOMINICK ADAN BOTOR,
18F BPI ASSET MANAGEMENT, BPI HEAD OFFICE BLDG.,
AYALA AVENUE COR. PASEO DE ROXAS,
MAKATI CITY
BPI - ESPP 2015
C/O MS. JOSEPHINE F. FERNANDEZ, ESPP ADMINISTRATOR
5F BPI HEAD OFFICE, AYALA
CORNER PASEO DE ROXAS AVENUE, MAKATI CITY
XAVIER P. LOINAZ
C/O BPI, 19/F BPI HO BUILDING
AYALA AVE., CORNER PASEO DE
ROXAS, MAKATI CITY
BPI - ESPP 2017
C/O BPI HRHERMANN BARRETTO WARNS
29 SAN MIGUEL AVENUE, CRESCENT CONDOMINIUM #FB11,
ORTIGAS CENTER, PASIG CITY
SAHARA MGT. & DEV. CORP.
OFFICE OF THE TREASURER/CFO, 27 MERCURY ST.,
BEL-AIR 1 VILLAGE MAKATI CITY
BPI - ESPP 2014
C/O AVP TINA DEL FIERRO
5F BPI HEAD OFFICE BLDG., AYALA AVENUE
COR PASEO DE ROXAS, MAKATI CITY
BPI - ESPP 2016
C/O MS. JOSELINE S. LAGMAN, ESPP ADMINISTRATOR,
5F BPI HEAD OFFICE, AYALA
CORNER PASEO DE ROXAS AVENUE, MAKATI CITY
FORESIGHT REALTY & DEVELOPMENT CORPORATION
CONCEPCION INDUSTRIES BLDG., C/O RAUL CONCEPCION
308 SEN GIL PUYAT AVE., MAKATI CITY
HYLAND REALTY & DEV`T. CORP.
C/O OFFICE OF THE TREASURER/CFO 21 TANGUILE RD.,
NORTH FORBES PARK MAKATI CITY
HORIZONS REALTY, INC.
RFM CORP. CENTER, C/O OFFICE OF THE TREASURER/CFO
PIONEER CORNER SHERIDAN STS.,
MANDALUYONG CITY
TELENGTAN BROTHERS & SONS, INC.
C/O OFFICE OF THE TREASURER / CFO
C/O LA SUERTE CIGAR & CIGARETTE FACTORY
KM 14 SOUTH SUPER HI-WAY PARANAQUE CITY

EXHIBIT D
(Statistical Report by Sharelots)

Page 1 of 1
RUN TIME : 08:16:54
RUN DATE : 4/10/2019
USER ID : SK184899
100,001 - 500,000 145 29,123,944
500,001 - 1,000,000 13 8,763,129
10,001 - 50,000 658 14,135,279
50,001 - 100,000 119 8,148,340
10,000,001 - 50,000,000 2 63,481,023
50,000,001 - UP 8 4,302,383,989
1,000,001 - 5,000,000 16 41,642,678
5,000,001 - 10,000,000 3 21,221,237
5,001 - 10,000 613 4,208,456
101 - 500 4,233 1,079,079
1 - 100 1,555 58,475
1,001 - 5,000 3,057 6,617,948
501 - 1,000 2,166 1,585,924
GRAND TOTAL 12,588 4,502,449,501
STATISTICAL REPORT BY SHARELOTS
BANK OF THE PHILIPPINE ISLANDS
SHARE LOTS NUMBER OF STOCKHOLDERS
ISSUED SHARES
As of December 31, 2018