
Standard Commercial Financial Statement Template
113
For the years ended June 30, 2019 and June 30, 2020 CA F R COMPREHENSIVE ANNUAL FINANCIAL REPORT An Enterprise Fund and Department of the City of Alameda Alameda, California
Transcript of Standard Commercial Financial Statement Template

For the years ended June 30, 2019 and June 30, 2020
C A F RCOMPREHENSIVE ANNUAL FINANCIAL REPORT
An Enterprise Fund and Department of the City of AlamedaAlameda, California

PUBLIC UTILITIES BOARD (AS OF JUNE 30, 2020)
President Ann McCormick
Vice President Jerry Serventi
Commissioner Jeff Gould
Commissioner Laura Giuntini
City Manager Eric Levitt
ALAMEDA MUNICIPAL POWER
General Manager Nicolas Procos
Assistant General Manager, Engineering & Operations Andre Basler
Assistant General Manager, Customer Resources Rebecca Irwin
Assistant General Manager, Administration Robert Orbeta
Assistant General Manager, Energy Resource Planning Vidhi Chawla
2000 Grand Street Alameda, CA 94501 510.748.3900 www.alamedamp.com

Comprehensive Annual Financial Statements June 30, 2020 and 2019
Alameda Municipal Power An Enterprise Fund and Department of the City of Alameda, California
i
Alameda Municipal Power An Enterprise Fund and Department of the City of Alameda, California
Table of Contents Years Ended June 30, 2020 and 2019
INTRODUCTORY SECTION
Table of Contents .................................................................................................................................................... i Letter of Transmittal ............................................................................................................................................. iii Principal Officers ...................................................................................................................................................xv Organizational Chart ............................................................................................................................................ xvi GFOA Award ........................................................................................................................................................ xvii Location Map ..................................................................................................................................................... xviii
FINANCIAL SECTION
Independent Auditor’s Report ................................................................................................................................... 1
Management’s Discussion and Analysis .................................................................................................................... 4
Basic Financial Statements
Statements of Net Position .................................................................................................................................. 17 Statements of Revenues, Expenses and Changes in Fund Net Position .............................................................. 19 Statements of Cash Flows .................................................................................................................................... 20
Notes to Financial Statements ................................................................................................................................. 22
Required Supplementary Information
Schedule of AMP's Proportionate Share of the City's Miscellaneous Plan Net Pension Liability ....................... 62 Schedule of AMP’s Pension Contributions ........................................................................................................... 63 Schedule of AMP’s Proportionate Share of the City’s OPEB Liability and Related Ratios ................................... 64 Schedule of AMP's OPEB Contributions ............................................................................................................... 65
STATISTICAL SECTION
Statistical Section Overview ................................................................................................................................. 66 Net Position by Component ................................................................................................................................. 67 Changes in Net Position of Consolidated Operations ........................................................................................... 68 Changes in Net Position of Electric and Telecommunication Operations ........................................................... 69 Electric Operating Revenues by Source ............................................................................................................... 70 Customer Accounts .............................................................................................................................................. 71 Pricing Changes .................................................................................................................................................... 72 Ratio of Outstanding Debt by Type ...................................................................................................................... 73 Revenue Bonds / Certificates of Participation Coverage – Electric Operations .................................................. 74 Certificates of Participation Coverage - Telecommunications............................................................................. 75 Demographic and Economic Statistics ................................................................................................................. 76 Top Ten Customers and City’s Principal Employers ............................................................................................. 77 Operating Expenses by Function Per FERC Codes ............................................................................................... 78 Capital Asset Statistics by Function / Program .................................................................................................... 80 Operation Indicators ............................................................................................................................................ 81 Days Cash on Hand............................................................................................................................................... 83

Alameda Municipal Power An Enterprise Fund and Department of the City of Alameda, California
Table of Contents (Continued) Years Ended June 30, 2020 and 2019
ii
BOND DISCLOSURE SECTION
Report Overview .................................................................................................................................................. 84 Power Supply Resources ...................................................................................................................................... 87 Electric Rate Changes ........................................................................................................................................... 88 Electric Customers, Sales, Revenues and Demand .............................................................................................. 89 Condensed Operating Results and Selected Balance Sheet Information ............................................................90

iii
February 25, 2021 To the Public Utilities Board and Our Customers: We are pleased to transmit the Comprehensive Annual Financial Report of Alameda Municipal Power (AMP), an enterprise fund and department of the City of Alameda, California for the fiscal years ended June 30, 2020 and 2019. AMP encourages readers to review all sections of this report and especially request that they refer to Management’s Discussion and Analysis located in the Financial Section of this report. Responsibility for both the accuracy of the data, and the completeness and fairness of the presentation, including all disclosures, rests with AMP’s management. AMP believes that the data presented here is accurate in all material respects, that the data is presented in a manner designed to set forth fairly the financial position of the organization and that all disclosures necessary to gain an understanding of the financial activity are included in this report. Profile The City of Alameda - Department of Public Utilities - Bureau of Electricity, now doing business as Alameda Municipal Power, is the oldest municipal electric utility in California and is amongst the oldest in the nation, either public or private. The municipal utility has safely provided reliable, cost-effective, and environmentally responsible, electric-energy services since its founding in 1887. As a reminder to the reader, AMP sold its telecommunications business line (telecom) to Comcast of Alameda, Inc. effective November 21, 2008, changed its name from Alameda Power & Telecom to Alameda Municipal Power on January 26, 2009, and ceased to provide telecom services on March 21, 2009. AMP is governed by a Public Utilities Board (Board). Pursuant to the Alameda City Charter, the Board has the power to control and manage the electric system, including the power to fix rates for the services provided by AMP. The Board establishes goals and policies, approves major purchases, and creates the framework for local control of AMP, one of Alameda’s largest businesses. The Board is comprised of four commissioners (appointed by the Mayor with concurrence from the City Council) and the City Manager (as an ex-officio member). During fiscal year (FY) 2020, the members of the Board included President Ann McCormick, Vice President Jerry Serventi, Commissioner Laura Giuntini, Commissioner Jeff Gould, Commissioner and City Manager Eric J. Levitt. For FY 2021, the Board members are Ann McCormick, President, Jerry Serventi, Vice President, Commissioners Laura Giuntini, Jeff Gould, and City Manager Eric J. Levitt. The appointments became effective July 2020.

iv
The City of Alameda is an island community of 22.8 square miles located across the bay from San Francisco and to the southwest of the City of Oakland. Alameda Municipal Power (hereinafter, “AMP”) serves the entire area of the City of Alameda and has about 86 pole miles of overhead distribution lines and 186 circuit miles of underground distribution lines, 6.8 pole miles of overhead transmission lines, 1.9 underground circuit miles. During FY 2020, AMP served an average of 36,067 customers, comprised of an average of 31,822 residential customers, an average of 3,852 commercial customers and an average of 393 public authority and other customers, with a peak demand of approximately 62.0 MW.
AMP does not independently own any generation assets at this time; but rather, it procures power through long and short-term agreements. To facilitate the acquisition of power, AMP joined the Northern California Power Agency (NCPA) in 1968. NCPA is a joint-powers agency composed of AMP and 14 other northern California public entities. NCPA provides electric scheduling, dispatch and transmission for the provision of AMP’s electric-energy services. AMP participates in the NCPA power pool and makes short-term market purchases and sales as necessary, or economical, to meet its native load requirements and dispose of surplus. Generally, AMP has entered into power purchase agreements solely or primarily for use within its own system. AMP continues its program to research, solicit and acquire electric generation sources that are economical, provide stable costs over the long-term, and are environmentally responsible.
The actual energy purchased is illustrated below:
2.0
5.3
20.7
29.9
-
43.4
85.1
36.3
128.6
2.5
3.3
18.6
52.6
59.4
57.8
45.1
36.5
76.8
0.0 20.0 40.0 60.0 80.0 100.0 120.0 140.0
Graeagle Hydro
Combustion Turbines
High Winds
Landfill Projects
Geothermal
Western Hydro
Calaveras Hydro
Silicon Valley Power
Other Purchases (Sales)
FY2020 FY2019Purchased Power SourcesActual Energy (GWh) - FY2020 and FY2019

v
AMP participates in most of NCPA’s generation projects, but it does not participate in the Lodi Energy Center. Approximately 69.4% of AMP’s resources in FY2020 were sourced through NCPA including 12.8% from the Calaveras hydroelectric facilities, 16.4% from the Western Area Power Administration’s (WAPA) hydroelectric facilities, 0.7% from the Graeagle hydroelectric facilities, 16.9% from geothermal and 0.9% from the Combustion Turbine (CT) projects. NCPA market purchases for AMP accounted for another 21.8% of purchased power. AMP sold its share of eligible renewable energy generated by the NCPA Geothermal Project and one of its landfill power purchase agreements through December 31, 2019. FY2020 reflects one-half year of Geothermal power purchases while FY2019 reflects zero. AMP procured approximately 30.5% of its power supply resources independent of NCPA and has obtained independent contracts for several landfill gas facilities and for a portion of the high winds project. NCPA provides electric scheduling, dispatch and transmission for these electric-energy services. At its January 2012 meeting, the Board approved a Renewable Portfolio Power Sales Policy that directed AMP to sell all eligible renewable power through 2019 not required to comply with the revised Renewable Portfolio Standard. NCPA makes market purchases to replace the short-term sales and meet AMP’s load requirements. The Board directed that the resulting revenues from the short-term sales of the renewable power be retained and used to support AMP directed initiatives to reduce Green House Gas (GHG) emissions associated with electricity usage and service. Additionally, the California Cap-and-Trade (C&T) program continues to auction directly allocated allowances from the California Air Resources Board (CARB). The resulting revenues from the C&T sales will be used for the benefit of ratepayers consistent with the goals of Assembly Bill 32. AMP has established Board designated reserves for these special sales revenues. Each year, the energy output from the generating facilities is optimized based upon seasonal, economic and maintenance considerations. The chart below indicates the electric system’s maximum average daily load occurs about 7:00 pm during the winter and the minimum average daily load occurs about 4:00 am during the summer. This data is used by AMP to review system capacity needs and trends for time-of-use rate planning.

vi
AMP’s employees keep the system operational 24 hours a day, 7 days a week. The utility’s professionals are represented by Alameda Municipal Power Unrepresented Employees (“AMPU”), the Electric Utility Professionals of Alameda (“EUPA”). Non-management personnel are represented by either the International Brotherhood of Electrical Workers (“IBEW”) or the Alameda City Employees Association (“ACEA”). The current Memoranda of Understanding expires June 2022. Employee retirement benefits are provided by AMP through the City of Alameda’s participation in the California Public Employees Retirement System (“CalPERS”).
20
25
30
35
40
45
50
55
60
1 2 3 4 5 6 7 8 9 10 11 12 13 14 15 16 17 18 19 20 21 22 23 24
Meg
awat
ts
Hour of the Day
TYPICAL DAILY LOADS FY 2020
Summer Season Winter Season

vii
AMP refinanced $31.7 million of its electric debt during August 2010 into fixed rate bonds. The Board continues to establish financial guidelines, set specific reserve targets and affirm rate principles. In January 2019, the Board accepted the five-year strategic plan that will enable AMP to meet its obligations as Alameda’s municipal electric provider for 2020 through 2025. Critical elements that will determine AMP’s future direction include global issues, issues within Alameda, critical stakeholders, priorities, mission, vision, values, and key performance indicators (KPI). The strategic plan is based on five main issues:
1) Sustainability Manage triple bottom line (economic/environmental/social) performance to support a
sustainable Alameda o Deliver and maintain 100% clean energy resources by 2020 and beyond o Support opportunities in the electrification of the transportation system and
buildings to reduce Green House Gas (GHG) emissions 2) Customer Experience
Increase value to the community through meaningful programs and services, positive customer interactions, and building the brand
o Define and promote brand to improve awareness and value o Build an employee culture that consistently promotes value and principles of
public power and customer service o Maximize opportunities to meet customer needs and improve engagement
80
82
84
86
88
90
92
94
96
98
100
2015 2016 2017 2018 2019 2020
Electric Staff Position - Budget/Actual
Budget
Actual

viii
3) Business Resiliency Maintain competitiveness and financial performance by utilizing sustainable resources
and operational excellence o Develop a utility asset management plan o Develop financial planning processes that provide fiscal stability, linking
service priorities with associated costs o Ensure quality, efficiency, and knowledge transfer by documenting standard
operating procedures o Implement succession plans that ensure continuity of operations o Perform an assessment of the organizational structure
4) Technology
Optimize technology to meet the evolving business environment o Update technology roadmap to guide our technology-related investments and
decisions o Leverage Advanced Metering Infrastructure (AMI) systems to enhance the
customer experience, operations, financial forecasting, and marketing o Develop a training plan that supports effective technology adoption, improves
utilization, and enables an adaptable workforce 5) Workforce
Attract and retain employees while fostering a collaborative culture and adapting to changing industry trends
o Develop a talent outreach plan that highlights the benefits and opportunities of working at AMP to increase talent pool for positions and ensure needed staffing levels
o Design a training and career development model to enhance employee job satisfaction
AMP has developed KPIs to measure the performance of the utility and has set specific targets for each issue identified. On January 2020, AMP attained 100% clean-energy portfolio and will continue to remain at 100% for future years while maintaining a competitive position. AMP’s rates and fees are intended to recover the actual cost of providing service to each customer, remain competitive with those providing similar services in surrounding communities, and provide a return to the City. At its January 2020 meeting, the Board approved a five-year ratemaking policy for FY 2021 through 2025. The Board adopted financial guidelines that included a debt service coverage ratio of 1.75 times AMP’s total debt service and an operating cash reserve requirement that is at least 145 days for operations during unforeseen events. At its regular meeting conducted April 2020, the Board approved no increase in rates for FY 2021. The zero increase in rates is due partly to COVID-19 pandemic that began in March 2020. AMP determines the recommended rates based on the results of the 10-year pro forma model, a tool that enables staff to incorporate key assumptions and determine the rate adjustment needed to comply with financial guidelines.

ix
The 10-year pro forma model will continue to be used as a tool to consider yearly adjustments. Additional rate increases could be forecast during these years as key cost drivers, such as rising power and transmission charges, increased operating expenses, and lower load forecasts (translating into lower sales and lower revenue), exert upward pressure on rates. AMP will continue to investigate options to assure that revenues are sufficient to cover the cost of providing quality service to its customers. In its continuing commitment to provide the most reliable power for Alameda and in support of community development goals, AMP continues to improve its electric distribution network through capital improvements to the supervisory control and data acquisition (SCADA) system and electrical equipment; providing new electric services for residential and business development; providing increased circuit cleansing, maintenance and inspection of high voltage components; upgrading internal systems; as well as a variety of routine enhancements including selected street light replacements, transformer inspections, and meter work.
Several modifications to the CIP strategic plan occurred during FY 2020 that impacted planned construction budgets and schedules. Projects that were lower than budget because of material, labor, or contractor availability were 1) distribution poles replacement, vehicle replacements, inventory long lead purchase orders that were placed but not received in FY2020 and will be
0
1000000
2000000
3000000
4000000
5000000
6000000
7000000
8000000
JUL AUG SEP OCT NOV DEC JAN FEB MAR APR MAY JUN
Electric Capital AdditionsBudget vs. Actual
YTD through June, 2020Budget Actual
x
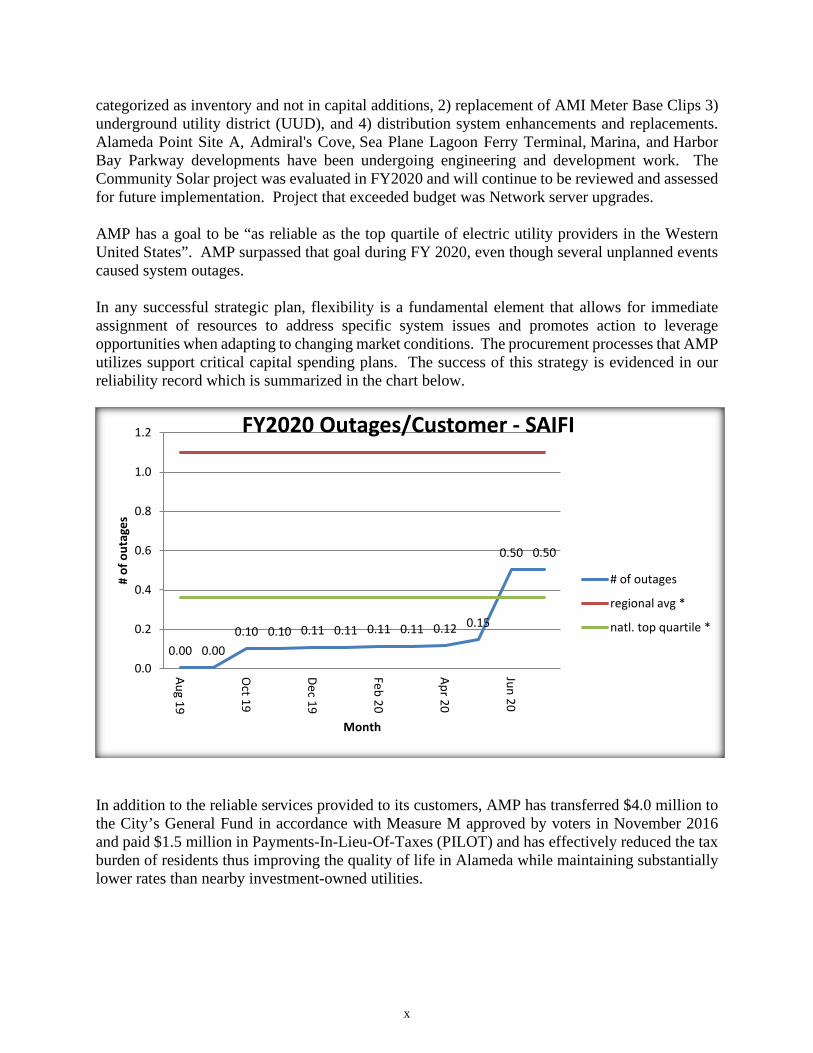
categorized as inventory and not in capital additions, 2) replacement of AMI Meter Base Clips 3) underground utility district (UUD), and 4) distribution system enhancements and replacements. Alameda Point Site A, Admiral's Cove, Sea Plane Lagoon Ferry Terminal, Marina, and Harbor Bay Parkway developments have been undergoing engineering and development work. The Community Solar project was evaluated in FY2020 and will continue to be reviewed and assessed for future implementation. Project that exceeded budget was Network server upgrades. AMP has a goal to be “as reliable as the top quartile of electric utility providers in the Western United States”. AMP surpassed that goal during FY 2020, even though several unplanned events caused system outages. In any successful strategic plan, flexibility is a fundamental element that allows for immediate assignment of resources to address specific system issues and promotes action to leverage opportunities when adapting to changing market conditions. The procurement processes that AMP utilizes support critical capital spending plans. The success of this strategy is evidenced in our reliability record which is summarized in the chart below.
In addition to the reliable services provided to its customers, AMP has transferred $4.0 million to the City’s General Fund in accordance with Measure M approved by voters in November 2016 and paid $1.5 million in Payments-In-Lieu-Of-Taxes (PILOT) and has effectively reduced the tax burden of residents thus improving the quality of life in Alameda while maintaining substantially lower rates than nearby investment-owned utilities.
0.00 0.000.10 0.10 0.11 0.11 0.11 0.11 0.12 0.15
0.50 0.50
0.0
0.2
0.4
0.6
0.8
1.0
1.2
Aug 19
Oct 19
Dec 19
Feb 20
Apr 20
Jun 20
# of
out
ages
Month
FY2020 Outages/Customer - SAIFI
# of outages
regional avg *
natl. top quartile *

xi
Economic Conditions and Outlook The City of Alameda is an island community with residential neighborhoods and commercial areas. There are scenic views of Oakland, San Francisco, and other areas of the Bay shoreline. The City has highway links to the City of Oakland to the north and east, and offers ferry services to San Francisco from two locations. The California Department of Finance shows a population of 81,312 people residing in Alameda in FY 2020 versus 79,316 people in FY 2019, an increase of 2.5%. Alameda’s unemployment rate dropped from 2.8% in FY 2019 to 2.6% in FY 2020. It is anticipated that the population of Alameda will increase as new housing units are constructed and occupied at the former Naval Station (aka as Alameda Point) and elsewhere in the City. Alameda’s business enterprises range in scope from the US Coast Guard Integrated Support providing, regulation administration of transport, to City of Alameda, providing local governmental support and services, to Alameda Commercial Properties and G&I IX Marina Village Office Park, providing real estate management services, to Penumbra providing designing and manufacturing innovative medical devices, to Alameda Unified School District, to City of San Leandro Health Care, providing health services, to the Maritime Administration providing a ready-fleet of ships, to Safeway, providing groceries, and Peet’s Coffee, providing coffee and retail goods. The diversity of businesses and their unique electricity needs continues to be reliably served by the backbone of the electric distribution network. Overall, the outlook for the City of Alameda is generally stable. Investors continue to demonstrate their faith in the strengths of the community by continuing capital improvements and through community planning development for Alameda Point. AMP continues to recognize trends developing in the market place and has adjusted its system expansion budget. AMP understands that in addition to being responsive to the community, it must assess its risks and plan accordingly. This planning is especially important at this time since operating expenses are expected to escalate as certain power supply contracts expire, renewable energy continues to be prominent in the portfolio, and transmission costs escalate. Major Initiatives Community Involvement Through a wide range of customer programs and events, and in partnership with local agencies, AMP maintains a strong presence in the community. AMP sponsors a variety of organizations and local events annually and uses many communication channels to educate customers about topics such as electric vehicles, solar, energy efficiency and sustainability. AMP’s customer communication channels include a monthly newsletter and bill insert, which promote safety education as well as various customer programs and services.

xii
Major Initiatives in 2020 While AMP normally hosts in-person events for customers each year, the COVID-19 crisis caused the utility to change its customer engagement strategy in 2020. Throughout this unprecedented year, AMP worked with customers experiencing financial hardship during COVID-19. AMP met the community’s needs in a number of ways:
• AMP placed a moratorium on electric service disconnections for non-payment for customers facing financial hardship as a result of COVID-19 and suspended all penalties for late payments.
• Utility staff continuously promoted AMP’s bill savings, financial assistance programs and payment plans to commercial and residential customers.
• Through the utility's "Power Up for Learning" program, AMP customers had the opportunity to support distance learning for local public school students during the pandemic.
• AMP’s direct-install program continues to offer energy efficiency upgrades to low-income customers at no cost.
• AMP launched new rebates for used electric vehicles with enhanced incentives for low-income customers.
Economic Development The City of Alameda and AMP continue to encourage new and existing businesses to develop in Alameda. Alameda is an excellent choice for energy-sensitive businesses and is centrally located within the San Francisco Bay Area. While having one of the best records of reliability, customers enjoy electric rates significantly lower than those of nearby cities served by other utilities. A portion of the east and west ends of Alameda has seen significant growth. During FY 2020, AMP continues support development at Alameda Point - Site A, Admiral's Cove, Sea Plane Lagoon Ferry Terminal, Marina, and Harbor Bay Parkway. AMP moved forward with replacing the SF6 breakers at the Cartwright substation and will do the same in FY 2021 for the NCPA-Combustion Turbine substation. AMP changed the methodology to charge new development for service laterals to ensure new developments pay an equitable share for new service. In February 2019 AMP obtained Board approval to start work on the Otis/Broadway Underground Utility District and rolled out the design phase. AMP continues to work on system enhancements and improvements to better serve customers. Customer Service AMP’s customers can call during business hours to obtain information about their bill, make a payment, inquire about energy efficiency programs, the solar rebate program, request new service, or discontinue service. Customers have seven bill payment options when paying their electric bill. There are no additional fees for any of these bill payment options. • Automatic Payment Service (Easy Pay) • Electronic Bill Presentment/Payment (EBPP) • On-line Credit/Debit Card Payment • Credit Card Payments by Phone • U.S. Mail • In-Person Payments • Pay Station

xiii
Customers can also utilize AMP’s website to obtain an array of information regarding programs, services, events, Public Utility Board meetings, and other areas of interest. Solar Rebates and Alternative Fuel Vehicles AMP continues to support community efforts for reducing greenhouse gases through its solar programs and by its use of alternative-fuel vehicles, including both all-electric and hybrid electric/gasoline vehicles. AMP installed two level-three charging stations at its service center which charge a vehicle within approximately seven minutes. AMP will continue to monitor electric vehicle charging stations to assess electric vehicle charging patterns as more all-electric vehicles begin to be utilized by the community. Alameda Point Telephone System AMP took over the operation of the telephone plant at Alameda Point on July 1, 2000 and converted the operation to a self-sustaining portion of the utility. AMP charges installation and monthly recurring fees to provide for the recovery of maintenance expenses. Capital plant investment for the Alameda Point telephone system have been minimized because the telephone cable pairs to extend telephone services from the AT&T Minimum Point of Entry (MPOE) to tenants leasing space and housing on Alameda Point are temporary. Existing telephone circuits will be abandoned as Alameda Point is redeveloped. In the future, it is expected that a state-certified communications carrier will construct telephone facilities on Alameda Point as part of the overall development plan. Until Alameda Point’s redevelopment plans are implemented, the Alameda Point telephone system will continue to support residents, business and economic development by providing access to the public dial telephone network. Management’s Statement of Responsibility AMP’s management is responsible for the integrity and objectivity of all financial data included in this annual report. The statements have been prepared in accordance with accounting principles generally accepted in the United States. The financial data includes amounts that are based on the best estimates and judgments of management. AMP’s management takes seriously its responsibility to establish and maintain an effective internal control system. It employs a variety of administrative and accounting processes that form its internal control system. The controls provide reasonable, rather than absolute assurance, that the financial statements are free of any material misstatements because internal control costs should not exceed the benefits derived. Management periodically reviews the internal control system. Actions are taken to correct deficiencies as they are identified. AMP maintains high standards in selecting, training, and developing personnel to assure that its operations are conducted in conformity with applicable laws and is committed to maintaining programs to encourage and assess compliance with the highest standards of personal and business conduct. Independent Audit California State statutes and the City of Alameda’s charter require an annual audit of AMP's financial records and transactions. Eide Bailly, LLP, a certified public accounting firm, is contracted to independently audit the financial information of AMP. Eide Bailly, LLP was


xv
Principal Officers
(As of June 30, 2020)
PUBLIC UTILITIES BOARD
Ann McCormick, President
Jerry Serventi, Vice President
Laura Giuntini, Commissioner
Jeff Gould, Commissioner
City Manager, Eric J. Levitt
GENERAL MANAGER
Nicolas Procos
MANAGERS
Robert J. Orbeta, Assistant General Manager – Administration
Rebecca Irwin, Assistant General Manager – Customer Resources
Vidhi Chawla Assistant General Manager – Energy Resource Planning
Andre Basler Assistant General Manager – Engineering & Operations
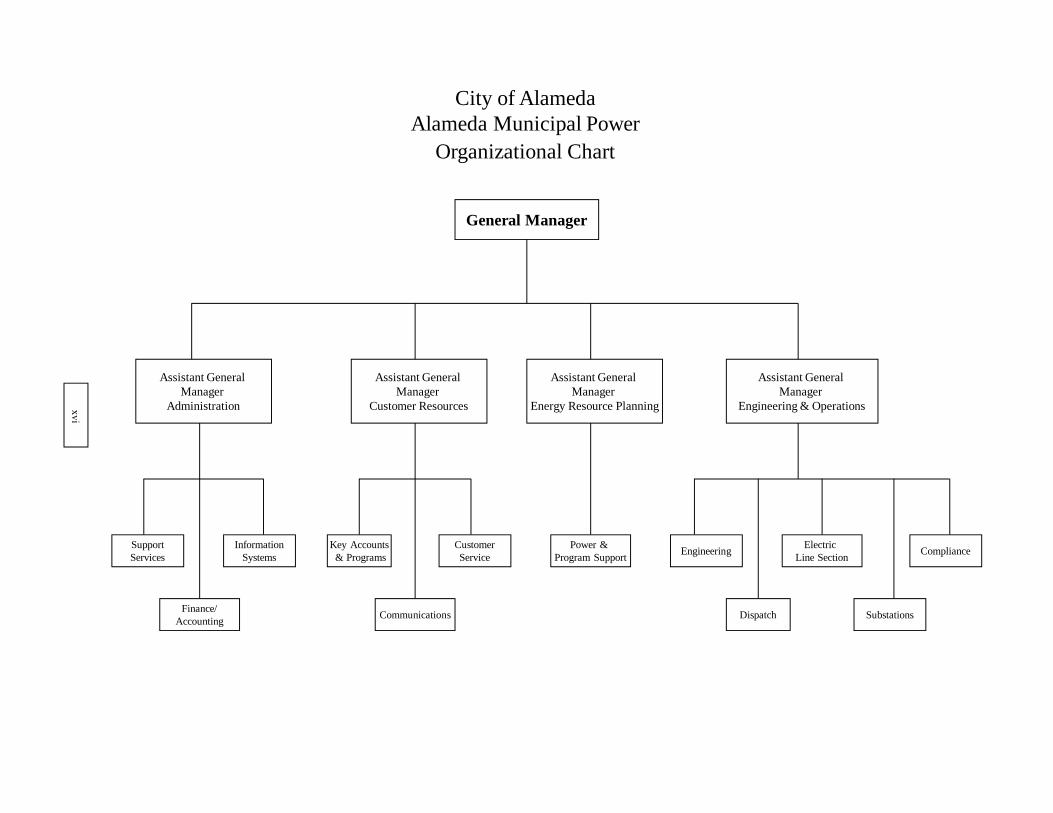
City of AlamedaAlameda Municipal Power
Organizational Chart
General Manager
Finance/Accounting
Assistant General Manager
Administration
SupportServices
InformationSystems
Key Accounts& Programs
CustomerService
Engineering
SubstationsDispatch
Electric Line Section
xvi
Assistant General Manager
Energy Resource Planning
Assistant General Manager
Customer Resources
Assistant General Manager
Engineering & Operations
Compliance
Communications
Power & Program Support
Government Finance Officers Association
Certificate of Achievementfor Excellence
in Financial Reporting
Presented to
Alameda Municipal PowerCalifornia
For its Comprehensive AnnualFinancial Report
For the Fiscal Year Ended
June 30, 2019
Executive Director/CEO
xvii

!!
!
!
!
!
!! !
!
!
!
!
!
!
!
!
!
!
!
!
!
!
!
!
!
!
!
!
!
!
!
!
!
!
!
!
!
!
!
!
!
!
!
!!
!
!
!!
!!
!!
!!
!!
!
!
!
!
!
!
!
!
!
!
!
!
!
!
!
!
!
!
!
!
!
!
!
!
!
!
!
!
!
!!
!!
!!
!!
!!
!
!
!
!
!
!
!
!
!
!
!
!
!
!
!
!
!
!
!
!
!
!
!
!
!
!
!
!
!
!
!
!
!
!
!
!
!
!
!
!
!
!
!
!
!
!
!
!
!
!
!
!
!
!
!
!
!
!
!
!
!
!
!
!
!
!
!
!
!!
! !
!
!!
!
!
!
!
!
!
!
!
!
!
!
!
!
!
!
!
!
!
!
!
!
!
!
!
!
!!
!
!
!
!
!
!
!
!
!
!
!!
!
!
!
!
!
!
!
!!
!
!
!
!
!
!
!
!
!
!
!!
!
!
!
!
!
!
!
!
!
!
!
!
!
!
!
!
!
!!
!!
!
!!
!!
!
!
!
!
!
!
!
!
!
!
!
!
!
!
!
!
!
!
!
!
!
!
!
!
!
!
!
!
!
!
!
!!
!!
!
!
!
!
!
!
!!
!
!
!
!
!
!
!
!
!
!
!
!
!
!
!
!
!
!
!
!
!
!
!
!
!
!
!
!
!
!
!
!
!
!
!!!
!
!
!
!
!
!
!
!!
!
!
!
!
!
!
!
!
!
!
!
!
!
!
!
!
!
!
!
!
!
!
!
!
!
!
!
!
!
!
!
!
!
!
!
!
!
!
!
!
!!
!
!
!
!
!
!
!
!
!
!
!
!
!
!
!
!
!
!
!
!
!
!
!
!
!
!
!
!
!
!
!
!
!
!
!
!
!
!
!
!
!
!
!
!
!
!
!
!
!
!
!
!
!
!
!
!
!
!
!
!
!
!
!
!
!
!
!
!
!
!
!
!
!
!!
!!
!!
!!
!!
!
!
!
!
!
!
!
!
!
!
!
!
!
!
!
!
!
!
!
!
!
!
!
!
!
!
!
!
!!
!!
!!
!!
!!
!
!
!!
!
!
!
!
!
!
!
!
!
!
!
!
!
!
!
!
!
!
!
!
!
!
!
!
!
!
!
!
!
!
!
!
!
!
!
!
!!!
!
!
!
!
!!!
!!
!
!
!
!
!
!
!
!
!
!
!
!
!
!
!
!
!
!
!
!
!
!
!
!
!
!
!
!
!
!
!
!
!
!
!
!
!
!
!
!
!
!!
!
!
!
!
!
!
!
!
!
!
!
!
!
!
!
! !
!
!
!
!
! !
!
!
!
!
!
!
!!
!!
!
!
!
!
!
!
!
!!
!
!
!
!
!
!
!
!
!
!
!
!
!
!
!
!
!
!
!
!
! !
!
!
!
!
!
!
!
!
!
!
!
!
!
!
!
!!
!
!
!
!
!
!
!
!
!
!
!
!
!
!
!
!
!!
!
!
!
!
!
!
!
!
!
!
!
!
!
!
!
!
!
!
!
!
!
!
!
!
!
!
!
!
!
!
!
!
!
!
!
!
!
!!
SanFrancisco
Bay
OaklandInner
Harbor
AlamedaHarbor/Brooklyn
Basin
Tidal Canal
E 10TH ST
LINCOLN AV
COOL
IDGE A
V
BRYANT AV
SILVA L N
W MIDWAY AV
GIBBONS DR
W ESSEX DR
PARU
STOLEANDER AV
CLEMENT AV
BETTE ST
ORIO
NST
W TOWER AVLINA AV
3RD ST
MONA
RCH
ST
E 8TH ST
FIR PL
HOLLISTER AV
E 19TH ST
PEAC
H ST
BUENA VISTA AV
5THAV
E 22ND ST
WILLIE STARGELL AV
CATALINA AV
TILDEN WY
EMBARCADERO
34TH
AV
BAYVIEW DR
MARINA
DR
ROSEWOOD W YHANCOCK ST
DENNISON ST
SAN ANTONIO AV
E 23RD ST
POST
ST
PEAR
L ST
SKYH AWKST
REGE
NT
ST
E 15TH ST
36TH
AV
SHORELINE DR
MOUND ST
E 21ST ST
COURT ST
WILL
OWST
WESTLINEDR
EAGLE AV
SAN JOSE AV
ALAMEDA AV
MARIN WY
CLINTON AV
CAMPBELL RD
26TH A
V
6TH ST
27TH A
V
37TH
AV
OAK S
T
FORD ST
WALN
UT S
T
9TH ST
E 17TH ST
28TH A
V
BAY ST
ATLANTIC AV
HAIGHT AV
W RED LINE AV
E 9TH ST
BEACH RD
TAYLOR AV
ROBER T DAVE
Y JR DR
SINGLETON AV
W HORNET AV 8THST
10TH AV
TIDEWATER AV
RON COWAN PW
N LOOP RD
38TH
AV
VETERANS CT
MOSLEY AV
BARBERS POINTRD
23RDAV
ADELPHIA N WY
FERNSID
EBL
5TH ST
RATTORD
FERR
Y PO
INT
EAGLE RD
USN AIR STATION ALAMEDA
VIKIN
G ST
HAR BORBAY
PW
S LOO P RD
§̈¦I880
SANTA CLARA AV
SAN LEANDRO STPACIFIC AV
AUGHINBAUGHW
Y
FOOTHILL BL
1 4TH
AV
23RD AV
OTIS DR
INTERNATIONAL BLMAITLAND DR
FRUIT
VALE
AV
HIGH ST
VERS
AILLE
S AVPA
RK ST
MECARTNEY RD
ENCINAL AV
DAVIS ST
35TH
AV
CENTRAL AV
E 12TH ST
BROA
DWAY
E 20TH ST
GRAN
D ST
PARK
AV
E 11TH ST
E 7THST
WEBSTERST
ISLA
NDDR
DOOLITTLE DRPO
SEY
TUBE
SEAVIEW PW
MAIN ST
HARBOR BAY PW
Alameda, California, United States
0 10.5 MilesÜ
!
!
!
!
! Alameda City Boundary
Oakland
Bay FarmIsland
Alameda
State Beach
GolfCourse
xviii

1
Independent Auditor’s Report Public Utilities Board Alameda Municipal Power Alameda, California Report on the Financial Statements We have audited the accompanying financial statements of Alameda Municipal Power (AMP), an enterprise fund and department of the City of Alameda, California, as of and for the years ended June 30, 2020 and 2019, and the related notes to the financial statements as listed in the table of contents. Management’s Responsibility for the Financial Statements Management is responsible for the preparation and fair presentation of these financial statements in accordance with accounting principles generally accepted in the United States of America; this includes the design, implementation, and maintenance of internal control relevant to the preparation and fair presentation of financial statements that are free from material misstatement, whether due to fraud or error. Auditor’s Responsibility Our responsibility is to express an opinion on these financial statements based on our audits. We conducted our audits in accordance with auditing standards generally accepted in the United States of America and the standards applicable to financial audits contained in Government Auditing Standards, issued by the Comptroller General of the United States. Those standards require that we plan and perform the audit to obtain reasonable assurance about whether the financial statements are free from material misstatement. An audit involves performing procedures to obtain audit evidence about the amounts and disclosures in the financial statements. The procedures selected depend on the auditor’s judgment, including the assessment of the risks of material misstatement of the financial statements, whether due to fraud or error. In making those risk assessments, the auditor considers internal control relevant to the entity’s preparation and fair presentation of the financial statements in order to design audit procedures that are appropriate in the circumstances, but not for the purpose of expressing an opinion on the effectiveness of the entity’s internal control. Accordingly, we express no such opinion. An audit also includes evaluating the appropriateness of accounting policies used and the reasonableness of significant accounting estimates made by management, as well as evaluating the overall presentation of the financial statements. We believe that the audit evidence we have obtained is sufficient and appropriate to provide a basis for our audit opinion.
What inspires you, inspires us. | eidebailly.com2151 River Plaza Dr., Ste. 308 | Sacramento, CA 95833-4133 | T 916.570.1880 | F 916.570.1875 | EOE
2
Opinion In our opinion, the financial statements referred to above present fairly, in all material respects, the financial position of AMP, as of June 30, 2020 and 2019, and its changes in financial position, and cash flows thereof for the years then ended in accordance with accounting principles generally accepted in the United States of America. Emphasis of Matter Individual Fund Financial Statements As discussed in Note 1 to the financial statements, the financial statements present only the AMP electric enterprise fund, which is a department of the City of Alameda, and do not purport to, and do not, present fairly the financial position of the City of Alameda, California, as of June 30, 2020, and the changes in its financial position, or where applicable, its cash flows for the year then ended in conformity with accounting principles generally accepted in the United States of America. Our opinion is not modified with respect to this matter. Other Matters Required Supplementary Information Accounting principles generally accepted in the United States of America require that the management’s discussion and analysis, schedule of proportionate share of the City’s net pension liability, schedule of AMP’s pension contributions, schedule of AMP’s proportionate share of the City’s net OPEB liability, and schedule of AMP’s OPEB contributions, as listed on the table of contents, be presented to supplement the basic financial statements. Such information, although not a part of the basic financial statements, is required by the Governmental Accounting Standards Board, who considers it to be an essential part of financial reporting for placing the basic financial statements in an appropriate operational, economic, or historical context. We have applied certain limited procedures to the required supplementary information in accordance with auditing standards generally accepted in the United States of America, which consisted of inquiries of management about the methods of preparing the information and comparing the information for consistency with management’s responses to our inquiries, the basic financial statements, and other knowledge we obtained during our audit of the basic financial statements. We do not express an opinion or provide any assurance on the information because the limited procedures do not provide us with sufficient evidence to express an opinion or provide any assurance. Other Information Our audit was conducted for the purpose of forming an opinion on the financial statements as a whole. The introductory section, statistical section and bond disclosure section are presented for purposes of additional analysis and are not a required part of the basic financial statements. The introductory, statistical and bond disclosure sections have not been subjected to the auditing procedures applied in the audit of the basic financial statements and, accordingly, we do not express an opinion or provide any assurance on them.

3
Other Reporting Required by Government Auditing Standards In accordance with Government Auditing Standards, we have also issued our report dated February 25, 2021 on our consideration of AMP’s internal control over financial reporting and on our tests of its compliance with certain provisions of laws, regulations, contracts, and grant agreements and other matters. The purpose of that report is solely to describe the scope of our testing of internal control over financial reporting and compliance and the results of that testing, and not to provide an opinion on the effectiveness of AMP’s internal control over financial reporting or on compliance. That report is an integral part of an audit performed in accordance with Government Auditing Standards in considering AMP’s internal control over financial reporting and compliance.
Sacramento, California February 25, 2021
ALAMEDA MUNICIPAL POWER ELECTRIC ENTERPRISE FUND MANAGEMENT’S DISCUSSION AND ANALYSIS JUNE 30, 2020 and 2019
4
As management of Alameda Municipal Power (AMP), we offer readers of AMP’s financial statements this narrative overview and analysis of the financial activities of AMP for the year ended June 30, 2020. Readers are encouraged to consider the information presented here in conjunction with information contained in the preceding transmittal letter, the accompanying financial statements and notes, the statistical section of the comprehensive annual financial report and the bond disclosure information. FINANCIAL STATEMENTS OVERVIEW The basic financial statements present the financial picture of AMP from an economic resources measurement focus using the accrual basis of accounting similar to a private-sector business. The Statement of Net Position presents information on AMP’s assets, deferred outflows/inflows, and liabilities with the difference reported as net position. The primary purpose of this Statement is to provide relevant information about AMP’s assets, liabilities, deferred outflows/inflows, net position, and their relationships to each other at the year-end closing date. The information provided in the Statement, used with related disclosures and information in other financial statements, helps the public, creditors, and others assess AMP’s ability to continue to provide services, understand its liquidity, financial flexibility, and its ability to meet obligations. The Statement of Revenues, Expenses and Change in Net Position present relevant information showing how AMP’s resources were used in providing services and how AMP’s net position changed during the period. The information helps the public, creditors, and others to evaluate the organization's performance. The Statement allows the reader to assess AMP's service efforts, its ability to continue to provide services, the results of management’s stewardship, and other aspects of performance. The Statement of Cash Flows presents relevant information about cash receipts and payments and the net change in cash resulting from AMP’s operating, investing, and financing activities during the period. The Statement provides information for investors, creditors, and others, to evaluate AMP’s financial position, its ability to generate future cash flows, its ability to pay bills and meet obligations, and the differences between net income and net cash provided (used) by AMP’s operating, investing, and financing activities during the period. FINANCIAL HIGHLIGHTS AMP’s total net position increased by $1.3 million for the year ended June 30, 2020 while last year an
increase of $2.8 million was reported.
The increase of $1.3 million to the total net position comes from a combination of factors including:
o Current Assets increased by $4.9 million for the year ended June 30, 2020 while last year’s current assets increased by $6.7 million. The change in current assets was mainly driven by increased investments due to $1.8 million additional developer deposits for future developments, lower capital expenditures, and lower operating expenses. Accounts receivable increased by $715k as some business customers were impacted by the COVID-19 and were temporarily closed. AMP increased the bad debt reserves by $330k relating to the COVID-19. Green House Gas (GHG) related receivables decreased $946k as the Renewable Energy Credit (REC) sales ended on December 31, 2019. Materials and supplies decreased $710k as transformers and poles that were purchased in FY 2019 were utilized for restoration and maintenance as well as some development work.

ALAMEDA MUNICIPAL POWER ELECTRIC ENTERPRISE FUND MANAGEMENT’S DISCUSSION AND ANALYSIS JUNE 30, 2020 and 2019
5
o Capital Assets net of depreciation decreased $1.3 million for the year ended June 30, 2020, while last year’s decrease was $1.5 million (see note 3 for additional information regarding capital assets and depreciation amounts).
o Other Non-current Assets increased by $2.8 million for the year ended June 30, 2020 while last year an increase of $3.8 million was reported. This change was primarily due to an increase of $1.1 million for Underground Utility Districts (UUD) reserve, $795k for Low Carbon Fuel Standard (LCFS) reserve, and $986k for REC and Cap & Trade reserves. (see note 2 for additional information regarding restricted and designated investments).
o Deferred Outflow of Resources increased by $5k for the year ended June 30, 2020 while last year was reported a decrease of $2.7 million to pensions.
o Current Liabilities increased by $2.1 million for the year ended June 30, 2020, while last year an increase of $770k was reported. The change was primarily due to an increase of $1.8 million in deposits for transformers and various development projects.
o Non-current Liabilities increased by $1.9 million for the year ended June 30, 2020 while last year an increase of $2.5 million was reported. The change was primarily due to a decrease of $1.4 million in long term debt (net of current portion), an increase of $2.4 million in net pension liability, an increase of $90k in OPEB liability, and an increase of $768k claims liability (see note 10B for additional information).
o Deferred Inflow of Resources increased $1.2 million primarily as a result of the balancing account adjustment (see note 1C for additional information).
Electric fund operating revenue decreased $12k for the year ended June 30, 2020 while last year had an increase of $2.5 million. Electricity sales revenue increased $1.7 million while GHG sales decreased $1.4 million due to the end of the REC sales on December 31, 2019. Jobbing Sales decreased $452k and miscellaneous services such as field visits decreased $148k.
Excluding purchased power, depreciation and the balancing account, electric fund operating expenses for the year ended June 30, 2020 decreased $2.0 million while last year had an increase of $1.5 million. General and administration costs increased $2.3 million as a result of higher wages, increased benefit expense, and higher pension and OPEB expenses. Jobbing sales expense decreased by $438k, and customer service, energy efficiency and customer relations expenses increased by $99k.
Purchased power expenses increased $2.7 million for the year ended June 30, 2020, while last year a $968k increase was reported. Increase in purchase power was primarily due to higher transmission costs, reduced market revenue prices, and replacement purchases for the Geothermal plants during the Kincaid Fire in late 2019.
Depreciation and amortization expense increased $42k for the year ended June 30, 2020, while last year a $516k decrease was reported.
The balancing account adjustment, which is used to stabilize rates, decreased $3.8 million, while last year it was increased by $2 million (see note 1C for additional information on the deferred inflows of resources related to balancing account).
Electric fund non-operating revenues/expenses had a net decrease of $491k in spending for the year ended June 30, 2020 while last year a net increase in spending of $2.8 million was reported mainly from investments in NCPA projects and changes in investment interest income.

ALAMEDA MUNICIPAL POWER ELECTRIC ENTERPRISE FUND MANAGEMENT’S DISCUSSION AND ANALYSIS JUNE 30, 2020 and 2019
6
o Interest income was higher by $328k and interest expense was lower by $69k for the year ended June 30, 2020 while last year interest income was higher by $794k and interest expenses was lower by $64k.
o Loss from disposition of capital assets was $163k during the year ended June 30, 2020.
o Fair value of NCPA Projects and Reserves decreased by $778k during the year ended June 30, 2020, while last year an increase of $1.3 million was reported.
o Miscellaneous non-operating revenue/expense had a net increase of $107k for the year ended June 30, 2020 while last year a net decrease of $164k was reported.
AMP continued its support of the City’s general fund with a voter approved contribution of $4 million in FY 2020.
Cash and equivalents decreased $450k for the year ended June 30, 2020 while last year an increase of $2.9 million was reported. The results come from a combination of factors including:
o Net cash provided by operating activities decreased $1.6 million for years ended June 30, 2020 and 2019. FY 2020 employee payments decreased $1.4 million while FY 2019 an increase of $1.5 million relating to the renegotiated labor contracts. REC, C&T, and LCFS sales decreased $342k mainly due to the end of REC sales on December 31, 2019. Customer receipts increased $815k in FY 2020 compared to $1.5 million in FY 2019. Supplier payments increased $3.6 million while prior year saw an increase of $2.2 million as additional inventory and transformers were purchased during the year.
o Net cash used for non-capital financing activities increased $241k while last year it was reported that net cash used for non-capital financing activities decreased $4.2 million from the previous year. FY 2018 reflected $4.4 million non-cash streetlight asset transfer to the City.
o Net cash used for capital and related financing activities increased $403k while last year it was reported that net cash used in capital and related financing activities decreased $201k. The FY 2020 increase was mainly due purchases of capital assets.
o Net cash used for investing activities increased $1.2 million while last year it was reported that net cash provided for investing activities increased $3.7 million. Interest receipts increased $534k in FY 2020 due to investment portfolio diversification and higher interest rates as well as an increase of $330k in market value. Special purpose investment usage increased $2 million as REC sales expired December 31, 2019, and NCPA investment decreased by $325k.

ALAMEDA MUNICIPAL POWER ELECTRIC ENTERPRISE FUND MANAGEMENT’S DISCUSSION AND ANALYSIS JUNE 30, 2020 and 2019
7
COMBINED NET POSITION
AMP’s Combined Net Position as of June 30:
(Dollars in thousands)2020 2019 2018
Assets:Current Assets 63,251$ 58,383$ 51,663$ Capital Assets, net of depreciation 38,385 39,714 41,206 Other Non-current Assets 54,004 51,150 47,307
Total Assets 155,640 149,247 140,176
Deferred Outflow of Resources 3,226 3,221 5,926
Liabilities:Current Liabilities 10,452 8,364 7,594 Non-current Liabilities 49,770 47,898 50,353
Total Liabilities 60,222 56,262 57,947
Deferred Inflow of Resources 27,950 26,776 21,553
Net Position:Net Investment in Capital Assets 30,185 31,576 33,129 Restricted 4,777 4,720 4,662 Unrestricted 35,732 33,134 28,811
Total Net Position 70,694$ 69,430$ 66,602$

ALAMEDA MUNICIPAL POWER ELECTRIC ENTERPRISE FUND MANAGEMENT’S DISCUSSION AND ANALYSIS JUNE 30, 2020 and 2019
8
ANALYSIS OF NET POSITION AMP’s combined total net position was $71 million as of June 30, 2020. Comparing this year results to the previous fiscal year, the combined total net position increased by $1.3 million, or 1.8% of last year. The largest portion of combined total net position is the cash and cash equivalents, investments and interest, accounts receivable and inventory. The next largest contributor to AMP’s combined total net position is net investment in capital assets (e.g., land, utility plant, buildings, vehicles and equipment) less any related debt still outstanding that was used to acquire those assets. The capital assets are used to provide electric services and, consequently, are not available for future spending. Although AMP’s investment in capital assets is reported net of related debt, it should be noted that the resources to repay this debt must be provided from net revenues of the electric fund. The capital assets themselves cannot be used to liquidate these liabilities except under extraordinary circumstances. The third largest portion is the unrestricted Net Position from the renewable energy credit sales held in designated reserve accounts. AMP’s board may designate how these funds are expended. The largest portion of combined total liabilities is used to finance AMP’s operations, construction, and NCPA activities. Total combined assets increased $6.4 million, or a 4.3% increase to last year’s total. Total combined Deferred Outflow of Resources increased $5k, or 0.2% increase to last year’s total. Deferred Inflow of Resources increased $1.2 million, or 4.4% increase to last year’s total relating to pensions, OPEB, and the balancing account. Total combined liabilities increased by $4.0 million, or a 7.0% compared to last year’s total.

ALAMEDA MUNICIPAL POWER ELECTRIC ENTERPRISE FUND MANAGEMENT’S DISCUSSION AND ANALYSIS JUNE 30, 2020 and 2019
9
Combined Statement of Revenues, Expenses and Changes in Net Position as of June 30:
(Dollars in thousands)2020 2019 2018 2017 2016
Operating RevenuesElectric Sales 62,732$ 61,028$ 59,501$ 55,926$ 54,221$ Other Services Revenue 4,334 6,050 5,101 7,523 7,792
Total Operating Revenues 67,066 67,078 64,602 63,449 62,013
Operating ExpensesPurchased Power 32,246 29,587 28,618 28,201 29,781 Energy efficiency, solar, other 1,272 1,773 1,173 1,505 1,685 Operations and Maintenance 5,055 5,033 4,814 4,674 4,574 Customer Accounts, Information Systems 3,179 2,617 2,296 2,171 2,226 Administrative and General 12,262 9,955 10,527 7,425 7,733 Depreciation and Amortization 3,898 3,856 3,340 3,506 3,366 Sales Expense 587 549 506 530 540 Jobbing Sales Expense 804 1,242 368 994 315 Balancing Account 1,021 4,860 2,821 1,425 1,010
Total Operating Expenses 60,324 59,472 54,463 50,431 51,230
Total Operating Income (Loss) 6,742 7,606 10,139 13,018 10,783
Non-operating Revenue (Expense)Interest Income on Investments 1,973 1,645 851 473 316 Interest Expense (1,274) (1,343) (1,406) (1,461) (1,510) Gain (Loss) from Disposition (162) 38 (705) 86 - Other Expense 12 (6) (14) - - Increase (Decrease) in Value of NCPA Projects (566) 212 (1,125) 1,579 1,073 Alameda Point Phone Maintenance-Net 67 71 16 43 51 Misc Non-operating Income (Expense) 6 (101) 63 105 58 Telecommunications - - - - 10 Payment in-lieu of taxes (1,505) (1,475) (1,446) (1,418) (1,391)
Total Non-Operating Revenue (Expense) (1,449) (959) (3,766) (593) (1,393)
Income (loss) before Transfers and Special Item 5,293 6,647 6,373 12,425 9,390
Transfers in (to Telecom) - - - - 2,190 Transfer to City of Alameda (4,030) (3,818) (8,075) (2,800) (2,800) Transfers out (from Electric) - - - - (2,190)
Total Transfers (4,030) (3,818) (8,075) (2,800) (2,800)
Change In Net PositionElectric 1,263 2,829 (1,702) 9,625 4,390 Telecommunications - - - - 2,200
Total Change In Net Position 1,263$ 2,829$ (1,702)$ 9,625$ 6,590$
ALAMEDA MUNICIPAL POWER ELECTRIC ENTERPRISE FUND MANAGEMENT’S DISCUSSION AND ANALYSIS JUNE 30, 2020 and 2019
10
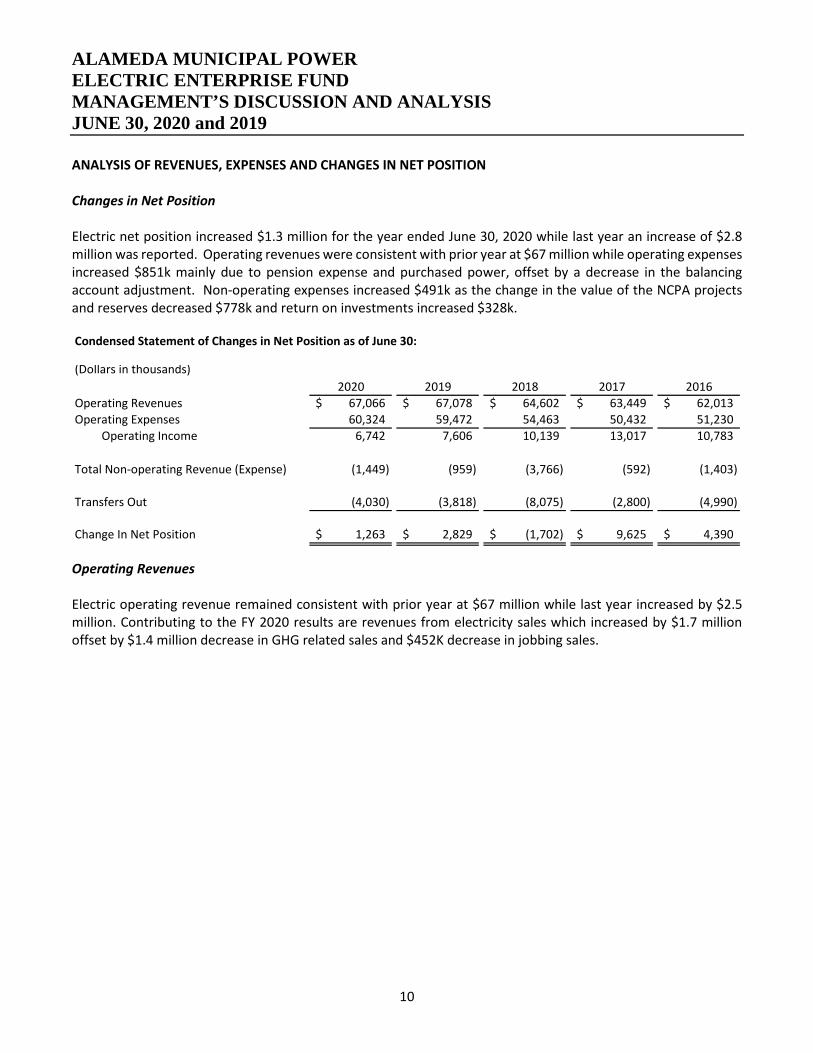
ANALYSIS OF REVENUES, EXPENSES AND CHANGES IN NET POSITION Changes in Net Position Electric net position increased $1.3 million for the year ended June 30, 2020 while last year an increase of $2.8 million was reported. Operating revenues were consistent with prior year at $67 million while operating expenses increased $851k mainly due to pension expense and purchased power, offset by a decrease in the balancing account adjustment. Non-operating expenses increased $491k as the change in the value of the NCPA projects and reserves decreased $778k and return on investments increased $328k. Condensed Statement of Changes in Net Position as of June 30:
(Dollars in thousands)2020 2019 2018 2017 2016
Operating Revenues 67,066$ 67,078$ 64,602$ 63,449$ 62,013$ Operating Expenses 60,324 59,472 54,463 50,432 51,230
Operating Income 6,742 7,606 10,139 13,017 10,783
Total Non-operating Revenue (Expense) (1,449) (959) (3,766) (592) (1,403)
Transfers Out (4,030) (3,818) (8,075) (2,800) (4,990)
Change In Net Position 1,263$ 2,829$ (1,702)$ 9,625$ 4,390$
Operating Revenues Electric operating revenue remained consistent with prior year at $67 million while last year increased by $2.5 million. Contributing to the FY 2020 results are revenues from electricity sales which increased by $1.7 million offset by $1.4 million decrease in GHG related sales and $452K decrease in jobbing sales.

ALAMEDA MUNICIPAL POWER ELECTRIC ENTERPRISE FUND MANAGEMENT’S DISCUSSION AND ANALYSIS JUNE 30, 2020 and 2019
11
Sources of Electric Revenue AMP's operating revenues are based on rate schedules authorized by the Board. Such rates are designed to recover AMP's cost of service and still be competitive with those in surrounding areas. Rates also provide a contribution to the City of Alameda; voters approved the contribution amount in November 2016. Operating Expenses Operating expenses, excluding the adjustment for balancing account accumulation, were higher than last year’s results by $4.7 million. In FY 2019, a $3.0 million increase from FY 2018 was reported. The increase experienced during FY 2020 was primarily increased power purchase costs and higher administrative and general expenses due to pensions and OPEB. The Balancing Account is used by AMP to stabilize rates by accumulating differences between the actual costs of providing service with the related revenues designated for recovery of such costs. AMP continues to experience volatility in California energy markets as seasonal weather impacts hydroelectric generation, natural-gas prices impact peak-demand electricity prices, geothermal generation is impacted by aging facilities, new landfill-gas generation becomes operational and new state laws and regulations are implemented for GHG reduction strategies. Although AMP recognizes that energy markets have stabilized since the energy crisis of 2000-2001, it is keenly aware that adverse energy markets may return due to a variety of factors that affect both the supply of and demand for electric energy in the Western United States.
0
5,000,000
10,000,000
15,000,000
20,000,000
25,000,000
30,000,000
35,000,000
Residential Commercial -GeneralService
Commercial -DemandMetered
Municipal Other RateSchedules
OtherRevenue
GHGReduction
Sales
Electric Revenue (Total)for FY2020 = $67,066,350 ; FY2019 = $67,078,362; FY2018 = $64,602,195
2020
2019
2018

ALAMEDA MUNICIPAL POWER ELECTRIC ENTERPRISE FUND MANAGEMENT’S DISCUSSION AND ANALYSIS JUNE 30, 2020 and 2019
12
The chart below offers a comparison of operating expenses for FY 2020, FY 2019, and FY 2018.
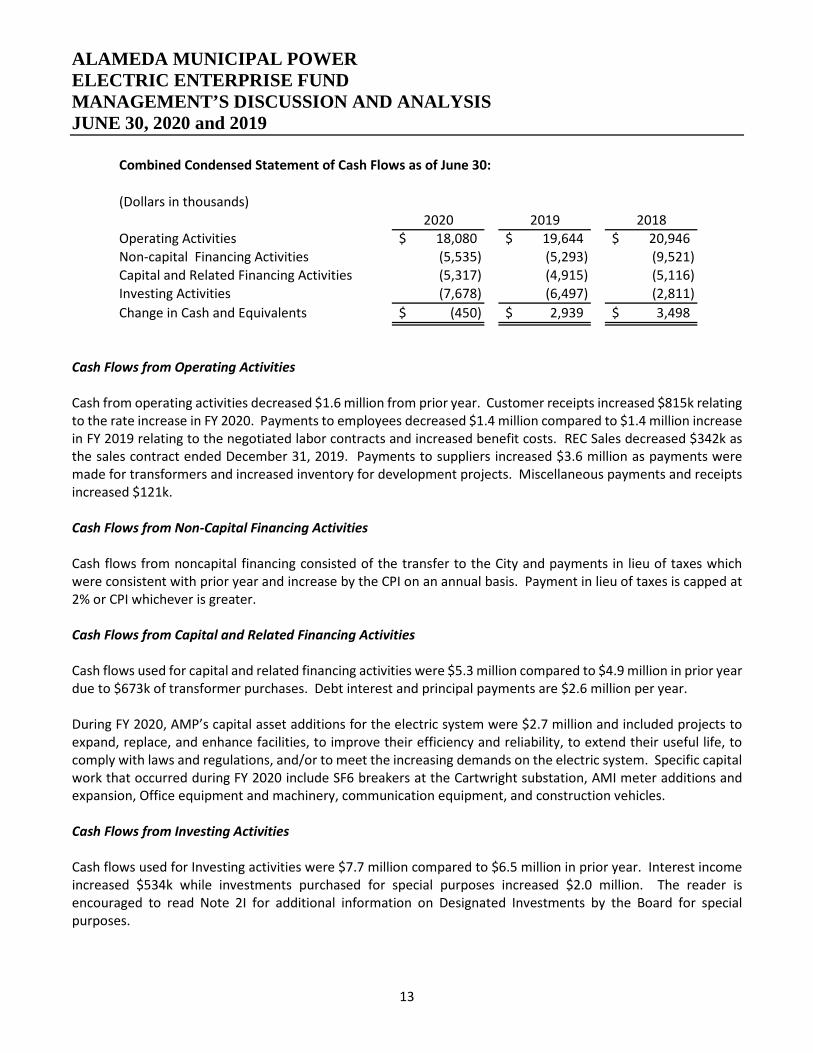
Non-Operating Revenues (Expenses) Non-operating expenses in FY 2020 exceeded non-operating revenue by $1.5 million compared to the $959k recorded last year. Return on investment revenues were $2.0 million while expenses consisted of $162k loss from sale of capital assets relating to obsolete inventory and retirement of assets, $566k from NCPA projects and reserves, $1.3 million for interest expense for the 2010A/B bonds, and $1.5 million from payments in lieu of taxes. ANALYSIS OF COMBINED CASH FLOWS Net Change in Cash and Equivalents Combined net change in cash and equivalents decreased by $450k for the year ended June 30, 2020 while last year an increase of $2.9 million was reported. AMP generates cash from its electric operations or utilizes its reserves to meet its operating needs including payments in lieu of taxes (PILOT), return on investment (ROI), and transfer to the City’s General Fund. AMP places Cap & Trade net revenues, GHG sales revenues, and Low carbon fuel standards sales revenues into investments for the Board designated special reserves for those funds. Changes in the cash flows are higher supplier payments relating to increased inventory and transformers, improved customer receipts relating to rate adjustments, decreased employee expenses, and change to investment in NCPA projects and reserves.
ALAMEDA MUNICIPAL POWER ELECTRIC ENTERPRISE FUND MANAGEMENT’S DISCUSSION AND ANALYSIS JUNE 30, 2020 and 2019
13
Combined Condensed Statement of Cash Flows as of June 30:
(Dollars in thousands)2020 2019 2018
Operating Activities 18,080$ 19,644$ 20,946$ Non-capital Financing Activities (5,535) (5,293) (9,521) Capital and Related Financing Activities (5,317) (4,915) (5,116) Investing Activities (7,678) (6,497) (2,811) Change in Cash and Equivalents (450)$ 2,939$ 3,498$
Cash Flows from Operating Activities Cash from operating activities decreased $1.6 million from prior year. Customer receipts increased $815k relating to the rate increase in FY 2020. Payments to employees decreased $1.4 million compared to $1.4 million increase in FY 2019 relating to the negotiated labor contracts and increased benefit costs. REC Sales decreased $342k as the sales contract ended December 31, 2019. Payments to suppliers increased $3.6 million as payments were made for transformers and increased inventory for development projects. Miscellaneous payments and receipts increased $121k. Cash Flows from Non-Capital Financing Activities Cash flows from noncapital financing consisted of the transfer to the City and payments in lieu of taxes which were consistent with prior year and increase by the CPI on an annual basis. Payment in lieu of taxes is capped at 2% or CPI whichever is greater. Cash Flows from Capital and Related Financing Activities Cash flows used for capital and related financing activities were $5.3 million compared to $4.9 million in prior year due to $673k of transformer purchases. Debt interest and principal payments are $2.6 million per year. During FY 2020, AMP’s capital asset additions for the electric system were $2.7 million and included projects to expand, replace, and enhance facilities, to improve their efficiency and reliability, to extend their useful life, to comply with laws and regulations, and/or to meet the increasing demands on the electric system. Specific capital work that occurred during FY 2020 include SF6 breakers at the Cartwright substation, AMI meter additions and expansion, Office equipment and machinery, communication equipment, and construction vehicles. Cash Flows from Investing Activities Cash flows used for Investing activities were $7.7 million compared to $6.5 million in prior year. Interest income increased $534k while investments purchased for special purposes increased $2.0 million. The reader is encouraged to read Note 2I for additional information on Designated Investments by the Board for special purposes.

ALAMEDA MUNICIPAL POWER ELECTRIC ENTERPRISE FUND MANAGEMENT’S DISCUSSION AND ANALYSIS JUNE 30, 2020 and 2019
14
ANALYSIS OF LONG-TERM DEBT On August 4, 2010, AMP authorized the issuance of $8.7 million in Revenue Bonds, Series 2010A, and $22.99 million in taxable Revenue Bonds, Series 2010B. Proceeds were used to prepay the outstanding Electric System Revenue Series 2000A COPs and the Series 2000AT taxable COPs, to fund a security deposit for the 2010A/B bonds, and to pay the cost of issuance for the 2010 A/B bonds. The maturity date for the Series 2010A is July 1, 2030 and the maturity date for the Series 2010B is July 1, 2027. The reader is encouraged to read Note 4, and the statistical section of this report, for additional information regarding long-term debt and expected payments for this bond.
Long-Term Debt as of June 30:
(Dollars in thousands)2020 2019 2018
Revenue Bonds, Series 2010A 8,700$ 8,700$ 8,700$ Taxable Revenue Bonds, Series 2010B 12,755 14,095 15,370 Long-Term Debt 21,455$ 22,795$ 24,070$
ANALYSIS OF CAPITAL ASSETS AMP’s investment in capital assets for its electric operations amounts to $38.4 million, net of accumulated depreciation. The investment in capital assets includes land, buildings, construction-in-progress, electric utility plant, machinery and equipment, transportation, and computer equipment. Readers desiring more detailed information on capital asset activity should see Note 3 and information in the Statistical Section of this report.
Electric Capital Assets as of June 30:
(Dollars in thousands)2020 2019 2018
Land and Rights 220$ 220$ 154$ Construction In Progress 5,199 3,862 2,873 Utility Plant 87,422 86,915 86,124 Service Center Building 8,168 8,168 8,131 Machinery & Equipment 9,726 9,726 9,620 Transportation Equipment 3,406 3,403 3,318 Computer Equipment 4,683 4,377 4,168 Furniture & Fixtures 923 900 900 Easements - - 186 Less Accumulated Depreciation (81,362) (77,857) (74,268)
Capital Assets, Net 38,385$ 39,714$ 41,206$

ALAMEDA MUNICIPAL POWER ELECTRIC ENTERPRISE FUND MANAGEMENT’S DISCUSSION AND ANALYSIS JUNE 30, 2020 and 2019
15
ANALYSIS OF ECONOMIC FACTORS Economic Factors and Next Year’s Budget The adopted budget for FY 2021 continues to grow at a low rate reflecting the local economy and the sluggish demand for new electric vehicles from the commercial sector. During FY 2020, AMP continued its strategic planning activities to enhance focus on the customer, provide a forum for long-range financial planning, facilitate prioritization of limited resources, balance conflicting priorities, and provide for effective communication of goals and policies. The global pandemic of coronavirus caused the economy to be shutdown for a good part of the year and AMP was able to maintain a strong financial position exceeding budgeted revenue and reducing expenses. AMP continues assessments of future financial needs; documents those needs in a 10-year pro-forma; manages Board established financial guidelines for rates, revenues and reserves; develops rate designs to meet financial guideline objectives; and continues to review opportunities to monetize its power supply resources. The adopted budget for FY 2021 includes electric operating revenues of $65 million reflecting zero rate increase from FY 2020. Per AMP’s Board, Renewable Energy Credit Revenues ended on December 31, 2019. Purchase power for FY 2021 is estimated to increase approximately $3.1 million due to market power purchase prices, ISO Load aggregation, wildfire insurance, and increased transmission costs. Excluding purchased power, the adopted budget for FY 2021 includes $28.2 million in operating expenses or 7.0% higher than the FY 2020 expenses. The primary reason for the operating budget increase is $1.8 million in customer programs and computer services for software purchases and maintenance that were previously capitalized. AMP revised its capitalization policy to increase the minimal value of capitalized items. The non-operating budget for FY 2021 is decreased $53k or 1.0% and includes funds for outside billing projects, debt related charges of $1.2 million, PILOT/ROI charges of $1.5 million and a transfer to the City of $4.0 million as a result of the approved voter proposal in November 2016. The budget assumes that no additional long-term debt will be needed during the fiscal year. The capital project budget for FY 2021 is estimated at $7.1 million and includes $1.5 million for UUD, $2 million for the Doolittle community solar project, $1.5M for inventory additions for long lead parts, and approximately $2.1 million for system additions, system enhancements, new load additions, vehicle replacement, and SF6 breakers for the NCPA Combustion Turbine. The budget anticipates that operating revenues will be insufficient to meet all expenses during FY 2021 and that existing reserves will be used to cover expenses. As part of the financial planning process, the Board directed that a series of smaller rate adjustments implemented each year is preferred to a few large rate increases. The special reserves will provide funds for certain capital expenditures. Working capital will provide funds for any shortfall between revenue and expenditures. Market Risk Each year during budget development, AMP considers the risk exposure that it faces. The risk exposure can be categorized into broad categories including power supply risks, credit risks, other supply-based risks, demand side risks, legislative / regulatory risks, and other utility risks. AMP manages energy price risks through its involvement with NCPA and their energy commodity risk management policies, processes, and procedures to help mitigate fluctuations in energy prices. NCPA also monitors and manages credit risk with its trading counter parties. In addition to policies, processes and procedures, AMP manages its risk exposure by maintaining adequate reserves

ALAMEDA MUNICIPAL POWER ELECTRIC ENTERPRISE FUND MANAGEMENT’S DISCUSSION AND ANALYSIS JUNE 30, 2020 and 2019
16
and establishing new reserves as needed. AMP is exposed to changes in interest rates primarily because of its borrowing and investing activities used for liquidity purposes and to fund business operations as well as finance capital expenditures. AMP’s investment policy limits investments to financial instruments that maximize the safety of principal (See Note 2 to the Basic Financial Statements). In addition, AMP has restricted investments invested in accordance with guidelines established in the related bond documents. REQUESTS FOR INFORMATION This financial report is designed to provide the Board, Alameda citizens, taxpayers, creditors, and investors with a general overview of AMP’s finances. Questions concerning any of the information provided in this report or requests for additional information should be addressed to Alameda Municipal Power; Assistant General Manager - Administration; 2000 Grand Street; Alameda, California 94501.

See Notes to Financial Statements 17
Alameda Municipal Power Electric Enterprise Fund
Statements of Net Position June 30, 2020 and 2019
2020 2019
Assets
Current Assets:Cash and cash equivalents (Note 2) 28,469,934$ 28,919,531$ Investments 23,612,935 17,276,229 Interest receivable 215,498 321,766 Accounts receivable, net 7,464,423 6,749,841 Greenhouse gas related sales receivable - 946,213 Materials and supplies 3,394,641 4,104,160 Prepaid and other 93,488 65,441
Total Current Assets 63,250,919 58,383,181
Non-current Assets:Capital assets (Note 3):
Nondepreciable 5,418,634 4,082,363 Depreciable 114,328,408 113,489,028 Accumulated depreciation (81,362,299) (77,856,841)
Total capital assets, net 38,384,743 39,714,550
Restricted assets (Note 2) 4,777,285 4,719,758
Investments designated for special purposes (Note 2) 38,654,618 35,757,540
Investment in Joint Venture - Share of certain NCPA projects and reserve (Note 8) 10,572,051 10,673,031
Total Non-current Assets 92,388,697 90,864,879
Total Assets 155,639,616 149,248,060
Deferred Outflows of ResourcesDeferred amount on refunding 500,144 561,795 Deferred outflows related to pensions 2,666,288 2,657,801 Deferred outflows related to OPEB 59,672 1,509
Total Deferred Outflows of Resources 3,226,104 3,221,105 (Continued)

See Notes to Financial Statements 18
Alameda Municipal Power Electric Enterprise Fund
Statement of Net Position (Continued) June 30, 2020 and 2019
2020 2019
Liabilities
Current Liabilities:Accounts payable and accrued payroll 1,198,881$ 1,206,336$ Due to City of Alameda 325,692 300,508 Interest payable 606,067 640,525 Refundable deposits 6,061,796 4,219,174 Current portion of long term debt (Note 4) 1,410,000 1,340,000 Other accrued liabilities - 22,636 Current portion of compensated absences (Note 1C) 654,633 530,200 Current portion of claims liability (Note 10B) 195,000 105,013
Total Current Liabilities 10,452,069 8,364,392
Non-current Liabilities:Long term debt, net of current portion (Note 4) 20,045,000 21,455,000 Claims liability (Note 10B) 1,703,235 934,938 Net pension liability 26,437,127 24,012,403 Net OPEB liability 1,584,849 1,495,574
Total Non-current Liabilities 49,770,211 47,897,915
Total Liabilities 60,222,280 56,262,307
Deferred Inflows of ResourcesBalancing account 27,350,493 26,329,878 Deferred inflows related to pensions 560,522 360,913 Deferred inflows related to OPEB 39,015 85,624
Total Deferred Inflows of Resources 27,950,030 26,776,415
Net PositionNet investment in capital assets 30,184,887 31,576,345 Restricted for:
Debt service reserves (Note 2H) 4,777,285 4,719,758 Unrestricted 35,731,238 33,134,340
Total Net Position 70,693,410$ 69,430,443$

See Notes to Financial Statements 19
Alameda Municipal Power Electric Enterprise Fund
Statements of Revenues, Expenses and Changes in Fund Net Position Years Ended June 30, 2020 and 2019
2020 2019
Operating Revenues:Sales 62,731,635$ 61,027,633$ Miscellaneous services 362,644 510,524 Plant leased to others 258,812 125,072 Jobbing sales 803,802 1,255,775 Cap and trade revenue 1,034,008 998,374 Greenhouse gas related sales 886,699 2,277,784 Low carbon fuel standard credit sales 988,750 883,200
Total Operating Revenues 67,066,350 67,078,362
Operating Expenses:Purchased power 32,246,283 29,586,832 Energy efficiency, solar and other 1,271,590 1,773,249 Operations and maintenance 5,055,482 5,033,334 Customer service, information systems 3,179,247 2,617,469 Administrative and general 12,261,784 9,954,555 Depreciation and amortization 3,898,011 3,856,302 Customer relations 587,487 548,723 Jobbing sales expense 803,802 1,242,159 Balancing account adjustment 1,020,615 4,860,258
Total Operating Expenses 60,324,301 59,472,881
Operating Income 6,742,049 7,605,481
Nonoperating Revenues (Expenses):Return on investments 1,934,656 1,584,596 Interest income on restricted investments 37,972 60,438 Interest expense (1,273,787) (1,342,703) Gain (Loss) from sale of capital assets (162,658) 37,880 Other income (expense) 12,490 (5,883) Increase (decrease) in value of certain NCPA
projects and reserves (566,144) 212,080 Alameda Point phone maintenance-Net 66,926 71,417 Miscellaneous income (expense) 6,228 (101,345) Payment in-lieu of taxes (1,505,000) (1,474,996)
Total Nonoperating Revenue (Expense) (1,449,317) (958,516)
Income before Transfers 5,292,732 6,646,965
Transfers to City of Alameda (Note 5) (4,029,765) (3,818,400)
Change in Net Position 1,262,967 2,828,565
Net position, beginning of year 69,430,443 66,601,878
Net position, end of year 70,693,410$ 69,430,443$

See Notes to Financial Statements 20
Alameda Municipal Power Electric Enterprise Fund
Statements of Cash Flows Years Ended June 30, 2020 and 2019
2020 2019
Cash Flows from Operating ActivitiesReceipts from customers 65,284,933$ 64,469,549$ Receipts from Special Sales (C&T and REC) 3,855,670 4,197,647 Payments to suppliers (45,046,314) (41,447,018) Payments to employees (6,124,914) (7,566,265) Miscellaneous payments and receipts 110,828 (9,801)
Net cash provided by Operating Activities 18,080,203 19,644,112
Cash Flows from Noncapital Financing ActivitiesTransfers to General Fund of City of Alameda (4,029,765) (3,818,400) Payments in-lieu of taxes (1,505,000) (1,474,996)
Net cash used for Noncapital Financing Activities (5,534,765) (5,293,396)
Cash Flows from Capital and Related Financing ActivitiesPurchase of Capital Assets (2,743,979) (2,364,907) Proceeds (loss) from disposition of capital assets 13,117 37,880 Long-term debt repayments (1,340,000) (1,275,000) Interest paid on long-term debt (1,246,594) (1,312,884)
Net cash used for Capital and Related Financing Activities (5,317,456) (4,914,911)
Cash Flows from Investing ActivitiesInterest receipts 2,078,896 1,544,625 Investments designated for special purposes (9,233,784) (7,193,134) Investment in certain NCPA projects and reserves (465,164) (790,185) Investment in restricted assets (57,527) (58,255)
Net cash used for Investing Activities (7,677,579) (6,496,949)
Net increase (decrease) in cash and cash equivalents (449,597) 2,938,856
Cash and equivalents at beginning of year 28,919,531 25,980,675
Cash and equivalents at end of year 28,469,934$ 28,919,531$
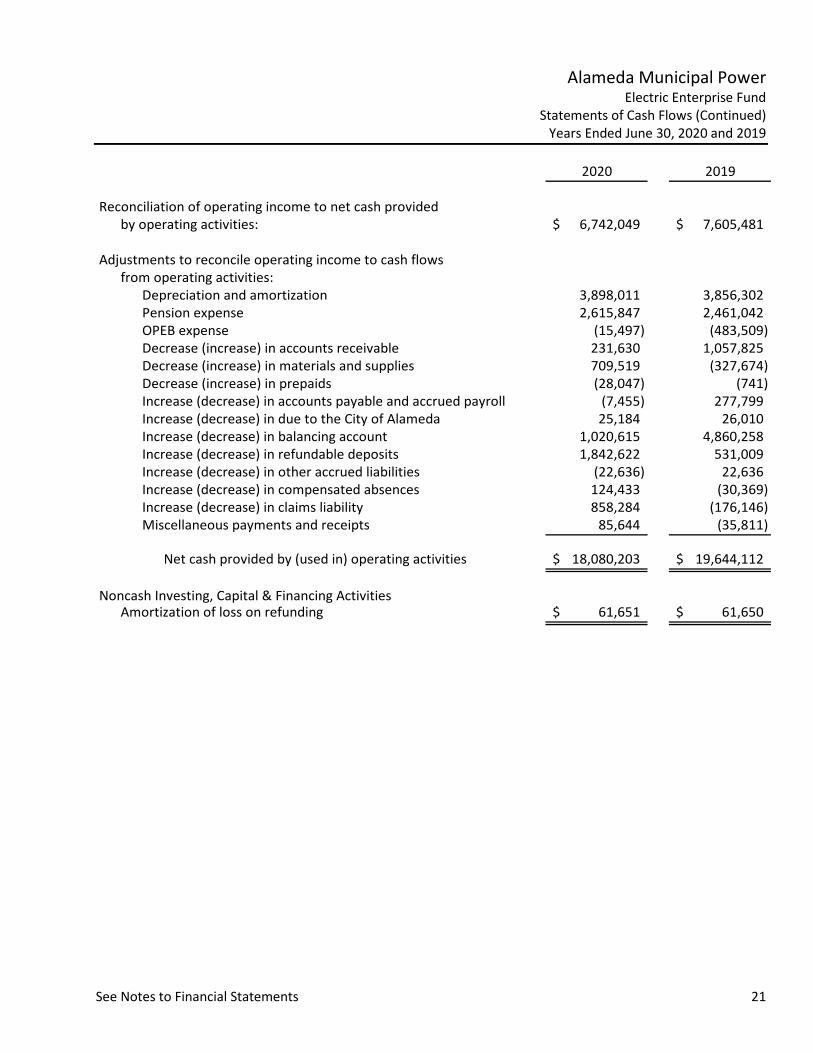
See Notes to Financial Statements 21
Alameda Municipal Power Electric Enterprise Fund
Statements of Cash Flows (Continued) Years Ended June 30, 2020 and 2019
2020 2019
Reconciliation of operating income to net cash provided by operating activities: 6,742,049$ 7,605,481$
Adjustments to reconcile operating income to cash flows from operating activities:
Depreciation and amortization 3,898,011 3,856,302 Pension expense 2,615,847 2,461,042 OPEB expense (15,497) (483,509) Decrease (increase) in accounts receivable 231,630 1,057,825 Decrease (increase) in materials and supplies 709,519 (327,674) Decrease (increase) in prepaids (28,047) (741) Increase (decrease) in accounts payable and accrued payroll (7,455) 277,799 Increase (decrease) in due to the City of Alameda 25,184 26,010 Increase (decrease) in balancing account 1,020,615 4,860,258 Increase (decrease) in refundable deposits 1,842,622 531,009 Increase (decrease) in other accrued liabilities (22,636) 22,636 Increase (decrease) in compensated absences 124,433 (30,369) Increase (decrease) in claims liability 858,284 (176,146) Miscellaneous payments and receipts 85,644 (35,811)
Net cash provided by (used in) operating activities 18,080,203$ 19,644,112$
Noncash Investing, Capital & Financing ActivitiesAmortization of loss on refunding 61,651$ 61,650$

22
Alameda Municipal Power Electric Enterprise Fund
Notes to Financial Statements June 30, 2020 and 2019
Note 1 - Summary of Significant Accounting Policies A. General Alameda Municipal Power (AMP) is a department of the City of Alameda (City) that operates the electric system. AMP provides this service to the businesses and residents of the City, Alameda Point (former Alameda Naval Air Station) and Coast Guard Island. AMP is under the policy control of the Public Utilities Board (Board), as set forth in the City Charter. The Board consists of five members appointed by the City Council, one of whom is the City Manager. The accompanying financial statements only reflect the activity of AMP, an enterprise fund of the City. These financial statements present only AMP and do not purport to, and do not, present fairly the financial position of the City and the changes in its financial position and cash flows, where applicable, in conformity with accounting principles generally accepted in the United States of America. B. Basis of Presentation AMP's basic financial statements are prepared in conformity with accounting principles generally accepted in the United States of America. The Governmental Accounting Standards Board is the acknowledged standard setting body for establishing accounting and financial reporting standards followed by governmental entities in the United States of America. C. Basis of Accounting AMP is accounted for as an enterprise fund (proprietary fund type). A fund is an accounting entity with a self-balancing set of accounts established to record the financial position and results of operations of a specific activity. The activities of an enterprise fund closely resemble those of the private sector in which the purpose is to conserve and add to economic resources. Enterprise funds account for operations that provide services on a continuous basis and are substantially financed by revenues derived from user charges. The financial statements are reported using the economic resources measurement focus and the accrual basis of accounting. Revenues are recorded when earned and expenses are recorded at the time liabilities are incurred, regardless of when the related cash flows take place. Investments in Joint Ventures – AMP records its equity in the general operating reserve of the Northern California Power Agency (NCPA), and its net equity in those projects in which it participates, as discussed in Note 8. AMP's share of individual project obligations has been netted against its share of the related project assets, as reported by NCPA, because AMP does not actively manage these projects and does not expect to become directly liable for any of the obligations of these projects. Amounts paid to the Transmission Agency of Northern California (TANC) are expensed currently because AMP's estimated equity, if any, in TANC is not material, as discussed in Note 9. Amounts paid to the Local Agency Workers Compensation Excess Joint Powers Authority are charged currently to insurance expense, as discussed in Note 10. Cash and Cash Equivalents – For purposes of the statements of cash flows, AMP defines cash and cash equivalents to include all cash and temporary investments with original maturities of three months or less from the date of acquisition.
Alameda Municipal Power Electric Enterprise Fund
Notes to Financial Statements (Continued) June 30, 2020 and 2019
23
Investments – are carried at fair value, as required by generally accepted accounting principles in the United States of America. AMP adjusts the carrying value of its investments to reflect their fair value at each fiscal year end, and it includes the effects of these adjustments in income for that fiscal year. Materials and Supplies – are valued at average cost and are used primarily for internal purposes. Maintenance and Repairs – are charged to maintenance expense as incurred. Capital Assets – are valued at historical cost or estimated historical cost if actual historical cost is not available. AMP capitalizes all assets with a historical cost of at least $5,000 and a useful life of at least three years. All capital assets with limited useful lives are depreciated over their estimated useful lives. The purpose of depreciation is to spread the cost of capital assets equitably among all users over the life of these assets. The amount charged to depreciation expense each year represents that year's pro rata share of the cost of capital assets. Depreciation is provided using the straight-line method which means the cost of the asset is divided by its expected useful life in years and the result is charged to expense each year until the asset is fully depreciated. AMP has assigned the useful lives listed below to capital assets: Utility Plant and Buildings 30-50 yearsMachinery and Equipment 10-40 yearsTransportation Equipment 5-10 yearsComputer Equipment 5 yearsFurniture and Fixtures 25 years
Major outlays for capital assets and improvements are capitalized as projects are constructed. Some capital assets may be acquired using federal and state grant funds, or they may be contributed by developers or other governments. Contributions are accounted for at their acquisition cost at the time the capital assets are contributed. Deferred Outflows and Inflows of Resources – deferred outflows of resources are a consumption of net position that is applicable to a future reporting period and deferred inflows of resources are an acquisition of net position that is applicable to a future reporting period. A deferred outflow of resources has a positive effect on net position, similar to assets, and a deferred inflow of resources has a negative effect on net position, similar to liabilities. AMP has certain items, which qualify for reporting as deferred outflows of resources and deferred inflows of resources. Deferred Outflows of Resources – Deferred Loss on Refunding – is used by AMP to report the difference in the carrying value of the refunded debt and its reacquisition price for the 2010A/B Refunding Bonds. This amount is deferred and amortized over the shorter of the life of the refunded or refunding debt.
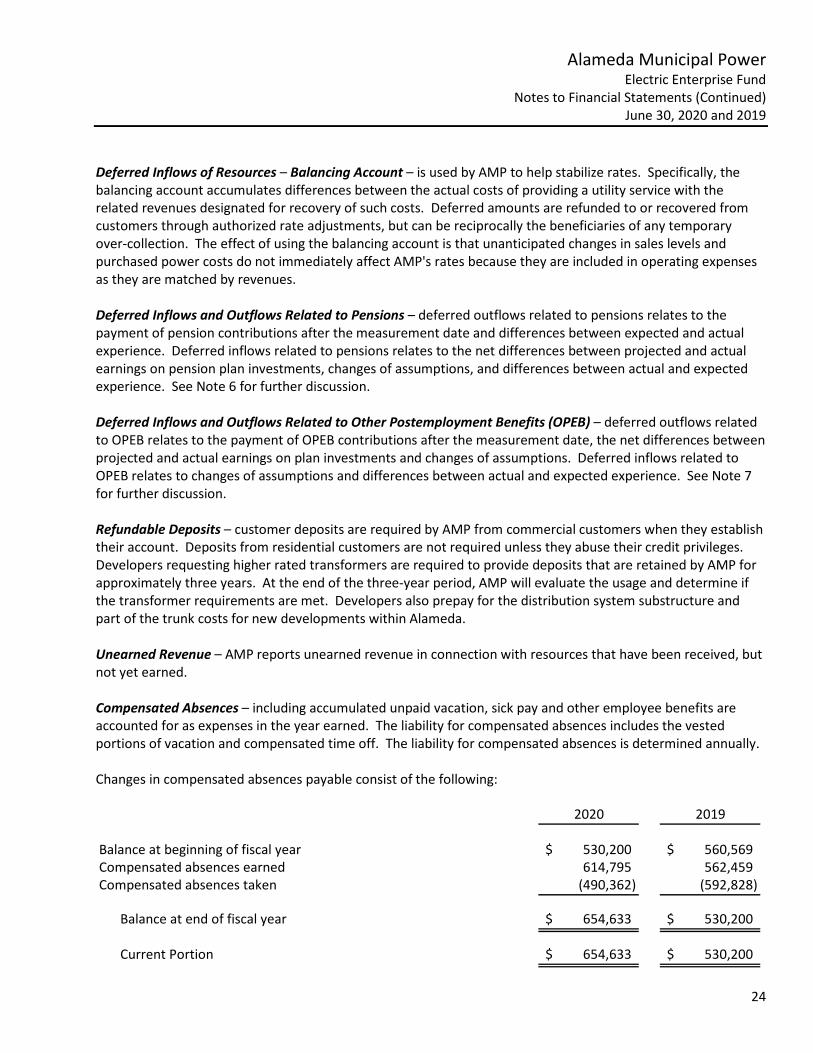
Alameda Municipal Power Electric Enterprise Fund
Notes to Financial Statements (Continued) June 30, 2020 and 2019
24
Deferred Inflows of Resources – Balancing Account – is used by AMP to help stabilize rates. Specifically, the balancing account accumulates differences between the actual costs of providing a utility service with the related revenues designated for recovery of such costs. Deferred amounts are refunded to or recovered from customers through authorized rate adjustments, but can be reciprocally the beneficiaries of any temporary over-collection. The effect of using the balancing account is that unanticipated changes in sales levels and purchased power costs do not immediately affect AMP's rates because they are included in operating expenses as they are matched by revenues. Deferred Inflows and Outflows Related to Pensions – deferred outflows related to pensions relates to the payment of pension contributions after the measurement date and differences between expected and actual experience. Deferred inflows related to pensions relates to the net differences between projected and actual earnings on pension plan investments, changes of assumptions, and differences between actual and expected experience. See Note 6 for further discussion. Deferred Inflows and Outflows Related to Other Postemployment Benefits (OPEB) – deferred outflows related to OPEB relates to the payment of OPEB contributions after the measurement date, the net differences between projected and actual earnings on plan investments and changes of assumptions. Deferred inflows related to OPEB relates to changes of assumptions and differences between actual and expected experience. See Note 7 for further discussion. Refundable Deposits – customer deposits are required by AMP from commercial customers when they establish their account. Deposits from residential customers are not required unless they abuse their credit privileges. Developers requesting higher rated transformers are required to provide deposits that are retained by AMP for approximately three years. At the end of the three-year period, AMP will evaluate the usage and determine if the transformer requirements are met. Developers also prepay for the distribution system substructure and part of the trunk costs for new developments within Alameda. Unearned Revenue – AMP reports unearned revenue in connection with resources that have been received, but not yet earned. Compensated Absences – including accumulated unpaid vacation, sick pay and other employee benefits are accounted for as expenses in the year earned. The liability for compensated absences includes the vested portions of vacation and compensated time off. The liability for compensated absences is determined annually. Changes in compensated absences payable consist of the following:
2020 2019
Balance at beginning of fiscal year 530,200$ 560,569$ Compensated absences earned 614,795 562,459 Compensated absences taken (490,362) (592,828)
Balance at end of fiscal year 654,633$ 530,200$
Current Portion 654,633$ 530,200$

Alameda Municipal Power Electric Enterprise Fund
Notes to Financial Statements (Continued) June 30, 2020 and 2019
25
Sales Revenues – sales of electricity are recognized based on cycle billings periodically rendered to customers. Revenues for services provided but not billed at the end of a fiscal year are recognized and accrued based on the estimated consumption. D. Budgets and Budgetary Accounting Although not required by California Government Code, AMP adopts an annual budget to serve as its approved financial plan. AMP follows these procedures in establishing the budget:
1. The General Manager submits to the Board a proposed operating budget for the fiscal year commencing the following July 1. The operating budget includes proposed expenditures and the means of financing them.
2. Ratepayer comments are solicited during regular Public Utilities Board meetings.
3. The budget is legally enacted through passage of a resolution.
4. The General Manager is authorized to transfer budgeted amounts between divisions; however, any
revisions that increase the total expenditures must be approved by the Board. Expenditures may not legally exceed budgeted appropriations at the fund level without Board approval.
5. Unexpended appropriations lapse at year-end and must be re-appropriated in the following year.
6. Formal budgetary integration is employed as a management control device during the year.
7. Budgets are adopted on a basis consistent with generally accepted accounting principles, except that
AMP budgets capital asset outlays as current year expenditures. E. Net Position It is AMP’s policy to apply restricted resources first when an expense is incurred for purposes for which both restricted and unrestricted net position is available. Net Position is the excess of all AMP's assets and deferred outflows over all its liabilities and deferred inflows, regardless of fund. Net Position is divided into the captions below: Net Investment in Capital Assets describes the portion of net position which is represented by the current net book value of AMP's capital assets, less the outstanding balance of any debt issued to finance these assets. Restricted describes the portion of net position which is restricted as to use by the terms and conditions of agreements with outside parties, governmental regulations, laws, enabling legislation, or other restrictions which AMP cannot unilaterally alter. Unrestricted describes the portion of net position which is not restricted to use.
Alameda Municipal Power Electric Enterprise Fund
Notes to Financial Statements (Continued) June 30, 2020 and 2019
26
Designations are imposed by the Board to reflect future spending plans or concerns about the availability of future resources. Designations may be modified, amended or removed by Board action and are classified under unrestricted net position. F. Classification of Revenues Operating revenues consist mainly of electric services sales. Operating revenues are used to finance the cost of operations, including the cost of delivering and providing services, maintenance and recurring capital replacement and paying debt service. All other revenues and expenses not meeting this definition are reported as nonoperating revenues and expenses. AMP distinguishes operating revenues and expenses from nonoperating items. Operating revenues and expenses generally result from providing services and producing and delivering goods in connection with AMP’s principal ongoing operations. The principal operating revenues are charges to customers for sales and services. Operating expenses include the cost of sales and services, administrative expenses, and depreciation on capital assets. All revenues and expenses not meeting this definition are reported as nonoperating revenues and expenses. G. Use of Estimates The preparation of financial statements in conformity with generally accepted accounting principles (GAAP) requires management to make estimates and assumptions that affect the reported amounts of assets, liabilities, deferred outflows of resources, deferred inflows of resources and disclosures at the date of the financial statements and the reported amounts of revenues and expenses during the reporting period. Actual results could differ from those estimates. H. Pension For purposes of measuring the net pension liability, deferred outflows of resources and deferred inflows of resources related to pensions, and pension expense, information about the fiduciary net position of AMP’s proportionate share of the City of Alameda’s agent multiple-employer defined benefit miscellaneous retirement plan (the Plan) administered by California Public Employees’ Retirement System (CalPERS) and additions to deductions from the Plan’s net position have been determined on the same basis as they are reported by the Plan. For this purpose, benefit payments (including refunds of employee contributions) are recognized when due and payable in accordance with the benefit terms. Investments are reported at fair value. I. OPEB For purposes of measuring the net other post-employment benefits (OPEB) liability, deferred outflows of resources and deferred inflows of resources related to OPEB, and OPEB expense, information about the fiduciary net position of AMP's proportionate share of the City's Single-Employer OPEB Plan, as administered by the City, and additions to/deductions from the Plan's fiduciary net position have been determined on the same basis as they are reported by the Plan. For this purpose, benefit payments (including refunds of employee contributions) are recognized when due and payable in accordance with the benefit terms. Investments are reported at fair value.
Alameda Municipal Power Electric Enterprise Fund
Notes to Financial Statements (Continued) June 30, 2020 and 2019
27
J. Implemented GASB Pronouncements GASB Statement No. 95 – In May 2020, GASB issued Statement No. 95, Postponement of the Effective Dates of Certain Authoritative Guidance. The objective of this Statement is to provide temporary relief to governments and other stakeholders in light of the COVID-19 pandemic. That objective is accomplished by postponing the effective dates of certain provisions in Statements and Implementation Guides that first became effective or are scheduled to become effective for periods beginning after June 15, 2018 and later. This Statement is effective immediately. AMP has determined that this Statement does not have an impact on the financial statements. K. New Governmental Accounting and Reporting Standards The Governmental Accounting Standards Board (GASB) releases new accounting and financial reporting standards which may have a significant impact on AMP’s financial reporting process. Future new standards which may impact AMP include the following: GASB Statement No. 84 – In January 2017, GASB issued Statement No. 84, Fiduciary Activities. The objective of this Statement is to improve guidance regarding the identification of fiduciary activities for accounting and financial reporting purposes and how those activities should be reported. This Statement is effective for reporting periods beginning after December 15, 2019. AMP has not determined the effect on the financial statements. GASB Statement No. 87 – In June 2017, GASB issued Statement No. 87, Leases. The objective of this Statement is to better meet the information needs of financial statement users by improving accounting and financial reporting for leases; enhancing the comparability of financial statements between governments; and also enhancing the relevance, reliability (representational faithfulness), and consistency of information about the leasing activities of governments. This Statement is effective for reporting periods beginning after June 15, 2021. AMP has not determined the effect on the financial statements. GASB Statement No. 89 – In June 2018, GASB issued Statement No. 89, Accounting for Interest Cost Incurred before the End of a Construction Period. The objectives of this Statement are to enhance the relevance and comparability of information about capital assets and the cost of borrowing for a reporting period and to simplify accounting for interest cost incurred before the end of a construction period. This Statement is effective for reporting periods beginning after December 15, 2020. AMP has not determined the effect on the financial statements. GASB Statement No. 90 – In June 2018, GASB issued Statement No. 90, Majority Equity Interest. The objective of this Statements is to improve the consistency and comparability of a reporting a government’s majority equity interest in a legally separate organization and to improve the relevance of financial statement information for certain component units. This Statement is effective for reporting periods beginning after December 15, 2019. AMP has not determined the effect on the financial statements. GASB Statement No. 91 – In May 2019, GASB issued Statement No. 91, Conduit Debt Obligations. The objective of this Statements is to provide a single method of reporting conduit debt obligations by issuers and eliminate diversity in practice associated with (1) commitments extended by issuers, (2) arrangements associated with conduit debt obligations, and (3) related note disclosures. This Statement is effective for reporting periods beginning after December 15, 2021. AMP has not determined the effect on the financial statements.

Alameda Municipal Power Electric Enterprise Fund
Notes to Financial Statements (Continued) June 30, 2020 and 2019
28
GASB Statement No. 92 – In January 2020, GASB issued Statement No. 92, Omnibus 2020. The objectives of this Statement are to enhance comparability in accounting and financial reporting and to improve the consistency of authoritative literature by addressing practice issues that have been identified during implementation and application of certain GASB Statements. Except for certain provisions, which are effective upon issuance. This statement is effective for fiscal years beginning after June 15, 2021. AMP has not determined the effect on the financial statements. GASB Statement No. 93 – In March 2020, GASB issued Statement No. 93, Replacement of Interbank Offered Rates. The objective of this Statement is to address those and other accounting and financial reporting implications that result from the replacement of an IBOR. This Statement is effective for reporting periods beginning after December 31, 2021. AMP has not determined the effect on the financial statements. GASB Statement No. 94 – In March 2020, GASB issued Statement No. 94, Public-Private and Public-Public Partnerships and Availability Payment Arrangements. The objective of this Statement is to improve financial reporting by addressing issues related to public-private and public-public partnership arrangements (PPPs). This Statement is effective for reporting periods beginning after June 15, 2022. AMP has not determined the effect on the financial statements. GASB Statement No. 96 – In May 2020, GASB issued Statement No. 96, Subscription-Based Information Technology Arrangements. The objective of this Statement is to better meet the information needs of financial statement users by (a) establishing uniform accounting and financial reporting requirements for SBITAs; (b) improving the comparability of financial statements among governments that have entered into SBITAs; and the (c) enhancing the understandability, reliability, relevance, and consistency of information about SBITAs. This Statement is effective for reporting periods beginning after June 15, 2022. AMP has not determined the effect on the financial statements. GASB Statement No. 97 – In June 2020, GASB issued Statement No. 97, Certain Component Unit Criteria, and Accounting and Financial Reporting for Internal Revenue Code Section 457 Deferred Compensation Plans – An Amendment of GASB Statements No. 14 and No. 84, and a Supersession of GASB Statement No. 32. The objective of this Statement are to (1) increase consistency and comparability related to the reporting of fiduciary component units in circumstances in which a potential component unit does not have a governing board and the primary government performs the duties that a governing board typically would perform; (2) mitigate costs associated with the reporting of certain defined contribution pension plans, defined contribution other postemployment benefit (OPEB) plans, and employee benefit plans other than pension plans or OPEB plans (other employee benefit plans) as fiduciary component units in fiduciary fund financial statements; and (3) enhance the relevance, consistency, and comparability of the accounting and financial reporting for Internal Revenue Code (IRC) Section 457 deferred compensation plans (Section 457 plans) that meet the definition of a pension plan and for benefits provided through those plans. This Statement is effective for reporting periods beginning after June 15, 2021. AMP has not determined the effect on the financial statements.

Alameda Municipal Power Electric Enterprise Fund
Notes to Financial Statements (Continued) June 30, 2020 and 2019
29
Note 2 - Cash and Investments and Restricted Assets A. Classification Cash and investments are classified in the financial statements as shown below, based on whether or not their use is restricted under the terms of AMP debt instruments. Cash and investments as of June 30 are as follows:
2020 2019
Cash and cash equivalents 28,469,934$ 28,919,531$ Investments 23,612,935 17,276,229 Restricted assets 4,777,285 4,719,758 Investments designated for special purposes 38,654,618 35,757,540
Total Cash and Investments 95,514,772$ 86,673,058$
B. Policies California law requires banks and savings and loan institutions to pledge government securities with a market value of 110 percent of AMP's cash on deposit, or first trust deed mortgage notes with a market value of 150 percent of the deposit, as collateral for these deposits. Under California law this collateral is held in a separate investment pool by another institution in AMP's name and places AMP ahead of general creditors of the institution. AMP and its fiscal agents invest in individual investments and in investment pools. Individual investments are evidenced by specific identifiable securities instruments, or by an electronic entry registering the owner in the records of the institution issuing the security, called the book entry system. Individual investments are generally made by AMP's fiscal agents as required under its debt issues. C. Investments Authorized by the California Government Code and AMP's Investment Policy AMP's investment policy and the California Government Code allow AMP to invest in the following, provided the credit ratings of the issuers are acceptable to AMP, and approved percentages and maturities are not exceeded. The table below also identifies certain provisions of the California Government Code, or AMP's Investment Policy where AMP's Investment Policy is more restrictive, that addresses interest rate risk, credit risk and concentration of credit risk. This table does not address investments of debt proceeds held by bond trustees that are governed by the provisions of debt agreements of AMP, rather than the general provisions of the California Government Code or AMP's investment policy. AMP's investment policy and the California Government Code allow AMP to invest in the investments in the table below:

Alameda Municipal Power Electric Enterprise Fund
Notes to Financial Statements (Continued) June 30, 2020 and 2019
30
Maximum Maximum Percentage Maximum Minimum
Investment Type % or $ by Issuer Maturity Required Rating
Bank/Time Deposits No limit No limit 5 years N/AU.S. Treasuries Obligations No limit No limit 5 years N/AU.S. Agencies Securities 75% 25% 5 years N/AMutual Funds and Money Market Funds 20% 10% 5 years Highest rating by 2 NRSROsBankers' Acceptances 30% 5% 180 days A1/P1 or its equivalentCommercial Paper 25% 5% 270 days A1/P1 or its equivalent (with
issuer rated A or its equivalent)CDs - non negotiable / CDARS 30% (combined with NCDs) 5% 3 years N/ANegotiable CDs 30% 5% 5 years No rating for amount under FDIC
insurance; A-1 / A for amountsgreater than FDIC insurance
Local Agency Investment Fund (LAIF) LAIF Limit No limit N/A N/ACAMP / Caltrust No limit No limit N/A N/AMunicipal Obligations 30% 5% 5 years A (except City’s own bonds)Medium Term Notes 30% 5% 5 years A or its equivalentSupranationals 15% (US Dollar denominated) 10% 5 years AA or its equivalentAsset-Backed Securities 20% 5% 5 years AA or its equivalent (with issuer
rated A or its equivalent)
D. Investments Authorized by Debt Agreements AMP must maintain required amounts of cash and investments with trustees or fiscal agents under the terms of certain debt issues. These funds are unexpended bond proceeds or are pledged as reserves to be used if AMP fails to meet its obligations under these debt issues. The California Government Code requires these funds to be invested in accordance with AMP’s ordinance, bond indentures or State Statute. The table on the next page identifies the investment types that are authorized for investments held by fiscal agents.
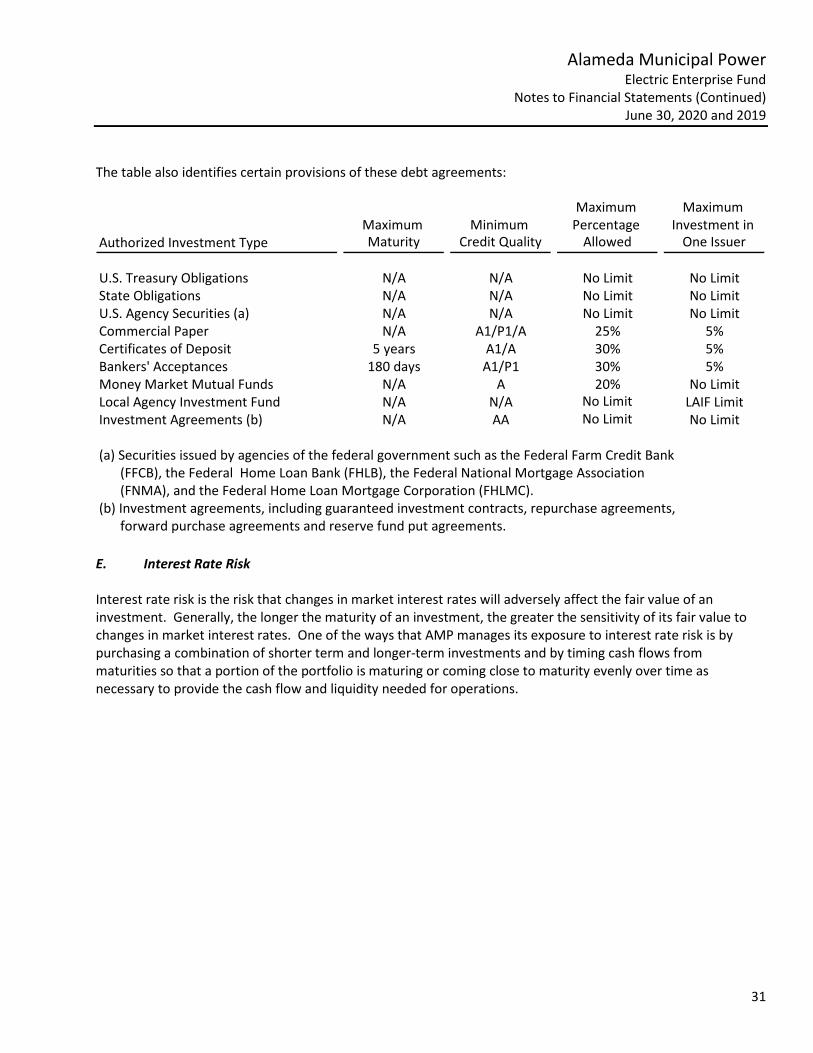
Alameda Municipal Power Electric Enterprise Fund
Notes to Financial Statements (Continued) June 30, 2020 and 2019
31
The table also identifies certain provisions of these debt agreements:
Maximum Maximum Maximum Minimum Percentage Investment in
Authorized Investment Type Maturity Credit Quality Allowed One Issuer
U.S. Treasury Obligations N/A N/A No Limit No LimitState Obligations N/A N/A No Limit No LimitU.S. Agency Securities (a) N/A N/A No Limit No LimitCommercial Paper N/A A1/P1/A 25% 5%Certificates of Deposit 5 years A1/A 30% 5%Bankers' Acceptances 180 days A1/P1 30% 5%Money Market Mutual Funds N/A A 20% No LimitLocal Agency Investment Fund N/A N/A No Limit LAIF LimitInvestment Agreements (b) N/A AA No Limit No Limit
(a) Securities issued by agencies of the federal government such as the Federal Farm Credit Bank(FFCB), the Federal Home Loan Bank (FHLB), the Federal National Mortgage Association (FNMA), and the Federal Home Loan Mortgage Corporation (FHLMC).
(b) Investment agreements, including guaranteed investment contracts, repurchase agreements, forward purchase agreements and reserve fund put agreements.
E. Interest Rate Risk Interest rate risk is the risk that changes in market interest rates will adversely affect the fair value of an investment. Generally, the longer the maturity of an investment, the greater the sensitivity of its fair value to changes in market interest rates. One of the ways that AMP manages its exposure to interest rate risk is by purchasing a combination of shorter term and longer-term investments and by timing cash flows from maturities so that a portion of the portfolio is maturing or coming close to maturity evenly over time as necessary to provide the cash flow and liquidity needed for operations.

Alameda Municipal Power Electric Enterprise Fund
Notes to Financial Statements (Continued) June 30, 2020 and 2019
32
Information about the sensitivity of the fair values of AMP's investments (including investments held by bond trustees) to market interest rate fluctuations is provided by the following table that shows the distribution of AMP's investments by maturity, as of June 30, 2020 and 2019: June 30, 2020 12 Months 13 to 24 25 to 60
or less Months Months Total
Investments:Money Market Mutual Funds 1,211,002$ -$ -$ 1,211,002$ Federal Agency Securities 299,589 - 2,062,045 2,361,634 Local Agency Investment Fund 54,592,511 - - 54,592,511 Corporate Bonds 504,753 1,140,630 5,432,513 7,077,896 Certificates of Deposit 1,524,707 750,113 3,723,259 5,998,079 Municipal Bonds 452,660 1,834,690 4,676,975 6,964,325 Held by bond fiscal agent:
Bond Mutual Funds 4,777,285 - - 4,777,285
Total Investments 63,362,507 3,725,433 15,894,792 82,982,732
Cash with Banks and Petty Cash 12,532,040 - - 12,532,040
Total Cash and Investments 75,894,547$ 3,725,433$ 15,894,792$ 95,514,772$
June 30, 2019 12 Months 13 to 24 25 to 60or less Months Months Total
Investments:Local Agency Investment Fund 49,382,192$ -$ -$ 49,382,192$ Corporate Bonds - 399,545 5,278,289 5,677,834 Certificates of Deposit - 4,701,995 2,753,672 7,455,667 Municipal Bonds - 456,586 3,686,312 4,142,898 Held by bond fiscal agent:
Bond Mutual Funds 4,719,758 - - 4,719,758
Total Investments 54,101,950 5,558,126 11,718,273 71,378,349
Cash with Banks and Petty Cash 15,294,709 - - 15,294,709
Total Cash and Investments 69,396,659$ 5,558,126$ 11,718,273$ 86,673,058$
AMP is a participant in the Local Agency Investment Fund (LAIF) that is regulated by California Government Code Section 16429 under the oversight of the Treasurer of the State of California. AMP reports its investment in LAIF at the fair value amount provided by LAIF, which is the same as the value of the pool share. The balance is available for withdrawal on demand and is based on the accounting records maintained by LAIF, which are recorded on an amortized cost basis. LAIF is not registered with the Securities and Exchange Commission and is not rated.

Alameda Municipal Power Electric Enterprise Fund
Notes to Financial Statements (Continued) June 30, 2020 and 2019
33
F. Fair Value Measurement AMP categorizes the fair value measurements of its investments based on the hierarchy established by generally accepted accounting principles. The fair value hierarchy, which has three levels, is based on the valuation inputs used to measure an assets’ fair value: Level 1 inputs are quoted prices in active markets for identical assets; Level 2 inputs are significant other observable inputs such as quoted prices for similar assets or liabilities in active markets; quoted prices for identical or similar assets or liabilities in inactive markets; inputs other than quoted prices that are observable for the asset or liability; and inputs that are derived principally from or corroborated by observable market data by correlation or other means; Level 3 inputs are significant unobservable inputs. Deposits and withdrawals in Local Agency Investment Fund (LAIF) are made on the basis of $1 and amounts are reported on an amortized basis which approximates fair value. Accordingly, AMP’s proportionate share in LAIF is an uncategorized input not defined as Level 1, Level 2, or Level 3 input. As of June 30, 2020, and 2019, AMP has the following recurring fair value measurements: June 30, 2020 Fair Value Measurements on a Recurring Basis Using
Quoted Prices Significant Other SignificantActive Markets for Observable Unobservable
Balance at Identical Assets Inputs InputsJune 30, 2020 (Level 1) (Level 2) (Level 3)
Investments by Fair Value LevelFederal Agency Securities 2,361,634$ -$ 2,361,634$ -$ Corporate Bonds 7,077,896 - 7,077,896 - Certificates of Deposits 5,998,079 - 5,998,079 - Municipal Bonds 6,964,325 - 6,964,325 -
Total Investments by Fair Value Level 22,401,934 -$ 22,401,934$ -$
Investments Not Subject to Fair Value Hierarchy
Local Agency Investment Fund 54,592,511 Money Market Mutual Fund 1,211,002
Total Investments Not Subjectto the Fair Value Hierarchy 55,803,513
Investments Measured at Net Asset Value (NAV)
Bond Mutual Funds 4,777,285
Total Investments 82,982,732$

Alameda Municipal Power Electric Enterprise Fund
Notes to Financial Statements (Continued) June 30, 2020 and 2019
34
June 30, 2019 Fair Value Measurements on a Recurring Basis Using
Quoted Prices Significant Other SignificantActive Markets for Observable Unobservable
Balance at Identical Assets Inputs InputsJune 30, 2019 (Level 1) (Level 2) (Level 3)
Investments by Fair Value LevelCorporate Bonds 5,677,834$ -$ 5,677,834$ -$ Certificates of Deposits 7,455,667 - 7,455,667 - Municipal Bonds 4,142,898 - 4,142,898 -
Total Investments by Fair Value Level 17,276,399 -$ 17,276,399$ -$
Investments Not Subject to Fair Value Hierarchy
Local Agency Investment Fund 49,382,192
Investments Measured at Net Asset Value (NAV)
Bond Mutual Funds 4,719,758
Total Investments 71,378,349$
G. Credit Risk Generally, credit risk is the risk that an issuer of an investment will not fulfill its obligation to the holder of the investment. This is measured by the assignment of a rating by a nationally recognized statistical rating organization. As an external investment pool, the Local Agency Investment Fund was not rated as of June 30, 2020 and 2019: June 30, 2020
Investment Type AAA/Aaa AA+ / AA / AA- A+ / A / A- BBB+ /- Total
Bond Mutual Funds 4,777,285$ -$ -$ -$ 4,777,285$ Money Market Mutual Funds 1,211,002 - - - 1,211,002 Federal Agency Securities - 2,361,634 - - 2,361,634 Corporate Bonds - 583,202 6,259,686 235,008 7,077,896 Municipal Bonds 177,912 3,275,706 3,510,707 - 6,964,325
Total 6,166,199$ 6,220,542$ 9,770,393$ 235,008$ 22,392,142
Not rated:Certificate of Deposits 5,998,079 Local Agency Investment Fund 54,592,511
Total investments 82,982,732$

Alameda Municipal Power Electric Enterprise Fund
Notes to Financial Statements (Continued) June 30, 2020 and 2019
35
June 30, 2019
Investment Type AAA/Aaa AA+ / AA / AA- A+ / A / A- BBB+ /- Total
Bond Mutual Funds 4,719,758$ -$ -$ -$ 4,719,758$ Federal Agency Securities - - - - - Corporate Bonds - 1,005,957 4,671,877 - 5,677,834 Municipal Bonds 249,858 2,208,733 1,684,307 - 4,142,898
Total 4,969,616$ 3,214,690$ 6,356,184$ -$ 14,540,490
Not rated:Certificate of Deposits 7,455,667 Local Agency Investment Fund 49,382,192
Total investments 71,378,349$
Deposits This is the risk that in the event of a bank failure, AMP’s deposits may not be returned to it. AMP’s policy, as well as the California Government Code, requires that a financial institution secure deposits made by state or local governmental units by pledging securities in an undivided collateral pool held by a depository regulated under state law (unless so waived by the governmental unit). The market value of the pledged securities in the collateral pool must equal at least 110 percent of the total amount deposited by the public agencies. California law also allows financial institutions to secure public deposits by pledging first trust deed mortgage notes having a value of 150 percent of the secured public deposits and letters of credit issued by the Federal Home Loan Bank of San Francisco having a value of 105 percent of the secured deposits. As of June 30, 2020, AMP’s bank balance of $12,530,040 was either collateralized or insured by the Federal Deposit Insurance Corporation (FDIC). AMP’s deposits with Hilltop Securities were insured up to $250,000 by FDIC. Hilltop Securities also had Securities Investor Protection Corporation (SIPC) coverage which provided an additional $500,000 coverage. Furthermore, Hilltop Securities had private insurance in excess of SIPC coverage with a $1.9M per-client limit. As of June 30, 2020, AMP’s investments balance with Hilltop Securities was $23,612,935. Investments As of June 30, 2020, none of AMP’s investments were held with counterparty. All of AMP’s investments were held with an independent third-party custodian bank. All of AMP investments held in custody and safekeeping are held in the name of AMP and segregated from securities owned by the bank. This is the lowest level of custodial credit risk exposure. H. Concentration of Credit Risk Concentration of credit risk is the loss risk attributed to the magnitude of investment in a single issuer. AMP’s investment policy places certain maximum percentage limitations of investments by investment type and AMP has adhered to this policy with no exception.
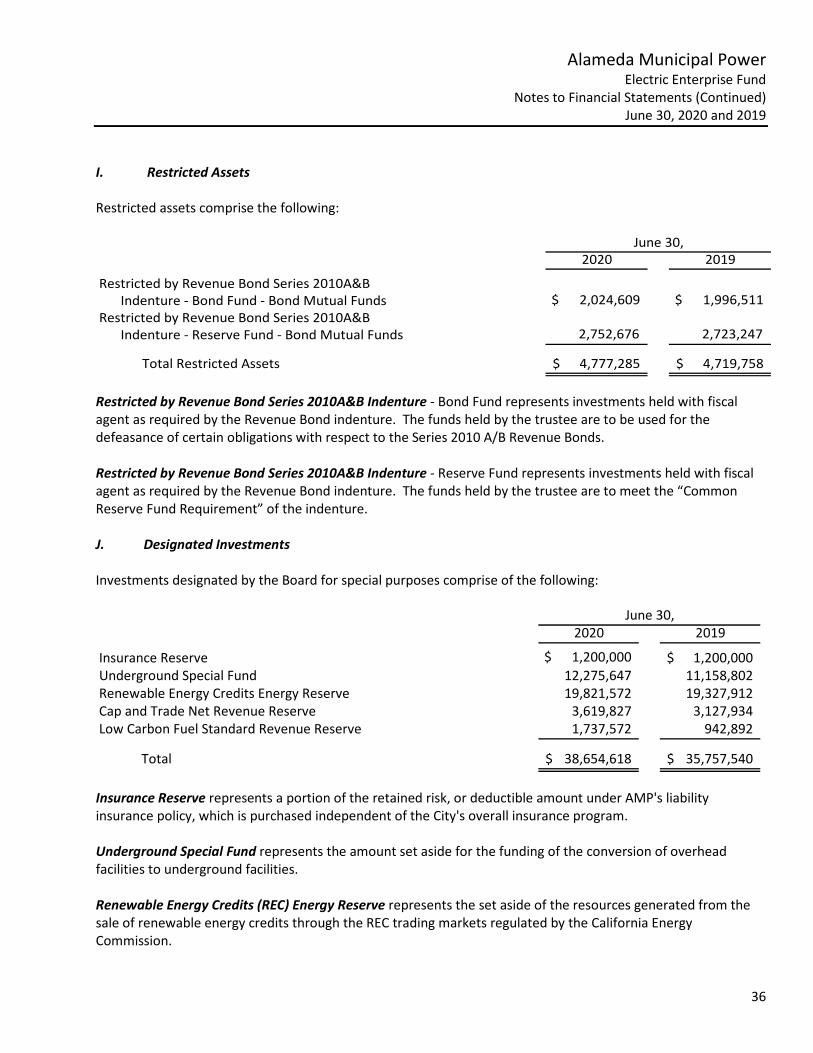
Alameda Municipal Power Electric Enterprise Fund
Notes to Financial Statements (Continued) June 30, 2020 and 2019
36
I. Restricted Assets Restricted assets comprise the following:
2020 2019
Restricted by Revenue Bond Series 2010A&B Indenture - Bond Fund - Bond Mutual Funds $ 2,024,609 $ 1,996,511
Restricted by Revenue Bond Series 2010A&B Indenture - Reserve Fund - Bond Mutual Funds 2,752,676 2,723,247
Total Restricted Assets 4,777,285$ 4,719,758$
June 30,
Restricted by Revenue Bond Series 2010A&B Indenture - Bond Fund represents investments held with fiscal agent as required by the Revenue Bond indenture. The funds held by the trustee are to be used for the defeasance of certain obligations with respect to the Series 2010 A/B Revenue Bonds. Restricted by Revenue Bond Series 2010A&B Indenture - Reserve Fund represents investments held with fiscal agent as required by the Revenue Bond indenture. The funds held by the trustee are to meet the “Common Reserve Fund Requirement” of the indenture. J. Designated Investments Investments designated by the Board for special purposes comprise of the following:
2020 2019
Insurance Reserve $ 1,200,000 1,200,000$ Underground Special Fund 12,275,647 11,158,802 Renewable Energy Credits Energy Reserve 19,821,572 19,327,912 Cap and Trade Net Revenue Reserve 3,619,827 3,127,934 Low Carbon Fuel Standard Revenue Reserve 1,737,572 942,892
Total 38,654,618$ 35,757,540$
June 30,
Insurance Reserve represents a portion of the retained risk, or deductible amount under AMP's liability insurance policy, which is purchased independent of the City's overall insurance program. Underground Special Fund represents the amount set aside for the funding of the conversion of overhead facilities to underground facilities. Renewable Energy Credits (REC) Energy Reserve represents the set aside of the resources generated from the sale of renewable energy credits through the REC trading markets regulated by the California Energy Commission.

Alameda Municipal Power Electric Enterprise Fund
Notes to Financial Statements (Continued) June 30, 2020 and 2019
37
Cap and Trade Net Revenue Reserve represents the set aside of resources generated by the Cap and Trade program which took effect in early 2012 to reduce greenhouse gas (GHG) emissions and is regulated by the California Air Resources Board. Low Carbon Fuel Standard Revenue Reserve represents the set aside of resources generated from the sale of the banked credits to reduce the carbon intensity of transportation fuels in California by 10 percent by 2020. The program is administered by the California Air Resources Board (CARB). Note 3 - Capital Assets Capital asset activity for the years ended June 30, 2020 and 2019 is as follows:
Balance Balance June 30, 2019 Additions Retirements Transfers June 30, 2020
Capital assets not being depreciated:
Land and Rights 220,143$ -$ -$ -$ 220,143$ Construction Work in Progress 3,862,220 2,743,979 - (1,407,708) 5,198,491
Total Capital Assets not being depreciated 4,082,363 2,743,979 - (1,407,708) 5,418,634
Capital assets being depreciated:
Utility Plant 86,915,116 - (565,828) 1,072,494 87,421,782 Service Center Building 8,168,069 - - - 8,168,069 Machinery and Equipment 9,725,953 - - - 9,725,953 Transportation Equipment 3,402,639 - (2,500) 5,598 3,405,737 Computer Equipment 4,377,329 - - 306,419 4,683,748 Furniture and Fixtures 899,922 - - 23,197 923,119
Total Capital Assets being depreciated 113,489,028 - (568,328) 1,407,708 114,328,408
Less accumulated depreciation and amortization for:
Utility Plant 57,243,753 3,249,677 (390,054) - 60,103,376 Service Center Building 4,418,751 180,960 - - 4,599,711 Machinery and Equipment 9,020,001 142,297 - - 9,162,298 Transportation Equipment 2,611,412 121,969 (2,500) - 2,730,881 Computer Equipment 3,948,836 163,839 - - 4,112,675 Furniture and Fixtures 614,088 39,270 - - 653,358
Total Accumulated Depreciation 77,856,841 3,898,012 (392,554) - 81,362,299
Total Depreciable Assets 35,632,187 (3,898,012) (175,774) 1,407,708 32,966,109
Capital assets, net 39,714,550$ (1,154,033)$ (175,774)$ -$ 38,384,743$

Alameda Municipal Power Electric Enterprise Fund
Notes to Financial Statements (Continued) June 30, 2020 and 2019
38
Balance Balance June 30, 2018 Additions Retirements Transfers June 30, 2019
Capital assets not being depreciated:
Land and Rights 153,643$ 66,500$ -$ -$ 220,143$ Construction Work in Progress 2,872,673 2,364,907 - (1,375,360) 3,862,220
Total Capital Assets not 3,026,316 2,431,407 - (1,375,360) 4,082,363
Capital assets being depreciated:
Utility Plant 86,123,810 - - 791,306 86,915,116 Service Center Building 8,130,625 - - 37,444 8,168,069 Machinery and Equipment 9,620,376 - - 105,577 9,725,953 Transportation Equipment 3,318,156 - (148,133) 232,616 3,402,639 Computer Equipment 4,168,912 - - 208,417 4,377,329 Furniture and Fixtures 899,922 - - - 899,922 Easements 185,500 - (185,500) - -
Total Capital Assets being depreciated 112,447,301 - (333,633) 1,375,360 113,489,028
Less accumulated depreciation and amortization for:
Utility Plant 54,033,016 3,210,737 - - 57,243,753 Service Center Building 4,237,510 181,241 - - 4,418,751 Machinery and Equipment 8,892,168 127,833 - - 9,020,001 Transportation Equipment 2,621,613 137,932 (148,133) - 2,611,412 Computer Equipment 3,785,660 163,176 - - 3,948,836 Furniture and Fixtures 578,705 35,383 - - 614,088 Easements 119,000 - (119,000) - -
Total Accumulated Depreciation 74,267,672 3,856,302 (267,133) - 77,856,841
Total Depreciable Assets 38,179,629 (3,856,302) (66,500) 1,375,360 35,632,187
Capital assets, net 41,205,945$ (1,424,895)$ (66,500)$ -$ 39,714,550$
Depreciation and amortization on capital assets and intangibles included in the statement of revenues, expenses and changes in net position for the years ended June 30, 2020 and 2019 was $3,898,012 and $3,856,302 respectively. Note 4 - Long-Term Debt A. Composition and Changes AMP generally incurs long-term debt to finance projects or purchase assets which will have useful lives equal to or greater than the related debt. AMP's debt issues and transactions are summarized below and discussed in detail thereafter.
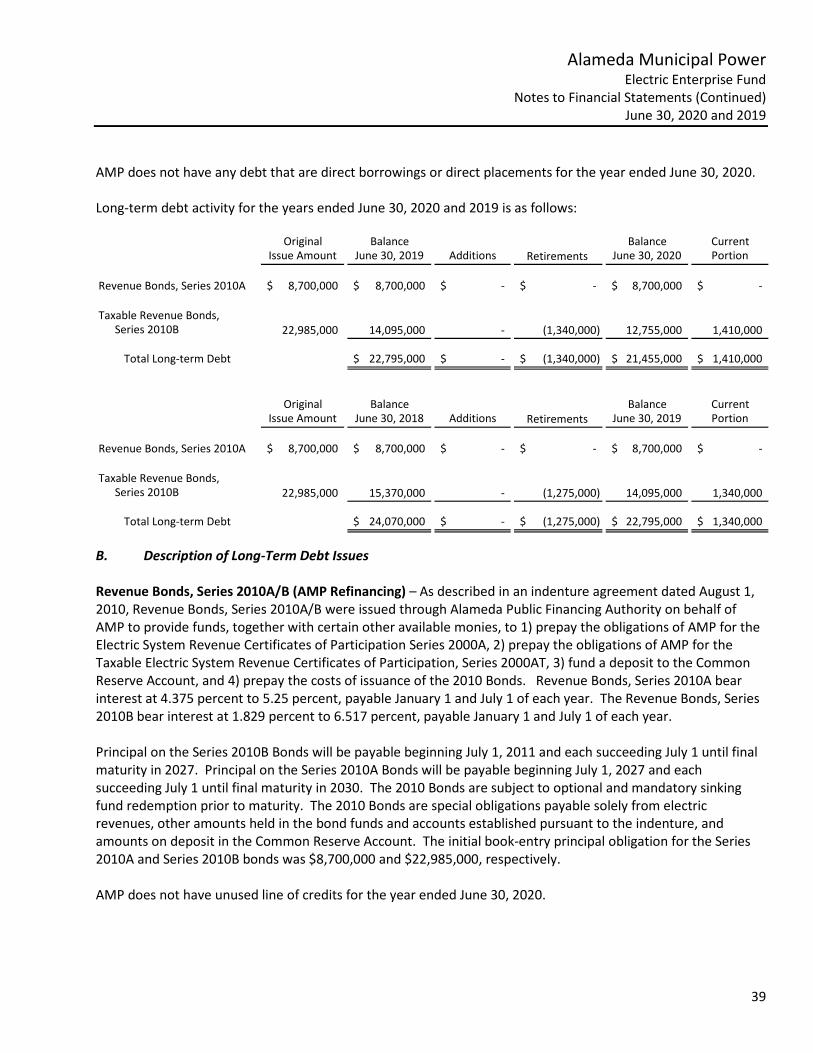
Alameda Municipal Power Electric Enterprise Fund
Notes to Financial Statements (Continued) June 30, 2020 and 2019
39
AMP does not have any debt that are direct borrowings or direct placements for the year ended June 30, 2020. Long-term debt activity for the years ended June 30, 2020 and 2019 is as follows:
Original Balance Balance CurrentIssue Amount June 30, 2019 Additions Retirements June 30, 2020 Portion
Revenue Bonds, Series 2010A 8,700,000$ 8,700,000$ -$ -$ 8,700,000$ -$
Taxable Revenue Bonds, Series 2010B 22,985,000 14,095,000 - (1,340,000) 12,755,000 1,410,000
Total Long-term Debt 22,795,000$ -$ (1,340,000)$ 21,455,000$ 1,410,000$
Original Balance Balance CurrentIssue Amount June 30, 2018 Additions Retirements June 30, 2019 Portion
Revenue Bonds, Series 2010A 8,700,000$ 8,700,000$ -$ -$ 8,700,000$ -$
Taxable Revenue Bonds, Series 2010B 22,985,000 15,370,000 - (1,275,000) 14,095,000 1,340,000
Total Long-term Debt 24,070,000$ -$ (1,275,000)$ 22,795,000$ 1,340,000$
B. Description of Long-Term Debt Issues Revenue Bonds, Series 2010A/B (AMP Refinancing) – As described in an indenture agreement dated August 1, 2010, Revenue Bonds, Series 2010A/B were issued through Alameda Public Financing Authority on behalf of AMP to provide funds, together with certain other available monies, to 1) prepay the obligations of AMP for the Electric System Revenue Certificates of Participation Series 2000A, 2) prepay the obligations of AMP for the Taxable Electric System Revenue Certificates of Participation, Series 2000AT, 3) fund a deposit to the Common Reserve Account, and 4) prepay the costs of issuance of the 2010 Bonds. Revenue Bonds, Series 2010A bear interest at 4.375 percent to 5.25 percent, payable January 1 and July 1 of each year. The Revenue Bonds, Series 2010B bear interest at 1.829 percent to 6.517 percent, payable January 1 and July 1 of each year. Principal on the Series 2010B Bonds will be payable beginning July 1, 2011 and each succeeding July 1 until final maturity in 2027. Principal on the Series 2010A Bonds will be payable beginning July 1, 2027 and each succeeding July 1 until final maturity in 2030. The 2010 Bonds are subject to optional and mandatory sinking fund redemption prior to maturity. The 2010 Bonds are special obligations payable solely from electric revenues, other amounts held in the bond funds and accounts established pursuant to the indenture, and amounts on deposit in the Common Reserve Account. The initial book-entry principal obligation for the Series 2010A and Series 2010B bonds was $8,700,000 and $22,985,000, respectively. AMP does not have unused line of credits for the year ended June 30, 2020.

Alameda Municipal Power Electric Enterprise Fund
Notes to Financial Statements (Continued) June 30, 2020 and 2019
40
AMP’s outstanding revenue bonds (Series 2010A) and Taxable Revenue Bonds (Series 2010B) are secured solely by a pledge of net revenues of AMP. Both revenue bonds contain a rate covenant that AMP will at all times fix, prescribe and collect rates, fees and charges for the services and facilities of AMP during each fiscal year that will be at least sufficient to yield: Adjusted Annual Revenues for such fiscal year at least equal to the sum of the following for such fiscal year:
a. Operating and Maintenance Cost. b. Adjusted Annual Debt Service. c. All other payments required to meet any other obligations of AMP which are charges, liens and
encumbrances upon or payable from the Electric System Revenue Fund, including all amounts owed to any issuer of a Qualified Reserve Fund Credit Instrument then in effect and deposited in the Common Reserve Account under the terms of such Qualified Reserve Fund Credit Instrument and all amounts owing under subordinate debt, and Adjusted Annual Net Revenues for such fiscal year equal to at least 110% of Adjusted Annual Debt Service for such fiscal year.
If any event of default shall occur, then, and in each and every such case during the continuance of such event of default, the trustee may, and shall at the written direction of the owners of not less than a majority in aggregate principal amount of the bonds at the time outstanding, upon notice in writing to Alameda Municipal Power, declare the principal of all of the bonds then outstanding, and the interest accrued thereon, to be due and payable immediately, and upon any such declaration the same shall become and shall be immediately due and payable, anything in the indenture or in the bonds contained to the contrary notwithstanding. C. Debt Service Requirements Annual debt service requirements for AMP’s revenue bonds, loan from City of Alameda and capital leases are as follows:
For the Year Ending June 30 Principal Interest Total
2021 1,410,000$ 1,174,820$ 2,584,820$ 2022 1,485,000 1,097,090 2,582,090 2023 1,600,000 1,004,540 2,604,540 2024 1,705,000 896,847 2,601,847 2025 1,815,000 782,148 2,597,148
2026 - 2030 10,905,000 2,078,863 12,983,863 2031 2,535,000 60,206 2,595,206
Total 21,455,000$ 7,094,514$ 28,549,514$
Note 5 - Transactions with the City of Alameda Effective July 1, 2017, and each year thereafter, the City Charter states that AMP shall annually transfer to the City, the amount of $3,700,000 plus an adjustment for inflation, minus any deduction for the amount of any exemptions granted by the AMP Board pursuant to Article XII, Section 12-6, subdivision (d) of the City Charter, in twelve equal monthly installments. As of June 30, 2020 and 2019, $4,029,765 and $3,818,400 was transferred to the City’s General Fund.

Alameda Municipal Power Electric Enterprise Fund
Notes to Financial Statements (Continued) June 30, 2020 and 2019
41
Alameda Municipal Code provides that AMP pays the City an annual amount equal to one percent of the net book value of AMP's utility plant in service at the previous fiscal year end. AMP paid $1,505,000 and $1,474,996 in lieu of taxes to the City during the fiscal years ended June 30, 2020 and 2019, respectively. Disbursements by AMP to the City for services provided by the City for the years ended June 30, 2020 and 2019 were $3,822,305 and $4,827,103, respectively. Utility taxes collected by AMP and remitted to the City’s General Fund for the years ended June 30, 2020 and 2019 were $4,055,630 and $3,860,379, respectively. Amounts payable to the City as of June 30, 2020 and 2019 were $352,692 and $300,508, respectively. Billings of electricity to the City for the years ended June 30, 2020 and 2019 were $2,092,552 and $2,087,045, respectively. Note 6 - Defined Benefit Plan A. CalPERS Miscellaneous Employees Plan Plan Description – Substantially all City employees including AMP employees are eligible to participate in the City’s Miscellaneous Plan offered by California Public Employees Retirement System (CalPERS) an agent multiple employer defined benefit pension plan which acts as a common investment and administrative agent for its participating member employers. CalPERS provides retirement and disability benefits, annual cost of living adjustments and death benefits to plan members, who must be public employees and beneficiaries. AMP only has miscellaneous employees that participate in the City of Alameda’s separate Miscellaneous Employee Plan (all employees excluding Police and Fire). The City allocates a portion of the net pension liability, net pension expense, and related deferred inflows and outflows of resources to AMP on a cost-sharing basis. Benefit provisions under the Plan is established by State statute and City resolution. Benefits are based on years of credited service, equal to one year of full-time employment. Funding contributions for the Plan are determined annually on an actuarial basis as of June 30 by CalPERS; the City must contribute these amounts. CalPERS issues publicly available reports that include a full description of the pension plans regarding benefit provisions, assumptions and membership information can be found on the CalPERS website. Benefits Provided – CalPERS provides retirement and disability benefits, annual cost of living adjustments and death benefits to plan members, who must be public employees and beneficiaries. Benefits are based on years of credited service, equal to one year of full-time employment. Members with five years of total service are eligible to retire at age 50 with statutorily reduced benefits. All members are eligible for non-duty disability benefits after 10 years of service. The death benefit is one of the following; the Basic Death Benefit, the 1957 Survivor Benefit, or the Optional Settlement 2W Death Benefit. The cost of living adjustments for each plan are applied as specified by the Public Employees’ Retirement Law.
Alameda Municipal Power Electric Enterprise Fund
Notes to Financial Statements (Continued) June 30, 2020 and 2019
42
The Plans’ provisions and benefits in effect at June 30, 2020 and 2019, are summarized as follows: Classic PEPRA . Prior to On or after Hire Date January 1, 2013 January 1, 2013 Formula 2% @ 55 2% @ 62 Benefit vesting schedule 5 years of service 5 years of service Benefit payments monthly for life monthly for life Retirement age 50-63 52-67 Monthly benefits, as a % of annual salary 1.426% to 2.418% 1.0% to 2.5% Contributions – Section 20814(c) of the California Public Employees’ Retirement law requires that the employer contribution rates for all public employers are determined on an annual basis by the actuary and shall be effective on the July 1 following notice of a change in rate. Funding contributions for the Plan are determined annually on an actuarial basis as of June 30 by CalPERS. The actuarially determined rate is the estimated amount necessary to finance the costs of benefits earned by employees during the year, with an additional amount to finance any unfunded accrued liability. AMP is required to contribute the difference between the actuarially determined rate and the contribution rates of employees. Employer contribution rates for the fiscal years ended June 30, 2020 and 2019 were 29.974 percent and 26.579 percent, respectively. Employee contribution rates for the fiscal years ended June 30, 2020 and 2019 were 8.868 and 6.957 percent for the Classic Plan Members and 7.25 and 6.75 percent for the PEPRA Plan members. AMP’s proportionate share of the City’s contributions to the miscellaneous plan was $2,504,271 and $2,105,125 for the years ended June 30, 2020 and 2019, respectively. B. Pension Liability, Pension Expense and Deferred Outflows/Inflows of Resources Related to Pensions As of June 30, 2020, and 2019, AMP reported a net pension liability of $26,437,127 and $24,012,403, respectively for its proportionate share of the City’s net pension liability. The net pension liability of the Plan was measured as of June 30, 2019 and 2018, and the total pension liability for the Plan used to calculate the net pension liability was determined by an actuarial valuation as of June 30, 2018 and 2017. AMP’s proportion of the City’s net pension liability was based on AMP’s FY 2019 contributions to the City’s pension plan relative to the total contributions of the City as a whole. AMP’s proportionate share of the City’s net pension liability for the Plan as of the June 30, 2019 and 2018 measurement dates was 31.99 percent and 30.26 percent, respectively.
Alameda Municipal Power Electric Enterprise Fund
Notes to Financial Statements (Continued) June 30, 2020 and 2019
43
For the years ended June 30, 2020 and 2019, AMP recognized pension expense of $5,120,118 and $4,510,497, respectively. At June 30, 2020 and 2019, AMP reported deferred outflows of resources and deferred inflows of resources related to pension from the following sources:
Deferred Outflows of Resources
Deferred Inflows of Resources
Employer contributions paid by AMP subsequent to measurement date 2,504,271$ -$ Changes in assumptions - (50,309) Differences between expected and actual experience 162,017 (9,743) Net differences between projected and actual earnings
on pension plan investments - (500,470)
Total 2,666,288$ (560,522)$
Deferred Outflows of Resources
Deferred Inflows of Resources
Employer contributions paid by AMP subsequent to measurement date 2,105,125$ -$ Changes in assumptions 442,686 (302,358) Differences between expected and actual experience 7,922 (58,555) Net differences between projected and actual earnings
on pension plan investments 102,068 -
Total 2,657,801$ (360,913)$
2020
2019
The amount of 2,504,271 reported as deferred outflows of resources related to pensions, resulting from AMP’s contributions to the City’s pension plan subsequent to the measurement date, will be recognized as a reduction of the net pension liability in the year ended June 30, 2021. Other amounts reported as deferred outflows of resources and deferred inflows of resources related to pensions will be recognized as pension expense as follows:
Year ended Year ended June 30, June 30,
2021 287,413$ 2020 929,961$ 2022 (607,646) 2021 98,733 2023 (136,416) 2022 (664,124) 2024 58,144 2023 (172,807)
Total (398,505)$ Total 191,763$
2020 2019

Alameda Municipal Power Electric Enterprise Fund
Notes to Financial Statements (Continued) June 30, 2020 and 2019
44
Actuarial Assumptions – AMP’s proportion of the City’s total miscellaneous plan pension liability in the June 30, 2018 and 2017, actuarial valuation was determined using the following actuarial assumptions: Valuation Date June 30, 2018 June 30, 2017
Actuarial Cost MethodActuarial Assumptions:
Investment Rate 7.15% 7.15%Discount Rate 7.15% 7.15%Inflation 2.50% 2.50%Payroll Growth 3.0% 3.0%Projected Salary Increase 0.4% - 8.5% (1) 0.4% - 8.5% (1)Mortality
(1) Depending on age, service and type of employment(2) The mortality table used was developed based on CalPERS' specific data.
Entry-Age Normal Cost Method
Society of Actuaries Scale BB (2)
The underlying mortality assumptions and all other actuarial assumptions used in the June 30, 2017 valuation were based on the results of an actuarial experience study for the period of 1997 to 2015. Further details of the Experience Study can be found on the CalPERS website at: www.calpers.ca.gov under Forms and Publications. The long-term expected rate of return on pension plan investments was determined using a building-block method in which best-estimate ranges of expected future real rates of return (expected returns, net of pension plan investment expense and inflation) are developed for each major asset class. In determining the long-term expected rate of return, staff took into account both short-term and long-term market return expectations as well as the expected pension fund (Public Employees’ Retirement Fund) cash flows. Such cash flows were developed assuming that both members and employers will make their required contributions on time and as scheduled in all future years. Using historical returns of all the funds’ asset classes, expected compound (Geometric) returns were calculated over the short-term (first 10 years) and the long-term (11-60 years) using a building-block approach. Using the expected nominal returns for both short-term and long-term, the present value of benefits was calculated for each fund. The expected rate of return was set by calculating the single equivalent expected return that arrived at the same present value of benefits for cash flows as the one calculated using both short-term and long-term returns. The expected rate of return was then set equivalent to the single equivalent rate calculated above and rounded down to the nearest one quarter of one percent.

Alameda Municipal Power Electric Enterprise Fund
Notes to Financial Statements (Continued) June 30, 2020 and 2019
45
The tables below reflect long-term expected real rate of return by asset class. The rate of return is calculated using the capital market assumptions applied to determine the discount rate and asset allocation.
2020
Asset Class (1)Target
AllocationReal Return
Years 1 - 10 (2)Real Return Years 11+ (3)
Global Equity 50.0% 4.80% 5.98%Fixed Income 28.0% 1.00% 2.62%Inflation Assets 0.0% 0.77% 1.81%Private Equity 8.0% 6.30% 7.23%Real Assets 13.0% 3.75% 4.93%Liquidity 1.0% 0.00% -0.92%
Total 100.0%
2019
Asset Class (1)Target
AllocationReal Return
Years 1 - 10 (2)Real Return Years 11+ (3)
Global Equity 50.0% 4.80% 5.98%Fixed Income 28.0% 1.00% 2.62%Inflation Assets 0.0% 0.77% 1.81%Private Equity 8.0% 6.30% 7.23%Real Assets 13.0% 3.75% 4.93%Liquidity 1.0% 0.00% -0.92%
Total 100.0%
(1) In the CalPERS CAFR, Fixed Income is included in Global Debt Securities; Liquidity is included in Short-
term Investments; Inflation Assets are included in both Global Equity Securities and Global Debt Securities.
(2) An expected inflation of 2.00% used for this period. (3) An expected inflation of 2.92% used for this period.
Discount Rate – The discount rate used to measure the total pension liability was 7.15 percent and 7.15 percent for the Plan as of the measurement date of June 30, 2019 and 2018, respectively. The projection of cash flows used to determine the discount rate assumed that employee contributions will be made at the current contribution rate and that AMP’s contributions will be made at rates equal to the difference between actuarially determined contributions rates and the employee rate. Based on those assumptions, the pension plan’s fiduciary net position was projected to be available to make all projected future benefit payments of current active and inactive employees. Therefore, the long-term expected rate of return on pension plan investments was applied to all period of projected benefit payments to determine the total pension liability.
Alameda Municipal Power Electric Enterprise Fund
Notes to Financial Statements (Continued) June 30, 2020 and 2019
46
Sensitivity of AMP’s proportionate share of the City’s Miscellaneous Plan Net Pension Liability to Changes in the Discount Rate – The following presents AMP’s proportionate share of the City’s Miscellaneous Plan net pension liability, calculated using the discount rate of 7.15 percent and 7.15 percent for the Plan, as well as what AMP’s proportionate share of the City’s Miscellaneous Plan net pension liability would be if it were calculated using a discount rate that is 1-percentage point lower or 1 percentage point higher than the current rate:
2020 2019
1% Decrease 6.15% 6.15%Net Pension Liability 38,334,724$ 34,984,982$
Current Discount Rate 7.15% 7.15%Net Pension Liability 26,437,127$ 24,012,403$
1% Increase 8.15% 8.15%Net Pension Liability 16,500,871$ 14,870,052$
Pension Plan Fiduciary Net Position – Detailed information about the City’s Miscellaneous Plan net pension liability is available in the City’s separately issued Comprehensive Annual Financial Report (CAFR). The City’s financial statements may be obtained by contacting the City of Alameda’s Finance Department. That report may be obtained on the internet at alamedaca.gov. Detailed information about the pension plan’s fiduciary net position is available in the separately issued CalPERS financial reports. Note 7 - Post-employment Health Care Benefits A. City of Alameda Other Post-Employment Benefit Plan Plan Description – The City of Alameda provides medical and dental benefits to retirees as specified below under the City of Alameda Other Post-Employment Benefit (OPEB) Plan, a single-employer defined benefit health care plan. The City is responsible for establishing and amending the funding policy of the Plan. The City established an irrevocable trust with Public Agency Retirement Services (PARS) to fund its retiree health benefits. Contributions to the trust are made annually according to the City’s OPEB funding policy. The City is the Plan administrator, while PARS administers the investment trust. The City’s OPEB Plan does not issue separate financial statements. PARS issues a separate annual financial report and copies of the report may be obtained by writing to PARS at 4350 Von Karman Ave., Suite 100, Newport Beach, California, 92660. Benefits provided – The following is a summary of Plan eligibility requirements and benefits by employee group as of June 30, 2020: Eligibility requires retiring from the City under CalPERS typically on or after age 50 (52 for PEPRA employees) with at least 5 years of CalPERS service or disability retirement. The City’s contribution for medical coverage for Miscellaneous employees is the Public Employees’ Medical and Hospital Care Act (PEMHCA) minimum required contribution (MRC) - $133 per month in 2018.
Alameda Municipal Power Electric Enterprise Fund
Notes to Financial Statements (Continued) June 30, 2020 and 2019
47
As of June 30, 2020 and 2019, the total amount of benefits paid by AMP were $87,050 and $77,410 respectively. B. OPEB Liability, OPEB Expense and Deferred Outflows/Inflows of Resources Related to OPEB As of June 30, 2020, and 2019, AMP reported a net OPEB liability of $1,584,849 and $1,495,574 respectively for its proportionate share of the City’s net OPEB liability. The net OPEB liability of the Plan was measured as of June 30, 2020, and the net OPEB liability for the Plan used to calculate the net OPEB liability was determined by an actuarial valuation as of June 30, 2018. AMP’s proportion of the City’s net OPEB liability was based on AMP’s FY 2019 contributions to the City’s OPEB plan relative to the total contributions of the City as a whole. AMP’s proportionate share of the City’s net OPEB liability for the Plan as of June 30, 2020 and 2019 measurement dates were 2.22 and 2.22 percent respectively. For the years ended June 30, 2020 and 2019, AMP recognized OPEB expense of $15,497 and $694,994 respectively. At June 30, 2020 and 2019, AMP reported deferred inflows of resources related to OPEB from the following sources:
Deferred Deferred Outflows Inflows
of Resources of ResourcesDifferences between expected and
acturial experiences on liability -$ (3,924)$ Net differences between projected and
actual earnings on plan investments 4,315 - Changes in assumptions 55,357 (35,091)
Total 59,672$ (39,015)$
Deferred Deferred Outflows Inflows
of Resources of Resources
Changes in assumptions -$ (83,417)$
Total -$ (83,417)$
2019
2020
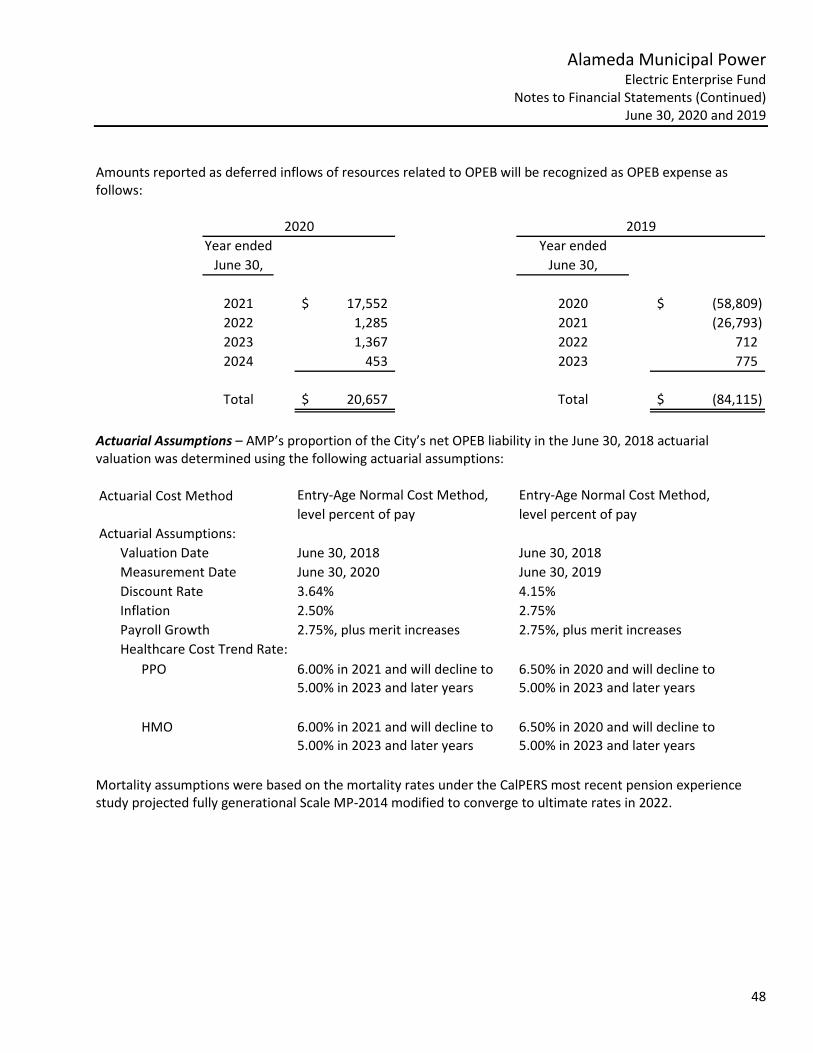
Alameda Municipal Power Electric Enterprise Fund
Notes to Financial Statements (Continued) June 30, 2020 and 2019
48
Amounts reported as deferred inflows of resources related to OPEB will be recognized as OPEB expense as follows:
Year ended Year endedJune 30, June 30,
2021 17,552$ 2020 (58,809)$ 2022 1,285 2021 (26,793) 2023 1,367 2022 712 2024 453 2023 775
Total 20,657$ Total (84,115)$
20192020
Actuarial Assumptions – AMP’s proportion of the City’s net OPEB liability in the June 30, 2018 actuarial valuation was determined using the following actuarial assumptions: Actuarial Cost Method Entry-Age Normal Cost Method, Entry-Age Normal Cost Method,
level percent of pay level percent of payActuarial Assumptions:
Valuation Date June 30, 2018 June 30, 2018Measurement Date June 30, 2020 June 30, 2019Discount Rate 3.64% 4.15%Inflation 2.50% 2.75%Payroll Growth 2.75%, plus merit increases 2.75%, plus merit increasesHealthcare Cost Trend Rate:
PPO 6.00% in 2021 and will decline to 6.50% in 2020 and will decline to 5.00% in 2023 and later years 5.00% in 2023 and later years
HMO 6.00% in 2021 and will decline to 6.50% in 2020 and will decline to 5.00% in 2023 and later years 5.00% in 2023 and later years
Mortality assumptions were based on the mortality rates under the CalPERS most recent pension experience study projected fully generational Scale MP-2014 modified to converge to ultimate rates in 2022.

Alameda Municipal Power Electric Enterprise Fund
Notes to Financial Statements (Continued) June 30, 2020 and 2019
49
The long-term expected real rate of return by asset class. The rate of return was determined using a building-block method in which best-estimate ranges of expected future real rates of return (expected returns, net of OPEB plan investment expense and inflation) are developed for each major asset class. These ranges are combined to produce the long-term expected rate of return by weighting the expected future real rates of return by the target asset allocation percentage and by adding expected inflation. Best estimates of arithmetic real rates of return for each major asset class included in the OPEB plan’s target asset allocation as of June 30, 2020 are summarized in the following table:
Asset classTarget
Allocation
Long-term expected real rate of return
Money-weighted rate
of returnModerate Plus
Equity 50.00% 4.25%Fixed Income 45.00% 2.25%Cash 5.00% 0.00%Total 100.00% 4.48%
Asset classTarget
Allocation
Long-term expected real rate of return
Money-weighted rate
of returnModerate Plus
Equity 50.00% 4.25% 5.93%Fixed Income 45.00% 2.25% 7.12%Cash 5.00% 0.00% 2.14%Total 100.00% 6.96%
2020
2019
Discount rate – The discount rate used to measure the net OPEB liability was 3.64 percent, based on a blended of asset expected rate of return and 3.15 percent, using the average of 3 different 20 year municipal bond rate indices: S&P Municipal Bond 20 Year High Grade Rate Index, Bond Buyer 20-Bond GO Index, Fidelity GO AA 20 Year Bond Index. Change in assumptions – For the measurement date of June 30, 2020, the discount rate decreased from 4.15% to 3.64%. The inflation rate was reduced from 2.75% to 2.50%. The Healthcare Cost Trend Rate was reduced from 6.50 to 6.00%.

Alameda Municipal Power Electric Enterprise Fund
Notes to Financial Statements (Continued) June 30, 2020 and 2019
50
Sensitivity of AMP’s proportionate share of the City’s Net OPEB Liability to Changes in the Discount Rate – The following presents AMP’s proportionate share of the City’s net OPEB liability, calculated using the discount rate of 3.64 percent for the Plan, as well as what AMP’s proportionate share of the City’s net OPEB liability would be if it were calculated using a discount rate that is 1-percentage point lower or 1-percentage point higher than the current rate:
1% Decrease Discount Rate 1% Increase(2.64%) (3.64%) (4.64%)
Net OPEB Liability 1,842,621$ 1,584,849$ 1,377,245$
1% Decrease Discount Rate 1% Increase(3.15%) (4.15%) (5.15%)
Net OPEB Liability 1,731,216$ 1,495,574$ 1,307,843$
2020
2019
Sensitivity of AMP’s proportionate share of the City’s Net OPEB Liability to Changes in the Healthcare Cost Trend Rate – The following presents AMP’s proportionate share of the City’s net OPEB liability, calculated using the healthcare cost trend rate of 6.00 (2020)/6.50 (2019) percent for the Plan, as well as what AMP’s proportionate share of the City’s net OPEB liability would be if it were calculated using a healthcare cost trend rate that is 1-percentage point lower or 1-percentage point higher than the current rate:
2020(5.00% HMO/5.00% PPO (6.00% HMO/6.00% PPO (7.00% HMO/7.00% PPO
decreasing to 4.00% decreasing to 5.00% decreasing to 6.00% HMO/4.00% PPO) HMO/5.00% PPO) HMO/6.00% PPO)
Total OPEB Liability 1,350,726$ 1,584,849$ 1,874,111$
2019(5.50% HMO/5.50% PPO (6.50% HMO/6.50% PPO (7.50% HMO/7.50% PPO
decreasing to 4.00% decreasing to 5.00% decreasing to 6.00% HMO/4.00% PPO) HMO/5.00% PPO) HMO/6.00% PPO)
Total OPEB Liability 1,295,526$ 1,495,574$ 1,744,001$

Alameda Municipal Power Electric Enterprise Fund
Notes to Financial Statements (Continued) June 30, 2020 and 2019
51
Note 8 - Northern California Power Agency (NCPA) A. General AMP participates in joint ventures through Joint Powers Authorities (JPAs) established under the Joint Exercise of Powers Act of the State of California. As separate legal entities, these JPAs exercise full powers and authorities within the scope of the related Joint Powers Agreement, including the preparation of annual budgets, accountability for all funds, the power to make and execute contracts and the right to sue and be sued. Obligations and liabilities of the JPAs are not those of AMP and the other participating entities unless assumed by them. Each JPA is governed by a board consisting of representatives from each member agency. Each board controls the operations of its respective JPA, including selection of management and approval of operating budgets, independent of any influence by member agencies beyond their representation on the board. The JPAs are discussed in this note and in Note 9. AMP is a member of NCPA, a joint powers agency which operates under a joint powers agreement among fourteen (14) public agencies (AMP, BART, Biggs, Gridley, Healdsburg, Lompoc, Palo Alto, Ukiah, Lodi, Port of Oakland, Redding, Roseville, Silicon Valley Power, Truckee-Donner PUD). Turlock Irrigation District withdrew from NCPA on April 1, 2011. The purpose of NCPA is to use the combined strength of its members to purchase, generate, sell and interchange electric energy and capacity through the acquisition and use of electrical generation and transmission facilities, as well as to optimize the use of those facilities and the member's position in the industry. Each agency member has agreed to fund a pro rata share of certain assessments by NCPA and certain members have entered into take-or-pay power supply contracts with NCPA. While NCPA is governed by its members, none of its obligations are those of its members unless expressly assumed by them. Amounts paid by AMP, net of refunds, to NCPA during the fiscal years ending June 30, 2020 and 2019 for purchased power were $32,246,283 and $29,586,832 respectively. Additionally, purchased power was reduced by a refund of $310,155 and $753,011 for power exchange distribution and budget settlement monies returned to the NCPA General Operating Reserve (GOR), for the fiscal years ended June 30, 2020 and 2019, respectively. AMP receives no income from NCPA and does not participate in all of its projects. Further, NCPA does not measure or determine AMP's equity in NCPA as a whole. NCPA reports only AMP's share of its General Operating Reserve, comprised of cash and investments, and AMP's share of those projects in which AMP is a participant. These amounts are reflected in the financial statements as Investment in Joint Venture - Share of Certain NCPA Projects and Reserve.

Alameda Municipal Power Electric Enterprise Fund
Notes to Financial Statements (Continued) June 30, 2020 and 2019
52
The changes in AMP’s share in NCPA projects and reserve are set forth below:
2020 2019
Beginning balance 10,673,031$ 9,670,766$ Increase (decrease) in equity in NCPA projects (100,980) 1,002,265
Ending balance 10,572,051$ 10,673,031$
June 30,
AMP's interest in NCPA Projects and Reserve, as computed by NCPA, is set forth below:
2020 2019
General Operating Reserve 5,915,771$ 5,485,842$ Purchased Power & Transmission 1,108 1,376 Share of Scheduling Coordination Balancing Account 2,313,058 2,095,189 Share of Congestion Revenue Rights (CRR) 194,615 199,877 Associated Member Services 107,492 108,789 Market Purchase Program (MPP) Security Deposit 25,536 34,315
8,557,580 7,925,388 Net book value of amounts contributed to fund
Alameda Municipal Power's share of NCPA Power:Geothermal Projects/Power Line 1,397,005 1,681,550 Calaveras Hydroelectric Project 697,574 1,368,154 Combustion Turbine Project No. 1 (156,236) (382,417) Combustion Turbine Project No. 2 76,128 80,356
10,572,051$ 10,673,031$
June 30,
The General Operating Reserve represents AMP's portion of funds which resulted from the settlement in prior years of issues with financial consequences and reconciliations of several prior years' budgets for programs. These funds are available on demand and earn interest. Members of NCPA may participate in an individual project of NCPA without obligation for any other project. Member assessments collected for one project may not be used to finance other projects of NCPA without the member's permission.

Alameda Municipal Power Electric Enterprise Fund
Notes to Financial Statements (Continued) June 30, 2020 and 2019
53
B. Projects in which AMP is a Participant Geothermal Projects – A power purchase agreement with NCPA obligates AMP for 18.31469 percent of the debt service and the operating costs for two geothermal steam powered generating plants, Plant Number 1 and Plant Number 2, located in the Geysers area in Northern California. In conjunction with these payments, AMP is entitled to receive 16.8825 percent of the output from these facilities. NCPA continues to pursue alternatives for improving and extending steam field reservoir performance, including supplemental water reinjection, plant equipment modifications, and changes in operating methodology. NCPA has increased steam production in the vicinity of reinjection wells and has evaluated a number of alternatives to increase water reinjection at strategic locations. Calaveras Hydroelectric Project – NCPA contracted to finance, manage, construct, and operate Hydroelectric Project Number One for the licensed owner, Calaveras County Water District. In exchange, NCPA has the right to the electric output of the project for 50 years starting in February 1982 and also has an option to purchase power from the project in excess of the District's requirements for the subsequent 50 years, subject to regulatory approval. Debt service payments to NCPA began in February 1990 when the project was declared substantially complete and power was delivered to the participants. AMP is entitled to receive 10.0 percent of output from facility. The debt obligation increased to 11.582% as other members have opted out and a reallocation was done for the remaining members. Combustion Turbine Project No. 1 – In October 1984, NCPA financed a five-unit, l25-megawatt combustion turbine project. The project, built in three member cities including Alameda, began full commercial operation in June 1986 and provides reserve and peaking power. During August 2010, phase two of the first amendment to the NCPA power purchase agreement finalized the transfer of ownership of two NCPA electricity generating units to the City of Roseville due to a misalignment of ISO control areas. The transfer reduced the generation output of the project to 74 MW, and increased the entitlement share to 21.82 percent. Although AMP’s project percentage share increases, its resulting generating capacity entitlement remains constant at 16.05 MW. Combustion Turbine Project No. 2 (Steam Injected Gas Turbine Project) – AMP is a participant in NCPA's 49.8 megawatt Steam Injected Gas Turbine (STIG) project which was built under turnkey contract near the City of Lodi and declared substantially complete on April 23, 1996. In 2010, the NCPA issued 2010 Refunding Series A Bonds for $55,120,000 for the purpose of providing funds to refund all of the Refunded 1999 Bonds, to fund a deposit to the 2010 Series debt service reserve account and to pay cost of issuance of the 2010 Series A Bonds. Under the NCPA power purchase agreement, AMP is obligated to pay 25.53895 percent of the debt service and operating costs for the STIG project. On December 20, 2019, NCPA issued Capital Facilities Revenue Bonds, 2019 Refunding Series A, in the amount of $20,450,000 with an average interest rate of 5.0% to refund $25,450,000 of outstanding Capital Facilities Revenue Bonds, 2010 Refunding Series A with an average interest rate of 5.1249%. The net proceeds were used to purchase US government securities. Those securities were deposited in an irrevocable trust with an escrow agent to provide for all future debt service payments on the old bonds. As a result, the old bonds are considered defeased. The outstanding 2010 Series A Bonds were called for redemption on February 1, 2020.

Alameda Municipal Power Electric Enterprise Fund
Notes to Financial Statements (Continued) June 30, 2020 and 2019
54
On April 2, 2019, NCPA issued Hydroelectric Project Number One Revenue Bonds, 2019 Refunding Series A, in the amount of $39,250,000 with an average interest rate of 4.9126% to refund $52,845,000 of outstanding Hydroelectric Project Number One Revenue Bonds, 2010 Refunding Series A with an average interest rate of 4.9003%. The net proceeds were used to purchase US government securities. Those securities were deposited in an irrevocable trust with an escrow agent to provide for all future debt service payments on the old bonds. As a result, the old bonds are considered defeased. AMP's participation in procurement of natural gas for fuel for existing and new combustion turbine units was approved in 1993. Although there is currently no additional debt financing, AMP and NCPA have committed to long-term payments for gas transmission pipeline capacity, and entered a purchase contract for natural gas. AMP is obligated to pay 19.0 percent. As of June 30, 2020, AMP's share of long-term debt for the Geothermal, Hydroelectric and Capital Facilities Projects are set forth below:
Final Balance Balance CurrentMaturity July 1, 2019 Additions Retirements June 30, 2020 Portion % $
Geothermal Project2009A 7/1/2024 2,675,000$ -$ 2,675,000$ -$ -$ 16.8825% -$ 2012A 7/1/2022 4,945,000 - 1,375,000 3,570,000 1,405,000 16.8825% 602,705 2016A 7/1/2024 16,900,000 - 370,000 16,530,000 3,190,000 16.8825% 2,790,677
Total Geothermal Project 24,520,000 - 4,420,000 20,100,000 4,595,000 3,393,382
Hydroelectric Project2008A&B 7/1/2032 85,160,000 - 1,520,000 83,640,000 2,165,000 10.0000% 8,364,000 2012A&B 7/1/2032 83,785,000 - - 83,785,000 - 10.0000% 8,378,500 2018A&B (a) 7/1/2025 70,215,000 - 10,225,000 59,990,000 10,730,000 11.5821% 6,948,102 2019A 7/1/2023 39,250,000 - 940,000 38,310,000 7,830,000 10.0000% 3,831,000 Unamortized premium 7/1/2025 16,527,991 - 2,814,535 13,713,456 - 10.0000%
Total Hydroelectric Project 294,937,991 - 15,499,535 279,438,456 20,725,000 27,521,602
Capital Facilities (STIG)2010A 8/1/2025 29,645,000 - 29,645,000 - - 19.0000% - 2019A 7/1/2025 - 20,450,000 - 20,450,000 2,575,000 19.0000% 3,885,500 Unamortized premium 419,967 2,287,769 700,505 2,007,231 - 19.0000% -
Total Capital Facilities 30,064,967 22,737,769 30,345,505 22,457,231 2,575,000 3,885,500
Total Long-Term Debt 349,522,958$ 22,737,769$ 50,265,040$ 321,995,687$ 27,895,000$ 34,800,484$
principal both January 1 and July 1.(a) AMP's share is 10%, the above reflects the other member opt out allocation %.NCPA Capital Facilities bond pay principal August 1.
AMP's ObligationTotal AMP
NCPA Geothermal (2009A & 2016A) and Hydroelectric bonds pay principal July 1. Geothermal 2012A bonds pay
Defeased Debt - Various bond refundings were undertaken to defease debt and realize future debt service savings. Debt was defeased by using the proceeds of the refunding issues and other available monies to irrevocably place in trust cash and US Gov’t securities, which together with interest earned thereon, will be sufficient to pay both the interest and the appropriate maturity or redemption value of the refunded bonds as required.

Alameda Municipal Power Electric Enterprise Fund
Notes to Financial Statements (Continued) June 30, 2020 and 2019
55
Graeagle Hydroelectric Project – AMP's participation in this small hydroelectric project was approved in 1993. Although this project does not involve any financing, it does involve a long-term contractual commitment to purchase the power produced by the project. AMP receives 100 percent of the power output from this small 440 kilowatt hydroelectric project. Western Area Power Administration – AMP has an allocation of power from the Federal Central Valley Project generating resources contracted through the U.S. Department of Energy's Western Area Power Administration. This allocation has been temporarily assigned to NCPA for scheduling and delivery to AMP. AMP pays 1.08075 percent of the base resource costs and receives that same amount of the base resource, power generated in one federal fiscal year. Other Power Purchase Agreements – AMP has also entered into a number of other power purchase agreements which are scheduled by or through NCPA. Highwinds Project Power Purchase In December 2004, AMP entered into a long-term power purchase agreement with PPM Energy, Inc. for power supplied by the Highwinds Project in Solano County, California. In 2008, Iberdrola Renewables succeeded PPM Energy as the seller counterparty for this power purchase agreement. AMP receives 6.17 percent of the output of the 162 megawatt project (nameplate rating) – 10 megawatts – as delivered through June 30, 2028. Landfill Gas Projects Power Purchase Since 2004, AMP has entered into four long-term power purchase agreements for power supplied by multiple generating facilities. These facilities utilize combustible gaseous emissions from landfills, located in or near the San Francisco Bay area to create power. AMP began receiving nearly 3.45 megawatts of base-load power from each of the first two facilities in 2004 and early 2006. An additional 5.2 megawatts of base-load output were added to AMP's portfolio in April 2009 when the Ox Mountain facility commenced operation. An additional 1.9 megawatts of power were added to AMP's portfolio as the Keller Canyon facility commenced base-load operation in August 2009. California Electric Industry Restructuring – In September 1996, the California State legislature signed into law Assembly Bill 1890 (AB 1890) deregulating the electric power supply market and restructuring the electric power industry in California. While the majority of the legislation was directed at investor-owned utilities (IOUs), AMP and other California publicly owned utilities were greatly affected by the restructuring of markets and the ensuing wild fluctuations in prices that resulted from a deficiency in generating capacity and an immature and flawed market structure. Because AMP has its own generating resources and is not heavily dependent on the wholesale market to purchase power, it was not significantly impacted by these price swings. In April 2008, the California Independent System Operator (CAISO) launched a new wholesale market structure in the state which is referred to as the Market Redesign and Technology Upgrade (MRTU). While MRTU features a day-ahead energy market with a nodal locational marginal price calculation, both load and resources are currently priced as aggregated pricing. The MRTU initiative has introduced new risks and uncertainties for AMP because the Federal Energy Regulatory Commission (FERC) continues requiring CAISO to implement a disaggregated market that will negatively affect AMP because it is in a transmission constrained location. To establish the extent of the risk and identify its impact to rates, AMP continues to monitor changes that CAISO makes to its market structure and operations.

Alameda Municipal Power Electric Enterprise Fund
Notes to Financial Statements (Continued) June 30, 2020 and 2019
56
NCPA plays an active role in protecting members' contractual rights in Federal Energy Regulatory Commission (FERC), California Public Utilities Commission (CPUC), and other legislative/regulatory proceedings. Priorities related to industry restructuring include the preservation of local control authority for publicly owned utilities, assuring open and fair access to wholesale markets and the transmission grid, and maintaining members' preference access to power from the Central Valley Project and Western Area Power Administration. NCPA Financial Information – NCPA's financial statements can be obtained from NCPA, 651 Commerce Drive, Roseville, California 95678. Note 9 - Transmission Agency of Northern California (TANC) AMP is a member of a joint powers agreement with fifteen other entities in TANC. TANC's purpose is to provide electrical transmission or other facilities for the use of its members. While governed by its members, none of TANC's obligations are those of its members unless expressly assumed by them. The California-Oregon Transmission Project (COTP) is one of three high voltage transmission lines connecting Oregon and California. The 500 kV line is able to transmit 1,600 MW/h of electricity. The COTP participants include the Transmission Agency of Northern California, Western, PG&E, City of Redding, Carmichael Water District, and the San Juan Water District. Currently, the COTP provides a transmission path for resources that is outside of the CAISO balancing authority. According to the 1985 Project Agreement with TANC for the development of the COTP and subsequent related project agreements, AMP is obligated to pay its share of the project's costs, including debt service and is entitled to the use of a percentage of the project's transmission or transfer capacity. AMP’s entitlement share on COTP is 1.2274 percent and AMP is obligated to pay 1.33 percent of the project’s operating costs. AMP is obligated to pay 1.33 percent of TANC's debt-service related to the California – Oregon Transmission Project (COTP). AMP’s share on the 2009 Series A bonds is 1.4496 percent. AMP is not obligated for any portion of the 2009 Series B bonds. These obligations provide AMP with a COTP transfer capability of 17.05 MW. AMP is also obligated to pay for a portion of the debt associated with the South of Tesla transmission which is provided under an agreement between TANC and Pacific Gas & Electric Company. In May 2009, TANC issued $67.0 million of tax-exempt 2009 Series A bonds and $61.8 million of taxable 2009 Series B bonds. The proceeds of the Series A bonds were used to retire a bank loan that refinanced $30.3 million of TANC's tax-exempt commercial paper and also to refund $34.7 million of TANC's 2003 Series C Auction Rate Securities. The proceeds of the Series B bonds were used to retire a bank loan that refinanced $56.3 million of TANC's taxable commercial paper. The 2009 refunding increased future aggregate debt service payments by $19.3 million, but resulted in a total economic gain of $6.5 million, the difference between present value of the old and new debt service payments. TANC has issued Revenue Bonds for $435,790,000 and eliminated its obligations for the Tax Exempt Commercial Paper notes. As of June 30, 2020 and 2019, AMP's share of this debt is $0 and $0, respectively.

Alameda Municipal Power Electric Enterprise Fund
Notes to Financial Statements (Continued) June 30, 2020 and 2019
57
As of July 1, 2014, AMP and other NCPA members executed a multiparty Long-Term Layoff Agreement (the Agreement) that laid off their participating percentage share of the COTP to other TANC participants namely the Sacramento Municipal Utility District, the Turlock Irrigation District, and Modesto Irrigation District, for twenty-five (25) years with the option to extend for an additional five years upon all parties approval. During the layoff period AMP and other NCPA members will not pay any debt service or operating costs. During the term of the Agreement, AMP would relinquish its voting rights on all short-term decisions and actions at TANC related to the COTP. In 2016, TANC issued $173.9 mission of tax-exempt 2016 Series A Revenue Refunding Bonds. The proceeds of the bonds were used to refund the certain outstanding bonds issued by TANC to finance or refinance a portion of the costs of the California – Oregon Transmission Project, fund the costs of terminating in full certain interest rate swap agreements relating to the variable rate Refunded Bonds, and fund a debt service reserve account for the 2016A bonds, and pay costs of the issuance of the 2016A Bonds. The 2016 Series A “small member” debt portion is $2,576,451. AMP is obligated to pay $54,209, or 2.104 percent of that debt. TANC Financial Information - TANC's financial statements can be obtained from TANC, P.O. Box 15129, Sacramento, California 95851 or from their website at http://www.tanc.us/financials.html. Note 10 - Risk Management AMP, as a department of the City, participates in the City's risk management program. The City manages risk by participating in two public entity risk excess pools described below and by retaining certain risks. Public entity risk pools are formally organized and separate entities established under the Joint Exercise of Powers Act of the State of California. As separate legal entities, those entities exercise full powers and authorities within the scope of the related Joint Powers Agreements including the preparation of annual budgets, accountability for all funds, the power to make and execute contracts and the right to sue and be sued. Each risk pool is governed by a board consisting of representatives from member municipalities. Each board controls the operations of the respective risk pool, including selection of management and approval of operating budgets, independent of any influence by member municipalities beyond their representation on that board. Obligations and liabilities of these risk pools are not AMP's or the City's responsibility. AMP has not reduced its risk pool insurance coverage from the prior year. Furthermore, settlements have not exceeded insurance coverage for the past three fiscal years. A. Risk Coverage The City is a member of the Local Agency Workers' Compensation Excess Joint Powers Authority (LAWCX) which covers workers' compensation claims up to $5,000,000 and provides additional coverage up to statutory limits. The City has a deductible or uninsured liability of up to $350,000 per claim. During the fiscal years ended June 30, 2020 and 2019, AMP contributed $116,392 and $73,202 for the coverage, respectively.

Alameda Municipal Power Electric Enterprise Fund
Notes to Financial Statements (Continued) June 30, 2020 and 2019
58
The contributions made to each risk pool equal the ratio of their respective payrolls to the total payrolls of all entities participating in the same layer of each program, in each program year. Actual surpluses or losses are shared according to a formula developed from overall loss costs and spread to member entities on a percentage basis after a retrospective rating. The City is also a member of the California Joint Powers Risk Management Authority (CJPRMA), an excess risk-sharing pool providing general liability, auto liability, physical vehicle damage, property and boiler and machinery insurance coverage. For the liability policies, the Authority provides $40,000,000 in coverage subject to a self-insured retention limit of $500,000. The physical vehicle damage coverage covers both owned and leased vehicles valued at $25,000 or more, subject to a $10,000 deductible. With regard to the property and boiler and machinery coverage, the Authority provides “all risk” (excluding flood and quake) replacement cost coverage subject to a $25,000 deductible. The following types of loss risks are covered by the above authority under the terms of their respective joint-powers agreements, through commercial insurance policies, and self-insured programs as follows: Type of Coverage Coverage Limits
Excess General Liability $40,000,000Auto - Physical damage Actual Cash ValueWorkers' Compensation Statutory, w/ $5,000,000 in Employer's LiabilityBoiler & Machinery Replacement CostComputer Software Self-InsuredProperty Replacement CostTerrorism $10,000,000
Financial statements for the workers’ compensation excess risk pool may be obtained from LAWCX, c/o Bickmore & Associates, 6371 Auburn Boulevard, Citrus Heights, California 95621. Financial statements for the liability/property excess risk pool may be obtained from CJPRMA, 3201 Doolan Drive, Suite 285, Livermore, California 94551. B. General Liability and Workers' Compensation Claims Payable The Governmental Accounting Standards Board (GASB) requires municipalities to record their liability for uninsured claims and to reflect the current portion of this liability as an expenditure in their financial statements. As discussed above, AMP has coverage for such claims, but it has retained the risk for the deductible or uninsured portion of these claims. The change in general liability and workers' compensation claims liability, including claims incurred but not reported as estimated by the City's independent actuary, is based on historical trend information provided by its third-party administrators and was computed as follows at June 30:

Alameda Municipal Power Electric Enterprise Fund
Notes to Financial Statements (Continued) June 30, 2020 and 2019
59
Worker's General Compensation Liability Total
Beginning Balance as of July 1, 2017 649,283$ 692,675$ 1,341,958$ Change in liability for current and prior
fiscal year claims (331,774) 312,394 (19,380) Payments made on claims (70,450) (36,031) (106,481)
Liability as of June 30, 2018 247,059 969,038 1,216,097
Change in liability for current and prior fiscal year claims (56,376) (68,992) (125,368)
Payments made on claims (50,657) (121) (50,778)
Liability as of June 30, 2019 140,026 899,925 1,039,951
Change in liability for current and prior fiscal year claims 32,101 828,699 860,800
Payments made on claims (66) (2,450) (2,516)
Ending balance as of June 30, 2020 172,061 1,726,174 1,898,235 Less current portion (160,000) (35,000) (195,000)
Long-term portion 12,061$ 1,691,174$ 1,703,235$
Note 11 - Commitments A. Take -or- Pay Agreements Under the terms of its NCPA and TANC joint venture agreements, AMP is liable for a portion of the bonded indebtedness issued by these agencies under take-or-pay or similar agreements, as discussed in Notes 8 and 9. AMP's estimated share of such debt outstanding at June 30, 2020 was $42,989,664. Under certain circumstances, AMP may also be responsible for a portion of the costs of operating these entities. Under certain circumstances, such as default or bankruptcy of other participants, AMP may also be liable to pay a portion of the debt of these joint ventures on behalf of the other participants. These "step up" provisions are generally capped at a 25 percent increase. Take-or-Pay commitments expire upon final maturity of outstanding debt for each project. Final fiscal year debt expirations are as follows: Project Debt Expiration Entitlement Debt service %
NCPA - Geothermal Project (NGP) Jul-2024 16.88250% 17.73095%NCPA - Calaveras Hydroelectric
Project (NCHP) Jul-2032 10.00000% 12.51968%NCPA - Capital Facilities
Project (NCFP) Jul-2026 19.00000% 19.77518%
As discussed in Note 9, as of July 1, 2014, AMP and other NCPA members executed a multiparty Long-Term Layoff Agreement that laid off their participating percentage share of the COTP to other TANC participants.

Alameda Municipal Power Electric Enterprise Fund
Notes to Financial Statements (Continued) June 30, 2020 and 2019
60
A summary of AMP’s “Take or Pay” contracts and related projects and its contingent liability for the debt service including principal and interest payments at June 30, 2020 is as follows: Fiscal Year NGP NCHP NCFP Total
717,629$ 3,499,301$ 608,513$ 4,825,443$ 835,761 3,203,071 945,013 4,983,845 836,267 3,268,236 960,403 5,064,906 586,381 3,739,922 966,435 5,292,738 587,882 3,811,363 960,593 5,359,838
- 10,678,515 - 10,678,515 - 6,784,379 - 6,784,379
3,563,920$ 34,984,787$ 4,440,957$ 42,989,664$
2026-2030
20212022202320242025
2031-2033
Total
B. Lease Agreement with 1835 Alameda Property, LLC In March 2016, AMP entered into a property lease agreement with the 1835 Alameda Property, LLC for warehousing/distributing space. The lease terms for the agreement started on May 1, 2016 and will expire on April 30, 2031. The base rent is $24,700 per month.
Fiscal Year
2021 316,023$ 2022 325,504 2023 335,269 2024 345,327 2025 355,687
2026-2030 1,945,041 2031 352,163
Total 3,975,013$

Required Supplementary Information June 30, 2020
Alameda Municipal Power

62
Alameda Municipal Power Schedule of AMP's Proportionate Share of the City's Miscellaneous Plan Net Pension Liability
Last 10 Fiscal Years*
2020 2019 2018 2017 2016 2015
AMP's proportion of the City's net pension liability 31.99% 30.26% 30.19% 29.84% 29.00% 29.00%
AMP's proportionate share of the City's net pension liability 26,437,127$ 24,012,403$ 24,557,226$ 21,006,196$ 16,040,814$ 13,657,795$
AMP's Covered payroll 8,666,657$ 8,550,195$ 8,094,108$ 7,798,786$ 7,471,121$ 7,264,115$
AMP's proportionate share of the City's net pension liability as a percentage of covered payroll 305.04% 280.84% 303.40% 269.35% 214.70% 188.02%
Miscellaneous Plan fiduciary net position as a percentage ofthe total pension liability 72.80% 72.90% 71.50% 72.92% 77.96% 81.01%
Measurement date: June 30, 2019 June 30, 2018 June 30, 2017 June 30, 2016 June 30, 2015 June 30, 2014
* Fiscal year 2015 was the first year of implementation, therefore, only six years are shown.

63
Alameda Municipal Power Schedule of AMP’s Pension Contributions
Last 10 Fiscal Years*
2020 2019 2018 2017 2016 2015
Actuarially determined contributions 2,504,271$ 2,105,125$ 1,739,297$ 1,631,011$ 1,312,978$ 1,016,782$
Contributions in relation to the actuarially determined contribution 2,504,271 2,105,125 1,739,297 1,631,011 1,312,978 1,016,782
Contribution deficiency (excess) -$ -$ -$ -$ -$ -$
Covered payroll 8,598,246$ 8,666,657$ 8,550,195$ 8,094,108$ 7,798,786$ 7,471,121$
Contributions as a percentageof covered payroll 29.13% 24.29% 20.34% 20.15% 16.84% 13.61%
* Fiscal year 2015 was the first year of implementation, therefore, only six years are shown.
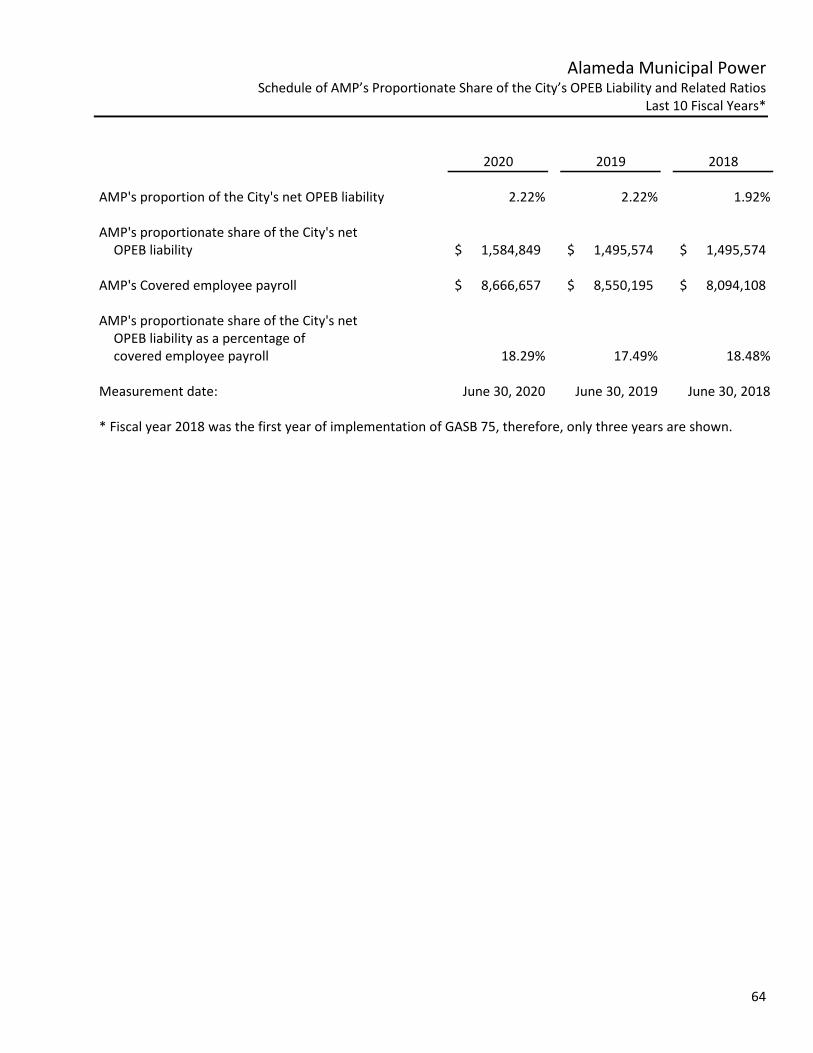
64
Alameda Municipal Power Schedule of AMP’s Proportionate Share of the City’s OPEB Liability and Related Ratios
Last 10 Fiscal Years*
2020 2019 2018
AMP's proportion of the City's net OPEB liability 2.22% 2.22% 1.92%
AMP's proportionate share of the City's net OPEB liability 1,584,849$ 1,495,574$ 1,495,574$
AMP's Covered employee payroll 8,666,657$ 8,550,195$ 8,094,108$
AMP's proportionate share of the City's net OPEB liability as a percentage of covered employee payroll 18.29% 17.49% 18.48%
Measurement date: June 30, 2020 June 30, 2019 June 30, 2018
* Fiscal year 2018 was the first year of implementation of GASB 75, therefore, only three years are shown.
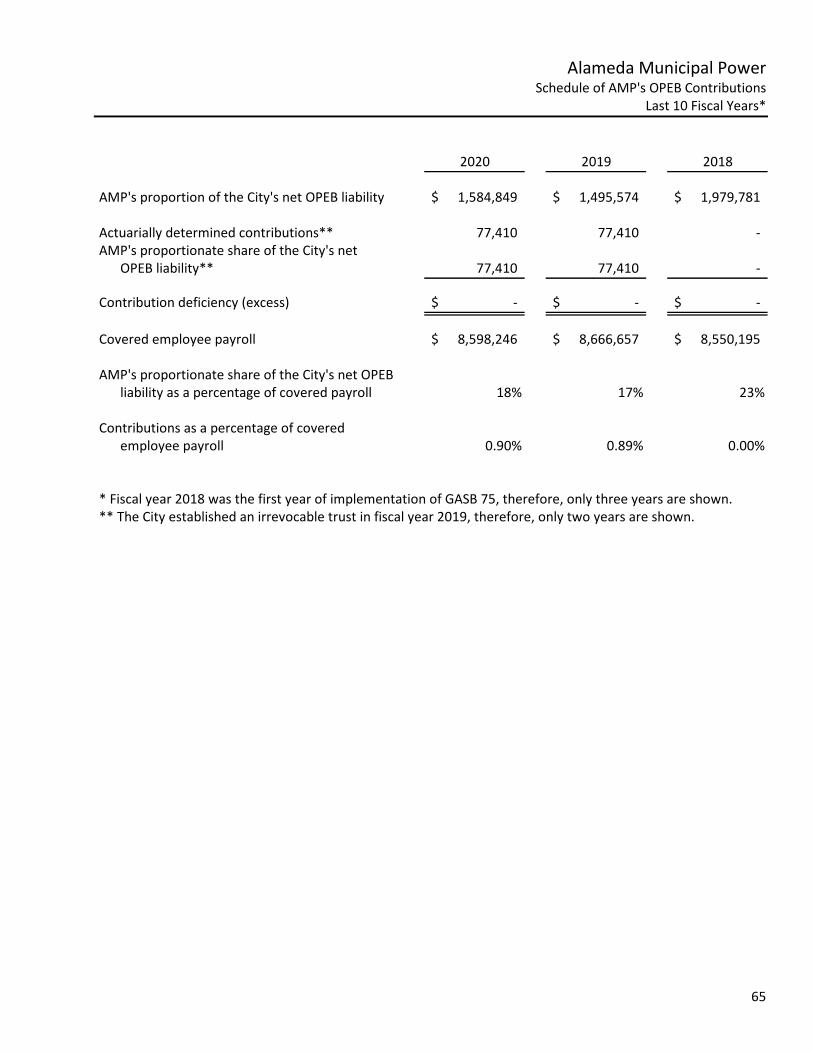
65
Alameda Municipal Power Schedule of AMP's OPEB Contributions
Last 10 Fiscal Years*
2020 2019 2018
AMP's proportion of the City's net OPEB liability 1,584,849$ 1,495,574$ 1,979,781$
Actuarially determined contributions** 77,410 77,410 - AMP's proportionate share of the City's net
OPEB liability** 77,410 77,410 -
Contribution deficiency (excess) -$ -$ -$
Covered employee payroll 8,598,246$ 8,666,657$ 8,550,195$
AMP's proportionate share of the City's net OPEB liability as a percentage of covered payroll 18% 17% 23%
Contributions as a percentage of covered employee payroll 0.90% 0.89% 0.00%
* Fiscal year 2018 was the first year of implementation of GASB 75, therefore, only three years are shown.** The City established an irrevocable trust in fiscal year 2019, therefore, only two years are shown.

66
Alameda Municipal Power Statistical Section Overview
STATISTICAL SECTION
This part of the Alameda Municipal Power’s (AMP) Comprehensive Annual Financial Report presents detailed information as a context for understanding what the information in the financial statements, note disclosures, and required supplementary information says about AMP’s overall financial health. In contrast to the financial section, the statistical section information is not subject to independent audit.
Financial Trends
These schedules contain trend information to help the reader understand how AMP’s financial performance and well being have changed over time:
1. Net Position by Component2. Changes in Net Position of Consolidated Operations3. Changes in Net Position of Electric Operations and Telecommunication Operations
Revenue Capacity These schedules contain information to help the reader assess AMP’s revenue sources:
1. Electric Operating Revenues by Source2. Customer Accounts3. Pricing Changes
Debt Capacity These schedules present information to help the reader assess the affordability of AMP’s current levels of outstanding debt and AMP’s ability to issue additional debt in the future:
1. Ratio of Outstanding Debt by Type2. Revenue Bonds/Certificates of Participation Coverage – Electric Operations3. Certificates of Participation Coverage – Telecommunication Operations
Demographic and Economic Information These schedules offer demographic and economic indicators to help the reader understand the environment within which AMP’s financial activities take place:
1. Demographic and Economic Statistics2. Top 10 Customers and City of Alameda Principal Employers
Operating Information These schedules contain service and infrastructure data to help the reader understand how the information in AMP’s financial report relates to the services that AMP provides and the activities it performs:
1. Operating Expenses by Function – Electric Operations2. Operating Expenses by Function –Telecommunications Operations3. Capital Asset Statistics by Function/Program4. Operation Indicators5. Days Cash on Hand – Actual and Budget
Sources Unless otherwise noted, the information in these schedules is derived from the Comprehensive Annual Financial Reports for the relevant year.

67
Alameda Municipal Power Net Position by Component
Last Ten Fiscal Years
Fiscal Year Ended,6/30/2011 6/30/2012 6/30/2013 6/30/2014 6/30/2015 6/30/2016 6/30/2017 6/30/2018 6/30/2019 6/30/2020
Net Position: Net Investment in Capital Assets 30,928,840$ 29,166,859$ 28,278,573$ 30,357,606$ 32,296,499$ 32,252,428$ 34,437,310$ 32,661,774$ 31,576,345$ 30,184,887$ Restricted 4,378,747 4,515,565 4,529,302 4,544,429 4,561,650 4,581,311 4,608,923 4,661,503 4,719,758 4,777,285 Unrestricted 16,111,594 14,916,203 19,774,368 27,833,516 17,235,250 23,848,220 31,259,576 29,278,601 33,134,340 35,731,238Total Net Position 51,419,181$ 48,598,627$ 52,582,243$ 62,735,551$ 54,093,399$ 60,681,959$ 70,305,809$ 66,601,878$ 69,430,443$ 70,693,410$
$-
$10,000,000
$20,000,000
$30,000,000
$40,000,000
$50,000,000
$60,000,000
$70,000,000
$80,000,000 Net Investment in Capital Assets Restricted Unrestricted

68
Alameda Municipal Power Changes in Net Position of Consolidated Operations
Last Ten Fiscal Years
Non-Operating
Fiscal Operating Operating OperatingRevenue,
Expenses & Change in Beginning EndingYear Revenues Expenses Income Transfers Net Position Balance Balance
2011 50,771,700$ 43,325,162$ 7,446,538$ (6,950,574)$ 495,964$ 50,923,217$ 51,419,181$ 2012 51,434,869$ 47,624,263$ 3,810,606$ (6,631,160)$ (2,820,554)$ 51,419,181$ 48,598,627$ 2013 56,044,239$ 48,133,618$ 7,910,621$ (3,927,005)$ 3,983,616$ 48,598,627$ 52,582,243$ 2014 59,693,838$ 44,283,891$ 15,409,947$ (5,256,639)$ 10,153,308$ 52,582,243$ 62,735,551$
2015* 58,759,497$ 45,041,333$ 13,718,164$ (5,452,868)$ 8,265,296$ 45,828,103$ 54,093,399$ 2016 62,012,528$ 51,230,776$ 10,781,752$ (4,193,192)$ 6,588,560$ 54,093,399$ 60,681,959$ 2017 63,449,233$ 50,432,498$ 13,016,735$ (3,392,887)$ 9,623,848$ 60,681,959$ 70,305,807$
2018** 64,602,195$ 54,463,482$ 10,138,713$ (11,840,882)$ (1,702,169)$ 68,304,047$ 66,601,878$ 2019 67,078,362$ 59,472,881$ 7,605,481$ (4,776,916)$ 2,828,565$ 66,601,878$ 69,430,443$ 2020 67,066,350$ 60,324,301$ 6,742,049$ (5,479,082)$ 1,262,967$ 69,430,443$ 70,693,410$
**2018 Net Position Beginning Balance was restated for the adoption of GASB Statement No. 75, Accounting and Financial Reporting forPostemployment Benefits Other Than Pensions .
Net Position
*2015 Net Position Beginning Balance was restated adopting GASB Statement No. 68 "Accounting and Financial Reporting for Pensions ".
$0$10,000,000$20,000,000$30,000,000$40,000,000$50,000,000$60,000,000$70,000,000$80,000,000
Fiscal Year
Net Position Ending Balance As of June 30,
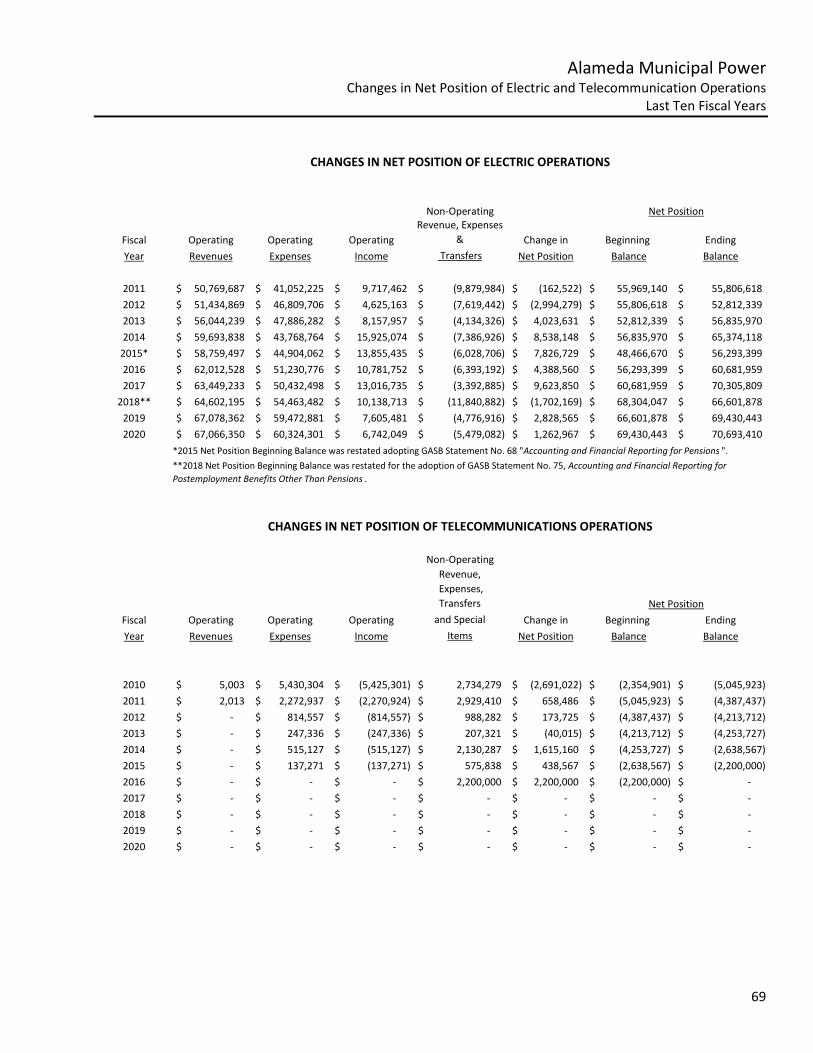
69
Alameda Municipal Power Changes in Net Position of Electric and Telecommunication Operations
Last Ten Fiscal Years
CHANGES IN NET POSITION OF ELECTRIC OPERATIONS
Non-Operating
Fiscal Operating Operating OperatingRevenue, Expenses
& Change in Beginning EndingYear Revenues Expenses Income Transfers Net Position Balance Balance
2011 50,769,687$ 41,052,225$ 9,717,462$ (9,879,984)$ (162,522)$ 55,969,140$ 55,806,618$ 2012 51,434,869$ 46,809,706$ 4,625,163$ (7,619,442)$ (2,994,279)$ 55,806,618$ 52,812,339$ 2013 56,044,239$ 47,886,282$ 8,157,957$ (4,134,326)$ 4,023,631$ 52,812,339$ 56,835,970$ 2014 59,693,838$ 43,768,764$ 15,925,074$ (7,386,926)$ 8,538,148$ 56,835,970$ 65,374,118$
2015* 58,759,497$ 44,904,062$ 13,855,435$ (6,028,706)$ 7,826,729$ 48,466,670$ 56,293,399$ 2016 62,012,528$ 51,230,776$ 10,781,752$ (6,393,192)$ 4,388,560$ 56,293,399$ 60,681,959$ 2017 63,449,233$ 50,432,498$ 13,016,735$ (3,392,885)$ 9,623,850$ 60,681,959$ 70,305,809$
2018** 64,602,195$ 54,463,482$ 10,138,713$ (11,840,882)$ (1,702,169)$ 68,304,047$ 66,601,878$ 2019 67,078,362$ 59,472,881$ 7,605,481$ (4,776,916)$ 2,828,565$ 66,601,878$ 69,430,443$ 2020 67,066,350$ 60,324,301$ 6,742,049$ (5,479,082)$ 1,262,967$ 69,430,443$ 70,693,410$
CHANGES IN NET POSITION OF TELECOMMUNICATIONS OPERATIONS
Non-OperatingRevenue,
Expenses, Transfers
Fiscal Operating Operating Operating and Special Change in Beginning EndingYear Revenues Expenses Income Items Net Position Balance Balance
2010 5,003$ 5,430,304$ (5,425,301)$ 2,734,279$ (2,691,022)$ (2,354,901)$ (5,045,923)$ 2011 2,013$ 2,272,937$ (2,270,924)$ 2,929,410$ 658,486$ (5,045,923)$ (4,387,437)$ 2012 -$ 814,557$ (814,557)$ 988,282$ 173,725$ (4,387,437)$ (4,213,712)$ 2013 -$ 247,336$ (247,336)$ 207,321$ (40,015)$ (4,213,712)$ (4,253,727)$ 2014 -$ 515,127$ (515,127)$ 2,130,287$ 1,615,160$ (4,253,727)$ (2,638,567)$ 2015 -$ 137,271$ (137,271)$ 575,838$ 438,567$ (2,638,567)$ (2,200,000)$ 2016 -$ -$ -$ 2,200,000$ 2,200,000$ (2,200,000)$ -$ 2017 -$ -$ -$ -$ -$ -$ -$ 2018 -$ -$ -$ -$ -$ -$ -$ 2019 -$ -$ -$ -$ -$ -$ -$ 2020 -$ -$ -$ -$ -$ -$ -$
Net Position
Net Position
*2015 Net Position Beginning Balance was restated adopting GASB Statement No. 68 "Accounting and Financial Reporting for Pensions ".**2018 Net Position Beginning Balance was restated for the adoption of GASB Statement No. 75, Accounting and Financial Reporting forPostemployment Benefits Other Than Pensions .

70
Alameda Municipal Power Electric Operating Revenues by Source
Last Ten Fiscal Years
Sales of ElectricityFiscal Commercial Commercial Street Lighting/ Miscellaneous Plant Lease & GHG/C&T/LCFSYear Residential Small Medium Municipal Other Services Jobbing Sales Related Sales Total
2011 $18,257,650 $23,352,114 $5,861,554 $1,753,399 $641,967 $613,426 $289,577 $0 $50,769,6872012 $18,488,086 $23,964,056 $5,666,350 $1,793,977 $464,788 $687,220 $370,392 $0 $51,434,8692013 $18,781,411 $24,967,214 $4,552,958 $1,779,313 $623,308 $666,112 $390,500 $4,283,423 $56,044,2392014 $18,974,096 $25,554,219 $4,088,510 $1,859,914 $660,902 $773,677 $843,737 $6,938,783 $59,693,8382015 $18,849,656 $25,660,869 $3,435,518 $2,047,549 $797,198 $742,071 $402,567 $6,824,069 $58,759,4972016 $19,869,104 $27,071,358 $4,278,240 $1,973,689 $1,028,631 $947,765 $479,791 $6,363,950 $62,012,5282017 $21,510,126 $27,177,335 $4,366,885 $1,958,154 $913,248 $1,275,191 $1,177,119 $5,071,175 $63,449,2332018 $23,902,788 $28,500,186 $4,338,898 $1,965,664 $793,870 $1,146,507 $519,200 $3,435,082 $64,602,1952019 $24,414,010 $28,354,299 $4,580,711 $2,225,142 $1,453,471 $510,524 $1,380,846 $4,159,358 $67,078,3622020 $25,933,443 $29,341,107 $5,069,275 $2,238,296 $149,514 $362,644 $1,062,614 $2,909,457 $67,066,350
Fiscal Commercial Commercial Street Lighting/ Total Peak
Year Residential Small Medium Municipal Other KWH Demand (KWH)2011 142,305,884 174,717,111 49,235,786 13,138,014 3,240,179 382,636,974 70,8002012 139,665,283 172,445,087 45,512,960 12,880,649 3,283,309 373,787,288 67,1882013 135,924,914 176,259,228 35,487,830 12,585,314 3,186,846 363,444,132 68,1002014 131,209,422 175,075,476 31,951,900 12,537,513 3,138,994 353,913,305 69,3082015 125,431,220 174,257,771 26,587,830 12,809,590 3,116,374 342,202,785 63,3722016 125,831,929 176,575,883 31,490,040 12,375,517 2,546,494 348,819,863 64,2832017 126,850,402 172,520,353 30,127,960 11,428,198 2,838,825 343,765,738 63,7382018 124,589,523 168,873,305 28,321,180 10,723,565 2,518,330 335,025,903 59,6242019 125,510,907 164,807,447 28,712,440 11,064,274 2,034,011 332,129,079 54,3622020 129,591,566 166,745,235 31,301,090 11,539,236 2,605,615 341,782,742 61,990
Kilowatt- Hour Sales
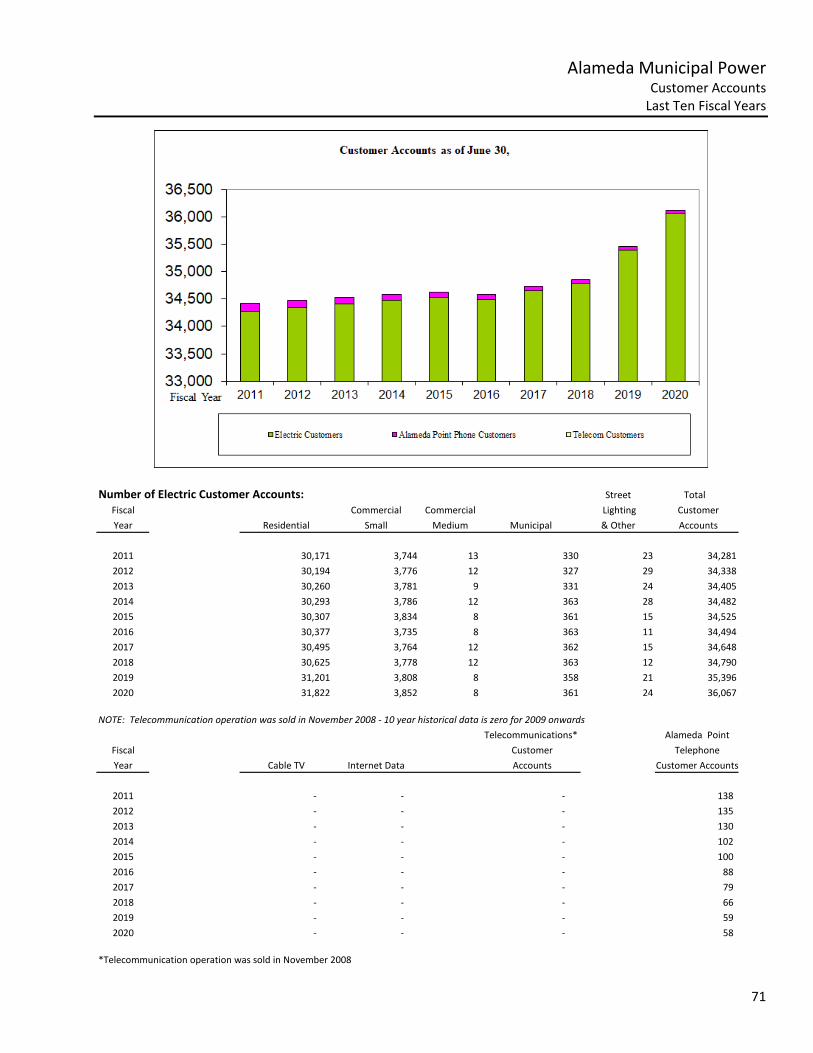
71
Alameda Municipal Power Customer Accounts
Last Ten Fiscal Years
Number of Electric Customer Accounts: Street Total Fiscal Commercial Commercial Lighting CustomerYear Residential Small Medium Municipal & Other Accounts
2011 30,171 3,744 13 330 23 34,2812012 30,194 3,776 12 327 29 34,3382013 30,260 3,781 9 331 24 34,4052014 30,293 3,786 12 363 28 34,4822015 30,307 3,834 8 361 15 34,5252016 30,377 3,735 8 363 11 34,4942017 30,495 3,764 12 362 15 34,6482018 30,625 3,778 12 363 12 34,7902019 31,201 3,808 8 358 21 35,3962020 31,822 3,852 8 361 24 36,067
NOTE: Telecommunication operation was sold in November 2008 - 10 year historical data is zero for 2009 onwardsTelecommunications* Alameda Point
Fiscal Customer TelephoneYear Cable TV Internet Data Accounts Customer Accounts
2011 - - - 1382012 - - - 1352013 - - - 1302014 - - - 1022015 - - - 1002016 - - - 882017 - - - 792018 - - - 662019 - - - 592020 - - - 58
*Telecommunication operation was sold in November 2008

72
Alameda Municipal Power Pricing Changes
Last Ten Fiscal Years
Electric Rate ChangesPercent
Date Change
July 1, 2011 3.85%July 1, 2012 3.25%July 1, 2013 3.25%July 1, 2014 2.00%July 1, 2015 4.60%July 1, 2016 5.00%July 1, 2017 5.00%July 1, 2018 1.00%July 1, 2019 2.50%July 1, 2020 0.00% (Fiscal Year 2021)

73
Alameda Municipal Power Outstanding Debt by Type Last
Ten Fiscal Years
Loans andFiscal Certificates of Revenue Bonds/ Lease Total Per Customer PerYear Participation Anticipation Notes Purchases Accounts Capita (a)
2011 -$ 31,685,000$ 2,447,380$ 34,132,380$ $994.01 460.74$ 2012 -$ 30,790,000$ 2,389,610$ 33,179,610$ $964.38 444.53$ 2013 -$ 29,750,000$ 2,328,405$ 32,078,405$ $930.29 426.99$ 2014 -$ 28,685,000$ 2,263,581$ 30,948,581$ $896.41 405.02$ 2015 -$ 27,590,000$ 2,200,000$ 29,790,000$ $862.85 392.17$ 2016 -$ 26,460,000$ -$ 26,460,000$ $767.09 333.77$ 2017 -$ 25,290,000$ -$ 25,290,000$ $726.93 316.41$ 2018 -$ 24,070,000$ -$ 24,070,000$ $680.02 301.15$ 2019 -$ 22,795,000$ -$ 22,795,000$ $644.00 287.39$ 2020 -$ 21,455,000$ -$ 21,455,000$ $594.87 263.86$
Source: (a) City of Alameda (population)
$-
$5,000,000
$10,000,000
$15,000,000
$20,000,000
$25,000,000
$30,000,000
$35,000,000
$40,000,000
2011 2012 2013 2014 2015 2016 2017 2018 2019 2020
Fiscal Year
Total Debt
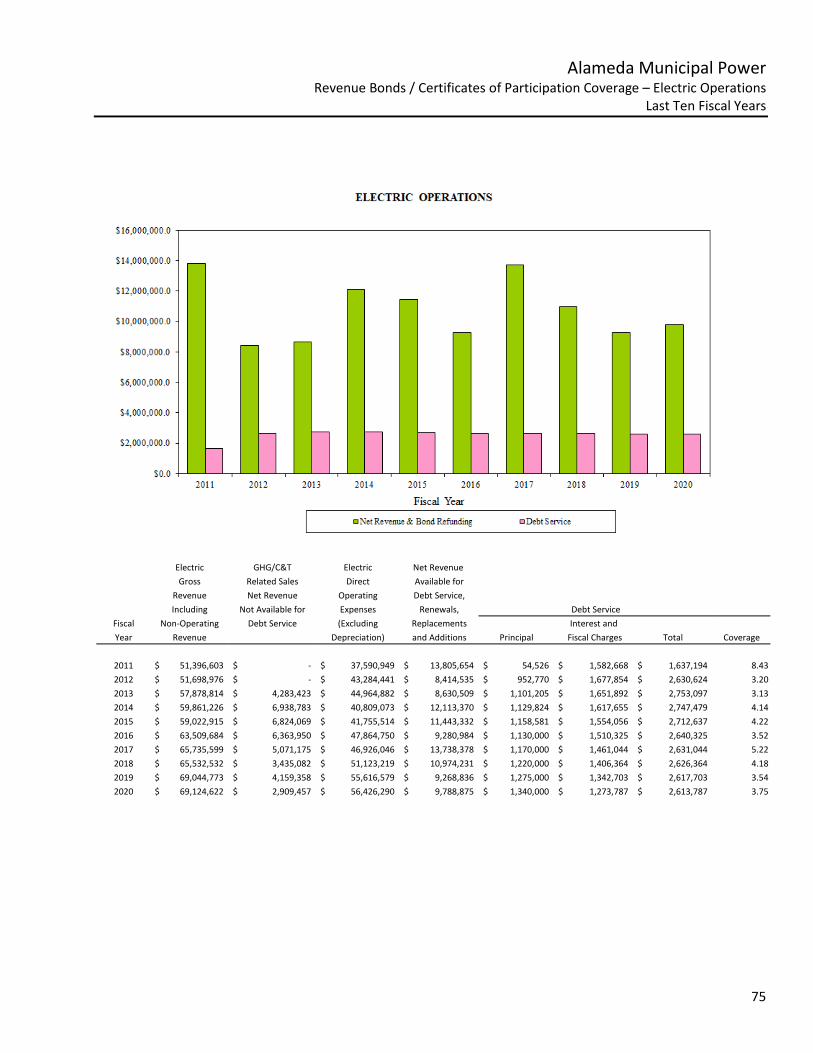
75
Alameda Municipal Power Revenue Bonds / Certificates of Participation Coverage – Electric Operations
Last Ten Fiscal Years
Electric GHG/C&T Electric Net Revenue Gross Related Sales Direct Available for
Revenue Net Revenue Operating Debt Service,Including Not Available for Expenses Renewals, Debt Service
Fiscal Non-Operating Debt Service (Excluding Replacements Interest andYear Revenue Depreciation) and Additions Principal Fiscal Charges Total Coverage
2011 51,396,603$ -$ 37,590,949$ 13,805,654$ 54,526$ 1,582,668$ 1,637,194$ 8.432012 51,698,976$ -$ 43,284,441$ 8,414,535$ 952,770$ 1,677,854$ 2,630,624$ 3.202013 57,878,814$ 4,283,423$ 44,964,882$ 8,630,509$ 1,101,205$ 1,651,892$ 2,753,097$ 3.132014 59,861,226$ 6,938,783$ 40,809,073$ 12,113,370$ 1,129,824$ 1,617,655$ 2,747,479$ 4.142015 59,022,915$ 6,824,069$ 41,755,514$ 11,443,332$ 1,158,581$ 1,554,056$ 2,712,637$ 4.222016 63,509,684$ 6,363,950$ 47,864,750$ 9,280,984$ 1,130,000$ 1,510,325$ 2,640,325$ 3.522017 65,735,599$ 5,071,175$ 46,926,046$ 13,738,378$ 1,170,000$ 1,461,044$ 2,631,044$ 5.222018 65,532,532$ 3,435,082$ 51,123,219$ 10,974,231$ 1,220,000$ 1,406,364$ 2,626,364$ 4.182019 69,044,773$ 4,159,358$ 55,616,579$ 9,268,836$ 1,275,000$ 1,342,703$ 2,617,703$ 3.542020 69,124,622$ 2,909,457$ 56,426,290$ 9,788,875$ 1,340,000$ 1,273,787$ 2,613,787$ 3.75

75
Alameda Municipal Power Certificates of Participation Coverage - Telecommunications
Last Ten Fiscal Years
Net RevenueGross Direct Available for
Revenue Operating Debt Service,Including Expenses Renewals, Debt Service
Fiscal Non-Operating (Excluding Replacements Interest andYear Revenue Depreciation) and Additions Principal Fiscal Charges Total Coverage
2011 2,013$ 2,272,937$ (2,270,924)$ -$ -$ -$ Not Applicable2012 1,060$ 814,557$ (813,497)$ -$ -$ -$ Not Applicable2013 892$ 247,336$ (246,444)$ -$ -$ -$ Not Applicable2014 815$ 515,127$ (514,312)$ -$ -$ -$ Not Applicable2015 1,020$ 137,271$ (136,251)$ -$ -$ -$ Not Applicable2016 9,977$ -$ 9,977$ 2,200,000$ -$ 2,200,000$ 0.002017 -$ -$ -$ -$ -$ -$ Not Applicable2018 -$ -$ -$ -$ -$ -$ Not Applicable2019 -$ -$ -$ -$ -$ -$ Not Applicable2020 -$ -$ -$ -$ -$ -$ Not Applicable
*Telecommunication operations was sold in November 2008. Sale proceed was used to pay debt principal.
($4,000,000)
($2,000,000)
$0
$2,000,000
$4,000,000
$6,000,000
$8,000,000
$10,000,000
$12,000,000
$14,000,000
$16,000,000
$18,000,000
$20,000,000
2011 2012 2013 2014 2015 2016 2017 2018 2019 2020
Fiscal Year
TELECOMMUNICATIONS OPERATIONS
Net Revenue Debt Service

76
Alameda Municipal Power Demographic and Economic Statistics
Last Ten Fiscal Years
Total Per Capita Unemployment Alameda CityFiscal City Personal Income Personal Rate County PopulationYear Population (In Thousands) Income % Population % of County
2011 74,081 3,035,929$ 40,981$ 7.4% 1,521,157 4.87%2012 74,640 2,763,776$ 36,962$ 6.5% 1,532,137 4.87%2013 75,126 2,824,097$ 37,591$ 6.2% 1,548,681 4.85%2014 76,413 3,406,033$ 44,574$ 7.6% 1,578,891 4.84%2015 75,961 3,092,904$ 40,717$ 5.1% 1,574,497 4.82%2016 79,277 3,207,096$ 40,454$ 4.1% 1,627,865 4.87%2017 79,928 3,423,524$ 42,833$ 3.6% 1,645,359 4.86%2018 79,928 3,529,109$ 44,154$ 3.3% 1,660,202 4.81%2019 79,316 3,695,508$ 46,592$ 2.8% 1,669,301 4.75%2020 81,312 3,828,228$ 47,080$ 2.6% 1,670,834 4.87%
Source: City of Alameda
4.68%4.70%4.72%4.74%4.76%4.78%4.80%4.82%4.84%4.86%4.88%4.90%
City Population as a % of County Population
$- $500,000
$1,000,000 $1,500,000 $2,000,000 $2,500,000 $3,000,000 $3,500,000 $4,000,000 $4,500,000
In 000's
Total Personal Income
$- $5,000
$10,000 $15,000 $20,000 $25,000 $30,000 $35,000 $40,000 $45,000 $50,000
Per Capita Personal Income
0.00%1.00%2.00%3.00%4.00%5.00%6.00%7.00%8.00%
Unemployment Rate %

77
Alameda Municipal Power Top Ten Customers and City’s Principal Employers
Year Ended June 30, 2020
2020 Percent of Percent of System System
No. Customer Type of Business KWHS Total Revenues Total
1 U.S. Coast Guard Regulation, Admin. of Transportation 19,497,715 9.63% 3,051,091$ 8.17%2 City Of Alameda Local Government 8,673,012 4.28% 1,671,876$ 4.48%3 Maritime Administration Regulation, Admin. of Transportation 6,487,408 3.21% 1,067,680$ 2.86%4 Penumbra, Inc. Medical Devices Developer/Manufacturer 5,664,304 2.80% 950,001$ 2.54%5 Safeway Inc. Grocery Retailer 5,488,920 2.71% 876,302$ 2.35%6 Alameda Unified School District Public School District 5,334,073 2.64% 974,838$ 2.61%
7 G&I IX Marina Village Office Park Real Estate Management 5,027,670 2.48% 927,326$ 2.48%8 City of San Leandro Health Care Hospital, Medical and Emergency Services 4,366,599 2.16% 734,483$ 1.97%9 Peets Coffee & Tea Coffee Roaster and Retailer 4,295,120 2.12% 736,549$ 1.97%
10 Alameda Commercial Properties Real Estate Management 4,284,000 2.12% 830,168$ 2.22% Top 10 Customers KWHS 69,118,821 34.15% 11,820,314$ 31.65%
Total Kilowatt Hour Sales 202,405,690 100% 37,342,828$ 100%
FY2009-10Percentage Percentage
No. Business Name Number of % of Total City Number of % of Total CityEmployees Rank Population Employees Rank Population
1 Penumbra 1,839 1 2.32%2 Alameda Unified School District 1,025 2 1.29% 1,068 5 1.37%3 Allegis Group Services, Inc 950 3 1.20%7 Alameda Hospital 754 4 0.95% 492 8 0.63%4 Oakland Raiders 694 5 0.87%6 Abbott Diabetes Care 600 6 0.76%5 City of Alameda 533 6 0.67% 620 6 0.80%8 Kaiser Foundation Health Plan 425 8 0.54%9 U.S. Department of Transportation 400 9 0.50%10 Performance Contracting Inc 380 10 0.48%
UT Starcom Inc 2,400 1U.S. Coast Guard 2,200 2 2.83%Telecare Corp 2,100 3Wind River Systems 1,673 4 2.15%Celera Diagnostics LLC 551 7 0.71%Bay Ship and Yacht 250 9 0.32%Bay View Nursing &Rehab Center 180 9 0.23%
Subtotal 7,600 9.58% 11,534 14.82%
Total City Day Population 79,316 77,838
Source: City of Alameda Community Development Department and City of Alameda Business License Records
FY2018-19
Principal Employers
Top 10 Customers
Last Fiscal Year and Nine Years Ago
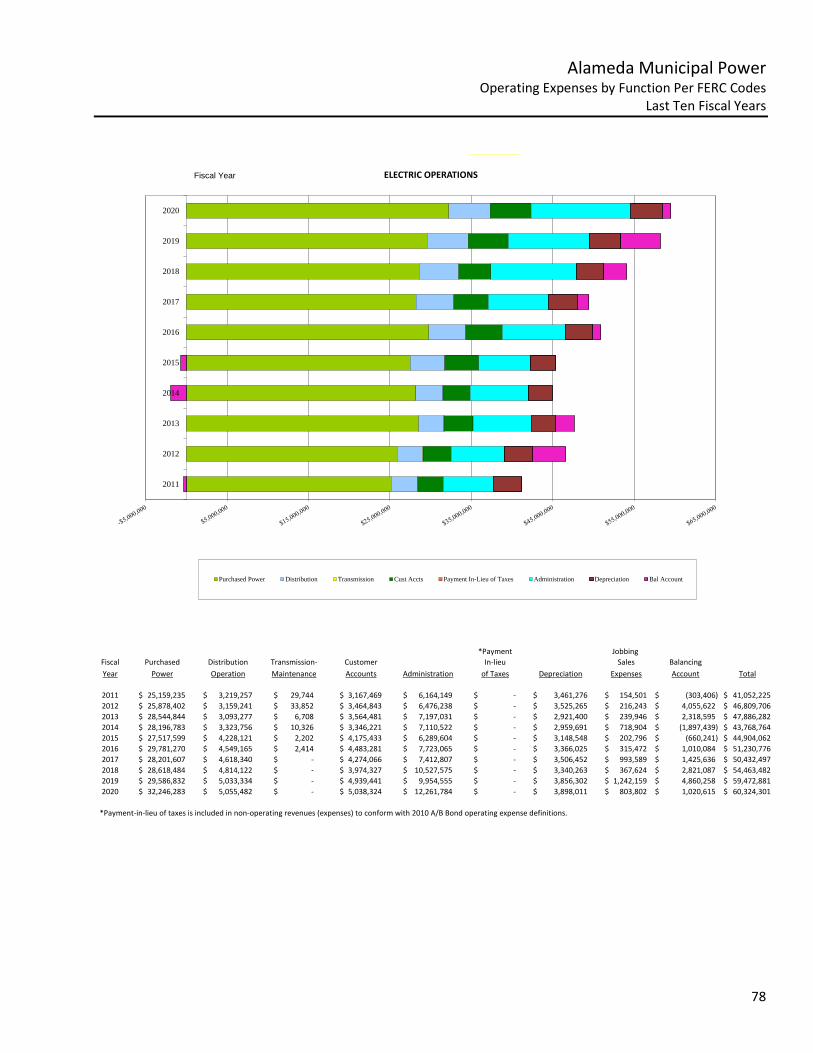
78
Alameda Municipal Power Operating Expenses by Function Per FERC Codes
Last Ten Fiscal Years
2,017
*Payment Jobbing Fiscal Purchased Distribution Transmission- Customer In-lieu Sales BalancingYear Power Operation Maintenance Accounts Administration of Taxes Depreciation Expenses Account Total
2011 25,159,235$ 3,219,257$ 29,744$ 3,167,469$ 6,164,149$ -$ 3,461,276$ 154,501$ (303,406)$ 41,052,225$ 2012 25,878,402$ 3,159,241$ 33,852$ 3,464,843$ 6,476,238$ -$ 3,525,265$ 216,243$ 4,055,622$ 46,809,706$ 2013 28,544,844$ 3,093,277$ 6,708$ 3,564,481$ 7,197,031$ -$ 2,921,400$ 239,946$ 2,318,595$ 47,886,282$ 2014 28,196,783$ 3,323,756$ 10,326$ 3,346,221$ 7,110,522$ -$ 2,959,691$ 718,904$ (1,897,439)$ 43,768,764$ 2015 27,517,599$ 4,228,121$ 2,202$ 4,175,433$ 6,289,604$ -$ 3,148,548$ 202,796$ (660,241)$ 44,904,062$ 2016 29,781,270$ 4,549,165$ 2,414$ 4,483,281$ 7,723,065$ -$ 3,366,025$ 315,472$ 1,010,084$ 51,230,776$ 2017 28,201,607$ 4,618,340$ -$ 4,274,066$ 7,412,807$ -$ 3,506,452$ 993,589$ 1,425,636$ 50,432,497$ 2018 28,618,484$ 4,814,122$ -$ 3,974,327$ 10,527,575$ -$ 3,340,263$ 367,624$ 2,821,087$ 54,463,482$ 2019 29,586,832$ 5,033,334$ -$ 4,939,441$ 9,954,555$ -$ 3,856,302$ 1,242,159$ 4,860,258$ 59,472,881$ 2020 32,246,283$ 5,055,482$ -$ 5,038,324$ 12,261,784$ -$ 3,898,011$ 803,802$ 1,020,615$ 60,324,301$
*Payment-in-lieu of taxes is included in non-operating revenues (expenses) to conform with 2010 A/B Bond operating expense definitions.
2011
2012
2013
2014
2015
2016
2017
2018
2019
2020
Fiscal Year ELECTRIC OPERATIONS
Purchased Power Distribution Transmission Cust Accts Payment In-Lieu of Taxes Administration Depreciation Bal Account
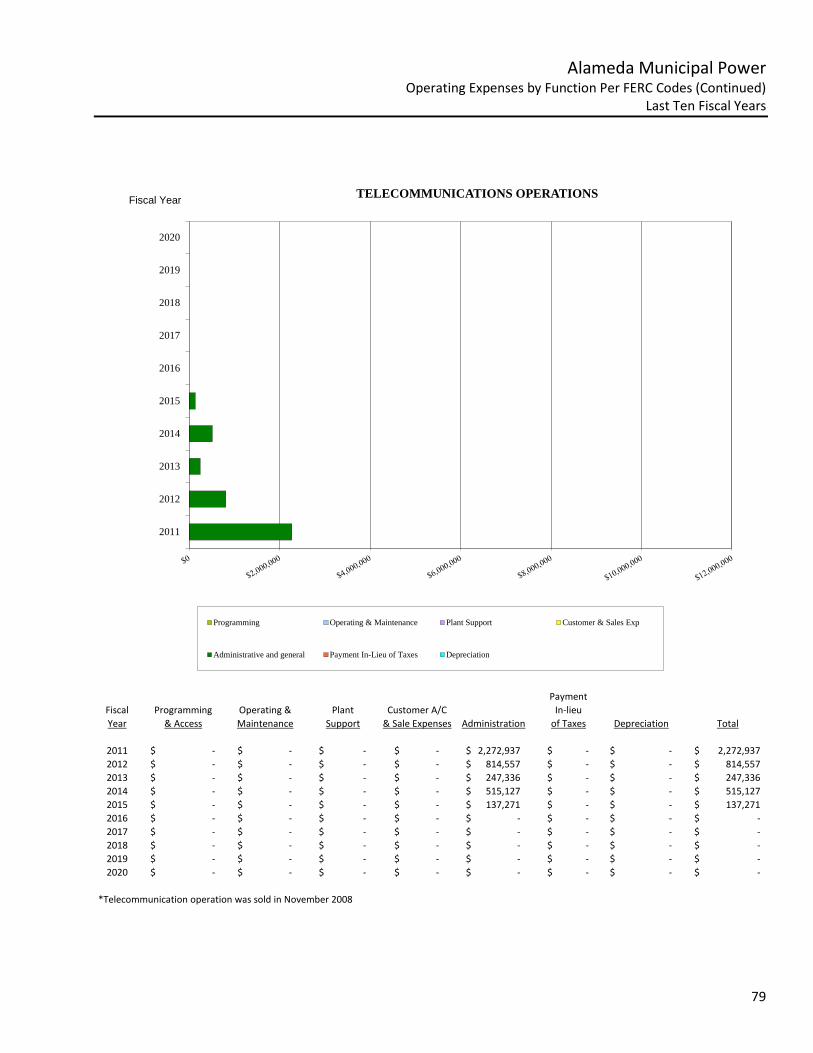
79
Alameda Municipal Power Operating Expenses by Function Per FERC Codes (Continued)
Last Ten Fiscal Years
PaymentFiscal Programming Operating & Plant Customer A/C In-lieuYear & Access Maintenance Support & Sale Expenses Administration of Taxes Depreciation Total
2011 -$ -$ -$ -$ 2,272,937$ -$ -$ 2,272,937$ 2012 -$ -$ -$ -$ 814,557$ -$ -$ 814,557$ 2013 -$ -$ -$ -$ 247,336$ -$ -$ 247,336$ 2014 -$ -$ -$ -$ 515,127$ -$ -$ 515,127$ 2015 -$ -$ -$ -$ 137,271$ -$ -$ 137,271$ 2016 -$ -$ -$ -$ -$ -$ -$ -$ 2017 -$ -$ -$ -$ -$ -$ -$ -$ 2018 -$ -$ -$ -$ -$ -$ -$ -$ 2019 -$ -$ -$ -$ -$ -$ -$ -$ 2020 -$ -$ -$ -$ -$ -$ -$ -$
*Telecommunication operation was sold in November 2008
Operations Imitated in July 2000
2011
2012
2013
2014
2015
2016
2017
2018
2019
2020
Fiscal Year TELECOMMUNICATIONS OPERATIONS
Programming Operating & Maintenance Plant Support Customer & Sales Exp
Administrative and general Payment In-Lieu of Taxes Depreciation

80
Alameda Municipal Power Capital Asset Statistics by Function / Program
Last Ten Fiscal Years
NetService Less: Electric
Fiscal Center Land, Rights Machinery Transportation Computer Furniture Construction Accumulated CapitalYear Plant Building & Easements & Equipment Equipment Equipment & Fixtures in Progress Depreciation Assets
2011 70,314,925$ 7,843,636$ 339,144$ 8,739,161$ 2,593,727$ 3,256,643$ 599,107$ 1,719,491$ (56,419,296)$ 38,986,538$ 2012 71,900,364$ 7,843,636$ 339,143$ 8,915,622$ 2,738,514$ 3,288,430$ 606,182$ 1,501,292$ (59,916,840)$ 37,216,343$ 2013 73,322,303$ 7,843,636$ 339,143$ 9,074,538$ 2,738,514$ 3,320,906$ 629,213$ 1,877,849$ (62,829,423)$ 36,316,679$ 2014 79,142,909$ 7,843,636$ 339,143$ 9,153,503$ 2,867,266$ 3,455,613$ 829,333$ 45,897$ (65,426,161)$ 38,251,139$ 2015 79,286,684$ 7,843,636$ 339,143$ 9,197,186$ 3,050,605$ 3,654,987$ 833,207$ 4,518,743$ (68,536,089)$ 40,188,102$ 2016 84,548,411$ 7,850,886$ 339,143$ 9,439,316$ 3,048,241$ 3,832,459$ 835,790$ 1,736,459$ (71,425,024)$ 40,205,681$ 2017 84,654,592$ 8,071,667$ 339,143$ 9,510,378$ 3,240,418$ 4,158,116$ 835,790$ 6,452,324$ (74,534,854)$ 42,727,575$ 2018 86,123,810$ 8,130,625$ 339,143$ 9,620,376$ 3,318,156$ 4,168,912$ 899,922$ 2,872,673$ (74,267,672)$ 41,205,945$ 2019 86,915,116$ 8,168,069$ 220,143$ 9,725,953$ 3,402,639$ 4,377,329$ 899,922$ 3,862,220$ (77,856,842)$ 39,714,550$ 2020 87,421,782$ 8,168,069$ 220,143$ 9,725,953$ 3,405,737$ 4,683,748$ 923,119$ 5,198,491$ (81,362,299)$ 38,384,743$
ELECTRIC OPERATIONS

81
Alameda Municipal Power Operation Indicators Last Ten Fiscal Years
Energy By SourceLast Ten Fiscal Years
Fiscal Year Other Purchases (Sales)Calaveras
HydroWestern
HydroLandfill Projects High Winds
Combustion Turbines
Graeagle Hydro Geothermal
y Power
(Morgan Stanley prior
to 2018) Total
2011 -10.27% 20.61% 9.06% 21.08% 5.62% 0.64% 0.70% 36.19% 16.37% 100.00%
2012 -3.67% 12.09% 9.96% 21.53% 4.75% 0.13% 0.67% 37.63% 16.91% 100.00%
2013 33.51% 7.03% 9.00% 16.71% 4.46% 0.15% 0.52% 11.41% 17.21% 100.00%
2014 50.61% 5.39% 6.68% 14.32% 4.71% 0.28% 0.43% 0.00% 17.58% 100.00%
2015 59.11% 4.62% 5.70% 14.74% 5.83% 0.39% 0.39% 0.00% 9.22% 100.00%
2016 63.57% 10.91% 7.05% 12.07% 5.44% 0.40% 0.55% 0.00% 0.00% 100.00%
2017 38.52% 25.67% 16.00% 12.29% 5.71% 1.03% 0.77% 0.00% 0.00% 100.00%
2018 52.13% 13.98% 10.41% 11.68% 5.54% 1.42% 0.80% 4.03% 0.00% 100.00%
2019 37.00% 24.22% 11.97% 8.52% 5.88% 1.50% 0.58% 10.32% 0.00% 100.00%
2020 21.80% 12.80% 16.40% 14.90% 5.30% 0.90% 0.70% 16.90% 10.30% 100.00%
26.8%
14.9%12.8%
11.3%
5.3%
0.7% 0.9%
16.8%
10.3%
0
0.05
0.1
0.15
0.2
0.25
0.3 ENERGY BY SOURCE - FY 2020

82
Alameda Municipal Power Operation Indicators (Continued)
Last Ten Fiscal Years
Fiscal Year 2011 2012 2013 2014 2015 2016 2017 2018 2019 2020
Since: 1887 1887 1887 1887 1887 1887 1887 1887 1887 1887Budgeted Employees 91 91 90 94 93 98 98 97 94 92Vehicles in Service 40 40 40 40 39 46 46 46 45 42Service Area (Miles) 22.80 22.80 22.80 22.80 22.80 22.80 22.80 22.80 22.80 22.80Transmission Lines (115kV) Overhead Pole Miles 6.77 6.77 6.80 6.77 6.77 6.77 6.77 6.77 6.77 6.77 Underground Circuit Miles 1.93 1.93 1.90 1.93 1.93 1.93 1.93 1.93 1.93 1.93Distribution Lines (12kV) Overhead Pole Miles 86.11 86.08 86.10 86.08 86.10 86.08 86.08 86.10 86.10 86.10 Underground Circuit Miles 171.76 172.93 172.50 174.01 176.40 177.17 178.06 179.00 179.00 185.70Street Lights (excluding inactivated lights) 5,584 5,593 5,315 5,372 5,441 5,470 5,470 6,415 - -
(1) Street Lights were transferred to the City of Alameda in FY2018 per Voter approval in November 2016

83
Alameda Municipal Power Days Cash on Hand
Last Ten Fiscal Years
Fiscal Year Actual Budget
2011 237 215
2012 222 195
2013 213 173
2014 168 167
2015 252 214
2016 236 235
2017 206 230
2018 233 208
2019 278 197
2020 307 186

84
February 25, 2021
Subject: Bond Disclosure Information
We are pleased to provide bond disclosure information for Alameda Municipal Power (AMP), an enterprise fund and department of the City of Alameda, California. The information presented is for AMP’s five (5) most recent fiscal years, which includes those ended June 30, 2020, 2019, 2018, 2017, and 2016. AMP believes that the data presented here is accurate in all material respects, that the data is presented in a manner designed to set forth fairly the financial position of the organization and that all disclosures necessary to gain an understanding of the financial activity of AMP are included in this report.
This Bond Disclosure Section is provided to fulfill requirements for an Annual Financial Report, and other information, as required by the:
Continuing Disclosure Certificates for the Alameda Public Financing Authority, Revenue Bonds, Series 2010A/B (Alameda Municipal Power Refinancing).
Continuing Disclosure Certificates obligation for the Bureau of Electricity/City of Alameda with respect to the Northern California Power Agency’s revenue bonds:
Geothermal-2009 Series A due 7/1/2024 (1) Hydroelectric-2008 Refunding Series A due 7/1/2032 Hydroelectric-2008 Refunding Series B due 7/1/2021 Hydroelectric-2012 Refunding Series A due 7/1/ 2032 Hydroelectric-2012 Refunding Series B due 7/1/ 2025 Hydroelectric-2018 Refunding Series A/B due 7/1/2025 Hydroelectric-2019 Refunding Series A due 7/1/2023
Capital Facilities-2010 Refunding Series A due 8/1/2025 (2) Capital Facilities-2019 Refunding Series A due 8/1/2025
(1) Geothermal 2009 Series A call notice issued 5/29/2019 and redeemed 7/1/2019 (2) Capital Facilities 2010A refunding bonds were Defeased by the Capital Facilities 2019A bonds and redeemed February
1, 2020

85
Annual Financial Report
This Bond Disclosure Section, included within AMP’s Comprehensive Annual Financial Report (CAFR) for Fiscal Years Ended 2020 and 2019, provides the most recent information required by the Continuing Disclosure Certificates (the Certificates). The CAFR, in turn, will be filed with the appropriate Dissemination Agent(s) for transmittal to the repositories in accordance with the requirements of the Certificates. The Annual Financial Report is incorporated into the CAFR and includes by reference the audited financial statements of AMP for the prior fiscal year.
This Bond Disclosure Section incorporated into this fiscal year’s CAFR, also contains the following information required by the Certificates:
1. Updated information comparable to the information in the table entitled “City of Alameda,Alameda Municipal Power, Power Supply Resources”;
2. Updated information comparable to the information in the table entitled “City of Alameda,Alameda Municipal Power, Electric Rate Changes”;
3. Updated information comparable to the information in the table entitled “City of Alameda,Alameda Municipal Power, Electric Customers, Sales, Revenues and Demand”; and,
4. Updated information comparable to the information in the table entitled “City of Alameda,Alameda Municipal Power, Condensed Operating Results and Selected Balance SheetInformation”.
Reporting of Significant Events
As of June 30, 2020, none of the events listed in Section 5 of the Certificates have occurred for the Series 2010 A/B bonds issued by the Alameda Public Financing Authority. As of June 30, 2020, Alameda Municipal Power has no knowledge of any impending significant event that would require disclosure under the provisions of the Certificates.
Additional Information
Senate Bill (SB) 1X 2 requires that load serving entities like AMP maintain their percentage of eligible renewable power used to supply their retail end-use customers at no less than an average of 20% for the calendar years (CY) 2011 through 2015, and gradually increasing to 33 percent for 2020. In January 2016 AMP’s Public Utilities Board (Board) approved a revised RPS Policy that is consistent with that of the State for the years 2014 through 2020. Additionally, the Board approved a Renewable Energy Sales and Use of Resulting Revenues Policy that allows AMP to sell any eligible renewable power through 2019 not required to comply with AMP’s RPS. The resulting revenues from these sales are used to support initiatives to reduce Green House Gas (GHG) emissions associated with electricity use by AMP’s customers.
Since then, more stringent requirements have been adopted in addition to SB X1 2 requirements. In October 2015, SB 350 was signed into law mandating a 33 percent RPS target by 2020 and 50 percent by 2030. In September 2018, SB 100 was signed into law, further accelerating the RPS targets to 50 percent by 2026 and 60 percent by 2030. Starting January 2020, the Board approved and committed to supplying AMP’s customers with 100% Carbon-Free Energy and adopted a revised RPS Plan in November 2020 to align with the State’s current RPS requirements.
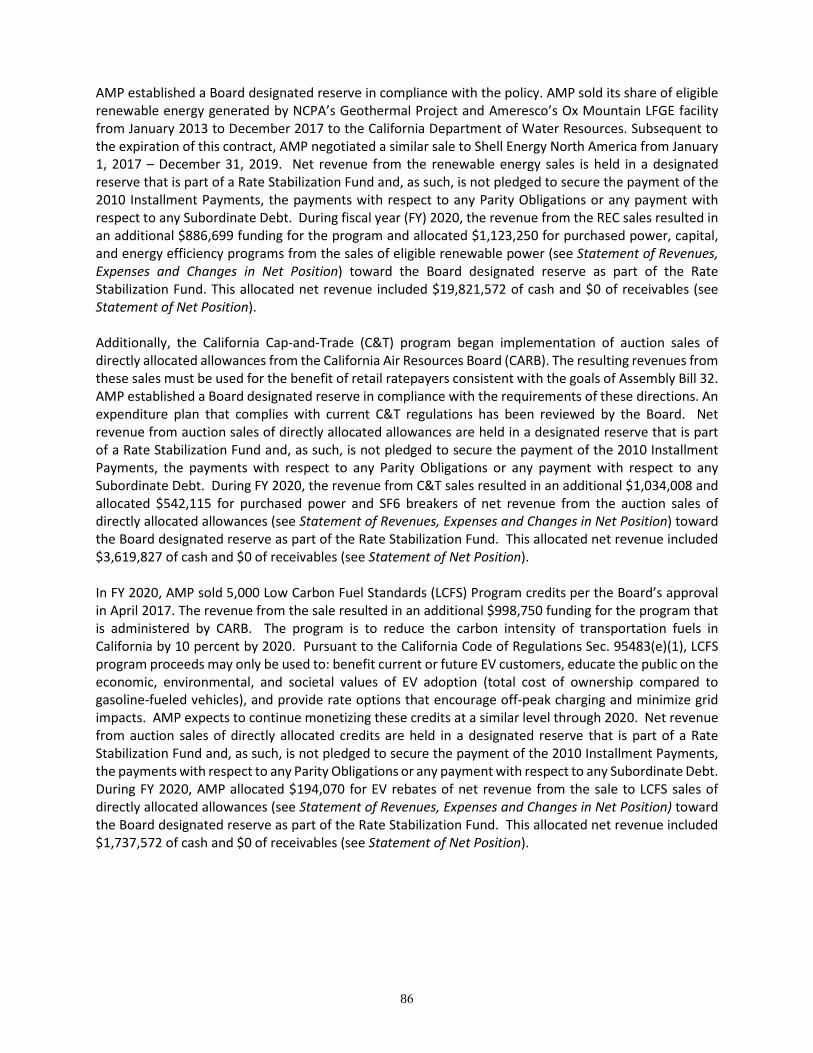
86
AMP established a Board designated reserve in compliance with the policy. AMP sold its share of eligible renewable energy generated by NCPA’s Geothermal Project and Ameresco’s Ox Mountain LFGE facility from January 2013 to December 2017 to the California Department of Water Resources. Subsequent to the expiration of this contract, AMP negotiated a similar sale to Shell Energy North America from January 1, 2017 – December 31, 2019. Net revenue from the renewable energy sales is held in a designated reserve that is part of a Rate Stabilization Fund and, as such, is not pledged to secure the payment of the 2010 Installment Payments, the payments with respect to any Parity Obligations or any payment with respect to any Subordinate Debt. During fiscal year (FY) 2020, the revenue from the REC sales resulted in an additional $886,699 funding for the program and allocated $1,123,250 for purchased power, capital, and energy efficiency programs from the sales of eligible renewable power (see Statement of Revenues, Expenses and Changes in Net Position) toward the Board designated reserve as part of the Rate Stabilization Fund. This allocated net revenue included $19,821,572 of cash and $0 of receivables (see Statement of Net Position).
Additionally, the California Cap-and-Trade (C&T) program began implementation of auction sales of directly allocated allowances from the California Air Resources Board (CARB). The resulting revenues from these sales must be used for the benefit of retail ratepayers consistent with the goals of Assembly Bill 32. AMP established a Board designated reserve in compliance with the requirements of these directions. An expenditure plan that complies with current C&T regulations has been reviewed by the Board. Net revenue from auction sales of directly allocated allowances are held in a designated reserve that is part of a Rate Stabilization Fund and, as such, is not pledged to secure the payment of the 2010 Installment Payments, the payments with respect to any Parity Obligations or any payment with respect to any Subordinate Debt. During FY 2020, the revenue from C&T sales resulted in an additional $1,034,008 and allocated $542,115 for purchased power and SF6 breakers of net revenue from the auction sales of directly allocated allowances (see Statement of Revenues, Expenses and Changes in Net Position) toward the Board designated reserve as part of the Rate Stabilization Fund. This allocated net revenue included $3,619,827 of cash and $0 of receivables (see Statement of Net Position).
In FY 2020, AMP sold 5,000 Low Carbon Fuel Standards (LCFS) Program credits per the Board’s approval in April 2017. The revenue from the sale resulted in an additional $998,750 funding for the program that is administered by CARB. The program is to reduce the carbon intensity of transportation fuels in California by 10 percent by 2020. Pursuant to the California Code of Regulations Sec. 95483(e)(1), LCFS program proceeds may only be used to: benefit current or future EV customers, educate the public on the economic, environmental, and societal values of EV adoption (total cost of ownership compared to gasoline-fueled vehicles), and provide rate options that encourage off-peak charging and minimize grid impacts. AMP expects to continue monetizing these credits at a similar level through 2020. Net revenue from auction sales of directly allocated credits are held in a designated reserve that is part of a Rate Stabilization Fund and, as such, is not pledged to secure the payment of the 2010 Installment Payments, the payments with respect to any Parity Obligations or any payment with respect to any Subordinate Debt. During FY 2020, AMP allocated $194,070 for EV rebates of net revenue from the sale to LCFS sales of directly allocated allowances (see Statement of Revenues, Expenses and Changes in Net Position) toward the Board designated reserve as part of the Rate Stabilization Fund. This allocated net revenue included $1,737,572 of cash and $0 of receivables (see Statement of Net Position).
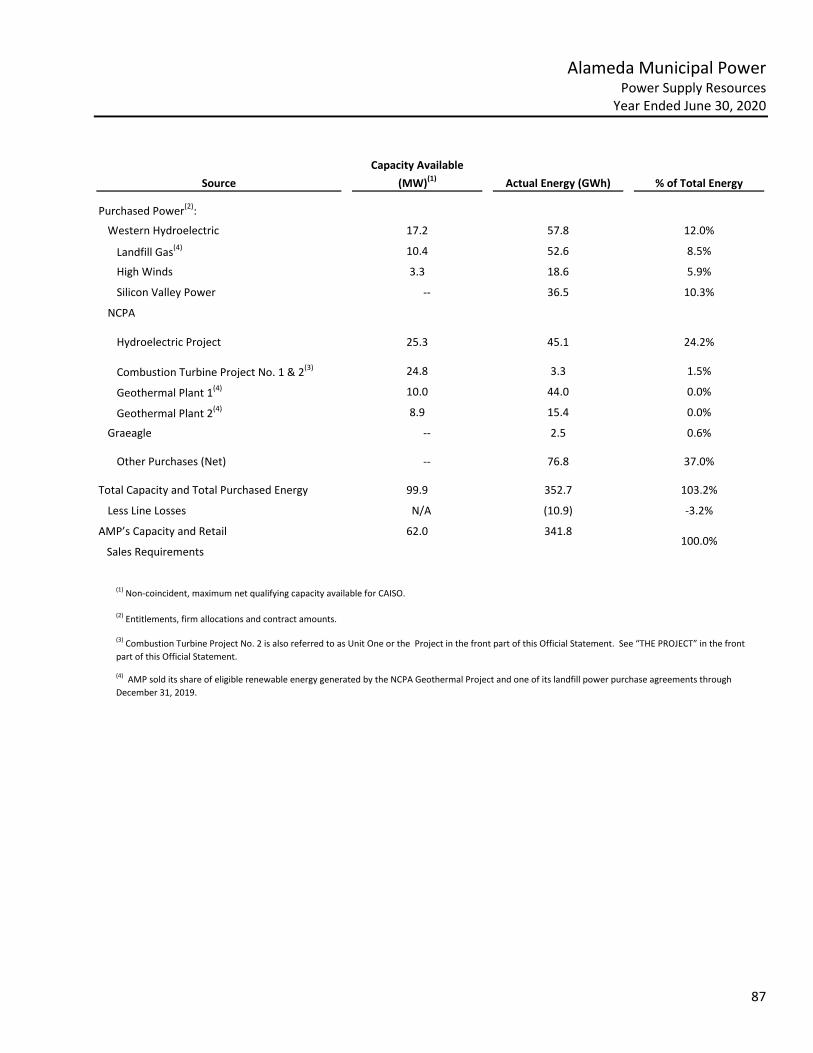
87
Alameda Municipal Power Power Supply Resources
Year Ended June 30, 2020
SourceCapacity Available
(MW)(1) Actual Energy (GWh) % of Total Energy
Purchased Power(2):
Western Hydroelectric 17.2 57.8 12.0%
Landfill Gas(4) 10.4 52.6 8.5%
High Winds 3.3 18.6 5.9%
Silicon Valley Power -- 36.5 10.3%
NCPA
Hydroelectric Project 25.3 45.1 24.2%
Combustion Turbine Project No. 1 & 2(3) 24.8 3.3 1.5%
Geothermal Plant 1(4) 10.0 44.0 0.0%
Geothermal Plant 2(4) 8.9 15.4 0.0%
Graeagle -- 2.5 0.6%
Other Purchases (Net) -- 76.8 37.0%
Total Capacity and Total Purchased Energy 99.9 352.7 103.2%
Less Line Losses N/A (10.9) -3.2%
AMP’s Capacity and Retail 62.0 341.8
Sales Requirements
(3) Combustion Turbine Project No. 2 is also referred to as Unit One or the Project in the front part of this Official Statement. See “THE PROJECT” in the front part of this Official Statement.
(4) AMP sold its share of eligible renewable energy generated by the NCPA Geothermal Project and one of its landfill power purchase agreements through December 31, 2019.
(2) Entitlements, firm allocations and contract amounts.
(1) Non-coincident, maximum net qualifying capacity available for CAISO.
100.0%
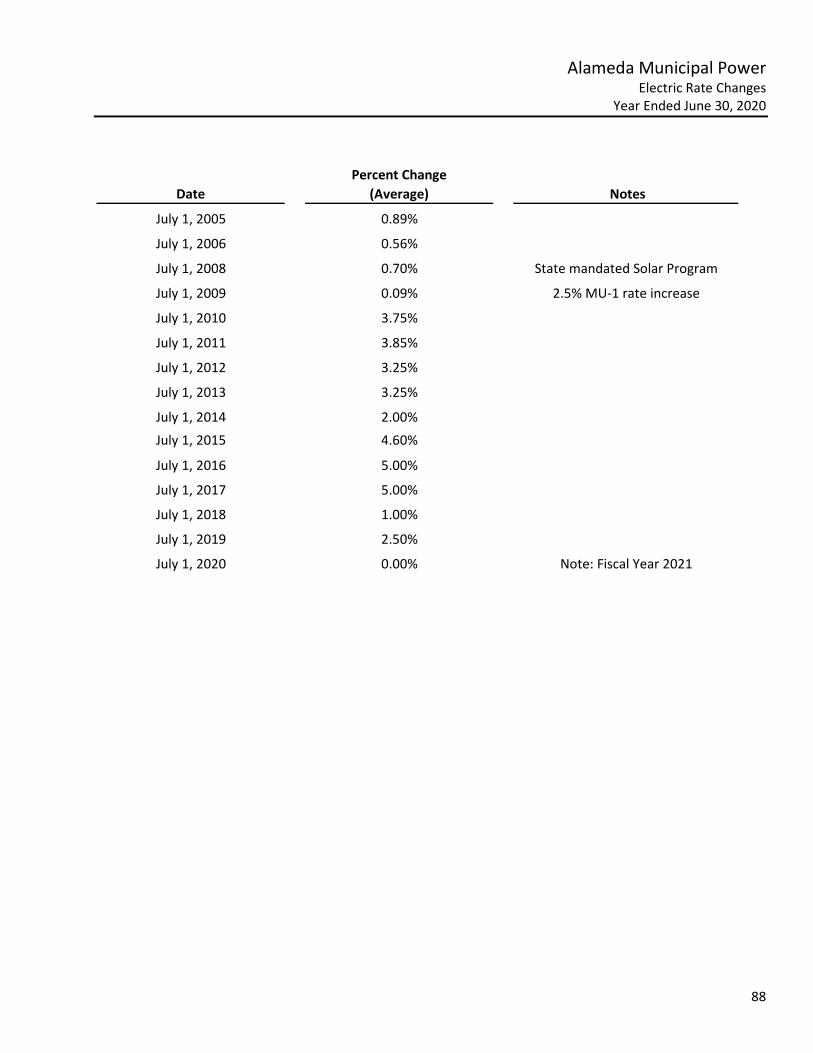
88
Alameda Municipal Power Electric Rate Changes
Year Ended June 30, 2020
DatePercent Change
(Average) Notes
July 1, 2005 0.89%
July 1, 2006 0.56%
July 1, 2008 0.70% State mandated Solar Program
July 1, 2009 0.09% 2.5% MU-1 rate increase
July 1, 2010 3.75%
July 1, 2011 3.85%
July 1, 2012 3.25%
July 1, 2013 3.25%
July 1, 2014 2.00%July 1, 2015 4.60%
July 1, 2016 5.00%
July 1, 2017 5.00%
July 1, 2018 1.00%
July 1, 2019 2.50%
July 1, 2020 0.00% Note: Fiscal Year 2021

89
Alameda Municipal Power Electric Customers, Sales, Revenues and Demand
Year Ended June 30, 2020
Description 2016 2017 2018 2019 2020Number of Customers Accounts:
Residential 30,377 30,495 30,625 31,201 31,822Commercial 3,735 3,764 3,778 3,808 3,852Industrial 8 12 12 8 8Public Authority 363 362 363 358 361Other 11 15 12 21 24
Total Customers 34,494 34,648 34,790 35,396 36,067
Kilowatt Hour Sales:Residential 125,831,929 126,850,402 124,589,523 125,510,907 129,591,566Commercial 176,575,883 172,520,353 168,873,305 164,807,447 166,745,235Industrial 31,490,040 30,127,960 28,321,180 28,712,440 31,301,090Public Authority 12,375,517 11,428,198 10,723,565 11,064,277 11,539,236Other 2,546,494 2,838,825 2,518,330 2,324,054 2,605,615
Total kWh sales 348,819,863 343,765,738 335,025,903 332,419,125 341,782,742
Revenues from Sale of Energy:Residential $ 19,869,104 $ 21,510,126 $ 23,902,788 $ 24,414,010 $ 25,933,443 Commercial 27,071,358 27,177,335 28,500,186 28,354,299 29,341,107Industrial 4,278,240 4,366,885 4,338,898 4,580,711 5,069,275Public Authority 1,973,689 1,958,154 1,965,664 2,225,142 2,238,296Other 1,028,631 913,247 793,870 1,453,471 149,514
Total Revenues from Sale of Energy $ 54,221,022 $ 55,925,747 $ 59,501,406 $ 61,027,633 $ 62,731,635
Peak Demand (kW) 64,283 63,738 59,624 62,131 61,990
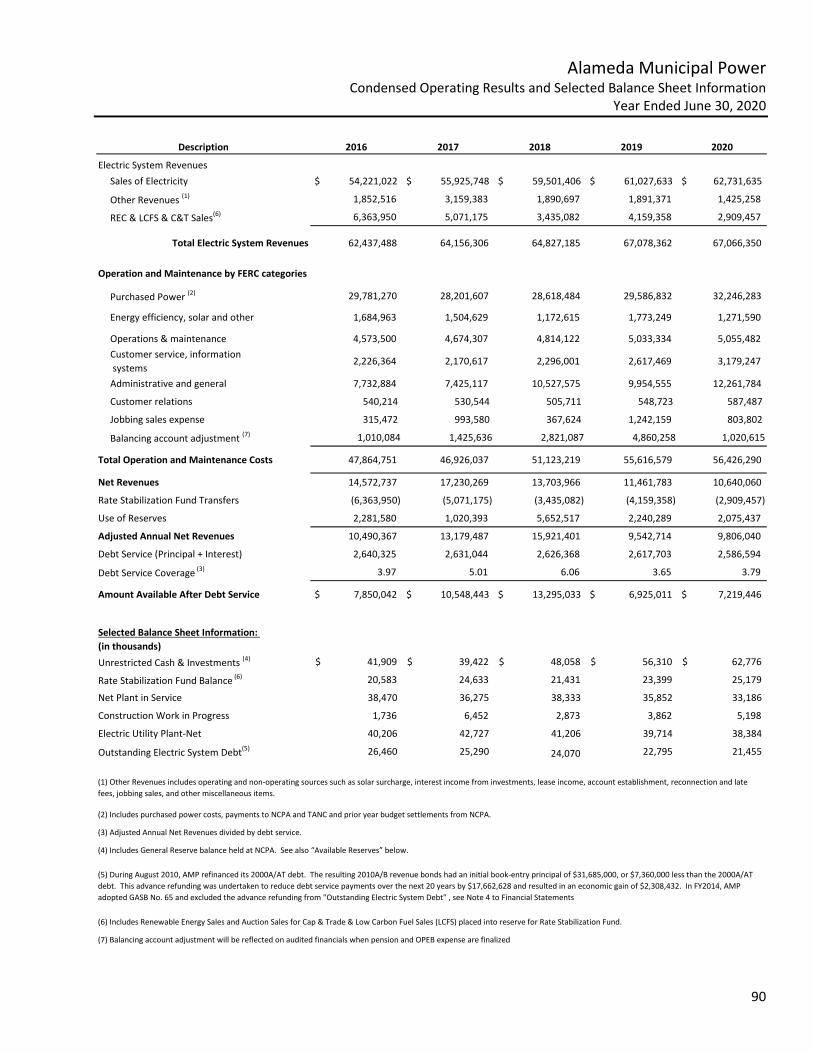
90
Alameda Municipal Power Condensed Operating Results and Selected Balance Sheet Information
Year Ended June 30, 2020
Description 2016 2017 2018 2019 2020
Electric System Revenues Sales of Electricity $ 54,221,022 $ 55,925,748 $ 59,501,406 $ 61,027,633 $ 62,731,635
Other Revenues (1) 1,852,516 3,159,383 1,890,697 1,891,371 1,425,258
REC & LCFS & C&T Sales(6) 6,363,950 5,071,175 3,435,082 4,159,358 2,909,457
Total Electric System Revenues 62,437,488 64,156,306 64,827,185 67,078,362 67,066,350
Operation and Maintenance by FERC categories
Purchased Power (2) 29,781,270 28,201,607 28,618,484 29,586,832 32,246,283
Energy efficiency, solar and other 1,684,963 1,504,629 1,172,615 1,773,249 1,271,590
Operations & maintenance 4,573,500 4,674,307 4,814,122 5,033,334 5,055,482 Customer service, information systems
2,226,364 2,170,617 2,296,001 2,617,469 3,179,247
Administrative and general 7,732,884 7,425,117 10,527,575 9,954,555 12,261,784
Customer relations 540,214 530,544 505,711 548,723 587,487
Jobbing sales expense 315,472 993,580 367,624 1,242,159 803,802
Balancing account adjustment (7) 1,010,084 1,425,636 2,821,087 4,860,258 1,020,615
Total Operation and Maintenance Costs 47,864,751 46,926,037 51,123,219 55,616,579 56,426,290
Net Revenues 14,572,737 17,230,269 13,703,966 11,461,783 10,640,060
Rate Stabilization Fund Transfers (6,363,950) (5,071,175) (3,435,082) (4,159,358) (2,909,457)
Use of Reserves 2,281,580 1,020,393 5,652,517 2,240,289 2,075,437
Adjusted Annual Net Revenues 10,490,367 13,179,487 15,921,401 9,542,714 9,806,040
Debt Service (Principal + Interest) 2,640,325 2,631,044 2,626,368 2,617,703 2,586,594
Debt Service Coverage (3) 3.97 5.01 6.06 3.65 3.79
Amount Available After Debt Service $ 7,850,042 $ 10,548,443 $ 13,295,033 $ 6,925,011 $ 7,219,446
Selected Balance Sheet Information: (in thousands)Unrestricted Cash & Investments (4) 41,909$ 39,422$ 48,058$ 56,310$ 62,776$
Rate Stabilization Fund Balance (6) 20,583 24,633 21,431 23,399 25,179
Net Plant in Service 38,470 36,275 38,333 35,852 33,186
Construction Work in Progress 1,736 6,452 2,873 3,862 5,198
Electric Utility Plant-Net 40,206 42,727 41,206 39,714 38,384
Outstanding Electric System Debt(5) 26,460 25,290 24,070 22,795 21,455
(7) Balancing account adjustment will be reflected on audited financials when pension and OPEB expense are finalized
(5) During August 2010, AMP refinanced its 2000A/AT debt. The resulting 2010A/B revenue bonds had an initial book-entry principal of $31,685,000, or $7,360,000 less than the 2000A/ATdebt. This advance refunding was undertaken to reduce debt service payments over the next 20 years by $17,662,628 and resulted in an economic gain of $2,308,432. In FY2014, AMP adopted GASB No. 65 and excluded the advance refunding from "Outstanding Electric System Debt" , see Note 4 to Financial Statements
(1) Other Revenues includes operating and non-operating sources such as solar surcharge, interest income from investments, lease income, account establishment, reconnection and late fees, jobbing sales, and other miscellaneous items.
(2) Includes purchased power costs, payments to NCPA and TANC and prior year budget settlements from NCPA.
(3) Adjusted Annual Net Revenues divided by debt service.
(4) Includes General Reserve balance held at NCPA. See also “Available Reserves” below.
(6) Includes Renewable Energy Sales and Auction Sales for Cap & Trade & Low Carbon Fuel Sales (LCFS) placed into reserve for Rate Stabilization Fund.


![Method Statement Template[1] - Routesonline](https://static.fdocuments.us/doc/165x107/6156fb45a097e25c764faf6c/method-statement-template1-routesonline.jpg)


