Standard Analytical Protocol for Vibrio choleraeO1 and ...
56
EPA 600/R-10/139 | October 2010 | www.epa.gov/ord Standard Analytical Protocol for Vibrio cholerae O1 and O139 in Drinking Water and Surface Water Office of Research and Development National Homeland Security Research Center
Transcript of Standard Analytical Protocol for Vibrio choleraeO1 and ...

EPA 600/R-10/139 | October 2010 | www.epa.gov/ord
Standard Analytical Protocol for Vibrio cholerae O1 and O139 in Drinking Water and Surface Water
Office of Research and DevelopmentNational Homeland Security Research Center


Standard Analytical Protocol for Vibrio cholerae O1 and O139 in Drinking Water and Surface Water
Office of Research and DevelopmentNational Homeland Security Research Center

ii

iii
Acknowledgments
This Standard Analytical Protocol (SAP) is based on procedures evaluated by Scientific Methods, Inc. under direction of Sanjiv R. Shah at the National Homeland Security Research Center within the U.S. Environmental Protection Agency’s (EPA’s) Office of Research and Development for analysis of Vibrio cholerae O1 and O139 in water samples. Technical support and data evaluation were provided by Computer Sciences Corporation (CSC) under EPA Contract No. EP-C-05-045.
The contributions of the following persons and organizations are gratefully acknowledged:
Study Workgroup Participants • Cheryl Bopp, Michele Parsons (Centers for Disease Control and Prevention)• Michele Burgess, Marissa Mullins (EPA, Office of Emergency Management)• Rita Colwell, Anwar Huq (Maryland Pathogen Research Institute, University of Maryland)• Stephanie Harris (EPA, Region 10) • Malik Raynor (EPA, Office of Ground Water and Drinking Water)• Gene Rice (EPA, National Homeland Security Research Center)
Subject Matter Experts • Cheryl Bopp (Centers for Disease Control and Prevention) • Nancy Hall (University of Iowa Hygienic Laboratory)• Steve Weagant (U.S. Food and Drug Administration)
Volunteer Participant Laboratory • Fu-Chih Hsu, Rebecca Wong (Scientific Methods, Inc.)

iv
Disclaimer
This document has been reviewed in accordance with EPA policy and approved for publication but does not necessarily reflect the Agency’s views. Mention of trade names or commercial products does not constitute endorsement or recommendation for use. Neither the United States Government nor any of its employees, contractors, or their employees make any warranty, expressed or implied, or assume any legal liability or responsibility for any third party’s use of or the results of such use of any information, apparatus, product, or process discussed in this document, or represent that its use by such party would not infringe on privately owned rights.
The procedures described in this document are intended for use in laboratories when analyzing water samples in support of remediation efforts following a homeland security event. The culture-based procedures provide viability determination, identification, and either qualitative or quantitative results. The sample preparation procedures are deemed the most appropriate for the wide variety of water matrices to be examined. To the extent possible, these procedures were developed to be consistent with other federal agency procedures. These procedures do not include the sample collection, rapid screening, field techniques, or molecular techniques that may accompany analysis.
Questions concerning this document or its application should be addressed to:Sanjiv R. Shah
National Homeland Security Research Center
U.S. Environmental Protection Agency
1200 Pennsylvania Avenue, NW
USEPA-8801RR
Washington, DC 20460
(202) 564-9522
If you have difficulty assessing these PDF documents, please contact [email protected] or [email protected] for assistance.

v
Foreword
The mission of the U.S. Environmental Protection Agency (EPA) is to protect human health and to safeguard the natural environment – the air, water, and land upon which life depends. After the 2001 terrorist attacks including the anthrax bioterrorism event, the EPA’s mission was expanded to address critical needs related to homeland security. Presidential directives identified EPA as the primary federal agency responsible for the protection and decontamination of indoor-outdoor structures and water infrastructure vulnerable to chemical, biological, or radiological (CBR) terror attacks.
The National Homeland Security Research Center (NHSRC) within the Office of Research and Development (ORD) is EPA’s focal point for providing expertise, and for conducting and reporting research to meet its homeland security mission needs. One specific focus area of the NHSRC’s research is to support the Environmental Response Laboratory Network (ERLN), a nationwide association of federal, state, local, and commercial environmental laboratories, established by EPA. The ERLN can be deployed in response to a large-scale environmental disaster to provide consistent analytical capabilities, capacities, and quality data in a systematic and coordinated manner. To this end, the NHSRC has worked with experts across EPA and other federal agencies to develop standard analytical protocols (SAPs) to be used in support of the response to national homeland security related incidents.
This Standard Analytical Protocol (SAP) is for the identification, confirmation, and quantitation of Vibrio cholerae (V. cholerae) O1 and O139 in water samples, using selective and non-selective media followed by biochemical characterization and serological confirmation.
NHSRC has made this publication available to assist in preparing for and recovering from disasters involving V. cholerae contamination. This work specifically represents an important step in EPA’s support for the ERLN and moves the agency closer to achieving its mission to support homeland security and its overall mission to protect human health and the environment.
Gregory D. Sayles, Ph.D., Acting Director
National Homeland Security Research Center
Office of Research and Development
U.S. Environmental Protection Agency

vi

vii
Contents
Acknowledgments ................................................................................................................................iii
Disclaimer ............................................................................................................................................ iv
Foreword ............................................................................................................................................... v
1.0 Scope and Application .................................................................................................................... 1
2.0 Summary of Protocol ...................................................................................................................... 3
3.0 Acronyms and Abbreviations .......................................................................................................... 5
4.0 Interferences and Contamination ................................................................................................... 7
5.0 Safety .............................................................................................................................................. 9
5.1 Laboratory Hazards ................................................................................................................. 9
5.2 Recommended Precautions ...................................................................................................... 9
6.0 Equipment and Supplies ............................................................................................................... 11
7.0 Reagents and Standards ................................................................................................................ 13
8.0 Calibration and Standardization .................................................................................................... 17
9.0 Quality Control ............................................................................................................................. 19
9.1 General ................................................................................................................................... 19
9.2 Negative Controls .................................................................................................................. 19
9.3 Positive Controls .................................................................................................................... 19
9.4 Method Blank ........................................................................................................................ 20
9.5 Media Sterility Check ............................................................................................................ 20

viii
10.0 Procedures ................................................................................................................................... 21
10.1 Qualitative Sample Analyses ............................................................................................... 21
10.2 Quantitative Sample Analyses ............................................................................................. 21
10.3 Isolation on TCBS Plates ..................................................................................................... 21
10.4 Isolation on TSA Plates ...................................................................................................... 22
10.5 Serological Analyses ............................................................................................................ 22
10.6 Biochemical Analyses .......................................................................................................... 22
10.7 Description of Quality Control and V. cholerae O1 and O139 Results ............................... 23
11.0 Data Analysis and Bacterial Density Calculation ....................................................................... 25
11.1 Most Probable Number (MPN) Technique .......................................................................... 25
11.2 Calculation of MPN ............................................................................................................. 25
12.0 Protocol Performance .................................................................................................................. 33
13.0 Pollution Prevention.................................................................................................................... 35
14.0 Waste Management ..................................................................................................................... 37
15.0 References ................................................................................................................................... 39
16.0 Flowcharts ................................................................................................................................... 41
16.1 Quantitative Analysis Dilution Scheme ............................................................................... 41
16.2 Identification Flowchart ....................................................................................................... 42

ix
Tables
Table 1. Positive and Negative Control Cultures ............................................................................... 15
Table 2. Storage Temperatures and Times for Prepared Media and Reagents .................................. 15
Table 3. Positive and Negative Result Descriptions and Vibrio cholerae O1 and O139 Results ...... 23
Table 4. Examples of Appropriate Tube Selection and MPN/100 mL .............................................. 25
Table 5. MPN Index and 95% Confidence Limits for Various Combinations of Positive Results When Five Tubes are Used and Sample Inoculation Volumes are 20.0, 10.0, and 1.0 mL ............... 26
Table 6. MPN Index and 95% Confidence Limits for Various Combinations of Positive Results When Five Tubes are Used and Sample Inoculation Volumes are 10.0, 1.0, and 0.1 mL .................. 29
Table 7. Summary of Results for V. cholerae O1 and O139 in Spiked PBS, Drinking Water, and Surface Water Samples ....................................................................................................................... 33

x

1
1.0Scope and Application
1.1This Standard Analytical Protocol (SAP) is for the identification, confirmation, and quantitation of Vibrio cholerae (V. cholerae) O1 and O139 in water samples, using selective and non-selective media followed by biochemical characterization and serological confirmation.
1.2This protocol has been adapted from the Centers for Disease Control and Prevention’s Laboratory Methods for the Diagnosis of Epidemic Dysentery and Cholera (Reference 15.1) and the U.S. Food and Drug Administration’s Bacteriological Analytical Manual Online (Reference 15.2), and is for use by laboratories when analyzing samples in support of U.S. Environmental Protection Agency (EPA) homeland security efforts.
1.3V. cholerae O1 and O139 are the causative agents of cholera. Due to the infectious nature of the bacterium and the potential for transmission to humans, all procedures should be performed in laboratories that use, at a minimum, biological safety level (BSL)-2 practices. Use of a biological safety cabinet is recommended for any aerosol-generating procedures (Reference 15.3).
1.4All sample handling, analysis, and reporting of results must be performed in accordance with established guidelines. Laboratories must have requisite resources in place prior to use of these procedures.
1.5This method is not intended for analysis of microorganisms other than V. cholerae O1 and O139 and the matrices described.

2

3
2.0Summary of Protocol
2.1V. cholerae O1 and O139 can be identified in water samples using selective media and biochemical and serological analyses. Bacterial densities can be estimated using the most probable number (MPN) technique.
2.2For qualitative results, samples are diluted 1:1 in double-strength alkaline peptone water (APW) and incubated at 36.0°C ± 1.0°C for either 6 – 8 or 24 ± 2 hours.
2.3For quantitative results, samples are analyzed as received. Samples are analyzed using a 15-tube MPN. Inoculated APW tubes are incubated at 36.0°C ± 1.0°C for 6 – 8 or 24 ± 2 hours.
Note: It may be necessary to incubate APW for 24 ± 2 hours for some sample types and target organisms (e.g., V. cholerae O1).
2.4APW tubes (MPN and qualitative analyses tubes) are streaked from the top of the tube (pellicle) onto thiosulfate citrate bile salts sucrose (TCBS) agar and incubated at 36.0°C ± 1.0°C for 24 ± 2 hours.
2.5TCBS plates are examined for large yellow colonies typical of V. cholerae O1 and O139. Isolated, presumptive colonies are sub-cultured onto tryptic soy agar (TSA) and submitted to biochemical and serological confirmation. Serological confirmation is by agglutination using either V. cholerae O1 or O139 antiserum (as appropriate), followed by biochemical characterization using commercially available test strips (e.g., API 20E® [bioMérieux or equivalent) or with selected individual biochemical tests.
2.6APW tubes (MPN and qualitative analysis) may be subjected to real-time polymerase chain reaction (PCR) confirmation in place of biochemical and serological confirmation.
2.7Quantitation of V. cholerae O1 and O139 is determined using the MPN technique (Flowchart 16.1). Tubes that are confirmed positive for V. cholerae O1 or O139 are used to determine the MPN.

4
5
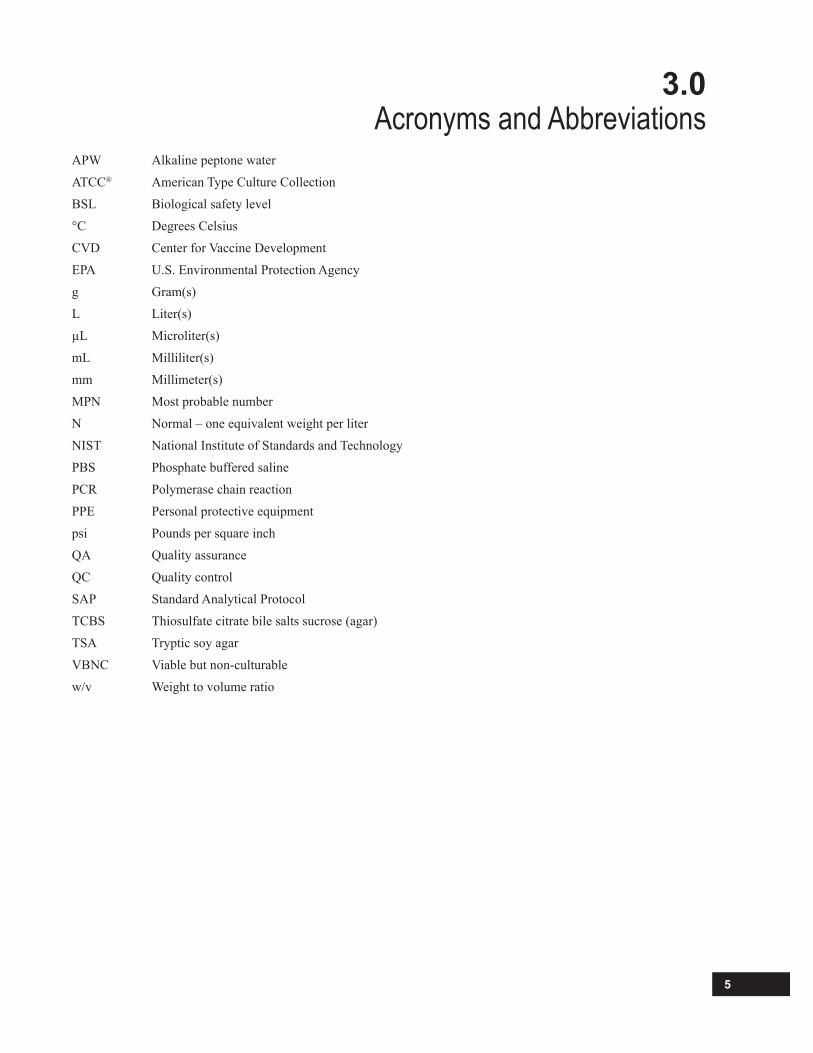
3.0 Acronyms and Abbreviations
APW Alkaline peptone water
ATCC® American Type Culture Collection
BSL Biological safety level
°C Degrees Celsius
CVD Center for Vaccine Development
EPA U.S. Environmental Protection Agency
g Gram(s)
L Liter(s)
µL Microliter(s)
mL Milliliter(s)
mm Millimeter(s)
MPN Most probable number
N Normal – one equivalent weight per liter
NIST National Institute of Standards and Technology
PBS Phosphate buffered saline
PCR Polymerase chain reaction
PPE Personal protective equipment
psi Pounds per square inch
QA Quality assurance
QC Quality control
SAP Standard Analytical Protocol
TCBS Thiosulfate citrate bile salts sucrose (agar)
TSA Tryptic soy agar
VBNC Viable but non-culturable
w/v Weight to volume ratio

6
7
4.0Interferences and Contamination
4.1Low recoveries of V. cholerae O1 and O139 may be caused by the presence of either high numbers of competing or inhibitory organisms, or toxic substances (e.g., metals, organic compounds).
4.2A viable but non-culturable (VBNC) state of V. cholerae O1 or O139 may also account for lower recoveries (Reference 15.4).
4.3Sample refrigeration or transport on ice may result in V. cholerae O1 or O139 becoming VBNC (Reference 15.4).

8

9
5.0Safety
5.1 Laboratory HazardsTo prevent transmission, disposable gloves should be worn when working with this organism. Hands should be washed immediately following removal of gloves. Direct and indirect contact of intact or broken skin with cultures and/or contaminated laboratory surfaces, and accidental parenteral inoculation are the primary hazards to laboratory personnel. Rarely, exposure to infectious aerosols may occur. Staff should apply safety procedures used for pathogens when handling all samples.
5.2 Recommended Precautions5.2.1V. cholerae O1 and O139 are BSL-2 pathogens and all procedures should be performed in laboratories that use, at a minimum, BSL-2 practices. This includes prohibiting eating, drinking, smoking, handling contact lenses, applying cosmetics, and storing food and drink in the laboratory (Reference 15.3).
5.2.2A Class II biological safety cabinet is recommended for sample manipulations where the risk of aerosol production is high. Production of aerosols should be avoided.
5.2.3Disposable materials are recommended for sample manipulation.
5.2.4Mouth-pipetting is prohibited.
5.2.5The analyst must know and observe normal safety procedures required in a microbiology laboratory while preparing, using, and disposing of media, cultures, reagents, and materials, including operation of sterilization equipment.
5.2.6 Personal Protective Equipment (PPE)5.2.6.1Disposable nitrile gloves should be worn at all times to prevent contact with infectious materials. Gloves should be changed whenever they are visibly soiled. Aseptic technique should be used when removing gloves and other protective clothing.
5.2.6.2Protective goggles and/or non-breakable, chemical-resistant glasses should be worn as appropriate.
5.2.6.3Laboratory coats covering arms and clothing and closed in the front should be worn at all times. Laboratory coats that become soiled should be changed.
5.2.7This method does not address all safety issues associated with its use. Please refer to Biosafety in Microbiological and Biomedical Laboratories, 5th Edition (Reference 15.3) for additional safety information. A reference file of Material Safety Data Sheets should be available to all personnel involved in analyses.

10

11
6.0Equipment and Supplies
6.1Autoclave or steam sterilizer, capable of achieving 121°C (15 pounds per square inch [psi]) for 15 minutes
6.2Autoclave bags, aluminum foil, or kraft paper
6.3Balance, top loading, with ASTM International Class S reference weights, capable of weighing 100 g ± 0.1 g
6.4Beakers, glass or plastic (assorted sizes)
6.5Biological safety cabinet, Class II (optional)
6.6Borosilicate glass culture tubes, with autoclavable screw or snap caps (25 × 150 mm)
6.7Borosilicate glass or plastic screw-cap, wide-mouth bottles, sterile (e.g., 250 mL)
6.8Erlenmeyer flasks (500 mL, 1 L, 2 L)
6.9Gloves, sterile, nitrile, or equivalent
6.10Graduated cylinders (assorted sizes)
6.11Incubator, microbiological type, maintained at 36.0°C ± 1.0°C
6.12Inoculation loops, sterile, disposable
6.13Parafilm® or equivalent
6.14Petri dishes, sterile, plastic (15 × 100 mm)
6.15pH meter

12
6.16Pipettes, standard tip, sterile, plastic, disposable (assorted sizes)
6.17Pipetting device (automatic or equivalent)
6.18Stirring hotplates and stir bars
6.19Test tube racks
6.20Thermometer, National Institute of Standards and Technology (NIST)-traceable
6.21Tissues, lint-free (Kimwipes® or equivalent)
6.22Waterbath, maintained at 45°C – 50°C for tempering agar
6.23Weigh paper and boats

13
7.0Reagents and Standards
7.1Reagent-grade chemicals must be used in all analyses. Unless otherwise indicated, reagents shall conform to the specifications of the Committee on Analytical Reagents of the American Chemical Society (Reference 15.5). For suggestions regarding the testing of reagents not listed by the American Chemical Society, see AnalaR Standards for Laboratory Chemicals (Reference 15.6) and United States Pharmacopeia and National Formulary 24 (Reference 15.7).
7.2Whenever possible, use commercially available culture media. The agar used in the preparation of culture media must be of microbiological grade.
7.3Reagent-grade water must conform to specifications in Standard Methods for the Examination of Water and Wastewater, 21st Edition (Reference 15.8).
7.4 Phosphate Buffered Saline (PBS)Prepare reagent according to the following and store at <10°C and above freezing for a maximum of two weeks in tubes with loose caps or three months in screw-cap tubes.
7.4.1 Composition:Monosodium phosphate (NaH2PO4) 0.58 gDisodium phosphate (Na2HPO4) 2.50 gSodium chloride 8.50 gReagent-grade water 1.0 L
7.4.2Dissolve reagents in 1 L reagent-grade water, adjust pH to 7.4 ± 0.2 with 1.0 N hydrochloric acid or 1.0 N sodium hydroxide, and dispense appropriate volumes in screw-cap bottles or tubes and autoclave at 121°C (15 psi) for 15 minutes.
7.5 Alkaline Peptone Water (APW)Commercially prepared medium is recommended. Dehydrated medium (EMD Chemicals 1.01800.0500 or equivalent) may be used. If commercially prepared medium is not available prepare 1X, 2X, and 5X APW according to Sections 7.5.1 and 7.5.2.
7.5.1 Composition:1X 2X 5X
Peptone 10.0 g 20.0 g 50.0 gSodium chloride 10.0 g 20.0 g 50.0 gReagent-grade water 1.0 L 1.0 L 1.0 L
7.5.2Add reagents to 950 mL of reagent-grade water and mix thoroughly using a stir bar. Adjust pH to 8.5 ± 0.2 with 1.0 N hydrochloric acid or 1.0 N sodium hydroxide and bring up to 1 L. Dispense 10 mL (1X and 2X) or 5 mL (5X) aliquots in 25 × 150 mm tubes and autoclave at 121°C (15 psi) for 15 minutes. Cool to room temperature. Warm medium to 36°C ± 1.0°C prior to inoculation.

14
7.6 Thiosulfate Citrate Bile Salts Sucrose (TCBS) Agar Commercially prepared medium is recommended. Dehydrated medium (Oxoid CM0333 or equivalent) may be used. If commercially prepared medium is not available, prepare medium according to Sections 7.6.1 and 7.6.2.
7.6.1 Composition:Yeast extract 5.0 gPeptone 10.0 gSodium thiosulfate 10.0 gSodium citrate 10.0 gOx bile 8.0 gSucrose 20.0 gSodium chloride 10.0 gFerric citrate 1.0 gBromothymol blue 0.04 gThymol blue 0.04 gAgar 14.0 gReagent-grade water 1.0 L
7.6.2Add reagents to 950 mL of reagent-grade water and mix thoroughly using a stir bar and hot plate. Adjust pH to 8.6 ± 0.2 with 1.0 N hydrochloric acid or 1.0 N sodium hydroxide and bring up to 1 L. Boil for one minute with rapid stir bar agitation to dissolve completely. DO NOT AUTOCLAVE. Aseptically pour 12 – 15 mL into each 15 × 100 mm sterile Petri plate. Warm medium to room temperature prior to use.
7.7 Tryptic Soy Agar (TSA)Commercially prepared medium is recommended. Prepared plates (BBL™ 221803 or equivalent) or dehydrated medium (BBL™ 211043 or equivalent) may be used. If commercially prepared medium is not available, prepare medium according to Sections 7.7.1 and 7.7.2.
7.7.1 Composition:Pancreatic digest of casein 15.0 gPapaic digest of soybean meal 5.0 gSodium chloride 5.0 gAgar 15.0 gReagent-grade water 1.0 L
7.7.2Add reagents to 950 mL of reagent-grade water and mix thoroughly using a stir bar and hot plate. Heat to dissolve completely. Adjust pH to 7.3 ± 0.2 with 1.0 N hydrochloric acid or 1.0 N sodium hydroxide and bring up to 1 L. Autoclave at 121°C (15 psi) for 15 minutes. Aseptically pour 12 – 15 mL into each 15 × 100 mm sterile Petri plate. Warm medium to room temperature prior to use.
7.8Saline, physiological (0.85% w/v): Dissolve 0.85 g NaCl in 100 mL of reagent-grade water. Autoclave at 121°C (15 psi) for 15 minutes. Cool to room temperature.
7.9V. cholerae O1 (Difco™ 210603 or equivalent) and O139 antisera (Difco™ 210431 or equivalent)

15
7.10Biochemical test strip (bioMérieux API 20E® or equivalent)
7.11Oxidase reagent (BBL™ DrySlide™ 231746 or equivalent)
7.12Positive and negative control cultures that are to be used with this protocol are listed in Table 1. Use of these controls is discussed in Section 9.0.
Table 1. Positive and Negative Control Cultures
Media/Reagents Positive Control(1) Negative Control
APW V. cholerae O1 or O139 E. coli (ATCC® 25922™)
TCBS V. cholerae O1 or O139 E. coli (ATCC®25922™)
O1 serum agglutination V. cholerae O1 E. coli (ATCC® 25922™)
O139 serum agglutination V. cholerae O139 E. coli (ATCC® 25922™)
Biochemical test strip V. cholerae O1 or O139 E. coli (ATCC® 25922™)
Oxidase V. cholerae O1 or O139 E. coli (ATCC® 25922™)(1)Either JBK 70 for V. cholerae O1, CVD 112 for V. cholerae O139, Center for Vaccine Development (CVD), University of Maryland School of Medicine, or equivalent strains may be used, as appropriate.
7.13Storage temperatures and times for prepared media and reagents are provided in Table 2. Follow manufacturers’ guidelines for storage and expiration of all commercially prepared reagents.
Table 2. Storage Temperatures and Times for Prepared Media and Reagents
Media/Reagents Storage Temperature(1) Storage Time
PBS, saline(in screw-cap bottles or tubes)
Room temperature 3 months
Tubes: APW Room temperature 2 weeks in loose cap tubes 3 weeks in screw-cap tubes
Plates: TCBS, TSA <10°C and above freezing 2 weeks
(1)If media/reagent is refrigerated, remove from refrigerator 1 – 1.5 hours prior to inoculation to ensure that it reaches room temperature prior to use. APW should be brought to 36.0°C ± 1.0°C prior to inoculation.

16

17
8.0Calibration and Standardization
8.1Check temperature in incubators twice daily, a minimum of four hours apart, to ensure operation is within stated limits of the method. Record daily measurements in an incubator log book.
8.2Check temperature in refrigerators/freezers at least once daily to ensure operation is within stated limits of the method. Record daily measurements in a refrigerator/freezer log book.
8.3Calibrate thermometers and incubators annually against a NIST-certified thermometer or against a thermometer that meets the requirements of NIST Monograph SP 250-23 (Reference 15.9). Check mercury columns for breaks.
8.4Calibrate pH meter prior to each use with two of three standards (e.g., pH 4.0, 7.0, or 10.0) closest to the range being tested.
8.5Calibrate analytical and top-loading balances with ASTM International Class S reference weights once per month, at a minimum. Check each day prior to use with Class S weights.
8.6Re-certify biological safety cabinets once per year. Re-certification must be performed by a qualified technician.

18

19
9.0Quality Control
9.1 GeneralEach laboratory that uses this method is required to operate a formal quality assurance (QA) program that addresses and documents instrument and equipment maintenance and performance, reagent quality and performance, analyst training and certification, and records storage and retrieval. Specific quality control (QC) procedures for use with this method are discussed below.
Note: Following testing and validation, this method will be updated to include QC criteria for initial and ongoing demonstration of capability as well as matrix spike/matrix spike duplicates.
9.2 Negative Controls9.2.1The laboratory should analyze negative controls to ensure that all media and reagents are performing properly. Negative controls should be analyzed whenever a new batch of media or reagents is used. On an ongoing basis, the laboratory should analyze a negative control every day that samples are analyzed. Recommended negative control organisms are provided in Table 1 (Section 7.12) and descriptions of negative results are provided in Table 3 (Section 10.7).
9.2.2Analysis of negative controls is conducted by inoculating media and performing biochemical and serological tests with known negative control organisms as described in Section 10.0. The negative control is treated as a sample and submitted to the same analytical procedures.
9.2.3If a negative control fails to exhibit the appropriate response, check and/or replace the associated media, reagents, and/or negative control organism, and re-analyze the appropriate negative control and corresponding sample(s).
9.2.4Viability of the negative controls should be demonstrated on a monthly basis, at a minimum, using a non-selective medium (e.g., TSA).
9.3 Positive Controls9.3.1The laboratory should analyze positive controls to ensure that all media and reagents are performing properly. Positive controls should be analyzed whenever a new batch of media or reagents is used. On an ongoing basis, the laboratory should analyze a positive control every day that samples are analyzed. Recommended positive control organisms are provided in Table 1 (Section 7.12) and descriptions of positive results are provided in Table 3 (Section 10.7).
9.3.2Analysis of positive controls is conducted by inoculating media and performing biochemical and serological tests with known positive organisms as described in Section 10.0. The positive control is treated as a sample and submitted to the same analytical procedures.
9.3.3If a positive control fails to exhibit the appropriate response, invalidate the sample results, check and/or replace the associated media, reagents, and/or positive control organism, and re-analyze the appropriate positive control and corresponding sample(s).

20
9.4 Method BlankTo verify the sterility of equipment, materials, and supplies, the laboratory should analyze a method blank each day that samples are analyzed using sterile PBS (Section 7.4). The method blank is treated as a sample and submitted to the same analytical procedures. Absence of growth indicates freedom from contamination by the target organisms.
9.5 Media Sterility CheckTest sterility of PBS, and media (APW, TCBS, TSA) by incubating one unit (tube or plate) from each batch at 36.0°C ± 1.0°C for 24 ± 2 hours and observing for growth. Absence of growth indicates the media are sterile. On an ongoing basis, media sterility checks should be done every day that samples are analyzed.

21
10.0Procedures
Process samples promptly upon receipt, allowing no more than six hours to elapse from the time of sample collection to sample analysis. Samples should not be placed on ice or held at <10°C. V. cholerae O1 and O139 are pathogens, and all samples should be handled with caution, using appropriate BSL-2 procedures and PPE. A Class II biological safety cabinet is recommended for sample manipulations where the risk of aerosol production is high.
10.1 Qualitative Sample AnalysesAdd a sample volume (e.g., 100 mL) to an equal volume of double-strength APW (Section 7.5) and incubate at 36.0°C ± 1.0°C for 6 – 8 hours or 24 ± 2 hours. Based on the single-laboratory verification study, analysis of drinking water matrices may require a 24 ± 2 hour incubation period. After incubation, proceed to Section 10.3 for selective isolation of V. cholerae O1 and O139.
Note: It may be necessary to incubate APW for 24 ± 2 hours for some sample types and target organisms (e.g., V. cholerae O1).
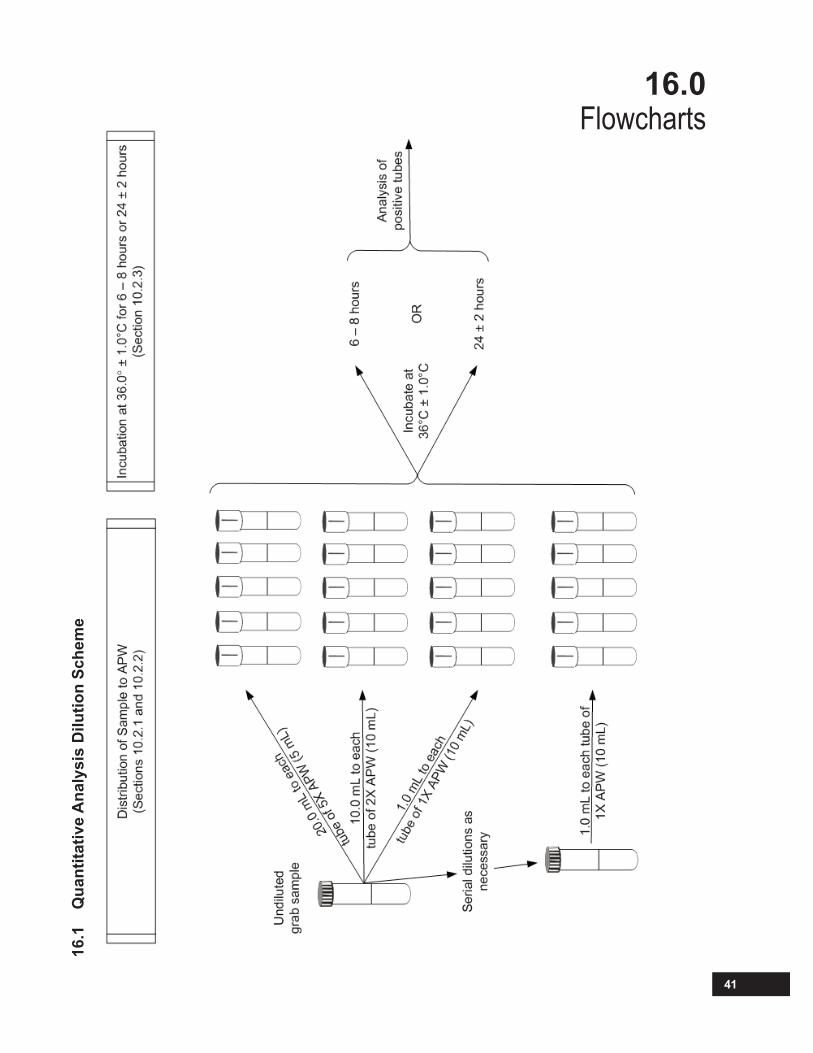
10.2 Quantitative Sample AnalysesA multiple-tube assay incorporating differential sample volumes is used to estimate V. cholerae O1 and O139 densities in undiluted or diluted samples. If low levels of V. cholerae are suspected, larger sample volumes (20 mL of original sample) should be used to inoculate the first row of tubes in the series. If high levels of V. cholerae are suspected, additional serial dilutions should be used. See Flowchart 16.1 for an overview of the sample dilution and inoculation scheme. A minimum sample volume of 156 mL is required if 20 mL volumes are used to inoculate the first row of tubes. Bring APW to 36.0°C ± 1.0°C prior to inoculation.
10.2.1 Sample inoculation Arrange APW tubes in three rows (5 mL of 5X, 10 mL of 2X, 10 mL of 1X) of five tubes each. Inoculate the first row of tubes (5 mL of 5X APW) with 20 mL of the undiluted sample. Inoculate 10 mL of the undiluted sample into each of the tubes in the second row (10 mL of 2X APW). Inoculate 1 mL from the initial sample into each of the tubes in the third row (10 mL of 1X APW). See Flowchart 16.1 for an overview of the sample inoculation scheme.
10.2.2 Sample dilutions Samples may require serial dilution prior to inoculation due to high levels of V. cholerae. If analyzing serially diluted samples, 1.0 mL of each dilution will be used to inoculate each tube of 1X APW, as appropriate.
10.2.3 Growth Incubate tubes at 36.0°C ± 1.0°C for 6 – 8 hours or 24 ± 2 hours. Based on the single-laboratory verification study, analysis of drinking water matrices may require a 24 ± 2 hour incubation period. After incubation, proceed to Section 10.3 for isolation of V. cholerae.
Note: It may be necessary to incubate APW for 24 hours for some sample types and target organisms (e.g., V. cholerae O1).
10.3 Isolation on TCBS Plates10.3.1Perform primary isolation on all APW tubes incubated 6 – 8 hours and on all tubes incubated 24 ± 2 hours exhibiting growth. Do not shake or mix tubes. Obtain inoculum 2 – 5 mm from the top of the tube (pellicle) and streak for isolation onto TCBS plates using a sterile inoculation loop (20 μL).
10.3.2Incubate TCBS plates at 36.0°C ± 1.0°C for 24 ± 2 hours. Typical V. cholerae colonies are large and yellow.
Note: Cultures grown on TCBS should be examined quickly after removal from an incubator because the yellow colonies may revert to a green color when left at room temperature.

22
10.4 Isolation on TSA Plates 10.4.1Streak a single typical colony for isolation onto a TSA plate from each TCBS plate. Incubate the plates at 36.0°C ± 1.0°C for 24 ± 2 hours.
10.4.2Seal the TCBS plates with Parafilm® and store at room temperature for use as backup plates. Use the TSA plates for serological and biochemical analyses.
10.5 Serological Analyses10.5.1V. cholerae O1 or O139 antiserum: Choose a well-isolated colony from each of the TSA plates and emulsify growth using sterile physiological saline. Place two discrete drops of emulsified growth onto a slide. To the first drop of emulsified growth, add one drop of O1 or O139 antiserum (as appropriate). To the second drop of emulsified growth, add one drop of sterile saline (as a visual comparison).
10.5.2Observe under magnification for an agglutination reaction, which indicates a positive result. V. cholerae O1 is agglutination-positive for O1 antiserum and V. cholerae O139 is agglutination-positive for O139 antiserum. Results should be compared with those for positive and negative controls (Table 1) analyzed at the same time.
10.6 Biochemical AnalysesUse a single, isolated, large colony (2 – 3 mm diameter) from each TSA plate for biochemical and oxidase analyses.
10.6.1 Oxidase Test (BBL™ DrySlide™ 231746 or equivalent)Following manufacturer’s instructions, transfer a small amount of cells from the selected colony to the slide. Oxidase-positive bacteria turn the reagent dark purple within 20 seconds. V. cholerae is oxidase-positive. Results should be compared with those for positive and negative controls (Table 1) analyzed at the same time.
10.6.2 Biochemical Test Strips (API 20E® or equivalent)Emulsify the remainder of the colony in 0.85% NaCl. Follow manufacturer’s instructions to inoculate wells and add appropriate reagents. Incubate test strip according to manufacturer’s instructions. Add additional reagents, read, and record results.
10.6.3 Alternative Biochemical TestsThe following individual biochemical tests may be used instead of biochemical test strips to identify V. cholerae O1 and O139:
• Arginine• Glucose fermentation• H2S• Lysine• Ornithine• Oxidase• String test• Sucrose fermentation• Voges-Proskauer
V. cholerae O1 and O139 are positive for oxidase, glucose, lysine, ornithine, string test, and sucrose, and negative for arginine and H2S. Voges-Proskauer test results are variable, but generally positive.

23
10.7 Description of Quality Control and V. cholerae O1 and O139 ResultsTypical results are provided in Table 3.
Table 3. Positive and Negative Result Descriptions and Vibrio cholerae O1 and O139 Results
Medium/Test V. cholerae O1 and O139 Results
Positive Control Result and Description
Negative Control Result and Description
TCBS Positive Large, yellow colonies No growth
APW Positive Growth at alkaline pH (pellicle or turbidity) No growth
Oxidase Positive Purple to violet color change within 20 seconds
Colorless or very light pink color change over time
Biochemical test strip Consult manufacturer’s instructions
O1/O139 antiserum (as appropriate) Positive Agglutination No agglutination

24

25
11.0Data Analysis and Bacterial Density Calculation
11.1 Most Probable Number (MPN) TechniqueEstimation of bacterial densities may be determined based on the number of tubes positive for V. cholerae O1 or O139 either by biochemical and serological confirmation or PCR.
11.2 Calculation of MPNIf only three rows of tubes were analyzed, identify appropriate MPN value using either Table 5 or 6, depending on volumes assayed. If more than three rows of tubes were analyzed, the appropriate rows must be selected and MPN value calculated as described in Sections 11.2.1 and 11.2.2. Table 5 should only be used for volumes of 20.0 mL, 10.0 mL, and 1.0 mL. To select MPN values for volumes of 10.0 mL or less, use Table 6.
11.2.1 Selection of Tubes If more than three rows of tubes are inoculated with sample (i.e., volumes and/or dilutions), select the most appropriate rows of tubes according to the criteria provided below. Examples of row selections and MPN/100 mL values are provided in Table 4.
11.2.1.1Choose the smallest volume or the highest dilution giving positive results in all five tubes inoculated, plus the two succeeding lower concentrations. In Table 4, Example A, 10 mL is a smaller volume than 20 mL, and is the lowest volume giving positive results in all five tubes.
11.2.1.2If the largest volume tested has less than five tubes with positive results, select it and the next two volumes (Table 4, Examples B and C).
11.2.1.3When a positive result occurs in a smaller volume than the three rows selected according to the rules above, change the selection to the largest volume that has less than five positive results, and the next two smaller volumes (Table 4, Example D).
11.2.1.4When the selection rules above have left unselected any smaller volumes with positive results, add those positive tubes to the row of tubes for the smallest volume selected (Table 4, Example E).
11.2.1.5If there were not enough lower volumes analyzed to select three dilutions using the rules above, then select the three smallest volumes (Table 4, Example F).
Table 4. Examples of Appropriate Tube Selection and MPN/100 mL(1)
Example 20 mL 10 mL 1.0 mL 0.1 mL SignificantDilutions Table MPN Index MPN/100 mL
A 5/5 5/5 3/5 0/5 5-3-0 6 0.792 79.2
B 4/5 5/5 1/5 0/5 4-5-1 5 0.1524 15.24
C 0/5 1/5 0/5 0/5 0-1-0 5 0.0067 0.67
D 5/5 3/5 1/5 1/5 3-1-1 6 0.137 13.7
E 4/5 4/5 0/5 1/5 4-4-1 5 0.1181 11.81
F 5/5 5/5 5/5 2/5 5-5-2 6 5.422 542.2
(1)Appropriate volumes are underlined and the largest sample volumes analyzed are highlighted.

26
11.2.2For calculation of MPN/100 mL when additional dilutions are analyzed (e.g., 10-2, 10-3), obtain the MPN index value from Table 5 using the number of positive tubes in the three selected dilutions. Calculate MPN/100 mL using the equation below:
MPN Index from Table 6 MPN/100 mL = × 100
Middle volume analyzed in the series used for MPN determination
For example, a dilution series of 10-3, 10-4, 10-5, with the following positive tubes 5, 1, 0, respectively, would be:
0.329MPN/100 mL = × 100 = 3.29 × 10⁵
10-4
Table 5. MPN Index and 95% Confidence Limits for Various Combinations of Positive Results When Five Tubes are Used and Sample Inoculation Volumes are 20.0, 10.0, and 1.0 mL(1)
Combination of Positives MPN Index
95% Confidence Limits Combination of Positives MPN Index
95% Confidence Limits
Lower Upper Lower Upper
0-0-0 <0.006473 ---- 0.0223 1-3-0 0.0312 0.0055 0.0678
0-0-1 0.0065 0.0012 0.0223 1-3-1 0.0393 0.0092 0.0821
0-0-2 0.0130 0.0012 0.0352 1-3-2 0.0475 0.0132 0.0967
0-0-3 0.0195 0.0012 0.0472 1-3-3 0.0559 0.0173 0.1119
0-0-4 0.0262 0.0033 0.0589 1-3-4 0.0644 0.0216 0.1277
0-0-5 0.0328 0.0062 0.0706 1-3-5 0.0730 0.0260 0.1444
0-1-0 0.0067 0.0012 0.0228 1-4-0 0.0409 0.0099 0.0849
0-1-1 0.0134 0.0012 0.0360 1-4-1 0.0495 0.0141 0.1002
0-1-2 0.0202 0.0012 0.0483 1-4-2 0.0583 0.0185 0.1163
0-1-3 0.0270 0.0037 0.0604 1-4-3 0.0672 0.0231 0.1331
0-1-4 0.0339 0.0067 0.0725 1-4-4 0.0763 0.0277 0.1509
0-1-5 0.0408 0.0099 0.0847 1-4-5 0.0855 0.0324 0.1700
0-2-0 0.0138 0.0012 0.0367 1-5-0 0.0517 0.0152 0.1042
0-2-1 0.0208 0.0012 0.0495 1-5-1 0.0609 0.0199 0.1212
0-2-2 0.0279 0.0040 0.0619 1-5-2 0.0703 0.0247 0.1391
0-2-3 0.0350 0.0072 0.0745 1-5-3 0.0799 0.0296 0.1583
0-2-4 0.0422 0.0106 0.0871 1-5-4 0.0897 0.0346 0.1790
0-2-5 0.0494 0.0141 0.1001 1-5-5 0.0998 0.0397 0.2015
0-3-0 0.0215 0.0012 0.0507 2-0-0 0.0155 0.0012 0.0404
0-3-1 0.0288 0.0044 0.0636 2-0-1 0.0226 0.0018 0.0526
0-3-2 0.0362 0.0077 0.0766 2-0-2 0.0303 0.0051 0.0662
0-3-3 0.0437 0.0113 0.0898 2-0-3 0.0382 0.0087 0.0801
0-3-4 0.0512 0.0051 0.1243 2-0-4 0.0462 0.0125 0.0943
0-3-5 0.0588 0.0095 0.1428 2-0-5 0.0543 0.0165 0.1090

27
Combination of Positives MPN Index
95% Confidence Limits Combination of Positives MPN Index
95% Confidence Limits
Lower Upper Lower Upper
0-4-0 0.0299 0.0049 0.0654 2-1-0 0.0234 0.0022 0.0540
0-4-1 0.0375 0.0084 0.0789 2-1-1 0.0315 0.0056 0.0683
0-4-2 0.0453 0.0121 0.0927 2-1-2 0.0397 0.0094 0.0827
0-4-3 0.0531 0.0160 0.1069 2-1-3 0.0480 0.0134 0.0976
0-4-4 0.0611 0.0200 0.1216 2-1-4 0.0565 0.0177 0.1131
0-4-5 0.0691 0.0241 0.1369 2-1-5 0.0652 0.0221 0.1293
0-5-0 0.0390 0.0090 0.0814 2-2-0 0.0327 0.0062 0.0705
0-5-1 0.0470 0.0129 0.0958 2-2-1 0.0413 0.0101 0.0856
0-5-2 0.0553 0.0170 0.1107 2-2-2 0.0501 0.0144 0.1013
0-5-3 0.0636 0.0212 0.1262 2-2-3 0.0590 0.0189 0.1176
0-5-4 0.0720 0.0255 0.1425 2-2-4 0.0681 0.0236 0.1349
0-5-5 0.0806 0.0299 0.1596 2-2-5 0.0774 0.0283 0.1533
1-0-0 0.0072 0.0012 0.0241 2-3-0 0.0431 0.0110 0.0887
1-0-1 0.0139 0.0012 0.0369 2-3-1 0.0523 0.0155 0.1053
1-0-2 0.0209 0.0012 0.0497 2-3-2 0.0617 0.0203 0.1227
1-0-3 0.0281 0.0041 0.0623 2-3-3 0.0714 0.0252 0.1412
1-0-4 0.0353 0.0073 0.0749 2-3-4 0.0813 0.0303 0.1611
1-0-5 0.0425 0.0107 0.0878 2-3-5 0.0914 0.0354 0.1826
1-1-0 0.0144 0.0012 0.0377 2-4-0 0.0547 0.0168 0.1098
1-1-1 0.0217 0.0013 0.0509 2-4-1 0.0647 0.0218 0.1284
1-1-2 0.0290 0.0045 0.0640 2-4-2 0.0750 0.0271 0.1484
1-1-3 0.0365 0.0079 0.0771 2-4-3 0.0855 0.0325 0.1700
1-1-4 0.0441 0.0115 0.0905 2-4-4 0.0964 0.0380 0.1937
1-1-5 0.0517 0.0153 0.1043 2-4-5 0.1076 0.0436 0.2201
1-2-0 0.0224 0.0017 0.0523 2-5-0 0.0681 0.0235 0.1349
1-2-1 0.0301 0.0050 0.0658 2-5-1 0.0791 0.0292 0.1566
1-2-2 0.0379 0.0085 0.0795 2-5-2 0.0904 0.0349 0.1805
1-2-3 0.0457 0.0123 0.0935 2-5-3 0.1021 0.0409 0.2070
1-2-4 0.0537 0.0162 0.1079 2-5-4 0.1143 0.0469 0.2372
1-2-5 0.0618 0.0203 0.1229 2-5-5 0.1268 0.0531 0.2725
3-0-0 0.0255 0.0028 0.0585 4-3-0 0.0797 0.0295 0.1579
3-0-1 0.0330 0.0063 0.0710 4-3-1 0.0937 0.0366 0.1877
3-0-2 0.0417 0.0103 0.0863 4-3-2 0.1086 0.0441 0.2228
3-0-3 0.0506 0.0147 0.1023 4-3-3 0.1245 0.0520 0.2656
3-0-4 0.0598 0.0193 0.1191 4-3-4 0.1414 0.0602 0.3218
3-0-5 0.0691 0.0241 0.1368 4-3-5 0.1595 0.0686 0.4067
3-1-0 0.0344 0.0069 0.0734 4-4-0 0.1012 0.0404 0.2049
3-1-1 0.0435 0.0112 0.0896 4-4-1 0.1181 0.0489 0.2476
3-1-2 0.0529 0.0159 0.1065 4-4-2 0.1364 0.0578 0.3038
3-1-3 0.0626 0.0207 0.1244 4-4-3 0.1563 0.0672 0.3890
3-1-4 0.0725 0.0258 0.1434 4-4-4 0.1780 0.0770 0.5273
3-1-5 0.0827 0.0310 0.1640 4-4-5 0.2015 0.0873 0.6411

28
Combination of Positives MPN Index
95% Confidence Limits Combination of Positives MPN Index
95% Confidence Limits
Lower Upper Lower Upper
3-2-0 0.0456 0.0122 0.0932 4-5-0 0.1304 0.0549 0.2836
3-2-1 0.0555 0.0171 0.1112 4-5-1 0.1524 0.0653 0.3687
3-2-2 0.0657 0.0223 0.1303 4-5-2 0.1769 0.0766 0.5210
3-2-3 0.0763 0.0277 0.1510 4-5-3 0.2046 0.0886 0.6528
3-2-4 0.0872 0.0333 0.1735 4-5-4 0.2357 0.1015 0.7516
3-2-5 0.0984 0.0390 0.1984 4-5-5 0.2708 0.1150 0.8426
3-3-0 0.0583 0.0186 0.1164 5-0-0 0.0549 0.0162 0.1116
3-3-1 0.0693 0.0241 0.1371 5-0-1 0.0637 0.0213 0.1265
3-3-2 0.0806 0.0299 0.1597 5-0-2 0.0763 0.0277 0.1510
3-3-3 0.0924 0.0359 0.1847 5-0-3 0.0896 0.0345 0.1787
3-3-4 0.1046 0.0421 0.2128 5-0-4 0.1037 0.0417 0.2107
3-3-5 0.1173 0.0484 0.2452 5-0-5 0.0953 0.0165 0.2234
3-4-0 0.0733 0.0262 0.1450 5-1-0 0.0678 0.0234 0.1344
3-4-1 0.0856 0.0325 0.1700 5-1-1 0.0816 0.0304 0.1618
3-4-2 0.0984 0.0390 0.1982 5-1-2 0.0963 0.0379 0.1936
3-4-3 0.1118 0.0457 0.2307 5-1-3 0.1121 0.0459 0.2316
3-4-4 0.1258 0.0526 0.2695 5-1-4 0.1291 0.0542 0.2796
3-4-5 0.1405 0.0597 0.3184 5-1-5 0.1293 0.0304 0.3090
3-5-0 0.0913 0.0354 0.1825 5-2-0 0.0879 0.0337 0.1751
3-5-1 0.1055 0.0426 0.2150 5-2-1 0.1046 0.0421 0.2128
3-5-2 0.1204 0.0500 0.2538 5-2-2 0.1227 0.0511 0.2605
3-5-3 0.1362 0.0577 0.3029 5-2-3 0.1427 0.0608 0.3267
3-5-4 0.1529 0.0656 0.3715 5-2-4 0.1646 0.0710 0.4385
3-5-5 0.1707 0.0738 0.4795 5-2-5 0.1767 0.0503 0.5230
4-0-0 0.0381 0.0082 0.0809 5-3-0 0.1151 0.0474 0.2394
4-0-1 0.0461 0.0125 0.0942 5-3-1 0.1368 0.0580 0.3050
4-0-2 0.0563 0.0175 0.1126 5-3-2 0.1614 0.0695 0.4183
4-0-3 0.0668 0.0229 0.1323 5-3-3 0.1895 0.0821 0.5899
4-0-4 0.0777 0.0284 0.1537 5-3-4 0.2216 0.0957 0.7101
4-0-5 0.0890 0.0342 0.1773 5-3-5 0.2527 0.0814 0.7971
4-1-0 0.0484 0.0136 0.0983 5-4-0 0.1571 0.0676 0.3935
4-1-1 0.0592 0.0190 0.1181 5-4-1 0.1907 0.0826 0.5954
4-1-2 0.0705 0.0248 0.1395 5-4-2 0.2319 0.0999 0.7409
4-1-3 0.0822 0.0308 0.1631 5-4-3 0.2834 0.1196 0.8726
4-1-4 0.0945 0.0370 0.1894 5-4-4 0.3475 0.1417 1.0160
4-1-5 0.1072 0.0434 0.2193 5-4-5 0.4256 0.1437 1.1800
4-2-0 0.0626 0.0207 0.1244 5-5-0 0.2398 0.0762 0.7629
4-2-1 0.0748 0.0269 0.1479 5-5-1 0.3477 0.1172 1.0160
4-2-2 0.0875 0.0335 0.1742 5-5-2 0.5422 0.1791 1.4190
4-2-3 0.1009 0.0403 0.2041 5-5-3 0.9178 0.2672 2.2010
4-2-4 0.1150 0.0473 0.2392 5-5-4 1.6090 0.3837 4.1030
4-2-5 0.1299 0.0546 0.2820 5-5-5 >1.6090 0.3837 ----
(1)Table was developed using the MPN calculator developed by Albert Klee (Reference 15.10).

29
Table 6. MPN Index and 95% Confidence Limits for Various Combinations of Positive Results When Five Tubes are Used and Sample Inoculation Volumes are 10.0, 1.0, and 0.1 mL(1)
Combination of Positives MPN Index
95% Confidence Limits Combination of Positives MPN Index
95% Confidence Limits
Lower Upper Lower Upper
0-0-0 <0.018 --- 0.063 1-3-0 0.083 0.012 0.196
0-0-1 0.018 0.003 0.063 1-3-1 0.104 0.020 0.243
0-0-2 0.036 0.003 0.101 1-3-2 0.125 0.029 0.296
0-0-3 0.054 0.003 0.137 1-3-3 0.147 0.038 0.364
0-0-4 0.072 0.008 0.174 1-3-4 0.169 0.048 0.460
0-0-5 0.091 0.015 0.212 1-3-5 0.191 0.057 0.566
0-1-0 0.018 0.003 0.063 1-4-0 0.105 0.021 0.245
0-1-1 0.036 0.003 0.101 1-4-1 0.127 0.030 0.300
0-1-2 0.055 0.003 0.138 1-4-2 0.148 0.039 0.370
0-1-3 0.073 0.008 0.175 1-4-3 0.170 0.048 0.468
0-1-4 0.091 0.015 0.214 1-4-4 0.193 0.058 0.575
0-1-5 0.110 0.023 0.256 1-4-5 0.215 0.067 0.657
0-2-0 0.037 0.003 0.102 1-5-0 0.128 0.030 0.303
0-2-1 0.055 0.003 0.139 1-5-1 0.150 0.040 0.375
0-2-2 0.074 0.008 0.176 1-5-2 0.172 0.049 0.477
0-2-3 0.092 0.015 0.215 1-5-3 0.195 0.058 0.583
0-2-4 0.111 0.023 0.258 1-5-4 0.217 0.068 0.664
0-2-5 0.129 0.031 0.307 1-5-5 0.240 0.077 0.731
0-3-0 0.056 0.003 0.140 2-0-0 0.045 0.003 0.119
0-3-1 0.074 0.009 0.177 2-0-1 0.068 0.006 0.164
0-3-2 0.093 0.016 0.217 2-0-2 0.091 0.015 0.213
0-3-3 0.112 0.023 0.260 2-0-3 0.115 0.025 0.269
0-3-4 0.130 0.031 0.310 2-0-4 0.139 0.035 0.338
0-3-5 0.149 0.039 0.372 2-0-5 0.164 0.046 0.437
0-4-0 0.075 0.009 0.179 2-1-0 0.068 0.006 0.166
0-4-1 0.094 0.016 0.219 2-1-1 0.092 0.015 0.216
0-4-2 0.112 0.024 0.263 2-1-2 0.116 0.025 0.272
0-4-3 0.131 0.032 0.313 2-1-3 0.141 0.036 0.343
0-4-4 0.150 0.040 0.377 2-1-4 0.166 0.046 0.447
0-4-5 0.169 0.048 0.462 2-1-5 0.192 0.057 0.571
0-5-0 0.094 0.016 0.221 2-2-0 0.093 0.016 0.218
0-5-1 0.113 0.024 0.265 2-2-1 0.118 0.026 0.276
0-5-2 0.133 0.032 0.317 2-2-2 0.143 0.036 0.349
0-5-3 0.152 0.040 0.382 2-2-3 0.168 0.047 0.456
0-5-4 0.171 0.048 0.470 2-2-4 0.194 0.058 0.581
0-5-5 0.190 0.056 0.563 2-2-5 0.221 0.069 0.675
1-0-0 0.020 0.003 0.068 2-3-0 0.119 0.026 0.279
1-0-1 0.040 0.003 0.108 2-3-1 0.144 0.037 0.355
1-0-2 0.060 0.003 0.149 2-3-2 0.170 0.048 0.467
1-0-3 0.081 0.011 0.191 2-3-3 0.197 0.059 0.591
1-0-4 0.101 0.019 0.236 2-3-4 0.223 0.070 0.683
1-0-5 0.122 0.028 0.287 2-3-5 0.251 0.082 0.759

30
Combination of Positives MPN Index
95% Confidence Limits Combination of Positives MPN Index
95% Confidence Limits
Lower Upper Lower Upper
1-1-0 0.040 0.003 0.109 2-4-0 0.146 0.038 0.361
1-1-1 0.061 0.003 0.150 2-4-1 0.172 0.049 0.477
1-1-2 0.081 0.011 0.192 2-4-2 0.199 0.060 0.600
1-1-3 0.102 0.019 0.238 2-4-3 0.226 0.072 0.692
1-1-4 0.123 0.028 0.290 2-4-4 0.254 0.083 0.768
1-1-5 0.144 0.037 0.354 2-4-5 0.282 0.094 0.836
1-2-0 0.061 0.003 0.151 2-5-0 0.174 0.050 0.488
1-2-1 0.082 0.012 0.194 2-5-1 0.201 0.061 0.610
1-2-2 0.103 0.020 0.240 2-5-2 0.229 0.073 0.700
1-2-3 0.124 0.029 0.293 2-5-3 0.257 0.084 0.776
1-2-4 0.146 0.038 0.359 2-5-4 0.286 0.095 0.845
1-2-5 0.167 0.047 0.451 2-5-5 0.315 0.107 0.910
3-0-0 0.079 0.010 0.188 4-3-0 0.271 0.090 0.809
3-0-1 0.106 0.021 0.246 4-3-1 0.326 0.111 0.934
3-0-2 0.135 0.033 0.323 4-3-2 0.386 0.132 1.060
3-0-3 0.165 0.046 0.440 4-3-3 0.451 0.154 1.192
3-0-4 0.196 0.059 0.589 4-3-4 0.521 0.176 1.331
3-0-5 0.229 0.073 0.699 4-3-5 0.593 0.196 1.477
3-1-0 0.107 0.022 0.250 4-4-0 0.335 0.114 0.953
3-1-1 0.137 0.034 0.329 4-4-1 0.398 0.137 1.084
3-1-2 0.167 0.047 0.452 4-4-2 0.466 0.159 1.223
3-1-3 0.199 0.060 0.601 4-4-3 0.539 0.181 1.368
3-1-4 0.232 0.074 0.710 4-4-4 0.615 0.202 1.521
3-1-5 0.267 0.088 0.800 4-4-5 0.693 0.223 1.681
3-2-0 0.138 0.035 0.335 4-5-0 0.411 0.141 1.111
3-2-1 0.170 0.048 0.464 4-5-1 0.483 0.164 1.256
3-2-2 0.202 0.062 0.613 4-5-2 0.559 0.187 1.409
3-2-3 0.236 0.076 0.720 4-5-3 0.639 0.209 1.570
3-2-4 0.271 0.090 0.810 4-5-4 0.722 0.230 1.739
3-2-5 0.308 0.104 0.894 4-5-5 0.806 0.250 1.916
3-3-0 0.172 0.049 0.477 5-0-0 0.240 0.076 0.763
3-3-1 0.205 0.063 0.624 5-0-1 0.314 0.106 0.908
3-3-2 0.240 0.077 0.731 5-0-2 0.427 0.146 1.142
3-3-3 0.276 0.092 0.821 5-0-3 0.578 0.192 1.446
3-3-4 0.313 0.106 0.906 5-0-4 0.759 0.239 1.816
3-3-5 0.352 0.120 0.989 5-0-5 0.953 0.165 2.234
3-4-0 0.209 0.064 0.636 5-1-0 0.329 0.112 0.940
3-4-1 0.244 0.079 0.742 5-1-1 0.456 0.156 1.202
3-4-2 0.281 0.093 0.833 5-1-2 0.631 0.207 1.553
3-4-3 0.319 0.108 0.918 5-1-3 0.839 0.257 1.985
3-4-4 0.358 0.123 1.002 5-1-4 1.062 0.304 2.485
3-4-5 0.399 0.137 1.086 5-1-5 1.293 0.304 3.090

31
Combination of Positives MPN Index
95% Confidence Limits Combination of Positives MPN Index
95% Confidence Limits
Lower Upper Lower Upper
3-5-0 0.248 0.080 0.753 5-2-0 0.493 0.167 1.276
3-5-1 0.286 0.095 0.844 5-2-1 0.700 0.224 1.694
3-5-2 0.325 0.110 0.931 5-2-2 0.944 0.280 2.213
3-5-3 0.365 0.125 1.017 5-2-3 1.205 0.331 2.843
3-5-4 0.407 0.140 1.103 5-2-4 1.479 0.381 3.714
3-5-5 0.450 0.154 1.189 5-2-5 1.767 0.503 5.230
4-0-0 0.130 0.031 0.311 5-3-0 0.792 0.247 1.886
4-0-1 0.166 0.046 0.445 5-3-1 1.086 0.308 2.544
4-0-2 0.207 0.064 0.631 5-3-2 1.406 0.368 3.445
4-0-3 0.253 0.082 0.764 5-3-3 1.750 0.434 5.131
4-0-4 0.302 0.102 0.881 5-3-4 2.122 0.529 6.798
4-0-5 0.355 0.121 0.996 5-3-5 2.527 0.814 7.971
4-1-0 0.169 0.048 0.460 5-4-0 1.299 0.348 3.108
4-1-1 0.212 0.066 0.646 5-4-1 1.724 0.429 4.975
4-1-2 0.258 0.085 0.779 5-4-2 2.212 0.563 7.087
4-1-3 0.310 0.105 0.898 5-4-3 2.781 0.882 8.600
4-1-4 0.365 0.125 1.016 5-4-4 3.454 1.159 10.110
4-1-5 0.425 0.145 1.138 5-4-5 4.256 1.437 11.800
4-2-0 0.216 0.067 0.661 5-5-0 2.398 0.762 7.629
4-2-1 0.264 0.087 0.794 5-5-1 3.477 1.172 10.160
4-2-2 0.317 0.108 0.915 5-5-2 5.422 1.791 14.190
4-2-3 0.375 0.129 1.037 5-5-3 9.178 2.672 22.010
4-2-4 0.438 0.150 1.164 5-5-4 16.090 3.837 41.030
4-2-5 0.504 0.171 1.297 5-5-5 >16.090 3.837 ----- (1)Table was developed using the MPN calculator developed by Albert Klee (Reference 15.10).

32

33
12.0Protocol Performance
Culture-based procedures were evaluated for V. cholerae O1 and O139 in a reference matrix (PBS) and two matrices of interest (drinking water, surface water) during a single-laboratory verification study. Details regarding procedure performance are provided in the study report (Reference 15.11). Summary results from this evaluation are listed in Table 7.
Table 7. Summary of Results for V. cholerae O1 and O139 in Spiked PBS, Drinking Water, and Surface Water Samples(1)
Analyte Sample Location Spike level
Pre-Enrichment
in APW
Mean Recovery
(%)
Minimum Recovery
(%)
Maximum Recovery
(%)SD (%) RSD (%)
Phosphate Buffered Saline
O1 NA 129 6 hours 57.20 57.20 57.20 NA NA
O139 NA 253 6 hours 94.18 94.18 94.18 NA NA
Drinking Water
O1 NA 36 24 hours 84.91 25.25 125.39 49.30 58.06
O139 NA 34 24 hours 163.23 67.35 320.06 109.00 66.78
Surface Water
O1Site 1
129 6 hours 25.52 16.26 30.79 6.36 24.94
O1 129 24 hours 152.33 69.97 355.93 137.27 90.11
O1Site 2
129 6 hours 13.53 4.89 30.79 12.21 90.27
O1 129 24 hours 52.86 13.99 113.47 48.26 91.31
O139 Site 3 253 6 hours 88.62 35.62 181.17 66.75 75.32
O139 Site 4 253 6 hours 119.46 57.76 181.17 71.25 59.64
(1)These values are based on a 9-tube, as opposed to a 15-tube, MPN.APW – Alkaline peptone water NA – Not applicable SD – Standard deviation RSD – Relative standard deviation

34

35
13.0Pollution Prevention
13.1The solutions and reagents used in this method pose little threat to the environment when recycled and managed properly.
13.2Solutions and reagents should be prepared in volumes consistent with laboratory use to minimize the volume of expired materials to be disposed.

36

37
14.0 Waste Management
14.1It is the laboratory’s responsibility to comply with all federal, state, and local regulations governing waste management particularly the biohazard and hazardous waste identification rules and land disposal restrictions and to protect the air, water, and land by minimizing and controlling all releases from fume hoods and bench operations. Compliance with all sewage discharge permits and regulations is also required.
14.2Samples, reference materials, and equipment known or suspected to have viable V. cholerae O1 or O139 attached or contained must be sterilized prior to disposal.
14.3For further information on waste management, consult The Waste Management Manual for Laboratory Personnel (Reference 15.12) and Less Is Better: Laboratory Chemical Management for Waste Reduction (Reference 15.13), both available from the American Chemical Society’s Department of Government Relations and Science Policy, 1155 16th Street NW, Washington, DC 20036.

38

39
15.0References
15.1 National Center for Infectious Diseases, Centers for Disease Control and Prevention. 1999. “Isolation and Identification of Vibrio cholerae Serogroups O1 and O139.” In Laboratory Methods for the Diagnosis of Epidemic Dysentery and Cholera. J.P. Koplan, J.M. Hughes, M.L. Cohen, E.M.B. Samba, and A.B. Kabore (eds.). 41 – 54. Atlanta, GA: National Center for Infectious Diseases, Centers for Disease Control and Prevention. http://www.cdc.gov/ncidod/DBMD/diseaseinfo/cholera_lab_manual.htm
15.2 Kaysner, C.A. and Depaola, A., Jr. May 2004. “Vibrio.” In Bacteriological Analytical Manual Online. G.J. Jackson, R.I. Merker, and R. Bandler. (eds.) U.S. Food and Drug Administration. http://www.fda.gov/Food/ScienceResearch/LaboratoryMethods/BacteriologicalAnalyticalManualBAM/ucm070830.htm
15.3 U.S. Department of Health and Human Services, Centers for Disease Control and Prevention and National Institutes of Health. 2007. Biosafety in Microbiological and Biomedical Laboratories (BMBL), 5th Edition. Washington, D.C.: U.S. Government Printing Office. http://www.cdc.gov/OD/ohs/biosfty/bmbl5/bmbl5toc.htm
15.4 Alam, M., Sultana, M., Nair, G.B., Siddique, A.K., Hasan, N.A., Sack, R.B., Sack, D.A. Ahmed, K.U., Sadique, A., Watanabe, H., Grim, C.J., Huq, A., and Colwell, R.R. 2007. “Viable But Nonculturable Vibrio cholerae O1 in Biofilms in the Aquatic Environment and Their Role in Cholera Transmission.” Proceedings of the National Academy of Sciences. 104(45): 17801 – 17806.
15.5 American Chemical Society. 2000. Reagent Chemicals, American Chemical Society Specifications. New York, NY: American Chemical Society.
15.6 British Drug Houses, Ltd. 1957. AnalaR Standards for Laboratory Chemicals. 5th Edition. Poole, Dorset, U.K.: BDH, Ltd.
15.7 United States Pharmacopeia. 2005. United States Pharmacopeia and National Formulary 24. Rockville, MD: United States Pharmacopeial Convention.
15.8 Bordner, R.H. 2005. “Section 9020 – Quality Assurance/Quality Control.” In Standard Methods for the Examination of Water and Wastewater, 21st Edition. A.D. Eaton, L.S. Clesceri, E.W. Rice, A.E. Greenberg, and M.A.H. Franson (eds.). Washington, D.C.: American Public Health Association, American Water Works Association, and Water Environment Federation.
15.9 Wise, J. 1988. NIST Measurement Services: Liquid-In-Glass Thermometer Calibration Service, SP 250–23. Washington, D.C.: U.S. Department of Commerce, National Institute of Standards and Technology. http://ts.nist.gov/MeasurementServices/Calibrations/upload/SP250-23.pdf
15.10 Klee, A. J. 1993. “A Computer Program for the Determination of Most Probable Number and its Confidence Limits.” Journal of Microbiological Methods. 18(2): 91 – 98.
15.11 U.S. Environmental Protection Agency. Results of Single-Laboratory Verification of Culture-based Analytical Procedures for Vibrio Cholerae O1 and O139 in Drinking Water and Surface Water. Publication forthcoming; date and number to be determined.
15.12 American Chemical Society (ACS). 1990. The Waste Management Manual for Laboratory Personnel. Washington, D.C.: American Chemical Society Department of Government Relations and Science Policy.
15.13 American Chemical Society (ACS). 1985. Less Is Better: Laboratory Chemical Management for Waste Reduction. Washington, D.C.: American Chemical Society Department of Government Relations and Science Policy.

40
41
A
naly
sis
Dilu
tion
Sche
me
Qua
ntita
tive
16
.1
16.0Flowcharts

42
Iden
tifica
tion
Flow
char
t
16.2


Office of Research and Development (8101R) Washington, DC 20460
Official Business Penalty for Private Use $300
PRESORTED STANDARDPOSTAGE & FEES PAID
EPAPERMIT NO. G-35