
Stanbic Holdings Plc Annual Report and Financial ... elements... · Michael Blades** (Resigned: ......
125
Stanbic Holdings Plc Annual Report and Financial Statements For the year ended 31 December 2017
Transcript of Stanbic Holdings Plc Annual Report and Financial ... elements... · Michael Blades** (Resigned: ......

Stanbic Holdings Plc
Annual Report and Financial Statements
For the year ended 31 December 2017

Stanbic Holdings Plc Annual Report For the year ended 31 December 2017
Table of Contents
Corporate Information
2 Corporate information
Co
rpo
rate
Info
rmati
on
3 Report of the Directors
5 Statement of Directors’ responsibilities
6 Director’s Remuneration Report
9 Report of the independent auditor
Financial Statements
13 Consolidated and Company statement of profit or loss
Fin
an
cia
l S
tate
men
ts
14 Consolidated and Company statement of other comprehensive income
15 Consolidated and Company statement of financial position
16 Consolidated statement of changes in equity
18 Company statement of changes in equity
19 Consolidated and Company statement of cash flows
20 Notes to the financial statements
Stanbic Holdings Plc Annual Report For the year ended 31 December 2017
2
Corporate information Chairman: Fred N. Ojiambo, MBS, SC Chief Executive: Greg Brackenridge* Chief Executive of Stanbic Bank Kenya Limited: Philip Odera (Outgoing: 31 December 2017) Charles Mudiwa*** (Incoming: 1 January 2018) Non-Executive Directors: Kitili Mbathi Edward W. Njoroge Rose W. Kimotho Ruth T. Ngobi
Peter N. Gethi Christopher J. Blandford – Newson** Rose Osoro (Appointed: 25 September 2017) Dorcas Kombo (Appointed: 12 January 2018) Michael Blades** (Resigned: 23 February 2017)
**** South African *** South African & British **** Zimbabwean
Company secretary: Lillian N. Mbindyo P.O. Box 72833 00200 Nairobi Auditor: PricewaterhouseCoopers PwC Tower Waiyaki Way/Chiromo Road P.O. Box 43963 00100 Nairobi Registered office: Stanbic Bank Centre Chiromo Road P.O. Box 72833 00200 Nairobi Principal bankers: Stanbic Bank Kenya Limited
Chiromo Road P.O. Box 30550 00100 Nairobi GPO

Stanbic Holdings Plc Annual Report For the year ended 31 December 2017
3
Report of the Directors The Directors submit their report together with the audited financial statements for the year ended 31
December 2017, which disclose the state of affairs of Stanbic Holdings Plc (the “Group” or the
“Company”).
Principal activities The Group is engaged in the business of banking, insurance agency and stock broking and is licensed under the Banking Act and Capital Markets Act. The Company is listed on the Nairobi Securities Exchange. Business Review The Group has exposure to various risks from its operations. These are -:
a) Credit risk
b) Liquidity risk
c) Market risk
d) Operational risk
These are explained in more detail on Note 5 of the financial statements
The major result highlights were-;
The Group net profit of KShs 4,309,494,000 (2016: KShs 4,418,589,000) has been added to retained earnings.
Net interest income declined to KShs 10.6 billion compared to KShs 10.9 billion in 2016 due to
decrease in asset yields which was partly offset by a 13% growth in customer loans and advances. In
addition, the growth in transactional accounts resulted in lower cost of funds.
Non-interest revenue reported strong performance as the Group leveraged on technology to improve
our customers’ banking experience and successful closure of key deals in Investment Banking.
Loan loss provisions increased in the year compared to 2016 on account of a challenging operating
environment for some of our clients.
Dividends During the year, an interim dividend of KShs 1.25 (2016: KShs 1.77) per ordinary share amounting to KShs 494 million (2016: KShs 700 million) was paid. Subject to the approval of the shareholders at the Annual General Meeting, the Directors recommend payment of a final dividend of KShs 4.00 (2016: KShs 3.48) per ordinary share equivalent to a total sum of KShs 1,581 million (2016: KShs 1,375 million). The total dividend for the year, therefore, will be KShs 5.25 (2016: KShs 5.25) for every one ordinary share amounting to KShs 2,075 million (2016: KShs 2,075 million).
Stanbic Holdings Plc Annual Report For the year ended 31 December 2017
4
Share capital The total number of authorised shares as at 31 December 2017 was 473,684,211 (2016: 473,684,211), ordinary shares of KShs 5 each, with 395,321,638 shares being issued and fully paid up. Directors The Directors who held office during the year and to the date of this report are set out on page 2.
Events subsequent to the end of the reporting period There is no material event that has occurred between the end of the reporting period and the date of this report. Disclosures to auditors
The Directors confirm that with respect to each Director at the time of approval of this report:
a) there was, as far as each Director is aware, no relevant audit information of which the company’s
auditor is unaware; and
b) each Director had taken all steps that ought to have been taken as a Director so as to be aware of
any relevant audit information and to establish that the company’s auditor is aware of that
information.
Terms of appointment of auditors
PricewaterhouseCoopers continue in office in accordance with the Company's Articles of Association
and Section 721 of the Kenyan Companies Act, 2015.
The Directors monitor the effectiveness, objectivity and independence of the auditor. This responsibility
includes the approval of the audit engagement contract and the associated fees on behalf of the
shareholders.
Approval of financial statements The financial statements were approved by the Board of Directors on 2 March 2018. BY ORDER OF THE BOARD

Stanbic Holdings Plc Annual Report For the year ended 31 December 2017
5
Statement of Directors’ responsibilities The Kenyan Companies Act 2015 requires the Directors to prepare financial statements for each financial year which give a true and fair view of the financial position of the Group and Company at the end of the financial year and its financial performance for the year then ended. The Directors are responsible for ensuring that the Group and Company keeps proper accounting records that are sufficient to show and explain the transactions of the Group and Company; disclose with reasonable accuracy at any time the financial position of the Group and Company; and that enables them to prepare financial statements of the Group and Company that comply with prescribed financial reporting standards and the requirements of the Kenyan Companies Act. They are also responsible for safeguarding the assets of the Group and Company and for taking reasonable steps for the prevention and detection of fraud and other irregularities. The Directors accept responsibility for the preparation and presentation of these financial statements in accordance with International Financial Reporting Standards and in the manner required by the Companies Act 2015. They also accept responsibility for:
i. Designing, implementing and maintaining internal control as they determine necessary to
enable the preparation of financial statements that are free from material misstatements,
whether due to fraud or error;
ii. Selecting suitable accounting policies and then apply them consistently; and iii. Making judgements and accounting estimates that are reasonable in the circumstances
In preparing the financial statements, the Directors have assessed the Group’s and Company’s ability to continue as a going concern and disclosed, as applicable, matters relating to the use of going concern basis of preparation of the financial statements. Nothing has come to the attention of the Directors to indicate that the Group and Company will not remain a going concern for at least the next twelve months from the date of this statement. The Directors acknowledge that the independent audit of the financial statements does not relieve them of their responsibility.
Approved by the Board of Directors on 2 March 2018 and signed on its behalf by:

Stanbic Holdings Plc Annual Report For the year ended 31 December 2017
6
Directors’ Remuneration Report Information Not Subject to Audit The Company’s Board Remuneration Policy The Company’s Board remuneration policy is designed to create value for shareholders, clients, our employees and communities while retaining and motivating an effective Board of Directors. In determining the remuneration fee for Non-Executive Directors, the Board will ensure that regular surveys are conducted on the remuneration of Non-Executive Directors on the boards of peer listed companies. The level of remuneration and compensation for Non-Executive Directors (NEDs) must be set to attract independent NEDs who, together with the Board as a whole, encompass a varied range of relevant skills and experience to determine the Company’s strategy and oversee implementation. The NEDs are paid an annual fee on a pro-rata basis and sitting allowance for meetings attended. The remuneration for NEDs is reviewed on an annual basis for approval by the shareholders of the Company at the annual general meeting. A schedule of the remuneration to be paid is submitted to the Remuneration Committee for Standard Bank Group on annual basis. The NEDs are to be appropriately reimbursed for expenses such as travel and subsistence incurred in the performance of their duties. Disclosure of the Board’s remuneration is made in the annual financial report of the Company in the Board Remuneration Report as guided by law. The chairman on the Board is paid a taxable retainer of Kshs 400,000 per annum and a sitting allowance of Kshs 180,000 for every meeting attended. The other members of the board are paid a taxable retainer of Kshs 75,000 per quarter and a sitting allowance of Kshs 120,000 for every meeting attended. The members of the Board can access loans and guarantees at the prevailing market rates.
Contract of service
In accordance with the Kenyan Companies Act, 2015, the Company’s Articles of Association and as
outlined in the letters of appointment for Directors, a third of Non-Executive Directors retire by
rotation at every annual general meeting and if eligible, may offer themselves for re-election by
shareholders.
The Chief Executive was appointed in accordance to the Company’s Articles of Association,
paragraph 144, which states that;
• The Board may from time to time appoint one or more of its body to any executive office in the
management of the Company as the Board shall determine, for such period and upon such
terms as it thinks fit and, subject to the provisions of any agreement entered into in any
particular case, may revoke such appointment.
Statement of Voting on the Directors Remuneration Report at the Previous Annual General Meeting
During the Annual General Meeting held on 5 May 2017, the shareholders approved the payments
of Directors Fees for the year ended 31 December 2017.
At the Annual General Meeting to be held on 12 June 2018, approval will be sought from
shareholders to pay Director Fees for the financial year ending 31 December 2018.

Stanbic Holdings Plc Annual Report For the year ended 31 December 2017
7
Directors’ Remuneration Report
Information Subject to Audit
Year ended 31 December 2017
Name Category Retainer Sitting allowance
Total Company Total Group subsidiaries
Total Group
Fred Ojiambo Chairman Non - Executive 400,000 900,000 1,300,000 4,666,000 5,966,000
*Greg Brackenridge Chief Executive - - - - -
Michael Blades Non - Executive - - - 5,932,500 5,932,500
Kitili Mbathi Non - Executive 300,000 840,000 1,140,000 4,651,420 5,791,420
Christopher Newson Non - Executive 150,000 540,000 690,000 4,415,420 5,105,420
Edward W. Njoroge Non - Executive 300,000 600,000 900,000 2,615,420 3,515,420
Rose Kimotho Non - Executive 300,000 600,000 900,000 3,279,420 4,179,420
Ruth T. Ngobi Non - Executive 300,000 840,000 1,140,000 4,179,420 5,319,420
Peter Nderitu Gethi Non - Executive 300,000 600,000 900,000 3,740,420 4,640,420
Rose Osoro Non - Executive 75,000 120,000 195,000 594,855 789,855
Total 2,125,000 5,040,000 7,165,000 34,074,875 41,239,875
*In line with Standard Bank Group’s transfer pricing policy, Greg Brackenridge’s function is a group oversight role and therefore the majority shareholder, Standard Bank of South Africa Limited, bears all his employment costs and benefits. Those costs and benefits are not recharged to Stanbic Holdings Plc.

Stanbic Holdings Plc Annual Report For the year ended 31 December 2017
8
Directors’ Remuneration Report
Information Subject To Audit
Year ended 31 December 2016
Name Category Retainer Sitting allowance
Total Company Total Group subsidiaries
Total Group
Fred Ojiambo Chairman Non - Executive 400,000 1,260,000 1,660,000 3,932,000 5,592,000
*Greg Brackenridge Chief Executive - - - - -
Michael Blades Non - Executive - - - 55,453,198 55,453,198
Charles Muchene Non - Executive 300,000 480,000 780,000 2,615,000 3,395,000
Kitili Mbathi Non - Executive 300,000 840,000 1,140,000 3,690,000 4,830,000
Christopher Newson Non - Executive 300,000 480,000 780,000 3,380,000 4,160,000
Edward W. Njoroge Non - Executive 300,000 840,000 1,140,000 2,860,000 4,000,000
Rose Kimotho Non - Executive 300,000 840,000 1,140,000 3,480,000 4,620,000
Ruth T. Ngobi Non - Executive 300,000 840,000 1,140,000 3,900,000 5,040,000
Peter Nderitu Gethi Non - Executive 300,000 720,000 1,020,000 3,280,000 4,300,000
Total 2,500,000 6,300,000 8,800,000 82,590,198 91,390,198 *In line with Standard Bank Group’s transfer pricing policy, Greg Brackenridge’s function is a group oversight role and therefore the majority shareholder, Standard Bank of South Africa Limited, bears all his employment costs and benefits. Those costs and benefits are not recharged to Stanbic Holdings Plc.

PricewaterhouseCoopers CPA. PwC Tower, Waiyaki Way/Chiromo Road, Westlands P O Box 43963 – 00100 Nairobi, Kenya T: +254 (20)285 5000 F: +254 (20)285 5001 www.pwc.com/ke Partners: A Eriksson E Kerich B Kimacia K Muchiru M Mugasa A Murage F Muriu P Ngahu R Njoroge S N Ochieng' B Okundi K Saiti
Independent auditor’s report to the shareholders of Stanbic Holdings Plc
Report on the audit of the financial statements
Our opinion
We have audited the accompanying separate financial statements of Stanbic Holdings Plc (the Company) and the consolidated financial statements of the Company and its subsidiaries (together, the Group) set out on pages 13 to 124, which each comprise a statement of financial position at 31 December 2017 and statements of profit or loss and other comprehensive income, changes in equity and cash flows for the year then ended, and notes, including a summary of significant accounting policies.
In our opinion, the financial statements give a true and fair view of the financial position of the Group and of the Company at 31 December 2017 and of their financial performance and cash flows for the year then ended in accordance with International Financial Reporting Standards and the requirements of the Kenyan Companies Act, 2015.
Basis for opinion
We conducted our audit in accordance with International Standards on Auditing (ISAs). Our responsibilities under those standards are further described in the Auditor’s responsibilities for the audit of the financial statements section of our report.
We are independent of the company in accordance with the International Ethics Standards Board for Accountants’ Code of Ethics for Professional Accountants (IESBA Code) together with the ethical requirements that are relevant to our audit of the financial statements in Kenya, and we have fulfilled our ethical responsibilities in accordance with these requirements and the IESBA Code.
We believe that the audit evidence we have obtained is sufficient and appropriate to provide a basis for our opinion.
Key audit matters
Key audit matters are those matters that, in our professional judgement, were of most significance in our audit of the financial statements of the current period. These matters were addressed in the context of our audit of the financial statements as a whole, and in forming our opinion thereon, and we do not provide a separate opinion on these matters.
Key audit matter How our audit addressed the matter
Credit risk and provision for impairment loss on loans and advances to customers
Impairment of loans and advances is a key audit matter due to the significant judgment applied in estimating the loan loss provisions. As explained in Note 2(h) of the financial statements, the directors make complex and subjective judgments when estimating these provisions. Credit risk arises from lending to customers and other banks. Loans and advances accounted for 52% of the Group’s total assets as at 31 December 2017. The carrying value of these balances may be materially misstated if impairment loss thereon is not appropriately identified and estimated. The business is structured into two segments, Corporate and Investment Banking (CIB) and Personal and Business Banking (PBB). Impairment calculation on loans and advances
We assessed and tested the design and operating effectiveness of the controls over impairment data and calculations. These controls included those over the identification of loans and advances that were impaired and the calculation of the impairment provisions.
In addition, we examined a sample of loans and advances which had not been identified by management as potentially impaired and formed our own judgment as to whether that was appropriate by using external evidence in respect of the relevant counterparties. Where impairment was individually calculated, we tested a sample of loans and advances to ascertain whether the loss event (that is the point at which impairment is recognised) had been identified in a timely manner including, where relevant, how forbearance had been considered. Further, where

Independent auditor’s report to the shareholders of Stanbic Holdings Plc (continued)
10
Key audit matter How our audit addressed the matter
follows this categorisation. For CIB accounts, a significant portion of the impairment provisions on non-performing loans and advances, and this is calculated individually for each loan as the difference between the carrying amount and the present value of estimated future cash flows discounted at the original effective interest rate of the loan. Where no evidence of impairment exists for an individually assessed financial asset, the asset is included in a group of financial assets with similar credit risk characteristics and collectively assessed for impairment using an unidentified corporate impairment model. For PBB customers, the impairment is calculated using models. The key inputs to the model are the roll-rates and probability of default (PD) based on the facility category. Each type of facility also carries a varied loss given default factor.
specific impairment was calculated, we examined the reasonableness of the expected future recoverable amounts as assessed by management to support the calculation of the impairment. We assessed the assumptions and compared estimates to external evidence where available. Where impairment was calculated using a model, we tested the basis and operation of those models and the data and assumptions used. Our audit procedures included: - Comparison of the principal assumptions
made with our own knowledge of other practices and actual experience.
- Testing the operation of the models used to calculate the impairment including, in some cases, developing independent expectations and comparing results.
- Considering the potential effect of events which were not captured by management’s models and evaluating how management has responded to these events by making further adjustments to the models where appropriate.
Goodwill impairment assessment As shown in Note 29 of the financial statements, the directors assess the impairment of goodwill arising from acquisitions at the cash generating unit level using value-in-use calculations. Goodwill arises on the acquisition of subsidiaries and represents the excess of the consideration transferred over the fair value of the net identifiable assets, liabilities and contingent liabilities of the acquiree and the fair value of the non-controlling interest in the acquiree. We focused on the goodwill impairment assessment because the value-in-use calculations involve significant judgements and estimates about the future results of the cash generating units and the applicable discount rates. In assessing value in use, the estimated future cash flows are discounted to their present value using a pre-tax discount rate that reflects current market assessments of the time value of money and the risks specific to the asset. Goodwill is allocated to the Bank’s two cash generating units – CIB and PBB, that represent the lowest level at which financial performance is monitored.
We evaluated the composition of management’s future cash flow forecasts and the underlying assumptions based on the historical performance of the business, industry-specific reports and the macro economic outlook. We assessed the projected cash flows against the approved strategic and business plan of the cash generating unit.
We assessed the reasonableness of the forecast cash flows based on recent actual performance and the approved short-term financial budgets of the business.
We also assessed management’s assumptions in relation to the:
- Long term growth rates by comparing them to economic and industry forecasts
- Pre-tax discount rate by assessing the cost of capital for the company and comparable organisations, as well as considering country specific factors
We assessed the sensitivity of the parameters in the calculations and determined that the calculations were most sensitive to assumptions for gross margin and the pre-tax discount rates as disclosed in Note 29 of the financial statements.

Independent auditor’s report to the shareholders of Stanbic Holdings Plc (continued)
11
Other information
The directors are responsible for the other information. The other information comprises the Corporate information, Report of the Directors, Statement of Directors responsibilities and the Board Remuneration report (but does not include the financial statements and our auditor’s report thereon), which we obtained prior to the date of this auditor’s report, and the Group overview, Business review including Chairman’s and Chief Executive’s statements, Sustainability report, Transparency and accountability reports and Shareholders’ information, which are expected to be made available to us after the audit report date.
Our opinion on the financial statements does not cover the other information and we do not express any form of assurance conclusion thereon.
In connection with our audit of the financial statements, our responsibility is to read the other information identified above and, in doing so, consider whether the other information is materially inconsistent with the financial statements or our knowledge obtained in the audit, or otherwise appears to be materially misstated. If, based on the work we have performed on the other information obtained prior to the date of this auditor’s report, we conclude that there is a material misstatement of this other information, we are required to report that fact. We have nothing to report in this regard.
When we read the other information not yet received as described above, if we conclude that there is a material misstatement therein, we are required to communicate the matter to those charged with governance.
Responsibilities of the directors for the financial statements
The directors are responsible for the preparation and fair presentation of the financial statements in accordance with International Financial Reporting Standards and the requirements of the Kenyan Companies Act, 2015, and for such internal control as the directors determine is necessary to enable the preparation of financial statements that are free from material misstatement, whether due to fraud or error.
In preparing the financial statements, the directors are responsible for assessing the Group’s ability to continue as a going concern, disclosing, as applicable, matters related to going concern and using the going concern basis of accounting unless the directors either intend to liquidate the Group or to cease operations, or have no realistic alternative but to do so.
Auditor’s responsibilities for the audit of the financial statements
Our objectives are to obtain reasonable assurance about whether the financial statements as a whole are free from material misstatement, whether due to fraud or error, and to issue an auditor’s report that includes our opinion. Reasonable assurance is a high level of assurance, but is not a guarantee that an audit conducted in accordance with ISAs will always detect a material misstatement when it exists. Misstatements can arise from fraud or error and are considered material if, individually or in the aggregate, they could reasonably be expected to influence the economic decisions of users taken on the basis of these financial statements.
As part of an audit in accordance with ISAs, we exercise professional judgement and maintain professional scepticism throughout the audit. We also:
● Identify and assess the risks of material misstatement of the financial statements, whether due to
fraud or error, design and perform audit procedures responsive to those risks, and obtain audit
evidence that is sufficient and appropriate to provide a basis for our opinion. The risk of not
detecting a material misstatement resulting from fraud is higher than for one resulting from error,
as fraud may involve collusion, forgery, intentional omissions, misrepresentations, or the override of
internal control.
● Obtain an understanding of internal control relevant to the audit in order to design audit procedures
that are appropriate in the circumstances, but not for the purpose of expressing an opinion on the
effectiveness of the Group’s internal control.

Independent auditor’s report to the shareholders of Stanbic Holdings Plc (continued)
12
Auditor’s responsibilities for the audit of the financial statements (continued)
● Evaluate the appropriateness of accounting policies used and the reasonableness of accounting
estimates and related disclosures made by the directors.
● Conclude on the appropriateness of the directors’ use of the going concern basis of accounting and,
based on the audit evidence obtained, whether a material uncertainty exists related to events or
conditions that may cast significant doubt on the Group’s ability to continue as a going concern. If
we conclude that a material uncertainty exists, we are required to draw attention in our auditor’s
report to the related disclosures in the financial statements or, if such disclosures are inadequate, to
modify our opinion. Our conclusions are based on the audit evidence obtained up to the date of our
auditor’s report. However, future events or conditions may cause the Group to cease to continue as a
going concern.
● Evaluate the overall presentation, structure and content of the financial statements, including the
disclosures, and whether the financial statements represent the underlying transactions and events
in a manner that achieves fair presentation.
● Obtain sufficient appropriate audit evidence regarding the financial information of the entities or
business activities within the Group to express an opinion on the Group’s financial statements. We
are responsible for the direction, supervision and performance of the Group audit. We remain solely
responsible for our audit opinion.
We communicate with the directors regarding, among other matters, the planned scope and timing of the audit and significant audit findings, including any significant deficiencies in internal control that we identify during our audit.
We also provide the directors with a statement that we have complied with relevant ethical requirements regarding independence, and to communicate with them all relationships and other matters that may reasonably be thought to bear on our independence, and where applicable, related safeguards.
From the matters communicated with the directors, we determine those matters that were of most significance in the audit of the Group’s financial statements of the current period and are therefore the key audit matters. We describe these matters in our auditor’s report unless law or regulation precludes public disclosure about the matter or when, in extremely rare circumstances, we determine that a matter should not be communicated in our report because the adverse consequences of doing so would reasonably be expected to outweigh the public interest benefits of such communication.
Report on other matters prescribed by the Kenyan Companies Act, 2015
Report of the directors
In our opinion the information given in the report of the directors on pages 3 to 4 is consistent with the financial statements.
Directors’ remuneration report
In our opinion the auditable part of the directors’ remuneration report on pages 7 to 8 has been properly prepared in accordance with the Kenyan Companies Act, 2015.
The engagement partner responsible for the audit resulting in this independent auditor’s report is CPA Kang’e Saiti – Practising Certificate No. 1652.

Stanbic Holdings Plc Financial statements For the year ended 31 December 2017
13
Consolidated and Company statement of profit or loss
For the year ended 31 December
Group Company
2017 2016 2017 2016 Note KShs'000 KShs'000 KShs'000 KShs'000
Interest income 6
16,608,234 17,127,042 4,901 22,451
Interest expense 7
(5,963,953) (6,266,995) - -
Net interest income
10,644,281 10,860,047 4,901 22,451
Credit impairment charges on loans and advances 22(d)
(2,761,325) (1,751,812) - -
Net interest income after credit impairment charges
7,882,956 9,108,235 4,901 22,451
Fees and commission revenue 8
4,348,008 3,242,504 - -
Fees and commission expense 9
(401,215) (337,539) - -
Net fee and commission revenue
3,946,793 2,904,965 - -
Trading revenue 10
4,403,510 4,723,253 - -
Other income 11
69,805 29,093 1,900,274 2,846,066
Other operating income
4,473,315 4,752,346 1,900,274 2,846,066
Total income
16,303,064 16,765,546 1,905,175 2,868,517
Employee benefits expense 12
(5,735,195) (5,440,584) - -
Other expenses
(4,268,006) (3,543,883) (26,422) (28,838) Depreciation and amortisation expense 13 (612,933) (517,500) - -
Finance costs 14 (285,682) (1,214,493) (524) (456)
Total operating, administration and general expenses
(10,901,816) (10,716,460) (26,946) (29,294)
Profit before income tax
5,401,248 6,049,086 1,878,229 2,839,223
Income tax expense 15
(1,091,754) (1,630,497) (1,339) (6,664)
Profit for the year 4,309,494 4,418,589 1,876,890 2,832,559
Earnings per share (basic and
diluted) 16 10.90 11.18 4.75 7.17
The notes set out on pages 20 to 124 form an integral part of these financial statements.

Stanbic Holdings Plc Financial statements For the year ended 31 December 2017
14
Consolidated and Company statement of other comprehensive income
For the year ended 31 December Group Company 2017 2016 2017 2016 Note KShs'000 KShs'000 KShs'000 KShs'000
Profit for the year 4,309,494 4,418,589 1,876,890 2,832,559
Other comprehensive income for the year, net of income tax
Items that may be subsequently reclassified to profit or loss
Currency translation differences for foreign operations
74,400 220,306 - -
Fair value changes on available-for-sale financial assets, net of income tax 20(b)
298,645 (29,490) - -
Total other comprehensive income for the year, net of income tax
373,045 190,816 - -
Total comprehensive income for the year 4,682,539 4,609,405 1,876,890 2,832,559
The notes set out on pages 20 to 124 form an integral part of these financial statements.

Stanbic Holdings Plc Financial statements For the year ended 31 December 2017
15
Consolidated and Company statement of financial position
Group Company
As at 31 December As at 31 December
Note 2017 2016 2017 2016
KShs'000 KShs'000 KShs'000 KShs'000
Assets Cash and balances with Central Bank of
Kenya 18 8,044,783 8,621,228 - -
Financial investments 20 71,329,763 50,032,732 - -
Available-for-sale pledged assets 19 4,915,107 2,894,456 - -
Derivative assets 31 2,391,101 2,472,191 - -
Loans and advances to banks 22 (a) 12,743,630 16,988,881 111,803 100,662
Loans and advances to customers 22 (b) 130,535,814 115,587,723 - -
Other assets and prepayments 23 3,220,570 3,817,487 - -
Other investments 25 17,500 - 18,217,512 18,175,338
Property and equipment 26 2,256,275 2,207,965 - -
Prepaid operating lease 27 50,947 53,901 - -
Other intangible assets 28 1,356,050 1,135,496 - -
Intangible assets - goodwill 29 9,349,759 9,349,759 - -
Current income tax 35 (b) 83,026 113,547 18,054 18,872
Deferred income tax 35 (c) 2,444,394 1,407,363 203 -
Total assets 248,738,719 214,682,729 18,347,572 18,294,872
Liabilities and equity
Liabilities
Derivative liabilities 31 2,427,563 3,061,063 - - Financial liabilities at fair value through profit
or loss 21 362,630 3,867,718 - -
Deposits from banks 32 (a) 38,707,135 36,506,824 - -
Deposits from customers 32 (b) 154,660,772 119,328,219 - -
Other liabilities and accrued expenses 34 5,596,830 6,389,083 105,801 60,110
Borrowings 33 3,989,243 3,986,138 - -
Current income tax 35 (a) - 1,402,810 - -
Deferred income tax 35 (d) 38,859 - - 11
Total liabilities 205,783,032 174,541,855 105,801 60,121
Equity
Ordinary share capital 30 (b) 1,976,608 1,976,608 1,976,608 1,976,608
Ordinary share premium 30 (c) 16,897,389 16,897,389 16,897,389 16,897,389
Other reserves 40 (448,316) (758,058) - -
Retained earnings 22,948,720 20,649,216 (2,213,513) (2,014,965)
Proposed dividend 17 1,581,286 1,375,719 1,581,287 1,375,719
Total equity 42,955,687 40,140,874 18,241,771 18,234,751
Total equity and liabilities 248,738,719 214,682,729 18,347,572 18,294,872
The notes set out on pages 20 to 124 form an integral part of these financial statements.

Stanbic Holdings Plc Financial statements For the year ended 31 December 2017
16
Consolidated statement of changes in equity
Attributable to equity holders
Share Capital
Share Premium
Other Reserves
Retained Earnings
Proposed Dividends Total Equity
For the year ended 31 December 2017 Note KShs’000 KShs’000 KShs’000 KShs’000 KShs’000 KShs’000
1,976,608 16,897,389 (758,058) 20,649,216 1,375,719 40,140,874
At 1 January 2017
Profit for the year
- - - 4,309,494 - 4,309,494
Other comprehensive income, net of tax
- - 373,045 - - 373,045
Transfer from statutory credit risk reserve
- - (65,449) 65,449 - -
Transactions with owners, recorded directly in equity Contributions by and distributions to owners of the Group
Dividends to equity holders - dividend paid 17 - - - (494,153) (1,375,719) (1,869,872)
Proposed dividend 17 - - - (1,581,286) 1,581,286 -
Share based payment reserve 41 - - 2,146 - - 2,146
Total transactions with owners
- -
2,146
(2,075,439)
(205,567)
(1,867,726)
At 31 December 2017
1,976,608 16,897,389 (448,316) 22,948,720 1,581,286 42,955,687
The notes set out on pages 20 to 124 form an integral part of these financial statements.
Stanbic Holdings Plc Financial statements For the year ended 31 December 2016
17
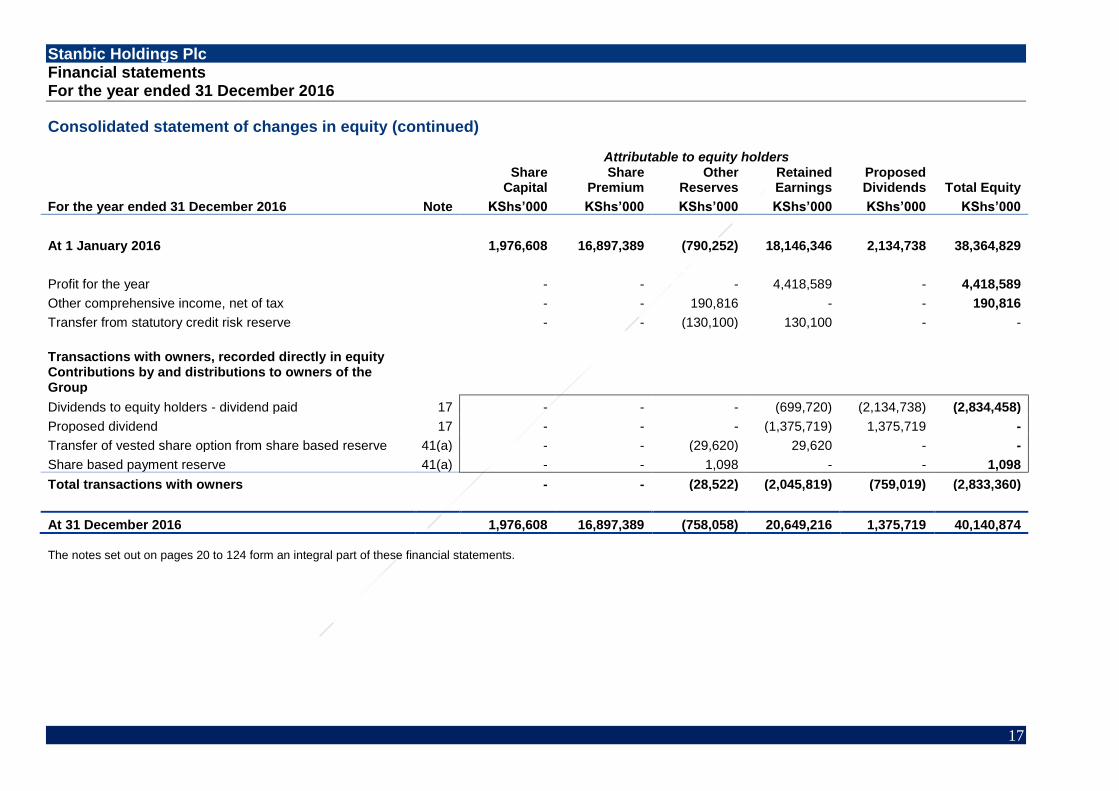
Consolidated statement of changes in equity (continued)
Attributable to equity holders
Share Capital
Share Premium
Other Reserves
Retained Earnings
Proposed Dividends Total Equity
For the year ended 31 December 2016 Note KShs’000 KShs’000 KShs’000 KShs’000 KShs’000 KShs’000
At 1 January 2016
1,976,608 16,897,389 (790,252) 18,146,346 2,134,738 38,364,829
Profit for the year
- - - 4,418,589 - 4,418,589
Other comprehensive income, net of tax
- - 190,816 - - 190,816
Transfer from statutory credit risk reserve
- - (130,100) 130,100 - -
Transactions with owners, recorded directly in equity Contributions by and distributions to owners of the Group
Dividends to equity holders - dividend paid 17 - - - (699,720) (2,134,738) (2,834,458)
Proposed dividend 17 - - - (1,375,719) 1,375,719 -
Transfer of vested share option from share based reserve 41(a) - - (29,620) 29,620 - -
Share based payment reserve 41(a) - - 1,098 - - 1,098
Total transactions with owners
- - (28,522) (2,045,819) (759,019) (2,833,360)
At 31 December 2016
1,976,608 16,897,389 (758,058) 20,649,216 1,375,719 40,140,874
The notes set out on pages 20 to 124 form an integral part of these financial statements.

Stanbic Holdings Plc Financial statements For the year ended 31 December 2017
18
Company statement of changes in equity
Attributable to equity holders
Note Share Capital
Share Premium
Retained Earnings
Proposed Dividend Total Equity
Year ended 31 December 2017 KShs’000 KShs’000 KShs’000 KShs’000 KShs’000
At 1 January 2017 1,976,608 16,897,389 (2,014,965) 1,375,719 18,234,751
Profit for the year 1,876,890 - 1,876,890 Other Comprehensive income, net of tax - - - - - Contribution and distributions to owners
Dividends to equity holders - dividend paid 17 - - (494,152) (1,375,719) (1,869,871) Dividends to equity holders - proposed dividend 17 - - (1,581,287) 1,581,287 -
Total contributions by and distributions to owners - - (2,075,439) 205,568 (1,869,871)
At 31 December 2017 1,976,608 16,897,389 (2,213,514) 1,581,287 18,241,770
Attributable to equity holders
Note Share Capital
Share Premium
Retained Earnings
Proposed Dividend Total Equity
Year ended 31 December 2016 KShs’000 KShs’000 KShs’000 KShs’000 KShs’000
At 1 January 2016 1,976,608 16,897,389 (2,772,085) 2,134,738 18,236,650
Profit for the year - - 2,832,559 - 2,832,559 Other Comprehensive income, net of tax - - - - - Contribution and distributions to owners
Dividends to equity holders - dividend paid 17 - - (699,720) (2,134,738) (2,834,458) Dividends to equity holders - proposed dividend 17 - - (1,375,719) 1,375,719 -
Total contributions by and distributions to owners - - (2,075,439) (759,019) (2,834,458)
At 31 December 2016 1,976,608 16,897,389 (2,014,965) 1,375,719 18,234,751
The notes set out on pages 20 to 124 form an integral part of these financial statements.

Stanbic Holdings Plc Financial statements For the year ended 31 December 2017
19
Consolidated and Company statement of cash flows Group Company
2017 2016 2017 2016
Note
Kshs’000 Kshs’000 Kshs’000 Kshs’000
Cash flows from operating activities
5,461,758 8,256,564
1,878,230 2,839,223
Income tax paid
(3,483,127) (990,384)
(736) (31,437)
Cash flows from operating activities before changes
in operating assets and liabilities
1,978,631 7,266,180
1,877,494 2,807,786
Changes in operating assets and liabilities:
Loans and advances to customers
(14,948,087) (10,606,157)
- -
Financial investments
(17,099,802) (8,137,509)
- -
Deposits held for regulatory purposes (Restricted cash)
1,718,913 (455,888)
- -
Other assets and prepayments
596,916 (1,108,187)
- 1,651
Deposits with banks
255,634 (12,300,360)
- -
Other liabilities and accrued expenses
(792,253) 427,820
45,691 16,843
Customer deposits
35,332,553 13,081,984
- -
Trading liabilities
(3,505,088) 3,345,745
- -
Net cash generated from operating activities
3,537,417 (8,486,372)
1,923,185 2,826,280
Cash flows from investing activities:
Additions to property and equipment (457,254) (373,581)
- -
Additions to intangible assets
(453,913) (558,470)
- -
Proceeds from sale of property and equipment
2,560 14,612
- -
Net cash used in investing activities
(908,607) (917,439)
- -
Cash flows from financing activities:
Other investments 25 (17,500) - - -
Investment in subsidiary 24 - - (42,174) -
Dividends paid
(1,869,872) (2,834,458)
(1,869,871) (2,834,457)
Decrease of borrowings
3,105 (2,495,924)
- -
Net cash used in financing activities
(1,884,267) (5,330,382)
(1,912,045) (2,834,457)
Net (decrease)/increase in cash and cash equivalents
744,543 (14,734,193)
11,140 (8,177)
Foreign currency translation differences
125,906 131,276
- -
Cash and cash equivalents at start of year
24,986,005 39,588,922
100,662 108,839
Cash and cash equivalents at end of year 36(b)
25,856,454 24,986,005
111,802 100,662
The notes set out on pages 20 to 124 form an integral part of these financial statements .

Stanbic Holdings Plc Financial statements For the year ended 31 December 2017
20
Notes
1 General information
Stanbic Holdings Plc is incorporated in Kenya under the Companies Act as a limited liability company, and is domiciled in Kenya. The address of its registered office is: Stanbic Centre Chiromo Road P O Box 72833 00200 Nairobi
The Company’s shares are listed on the Nairobi Securities Exchange (NSE).
For Kenyan Companies Act reporting purposes, the balance sheet is represented by the statement of financial position and the profit and loss account by the statement of profit or loss, in these financial statements.
2 Significant accounting policies
The principal accounting policies adopted in the preparation of these financial statements are set out below. These policies have been consistently applied to all years presented, unless otherwise stated.
a. Basis of preparation
Stanbic Holdings Plc (“the Company”) and its subsidiaries (“the Group”), annual financial statements have been prepared in accordance with International Financial Reporting Standards (IFRS) and IFRS Interpretations Committee (IFRIC) standards applicable to companies reporting under IFRS.
Basis of measurement
The measurement basis used is the historical cost basis except where otherwise stated in the accounting policies below.
Use of estimates
The preparation of financial statements in conformity with IFRS requires the use of certain critical accounting estimates. It also requires management to exercise its judgment in the process of applying the Group’s accounting policies. The areas involving a higher degree of judgment or complexity, or areas where assumptions and estimates are significant to the consolidated financial statements are disclosed
in Note 3.
Changes in accounting policies and disclosures
(i) Standards, amendments and interpretations to existing standards that are not yet effective and have not been early adopted by the Group
Certain new accounting standards and interpretations have been published that are not mandatory for 31 December 2017 reporting periods and have not been early adopted by the Group. The Group’s assessment of the impact of these new standards and interpretations is set out below: IFRS 9 Financial Instruments IFRS 9 Financial Instruments (IFRS 9) replaces the existing standard dealing with the accounting treatment for financial instruments IAS 39 Financial Instruments: Recognition and Measurement (IAS 39) from 1 January 2018. IFRS 9 consists of the following key areas which represent changes from that of IAS 39:
• Revised requirements for the classification and measurement of financial assets and consequential changes in the classification and measurement of financial liabilities, mainly relating to the recognition of changes in fair value due to changes in own credit risk on fair value designated financial liabilities in OCI as opposed to the income statement.
• An expected credit loss (ECL) impairment model.
• Revised requirements and simplifications for hedge accounting.
IFRS 9 is required to be adopted retrospectively from 1 January 2018, with the exception of IFRS 9’s hedge accounting requirements where the standard permits an entity to choose as its accounting policy to continue to apply with IAS 39 hedge accounting requirements instead of the requirements in Chapter 6 of IFRS 9. The Group has elected to not restate its comparative financial statements. Accordingly, the difference between the previous (IAS 39) and new (IFRS 9) carrying values will be recognised in the group’s opening retained earnings as at 1 January 2018.
Stanbic Holdings Plc Financial statements For the year ended 31 December 2017
21
Notes (continued)
2 Significant accounting policies (continued)
a) Basis of preparation (continued)
(i) Standards, amendments and interpretations to existing standards that are not yet effective and have not been early adopted by the Group (continued)
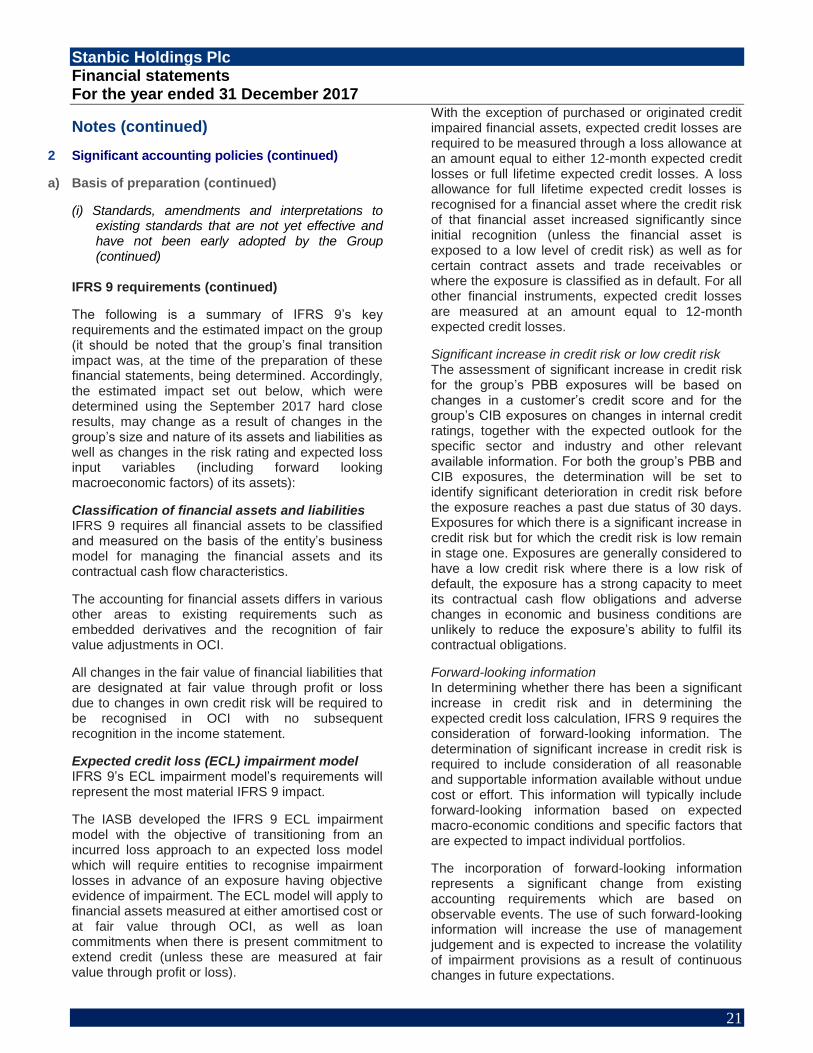
IFRS 9 requirements (continued)
The following is a summary of IFRS 9’s key requirements and the estimated impact on the group (it should be noted that the group’s final transition impact was, at the time of the preparation of these financial statements, being determined. Accordingly, the estimated impact set out below, which were determined using the September 2017 hard close results, may change as a result of changes in the group’s size and nature of its assets and liabilities as well as changes in the risk rating and expected loss input variables (including forward looking macroeconomic factors) of its assets):
Classification of financial assets and liabilities IFRS 9 requires all financial assets to be classified and measured on the basis of the entity’s business model for managing the financial assets and its contractual cash flow characteristics.
The accounting for financial assets differs in various other areas to existing requirements such as embedded derivatives and the recognition of fair value adjustments in OCI.
All changes in the fair value of financial liabilities that are designated at fair value through profit or loss due to changes in own credit risk will be required to be recognised in OCI with no subsequent recognition in the income statement.
Expected credit loss (ECL) impairment model IFRS 9’s ECL impairment model’s requirements will represent the most material IFRS 9 impact.
The IASB developed the IFRS 9 ECL impairment model with the objective of transitioning from an incurred loss approach to an expected loss model which will require entities to recognise impairment losses in advance of an exposure having objective evidence of impairment. The ECL model will apply to financial assets measured at either amortised cost or at fair value through OCI, as well as loan commitments when there is present commitment to extend credit (unless these are measured at fair value through profit or loss).
With the exception of purchased or originated credit impaired financial assets, expected credit losses are required to be measured through a loss allowance at an amount equal to either 12-month expected credit losses or full lifetime expected credit losses. A loss allowance for full lifetime expected credit losses is recognised for a financial asset where the credit risk of that financial asset increased significantly since initial recognition (unless the financial asset is exposed to a low level of credit risk) as well as for certain contract assets and trade receivables or where the exposure is classified as in default. For all other financial instruments, expected credit losses are measured at an amount equal to 12-month expected credit losses.
Significant increase in credit risk or low credit risk The assessment of significant increase in credit risk for the group’s PBB exposures will be based on changes in a customer’s credit score and for the group’s CIB exposures on changes in internal credit ratings, together with the expected outlook for the specific sector and industry and other relevant available information. For both the group’s PBB and CIB exposures, the determination will be set to identify significant deterioration in credit risk before the exposure reaches a past due status of 30 days. Exposures for which there is a significant increase in credit risk but for which the credit risk is low remain in stage one. Exposures are generally considered to have a low credit risk where there is a low risk of default, the exposure has a strong capacity to meet its contractual cash flow obligations and adverse changes in economic and business conditions are unlikely to reduce the exposure’s ability to fulfil its contractual obligations.
Forward-looking information In determining whether there has been a significant increase in credit risk and in determining the expected credit loss calculation, IFRS 9 requires the consideration of forward-looking information. The determination of significant increase in credit risk is required to include consideration of all reasonable and supportable information available without undue cost or effort. This information will typically include forward-looking information based on expected macro-economic conditions and specific factors that are expected to impact individual portfolios.
The incorporation of forward-looking information represents a significant change from existing accounting requirements which are based on observable events. The use of such forward-looking information will increase the use of management judgement and is expected to increase the volatility of impairment provisions as a result of continuous changes in future expectations.
Stanbic Holdings Plc Financial statements For the year ended 31 December 2017
22
Notes (continued)
2 Significant accounting policies (continued)
a) Basis of preparation (continued)
(i) Standards, amendments and interpretations to existing standards that are not yet effective and have not been early adopted by the Group (continued)
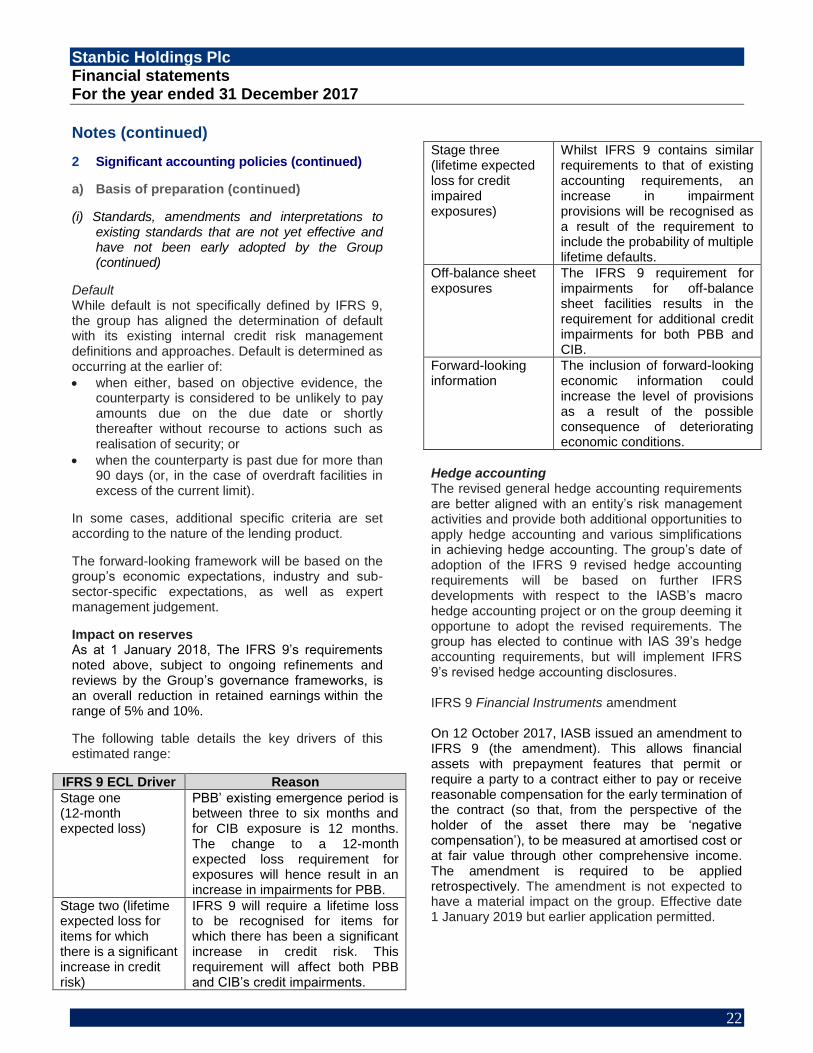
Default While default is not specifically defined by IFRS 9, the group has aligned the determination of default with its existing internal credit risk management definitions and approaches. Default is determined as occurring at the earlier of:
• when either, based on objective evidence, the counterparty is considered to be unlikely to pay amounts due on the due date or shortly thereafter without recourse to actions such as realisation of security; or
• when the counterparty is past due for more than 90 days (or, in the case of overdraft facilities in excess of the current limit).
In some cases, additional specific criteria are set according to the nature of the lending product.
The forward-looking framework will be based on the group’s economic expectations, industry and sub-sector-specific expectations, as well as expert management judgement.
Impact on reserves As at 1 January 2018, The IFRS 9’s requirements noted above, subject to ongoing refinements and reviews by the Group’s governance frameworks, is an overall reduction in retained earnings within the range of 5% and 10%.
The following table details the key drivers of this estimated range:
IFRS 9 ECL Driver Reason
Stage one (12-month expected loss)
PBB’ existing emergence period is between three to six months and for CIB exposure is 12 months. The change to a 12-month expected loss requirement for exposures will hence result in an increase in impairments for PBB.
Stage two (lifetime expected loss for items for which there is a significant increase in credit risk)
IFRS 9 will require a lifetime loss to be recognised for items for which there has been a significant increase in credit risk. This requirement will affect both PBB and CIB’s credit impairments.
Stage three (lifetime expected loss for credit impaired exposures)
Whilst IFRS 9 contains similar requirements to that of existing accounting requirements, an increase in impairment provisions will be recognised as a result of the requirement to include the probability of multiple lifetime defaults.
Off-balance sheet exposures
The IFRS 9 requirement for impairments for off-balance sheet facilities results in the requirement for additional credit impairments for both PBB and CIB.
Forward-looking information
The inclusion of forward-looking economic information could increase the level of provisions as a result of the possible consequence of deteriorating economic conditions.
Hedge accounting The revised general hedge accounting requirements are better aligned with an entity’s risk management activities and provide both additional opportunities to apply hedge accounting and various simplifications in achieving hedge accounting. The group’s date of adoption of the IFRS 9 revised hedge accounting requirements will be based on further IFRS developments with respect to the IASB’s macro hedge accounting project or on the group deeming it opportune to adopt the revised requirements. The group has elected to continue with IAS 39’s hedge accounting requirements, but will implement IFRS 9’s revised hedge accounting disclosures. IFRS 9 Financial Instruments amendment On 12 October 2017, IASB issued an amendment to IFRS 9 (the amendment). This allows financial assets with prepayment features that permit or require a party to a contract either to pay or receive reasonable compensation for the early termination of the contract (so that, from the perspective of the holder of the asset there may be ‘negative compensation’), to be measured at amortised cost or at fair value through other comprehensive income. The amendment is required to be applied retrospectively. The amendment is not expected to have a material impact on the group. Effective date 1 January 2019 but earlier application permitted.

Stanbic Holdings Plc Financial statements For the year ended 31 December 2017
23
Notes (continued)
2 Significant accounting policies (continued)
a) Basis of preparation (continued)
(i) Standards, amendments and interpretations to existing standards that are not yet effective and have not been early adopted by the Group (continued)
IFRS 16 Leases
This standard will replace the existing standard IAS 17 Leases as well as the related interpretations and sets out the principles for the recognition, measurement, presentation and disclosure of leases for both parties to a contract, being the lessee (customer) and the lessor (supplier).
The core principle of this standard is that the lessee and lessor should recognise all rights and obligations arising from leasing arrangements on the statement of financial position.
The most significant change pertaining to the accounting treatment of operating leases is from the lessees’ perspective. IFRS 16 eliminates the classification of leases as either operating leases or finance leases as is required by IAS 17 and introduces a single lessee accounting model, where a right of use (ROU) asset together with a liability for the future payments is to be recognised for all leases with a term of more than 12 months, unless the underlying asset is of low value.
The lessor accounting requirements in IAS 17 has not changed substantially in terms of this standard as a result a lessor continues to classify its leases as operating leases or finance leases and accounts for these as it currently done in terms of IAS 17. In addition, the standard requires lessor to provide enhanced disclosures about its leasing activities and in particular about its exposure to residual value risk and how it is managed.
The standard will be applied retrospectively. The impact on the annual financial statements has not yet been fully determined. However, the Standard Bank Group (SBG), which the Group is a member of, has formed an IFRS 16 working group and detailed project plan, identifying key responsibilities and milestones of the project. The SBG is in the process of determining the estimated impact as well as discussing the system requirements to accommodate IFRS 16’s principles. The new standard is effective on 1 January 2019 and earlier application permitted.
IFRIC 22 Foreign Currency Transactions and Advance Consideration
The IFRIC provides guidance on how to determine the date of the transaction for the purpose of determining the exchange rate to use on initial recognition of the related asset, expense or income (or part of it) on the derecognition of a non-monetary asset or non-monetary liability arising from the payment or receipt of advance consideration in a foreign currency. The IFRIC will be applied retrospectively or prospectively. The group has identified and reviewed the contracts and transaction that are within the scope of this interpretation which indicate that this IFRIC will not materially impact the annual financial statements. The new standard is effective on 1 January 2019 and earlier application permitted.
IFRS 15 Revenue from Contracts with Customers
This standard will replace the existing revenue standards and their related interpretations. The standard sets out the requirements for recognising revenue that applies to all contracts with customers (except for contracts that are within the scope of the standards on leases, insurance contracts or financial instruments).
The core principle of the standard is that revenue recognized reflects the consideration to which the company expects to be entitled in exchange for the transfer of promised goods or services to the customer.
The standard incorporates a five-step analysis to determine the amount and timing of revenue recognition.
The effective date is 1 January 2018. The Group assessed and concluded that the impact on the annual financial statements is not significant.
IFRIC 23 Uncertainty over Income Tax Treatments
This Interpretation clarifies how to apply the recognition and measurement requirements in IAS 12 when there is uncertainty over income tax treatments. In such a circumstance, an entity shall recognise and measure its current or deferred tax asset or liability applying the requirements in IAS 12 based on taxable profit (tax loss), tax bases, unused tax losses, unused tax credits and tax rates determined applying this Interpretation. This Interpretation addresses: whether an entity considers uncertain tax treatments separately; the assumptions an entity makes about the examination of tax treatments by taxation

Stanbic Holdings Plc Financial statements For the year ended 31 December 2017
24
Notes (continued)
2 Significant accounting policies (continued)
a) Basis of preparation (continued)
authorities; how an entity determines taxable profit (tax loss), tax bases, unused tax losses, unused tax credits and tax rates; and how an entity considers changes in facts and circumstances. The IFRIC will be applied retrospectively. The impact on the annual financial statements has not yet been fully determined. The new interpretation is effective on 1 January 2019 and earlier application permitted.
IFRS 2 (amendment) Share-based Payment
The amendments are intended to eliminate diversity
in practice in three main areas of the classification
and measurement of share- based payment
transactions are:
• the effects of vesting conditions on the
measurement of a cash-settled share
based payment transaction
• the classification of a share-based payment
transaction with net settlement features for
withholding tax obligations the accounting
where a modification to the terms and
conditions of a share-based payment
transaction changes its classification from
cash-settled to equity-settled.
The amendments will be applied prospectively. The effective date is I January 2018. Management performed an assessment of IFRS 2 and concluded that the impact is not significant. .
Annual improvements 2015-2017 cycle The IASB has issued various amendments and clarifications to existing IFRS, none of which is expected to have a significant impact on the group’s annual financial statements.
b) Consolidation
The consolidated financial statements incorporate the financial statements of Stanbic Holdings Plc and its subsidiaries; Stanbic Bank Kenya Limited, Stanbic Nominees Limited, Stanbic Insurance Agency Limited, SBG Securities Limited and SBG Securities Nominees Limited. The financial statements have been made up to 31 December 2017.
(i) Subsidiaries
Subsidiaries are all entities over which the Group has control. The Group controls an entity when the Group is exposed to, or has rights to, variable returns from its involvement with the entity and has the ability to affect those returns through its power over the entity. Subsidiaries are fully consolidated from the date on which control is transferred to the Group. They are deconsolidated from the date that control ceases.
The Group applies the acquisition method to account for business combinations. The consideration transferred for the acquisition of a subsidiary is the fair values of the assets transferred, the liabilities incurred to the former owners of the acquiree and the equity interests issued by the Group. The consideration transferred includes the fair value of any asset or liability resulting from a contingent consideration arrangement. Identifiable assets acquired and liabilities and contingent liabilities assumed in a business combination are measured initially at their fair values at the acquisition date. The Group recognises any non-controlling interest in the acquiree on an acquisition-by-acquisition basis, either at fair value or at the non-controlling interest’s proportionate share of the recognised amounts of acquiree’s identifiable net assets.
Acquisition-related costs are expensed as incurred.
If the business combination is achieved in stages, the acquisition date carrying of the acquirer’s previously held equity interest in the acquiree is re-measured to its fair value at the acquisition date; any gains or losses arising from such re-measurement are recognised in profit or loss.
Any contingent consideration to be transferred by the Group is recognised at fair value at the acquisition date. Subsequent changes to the fair value of the contingent consideration that is deemed to be an asset or liability is recognised in accordance with IAS 39 either in profit or loss or as a change to other comprehensive income. Contingent consideration that is classified as equity is not re-measured, and its subsequent settlement is accounted for within equity.
The excess of the consideration transferred, the amount of any non-controlling interest in the acquiree and the acquisition-date fair value of any previous equity interest in the acquiree over the fair value of the identifiable net assets acquired is recorded as goodwill.
Stanbic Holdings Plc Financial statements For the year ended 31 December 2017
25
Notes (continued) 2 Significant accounting policies (continued)
b) Consolidation (continued)
(i) Subsidiaries (Continued)
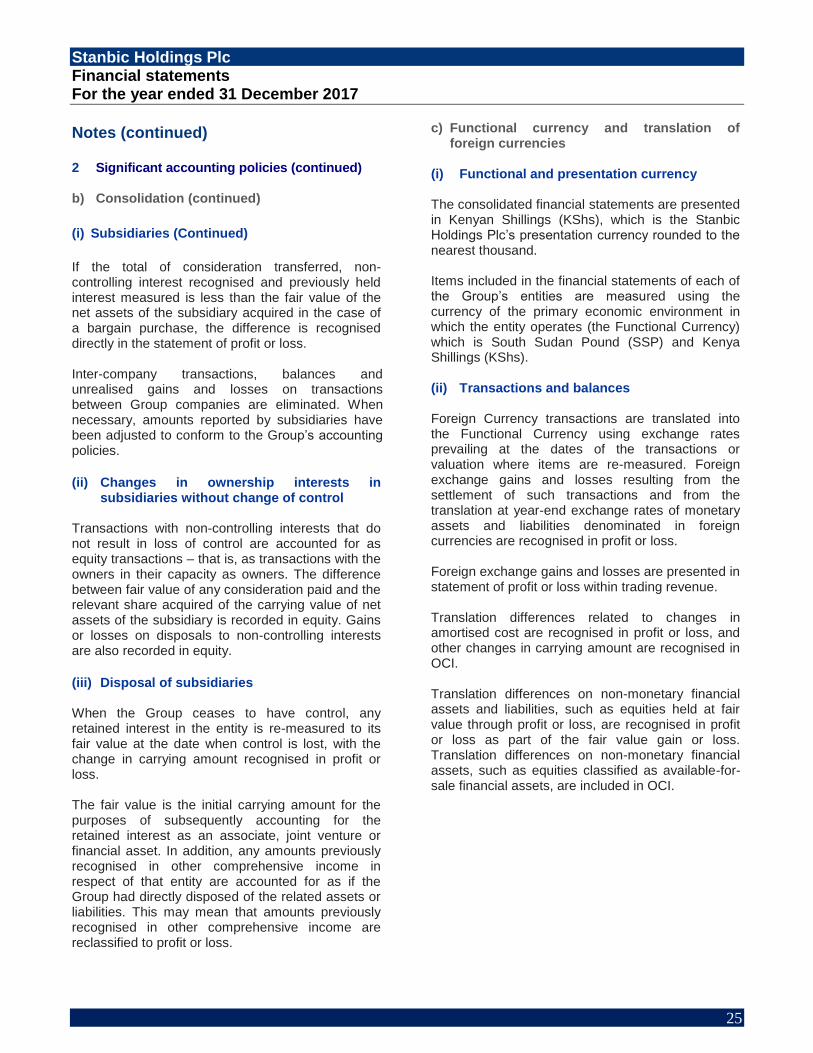
If the total of consideration transferred, non-controlling interest recognised and previously held interest measured is less than the fair value of the net assets of the subsidiary acquired in the case of a bargain purchase, the difference is recognised directly in the statement of profit or loss. Inter-company transactions, balances and unrealised gains and losses on transactions between Group companies are eliminated. When necessary, amounts reported by subsidiaries have been adjusted to conform to the Group’s accounting policies.
(ii) Changes in ownership interests in subsidiaries without change of control
Transactions with non-controlling interests that do not result in loss of control are accounted for as equity transactions – that is, as transactions with the owners in their capacity as owners. The difference between fair value of any consideration paid and the relevant share acquired of the carrying value of net assets of the subsidiary is recorded in equity. Gains or losses on disposals to non-controlling interests are also recorded in equity.
(iii) Disposal of subsidiaries When the Group ceases to have control, any retained interest in the entity is re-measured to its fair value at the date when control is lost, with the change in carrying amount recognised in profit or loss. The fair value is the initial carrying amount for the purposes of subsequently accounting for the retained interest as an associate, joint venture or financial asset. In addition, any amounts previously recognised in other comprehensive income in respect of that entity are accounted for as if the Group had directly disposed of the related assets or liabilities. This may mean that amounts previously recognised in other comprehensive income are reclassified to profit or loss.
c) Functional currency and translation of
foreign currencies (i) Functional and presentation currency The consolidated financial statements are presented in Kenyan Shillings (KShs), which is the Stanbic Holdings Plc’s presentation currency rounded to the nearest thousand. Items included in the financial statements of each of the Group’s entities are measured using the currency of the primary economic environment in which the entity operates (the Functional Currency) which is South Sudan Pound (SSP) and Kenya Shillings (KShs). (ii) Transactions and balances Foreign Currency transactions are translated into the Functional Currency using exchange rates prevailing at the dates of the transactions or valuation where items are re-measured. Foreign exchange gains and losses resulting from the settlement of such transactions and from the translation at year-end exchange rates of monetary assets and liabilities denominated in foreign currencies are recognised in profit or loss. Foreign exchange gains and losses are presented in statement of profit or loss within trading revenue. Translation differences related to changes in amortised cost are recognised in profit or loss, and other changes in carrying amount are recognised in OCI. Translation differences on non-monetary financial assets and liabilities, such as equities held at fair value through profit or loss, are recognised in profit or loss as part of the fair value gain or loss. Translation differences on non-monetary financial assets, such as equities classified as available-for-sale financial assets, are included in OCI.

Stanbic Holdings Plc Financial statements For the year ended 31 December 2017
26
Notes (continued) 2. Significant accounting policies (continued)
c) Functional currency and translation of foreign currencies (continued)
(iii) Group companies
The results and financial position of all the Group entities that have a Functional Currency different from the presentation currency are translated into the presentation currency as follows:
(i) assets and liabilities for each statement of financial position presented are translated at the closing rate at the end of the reporting period;
(ii) income and expenses for each statement of profit or loss amount are translated at average exchange rates (unless this average is not a reasonable approximation of the cumulative effect of the rates prevailing on the transaction dates, in which case income and expenses are translated at the dates of the transactions); and
(iii) all resulting exchange differences are recognised in other comprehensive income.
Goodwill and fair value adjustments arising on the acquisition of a foreign entity are treated as assets and liabilities of the foreign entity and translated at the closing rate.
d) Segment reporting
Operating segments are reported in a manner consistent with the internal reporting provided to the chief operating decision-maker (CODM). The CODM, who is responsible for allocating resources and assessing performance of the operating segments, has been identified as the Group’s Chief Executive (CE) with the assistance of the Group’s Executive Committee (EXCO) and the Asset and Liability Committee (ALCO).
Transactions between segments are priced at market-related rates, with intra-segment revenue and costs being eliminated in Group. Income and expenses directly associated with each segment are included in determining business segment performance
e) Revenue and expenditure
Banking activities
Revenue is derived substantially from the business
of banking and related activities and comprises interest income, fee and commission revenue and other non-interest revenue.
Net interest income
Interest income and expense (except for those borrowing costs that are capitalised), are recognised in the statement of profit or loss on an accrual basis using the effective interest method for all interest-bearing financial instruments, except for those classified at fair value through profit or loss which are included under trading income. In terms of the effective interest method, interest is recognised at a rate that exactly discounts estimated future cash payments or receipts through the expected life of the financial instrument or, where appropriate, a shorter period, to the net carrying amount of the financial asset or financial liability.
Direct incremental transaction costs incurred and origination fees received, including loan commitment fees, as a result of bringing margin-yielding assets or liabilities into the statement of financial position, are capitalised to the carrying amount of financial instruments that are not at fair value through profit or loss and amortised as interest income or expense over the life of the asset or liability as part of the effective interest rate.
Where the estimates or receipts on financial assets (except those that have been reclassified) or financial liabilities are subsequently revised, the carrying amount of the financial asset or liability is adjusted to reflect actual and revised estimated cash flows. The carrying amount is calculated by computing the present value of the estimated cash flows at the financial asset’s original effective interest rate. Any adjustment to the carrying value is recognised in interest income.
Interest is recognised on the gross loan balance
before taking portfolio impairment into account. Where financial assets have been specifically impaired, interest income continues to be recognised on the impaired value based on the original effective interest rate.
Gains and losses on the disposal of dated financial instruments, including amounts removed from other comprehensive income in respect of available-for-sale financial assets, and excluding those classified as held for trading, are included in net interest income.

Stanbic Holdings Plc Financial statements For the year ended 31 December 2017
27
Notes (continued) 2. Significant accounting policies (continued) e) Revenue and expenditure (Continued)
Non-interest revenue
Net fee and commission revenue
Fee and commission revenue, including transactional fees, account servicing fees, investment management fees, sales commission, placement fees and syndication fees are recognised as the related services are performed. Loan commitment fees for loans that are not expected to be drawn down are recognised on a straight-line basis over the commitment period.
Loan syndication fees, where the Group does not participate in the syndication or participates at the same effective interest rate for comparable risk as other participants, are recognised as revenue when the syndication has been completed. Syndication fees that do not meet these criteria are capitalised as origination fees and amortised as interest income.
The fair value of issued financial guarantee contracts on initial recognition is amortised as income over the term of the contract.
Fee and commission expense included in net fee and commission revenue are mainly transaction and service fees relating to financial instruments, which are expensed as the services are received.
Trading revenue
Trading revenue comprises all gains and losses from changes in the fair value of trading assets and liabilities, together with related interest income, expense and dividends.
Other revenue
Other revenue includes gains and losses on equity instruments designated at fair value through profit or loss, gains and losses on realised undated available-for-sale financial assets and, dividends relating to those financial instruments.
Net income from financial instruments designated at fair value includes all gains and losses from changes in the fair value of undated financial assets and
liabilities designated at fair value through profit or loss, including dividend income arising on these financial instruments.
Gains and losses on undated available-for-sale financial assets are transferred from other comprehensive income to profit or loss on realisation of the investments. Dividends on these instruments are recognised in profit or loss.
Gains and losses on all other undated financial instruments that are not held for trading are recognised in other revenue.
Dividend income Dividends are recognised in profit or loss when the right to receipt is established.
f) Cash and cash equivalents Cash and cash equivalents disclosed in the statement of cash flows consist of cash and balances with Central Banks and other short term highly liquid investments with original maturities of three months or less including investment securities with original maturities of 90 days or less and balances with other Groups. Cash and cash equivalents exclude the cash reserve held with Central Bank of Kenya. Cash and balances with Central Banks comprise coins and bank notes and balances with central banks.
g) Financial instruments
(i) Initial recognition and measurement
Financial instruments include all financial assets and liabilities. These instruments are typically held for liquidity, investment, trading or hedging purposes. All financial instruments are initially recognised at fair value plus directly attributable transaction costs, except those carried at fair value through profit or loss where transaction costs are recognised immediately in profit or loss. Financial instruments are recognised (derecognised) on the date the Group commits to purchase (sell) the instruments (trade date accounting).

Stanbic Holdings Plc Financial statements For the year ended 31 December 2017
28
Notes (continued)
g) Financial instruments (Continued)
(ii) Subsequent measurement
Subsequent to initial measurement, financial instruments are measured either at fair value or amortised cost, depending on their classifications as follows:
a. Held-to-maturity
Held-to-maturity investments are carried at amortised cost, using the effective interest method, less any impairment losses.
b. Held-for-trading assets and liabilities
Held-for-trading assets and liabilities include those financial assets and liabilities acquired or incurred principally for the purpose of selling or repurchasing in the near term, those forming part of a portfolio of identified financial instruments that are managed together and for which there is evidence of a recent actual pattern of short-term profit-taking, and commodities that are acquired principally by the Group for the purpose of selling in the near future and generating a profit from fluctuations in price or broker-traders’ margin. Derivatives are always categorised as held-for-trading.
Subsequent to initial recognition, the financial instruments’ fair values are re-measured at each reporting date. All gains and losses, including interest and dividends arising from changes in fair value are recognised in profit or loss as trading revenue within non-interest revenue except for derivatives that are designated and effective as hedging instruments (refer to ‘Derivative financial instruments and hedge accounting’ within this accounting policy for further details).
c. Financial assets and liabilities designated at fair value through profit or loss
• groups of financial assets, financial liabilities or both are managed, and their performance evaluated, on a fair value basis in accordance with a documented risk management or investment strategy, and reported to the Group’s key management personnel on a fair-value basis. Under this criterion, certain private equity, and other investment portfolios have been designated at fair value through profit or loss; or
The fair value designation is made on initial recognition and is irrevocable. Subsequent to initial recognition, the fair values are re-measured at each reporting date. Gains and losses arising from changes in fair value are recognised in interest income (interest expense) for all debt financial assets (financial liabilities) and in other revenue within non-interest revenue for all equity instruments.
d. Available-for-sale
Financial assets classified by the Group as available-for-sale are generally strategic capital investments held for an indefinite period, which may be sold in response to needs for liquidity or changes in interest rates, exchange rates or equity prices, or non-derivative financial assets that are not classified within another category of financial assets.
Held-to-maturity investments are non-derivative financial assets with fixed or determinable payments and fixed maturities that management has both the positive intent and ability to hold to maturity. Where the Group is to sell more than an insignificant amount of held-to-maturity investments, the entire category would be tainted and reclassified as available-for-sale assets with the difference between amortised cost and fair value being accounted for in OCI.
The Group designates certain financial assets and liabilities, other than those classified as held-for-trading, as at fair value through profit or loss when:
• this designation eliminates or significantly reduces an accounting mismatch that would otherwise arise. Under this criterion, the main classes of financial instruments designated by the Group are loans and advances to banks and customers and financial investments. The designation significantly reduces measurement inconsistencies that would have otherwise arisen. For example, where the related derivatives were treated as held-for-trading and the underlying financial instruments were carried at amortised cost. This category also includes financial assets used to match investment contracts,
• financial instruments containing one or more embedded derivatives that significantly modify the instruments’ cash flows.
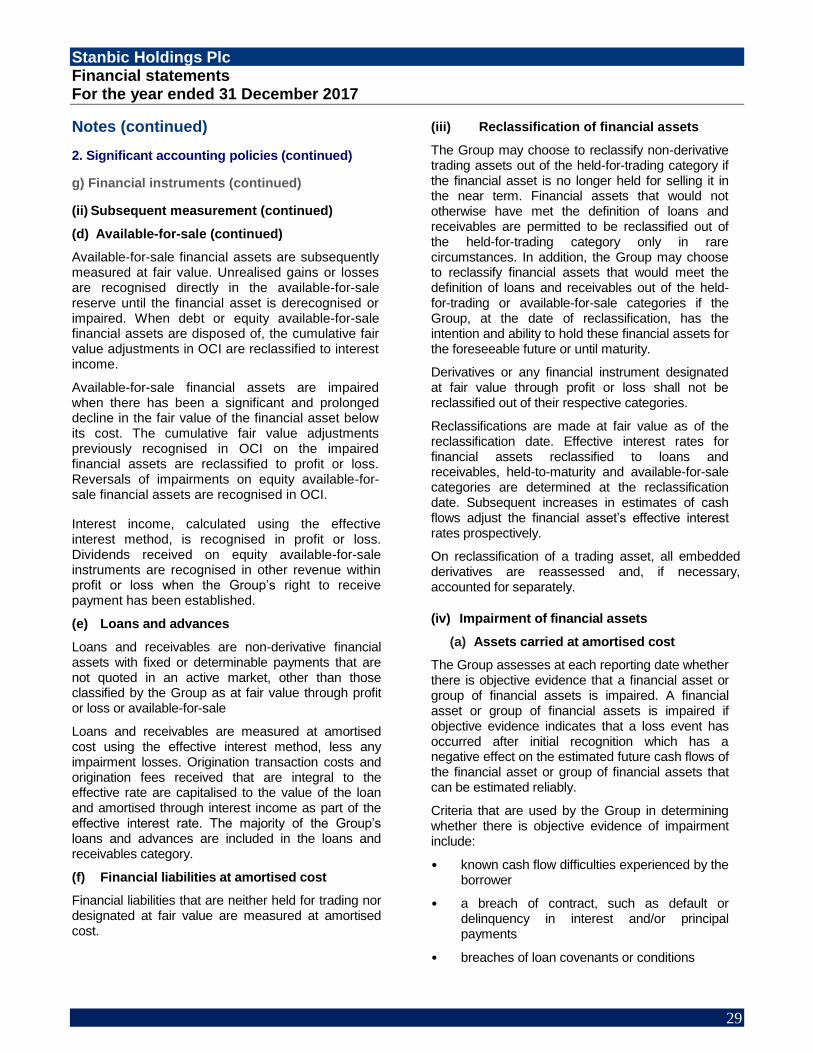
Stanbic Holdings Plc Financial statements For the year ended 31 December 2017
29
Notes (continued)
2. Significant accounting policies (continued)
g) Financial instruments (continued)
(ii) Subsequent measurement (continued)
(d) Available-for-sale (continued)
Available-for-sale financial assets are subsequently measured at fair value. Unrealised gains or losses are recognised directly in the available-for-sale reserve until the financial asset is derecognised or impaired. When debt or equity available-for-sale financial assets are disposed of, the cumulative fair value adjustments in OCI are reclassified to interest income.
Available-for-sale financial assets are impaired when there has been a significant and prolonged decline in the fair value of the financial asset below its cost. The cumulative fair value adjustments previously recognised in OCI on the impaired financial assets are reclassified to profit or loss. Reversals of impairments on equity available-for-sale financial assets are recognised in OCI.
Interest income, calculated using the effective interest method, is recognised in profit or loss. Dividends received on equity available-for-sale instruments are recognised in other revenue within profit or loss when the Group’s right to receive payment has been established.
(e) Loans and advances
Loans and receivables are non-derivative financial assets with fixed or determinable payments that are not quoted in an active market, other than those classified by the Group as at fair value through profit or loss or available-for-sale
Loans and receivables are measured at amortised cost using the effective interest method, less any impairment losses. Origination transaction costs and origination fees received that are integral to the effective rate are capitalised to the value of the loan and amortised through interest income as part of the effective interest rate. The majority of the Group’s loans and advances are included in the loans and receivables category.
(f) Financial liabilities at amortised cost
Financial liabilities that are neither held for trading nor designated at fair value are measured at amortised cost.
(iii) Reclassification of financial assets
The Group may choose to reclassify non-derivative trading assets out of the held-for-trading category if the financial asset is no longer held for selling it in the near term. Financial assets that would not otherwise have met the definition of loans and receivables are permitted to be reclassified out of the held-for-trading category only in rare circumstances. In addition, the Group may choose to reclassify financial assets that would meet the definition of loans and receivables out of the held-for-trading or available-for-sale categories if the Group, at the date of reclassification, has the intention and ability to hold these financial assets for the foreseeable future or until maturity.
Derivatives or any financial instrument designated at fair value through profit or loss shall not be reclassified out of their respective categories.
Reclassifications are made at fair value as of the reclassification date. Effective interest rates for financial assets reclassified to loans and receivables, held-to-maturity and available-for-sale categories are determined at the reclassification date. Subsequent increases in estimates of cash flows adjust the financial asset’s effective interest rates prospectively.
On reclassification of a trading asset, all embedded derivatives are reassessed and, if necessary, accounted for separately.
(iv) Impairment of financial assets
(a) Assets carried at amortised cost
The Group assesses at each reporting date whether there is objective evidence that a financial asset or group of financial assets is impaired. A financial asset or group of financial assets is impaired if objective evidence indicates that a loss event has occurred after initial recognition which has a negative effect on the estimated future cash flows of the financial asset or group of financial assets that can be estimated reliably.
Criteria that are used by the Group in determining whether there is objective evidence of impairment include:
• known cash flow difficulties experienced by the borrower
• a breach of contract, such as default or delinquency in interest and/or principal payments
• breaches of loan covenants or conditions

Stanbic Holdings Plc Financial statements For the year ended 31 December 2017
30
Notes (continued)
2. Significant accounting policies (continued)
g) Financial instruments (continued)
(iv) Impairment of financial assets (continued)
(a) Assets carried at amortised cost (continued)
• it is becoming probable that the borrower will enter bankruptcy or other financial reorganisation, and
• where the Group, for economic or legal reasons relating to the borrower’s financial difficulty, grants the borrower a concession that the Group would not otherwise consider.
The Group first assesses whether there is objective evidence of impairment individually for financial assets that are individually significant, and individually or collectively for financial assets that are not individually significant
Non-performing financial assets include those financial assets for which the Group has identified objective evidence of default, such as a breach of a material financial asset covenant or condition as well as those financial assets for which instalments are due and unpaid for 90 days or more. The impairment of non-performing financial assets takes into account past loss experience adjusted for changes in economic conditions and the nature and level of risk exposure since the recording of the historic losses.
When a financial asset carried at amortised cost has been identified as specifically impaired, the carrying amount of the financial asset is reduced to an amount equal to the present value of its estimated future cash flows, including the recoverable amount of any collateral, discounted at the financial asset’s original effective interest rate. The carrying amount of the financial asset is reduced through the use of a specific credit impairment account and the loss is recognised as a credit impairment charge in profit or loss.
The calculation of the present value of the estimated future cash flows of collateralised financial assets recognised on an amortised cost basis includes cash flows that may result from foreclosure less costs of obtaining and selling the collateral, whether or not foreclosure is probable.
If the Group determines that no objective evidence of impairment exists for an individually assessed financial asset, whether significant or not, it includes the financial asset in a group of financial assets with similar credit risk characteristics and collectively
assesses for impairment. Financial assets that are individually assessed for impairment and for which an impairment loss is recognised are not included in a collective assessment for impairment.
Impairment of groups of financial assets that are assessed collectively is recognised where there is objective evidence that a loss event has occurred after the initial recognition of the group of financial assets but before the reporting date. In order to provide for latent losses in a group of financial assets that have not yet been identified as specifically impaired, a credit impairment for incurred but not reported losses is recognised based on historic loss patterns and estimated emergence periods (time period between the loss trigger events and the date on which the Group identifies the losses).
Groups of financial assets are also impaired when adverse economic conditions develop after initial recognition, which may impact future cash flows. The carrying amount of groups of financial assets is reduced through the use of a portfolio credit impairment account and the loss is recognised as a credit impairment charge in profit or loss.
Increases in financial asset impairments and any subsequent reversals thereof, or recoveries of amounts previously impaired (including financial assets that have been written off), are reflected within credit impairment charges in profit or loss. Previously impaired financial assets are written off once all reasonable attempts at collection have been made and there is no realistic prospect of recovering outstanding amounts. Any subsequent reductions in amounts previously impaired are reversed by adjusting the allowance account with the amount of the reversal recognised as a reduction in impairment for credit losses in profit or loss.
Subsequent to impairment, the effects of discounting unwind over time as interest income.
(b) Renegotiated loans
Loans that would otherwise be past due or impaired and whose terms have been renegotiated and exhibit the characteristics of a performing loan are reset to performing loan status. Loans whose terms have been renegotiated are subject to on-going review to determine whether they are considered to be impaired or past due.
The effective interest rate of renegotiated loans that have not been derecognised (described under the heading Derecognition of financial instruments), is predetermined based on the loan’s renegotiated terms.
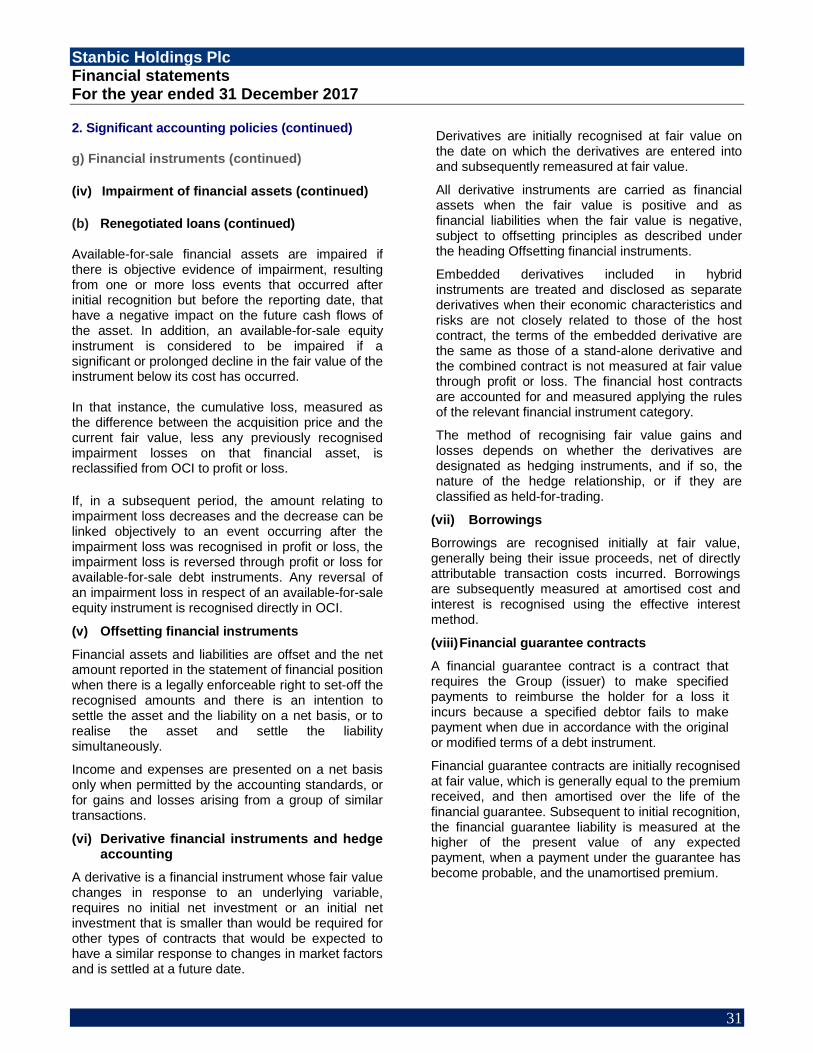
Stanbic Holdings Plc Financial statements For the year ended 31 December 2017
31
2. Significant accounting policies (continued) g) Financial instruments (continued)
(iv) Impairment of financial assets (continued)
(b) Renegotiated loans (continued) Available-for-sale financial assets are impaired if there is objective evidence of impairment, resulting from one or more loss events that occurred after initial recognition but before the reporting date, that have a negative impact on the future cash flows of the asset. In addition, an available-for-sale equity instrument is considered to be impaired if a significant or prolonged decline in the fair value of the instrument below its cost has occurred. In that instance, the cumulative loss, measured as the difference between the acquisition price and the current fair value, less any previously recognised impairment losses on that financial asset, is reclassified from OCI to profit or loss.
If, in a subsequent period, the amount relating to impairment loss decreases and the decrease can be linked objectively to an event occurring after the impairment loss was recognised in profit or loss, the impairment loss is reversed through profit or loss for available-for-sale debt instruments. Any reversal of an impairment loss in respect of an available-for-sale equity instrument is recognised directly in OCI.
(v) Offsetting financial instruments
Financial assets and liabilities are offset and the net amount reported in the statement of financial position when there is a legally enforceable right to set-off the recognised amounts and there is an intention to settle the asset and the liability on a net basis, or to realise the asset and settle the liability simultaneously.
Income and expenses are presented on a net basis only when permitted by the accounting standards, or for gains and losses arising from a group of similar transactions.
(vi) Derivative financial instruments and hedge accounting
A derivative is a financial instrument whose fair value changes in response to an underlying variable, requires no initial net investment or an initial net investment that is smaller than would be required for other types of contracts that would be expected to have a similar response to changes in market factors and is settled at a future date.
Derivatives are initially recognised at fair value on the date on which the derivatives are entered into and subsequently remeasured at fair value.
Embedded derivatives included in hybrid instruments are treated and disclosed as separate derivatives when their economic characteristics and risks are not closely related to those of the host contract, the terms of the embedded derivative are the same as those of a stand-alone derivative and the combined contract is not measured at fair value through profit or loss. The financial host contracts are accounted for and measured applying the rules of the relevant financial instrument category.
The method of recognising fair value gains and losses depends on whether the derivatives are designated as hedging instruments, and if so, the nature of the hedge relationship, or if they are classified as held-for-trading.
(vii) Borrowings
Borrowings are recognised initially at fair value, generally being their issue proceeds, net of directly attributable transaction costs incurred. Borrowings are subsequently measured at amortised cost and interest is recognised using the effective interest method.
(viii) Financial guarantee contracts
Financial guarantee contracts are initially recognised at fair value, which is generally equal to the premium received, and then amortised over the life of the financial guarantee. Subsequent to initial recognition, the financial guarantee liability is measured at the higher of the present value of any expected payment, when a payment under the guarantee has become probable, and the unamortised premium.
All derivative instruments are carried as financial assets when the fair value is positive and as financial liabilities when the fair value is negative, subject to offsetting principles as described under the heading Offsetting financial instruments.
A financial guarantee contract is a contract that requires the Group (issuer) to make specified payments to reimburse the holder for a loss it incurs because a specified debtor fails to make payment when due in accordance with the original or modified terms of a debt instrument.

Stanbic Holdings Plc Financial statements For the year ended 31 December 2017
32
Notes (continued)
2. Significant accounting policies (continued) g) Financial instruments (continued)
(ix) Derecognition of financial instruments
Financial assets are derecognised when the contractual rights to receive cash flows from the financial assets have expired, or where the Group has transferred its contractual rights to receive cash flows on the financial asset such that it has transferred substantially all the risks and rewards of ownership of the financial asset. Any interest in transferred financial assets that is created or retained by the Group is recognised as a separate asset or liability.
The Group enters into transactions whereby it transfers assets recognised in its statement of financial position, but retains either all or a portion of the risks or rewards of the transferred assets. If all or substantially all risks and rewards are retained, then the transferred assets are not derecognised. Transfers of assets with the retention of all or substantially all risks and rewards include securities lending and repurchase agreements.
When assets are sold to a third party with a concurrent total rate of return swap on the transferred assets, the transaction is accounted for as a secured financing transaction, similar to repurchase transactions. In transactions where the Group neither retains nor transfers substantially all the risks and rewards of ownership of a financial asset, the asset is derecognised if control over the asset is lost. The rights and obligations retained in the transfer are recognised separately as assets and liabilities as appropriate.
In transfers where control over the asset is retained, the Group continues to recognise the asset to the extent of its continuing involvement, determined by the extent to which it is exposed to changes in the value of the transferred asset.
Financial liabilities are derecognised when they are extinguished, that is, when the obligation is discharged, cancelled or expires.
Where an existing financial asset or liability is replaced by another with the same counterparty on substantially different terms, or the terms of an existing financial asset or liability are substantially modified, such an exchange or modification is treated as a derecognition of the original asset or liability and the recognition of a new asset or liability, with the difference in the respective carrying amounts being recognised in profit or loss.
In all other instances, the renegotiated asset or liability’s effective interest rate is predetermined taking into account the renegotiated terms.
(x) Sale and repurchase agreements and lending of securities
Securities sold subject to linked repurchase agreements (repos) are reclassified in the statement of financial position as pledged assets when the transferee has the right by contract or custom to sell or repledge the collateral. The liability to the counterparty is included under deposit and current accounts or trading liabilities, as appropriate.
Securities purchased under agreements to resell (reverse repurchase agreements), at either a fixed price or the purchase price plus a lender’s rate of return, are recorded as loans and included under trading assets or loans and advances, as appropriate.
For repurchase and reverse repurchase agreements measured at amortised cost, the difference between the purchase and sales price is treated as interest and amortised over the expected life using the effective interest method.
Securities lent to counterparties are retained in the annual financial statements. Securities borrowed are not recognised in the annual financial statements unless sold to third parties. In these cases, the obligation to return the securities borrowed is recorded at fair value as a trading liability.
Income and expenses arising from the securities borrowing and lending business are recognised
over the period of the transactions.

Stanbic Holdings Plc Financial statements For the year ended 31 December 2017
33
Notes (continued)
2. Significant accounting policies (continued) h) Fair value measurement
Fair value is the price that would be received to sell an asset or paid to transfer a liability in an orderly transaction in the principal (or most advantageous) market between market participants at the measurement date under current market conditions.
When a price for an identical asset or liability is not observable, fair value is measured using another valuation technique that maximises the use of relevant observable inputs and minimises the use of unobservable inputs.
In estimating the fair value of an asset or a liability, the Group takes into account the characteristics of the asset or liability that market participants would take into account when pricing the asset or liability at measurement date.
For financial instruments, where the fair value of the financial instrument differs from the transaction price, the difference is commonly referred to as day one profit or loss. Day one profit or loss is recognised in profit or loss immediately where the fair value of the financial instrument is either evidenced by comparison with other observable current market transactions in the same instrument, or is determined using valuation models with only observable market data as inputs.
Day one profit or loss is deferred where the fair value of the financial instrument is not able to be evidenced by comparison with other observable current market transactions in the same instrument, or determined using valuation models that utilise non-observable market data as inputs. The timing of the recognition of deferred day one profit or loss is determined individually depending on the nature of the instrument and availability of market observable inputs. It is either amortised over the life of the transaction, deferred until the instrument’s fair value can be determined using market observable inputs, or realised through settlement.
Subsequent to initial recognition, fair value is measured based on quoted market prices or dealer price quotations for the assets and liabilities that are traded in active markets and where those quoted prices represent fair value at the measurement date.
If the market for an asset or liability is not active or the instrument is unlisted, the fair value is determined using other applicable valuation techniques. These include the use of recent arm’s length transactions, discounted cash flow analyses,
pricing models and other valuation techniques commonly used by market participants.
Where discounted cash flow analyses are used, estimated future cash flows are based on management’s best estimates and a market related discount rate at the reporting date for an asset or liability with similar terms and conditions.
If an asset or a liability measured at fair value has both a bid and an ask price, the price within the bid-ask spread that is most representative of fair value is used to measure fair value.
The Group has elected the portfolio exception to measure the fair value of certain groups of financial assets and financial liabilities. This exception permits a group of financial assets and financial liabilities to be measured at fair value on a net basis. This election is applied where the Group:
• manages the group of financial assets and financial liabilities on the basis of the Group’s net exposure to a particular market risk (or risks) or to the credit risk of a particular counterparty in accordance with the Group’s documented risk management or investment strategy;
• provides information on that basis about the group of financial assets and financial liabilities to the Group’s key management personnel; and
• is required to or has elected to measure those financial assets and financial liabilities at fair value at the end of each reporting period.
Fair value measurements are categorised into level 1, 2 or 3 based on the degree to which the inputs to the fair value measurements are observable and the significance of the inputs to the fair value measurement.

Stanbic Holdings Plc Financial statements For the year ended 31 December 2017
34
Notes (continued)
2. Significant accounting policies (continued)
i) Intangible assets
Goodwill
Goodwill arises on the acquisition of subsidiaries, associates and joint ventures and represents the excess of the consideration transferred over the Company’s interest in net fair value of the net identifiable assets, liabilities and contingent liabilities of the acquiree and the fair value of the non-controlling interest in the acquiree.
For the purpose of impairment testing, goodwill acquired in a business combination is allocated to each of the Group’s Cash-generating Units (CGU), or groups of CGUs that is expected to benefit from the synergies of the combination.
Each unit or group of units to which the goodwill is allocated represents the lowest level within the entity at which the goodwill is monitored for internal management purposes. Goodwill is monitored at the operating segment level. Note 29 sets out the major cash generating unit to which goodwill has been allocated.
Goodwill impairment reviews are undertaken annually or more frequently if events or changes in
circumstances indicate a potential impairment, an
impairment loss is recognised whenever the carrying amount of an asset or its CGU exceeds its recoverable amount. Impairment losses are allocated first to reduce the carrying amount of any goodwill allocated to a CGU and then to reduce the carrying amount of other assets in the CGU on a pro rata basis. The carrying amount of these other assets may, however, not be reduced below the higher of the CGU’s fair value less costs to sell and its value in use. Any impairment recognised on goodwill is not subsequently reversed. Computer software Costs associated with maintaining computer software programmes are recognised as an expense as incurred. Development costs that are directly attributable to the design and testing of identifiable and unique software products controlled by the Group are recognised as intangible assets when the following criteria are met:
• it is technically feasible to complete the software product so that it will be available for use;
• management intends to complete the software product and use or sell it;
• there is an ability to use or sell the software product;
• it can be demonstrated how the software product will generate probable future economic benefits;
• adequate technical, financial and other resources to complete the development and to use or sell the software product are available; and
• the expenditure attributable to the software product during its development can be reliably measured.
Directly-attributable-costs that are capitalised as part of the software product include the software development employee costs and an appropriate portion of relevant overheads.
Other development expenditures that do not meet these criteria are recognised as an expense as incurred. Development costs previously recognised as an expense are not recognised as an asset in a subsequent period.
Computer software development costs recognised as assets are amortised over their estimated useful lives (2 to 10 years).
Acquired computer software licences are capitalised on the basis of the costs incurred to acquire and bring to use the specific software. These costs are amortised on the basis of the expected useful lives. Software has a maximum expected useful life of 5 years.
Other intangible assets
The Group recognises the costs incurred on internally generated intangible assets such as brands, customer lists, customer contracts and similar rights and assets, in profit or loss as incurred.
The Group capitalises brands, customer lists, customer contracts and similar rights acquired in business combinations.
Capitalised intangible assets are measured at cost less accumulated amortisation and accumulated impairment losses. Amortisation is recognised in profit or loss on a straight-line basis over the estimated useful lives of intangible assets (2 to 10 years) from the date that they are available for use.
Amortisation methods, useful lives and residual values are reviewed at each financial year-end and adjusted, if necessary. There have been no changes in the estimated useful lives from those applied in the previous financial year.

Stanbic Holdings Plc Financial statements For the year ended 31 December 2017
35
Notes (continued)
2. Significant accounting policies (continued)
j) Property and equipment
Equipment and owner-occupied properties Land and buildings comprise mainly branches and offices. All property and equipment is stated at historical cost less accumulated depreciation and accumulated impairment losses other than the revaluation of buildings that arose from the merger between CFC Bank and Stanbic Bank in 2008 (accounting policy 2.7 and 2.8). Historical cost includes expenditure that is directly attributable to the acquisition of these assets. Subsequent costs are included in the asset’s carrying amount or are recognised as a separate asset, as appropriate, only when it is probable that future economic benefits will flow to the Group and the cost of the item can be measured reliably. Maintenance and repairs, which do not meet these criteria, are recognised in profit or loss as incurred. Depreciation, impairment losses and gains or losses on disposal of assets are included in profit or loss. Owner-occupied properties are held for use in the supply of services or for administrative purposes. Property and equipment are depreciated on the straight-line basis over the estimated useful lives of the assets to their residual values. Land is not depreciated. Leasehold buildings are depreciated over the period of the lease or over a lesser period, as is considered appropriate. The assets’ residual values and useful lives and the depreciation method applied are reviewed, and adjusted if appropriate, at each financial year-end.
The estimated useful lives of tangible assets for the current financial year are as follows:
Buildings 40 years
Computer equipment 3 to 5 years
Motor vehicles 4 to 5 years
Office equipment 5 to 10 years
Furniture and fittings 5 to 13 years
Capitalised leased assets
over the shorter of the lease term or its useful life
There has been no change to the estimated useful lives from those applied in the previous financial year.
k) Impairment of non-financial assets
Intangible assets that have an indefinite useful life and goodwill are tested annually for impairment. Intangible assets that are subject to amortisation and other non-financial assets are reviewed for impairment at each reporting date and tested for impairment whenever events or changes in circumstances indicate that the carrying amount may not be recoverable. An impairment loss is recognised in profit or loss for the amount by which the asset’s carrying amount exceeds its recoverable amount. The recoverable amount is the higher of an asset’s fair value less costs to sell and value in use. Fair value less costs to sell is determined by ascertaining the current market value of an asset and deducting any costs related to the realisation of the asset. In assessing value in use, the estimated future cash flows are discounted to their present value using a pre-tax discount rate that reflects current market assessments of the time value of money and the risks specific to the asset. For the purposes of assessing impairment, assets that cannot be tested individually are grouped at the lowest levels for which there are separately identifiable cash inflows from continuing use (cash-generating units). Impairment losses recognised in respect of cash-generating units are allocated first to reduce the carrying amount of any goodwill allocated to the units, and then to reduce the carrying amounts of the other assets in the unit on a pro rata basis. An impairment loss in respect of goodwill is not reversed. In respect of other non-financial assets, impairment losses recognised in prior periods are assessed at each reporting date for any indications that the loss has decreased or no longer exists.

Stanbic Holdings Plc Financial statements For the year ended 31 December 2017
36
Notes (continued)
2. Significant accounting policies (continued)
k) Impairment of non-financial assets
(continued)
An impairment loss is reversed if there has been a change in the estimates used to determine the recoverable amount. An impairment loss is reversed through profit or loss only to the extent that the asset’s carrying amount does not exceed the carrying amount that would have been determined, net of depreciation or amortisation, if no impairment loss had been recognised. l) Leases
Group as lessee
Leases, where the Group assumes substantially all the risks and rewards of ownership, are classified as finance leases. Finance leases are capitalised at the inception of the lease at the lower of the fair value of the leased asset and the present value of the minimum lease payments. Lease payments are calculated using the interest rate implicit in the lease to identify the finance cost, which is recognised in profit or loss over the lease period, and the capital repayment, which reduces the liability to the lessor.
Leases of assets are classified as operating leases if the lessor retains a significant portion of the risks and rewards of ownership. Payments made under operating leases, net of any incentives received from the lessor, are recognised in profit or loss on a straight-line basis over the term of the lease. When an operating lease is terminated before the lease period has expired, any payment required to be made to the lessor by way of penalty is recognised as an expense in the period in which termination takes place.
Group as lessor
Lease and instalment sale contracts are primarily financing transactions in banking activities, with rentals and instalments receivable, less unearned finance charges, being included in loans and advances in the statement of financial position.
Finance charges earned are computed using the effective interest method, which reflects a constant periodic rate of return on the investment in the
finance lease. Initial direct costs and fees are capitalised to the value of the lease receivable and accounted for over the lease term as an adjustment to the effective rate of return. The benefits arising from investment allowances on assets leased to clients are accounted for in tax.
Leases of assets under which the Group retains a significant portion of the risks and rewards of ownership are classified as operating leases. Operating lease income from properties held as investment properties, net of any incentives given to lessees, is recognised on the straight-line basis over the lease term. When an operating lease is terminated before the lease period has expired, any payment required by the lessee by way of a penalty is recognised as income in the period in which termination takes place. m) Provisions and contingent liabilities
Provisions are recognised when the Group has a present legal or constructive obligation as a result of past events, it is probable that an outflow of resources embodying economic benefits will be required to settle the obligation and a reliable estimate of the amount of the obligation can be made. Provisions are determined by discounting the expected future cash flows using a pre-tax discount rate that reflects current market assessments of the time value of money and the risks specific to the liability. A provision for restructuring is recognised when the Group has approved a detailed formal plan, and the restructuring either has commenced or has been announced publicly. Future operating costs or losses are not provided for. A provision for onerous contracts is recognised when the expected benefits to be derived by the Group from a contract are lower than the unavoidable cost of meeting its obligations under the contract. The provision is measured at the present value of the lower of the expected cost of terminating the contract and the expected net cost of continuing with the contract.

Stanbic Holdings Plc Financial statements For the year ended 31 December 2017
37
Notes (continued)
2. Significant accounting policies (continued)
m) Provisions and contingent liabilities (continued)
Before a provision is established, the Group
recognises any impairment loss on the assets
associated with that contract.
Contingent liabilities include certain guarantees,
other than financial guarantees, and letters of credit
pledged as collateral security. Contingent liabilities
are not recognised on the statement of financial
position but are disclosed in the notes to the
financial statements unless they are remote.
n) Employee benefits
(i) Defined contribution plan The majority of the Group’s employees are eligible for retirement benefits under a defined contribution plan. The Group and its employees also contribute to the National Social Security Fund as applicable in its jurisdictions of operations. This is a defined contribution scheme. A defined contribution plan is a retirement benefit plan under which the Group pays fixed contributions into a separate entity.
The Group has no legal or constructive obligations to pay further contributions if the fund does not hold sufficient assets to pay all employees the benefits relating to employee service in the current and prior periods.
The assets of all schemes are held in separate trustee administered funds, which are funded by contributions from both the Group and employees. The Group’s contributions to the defined contribution schemes are charged to the statement of profit or loss in the year in which they fall due.
(ii) Short-term benefits
Short-term benefits consist of salaries, accumulated leave payments, profit share, bonuses and any non-monetary benefits such as medical aid contributions.
Short-term employee benefit obligations are measured on an undiscounted basis and are expensed as the related service is provided.
A liability is recognised for the amount expected to
be paid under short-term cash bonus plans or
accumulated leave if the Group has a present legal
or constructive obligation to pay this amount as a
result of past service provided by the employee and
the obligation can be estimated reliably.
Employee entitlements to annual leave are
recognised when they accrue to employees.
A provision is made for the estimated liability for annual leave and long-service leave as a result of services rendered by employees up to the reporting date.
(iii) Equity compensation plans
The Group operates both equity-settled and cash-settled share-based compensation plans. The fair value of equity-settled share options is determined on the grant date and accounted for as staff costs over the vesting period of the share options, with a corresponding increase in the share-based payment reserve. Non-market vesting conditions, such as the resignation of employees and retrenchment of staff, are not considered in the valuation but are included in the estimate of the number of options expected to vest. At each reporting date, the estimate of the number of options expected to vest is reassessed and adjusted against profit or loss and equity over the remaining vesting period.
On vesting of share options, amounts previously credited to the share-based payment reserve are transferred to retained earnings through an equity transfer. On exercise of equity-settled share options, proceeds received are credited to share capital and premium.
Share-based payments settled in cash are accounted for as liabilities at fair value until settled. The liability is recognised over the vesting period and is revalued at every reporting date and on settlement. Any changes in the liability are recognised in profit or loss.

Stanbic Holdings Plc Financial statements For the year ended 31 December 2017
38
Notes (continued)
2. Significant accounting policies (continued)
o) Current and deferred income tax
The tax expense for the period comprises current
and deferred income tax. Tax is recognised in profit
or loss, except to the extent that it relates to items
recognised in other comprehensive income or
directly in equity. In this case, the tax is also
recognised in other comprehensive income or
directly in equity respectively.
(i) Current income tax
The current income tax charge is calculated on the
basis of tax laws enacted or substantively enacted
at the reporting date. The directors periodically
evaluate positions taken in tax returns with respect
to situations in which applicable tax regulation is
subject to interpretation. They establish provisions
where appropriate on the basis of amounts
expected to be paid to the tax authorities.
(ii) Deferred income tax
Deferred income tax is recognised, using the liability
method, on temporary differences arising between
the tax bases of assets and liabilities and their
carrying amounts in the financial statements
However, deferred income tax liabilities are not
recognised if they arise from the initial recognition of
goodwill; deferred income tax is not accounted for if
it arises from initial recognition of an asset or liability
in a transaction other than a business combination
that at the time of the transaction affects neither
accounting nor taxable profit or loss.
Deferred income tax is determined using tax rates
(and laws) that have been enacted or substantially
enacted by the reporting date and are expected to
apply when the related deferred income tax asset is
realised or the deferred income tax liability is
settled.
Deferred income tax assets are recognised only to
the extent that it is probable that future taxable profit
will be available against which the temporary
differences can be utilised.
Deferred income tax assets and liabilities are offset
when there is a legally enforceable right to offset
current income tax assets against current income
tax liabilities and when the deferred income taxes
assets and liabilities relate to income taxes levied by
the same taxation authority on either the same entity
or different taxable entities where there is an
intention to settle the balances on a net basis.
p) Share capital
Ordinary shares are classified as ‘share capital’ in
equity. Any premium received over and above the
par value of the shares is classified as ‘share
premium’ in equity.
q) Dividends on ordinary shares
Dividends on ordinary shares are charged to equity
in the period in which they are declared.
r) Fiduciary activities
The Group commonly engages in trust or other
fiduciary activities that result in the holding or
placing of assets on behalf of individuals, trusts,
post-employment benefit plans and other
institutions. These assets and the income arising
directly thereon are excluded from these annual
financial statements as they are not assets of the
Group. However, fee income earned and fee
expenses incurred by the Group relating to the
Group’s responsibilities from fiduciary activities are
recognised in profit or loss.
s) Capitalisation of borrowing costs
Borrowing costs that relate to qualifying assets, that is, assets that necessarily take a substantial period of time to get ready for their intended use or sale and which are not measured at fair value, are capitalised. All other borrowing costs are recognised in profit or loss.
t) Hyperinflation The South Sudan economy has been classified as hyperinflationary from 1 January 2016. Accordingly, the results, cash flows and financial position of Stanbic South Sudan Branch have been expressed in terms of the measuring unit prevailing at the reporting date. The results, cash flows and financial position have also been expressed in terms of the measuring unit prevailing at the reporting date.

Stanbic Holdings Plc Financial statements For the year ended 31 December 2017
39
Notes (continued)
2. Significant accounting policies (continued)
t) Hyperinflation (continued) As the presentation currency of the Group is that of a non-hyperinflationary economy, comparative amounts are not adjusted for changes in the price level or exchange rates in the current year. In 2016, the components of owners’ equity, except retained earnings, are restated by applying a general price index from the dates the components were contributed or otherwise arose to the date of initial application. Non-monetary assets and liabilities are also restated at the date of initial application by applying to their cost and accumulated depreciation a general price index from the date the items were acquired to the date of initial application. The resulting adjustments determined at the beginning of the period are recognised directly in equity as an adjustment to
opening retained earnings. From the date of initial application and in subsequent periods, all components of owners’ equity are restated by applying a general price index from the beginning of the period or the date of contribution, if later. Items in the statement of financial position not already expressed in terms of the measuring unit current at the reporting period, such as non-monetary items carried at cost or cost less depreciation, are restated by applying a general price index. The restated cost, or cost less depreciation, of each item is determined by applying to its cost and accumulated depreciation the change in the general price index calculated from the later of the beginning of the reporting period and the date of acquisition up to the end of the reporting period. An impairment loss is recognised in profit or loss if the restated amount of a non-monetary item exceeds its estimated recoverable amount. Restated retained earnings are derived from all other amounts in the restated statement of financial position. All items recognised in the income statement are restated by applying the change in the general price index from the dates when the items of income and expenses were initially earned or incurred. Gains or losses on the net monetary position are recognised in profit or loss within finance costs. All items in the statement of cash flows are expressed in terms of the general price index.
u) Letters of Credit Acceptances Letters of credit acceptances arise in two ways: -
i) Issuing bank: At initial recognition where the Group is the LC issuer, it recognises a contingent liability for the amount that it may be required to pay out to the confirming bank or beneficiary should the terms and conditions underlying the contract be met. On the date that all terms and conditions underlying the contract are met, the Group recognises a financial asset (at fair value) on statement of financial position as part of loans and advances for the contractual right to receive cash from the applicant. Concurrently, the Group recognises a financial liability (at fair value) on statement of financial position as part of deposits for the contractual obligation to deliver cash to the beneficiary or the confirming bank, depending on the structure of the arrangement.
ii) Confirming bank At initial recognition where the Group is confirming the LC, it recognises the amount that it may be required to pay out to the beneficiary should the terms and conditions underlying the contract be met. The Group concurrently recognises a contingent asset for the amount that the issuing bank may be entitled to receive. On the date that all terms and conditions underlying the contract are met, the Group recognises a financial asset (at fair value) on the statement of financial position as part of loans and advances for the contractual right to receive cash from the issuing bank and concurrently recognises a financial liability (at fair value) on the statement of financial position as part of deposits for the contractual obligation to deliver cash to the beneficiary.
v) Comparative figures
Where necessary, comparative figures within notes
have been adjusted to conform to changes in
presentation in the current year.

Stanbic Holdings Plc Financial statements For the year ended 31 December 2017
40
Notes (continued)
3. Critical accounting estimates and judgements in
applying accounting policies
The Group makes estimates and assumptions that affect the reported amounts of assets and liabilities within the next financial year. Estimates and judgements are continually evaluated and are based on historical experience and other factors, including expectations of future events that are believed to be reasonable under the circumstances.
a) Impairment losses on loans and advances
The Group reviews its loan portfolios to assess impairment at least monthly. In determining whether an impairment loss should be recorded in the statement of profit or loss, the Group makes judgement as to whether there is any observable data indicating that there is a measurable decrease in the estimated future cash flows from a portfolio of loans before the decrease can be identified with an individual loan in that portfolio. This evidence may include observable data indicating that there has been an adverse change in the payment status of borrowers in a Group, or national or local economic conditions that correlate with defaults on assets in the Group. Management uses estimates based on historical loss experience for assets with credit risk characteristics and objective evidence of impairment similar to those in the portfolio when scheduling its future cash flows. The methodology and assumptions used for estimating both the amount and timing of future cash flows are reviewed regularly to reduce any differences between loss estimates and actual loss experience.
Management’s estimates of future cash flows on individually impaired loans are based on historical loss experience for assets with similar credit risk characteristics. The methodology and assumptions used for estimating both the amount and timing of future cash flows are reviewed regularly to reduce any differences between loss estimates and actual loss experience. Were the net present value of estimated cash flows from non-performing loans at year end to differ by +/-1%, the impairment loss would have been KShs 63,127,000 higher or KShs 63,127,000 lower (2016: Kshs 31,994,000 higher or KShs 31,994,000 lower).
b) Fair value of financial instruments
The fair value of financial instruments that are not quoted in active markets are determined by using valuation techniques. Where valuation techniques (for example, models) are used to determine fair values, they are validated and periodically reviewed by qualified personnel independent of the area that created them. All models are certified before they are used, and models are calibrated to ensure that outputs reflect actual data and comparative market prices. To the extent practical, models use only observable data, however areas such as credit risk (both own and counterparty), volatilities and correlations require management to make estimates. Changes in assumptions about these factors could affect reported fair value of financial instruments.
c) Impairment of goodwill
The Group tests, on an annual basis, whether goodwill
has suffered any impairment, in accordance with the
accounting policy stated in Note 2(j). The recoverable
amounts of cash-generating units have been
determined based on value-in-use calculations. The
carrying amount of the goodwill and the key
assumptions made are set out in Note 29.
d) Income taxes
Significant judgment is required in determining the Group’s provision for income taxes. There are many transactions and calculations for which the ultimate tax determination is uncertain during the ordinary course of business. The Group recognises liabilities for anticipated tax audit issues based on estimates of whether additional taxes will be due. Where the final tax outcome of these matters is different from the amounts that were initially recorded, such differences will impact the income tax and deferred income tax provisions in the period in which such determination is made.

Stanbic Holdings Plc Financial statements For the year ended 31 December 2017
41
Notes (continued)
3. Critical accounting estimates and judgements
in applying accounting policies (continued)
e) Hyperinflation
The Group exercises significant judgment in determining the onset of hyperinflation in countries in which it operates and whether the Functional Currency of its branches is the currency of a hyperinflationary economy. Various characteristics of the economic environment of each country are taken into account. These characteristics include, but are not limited to, whether:
• the general population prefers to keep its wealth in non-monetary assets or in a relatively stable foreign currency;
• prices are quoted in a relatively stable foreign currency;
• sales or purchase prices take expected losses of purchasing power during a short credit period into account;
• interest rates, wages and prices are linked to a price index; and
• the cumulative inflation rate over three years is approaching, or exceeds, 100%.
Following management’s assessment, the Bank’s branch, Stanbic Bank South Sudan has been accounted for as an entity operating in a hyperinflationary economy. The results, cash flows and financial position have been expressed in terms of the measuring units current at the reporting date and the results and financial position.
The general price indices used in adjusting the results, cash flows and financial position of the branch is set out below: The general price index used as published by the National Bureau of Statistics of South Sudan is as follows;
Date Base year
General price index
Inflation rate
30.09.2017 2016 2,178.73 78.63%
31.12.2016 2015 1,219.33 480.19%
The impact of adjusting the Group’s results for the effects of hyperinflation is set out below: 2017
Kshs 000 2016
Kshs 000
Net increase in revenue 136,283 655,448
Net monetary loss (Note 14) 186,502 1,150,687
Decrease in profit after tax (136,008) (549,127)

CfC Stanbic Holdings Limited Financial statements For the year ended 31 December 2017
42
Notes (continued)
4 Operating Segments
The Group is organised into two business units – Corporate and Investment Banking (CIB), Personal and Business Banking (PBB). The results of the business units are reviewed regularly by management in order to make decisions about resources to be allocated to segments and assessing segment performance.
The Group is required to disclose information to the users of its financial statements to evaluate the nature and financial effects of the business activities in which it engages and the economic environments in which it operates in compliance with IFRS 8.
An operating segment is a component of the Group engaged in business activities, whose operating results are reviewed regularly by management in order to make decisions about resources to be allocated to segments and assessing segment performance. Identification of segments and the measurement of segment results is based on the Group’s internal reporting to management.
Management has determined the operating segments based on the reports reviewed by the Group’s Chief Executive (CE) with the assistance of the Group’s Executive Committee (EXCO) and the Asset and Liability Committee (ALCO). Management considers the business from client turnover perspective.
The Group has therefore segmented its business as PBB and CIB. This is in line with Group reporting and decision-making reports.
The geographical spread (across borders) is also used as a part of performance analysis. The Group’s main subsidiary (Stanbic Bank Kenya Limited) operates one Branch in the Republic of South Sudan. Further, SBG Securities Limited (another subsidiary) operates branches in Uganda and Rwanda but these are not considered material for segment reporting.
Personal and Business Banking (PBB)
PBB provides banking services to individual
customers and small to medium sized enterprises.
The products offered include:
▪ Mortgage Lending – provides residential
accommodation loans to individual customers.
▪ Instalment Sales and Finance Leases –
comprises two areas, instalment finance in the
consumer market, mainly vehicles, and
secondly, finance of vehicles and equipment in
the business market.
▪ Card Products – provides card facilities to
individuals and businesses.
▪ Transactional and Lending Products –
transactions in products associated with the
various points of contact channels such as
Automated Teller Machines (ATMs), Internet,
and branches. This includes deposit taking
activities, electronic banking, cheque accounts
and other lending products.
Corporate and Investment Banking (CIB)
CIB provides commercial and investment financial
services to larger corporates, financial institutions
and international counterparties. The products
offered include:
▪ Global Markets – includes foreign exchange
and debt securities and equities trading.
▪ Transactional Products and Services – includes
transactional banking and investor services.
▪ Investment Banking – includes project finance,
advisory, structured finance, structured trade
finance, corporate lending, primary markets and
property finance.
▪ Wealth Management and advisory services.
Major customers
The Group does not have any one major customer
that contributes more than 10% of its revenues;
neither was there a major customer whose deposits
contributed more than 10% of the Group’s total
deposits as at 31 December 2017. However, the
Group has one major customer whose deposits
contribute 9.9% of total deposits as at December
2017 (2016: 5.8%). The interest expense paid to
this customer is reported under the CIB segment.
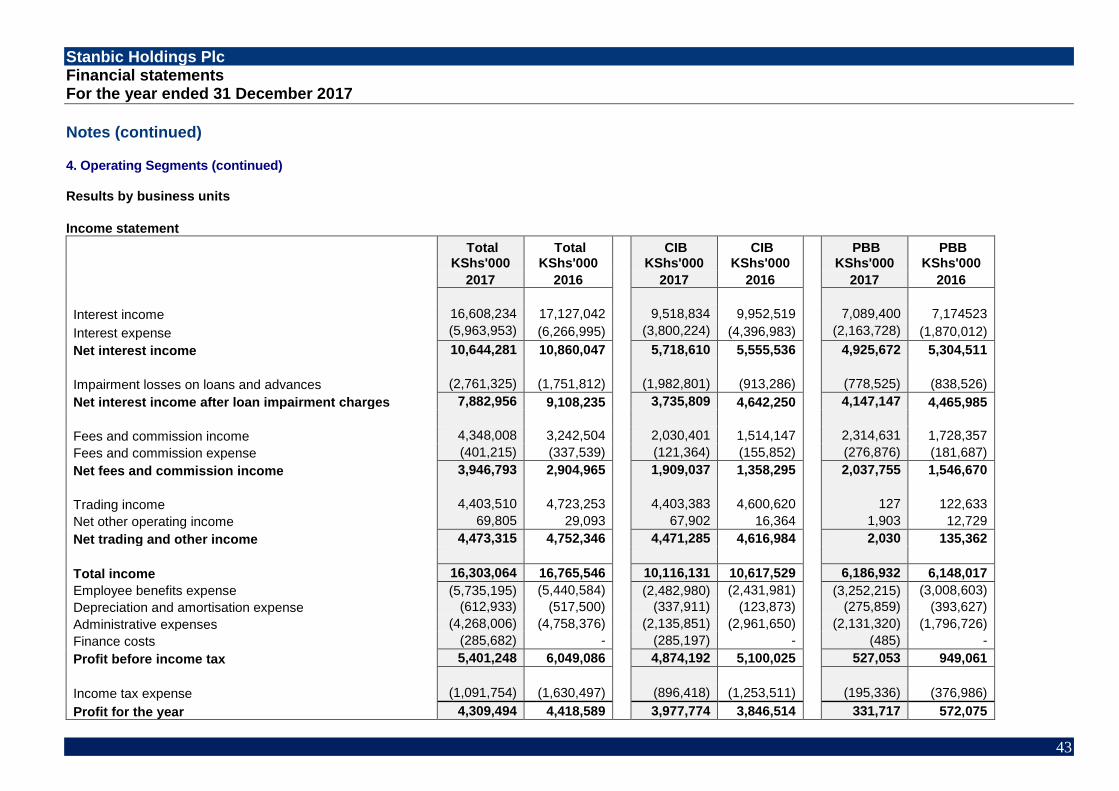
Stanbic Holdings Plc Financial statements For the year ended 31 December 2017
43
Notes (continued)
4. Operating Segments (continued) Results by business units
Income statement
Total
KShs'000 Total
KShs'000 CIB
KShs'000 CIB
KShs'000
PBB KShs'000
PBB KShs'000
2017 2016
2017 2016 2017 2016
Interest income 16,608,234 17,127,042
9,518,834 9,952,519
7,089,400 7,174523
Interest expense (5,963,953) (6,266,995)
(3,800,224) (4,396,983)
(2,163,728) (1,870,012)
Net interest income 10,644,281 10,860,047
5,718,610 5,555,536
4,925,672 5,304,511
Impairment losses on loans and advances (2,761,325) (1,751,812)
(1,982,801) (913,286)
(778,525) (838,526)
Net interest income after loan impairment charges 7,882,956 9,108,235
3,735,809 4,642,250
4,147,147 4,465,985
Fees and commission income 4,348,008 3,242,504
2,030,401 1,514,147
2,314,631 1,728,357
Fees and commission expense (401,215) (337,539)
(121,364) (155,852)
(276,876) (181,687)
Net fees and commission income 3,946,793 2,904,965
1,909,037 1,358,295
2,037,755 1,546,670
Trading income 4,403,510 4,723,253
4,403,383 4,600,620
127 122,633
Net other operating income 69,805 29,093
67,902 16,364
1,903 12,729
Net trading and other income 4,473,315 4,752,346
4,471,285 4,616,984
2,030 135,362
Total income 16,303,064 16,765,546
10,116,131 10,617,529
6,186,932 6,148,017
Employee benefits expense (5,735,195) (5,440,584)
(2,482,980) (2,431,981)
(3,252,215) (3,008,603)
Depreciation and amortisation expense (612,933) (517,500)
(337,911) (123,873)
(275,859) (393,627)
Administrative expenses (4,268,006) (4,758,376)
(2,135,851) (2,961,650)
(2,131,320) (1,796,726)
Finance costs (285,682) - (285,197) - (485) -
Profit before income tax 5,401,248 6,049,086
4,874,192 5,100,025
527,053 949,061
Income tax expense (1,091,754) (1,630,497)
(896,418) (1,253,511)
(195,336) (376,986)
Profit for the year 4,309,494 4,418,589
3,977,774 3,846,514
331,717 572,075

Stanbic Holdings Plc Financial statements For the year ended 31 December 2017
44
Notes (continued)
4. Operating Segments (continued)
Results by business units (continued) Statement of financial position
Total
KShs'000 Total
KShs'000 CIB
KShs'000 CIB
KShs'000 PBB
KShs'000 PBB
KShs'000 2017 2016 2017 2016 2017 2016
Assets
Cash and balances with Central Bank of Kenya 8,044,783 8,621,228
4,494,062 7,871,308
3,550,720 749,920
Financial investments 76,244,871 52,927,188
76,244,871 51,190,442
- 1,736,746
Derivative assets 2,391,101 2,472,191
2,391,101 2,472,191
- -
Loans and advances to banks 12,743,630 16,988,881 12,743,630 16,445,626 - 543,255
Loans and advances to customers 130,535,814 115,587,723
66,066,028 63,122,632
64,469,782 52,465,091
Other investments 17,500 -
17,500 -
- -
Property, equipment and intangibles 3,663,272 3,397,362
2,038,746 1,339,229
1,624,527 2,058,133
Goodwill 9,349,759 9,349,759 8,882,271 9,349,759 467,488 -
Deferred income tax 2,444,394 1,407,363
1,613,706 905,178
830,688 502,185
Current income tax 83,026 113,547 87,614 104,111 (4,588) 9,436
Other assets 3,220,573 3,817,487
250,221 1,089,892
2,970,352 2,727,595
Total assets 248,738,719 214,682,729
174,829,751 153,890,368
73,908,968 60,792,361
Liabilities
Customer deposits 154,660,772 119,328,219
84,638,490 62,232,770
70,022,282 57,095,449
Amounts due to other banks 38,707,135 36,506,824 38,707,135 36,517,365 - (10,541)
Current income tax - 1,402,810
- 803,853
- 598,957
Trading liabilities 362,630 3,867,718
362,630 3,867,718
- -
Derivative liabilities 2,427,563 3,061,063
2,427,563 3,061,063
- -
Borrowings 3,989,292 3,986,138
2,444,966 2,733,649
1,544,276 1,252,489
Other liabilities 5,596,773 6,389,083
3,403,215 4,937,001
2,193,616 1,452,082
Deferred tax liability 38,859 - 38,859 - - -
Total liabilities 205,783,032 174,541,855
132,022,858 114,153,419
73,760,174 60,388,436
-
Shareholders' equity 42,955,687 40,140,874
42,806,893 39,736,949
148,794 403,925
Total equity and liabilities 248,738,719 214,682,729
174,829,751 153,890,368
73,908,968 60,792,361

Stanbic Holdings Plc Financial statements For the year ended 31 December 2017
45
Notes (continued)
4. Operating Segments (continued)
Results by geographical area (continued) Statement of profit or loss
Total
KShs'000 Total
KShs'000
Kenya
KShs'000 Kenya
KShs'000
South Sudan
KShs'000
South Sudan
KShs'000 2017 2016 2017 2016 2017 2016 Interest income 16,608,233 17,127,042
16,607,079 17,123,205 1,154 3,837
Interest expense (5,963,952) (6,266,995)
(5,960,491) (6,266,993) (3,461) (2)
Net interest income 10,644,281 10,860,047
10,646,588 10,856,212 (2,307) 3,835
Impairment losses on loans and advances (2,761,325) (1,751,812)
(3,009,644) (1,342,006) 248,319 (686,229)
Net interest income after loan impairment charges 7,882,956 9,108,235
7,636,944 9,514,206 246,012 (682,394)
Fees and commission income 4,348,008 3,242,504
3,759,548 2,851,357 588,460 391,147
Fees and commission expense (401,215) (337,539)
(396,089) (313,385) (5,126) (24,154)
Net fees and commission income 3,946,793 2,904,965
3,363,459 2,537,972 583,334 366,993
Trading income 4,403,510 4,723,253
3,943,475 3,299,363 460,035 1,423,890
Net other operating income 69,805 29,093
69,799 29,093 6 -
Net trading and other income 4,473,315 4,752,346
4,013,274 3,328,456 460,041 1,423,890
Total income 16,303,064 16,765,546
15,013,677 15,380,634 1,289,387 1,108,489
Employee benefits expense (5,735,195) (5,440,584)
(5,454,906) (5,110,751) (280,288) (329,833)
Depreciation and amortisation expense (612,933) (517,500)
(606,974) (510,200) (5,959) (7,300)
Administrative expenses (4,268,006) (4,758,376) (3,876,440) (3,196,335) (391,566) (1,285,618)
Finance costs (285,682) -
(58,678) - (227,004) -
Profit before income tax 5,401,248 6,049,086
5,016,677 6,563,348 384,570 (514,262)
Income tax expense (1,091,754) (1,630,497)
(1,065,551) (1,618,470) (26,203) (12,027)
Profit for the year 4,309,494 4,418,589
3,951,126 4,944,878 358,368 (526,289)
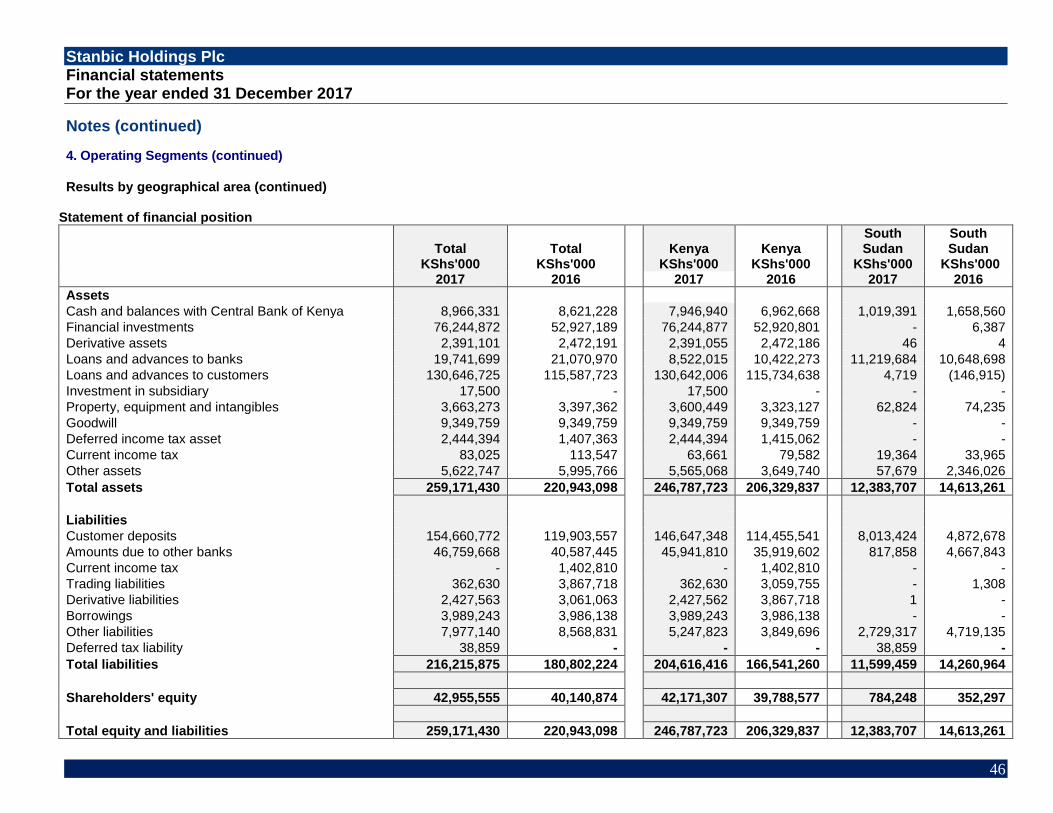
Stanbic Holdings Plc Financial statements For the year ended 31 December 2017
46
Notes (continued)
4. Operating Segments (continued)
Results by geographical area (continued)
Statement of financial position
Total
KShs'000 Total
KShs'000 Kenya
KShs'000 Kenya
KShs'000
South Sudan
KShs'000
South Sudan
KShs'000 2017 2016 2017 2016 2017 2016
Assets
Cash and balances with Central Bank of Kenya 8,966,331 8,621,228
7,946,940 6,962,668 1,019,391 1,658,560
Financial investments 76,244,872 52,927,189
76,244,877 52,920,801 - 6,387
Derivative assets 2,391,101 2,472,191
2,391,055 2,472,186 46 4
Loans and advances to banks 19,741,699 21,070,970 8,522,015 10,422,273 11,219,684 10,648,698
Loans and advances to customers 130,646,725 115,587,723
130,642,006 115,734,638 4,719 (146,915)
Investment in subsidiary 17,500 -
17,500 - - -
Property, equipment and intangibles 3,663,273 3,397,362
3,600,449 3,323,127 62,824 74,235
Goodwill 9,349,759 9,349,759 9,349,759 9,349,759 - -
Deferred income tax asset 2,444,394 1,407,363
2,444,394 1,415,062 - -
Current income tax 83,025 113,547 63,661 79,582 19,364 33,965
Other assets 5,622,747 5,995,766
5,565,068 3,649,740 57,679 2,346,026
Total assets 259,171,430 220,943,098
246,787,723 206,329,837 12,383,707 14,613,261
Liabilities
Customer deposits 154,660,772 119,903,557
146,647,348 114,455,541 8,013,424 4,872,678
Amounts due to other banks 46,759,668 40,587,445 45,941,810 35,919,602 817,858 4,667,843
Current income tax - 1,402,810
- 1,402,810 - -
Trading liabilities 362,630 3,867,718
362,630 3,059,755 - 1,308
Derivative liabilities 2,427,563 3,061,063
2,427,562 3,867,718 1 -
Borrowings 3,989,243 3,986,138
3,989,243 3,986,138 - -
Other liabilities 7,977,140 8,568,831
5,247,823 3,849,696 2,729,317 4,719,135
Deferred tax liability 38,859 - - - 38,859 -
Total liabilities 216,215,875 180,802,224
204,616,416 166,541,260 11,599,459 14,260,964
Shareholders' equity 42,955,555 40,140,874
42,171,307 39,788,577 784,248 352,297
Total equity and liabilities 259,171,430 220,943,098
246,787,723 206,329,837 12,383,707 14,613,261

Stanbic Holdings Plc Financial statements For the year ended 31 December 2017
47
Notes (continued) 4. Operating Segments (continued) Results by geographical area (continued) Reconciliation of reportable assets and liabilities
2017 2016
Assets KShs’000 KShs’000
Total assets for reportable segments 259,171,430 220,943,098
Elimination of inter-branch balances with South Sudan (10,432,711) (6,260,369)
Entity’s assets 248,738,719 214,682,729
Liabilities
Total liabilities for reportable segments 259,171,430 220,943,098
Elimination of inter-branch balances with South Sudan (10,432,711) (6,260,369)
Entity's liabilities 248,738,719 214,682,729
5 Financial risk management
Group risk management framework and governance structures The Group has exposure to the following risks from its use of financial instruments: ▪ Credit risk ▪ Liquidity risk ▪ Market risks ▪ Operational risks This note presents information about the Group’s exposure to each of the above risks, the Group’s objectives, policies and processes for measuring and managing risk, and the Group’s management of capital. The Board of Directors has overall responsibility for the establishment and oversight of the Group’s risk management framework. The Board has established various committees in the operating subsidiaries, including the Asset and Liability (ALCO), Credit and Operational Risk committees, which are responsible for developing and monitoring risk management policies in their specified areas. All Board committees have both executive and non-executive members and report regularly to the Board of Directors of the Group and the respective subsidiary on their activities. The Group’s risk management policies are established to identify and analyse the risks faced by the Group, to set appropriate risk limits and controls, and to monitor risks and adherence to limits. The Board provides written principles for overall risk management, as well as written policies covering specific areas, such as foreign exchange risk, interest rate risk, credit risk, use of derivative financial instruments and non-derivative financial instruments. Risk management policies and systems are reviewed regularly to reflect changes in market conditions, products and services offered. The Group, through its training and management standards and procedures, aims to develop a disciplined and constructive control environment, in which all employees understand their roles and obligations.

Stanbic Holdings Plc Financial statements For the year ended 31 December 2017
48
Notes (continued) 5 Financial risk management (continued) The Audit and Risk Committees are responsible for monitoring compliance with the Group’s risk management policies and procedures, and for reviewing the adequacy of the risk management framework in relation to the risks faced by the Group. The Audit Committee is assisted in this function by Internal Audit. Internal Audit undertakes both regular and ad-hoc reviews of risk management controls and procedures, the results of which are reported to the Audit Committee. By their nature, the Group’s activities are principally related to the use of financial instruments including derivatives. The Group accepts deposits from customers at both fixed and floating rates, and for various periods, and seeks to earn above-average interest margins by investing these funds in high quality assets. The Group seeks to increase these margins by consolidating short-term funds and lending for longer periods at higher rates, while maintaining sufficient liquidity to meet all claims that might fall due. The Treasury identifies, evaluates and hedges financial risks in close co-operation with the Group’s operating units. The Group also seeks to raise its interest margins by obtaining above-average margins, net of allowances, through lending to commercial and retail borrowers with a range of credit standing. Such exposures involve not just on-statement of financial position loans and advances; the Group also enters into guarantees and other commitments such as letters of credit and performance, and other bonds. The Group also trades in financial instruments where it takes positions in traded and over-the-counter instruments to take advantage of short-term market movements in bonds, currency and interest rate. The Board places trading limits on the level of exposure that can be taken in relation to both overnight and intra-day market positions. Foreign exchange and interest rate exposures associated with derivatives are normally offset by entering into counter-balancing positions, thereby controlling the variability in the net cash amounts required to liquidate market positions.

Stanbic Holdings Plc Financial statements For the year ended 31 December 2017
49
Notes (continued) 5 Financial risk management (continued)
a) Capital management
The Group’s objectives when managing capital, which is a broader concept than the ‘equity’ on the face of statement of financial position, are:
▪ To comply with the capital requirements set by the regulator, Capital Markets Authority in its relevant
jurisdictions of operations;
▪ To safeguard the Group’s ability (and its subsidiaries) to continue as a going concern so that it can
continue to provide returns for shareholders and benefits for other stakeholders.
▪ To maintain a strong capital base to support the development of its business; and
▪ To comply, at the operating companies level, with capital requirements set by respective regulators such
as the Central Bank of Kenya and Bank of South Sudan. Capital management – Company
The Company’s objectives when managing capital are to safeguard the Company’s ability to continue as a going concern in order to provide returns for shareholders and to maintain an optimal capital structure to reduce the cost of capital. In order to maintain or adjust the capital structure, the Company may limit the amount of dividends paid to shareholders, issue new shares, or sell assets to reduce debt. The Company monitors capital on the basis of the gearing ratio. This ratio is calculated as net debt divided by total capital. Net debt is calculated as total borrowings less cash and cash equivalents. Total capital is calculated as equity plus net debt.
2017 2016
KShs’000 KShs’000
Total borrowings
- -
Total equity
18,241,771 18,234,751
Gearing ratio
- -
The Board of Directors at the subsidiary companies are responsible for monitoring and ensuring compliance with the regulatory framework as established by the regulating bodies, namely Central Bank of Kenya, Capital Markets Authorities in Kenya, Rwanda and Uganda, Bank of South Sudan and the Nairobi Securities Exchange. This section presents information about the Group’s management of capital in the main operating divisions.

Stanbic Holdings Plc Financial statements For the year ended 31 December 2017
50
Notes (continued)
5 Financial risk management (continued)
a) Capital management (continued)
Capital management - Group
The Group’s objectives when managing capital, which is a broader concept than the ‘equity’ on the face of the
statement of financial position, are:
▪ To comply with the capital requirements set by the regulator, Capital Markets Authority;
▪ To safeguard the Group’s ability (and its subsidiaries) to continue as a going concern so that it can
continue to provide returns for shareholders and benefits for other stakeholders.
▪ To maintain a strong capital base to support the development of its business; and
▪ To comply, at the operating companies level, with capital requirements set by respective regulators such
as the Central Bank of Kenya and Bank of South Sudan.
The Group monitors the adequacy of its capital using ratios established by the Central Bank of Kenya (CBK), which
ratios are broadly in line with those of the Bank for International Settlements (BIS).
These ratios measure capital adequacy by comparing the Group’s eligible capital with its statement of financial
position assets, off-balance-sheet commitments and market and other risk positions at weighted amounts to reflect
their relative risk.
The risk-based approach applies to both on and off-statement of financial position items. The focus of this approach
is credit risk, interest rate risk, market risk, operational risk, concentration risk and underlying collateral risk.
The assets are weighted according to broad categories, each being assigned a risk weighting according to the
amount of capital deemed to be necessary to support them. Four categories of risk weights (0%, 20%, 50%, and
100%) are applied.
The Group’s key subsidiary (Stanbic Bank Kenya Limited) is required at all times to maintain:
▪ A minimum level of regulatory capital of KShs 1 billion as at 31 December 2017;
▪ A core capital (tier 1) of not less than 10.5 %(2016: 10.5%) of total risk weighted assets plus risk weighted
off-statement of financial position items;
▪ A core capital (tier 1) of not less than 8% (2016: 8%)of its total deposit liabilities; and
▪ A total capital (tier 1 + tier 2) of not less than 14.5% (2016: 14.5%) of its total risk weighted assets plus risk
adjusted off statement of financial position items.
Off-balance sheet credit related commitments and forwards are converted to credit risk equivalents using credit conversion factors, designed to convert these items into statement of financial position equivalents. The resulting credit equivalent amounts are then weighted for credit risk using the same percentages as for statement of financial position assets.
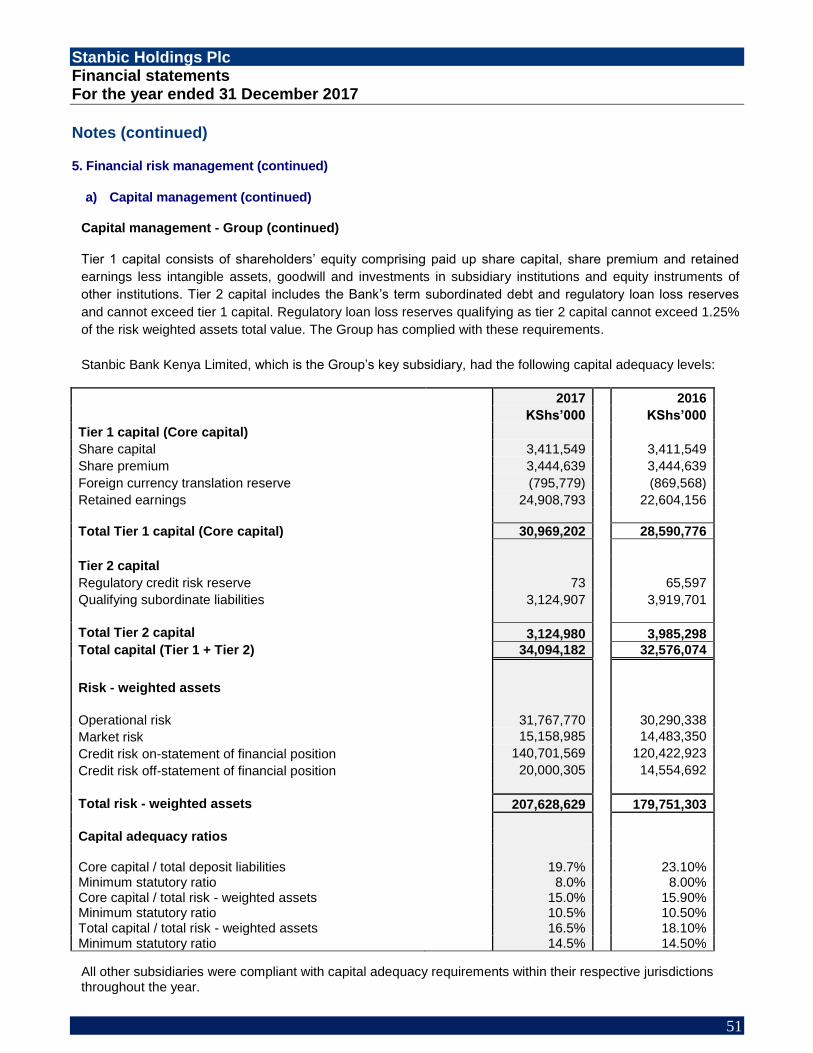
Stanbic Holdings Plc Financial statements For the year ended 31 December 2017
51
Notes (continued)
5. Financial risk management (continued)
a) Capital management (continued)
Capital management - Group (continued)
Tier 1 capital consists of shareholders’ equity comprising paid up share capital, share premium and retained
earnings less intangible assets, goodwill and investments in subsidiary institutions and equity instruments of
other institutions. Tier 2 capital includes the Bank’s term subordinated debt and regulatory loan loss reserves
and cannot exceed tier 1 capital. Regulatory loan loss reserves qualifying as tier 2 capital cannot exceed 1.25%
of the risk weighted assets total value. The Group has complied with these requirements.
Stanbic Bank Kenya Limited, which is the Group’s key subsidiary, had the following capital adequacy levels:
2017 2016
KShs’000 KShs’000
Tier 1 capital (Core capital)
Share capital 3,411,549
3,411,549
Share premium 3,444,639
3,444,639
Foreign currency translation reserve
(795,779)
(869,568)
Retained earnings 24,908,793
22,604,156
Total Tier 1 capital (Core capital) 30,969,202
28,590,776
Tier 2 capital
Regulatory credit risk reserve 73
65,597
Qualifying subordinate liabilities 3,124,907
3,919,701
Total Tier 2 capital 3,124,980
3,985,298
Total capital (Tier 1 + Tier 2) 34,094,182
32,576,074
Risk - weighted assets
Operational risk
31,767,770
30,290,338
Market risk
15,158,985
14,483,350
Credit risk on-statement of financial position 140,701,569
120,422,923
Credit risk off-statement of financial position 20,000,305
14,554,692
Total risk - weighted assets 207,628,629
179,751,303
Capital adequacy ratios
Core capital / total deposit liabilities 19.7% 23.10% Minimum statutory ratio 8.0% 8.00% Core capital / total risk - weighted assets 15.0% 15.90% Minimum statutory ratio 10.5% 10.50% Total capital / total risk - weighted assets 16.5% 18.10% Minimum statutory ratio 14.5% 14.50%
All other subsidiaries were compliant with capital adequacy requirements within their respective jurisdictions throughout the year.

Stanbic Holdings Plc Financial statements For the year ended 31 December 2017
52
Notes (continued)
5. Financial risk management (continued)
b) Credit risk
Credit risk is the risk of loss arising out of failure of client counterparties to meet their financial or contractual obligations when due. Credit risk is composed of counterparty risk (including primary, pre-settlement risk, issuer and settlement risk) and concentration risk. These risk types are defined as follows:
▪ Counterparty risk: The risk of credit loss to the Group as a result of failure by a counterparty to meet its
financial and/or contractual obligations to the Group as they fall due.
▪ Credit concentration risk: The risk of loss to the Group as a result of excessive build-up of exposure to a
specific counterparty or counterparty group, an industry, market, product, financial instrument or type of
security, or geography, or a maturity. This concentration typically exists where a number of counterparties
are engaged in similar activities and have similar characteristics, which could result in their ability to meet
contractual obligations being similarly affected by changes in economic or other conditions.
Governance committees
The primary governance committees overseeing credit risk are the Board Credit Risk Committee (BCRC) and Credit Risk Management Committee (CRMC). These committees are responsible for credit risk and credit concentration risk decision-making, and delegation thereof to Credit officers and committees within defined parameters. Credit risk management is governed by the Group’s overall credit policy guidelines. Respective Credit Risk Management Divisions, which report into the Board Credit Committee (BCC), are responsible for the implementation of these guidelines, which cover compliance with prescribed sanctioning authority levels, avoidance of a high concentration of credit risk and regular review of credit limits. Limits on facilities to counter-parties are governed by internal restraints, which restrict large exposures in relation to the Group’s capital.
The Group has set in place comprehensive resources, expertise and controls to ensure efficient and effective
management of credit risk.
General approach to managing credit risk
The Group’s credit risk comprises mainly wholesale and retail loans and advances, together with the counterparty credit risk arising from derivative contracts entered into with our clients and market counterparties. The Group manages credit risk through:
▪ maintaining strong culture of responsible lending and a robust risk policy and control framework
▪ identifying, assessing and measuring credit risk clearly and accurately across the Group, from the level of individual facilities up to the total portfolio
▪ defining, implementing and continually re-evaluating our risk appetite under actual and scenario conditions
▪ monitoring the Group’s credit risk relative to limits
▪ ensuring that there is expert scrutiny and independent approval of credit risks and their mitigation.

Stanbic Holdings Plc Financial statements For the year ended 31 December 2017
53
Notes (continued)
5. Financial risk management (continued)
b) Credit risk (continued)
General approach to managing credit risk (continued) Primary responsibility for credit risk management resides with the Group’s business lines. This is complemented with an independent credit risk function embedded within the business units, which is in turn supported by the overarching group risk function. Impairment provisions are provided for losses that have been incurred at the statement of financial position date. Significant changes in the economy, or in the health of a particular industry segment that represents a concentration of the Group’s portfolio, could result in losses that are different from those provided for at the reporting date. Management therefore carefully manages its exposure to credit risk. The exposure to any one borrower including banks is further restricted by sub-limits covering on- and off-balance sheet exposures and daily delivery risk limits in relation to trading items such as forward foreign exchange contracts. Actual exposures against limits are monitored daily. Exposure to credit risk is managed through regular analysis of the ability of borrowers and potential borrowers to meet interest and capital repayment obligations and by changing lending limits where appropriate. Exposure to credit risk is also managed in part by obtaining collateral and corporate and personal guarantees, but a significant portion is personal lending where no such facilities can be obtained. Management reporting
A number of reports are prepared as management information on credit risk. Various analyses of the data are done and a variety of reports are prepared on a monthly and quarterly basis. Some of these reports include:
▪ Monthly BCRC Report
▪ Quarterly Board Audit Report
▪ Quarterly Board Risk Report
▪ Regulatory returns
▪ Half-year results
▪ Annual financial statements
These reports are distributed to Standard Bank Group controlling divisions, regulators and are available for inspection by authorised personnel.
Stanbic Holdings Plc Financial statements For the year ended 31 December 2017
54
Notes (continued)
5. Financial risk management (continued)
b) Credit risk (continued)
General approach to managing credit risk (continued)
Loans and advances including loan commitments and guarantees
The estimation of credit exposure is complex and requires the use of models, as the value of a product varies with
changes in market variables, expected cash flows and the passage of time. The assessment of credit risk of a
portfolio of assets entails further estimations as to the likelihood of defaults occurring, of the associated loss ratios
and of default correlations between counterparties.
The Group has developed models to support the quantification of the credit risk. These rating and scoring models
are in use for all key credit portfolios and form the basis for measuring default risks. All models are managed
under model development and validation policies that set out the requirements for model governance structures
and processes, and the technical framework within which model performance and appropriateness is maintained.
The models are developed using internal historical default and recovery data. In low default portfolios, internal
data is supplemented with external benchmarks and studies. Models are assessed frequently to ensure on-going
appropriateness as business environments and strategic objectives change, and are recalibrated annually using
the most recent internal data
In measuring credit risk of loans and advances to customers and to banks at a counter-party level, the Group reflects three components:
(i) the ‘probability of default’ by the client or counter-party on its contractual obligations; (ii) current exposures to the counter-party and its likely future development, from which the Group derives the
‘exposure at default’; and (iii) the likely recovery ratio on the defaulted obligations (the ‘loss given default’).
Probability of default The Group uses a 25-point master rating scale to quantify the credit risk for each borrower as illustrated in the table on the following page. Ratings are mapped to PDs by means of calibration formulae that use historical default rates and other data from the applicable portfolio. The bank distinguishes between through-the-cycle PDs and point-in-time PDs, and utilises both measures in decision-making and in managing credit risk exposures.
Loss given default Loss given default (LGD) measures are a function of customer type, product type, seniority of loan, country of risk
and level of collateralisation. LGDs are estimated based on historic recovery data per category of LGD. A
downturn LGD is used in the estimation of the capital charge and reflects the anticipated recovery rates and
macroeconomic factors in a downturn period.
Exposure at default Exposure at default (EAD) captures the impact of potential draw-downs against unutilised facilities and changes in
counterparty risk positions due to changes in market prices. By using historical data, it is possible to estimate the
average utilisation of limits of an account when default occurs, recognising that customers may use more of their
facilities as they approach default.
For debt securities, external ratings such as Standard & Poor’s rating or their equivalents are used by Bank Treasury for managing of the credit risk exposures as supplemented by the Bank's own assessment through the use of internal ratings tools.
Debt securities
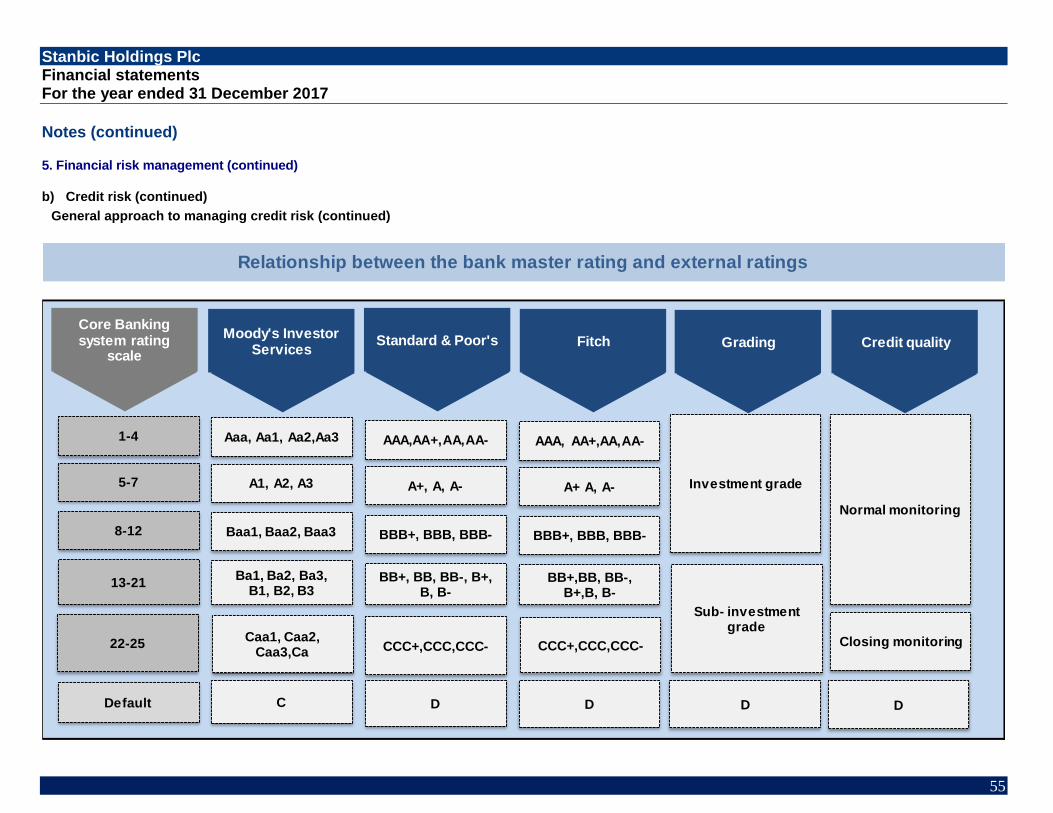
Stanbic Holdings Plc Financial statements For the year ended 31 December 2017
55
Notes (continued)
5. Financial risk management (continued)
b) Credit risk (continued)
General approach to managing credit risk (continued)
Relationship between the bank master rating and external ratings
Core Banking system rating
scale
Moody's InvestorServices
Standard & Poor's Fitch Grading Credit quality
1-4
5-7
8-12
13-21
22-25
Default
AAA, AA+,AA,AA-
A+ A, A-
BBB+, BBB, BBB-
BB+,BB, BB-,B+,B, B-
CCC+,CCC,CCC-
D
Aaa, Aa1, Aa2,Aa3
A1, A2, A3
Baa1, Baa2, Baa3
Ba1, Ba2, Ba3,B1, B2, B3
Caa1, Caa2, Caa3,Ca
C
AAA,AA+,AA,AA-
A+, A, A-
BBB+, BBB, BBB-
BB+, BB, BB-, B+, B, B-
CCC+,CCC,CCC-
D
Investment grade
Sub- investment grade
D
Normal monitoring
Closing monitoring
D

Stanbic Holdings Plc Financial statements For the year ended 31 December 2017
56
Notes (continued)
5. Financial risk management (continued)
b) Credit risk (continued)
Risk limit control and mitigation policies
The Group manages, limits and controls concentrations of credit risk wherever they are identified − in particular,
to individual counterparties and banks, industries and countries.
The Group structures the levels of credit risk it undertakes by placing limits on the amount of risk accepted in
relation to one borrower, or banks of borrowers, and to geographical and industry segments. Such risks are
monitored on a revolving basis and subject to an annual or more frequent review, when considered necessary.
Limits on the level of credit risk by product, industry sector and country are approved quarterly by the Board of
Directors.
The exposure to any one borrower including banks and brokers is further restricted by sublimit covering on- and
off-balance sheet exposures, and daily delivery risk limits in relation to trading items such as forward foreign
exchange contracts. Actual exposures against limits are monitored daily.
Lending limits are reviewed in the light of changing market and economic conditions and periodic credit reviews
and assessments of probability of default.
Some other specific control and mitigation measures are outlined below:
i. Credit tailored to customer profile
There is a clear distinction between the fundamental credit characteristics of the Group’s customer base. This
customer base is managed according to the following market segments:
▪ Corporate and Investment Banking
▪ Personal and Business Banking
The Group has established separate credit management functions for each market segment.
Corporate and Investment Banking (CIB) - (Corporate, sovereign and Bank portfolios)
Corporate, sovereign and bank borrowers include Kenyan and international companies, sovereigns, local government
entities, bank financial institutions, non-bank financial institutions and public-sector entities. The entities include large
companies as well as small and medium enterprises that are managed on a relationship basis. Creditworthiness is
assessed based on a detailed individual assessment of the financial strength of the borrower. Exposure is usually in
the form of short and long-term loans and advances but may include exposures arising from derivative contracts. In
these sectors, credit risk management is characterised by a close working relationship between the counter-party, the
customer relationship team and an independent credit evaluation manager. The credit evaluation manager bases his
lending decision on an in-depth knowledge of the counterparty and the industry in which it operates, as well as an
assessment of the creditworthiness of the counter-party based on a review of the audited financial statements and
underlying risk parameters.
CIB believes that the use of sophisticated modelling techniques combined with an in-depth knowledge and understanding of each client is essential in properly assessing the credit risk, both initially and on an on-going basis, of each counterparty with whom it deals.
To this end CIB uses software developed by third party vendors, which is widely used by the banking industry globally in its credit management process. Expected default frequencies are an important tool in the formal credit assessment process of both new and existing business, and form the basis for monitoring changes in counterparty credit quality on a day to day basis. Expected default frequencies will continue to be a vital component of credit risk management as the Group continues to improve credit processes and increases focus on portfolio credit management.

Stanbic Holdings Plc Financial statements For the year ended 31 December 2017
57
Notes (continued)
5. Financial risk management (continued)
b) Credit risk (continued)
Risk limit control and mitigation policies (continued)
i. Credit tailored to customer profile (continued)
Personal and Business Banking (PBB) Retail portfolio
Retail mortgage exposures relate to mortgage loans to individuals and are a combination of both drawn and undrawn EADs. Qualifying retail revolving exposure (QRRE) relate to cheque accounts, credit cards and evolving personal loans and products, and include both drawn and undrawn exposures. Retail other covers other branch lending and vehicle finance for retail, retail small and retail medium enterprise portfolios. Branch lending includes both drawn and undrawn exposures, while vehicle and asset finance only has drawn exposures.
Internally developed behavioural scorecards are used to measure the anticipated performance for each account.
Mapping of the behaviour score to a PD is performed for each portfolio using a statistical calibration of portfolio-
specific historical default experience. The behavioural scorecard PDs are used to determine the portfolio
distribution on the master rating scale. Separate LGD models are used for each product portfolio and are based
on historical recovery data. EAD is measured as a percentage of the credit facility limit and is based on historical
averages. EAD is estimated per portfolio and per portfolio-specific segment, using internal historical data on limit
utilisation.
ii. Financial covenants (for credit related commitments and loan books)
The primary purpose of these instruments is to ensure that funds are available to a customer as required. Guarantees and standby letters of credit, which represent irrevocable assurances that the Group will make payments in the event that a customer cannot meet its obligations to third parties, carry the same credit risk as loans. Documentary and commercial letters of credit, which are written undertakings by the Bank on behalf of a customer authorising a third party to draw drafts on the Group up to a stipulated amount under specific terms and conditions, are collateralised by the underlying shipments of goods to which they relate and therefore carry less risk than a direct borrowing.
Commitments to extend credit represent unused portions of authorisations to extend credit in the form of loans,
guarantees or letters of credit. With respect to credit risk on commitments to extend credit, the Group is potentially
exposed to loss in an amount equal to the total unused commitments. However, the likely amount of loss is less
than the total unused commitments, as most commitments to extend credit are contingent upon customers
maintaining specific credit standards. The Group monitors the term to maturity of credit commitments because
longer-term commitments generally have a greater degree of credit risk than shorter-term commitments.
iii. Master netting arrangements
The Group further restricts its exposure to credit losses by entering into master netting arrangements with
counterparties with which it undertakes a significant volume of transactions. Master netting arrangements do not
generally result in an offset of assets and liabilities of the statement of financial position, as transactions are either
usually settled on a gross basis or under most netting agreements the right of set off is triggered only on default.
However, the credit risk associated with favourable contracts is reduced by a master netting arrangement to the
extent that if a default occurs, all amounts with the counterparty are terminated and settled on a net basis. The
Bank’s overall exposure to credit risk on derivative instruments subject to master netting arrangements can
change substantially within a short period, as it is affected by each transaction subject to the arrangement.

Stanbic Holdings Plc Financial statements For the year ended 31 December 2017
58
Notes (continued)
5. Financial risk management (continued)
b) Credit risk (continued)
Risk limit control and mitigation policies (continued)
iv. Derivatives
For derivative transactions, the Group typically uses internationally recognised and enforceable International Swaps
and Derivatives Association (ISDA) agreements, with a credit support annexure, where collateral support is
considered necessary. Other credit protection terms may be stipulated, such as limitations on the amount of
unsecured credit exposure acceptable, collateralisation if mark-to-market credit exposure exceeds acceptable limits,
and termination of the contract if certain credit events occur, for example, downgrade of the counterparty’s public
credit rating.
v. Collateral The Group employs a range of policies and practices to mitigate credit risk. The most traditional of these is the taking of security for funds advanced, which is common practice. The Group implements guidelines on the acceptability of specific classes of collateral or credit risk mitigation. The main types of collateral taken are:
Personal and Business Banking
Mortgage lending First ranking legal charge over the property financed.
Instalment sales Joint registration of vehicles.
Other loans and advances Debentures over the Company’s assets, cash cover in cash
margin account, first ranking legal charge over both
commercial and residential properties, directors’ personal
guarantees and Company guarantees.
Corporate and Investment Banking
Corporate lending . All assets debenture over the Company’s assets, cash
cover in cash margin account, first ranking legal charge
over both commercial and residential properties, directors’
personal guarantees and Company guarantees.
Longer-term finance and lending to corporate entities is generally secured; revolving individual credit facilities are
generally unsecured. In addition, in order to minimise possible credit loss the Group seeks additional collateral from
the counter-party as soon as impairment indicators are noticed for the relevant individual loans and advances.
Collateral held as security for financial assets other than loans and advances is determined by the nature of the
instrument. Debt securities, treasury and other eligible bills are generally unsecured, with the exception of asset-
backed securities and similar instruments, which are secured by portfolios of financial instruments.
Valuation of collateral
The Group has a panel of valuers who undertake valuation of property and other assets to be used as Collateral.
The valuers in the panel are qualified professional valuers with adequate experience in the field of property and
machinery valuation. All the valuers on the panel provide the Group with professional indemnity to cover the
Group in case of negligence. The Group ensures that all properties used as collateral are adequately insured
during the term of the loan. Valuation reports on properties are valid for three years after which the property and
equipment is revalued.

Stanbic Holdings Plc Financial statements For the year ended 31 December 2017
59
Notes (continued)
5. Financial risk management (continued)
b) Credit risk (continued)
Risk limit control and mitigation policies (continued)
v. Collateral (continued)
The Group does not hold collateral which it is permitted to use in the absence of default by the customers. In the retail portfolio, 89% (2016: 87%) is fully collateralised. The total average collateral coverage for all retail mortgage exposures above 50% collateral coverage category is 100% (2016: 100%). Of the Group’s total exposure, 38% (2016: 38%) is unsecured and mainly reflects exposures to well-rated corporate counterparties, Group counterparties and sovereign entities.
The table on the following page shows the financial effect that collateral has on the Bank’s maximum exposure to
credit risk. The table includes collateral that management takes into consideration in the management of the
bank’s exposures to credit risk. All on- and off-balance sheet exposures that are exposed to credit risk, including
non-performing loans, have been included.
Collateral includes:
o Financial securities that have a tradable market, such as shares and other securities
o Physical items, such as property, plant and equipment
o Financial guarantees and intangible assets.
Netting agreements, which do not qualify for offset under IFRS but which are nevertheless enforceable, are
included as part of the bank’s collateral for risk management purposes. All exposures are presented before the
effect of any impairment provisions.
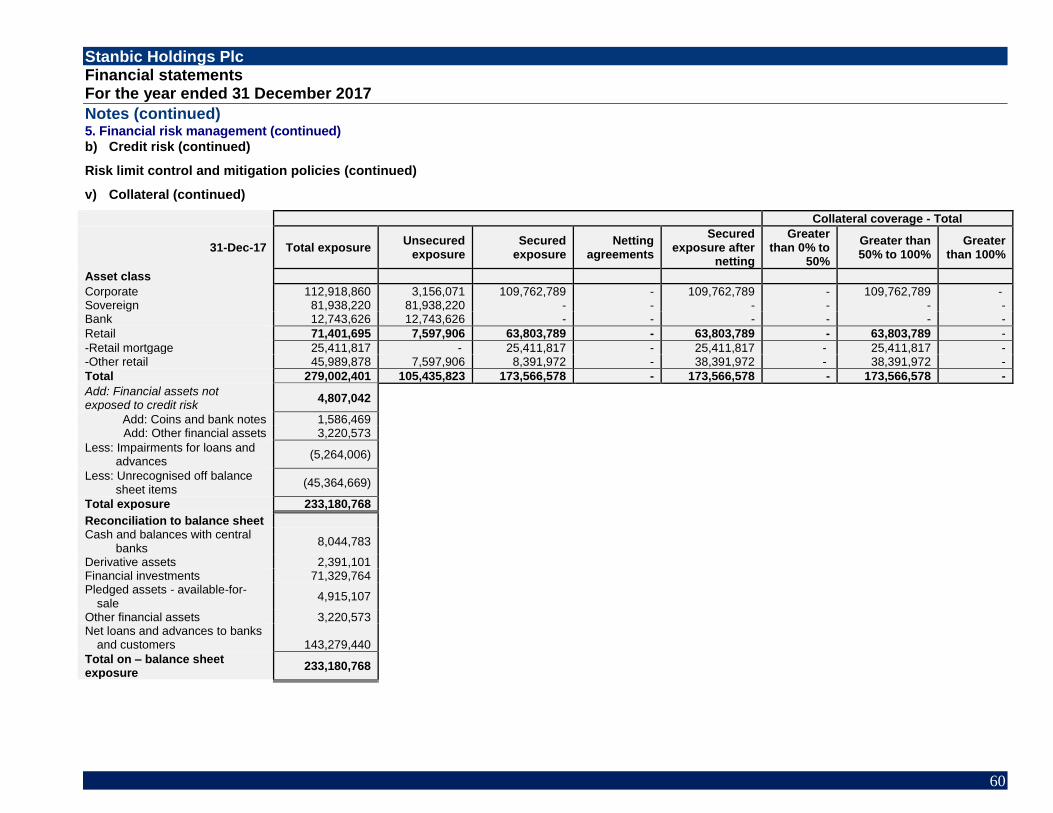
Stanbic Holdings Plc Financial statements For the year ended 31 December 2017
60
Notes (continued) 5. Financial risk management (continued)
b) Credit risk (continued)
Risk limit control and mitigation policies (continued)
v) Collateral (continued)
Collateral coverage - Total
31-Dec-17 Total exposure Unsecured
exposure Secured
exposure Netting
agreements
Secured exposure after
netting
Greater than 0% to
50%
Greater than 50% to 100%
Greater than 100%
Asset class
Corporate 112,918,860 3,156,071 109,762,789 - 109,762,789 - 109,762,789 - Sovereign 81,938,220 81,938,220 - - - - - - Bank 12,743,626 12,743,626 - - - - - -
Retail 71,401,695 7,597,906 63,803,789 - 63,803,789 - 63,803,789 -
-Retail mortgage 25,411,817 - 25,411,817 - 25,411,817 - 25,411,817 - -Other retail 45,989,878 7,597,906 8,391,972 - 38,391,972 - 38,391,972 -
Total 279,002,401 105,435,823 173,566,578 - 173,566,578 - 173,566,578 -
Add: Financial assets not exposed to credit risk
4,807,042
Add: Coins and bank notes 1,586,469 Add: Other financial assets 3,220,573 118,785,323
Less: Impairments for loans and advances
(5,264,006) 32,586,756
Less: Unrecognised off balance sheet items
(45,364,669)
Total exposure 233,180,768
Reconciliation to balance sheet Cash and balances with central
banks 8,044,783
Derivative assets 2,391,101 Financial investments 71,329,764 Pledged assets - available-for-
sale 4,915,107
Other financial assets 3,220,573 Net loans and advances to banks
and customers
143,279,440
Total on – balance sheet exposure
233,180,768

Stanbic Holdings Plc Financial statements For the year ended 31 December 2017
61
Notes (continued) 5. Financial risk management (continued)
b) Credit risk (continued)
Risk limit control and mitigation policies (continued)
v) Collateral (continued) Collateral coverage - Total
31 December 2016 Total exposure
Unsecured exposure
Secured exposure
Netting agreements
Secured exposure after netting
Greater than 0% to 50%
Greater than 50% to 100%
Greater than 100%
Asset class
Corporate 92,687,711 2,615,689 90,072,022 - 90,072,022 - 90,072,022 - Sovereign 64,640,257 64,640,257 - - - - - - Group 12,575,544 12,575,544 - - - - - -
Retail 59,287,265 7,726,870 51,560,395 - 51,560,395 - 51,560,395 -
-Retail mortgage 15,349,065 - 15,349,065 - 15,349,065 - 15,349,065 - -Other retail 43,938,200 7,726,870 36,211,330 - 36,211,330 - 36,211,330 - Total 229,190,777 87,558,360 141,632,417 - 141,632,417 - 141,632,417 - Add: Financial assets not exposed to credit risk
5,389,128
Add: Coins and Group notes 1,571,641 Add: Other financial assets 3,817,487
Less: Impairments for loans and advances
(3,591,243)
Less: Unrecognised off balance sheet items
(30,573,964)
Total exposure 200,414,698
Reconciliation to balance sheet Cash and balances with central banks
8,621,228
Derivative assets 2,472,191 Financial investments 50,032,732 Trading assets - Pledged assets 2,894,456 Other financial assets 3,817,487 Net loans and advances to banks
and customers
132,576,604
Total on – balance sheet exposure 200,414,698

Stanbic Holdings Plc Financial statements For the year ended 31 December 2017
62
Notes (continued)
5. Financial risk management (continued)
b) Credit risk (continued)
Risk limit control and mitigation policies (continued)
(v) Collateral (continued)
Repossessed Collateral
Assets repossessed as at the end of the year comprise saloon vehicles, prime movers and trailers, which had been financed by the Group under Vehicle
and Asset Finance (VAF) and residential and commercial property financed under personal markets. As at the year end, the Group had taken possession of
the following:
2017 2016
KShs'000 KShs'000
Nature of assets
Residential property
19,650 33,900
Other
265,976 246,892
285,626 280,792
It is the Group’s policy to dispose of repossessed properties on the open market, at fair market value. The proceeds are used to reduce or repay the
outstanding claim. In general, the Group does not occupy repossessed properties for business use.
(vi) Renegotiated financial assets
Renegotiated loans and advances are exposures which have been refinanced, rescheduled, rolled over or otherwise modified following weaknesses in the
counterparty's financial position, and where it has been judged that normal repayment will likely continue after the restructure. The table below shows the
carrying amount of financial assets that would otherwise be past due or impaired whose terms have been renegotiated, by class;
2017 2016
KShs'000 KShs'000
Personal and Business Banking
Instalment sales and finance leases
61,380 535,217 Other loans and advances
21,957 7,000,550
Corporate and Investment Banking
- -
83,337 7,535,767

Stanbic Holdings Plc Financial statements For the year ended 31 December 2017
63
Notes (continued)
5. Financial risk management (continued)
b) Credit risk (continued)
(vii) Impairment and provisioning policy
The internal and external rating systems described above focus more on credit-quality mapping from the inception of the lending and investment activities. In
contrast, impairment provisions are recognised for financial reporting purposes only for losses that have been incurred at the reporting date based on objective
evidence of impairment (see accounting policy 2.h (iv)) Due to the different methodologies applied, the amount of incurred credit losses provided for in the
financial statements is lower than the amount determined from the expected loss model used for internal operational management and banking regulation
purposes. The difference between the two methodologies is captured in the statutory reserve in equity (Note 40).
The internal rating tool assists management to determine whether objective evidence of impairment exists under IAS 39, based on the following criteria set
out by the Group:
• Delinquency in contractual payments of principal or interest;
• Cash flow difficulties experienced by the borrower (e.g. equity ratio, net income percentage of sales);
• Breach of loan covenants or conditions;
• Initiation of bankruptcy proceedings;
• Deterioration of the borrower’s competitive position;
• Deterioration in the value of collateral.
The Group’s policy requires the review of individual financial assets that are above materiality thresholds at least annually or more regularly when individual
circumstances require. Impairment allowances on individually assessed accounts are determined by an evaluation of the incurred loss at reporting date on
a case-by-case basis, and are applied to all individually significant accounts. The assessment normally encompasses collateral held (including re-
confirmation of its enforceability) and the anticipated receipts for that individual account.
Collectively assessed impairment allowances are provided for: (i) portfolios of homogenous assets that are individually below materiality thresholds; and (ii)
losses that have been incurred but have not yet been identified, by using the available historical experience, experienced judgment and statistical
techniques.
The credit quality of financial assets is managed by the Group using the Group’s internal credit rating system. The credit rating system utilises both
quantitative and qualitative information in arriving at the credit rating. Financial information is used and is key in arriving at the credit rating of individual
borrowers. The qualitative information used in generating the credit rating includes quality of management, account operation and the industry in which the
customer operates. The key consideration though remains the ability of the customer to meet its financial obligation from its cash flow.
The impairment provision shown in the statement of financial position at year-end is derived from each of the five internal rating grades. However, the
majority of the impairment provision comes from the bottom two grading (doubtful and loss categories).

Stanbic Holdings Plc Financial statements For the year ended 31 December 2017
64
Notes (continued)
5. Financial risk management (continued)
b) Credit risk (continued)
(vii) Impairment and provisioning policy (continued)
Criteria for classification of loans and advances
Performing loans Neither past due nor specifically impaired loans: are loans that are current and fully compliant with all contractual terms and conditions. Normal monitoring loans within this category are generally rated 1 to 21, and close monitoring loans are generally rated 22 to 25 using the Group’s master rating scale.
Early arrears but not specifically impaired loans: include those loans where the counterparty has failed to make contractual payments and payments are less than 90 days past due, but it is expected that the full carrying value will be recovered when considering future cash flows, including collateral. Ultimate loss is not expected but could occur if the adverse conditions persist. Non-performing loans Non-performing loans are those loans for which:
• the bank has identified objective evidence of default, such as a breach of a material loan covenant or condition, or
• instalments are due and unpaid for 90 days or more.
• Non-performing specifically impaired loans: are those loans that are regarded as non-performing and for which there has been a measurable decrease in estimated future cash flows.
Specifically impaired loans are further analysed into the following categories:
• Sub-standard: Items that show underlying well-defined weaknesses and are considered to be specifically impaired.
• Doubtful: Items that are not yet considered final losses due to some pending factors that may strengthen the quality of the items.
• Loss: Items that are considered to be uncollectible in whole or in part. The Group provides fully for its anticipated loss, after taking collateral into account.
(viii) Credit Quality
Maximum exposure to credit risk before collateral held or other credit enhancements
Financial instruments whose carrying amounts do not represent the maximum exposure to credit risk without taking account of any collateral held or other
credit enhancements are disclosed in Note 5.b (v). The directors are confident in the ability to continue to control and sustain minimal exposure of credit risk
to the Bank resulting from both the loan and advances portfolio and debt securities based on the following:
• 61% of the total maximum exposure is derived from loans and advances to banks and customers (2016: 66%); 33% represents investments in
debt securities (2016: 26%)
• 86% of the loans and advances portfolio is categorised in the top two grades of the internal rating system (2016: 86%);
• 87% of the loans and advances portfolio are considered to be neither past due nor impaired (2016: 96%); and
• 95% of all the debt securities, which the Group has invested in, are issued by the Central Bank of Kenya (2016: 100%).
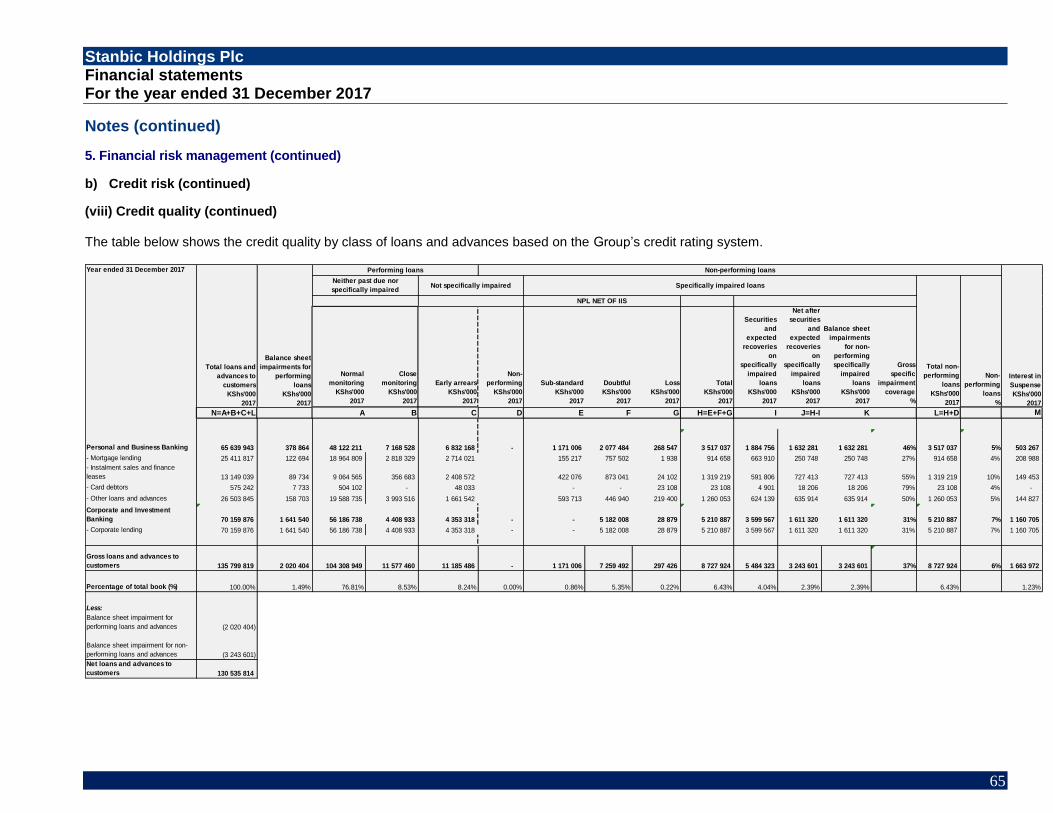
Stanbic Holdings Plc Financial statements For the year ended 31 December 2017
65
Notes (continued)
5. Financial risk management (continued)
b) Credit risk (continued)
(viii) Credit quality (continued) The table below shows the credit quality by class of loans and advances based on the Group’s credit rating system.
Normal
monitoring
KShs'000
2017
Close
monitoring
KShs'000
2017
Early arrears
KShs'000
2017
Non-
performing
KShs'000
2017
Sub-standard
KShs'000
2017
Doubtful
KShs'000
2017
Loss
KShs'000
2017
Total
KShs'000
2017
Securities
and
expected
recoveries
on
specifically
impaired
loans
KShs'000
2017
Net after
securities
and
expected
recoveries
on
specifically
impaired
loans
KShs'000
2017
Balance sheet
impairments
for non-
performing
specifically
impaired
loans
KShs'000
2017
Gross
specific
impairment
coverage
%
N=A+B+C+L A B C D E F G H=E+F+G I J=H-I K L=H+D M
Personal and Business Banking 65 639 943 378 864 48 122 211 7 168 528 6 832 168 - 1 171 006 2 077 484 268 547 3 517 037 1 884 756 1 632 281 1 632 281 46% 3 517 037 5% 503 267
- Mortgage lending 25 411 817 122 694 18 964 809 2 818 329 2 714 021 155 217 757 502 1 938 914 658 663 910 250 748 250 748 27% 914 658 4% 208 988
- Instalment sales and finance
leases 13 149 039 89 734 9 064 565 356 683 2 408 572 422 076 873 041 24 102 1 319 219 591 806 727 413 727 413 55% 1 319 219 10% 149 453
- Card debtors 575 242 7 733 504 102 - 48 033 - - 23 108 23 108 4 901 18 206 18 206 79% 23 108 4% -
- Other loans and advances 26 503 845 158 703 19 588 735 3 993 516 1 661 542 593 713 446 940 219 400 1 260 053 624 139 635 914 635 914 50% 1 260 053 5% 144 827
Corporate and Investment
Banking 70 159 876 1 641 540 56 186 738 4 408 933 4 353 318 - - 5 182 008 28 879 5 210 887 3 599 567 1 611 320 1 611 320 31% 5 210 887 7% 1 160 705
- Corporate lending 70 159 876 1 641 540 56 186 738 4 408 933 4 353 318 - - 5 182 008 28 879 5 210 887 3 599 567 1 611 320 1 611 320 31% 5 210 887 7% 1 160 705
Gross loans and advances to
customers 135 799 819 2 020 404 104 308 949 11 577 460 11 185 486 - 1 171 006 7 259 492 297 426 8 727 924 5 484 323 3 243 601 3 243 601 37% 8 727 924 6% 1 663 972
Percentage of total book (%) 100.00% 1.49% 76.81% 8.53% 8.24% 0.00% 0.86% 5.35% 0.22% 6.43% 4.04% 2.39% 2.39% 6.43% 1.23%
Less:
Balance sheet impairment for
performing loans and advances (2 020 404)
Balance sheet impairment for non-
performing loans and advances (3 243 601)
Net loans and advances to
customers 130 535 814
Neither past due nor
specifically impaired
Year ended 31 December 2017
Interest in
Suspense
KShs'000
2017
Not specifically impaired Specifically impaired loans
Total non-
performing
loans
KShs'000
2017
Non-
performing
loans
%
Total loans and
advances to
customers
KShs'000
2017
Balance sheet
impairments for
performing
loans
KShs'000
2017
Performing loans Non-performing loans
NPL NET OF IIS

Stanbic Holdings Plc Financial statements For the year ended 31 December 2017
66
Notes (continued) 5. Financial risk management (continued)
c) Credit risk (continued) (viii) Credit quality (continued)
Normal
monitoring
KShs'000
2016
Close
monitoring
KShs'000
2016
Early arrears
KShs'000
2016
Non-
performing
KShs'000
2016
Sub-standard
KShs'000
2016
Doubtful
KShs'000
2016
Loss
KShs'000
2016
Total
KShs'000
2016
Securities
and
expected
recoveries
on
specifically
impaired
loans
KShs'000
2016
Net after
securities
and
expected
recoveries
on
specifically
impaired
loans
KShs'000
2016
Balance sheet
impairments
for non-
performing
specifically
impaired
loans
KShs'000
2016
Gross
specific
impairment
coverage
%
N=A+B+C+L A B C D E F G H=E+F+G I J=H-I K L=H+D M
Personal and Business Banking 54 412 989 557 425 39 123 400 6 804 408 5 289 665 - 2 152 939 577 497 465 081 3 195 516 1 819 197 1 376 319 1 376 320 43% 3 195 516 6% 394 450
- Mortgage lending 18 109 188 91 239 13 191 151 2 727 613 1 539 175 650 992 - 256 651 248 528 532 122 716 122 716 19% 651 248 4% 159 772
- Instalment sales and finance
leases 12 338 712 181 505 8 547 258 391 217 2 414 834 445 331 539 097 974 985 402 452 178 533 224 533 224 54% 985 402 8% 115 737
- Card debtors 433 312 10 969 374 556 - 43 337 - - 15 419 15 419 7 907 7 512 7 512 49% 15 419 4% -
- Other loans and advances 23 531 780 273 712 17 010 434 3 685 578 1 292 319 1 056 616 38 400 448 432 1 543 448 830 580 712 868 712 868 46% 1 543 448 7% 118 941
Corporate and Investment
Banking 64 307 402 921 752 54 344 347 - 7 294 814 57 866 2 602 921 7 454 - 2 610 375 2 707 971 (97 596) 277 172 11% 2 668 241 4% 783 115
- Corporate lending 64 307 402 921 752 54 344 347 - 7 294 814 57 866 2 602 921 7 454 - 2 610 375 2 707 971 (97 596) 277 172 11% 2 668 241 4% 783 115
Gross loans and advances to
customers 118 720 391 1 479 177 93 467 747 6 804 408 12 584 479 57 866 4 755 860 584 951 465 081 5 805 891 4 527 168 1 278 723 1 653 492 28% 5 863 757 5% 1 177 565
Percentage of total book (%) 100.00% 1.25% 78.73% 5.73% 10.60% 0.05% 4.01% 0.49% 0.39% 4.89% 3.81% 1.08% 1.39% 4.94% 0.99%
Less:
Balance sheet impairment for
performing loans and advances (1 479 177)
Balance sheet impairment for non-
performing loans and advances (1 653 491)
Net loans and advances to
customers 115 587 723
Specifically impaired loans
Total non-
performing
loans
KShs'000
2016
Non-
performing
loans
%
NPL NET OF IIS
Year ended 31 December 2016
Total loans and
advances to
customers
KShs'000
2016
Balance sheet
impairments for
performing
loans
KShs'000
2016
Performing loans Non-performing loans
Interest in
Suspense
KShs'000
2016
Neither past due nor
specifically impairedNot specifically impaired

Stanbic Holdings Plc Financial statements For the year ended 31 December 2017
67
Notes (continued)
5. Financial risk management (continued)
b) Credit risk management (continued) (viii) Credit quality (continued) Loans and advances less than 90 days past due are not considered impaired unless other information is available to indicate the contrary. The table below shows the ageing of financial assets that are past due at the reporting date but not impaired, per class.
Performing (Early arrears) Non - performing
1 to 29 30 to 59 60 to 89 90 to 180 More than
days days days days 180 days Total
31 December 2017
KShs'000 KShs'000 KShs'000 KShs'000 KShs'000 KShs'000
Personal and Business Banking 4,733,200 1,482,944 616,024 - - 6,832,168
Mortgage lending 1,745,427 705,774 262,820 - - 2,714,021 Instalment sales and finance leases 1,756,159 508,797 143,616 - - 2,408,572 Other loans and advances 1,231,614 268,373 209,587 - - 1,709,575 Corporate and Investment Banking 3,328,461 539,013 485,844 - - 4,353,318
Corporate lending 3,328,461 539,013 485,844 - - 4,353,318
Total recognised financial instruments 8,061,661 2,021,957 1,101,868 - - 11,185,486
31 December 2016
Personal and Business Banking 3,435,980 1,342,009 511,677 - - 5,289,666
Mortgage lending 975,673 372,007 191,496 - - 1,539,176 Instalment sales and finance leases 1,488,613 737,579 188,642 - - 2,414,834 Other loans and advances 971,694 232,423 131,539 - 1,335,656 - Corporate and Investment Banking 5,882,040 5 1,412,768 - 57,866 7,352,679
Corporate lending 5,882,040 5 1,412,768 - 57,866 7,352,679
Total recognised financial instruments 9,318,020 1,342,014 1,924,445 - 57,866 12,642,345
Stanbic Holdings Plc Financial statements For the year ended 31 December 2017
68
Notes (continued)
5. Financial risk management (continued)
c) Market risk
Market risk is the risk of a change in market value, earnings (actual or effective) or future cash-flows of a portfolio of financial instruments (including commodities), caused by moves in market variables such as equity, bond and commodity prices, currency exchange rates and interest rates, credit spreads, recovery rates, correlations and implied volatilities in all of these measures.
Governance committees
The Group’s policy is that all trading activities are undertaken within the Group’s trading operations. The Board
grants general authority to take on market risk exposure to the Group’s Assets and Liabilities Committee
(ALCO).
Market risk management process is required to measure, monitor and control market risk exposures. The
Group manages market risk through following four principles.
(i) Identification of market risks in the trading and banking books
This process entails checking that all market risks are identified. It includes an analysis of new business
plans, new products, new pricing models, new risk models and regular reviews by Market Risk staff of
financial and management accounts balance sheets, income statements, and portfolio structure
hierarchies, accounting classification and accounting elections, jointly with financial control, Risk Self
Assessments jointly with operational risk, price testing reports and profit and loss decomposition reports.
(ii) Measurement of market risk
Measurement of market risks deals specifically and separately with normal market conditions and stress
market conditions. Measurement of trading exposures under stress market conditions is effected by
subjecting the portfolios to stress testing, e.g. historical scenarios, hypothetical scenarios on individual
asset classes and across different asset classes. In order to highlight ‘points of weakness’ and identify
particular sources of trading book exposure vulnerability, these stress tests capture the effects of
abnormal movements in market variables (yield curves including basis curves, volatility surfaces, spot
and/or rate moves, credit spread curves, recovery rate sensitivities etc.).
(iii) Management of market risk
The Group manages market risk through a specification of risk appetite in form of market risk limits. It
uses a suite of risk measurement techniques, including Value at Risk (VaR), Stress Value at Risk (SVaR),
stress testing, stop loss triggers, back-testing and specific business unit and product controls.
(iv) Reporting of market risk
Market Risk has reporting procedures that highlight for attention within Market Risk or by management all forms of exposures i.e. limit breaches or other reports that will periodically be required to submit to different stakeholders e.g. Local ALCO, Local Board, Internal Capital Adequacy Assessment Process (ICAAP) stakeholders, Shareholders (Annual financial statements); Rating agencies; Central Bank of Kenya and other regulators.

Stanbic Holdings Plc Financial statements For the year ended 31 December 2017
69
Notes (continued)
5. Financial risk management (continued)
c) Market risk (continued)
Market risk exposure on banking operations
Banking-related market risk exposure principally involves the management of the potential adverse effect of
interest rate movements on net interest income and the economic value of equity that arise from structural
interest rate risk caused by the differing repricing characteristics of banking assets and liabilities. They
include endowment risk, repricing risk, basis risk, optionality risk and yield curve risk. The Group’s approach
to managing Interest Rate Risk in Banking Book (IRRBB) is governed by applicable regulations and is
influenced by the competitive environment in which the Bank operates. Treasury and Capital Management
team monitors banking book interest rate risk together with the country ALCO.
The market risk function is independent of trading operations and it is accountable to ALCO. It is responsible
for identifying, measuring, managing, controlling and reporting market risk as outlined in the market risk
governance standard, with support from the central market risk function. The market risk function also has
the ability to set individual trader mandates. Exposures and excesses are monitored and reported daily.
Where breaches in limits and triggers occur, actions are taken by market risk management unit to move
exposures back in line with approved market risk appetite, with such breaches being reported to
management and ALCO.
Approved regulatory capital approaches
The Group applies the Standardised approach for calculating market risk capital. The standardised method
uses a “building block” approach, with the capital charge for each risk category calculated separately.
Market risk qualifying assets includes interest rate risk assets in the trading book and foreign currency risk
assets
Trading book market risk
Trading book market risk is represented by financial instruments held on the trading book, arising out of
normal global markets’ trading activity.
Approach to managing market risk in the trading book
The Group’s policy is that all trading activities are undertaken within the Group’s trading operations. The market risk functions are independent of trading operations and accountable to ALCO. All VaR and stressed Value at Risk (VaR) (SVaR) limits require prior approval from ALCO. The market risk functions have the authority to set limits at a lower level.
Market risk teams are responsible for identifying, measuring, managing, monitoring and reporting market risk as outlined in the market risk governance standard.
Exposures and excesses are monitored and reported daily. Where breaches in limits and triggers occur, actions are taken by market risk functions to move exposures back in line with approved market risk appetite, with such breaches being reported to management and ALCO.

Stanbic Holdings Plc Financial statements For the year ended 31 December 2017
70
Notes (continued)
5. Financial risk management (continued)
c) Market risk (continued)
(i) VaR and SVaR
The Group uses the historical VaR and SVaR approach to quantify market risk under normal conditions and under
stressed conditions.
For risk management purposes VaR is based on 250 days of unweighted recent historical data, a holding period
of one day and a confidence level of 95%. The historical VaR results are calculated in four steps:
• Calculate 250 daily market price movements based on 250 days’ historical data.
• Calculate hypothetical daily profit or loss for each day using these daily market price movements.
• Aggregate all hypothetical profits or losses for day one across all positions, giving daily hypothetical profit
or loss, and then repeat for all other days.
• VaR is the 95th percentile selected from the 250 days of daily hypothetical total profit or loss.
Daily losses exceeding the VaR are likely to occur, on average, 13 times in every 250 days.
SVaR uses a similar methodology to VaR, but is based on a period of financial stress and assumes a 10-day
holding period and a 99% confidence interval.
Where the Group has received internal model approval, the market risk regulatory capital requirement is based on
VaR and SVaR, both of which use a confidence level of 99% and a 10-day holding period.
Limitations of historical VaR are acknowledged globally and include:
• The use of historical data as a proxy for estimating future events may not encompass all potential events,
particularly those which are extreme in nature.
• The use of a one-day holding period assumes that all positions can be liquidated or the risk offset in one
day. This may not fully reflect the market risk arising at times of severe illiquidity, when a one-day holding
period may be insufficient to liquidate or hedge all positions fully.
• The use of a 95% confidence level, by definition, does not take into account losses that might occur
beyond this level of confidence.
• VaR is calculated on the basis of exposures outstanding at the close of business and, therefore, does not
necessarily reflect intraday exposures.
• VaR is unlikely to reflect loss potential on exposures that only arise under significant market moves.
(ii) Stop-loss triggers
Stop-loss triggers are used to protect the profitability of the trading desks, and are monitored by market risk on a
daily basis. The triggers constrain cumulative or daily trading losses through acting as a prompt to a review or
close-out positions.
(iii) Stress tests
Stress testing provides an indication of the potential losses that could occur under extreme but plausible market conditions, including where longer holding periods may be required to exit positions. Stress tests comprise individual market risk factor testing, combinations of market factors per trading desk and combinations of trading desks using a range of historical and hypothetical simulations. Daily losses experienced during the year ended 31 December 2017 did not exceed the maximum tolerable losses as represented by the Bank’s stress scenario limits.

Stanbic Holdings Plc Financial statements For the year ended 31 December 2017
71
Notes (continued)
5. Financial risk management (continued)
c) Market risk (continued)
(iv) Back-testing
The bank back-tests its VaR models to verify the predictive ability of the VaR calculations and ensure the
appropriateness of the models within the inherent limitations of VaR. Back-testing compares the daily hypothetical
profit and losses under the one-day buy and hold assumption to the prior day’s calculated VaR In addition, VaR is
tested by changing various model parameters, such as confidence intervals and observation periods to test the
effectiveness of hedges and risk-mitigation instruments.
(v) Specific business unit and product controls
Other market risk limits and controls specific to individual business units include permissible instruments, concentration of exposures, gap limits, maximum tenor, stop-loss triggers, price validation and balance sheet substantiation.
(vi) Foreign exchange risk
Definition
The Group’s primary exposures to foreign currency risk arise as a result of the translation effect on the bank’s
net assets in foreign operations, intragroup foreign-denominated debt and foreign denominated cash exposures
and accruals.
Approach to managing foreign currency risk
The Group takes on exposure to the effects of fluctuations in the prevailing foreign currency exchange rates on its financial position and cash flows. The Asset and Liability Committee sets limits on the level of exposure by currency and in total for both overnight and intra-day positions, which are monitored daily risk according to existing legislation, and accounting parameters. It takes into account naturally offsetting risk positions and manages the Group’s residual risk by means of forward exchange contracts, currency swaps and option contracts. Hedging is undertaken in such a way that it does not constrain normal operational activities. In particular, the need for capital to fluctuate with risk-weighted assets is taken into account. The repositioning of the currency profile is a controlled process based on underlying economic views of the relative strength of currencies. The Group does not ordinarily hold open exposures of any significance with respect to the banking book. Gains or losses on derivatives are reported in profit or loss.

Stanbic Holdings Plc Financial statements For the year ended 31 December 2017
72
Notes (continued)
5. Financial risk management (continued)
c) Market risk (continued)
(vi) Foreign exchange risk (continued)
The table below summarises the Group’s exposure to foreign exchange risk at 31 December 2016.
Included in the table are the Group’s financial instruments at carrying amounts, categorised by currency (all
amounts expressed in millions of Kenya Shillings):
At 31 December 2017 USD GBP EUR Others Total Assets
Cash and bank balances 14,703 427 661 2,780 18,571 Loans and advances 59,601 391 5,649 1 65,641 Financial investments 2,141 - - 1 2,142 Balances due from Group Companies 2,581 - - 210 2,791
Other foreign currency assets 2,851 22 397 974 4,244
Total financial assets 81,877 840 6,707 3,966 93,389
Liabilities
Amounts due to banking institutions abroad 29,782 8 186 616 30,592
Deposits 55,221 1,851 6,327 1,684 65,083
Loans and advances - - - - -
Balances due to Group Companies 9,911 - 1,637 - 11,548
Other foreign currency liabilities 5,182 8 137 1,260 6,587
Total financial liabilities 100,096 1,867 8,287 3,560 113,810
Net on balance sheet financial position (18,219) (1,027) (1,580) 406 (20,420)
Off balance sheet net notional position 20,414 1,036 2,098 (720) 22,828
Overall net position 2,195 9 518 (314) 2,408
At 31 December 2016 USD GBP EUR Others Total Assets
Cash and bank balances 11,441 1,233 535 560 13,769 Loans and advances 59,669 256 4,918 243 65,086 Financial investments - - - 6 6
Other assets 3,178 22 422 2,574 6,196
Total financial assets 74,288 1,511 5,875 3,383 85,057
Liabilities
Deposits from banks 33,148 543 57 323 34,071
Deposits from customers 45,292 2,636 3,318 822 52,068
Other liabilities and accrued expenses 8,618 4 546 2,597 11,765
Total financial liabilities 87,058 3,183 3,921 3,742 97,904
Net on balance sheet financial position (12,770) (1,672) (1,954) (359) (12,847)
Off balance sheet net notional position 15,086 1,683 1,904 125 14,990
Overall net position 2,136 11 50 (234) 2,143
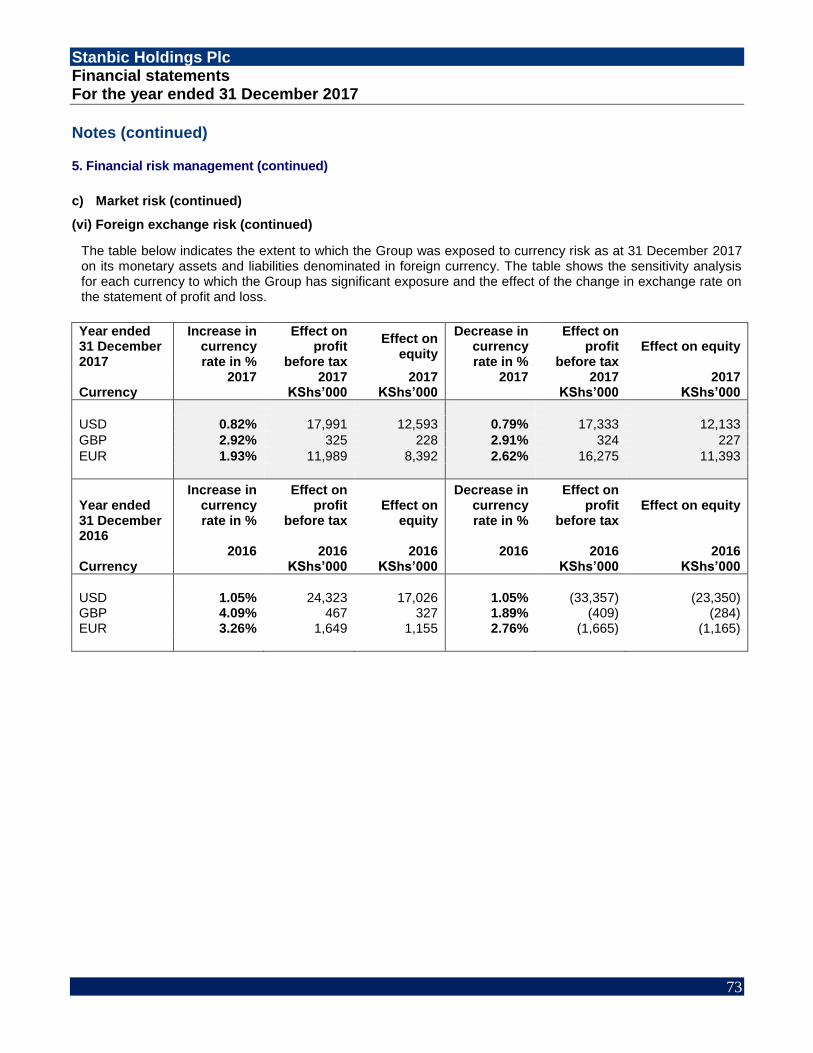
Stanbic Holdings Plc Financial statements For the year ended 31 December 2017
73
Notes (continued)
5. Financial risk management (continued)
c) Market risk (continued)
(vi) Foreign exchange risk (continued)
The table below indicates the extent to which the Group was exposed to currency risk as at 31 December 2017 on its monetary assets and liabilities denominated in foreign currency. The table shows the sensitivity analysis for each currency to which the Group has significant exposure and the effect of the change in exchange rate on the statement of profit and loss.
Year ended 31 December 2017
Increase in currency rate in %
Effect on profit
before tax
Effect on equity
Decrease in currency rate in %
Effect on profit
before tax Effect on equity
2017 2017 2017 2017 2017 2017 Currency KShs’000 KShs’000 KShs’000 KShs’000
USD 0.82% 17,991 12,593 0.79% 17,333 12,133
GBP 2.92% 325 228 2.91% 324 227
EUR 1.93% 11,989 8,392 2.62% 16,275 11,393
Year ended 31 December 2016
Increase in currency rate in %
Effect on profit
before tax
Effect on equity
Decrease in currency rate in %
Effect on profit
before tax
Effect on equity
2016 2016 2016 2016 2016 2016 Currency KShs’000 KShs’000 KShs’000 KShs’000
USD 1.05% 24,323 17,026 1.05% (33,357) (23,350) GBP 4.09% 467 327 1.89% (409) (284) EUR 3.26% 1,649 1,155 2.76% (1,665) (1,165)

Stanbic Holdings Plc Financial statements For the year ended 31 December 2017
74
Notes (continued)
5. Financial risk management (continued)
(vii) Interest rate risk
Interest rate risk in the Banking book (IRBB)
Definition
These are risks that have an impact on net interest income that arise from structural interest rate risk caused by
the differing repricing characteristics of banking assets and liabilities.
IRRBB is further divided into the following sub risk types:
• Repricing risk: timing differences in the maturity (fixed rate) and repricing (floating rate) of assets and liabilities.
• Yield curve risk: shifts in the yield curves that have adverse effects on the Bank’s income or underlying economic value.
• Basis risk: hedge price not moving in line with the price of the hedged position. Examples include bonds/swap basis, futures/ underlying basis.
• Optionality risk: options embedded in bank asset and liability portfolios, providing the holder with the right, but not the obligation, to buy, sell, or in some manner alter the cash flow of an instrument or financial contract.
• Endowment risk: exposure arising from the net differential between interest rate insensitive assets such as non-earning assets, interest rate insensitive liabilities such as non-paying liabilities, and equity.
Approach to managing IRRBB Banking book-related market risk exposure principally involves managing the potential adverse effect of interest rate movements on banking book earnings (net interest income and banking book mark-to-market profit or loss) and the economic value of equity.
The Group’s approach to managing IRRBB is governed by applicable regulations and is influenced by the competitive environment in which the bank operates. The Group’s Treasury and Capital Management team monitors banking book interest rate risk operating under the oversight of ALCO.
Measurement The analytical techniques used to quantify IRRBB include both earnings – and valuation-based measures. The analysis takes account of embedded optionality such as loan prepayments and accounts where the account behaviour differs from the contractual position. The results obtained from forward-looking dynamic scenario analyses, as well as Monte Carlo simulations, assist in developing optimal hedging strategies on a risk-adjusted return basis.
Desired changes to a particular interest rate risk profile are achieved through the restructuring of on-balance sheet repricing or maturity profiles, or through derivative overlays. Limits Interest rate risk limits are set in relation to changes in forecast banking book earnings and the economic value of equity. Economic value of equity sensitivity is calculated as the net present value of aggregate asset cash flows less the net present value of aggregate liability cash flows.
All assets, liabilities and derivative instruments are allocated to gap intervals based on either their repricing or maturity characteristics. Assets and liabilities for which no identifiable contractual repricing or maturity dates exist are allocated to gap intervals based on behavioural profiling.

Stanbic Holdings Plc Financial statements For the year ended 31 December 2017
75
Notes (continued)
5. Financial risk management (continued)
d) Interest rate risk
Hedging of endowment risk
IRRBB is predominantly the consequence of endowment exposures, being the net effect of non-rate sensitive
assets less non-rate sensitive liabilities and equity.
The endowment risk is hedged using liquid instruments as and when it is considered opportune. Where
permissible, hedge accounting is adopted using the derivatives. The interest rate view is formulated through
ALCO processes, following meetings of the monetary policy committees, or notable market developments.
Non-endowment IRRBB (repricing, yield curve, basis and optionality) is managed within the treasury and the
global markets portfolios.
The table below indicates the KShs equivalent sensitivity of the Group’s banking book earnings (net interest
income and banking book mark-to-market profit or loss) and other comprehensive income (OCI) given a
parallel yield curve shock. A floor of 0% is applied to all interest rates under the decreasing interest rate
Increase in basis points
Sensitivity of net interest
income
Sensitivity of other
comprehensive income
Decrease in basis points
Sensitivity of net interest
income
Sensitivity of other
comprehensive income
2017 2017 2017 2017 2017 2017
KShs 350 948,553 (1,153,661) 300 (1,345,202) 988,852
Others*(USD) 100 3,735 - 100 (2,751) -
Increase in basis points
Sensitivity of net interest
income
Sensitivity of other
comprehensive income
Decrease in basis points
Sensitivity of net interest
income
Sensitivity of other
comprehensive income
2016 2016 2016 2016 2016 2016
KShs 350 118,064 (617,187) 300 (209,179) 529,017
Others*(USD) 100 - - 100 (3,294) -
* This is any other currencies held by the Group not denominated in KShs

Stanbic Holdings Plc Financial statements For the year ended 31 December 2017
76
Notes (continued)
5. Financial risk management (continued)
e) Liquidity risk
Liquidity risk arises when the Group, despite being solvent, is unable to maintain or generate sufficient cash
resources to meet its payment obligations as they fall due, or can only do so on materially disadvantageous
terms. This inability to maintain or generate sufficient cash resources may arise where counterparties who
provide the Group with short-term funding withdraw or do not rollover that funding, or normally liquid assets
become illiquid as a result of a generalised disruption in asset markets.
Liquidity risk – Company
A summary of liquidity risk showing matching of financial assets and liabilities at Stanbic Holdings Plc
(Company only) is shown in the following table.
31 December 2017
Up to 1 – 6 6 – 12
1 month months months Total
KShs'000 KShs'000 KShs'000 KShs'000
Cash and bank balances 111,803 - - 111,803
Total assets
111,803 - - 111,803
Other liabilities and accrued expenses (105,801) - - (105,801)
Total liabilities
(105,801) - - (105,801)
Net liquidity gap
6,002 - - 6,002
Liquidity risk management – Group
The nature of banking and trading activities results in a continuous exposure to liquidity risk. The Group
manages liquidity in accordance with applicable regulations and within Group’s risk appetite. The Group’s
liquidity risk management governance framework supports the measurement and management of liquidity at
various levels to ensure that all payment obligations can be met by the Group under both normal and stressed
conditions. Liquidity risk management ensures that the Group has the appropriate amount, diversification and
tenor of funding and liquidity to support its asset base at all times.
The Group’s liquidity risk management framework differentiates between:
• Tactical (shorter-term) risk management: managing intra-day liquidity positions and daily cash flow requirements, and monitoring adherence to prudential and internal requirements and setting deposit rates as informed by ALCO.
• Structural (long-term) liquidity risk management: ensuring a structurally sound statement of financial position, a diversified funding base and prudent term funding requirements.

Stanbic Holdings Plc Financial statements For the year ended 31 December 2017
77
Notes (continued)
5. Financial risk management (continued)
e) Liquidity risk (continued)
Liquidity risk management – Group (continued)
• Contingent liquidity risk management: monitoring and managing early warning liquidity indicators while
establishing and maintaining contingency funding plans, undertaking regular liquidity stress testing and scenario analysis, and setting liquidity buffers in accordance with anticipated stress events
Governance committees The primary governance committee overseeing this risk is the Group Asset Liability Committee (ALCO), which is chaired by the Chief Executive. There is independent risk oversight of all liquidity limits and guidelines by Market Risk, Finance and Central Asset Liability Management units. ALCO reports to the Board Risk Committee. Approach to managing liquidity risk There is a sound and robust liquidity management process to measure, monitor and manage liquidity exposures. The following elements are incorporated as part of a cohesive liquidity management process: a) Maintaining a structurally sound statement of financial position;
With actual cash flows typically varying significantly from the contractual position, behavioural profiling is applied to assets, liabilities and off-balance sheet commitments with an indeterminable maturity or drawdown period, as well as to certain liquid assets. Behavioural profiling assigns probable maturities based on historical customer behaviour. This is used to identify significant additional sources of structural liquidity in the form of liquid assets and core deposits, such as current and savings accounts, which exhibit stable behaviour despite being repayable on demand or at short notice. Structural liquidity mismatch analysis are performed regularly to anticipate the mismatch between payment profiles of balance sheet items, in order to highlight potential risks within the Group’s defined liquidity risk thresholds.
b) Foreign currency liquidity management; A specific number of indicators are observed in order to monitor changes in market liquidity as well as the impacts on liquidity as a result of movements in exchange rates. Foreign currency loans and advances are restricted to the availability of foreign currency deposits.
c) Ensuring the availability of sufficient contingency liquidity;
Funding markets are evaluated on an on-going basis to ensure appropriate Group funding strategies are
executed depending on the market, competitive and regulatory environment. The Group employs a
diversified funding strategy.
d) Preserving a diversified funding base;
Concentration risk limits are used within the Group to ensure that funding diversification is maintained
across products, sectors, and counterparties. Primary funding sources are in the form of deposits across
a spectrum of retail and wholesale clients, as well as long-term capital.
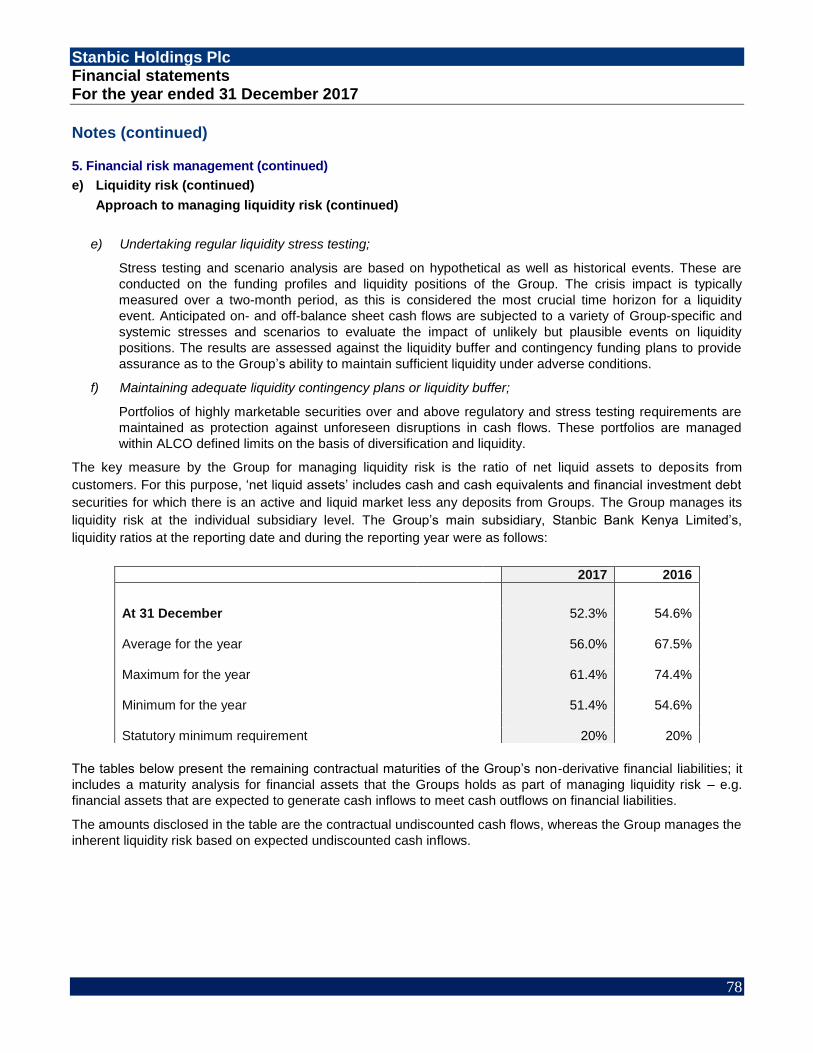
Stanbic Holdings Plc Financial statements For the year ended 31 December 2017
78
Notes (continued)
5. Financial risk management (continued)
e) Liquidity risk (continued)
Approach to managing liquidity risk (continued)
e) Undertaking regular liquidity stress testing;
Stress testing and scenario analysis are based on hypothetical as well as historical events. These are
conducted on the funding profiles and liquidity positions of the Group. The crisis impact is typically
measured over a two-month period, as this is considered the most crucial time horizon for a liquidity
event. Anticipated on- and off-balance sheet cash flows are subjected to a variety of Group-specific and
systemic stresses and scenarios to evaluate the impact of unlikely but plausible events on liquidity
positions. The results are assessed against the liquidity buffer and contingency funding plans to provide
assurance as to the Group’s ability to maintain sufficient liquidity under adverse conditions.
f) Maintaining adequate liquidity contingency plans or liquidity buffer;
Portfolios of highly marketable securities over and above regulatory and stress testing requirements are
maintained as protection against unforeseen disruptions in cash flows. These portfolios are managed
within ALCO defined limits on the basis of diversification and liquidity.
The key measure by the Group for managing liquidity risk is the ratio of net liquid assets to deposits from
customers. For this purpose, ‘net liquid assets’ includes cash and cash equivalents and financial investment debt
securities for which there is an active and liquid market less any deposits from Groups. The Group manages its
liquidity risk at the individual subsidiary level. The Group’s main subsidiary, Stanbic Bank Kenya Limited’s,
liquidity ratios at the reporting date and during the reporting year were as follows:
The tables below present the remaining contractual maturities of the Group’s non-derivative financial liabilities; it
includes a maturity analysis for financial assets that the Groups holds as part of managing liquidity risk – e.g.
financial assets that are expected to generate cash inflows to meet cash outflows on financial liabilities.
The amounts disclosed in the table are the contractual undiscounted cash flows, whereas the Group manages the
inherent liquidity risk based on expected undiscounted cash inflows.
2017 2016
At 31 December
52.3% 54.6%
Average for the year
56.0% 67.5%
Maximum for the year
61.4% 74.4%
Minimum for the year
51.4% 54.6%
Statutory minimum requirement 20% 20%
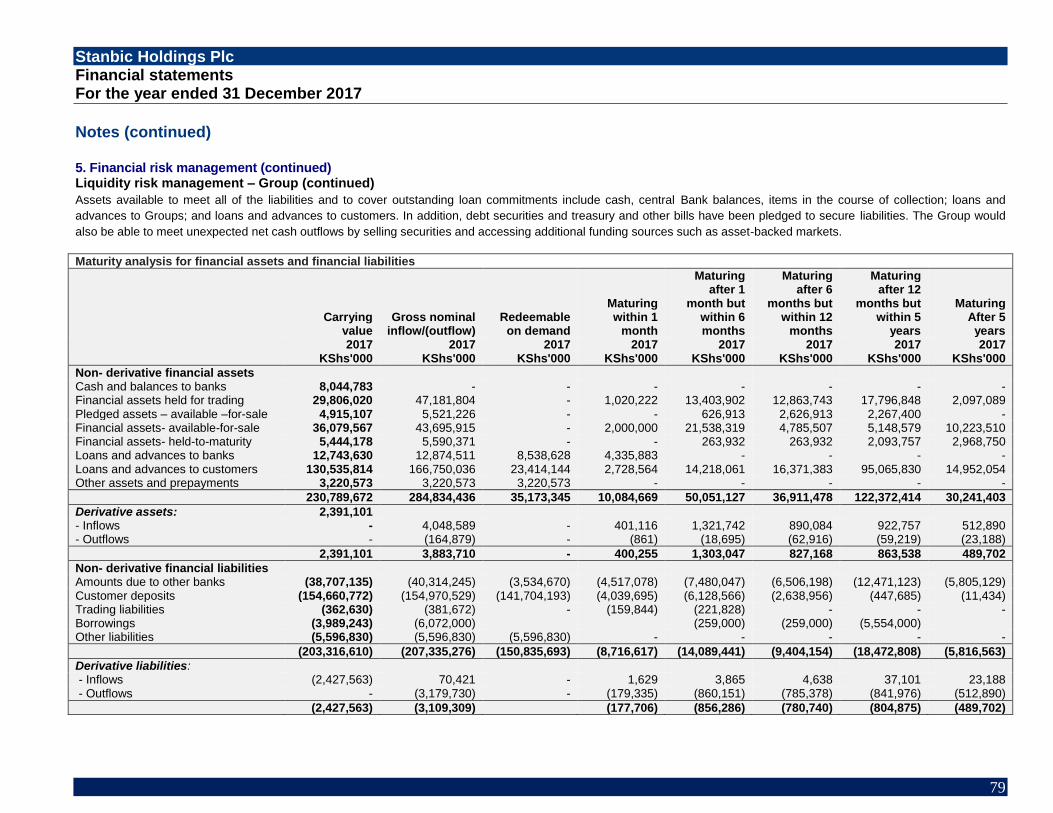
Stanbic Holdings Plc Financial statements For the year ended 31 December 2017
79
Notes (continued) 5. Financial risk management (continued) Liquidity risk management – Group (continued)
Assets available to meet all of the liabilities and to cover outstanding loan commitments include cash, central Bank balances, items in the course of collection; loans and
advances to Groups; and loans and advances to customers. In addition, debt securities and treasury and other bills have been pledged to secure liabilities. The Group would
also be able to meet unexpected net cash outflows by selling securities and accessing additional funding sources such as asset-backed markets.
Maturity analysis for financial assets and financial liabilities
Carrying
value Gross nominal
inflow/(outflow) Redeemable
on demand
Maturing within 1
month
Maturing after 1
month but within 6 months
Maturing after 6
months but within 12
months
Maturing after 12
months but within 5
years
Maturing After 5 years
2017 2017 2017 2017 2017 2017 2017 2017 KShs'000 KShs'000 KShs'000 KShs'000 KShs'000 KShs'000 KShs'000 KShs'000
Non- derivative financial assets
Cash and balances to banks 8,044,783 - - - - - - - Financial assets held for trading 29,806,020 47,181,804 - 1,020,222 13,403,902 12,863,743 17,796,848 2,097,089 Pledged assets – available –for-sale 4,915,107 5,521,226 - - 626,913 2,626,913 2,267,400 - Financial assets- available-for-sale 36,079,567 43,695,915 - 2,000,000 21,538,319 4,785,507 5,148,579 10,223,510 Financial assets- held-to-maturity 5,444,178 5,590,371 - - 263,932 263,932 2,093,757 2,968,750 Loans and advances to banks 12,743,630 12,874,511 8,538,628 4,335,883 - - - - Loans and advances to customers 130,535,814 166,750,036 23,414,144 2,728,564 14,218,061 16,371,383 95,065,830 14,952,054 Other assets and prepayments 3,220,573 3,220,573 3,220,573 - - - - -
230,789,672 284,834,436 35,173,345 10,084,669 50,051,127 36,911,478 122,372,414 30,241,403
Derivative assets: 2,391,101 - Inflows - 4,048,589 - 401,116 1,321,742 890,084 922,757 512,890 - Outflows - (164,879) - (861) (18,695) (62,916) (59,219) (23,188)
2,391,101 3,883,710 - 400,255 1,303,047 827,168 863,538 489,702
Non- derivative financial liabilities Amounts due to other banks (38,707,135) (40,314,245) (3,534,670) (4,517,078) (7,480,047) (6,506,198) (12,471,123) (5,805,129) Customer deposits (154,660,772) (154,970,529) (141,704,193) (4,039,695) (6,128,566) (2,638,956) (447,685) (11,434) Trading liabilities (362,630) (381,672) - (159,844) (221,828) - - - Borrowings (3,989,243) (6,072,000) (259,000) (259,000) (5,554,000) Other liabilities (5,596,830) (5,596,830) (5,596,830) - - - - -
(203,316,610) (207,335,276) (150,835,693) (8,716,617) (14,089,441) (9,404,154) (18,472,808) (5,816,563)
Derivative liabilities: - Inflows (2,427,563) 70,421 - 1,629 3,865 4,638 37,101 23,188 - Outflows - (3,179,730) - (179,335) (860,151) (785,378) (841,976) (512,890)
(2,427,563) (3,109,309) (177,706) (856,286) (780,740) (804,875) (489,702)
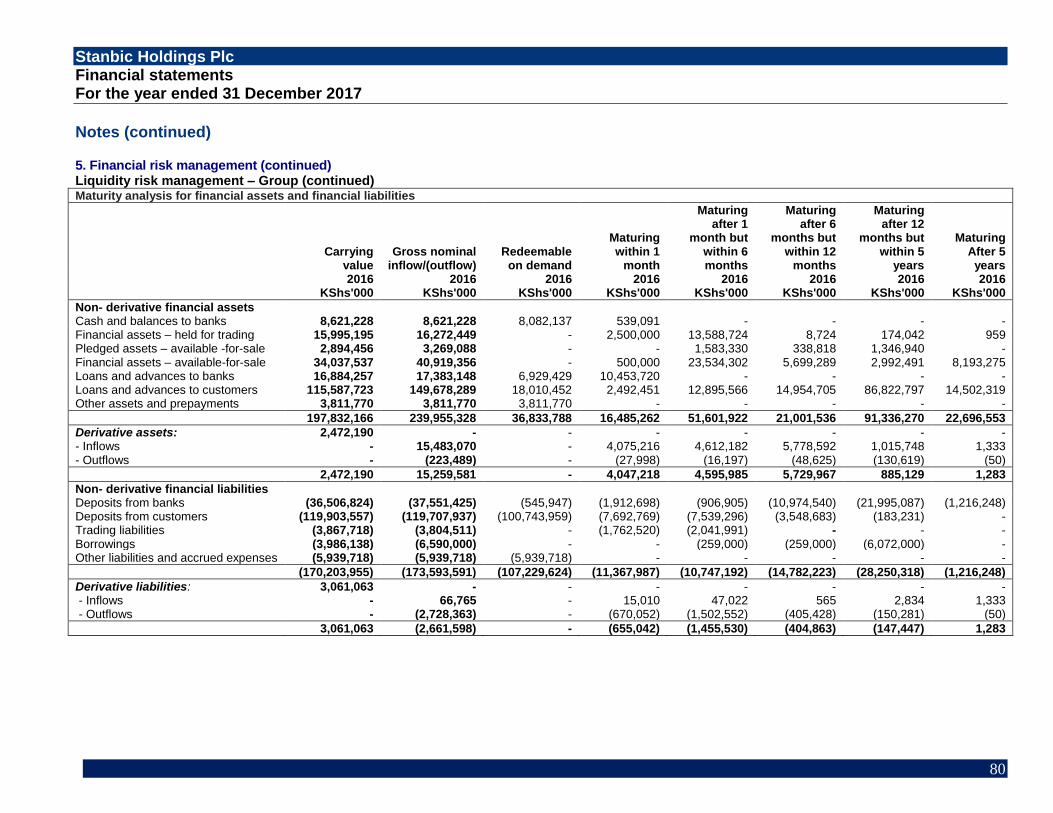
Stanbic Holdings Plc Financial statements For the year ended 31 December 2017
80
Notes (continued)
5. Financial risk management (continued) Liquidity risk management – Group (continued) Maturity analysis for financial assets and financial liabilities
Carrying
value Gross nominal
inflow/(outflow) Redeemable
on demand
Maturing within 1
month
Maturing after 1
month but within 6 months
Maturing after 6
months but within 12
months
Maturing after 12
months but within 5
years
Maturing After 5 years
2016 2016 2016 2016 2016 2016 2016 2016 KShs'000 KShs'000 KShs'000 KShs'000 KShs'000 KShs'000 KShs'000 KShs'000
Non- derivative financial assets
Cash and balances to banks 8,621,228 8,621,228 8,082,137 539,091 - - - - Financial assets – held for trading 15,995,195 16,272,449 - 2,500,000 13,588,724 8,724 174,042 959 Pledged assets – available -for-sale 2,894,456 3,269,088 - - 1,583,330 338,818 1,346,940 - Financial assets – available-for-sale 34,037,537 40,919,356 - 500,000 23,534,302 5,699,289 2,992,491 8,193,275 Loans and advances to banks 16,884,257 17,383,148 6,929,429 10,453,720 - - - - Loans and advances to customers 115,587,723 149,678,289 18,010,452 2,492,451 12,895,566 14,954,705 86,822,797 14,502,319 Other assets and prepayments 3,811,770 3,811,770 3,811,770 - - - - -
197,832,166 239,955,328 36,833,788 16,485,262 51,601,922 21,001,536 91,336,270 22,696,553
Derivative assets: 2,472,190 - - - - - - - - Inflows - 15,483,070 - 4,075,216 4,612,182 5,778,592 1,015,748 1,333 - Outflows - (223,489) - (27,998) (16,197) (48,625) (130,619) (50)
2,472,190 15,259,581 - 4,047,218 4,595,985 5,729,967 885,129 1,283
Non- derivative financial liabilities Deposits from banks (36,506,824) (37,551,425) (545,947) (1,912,698) (906,905) (10,974,540) (21,995,087) (1,216,248) Deposits from customers (119,903,557) (119,707,937) (100,743,959) (7,692,769) (7,539,296) (3,548,683) (183,231) - Trading liabilities (3,867,718) (3,804,511) - (1,762,520) (2,041,991) - - - Borrowings (3,986,138) (6,590,000) - - (259,000) (259,000) (6,072,000) - Other liabilities and accrued expenses (5,939,718) (5,939,718) (5,939,718) - - - - -
(170,203,955) (173,593,591) (107,229,624) (11,367,987) (10,747,192) (14,782,223) (28,250,318) (1,216,248)
Derivative liabilities: 3,061,063 - - - - - - - - Inflows - 66,765 - 15,010 47,022 565 2,834 1,333 - Outflows - (2,728,363) - (670,052) (1,502,552) (405,428) (150,281) (50)
3,061,063 (2,661,598) - (655,042) (1,455,530) (404,863) (147,447) 1,283
Stanbic Holdings Plc Financial statements For the year ended 31 December 2017
81
Notes (continued)
5. Financial risk management (continued)
e) Liquidity risk (continued)
The amounts in the table above have been compiled as follows:
(f) Financial instruments subject to offsetting, enforceable master netting arrangements or similar
agreements
The following table sets out the impact of offset, as well as financial assets and financial liabilities that are
subject to enforceable master netting arrangement or similar agreement, irrespective of whether they have been
offset in accordance with IAS 32, as required by IFRS 7 (R) disclosure requirements. The gross amounts of
financial asset and financial liabilities and their net amounts disclosed in the table below have been measured in
the statement of financial position on the following bases:
• Derivative asset and liabilities – fair value
• Loans and advances – amortised cost and
• Customer deposits – amortised cost
Type of financial instrument Basis on which amounts are compiled
None-derivative financial liabilities
and financial assets
Undiscounted cash flows which include interest payments
Issued financial guarantee contracts,
and unrecognised loan commitments
Earliest possible contractual maturity. For issued financial guarantee
contracts, maximum amount of the guarantee is allocated to the earliest
period in which the guarantee could be called.
Derivative financial liabilities and
financial assets held for risk
management purpose
Contractual undiscounted cash flows. The amounts shown are the gross
nominal inflows and outflows for derivatives that have simultaneous
gross settlement (e.g. forward exchange contracts and currency swaps)
and the net amounts for derivatives that are net settled.
As part of the management of liquidity risk arising from financial liabilities, the Group holds liquid assets
comprises cash and cash equivalents and debt securities issued by sovereigns which can be readily sold to
meet liquidity requirements. In addition, the Group maintains lines of credit with other Groups and holds
unencumbered assets eligible for use as collateral with central banks.

Stanbic Holdings Plc Financial statements For the year ended 31 December 2017
82
Notes (continued)
5. Financial risk management (continued)
f) Financial instruments subject to offsetting, enforceable master netting arrangements or similar
agreements (continued)
Gross amount of
recognised financial
assets
Gross amounts of recognised
financial liabilities offset in statement
of financial position
Net amounts of financial assets
presented in the statement
of financial position
Financial instruments,
financial collateral and
cash collateral received Net amount
2017 2017 2017 2017 2017 KShs'000 KShs'000 KShs'000 KShs'000 KShs'000
Assets
Loans and advances to banks and customers
148,527,602
- 148,527,602 1,520,838 147,006,764
Derivative assets 2,391,101 - 2,391,101 - 2,391,101
150,918,703 - 150,918,703 1,520,838 149,397,865
Gross amount of
recognised financial liabilities
Gross amounts of recognised
financial assets offset in statement
of financial position
Net amounts of financial assets
presented in the statement
of financial position
Financial instruments,
financial collateral and
cash collateral pledged Net amount
2017 2017 2017 2017 2017 KShs'000 KShs'000 KShs'000 KShs'000 KShs'000
Liabilities
Deposits 193,367,907 - 193,367,907 1,520,838 191,847,069
Derivative liabilities 2,427,563 - 2,427,563 - 2,427,563
195,795,470 - 195,795,470 1,520,838 194,274,632
Gross amount of recognised
financial assets
Gross amounts of recognised
financial liabilities offset in statement
of financial position
Net amounts of financial
assets presented in
the statement of financial
position
Financial instruments,
financial collateral and
cash collateral received Net amount
2016 2016 2016 2016 2016 KShs'000 KShs'000 KShs'000 KShs'000 KShs'000
Assets
Loans and advances to banks and customers
132,576,604
-
132,576,604
2,583,216
129,993,388
Derivative assets 2,472,190 - 2,472,190 - 2,472,190
135,048,794 - 135,048,794 2,583,216 132,465,578
Gross amount of recognised
financial liabilities
Gross amounts of recognised
financial assets offset in statement
of financial position
Net amounts of financial
assets presented in
the statement of financial
position
Financial instruments,
financial collateral and
cash collateral pledged Net amount
2016 2016 2016 2016 2016 KShs'000 KShs'000 KShs'000 KShs'000 KShs'000
Liabilities
Deposits 119,328,219 - 119,328,219 - 119,328,219
Derivative liabilities 3,061,063 - 3,061,063 - 3,061,063
122,389,282 - 122,389,282 - 122,389,282

Stanbic Holdings Plc Financial statements For the year ended 31 December 2017
83
Notes (continued)
5. Financial risk management (continued)
f) Financial instruments subject to offsetting, enforceable master netting arrangements or similar
agreements (continued)
The ISDA* and similar master netting arrangements do not meet the criteria for offsetting in the statement of
financial position. This is because they create for the parties to the agreement a right of set-off of recognised
amounts that is enforceable only following an event of default, insolvency Bankruptcy of the Group or the
counterparties following other predetermined events. In addition, the Group and its counterparties do not
intent to settle on a net basis or to realise the assets and the liabilities simultaneously.
The Group receives collateral in the form of cash in respect of lending
The table below sets out the nature of agreement, and the types of rights relating to items which do not
qualify for offset but that are subject to a master netting arrangement or similar agreement.
IAS 32 Financial Instruments: Presentation (IAS 32) requires financial assets and financial liabilities to be offset and the net amount presented in the statement of financial position when, and only when, the Group has a current legally enforceable right to set off recognised amounts, as well as the intention to settle on a net basis or to realise the asset and settle the liability simultaneously.
* An ISDA master agreement is a standard agreement used in over-the-counter derivatives transactions. The ISDA Master Agreement, published by the International Swaps and
Derivatives Association (ISDA), is a document that outlines the terms applied to a derivatives transaction between two parties.
Financial instrument Nature of agreement Basis on which amounts are compiled
Derivative assets and liabilities ISDAs
The agreement allows for offset
in the event of default.
Trading assets and trading
liabilities
Global master repurchase
agreements
The agreement allows for offset
in the event of default.
Loans and advances to banks Banks Act
In the event of liquidation or
bankruptcy, offset shall be
enforceable subject to meeting
Banking Act requirements.
Deposits and current accounts Banks Act
In the event of liquidation or
bankruptcy, offset shall be
enforceable subject to meeting
Groups Act requirements.

Stanbic Holdings Plc Financial statements For the year ended 31 December 2017
84
Notes (continued)
6 Interest income
Group Company
2017 2016 2017 2016
KShs'000 KShs'000 KShs'000 KShs'000
Interest on loans, advances and short-term funds 12,061,634 12,097,303 - -
Interest on government securities available-for-sale 4,285,211 4,691,764 - -
Placements and other bank balances 261,389 337,975 4,901 22,451
16,608,234 17,127,042 4,901 22,451
Interest income excludes interest on impaired loans and advances which have been recognised as interest in suspense on the statement of financial position (see Note 23(e)).
7 Interest expense
Group Company
2017 2016 2017 2016
KShs'000 KShs'000 KShs'000 KShs'000
Current accounts 718,978 160,665 - -
Savings and term deposit accounts 2,984,876 3,538,638 - -
Deposits and placements from other banks 1,738,995 1,882,643 - -
Interest on borrowed funds 521,104 685,049 - -
5,963,953 6,266,995 - -
8 Fees and commission revenue
Account transaction fees 1,347,361 1,089,832 - -
Knowledge based fees and commission 1,177,103 760,128 - -
Electronic banking fees 372,899 289,805 - -
Foreign service fees 510,838 325,880 - -
Documentation and administration fees 304,349 299,101 - -
Brokerage commission 251,537 223,548 - -
Other 383,921 254,210 - -
4,348,008 3,242,504 - -
The knowledge based fees are fees earned on Investment banking and custodial services. The commission relates to commission earned on guarantees
Other fee and commission revenue includes insurance agency commission and debit card commission.

Stanbic Holdings Plc Financial statements For the year ended 31 December 2017
85
Notes (continued)
9 Fees and commission expense
Group Company 2017 2016 2017 2016
KShs'000 KShs'000 KShs'000 KShs'000
Card based commission 104,222 60,728 - -
Knowledge based fees and commission 69,010 111,358 - -
Other bank - related fees and commission 227,983 165,453 - -
401,215 337,539 - -
10 Trading revenue
Group Company
2017 2016 2017 2016
KShs'000 KShs'000 KShs'000 KShs'000
Foreign exchange 3,827,033 3,361,113 - -
Other Income-financial assets-held for trading - 351,249 - -
Fixed Income-financial assets-held for trading 576,477 1,010,891
-
4,403,510 4,723,253 - -
11 Other income
Dividend income 400 - 1,900,000 2,834,737
Interest recovered from receivables previously provided for
46,240 - - -
Other income 23,165 29,093 274 11,329
69,805 29,093 1,900,274 2,846,066
Other income relates to income not earned in the normal course of business.
12 Employee benefits expense
Salaries and wages 5,346,064 5,076,130 - -
Retirement benefit costs 389,131 364,454 - -
5,735,195 5,440,584 - -
Included in retirement benefit costs are;
Defined contribution scheme 385,986 360,708 - -
National Social Security Fund 3,145 3,746 - -
389,131 364,454 - -

Stanbic Holdings Plc Financial statements For the year ended 31 December 2017
86
Notes (continued) 12 Employee benefits expense (Continued)
Group Company
2017 2016 2017 2016 Average employee number for the year
Management 274 308 - -
Supervisory 492 461 - -
Clerical 261 282 - -
Other categories 44 58 - -
Total 1,071 1,109 - -
13 Breakdown of expenses by nature
Group Company
2017 2016 2017 2016
Note KShs’000 KShs’000 KShs’000 KShs’000
Profit before tax has been arrived at after charging-;
Employees benefit 12 5,735,195 5,440,584 - -
Audit fees 23,006 18,400 1,884 1,805
Directors’ fees 36,557 37,895 7,165 8,800
Depreciation of property and equipment 26 377,316 346,980 - -
Amortisation of prepaid operating lease 27 2,954 2,952 - -
Amortisation of intangible assets 28 232,663 167,568 - -
Impairment of property and equipment - 76,853 - -
14 Finance costs
Bank charges
99,181 63,806 524 456
Loss in monetary value (Note 3 (e)) 186,501 1,150,687 - -
285,682 1,214,493 524 456
15 Income tax expense
Current income tax 2,096,245 2,640,305 1,554 6,655
Current year charge (credit)/ debit (Note 34 (a)) 2,096,245 2,639,014 1,554 6,655
Previous year’s charge (credit)/ debit (Note 34 (b)) - 1,291
Deferred income tax (1,004,491) (1,009,808) (215) 9
▪ Current year charge asset (credit)/ debit (Note 33 (a)) (1,030,555) (1,017,507) (215) 9
▪ Current year charge liability (credit)/ debit (Note 33 (b)) 26,064 7,699 - -
Income tax expense for the year 1,091,754 1,630,497 1,339 6,664

Stanbic Holdings Plc Financial statements For the year ended 31 December 2017
87
Notes (continued) 15 Income tax expense (Continued)
The tax on the profit before tax differs from the theoretical amount using the statutory income tax rate as follows:
Group Company
2017 2016 2017 2016
KShs’000 KShs’000 KShs’000 KShs’000
Profit before income tax 5,401,248 6,049,086 1.878,229 2,839,223
Tax at statutory tax rate of 30% (2016: 30%) 1,620,374 1,814,726 563,469 851,767
Tax effect of:
· Income not subjected to tax (681,926) (470,063) (570,224) (850,421)
· Expenses not deductible for tax purposes 137,002 97,236 8,094 5,318
· Previous year’s current tax underprovision - 14,300 - -
· Previous year’s deferred income tax overprovision 26,064 (35,356) - -
· Effect of tax paid in other jurisdictions (9,760) 7,351 - -
· Hyperinflation adjustment- South Sudan - 202,303 - -
Income tax expense 1,091,754 1,630,497 1,339 6,664
16 Earnings per share
Earnings per share are calculated by dividing the net profit attributable to shareholders by the weighted average number of ordinary shares in issue during the year.
Group Company
2017 2016 2017 2016
Earnings (Profit after tax)
Earnings for the purposes of basic earnings per share (KShs' 000) 4,309,494 4,418,589 1,876,890 2,832,559
Number of shares
Weighted average number of ordinary shares for the purpose
of basic earnings per share (in thousands)
395,322 395,322 395,322 395,322
Earnings per share (KShs) basic and diluted
10.90 11.18 4.75 7.17
There were no potentially dilutive shares as at 31 December 2017 or 31 December 2016. Therefore, diluted earnings per share are the same as basic earnings per share.
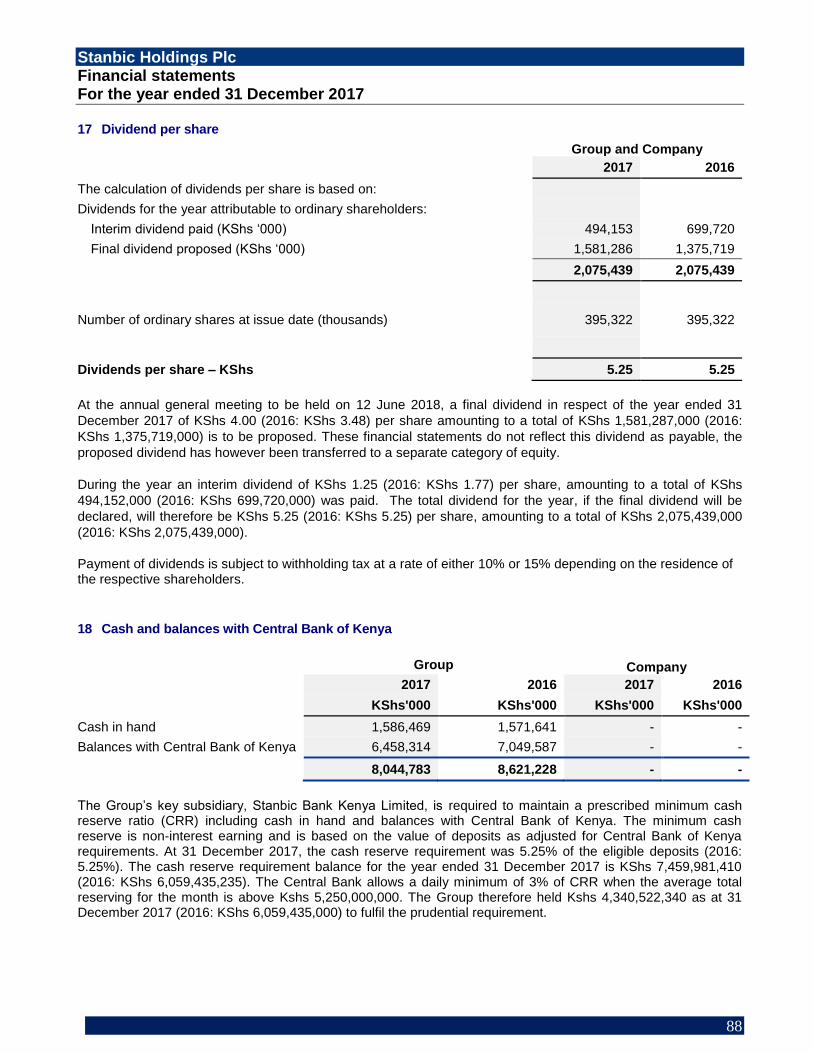
Stanbic Holdings Plc Financial statements For the year ended 31 December 2017
88
17 Dividend per share
Group and Company
2017 2016
The calculation of dividends per share is based on:
Dividends for the year attributable to ordinary shareholders:
Interim dividend paid (KShs ‘000) 494,153 699,720
Final dividend proposed (KShs ‘000) 1,581,286 1,375,719
2,075,439 2,075,439
Number of ordinary shares at issue date (thousands) 395,322 395,322
Dividends per share – KShs 5.25 5.25
At the annual general meeting to be held on 12 June 2018, a final dividend in respect of the year ended 31
December 2017 of KShs 4.00 (2016: KShs 3.48) per share amounting to a total of KShs 1,581,287,000 (2016:
KShs 1,375,719,000) is to be proposed. These financial statements do not reflect this dividend as payable, the
proposed dividend has however been transferred to a separate category of equity.
During the year an interim dividend of KShs 1.25 (2016: KShs 1.77) per share, amounting to a total of KShs
494,152,000 (2016: KShs 699,720,000) was paid. The total dividend for the year, if the final dividend will be
declared, will therefore be KShs 5.25 (2016: KShs 5.25) per share, amounting to a total of KShs 2,075,439,000
(2016: KShs 2,075,439,000).
Payment of dividends is subject to withholding tax at a rate of either 10% or 15% depending on the residence of the respective shareholders.
18 Cash and balances with Central Bank of Kenya
Group Company
2017 2016 2017 2016
KShs'000 KShs'000 KShs'000 KShs'000
Cash in hand 1,586,469 1,571,641 - -
Balances with Central Bank of Kenya 6,458,314 7,049,587 - -
8,044,783 8,621,228 - -
The Group’s key subsidiary, Stanbic Bank Kenya Limited, is required to maintain a prescribed minimum cash reserve ratio (CRR) including cash in hand and balances with Central Bank of Kenya. The minimum cash reserve is non-interest earning and is based on the value of deposits as adjusted for Central Bank of Kenya requirements. At 31 December 2017, the cash reserve requirement was 5.25% of the eligible deposits (2016: 5.25%). The cash reserve requirement balance for the year ended 31 December 2017 is KShs 7,459,981,410 (2016: KShs 6,059,435,235). The Central Bank allows a daily minimum of 3% of CRR when the average total reserving for the month is above Kshs 5,250,000,000. The Group therefore held Kshs 4,340,522,340 as at 31 December 2017 (2016: KShs 6,059,435,000) to fulfil the prudential requirement.

Stanbic Holdings Plc Financial statements For the year ended 31 December 2017
89
Notes (continued)
19 Available-for-sale pledged assets
Group
2017 2016
KShs'000 KShs'000
Debt securities 4,915,107 2,894,456
Maturity analysis;
Maturing within 6 months - 1,569,524
Maturing after 6 months but within 12 months 2,336,798 276,247
Maturing after 12 months but within 5 years 2,578,309 511,277
Maturing after 5 years - 537,408
4,915,107 2,894,456
Dated pledged assets had a redemption value at 31 December 2017 of KShs 5,000,000,000 (2016: KShs
2,770,000,000).
These transactions are conducted under terms that are usual and customary to security lending, security borrowings and lending activities. They are strictly for the purpose of providing collateral for counter-parties to the extent that the counter-party is permitted to sell and/or re-pledge the assets
20 Financial investments
Group
2017 2016
KShs'000 KShs'000
Financial assets – fair value through profit or loss (Note 20(a)) 29,806,020 15,995,194
Financial assets - available-for-sale (Note 20(b)) 36,079,567 34,037,538
Financial assets – at amortised cost (Note 20(c)) 5,444,176 -
71,329,763 50,032,732
(a) Financial assets – fair value through profit or loss
Listed securities-trading
29,806,020 15,995,194
Maturity analysis
Maturing within 1 month 998,307 2,493,499
Maturing after 1 month but within 6 months 12,674,152 4,955,950
Maturing after 6 months but within 12 months 12,176,738 8,442,722
Maturing after 12 months 3,956,823 103,023
29,806,020 15,995,194
The maturities represent periods to contractual redemption of trading assets recorded. Dated trading assets had a redemption value at 31 December 2017 of KShs 30,622,707,000 (2016: KShs 16,219,650,000). The weighted average effective interest yield on debt securities held for trading at 31 December 2017 was 10.51% (2016: 12.4%).
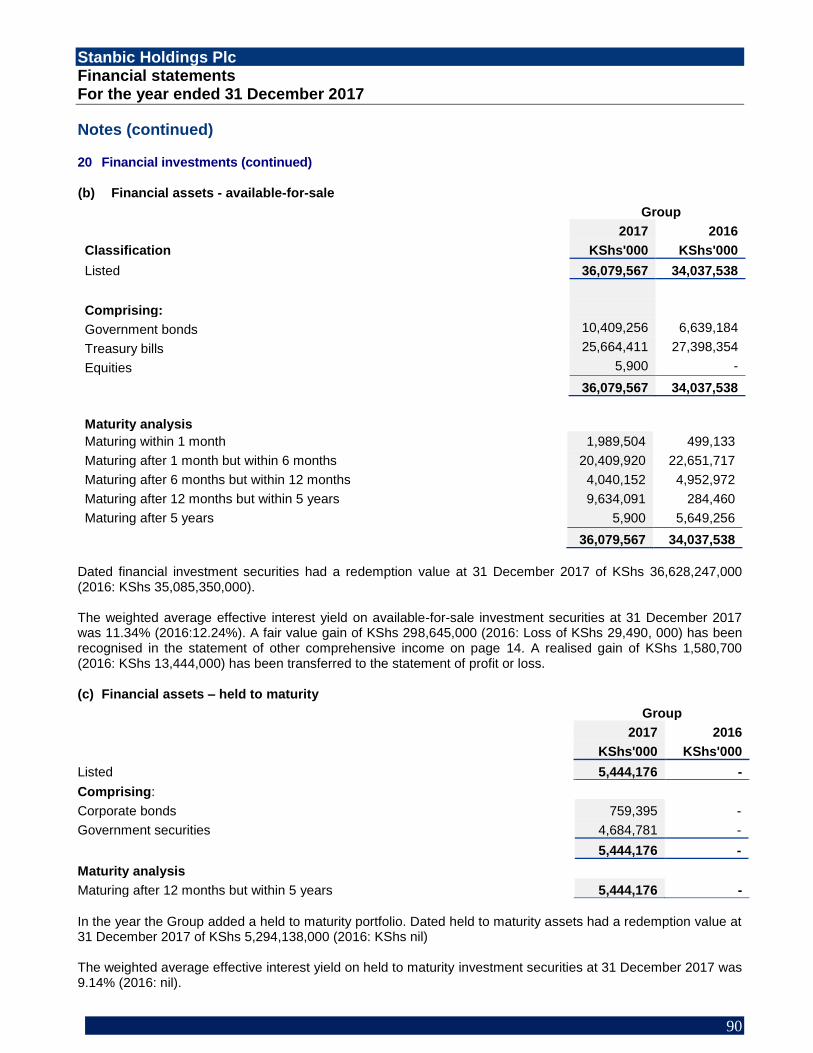
Stanbic Holdings Plc Financial statements For the year ended 31 December 2017
90
Notes (continued)
20 Financial investments (continued) (b) Financial assets - available-for-sale
Group
2017 2016
Classification
KShs'000 KShs'000
Listed
36,079,567 34,037,538
Comprising:
Government bonds
10,409,256 6,639,184
Treasury bills
25,664,411 27,398,354
Equities 5,900 -
36,079,567 34,037,538
Maturity analysis Maturing within 1 month
1,989,504 499,133
Maturing after 1 month but within 6 months 20,409,920 22,651,717
Maturing after 6 months but within 12 months 4,040,152 4,952,972
Maturing after 12 months but within 5 years 9,634,091 284,460
Maturing after 5 years
5,900 5,649,256
36,079,567 34,037,538
Dated financial investment securities had a redemption value at 31 December 2017 of KShs 36,628,247,000 (2016: KShs 35,085,350,000). The weighted average effective interest yield on available-for-sale investment securities at 31 December 2017 was 11.34% (2016:12.24%). A fair value gain of KShs 298,645,000 (2016: Loss of KShs 29,490, 000) has been recognised in the statement of other comprehensive income on page 14. A realised gain of KShs 1,580,700 (2016: KShs 13,444,000) has been transferred to the statement of profit or loss. (c) Financial assets – held to maturity
Group
2017 2016
KShs'000 KShs'000
Listed
5,444,176 -
Comprising: Corporate bonds
759,395 -
Government securities 4,684,781 -
5,444,176 -
Maturity analysis
Maturing after 12 months but within 5 years
5,444,176 -
In the year the Group added a held to maturity portfolio. Dated held to maturity assets had a redemption value at 31 December 2017 of KShs 5,294,138,000 (2016: KShs nil)
The weighted average effective interest yield on held to maturity investment securities at 31 December 2017 was 9.14% (2016: nil).

Stanbic Holdings Plc Financial statements For the year ended 31 December 2017
91
Notes (continued) 21 Financial liabilities at fair value through profit and loss
Group
2017 2016
KShs'000 KShs'000
Trading liabilities – designated at fair value through profit or loss 362,630 3,867,718
Maturity analysis
Maturing within 1 month 152,965 1,787,216
Maturing after 1 month but within 6 months 209,665 2,080,502
362,630 3,867,718
The maturities represent periods to contractual redemption of trading liabilities recorded. Dated trading liabilities had a redemption value at 31 December 2017 of KShs 358,794,000 (2016: KShs 3,804,511,000). The weighted average effective interest cost on debt securities held for trading at 31 December 2017 was 5.64% (2016: 4.24%).
22 Loans and advances
The Group extends advances to the personal, commercial and corporate sectors as well as to the public sector. Advances made to individuals are mostly in the form of mortgages, instalment credit, overdrafts and credit card borrowings.
(a) Loans and advances to banks
Group Company
2017 2016 2017 2016
KShs’000 KShs’000 KShs’000 KShs’000
Balances with banks
4,122,854 2,800,452 111,803 -
Balances due from Group banks (Note 38 (a)) 4,524,530 9,838,465 100,662
Balances with Bank of South Sudan 4,183,523 4,743,607 - -
12,830,907 17,382,524 111,803 100,662
Allowances for impairments
Impairment for performing loans (61,539) (330,270) - -
Impairment for non-performing loans (25,738) (63,373) - -
Credit impairment allowances (87,277) (393,643) - -
Net loans and advances to banks 12,743,630 16,988,881 111,803 100,662

Stanbic Holdings Plc Financial statements For the year ended 31 December 2017
92
Notes (continued)
22 Loans and advances (Continued)
(b) Loans and advances to customers
Group
2017 2016
KShs'000 KShs'000
Mortgage lending 17,975,608 15,349,063
Instalment sale and finance leases 14,000,974 13,166,542
Overdraft and other demand lending 23,414,144 18,010,452
Term lending 79,833,848 71,761,018
Card lending 575,241 433,316
Gross loans and advances to customers 135,799,815 118,720,391
Allowances for impairments
Impairment for non-performing loans (3,243,601) (1,653,491)
Impairment for performing loans (2,020,400) (1,479,177)
Credit impairment allowances (Note 23 (c)) (5,264,001) (3,132,668)
Net loans and advances 130,535,814 115,587,723
(b) Loans and advances to customers (continued)
Group
2017 2016
Maturity analysis: KShs'000 KShs'000
Redeemable on demand 18,016,245 15,027,772
Maturing within 1 month 11,609,492 10,226,706
Maturing after 1 month but within 6 months 16,938,688 10,619,831
Maturing after 6 months but within 12 months 3,834,190 9,354,099
Maturing after 12 months but within 5 years 40,091,563 36,917,927
Maturing after 5 years 40,045,636 33,441,388
Net loans and advances 130,535,814 115,587,723
The weighted average effective interest rate on loans and advances to customers as at 31 December 2017 was 10.68% (2016: 10.76%). The Group extends advances to personal, commercial and corporate sectors as well as to the public sector. Advances made to individuals are mostly in the form of mortgages, instalment sales and overdrafts.

Stanbic Holdings Plc Financial statements For the year ended 31 December 2017
93
Notes (continued)
22 Loans and advances (continued)
(c) Allowances for Impairment
Year ended 31 December 2017
Non-performing loans
Portfolio impairment
Group
Total
KShs'000 KShs'000 KShs'000
At 1 January 2017 1,653,491 1,479,177 3,132,668
Amounts written off during the year as uncollectable (944,175) - (944,175)
Amounts recovered during the year (100,406) - (100,406)
Provision for loans impairment 2,634,691 541,227 3,175,918
At 31 December 2017 3,243,601 2,020,404 5,264,005
Year ended 31 December 2016
Non-performing loans
Portfolio impairment
Group
Total
KShs'000 KShs'000 KShs'000
At 1 January 2016 1,271,153 1,159,249 2,430,402
Amounts written off during the year as uncollectable (733,208) - (733,208)
Amounts recovered during the year (591,867) - (591,867)
Provision for loans impairment 1,708,600 324,395 2,032,995
Exchange difference (1,187) (4,467) (5,654)
At 31 December 2016 1,653,491 1,479,177 3,132,668
(d) Loan impairment charge
Group
2017 2016
KShs’000 KShs’000
Customers Loans impairment for non-performing loans 2,634,690 1,708,600
Customers Loans impairment for performing loans 541,228 324,395
Banks loans impairment for non-performing loans - 63,373
Bank loans impairment for performing loans - 331,827
Amounts recovered during the year for banks (268,732) -
Amounts recovered during the year (100,406) (591,867)
Recoveries of amounts previously written off (45,455) (84,516)
Net loans impairment charge on loans and advances 2,761,325 1,751,812
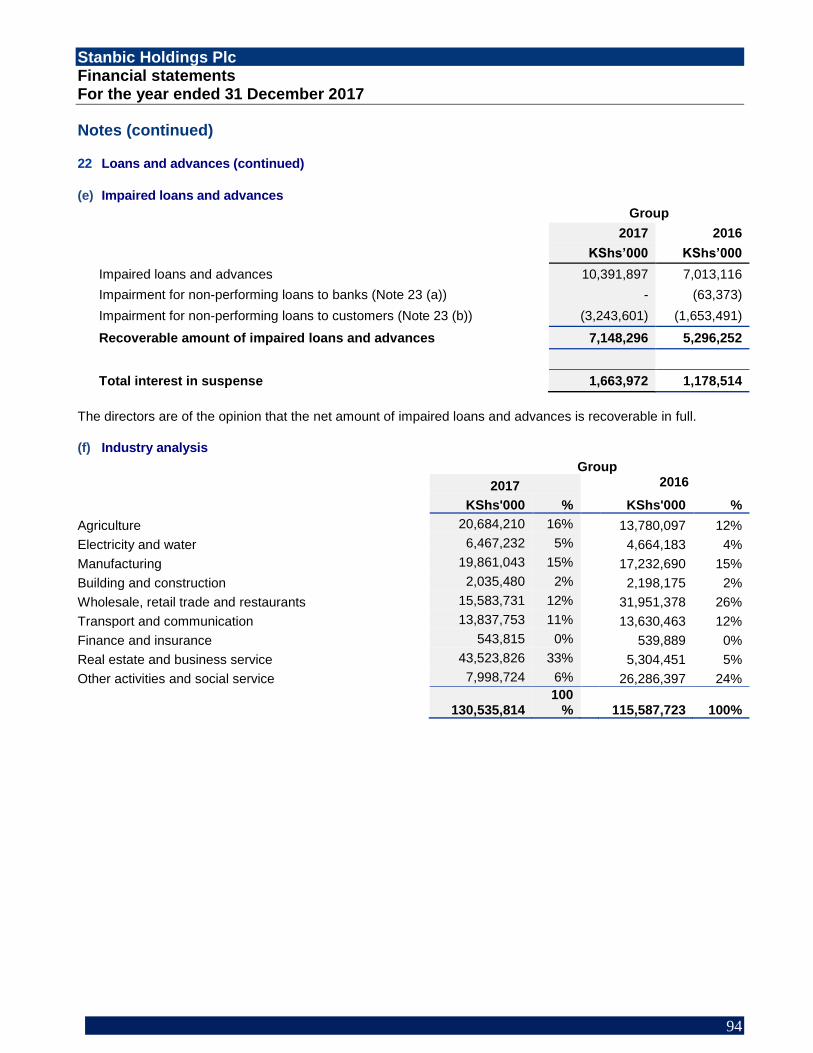
Stanbic Holdings Plc Financial statements For the year ended 31 December 2017
94
Notes (continued)
22 Loans and advances (continued)
(e) Impaired loans and advances
Group
2017 2016
KShs’000 KShs’000
Impaired loans and advances 10,391,897 7,013,116
Impairment for non-performing loans to banks (Note 23 (a)) - (63,373)
Impairment for non-performing loans to customers (Note 23 (b)) (3,243,601) (1,653,491)
Recoverable amount of impaired loans and advances 7,148,296 5,296,252
Total interest in suspense
1,663,972 1,178,514
The directors are of the opinion that the net amount of impaired loans and advances is recoverable in full.
(f) Industry analysis
Group
2017 2016
KShs'000 % KShs'000 %
Agriculture 20,684,210 16% 13,780,097 12%
Electricity and water 6,467,232 5% 4,664,183 4%
Manufacturing 19,861,043 15% 17,232,690 15%
Building and construction 2,035,480 2% 2,198,175 2%
Wholesale, retail trade and restaurants 15,583,731 12% 31,951,378 26%
Transport and communication 13,837,753 11% 13,630,463 12%
Finance and insurance 543,815 0% 539,889 0%
Real estate and business service 43,523,826 33% 5,304,451 5%
Other activities and social service 7,998,724 6% 26,286,397 24%
130,535,814
100% 115,587,723 100%

Stanbic Holdings Plc Financial statements For the year ended 31 December 2017
95
Notes (continued)
22 Loans and advances (continued)
(g) Segmental analysis of non-performing loans and advances – industry
2017 2016
KShs’000 % KShs’000 %
Agriculture 2,322,231 22% 2,623,197 37%
Manufacturing 4,442,432 43% 1,001,861 14%
Building and construction 161,950 2% 172,712 3%
Wholesale, retail trade and restaurants 450,901 4% 773,869 11%
Transport and communication 896,378 9% 426,421 6%
Finance and insurance 9,503 0% 199,449 3%
Real estate and business service 1,626,551 16% 57,869 1%
Other activities and social service 481,951 5% 1,757,738 25%
10,391,897 100% 7,013,116 100%
(h) Instalment sales and finance leases
Loans and advances to customers include finance lease receivables, which are analysed below: 2017 2016 KShs’000 KShs’000
Gross investment in instalment sales and finance leases: Not later than 1 year 1,285,172 1,461,570 Later than 1 year and not later than 5 years 12,446,683 11,698,480 Later than 5 years 460,600 122,230
14,192,455 13,282,280
Unearned finance charge - -
Net investment in finance leases 14,192,455 13,282,280
The amount of finance lease receivable included above is nil (2016: Nil). Impairment provisions of KShs 727,413,000 (2016: KShs 376,351,000) for instalment sale and finance lease receivables are included in the impairment for non-performing loans. i) Loans to employees
2017 2016
KShs’000 KShs’000
At start of year 3,708,037 3,710,046
New loans issued
1,104,356 1,235,293
Interest on loan
160,804 150,065
Loan repayments (1,124,715) (1,387,367)
At end of year 3,848,482 3,708,037

Stanbic Holdings Plc Financial statements For the year ended 31 December 2017
96
Notes (continued)
23 Other assets and prepayments Group Company
2017 2016 2017 2016
KShs'000 KShs'000 KShs'000 KShs'000
Uncleared effects 1,864,419 1,237,886 - -
Off market loan adjustment 833,640 901,192 - -
Trade receivables and prepayments 166,147 680,447 - -
Due from related companies (Note 37 (h)) 336,255 989,075 - -
Others 20,109 8,887 - -
3,220,570 3,817,487 - -
The off-market adjustment relates to the prepaid benefit granted to staff, being the difference between the fair value of the loan and the initial cash outflow. The fair value of future cash flows is discounted at a market related rate. The asset represents the group's right to receive future service from employees. 24 Investment in subsidiaries
Company
Beneficial Country of 2017 2016
Company
ownership Incorporation KShs'000 KShs'000
Stanbic Bank Kenya Limited
100% Kenya 18,009,808 18,009,808
SBG Securities Limited
100% Kenya 165,530 165,530
Stanbic Insurance Agency Limited 100% Kenya 42,174 -
18,217,512 18,175,338
The company has prepared consolidated financial statements as it wholly owns Stanbic Bank Kenya Limited, SBG Securities Limited and Stanbic Insurance Agency Limited. Stanbic Insurance Agency Limited (SIAL) was acquired by Stanbic Holdings Plc from Stanbic Bank Kenya Limited for Kshs 42,174,000 in 2017. The purchase price represented SIAL’s net asset value at the acquisition date.
All subsidiary entities are incorporated and domiciled in Kenya. The consolidated financial statements are available to the public and can be accessed on http://www.stanbicbank.co.ke/kenya/About-Us/Investor-relations
The principal place of business for the subsidiaries is Stanbic Bank Centre, Chiromo Road. There were no significant restrictions on the company’s ability to access the assets and settle liabilities of the subsidiaries. The total amount disclosed as investment in subsidiaries is a non-current asset.
25 Other investments Group Company
2017 2016 2017 2016
KShs'000 KShs'000 KShs'000 KShs'000
Unquoted: - -
Equity investment at cost 17,500 17,500 - -
Impairment of equity investment - (17,500) - -
At 31 December 17,500 - - -
The investment is in Anglo African Property Holding Limited where the Group holds a beneficial interest of 1%. For the last three years Anglo African property holdings has been profitable and not technically insolvent necessitating a writeback of the provision that had been held earlier.
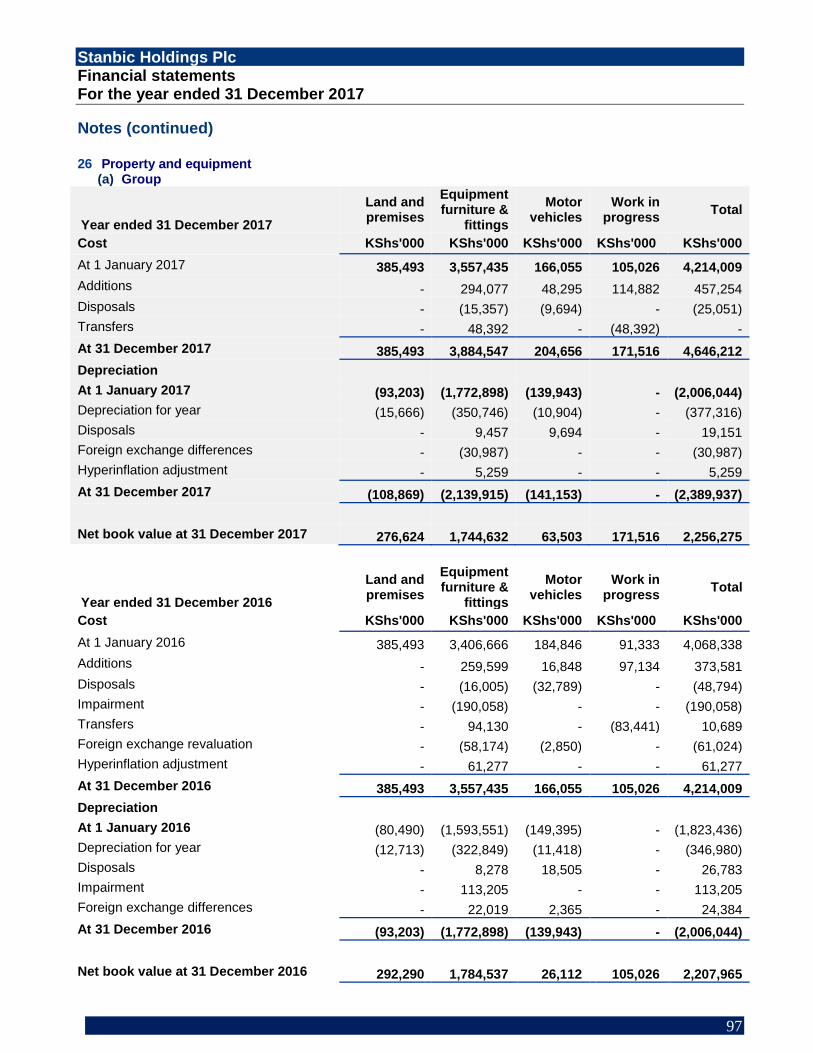
Stanbic Holdings Plc Financial statements For the year ended 31 December 2017
97
Notes (continued) 26 Property and equipment
(a) Group
Year ended 31 December 2017
Land and premises
Equipment furniture &
fittings
Motor vehicles
Work in progress
Total
Cost KShs'000 KShs'000 KShs'000 KShs'000 KShs'000
At 1 January 2017 385,493 3,557,435 166,055 105,026 4,214,009
Additions - 294,077 48,295 114,882 457,254
Disposals - (15,357) (9,694) - (25,051)
Transfers - 48,392 - (48,392) -
At 31 December 2017 385,493 3,884,547 204,656 171,516 4,646,212
Depreciation
At 1 January 2017 (93,203) (1,772,898) (139,943) - (2,006,044)
Depreciation for year (15,666) (350,746) (10,904) - (377,316)
Disposals - 9,457 9,694 - 19,151
Foreign exchange differences - (30,987) - - (30,987)
Hyperinflation adjustment - 5,259 - - 5,259
At 31 December 2017 (108,869) (2,139,915) (141,153) - (2,389,937)
Net book value at 31 December 2017 276,624 1,744,632 63,503 171,516 2,256,275
Year ended 31 December 2016
Land and premises
Equipment furniture &
fittings
Motor vehicles
Work in progress
Total
Cost KShs'000 KShs'000 KShs'000 KShs'000 KShs'000
At 1 January 2016 385,493 3,406,666 184,846 91,333 4,068,338
Additions - 259,599 16,848 97,134 373,581
Disposals - (16,005) (32,789) - (48,794)
Impairment - (190,058) - - (190,058)
Transfers - 94,130 - (83,441) 10,689
Foreign exchange revaluation - (58,174) (2,850) - (61,024)
Hyperinflation adjustment - 61,277 - - 61,277
At 31 December 2016 385,493 3,557,435 166,055 105,026 4,214,009
Depreciation
At 1 January 2016 (80,490) (1,593,551) (149,395) - (1,823,436)
Depreciation for year (12,713) (322,849) (11,418) - (346,980)
Disposals - 8,278 18,505 - 26,783
Impairment - 113,205 - - 113,205
Foreign exchange differences - 22,019 2,365 - 24,384
At 31 December 2016 (93,203) (1,772,898) (139,943) - (2,006,044)
Net book value at 31 December 2016 292,290 1,784,537 26,112 105,026 2,207,965

Stanbic Holdings Plc Financial statements For the year ended 31 December 2017
98
Notes (continued) 26 Property and equipment (continued)
(b) Company
Computer Equipment
2017 2016
KShs’000 KShs’000
Cost
At 1 January
1,659 1,659
At 31 December
1,659 1,659
Depreciation
At 1 January
(1,659) (1,659)
Charge for the year
- -
At 31 December
(1,659) (1,659)
Net book value at 31 December
- -
The Group’s work in progress is composed of refurbishments and equipment for branches and projects that had
not been completed as at year end. The total amount disclosed as property and equipment is non-current.
As at 31 December 2017 and 31 December 2016, there were no items of property and equipment pledged by the Group and Company to secure liabilities. No items of property and equipment were obtained from borrowed funds hence no capitalization of borrowing costs. Revaluation of land and buildings The revaluation reserve in equity relates to the value of the Stanbic office in Chiromo at the point of merger between CFC and Stanbic Bank in 2008. The fair value of the properties was determined using the market comparable method. This means that valuations performed by the valuer were based on active market prices, significantly adjusted for differences in the nature, location or condition of the specific property. As the functional currency of Stanbic South Sudan is the currency of a hyperinflationary economy, property, plant and equipment relating to this Branch is restated by applying the change in the general price indices from the date of acquisition to the current reporting date. Depreciation relating to the property, plant and equipment of Stanbic South Sudan is based on the restated amounts, which have been adjusted for the effects of hyperinflation.

Stanbic Holdings Plc Financial statements For the year ended 31 December 2017
99
Notes (continued)
27 Prepaid operating lease
Group
2017 2016
Cost KShs'000 KShs'000
At 1 January 85,499 85,499
At 31 December 85,499 85,499
Amortisation At 1 January (31,598) (28,646) Charge for the year (2,954) (2,952)
At 31 December (34,552) (31,598)
Net book value at 31 December 50,947 53,901
This relates to land leased by the Group for a lease term period of 99 years. The total amount disclosed as
prepaid operating lease in the Group is non-current.
28 Other intangible assets – Group
Year ended 31 December 2017 Work in
progress Software
Other intangible
assets Total
Cost KShs'000 KShs'000 KShs'000 KShs'000
At 1 January 2017 117,395 2,433,219 1,099,059 3,649,673
Additions 75,631 378,282 - 453,913
Foreign exchange differences - (934) - (934)
Hyperinflation adjustment - 238 - 238
At 31 December 2017 193,026 2,810,805 1,099,059 4,102,890
Amortisation
At 1 January 2017 - (1,705,578) (808,599) (2,514,177)
Amortisation charge for the year - (187,396) (45,267) (232,663)
At 31 December 2017 - (1,892,974) (853,866) (2,746,840)
Net book value at 31 December 2017 193,026 917,831 245,193 1,356,050

Stanbic Holdings Plc Financial statements For the year ended 31 December 2017
100
Notes (continued)
28 Other intangible assets – Group (continued)
Year ended 31 December 2016 Work in
progress Software
Other intangible
assets Total
Cost KShs'000 KShs'000 KShs'000 KShs'000
At 1 January 2016 48,972 1,952,988 1,099,059 3,101,019
Additions 103,602 454,868 - 558,470
Transfers (34,804) 24,115 - (10,689)
Foreign exchange differences (375) (60)
(435)
Hyperinflation adjustment - 1,308 - 1,308
At 31 December 2016 117,395 2,433,219 1,099,059 3,649,673
Amortisation
At 1 January 2016 - (1,583,317) (763,332) (2,346,649)
Amortisation charge for year - (122,301) (45,267) (167,568)
Foreign exchange differences - 40 - 40
At 31 December 2016 - (1,705,578) (808,599) (2,514,177)
Net book value at 31 December 2016 117,395 727,641 290,460 1,135,496
The total amount disclosed as intangible assets is non-current and relates to computer software. Work in progress relates to computer software development systems which had not been completed as at year end. As at 31 December 2017, the intangible assets had a remaining useful life of 10 years. The intangible assets arising from the business combination comprise of the following:
Cost Useful life
KShs’000 Years
Trade names
260,000 15
Customer relationships
475,000 5 - 15
Others
364,059 2 - 5
1,099,059
29 Intangible assets - goodwill
Group Company
2017 2016 2017 2016
Cost KShs’000 KShs’000 KShs’000 KShs’000
At 1 January and 31st December 9,349,759 9,349,759 - -
Goodwill relating to Stanbic Holdings Plc was tested for impairment on 31 December 2017. The recoverable amount was determined to be the value in use. Unless indicated otherwise, the value in use in 2017 was determined in a manner consistent with that used in prior years. Key assumptions relating to this valuation include the discount rate and cash flows used to determine the value in use.

Stanbic Holdings Plc Financial statements For the year ended 31 December 2017
101
Notes (continued)
29 Intangible assets – goodwill (continued)
a) Discount rate
The pre-tax discount rate used was based on an assessment of the risks applicable to the Stanbic
Holdings Plc. The cost of equity discount rate calculated for the forecast years was 16.72% per annum
(2016: 17.90%). The cost of equity assigned to the cash-generating unit and used to discount its future
cash flows can have a significant effect on its valuation. The cost of equity percentage is derived from an
equity pricing model deemed appropriate based on the entity under review. The risk-free rate used to
determine the cost of equity has been derived from the 10-year US Dollar government bonds adjusted
for inflation differential and country risk yield
A rise in the pre-tax discount rate to 25.82% (2016: 26.5%), that is +9.1% (2016: +8.6%) in the CIB unit would result to an impairment. A rise in the pre-tax discount rate to 18.92% (2016: 20.4%), that is +2.2% (2016: +2.5%) in the PBB unit would result to an impairment.
b) Future cash flows
The forecast periods adopted reflect a set of cash flows that based on management judgement and
expected market conditions could be sustainably generated over such a period. An eight-year forecast
was used as a basis for future cash flows, extrapolated in perpetuity to reflect the long-term plans for the
entity, using a nominal growth rate of 8% (2016: 8%). These values are sensitive to the cash flows
projected for the periods for which detailed forecasts are not available and to the assumptions regarding
the long-term sustainability of the cash flows thereafter. Based on the testing performed, no impairment
was identified.
A decrease in the net profit by 38% would result in a further impairment in the CIB unit. A decrease in the net profit by 17.0% would result in impairment in the PBB unit.
Goodwill is allocated to the Group’s cash-generating units (CGUs) identified according to operating segment. 95% of the goodwill has been allocated to Corporate CIB CGU and the remaining 5% has been allocated to PBB CGU.
30 Ordinary share capital and ordinary share premium
(a) Authorised share capital
2017 2016
Number of Shares
Share Capital
Number of Shares
Share Capital
(thousands) KShs’000 (thousands) KShs’000
Balance as at 1 January and 31 December 473,684 2,368,421 473,684 2,368,421
(b) Issued share capital
Number of Shares
Share Capital
Number of Shares
Share Capital
(thousands) KShs’000 (thousands) KShs’000
Balance as at 1 January and 31 December 395,322 1,976,608 395,322 1,976,6089
Unissued shares 78,362 391,813 78,362 391,813
(c) Ordinary share premium
2017 2016
KShs’000 KShs’000
At 1 January and 31 December
16,897,389 16,897,389

Stanbic Holdings Plc Financial statements For the year ended 31 December 2017
102
Notes (continued)
31 Derivative assets and liabilities
2017 2016
Fair values Fair values
Notional contract amount Assets Liabilities
Notional contract amount Assets Liabilities
KShs’000 KShs’000 KShs’000 KShs’000’ KShs’000 KShs’000
Foreign exchange derivatives
Currency forwards 17,445,355 185,265 216,441 15,869,130 167,449 742,879
Currency swaps 30,223,913 64,039 451,707 20,383,990 114,913 158,372
Currency options 18,403,411 867,354 183,107 13,196,814 147,084 117,067
Total over-the-counter derivatives
66,072,679
1,116,658
851,255
49,449,934
429,446
1,018,318
Interest rate derivatives
Interest rate swaps 48,583,192 1,085,227 1,387,092 31,108,019 1,745,515 1,745,515
Cross currency interest rate swaps 4,154,802 189,216
189,216 2,059,445 297,230 297,230
Total over-the-counter derivatives 52,737,994 1,274,443
1,576,308 33,167,464 2,042,745 2,042,746
Total derivative assets held for trading
118,810,673
2,391,101
2,427,563
82,617,398
2,472,191
3,061,063
Current 78,456,434 894,299 831,596 46,184,751 367,710 1,025,872
Non-current 40,354,239 1,496,802 1,595,967 36,432,647 2,104,481 2,035,191
Total 118,810,673 2,391,101 2,427,563 82,617,398 2,472,191 3,061,063
All derivatives are classified as derivatives held for trading. Fair values The fair value of a derivative financial instrument represents, for quoted instruments, the quoted market price and for unquoted instruments, the present value of the positive or negative cash flows, which would have occurred if the rights and obligations arising from that instrument were closed out in an orderly market place transaction at year end.
Notional amount The gross notional amount is the sum of the absolute value of all bought and sold contracts. The amount cannot be used to assess the market risk associated with the position and should be used only as a means of assessing the Group’s participation in derivative contracts. Use and measurement of derivative instruments In the normal course of business, the Group enters into a variety of derivative transactions for both trading and hedging purposes. Derivative financial instruments are entered into for trading purposes and for hedging foreign exchange exposures. Derivative instruments used by the Group in both trading and hedging activities include forwards and other similar types of instruments based on foreign exchange rates and interest rates.

Stanbic Holdings Plc Financial statements For the year ended 31 December 2017
103
Notes (continued) 32 Deposits from banks and customers
Deposit products include current accounts, savings accounts, call and fixed deposits and negotiable certificates of deposit. Group
2017 2016
KShs'000 KShs'000
(a) Deposits from Banks
Deposits from Banks
25,687,195 32,365,282
Deposits due to Group banks (Note 38 (b)) 13,019,940 4,141,542
38,707,135 36,506,824
Group
2017 2016
KShs'000 KShs'000
(b) Deposits from customers
Current accounts
105,335,213 68,890,440
Call deposits
7,240,980 6,430,155
Savings accounts
26,317,844 23,177,470
Term deposits
13,006,715 18,584,682
LC acceptances
2,760,020 2,245,472
154,660,772 119,328,219
Total deposits from banks and customers
193,367,907 155,835,043
Maturity analysis of deposits from customers The maturity analysis is based on the remaining periods to contractual maturity from year end.
Group
2017 2016
KShs'000 KShs'000
Repayable on demand
113,344,837 91,792,719 Maturing within 1 month
27,396,462 14,969,648
Maturing after 1 month but within 6 months
11,706,367 8,838,412 Maturing after 6 months but within 12 months
1,809,720 3,581,089
Maturing after 12 months
403,386 146,351
154,660,772 119,328,219
Deposit products include current accounts, savings accounts, call deposits, and fixed deposits. The weighted average effective interest rate on customer deposits as at 31 December 2017 was 2.57% (2016: 3.00%). Industry analysis 2017 2016
KShs’000 % KShs’000 %
Central government 12,366,130 8% 15,489,804 13%
Non-financial public enterprises 11,067,951 7% 774,459 1%
Non-bank financial institutions 243,168 0% 284,299 0%
Insurance companies 750,878 0% 1,327,366 1%
Hire purchase companies - 0% 7 0%
Private enterprises 102,473,546 66% 60,376,911 51%
Non-profit institutions and individuals 27,759,099 18% 41,075,373 34%
154,660,772 100% 119,328,219 100%

Stanbic Holdings Plc Financial statements For the year ended 31 December 2017
104
Notes (continued)
33 Borrowings
At 31 December 2017
Notional value Carrying value Interest Rate Date of
Issue Maturity
date
KShs’000 KShs’000
Stanbic Bond 4,000,000 3,989,243 12.95% 15-Dec-14 15-Dec-21
Total 4,000,000 3,989,243
At 31 December 2016
Notional value Carrying value Interest Rate Date of
Issue Maturity
date
KShs’000 KShs’000
Stanbic Bond 4,000,000 3,986,138 12.95% 15-Dec-14 15-Dec-21
Total 4,000,000 3,986,138
There were no charges placed on any of the Group’s assets in relation to these borrowings. The Group has not had any defaults of principal, interest or other breaches with regard to any borrowings during 2017 and 2016.The Bonds are payable on their maturity dates at the notional value. Interest expense incurred in the above borrowings was KShs 521,104,000 (2016: KShs 685,049,000). The weighted average effective interest rate on borrowings as at 31 December 2017 was 12.95% (2016: 12.95%). The difference between the carrying and notional value represents, accrued interest and the unamortised issue costs. The borrowings are unsecured subordinated debt instruments.

Stanbic Holdings Plc Financial statements For the year ended 31 December 2017
105
Notes (continued)
34 Other liabilities and accrued expenses
(a) Other liabilities and accrued expenses
Group Company
2017 2016 2017 2016
KShs'000 KShs'000 KShs'000 KShs'000
Items in transit 152,955 153,355 - -
Accruals 1,922,033 1,659,907 12,520 9,695
Deferred bonus scheme (Note 34(b)) 309,825 174,828 - -
Unpresented bank drafts 111,271 105,509 - -
Margin on guarantees and letters of credit 1,520,838 1,267,408 - -
Due to group companies (Note 38(i)) 463,369 992,289 8,675 1,550
Sundry creditors 1,116,539 2,035,787 84,606 48,865
5,596,830 6,389,083 105,801 60,110
(b) Deferred bonus scheme (DBS) It is essential for the Group to retain key skills over the longer term. This is done particularly through share-based incentive plans. The purpose of these plans is to align the interests of the Group and employees, as well as to attract and retain skilled, competent people. The Group has implemented a scheme to defer a portion of incentive bonuses over a minimum threshold for key management and executives. This improves the alignment of shareholder and management interests by creating a closer linkage between risk and reward, and also facilitates retention of key employees. All employees granted an annual performance award over a threshold have part of their award deferred. The award is indexed to Standard Bank Group's (SBG) share price and accrues notional dividends during the vesting period, which are payable on vesting. The awards vest in three equal amounts at 18 months, 30 months and 42 months from the date of award. The final pay-out is determined with reference to SBG’s share price on vesting date. The provision in respect of liabilities under the scheme amounts to KShs 310,117,000 at 31 December 2017 (2016: KShs 174,828,000) and the amount charged for the year was KShs 257,187,000 (2016: KShs 136,373,000).
Units
Reconciliation 2017 2016
Units outstanding at beginning of the year
133,976 246,954
Granted
- 180,604
Exercised
(116,975) (129,014)
Lapsed
(15,856) (36,004)
Transfers 139,517 (128,564)
Units outstanding at end of the year 140,662 133,976
Weighted average fair value at grant date (ZAR)
- 122.24 Expected life (years)
2.51 2.51
Risk-free interest rate (%)
- 5.54

Stanbic Holdings Plc Financial statements For the year ended 31 December 2017
106
Notes (continued)
35 (a) Current income tax (liability)/ asset
Group Company
2017 2017
The tax receivable from the tax authorities in the jurisdictions of operations are highlighted below;
KShs’000 KShs’000
Kenya operations 66,358 18,054
Foreign operations 16,668 -
As at 31 December 83,206 18,054
The tax reconciliations in the jurisdictions of operations are highlighted below;
Kenya operations Group Company
2017 2016 2017 2016
KShs’000 KShs’000 KShs’000 KShs’000
At 1 January (1,042,810) 382,965 18,872 (5,910)
Reallocation of Kenya/ (Foreign) operations to opening balance
79,582 (20,711) - -
Current income tax charge (Note 15) (2,096,245) (2,622,678) (1,554) (6,655)
Income tax paid 3,483,135 857,614 736 31,437
Prior year provision 2,696 - - -
As at 31 December 66,358 (1,402,810) 18,054 18,872
The Group and Company amount above relates to current income tax receivable/ (payable) from the Kenyan tax authority and is current.
(b) Current income tax asset/ (liability)
Foreign operations Group
2017 2016
KShs’000 KShs’000
As at 1 January 113,547 (89,535)
Reallocation of (Kenya)/ Foreign operations to opening balance (79,582) 20,711
Exchange difference on translation (14,601) 67,228
Current income tax charge (Note 15) - (17,627)
Income tax paid - 132,770
Prior year provision (2,696) -
As at 31 December 16,668 113,547
The Group has operations in South Sudan which is in a net tax recoverable position. The tax is recoverable from to the Government of South Sudan.

Stanbic Holdings Plc Financial statements For the year ended 31 December 2017
107
Notes (continued)
35 (c) Deferred income tax asset/(liability)
The deferred tax liability and asset have been separately recognised as Kenya, Rwanda, Uganda and South Sudan have no legal enforceable right to set off tax.
Kenya operations Group Company
2017 2016 2017 2016
Kshs’000 Kshs’000 Kshs’000 Kshs’000
At start of year 1,407,363 361,322 (11) (2)
Reallocation of Foreign operations to opening balance 7,699 - - -
Credit/ (charge) to statement of profit or loss (Note 15) 1,030,555 1,009,808 214 (9)
Credit/(charge) to other comprehensive income (1,324) 39,978 - -
Exchange difference on translation - (3,745) - -
Prior year provision 101 - - -
At end of year 2,444,394 1,407,363 203 (11)
Deferred income tax assets and liabilities and deferred income tax (credit)/charge in the statement of profit or loss and other comprehensive income (OCI) are attributable to the following items:
1.1.2017
Credited to
statement of profit or loss
Charge to statement of
other comprehensive
income Translation movements 31.12.2017
Year ended 31 December 2017 KShs’000 KShs’000 KShs’000 KShs’000 KShs’000
Arising from:
Property and equipment (42,163) (29,431) - - (71,594)
Fair value gains on AFS instruments (163,025) 766,754 (1,324) - 604,405
Portfolio impairment 821,379 (21,487) - - 799,892
Finance leasing 21,487 309,654 - - 331,141
Other provisions 965,170 (1,449) - - 963,721
Group intangible assets (88,826) 210,049 - - 121,223
Unrealised gain on South Sudan retained earnings conversion
(99,704) (193,413) -
- (293,116)
Foreign currency exchange differences (6,955) (10,123) - - (17,078)
Reallocation of tax subject to tax in other jurisdictions
- - -
7,699 7,699
Net deferred asset 1,407,363 1,030,554 (1,324) 7,699 2,444,394
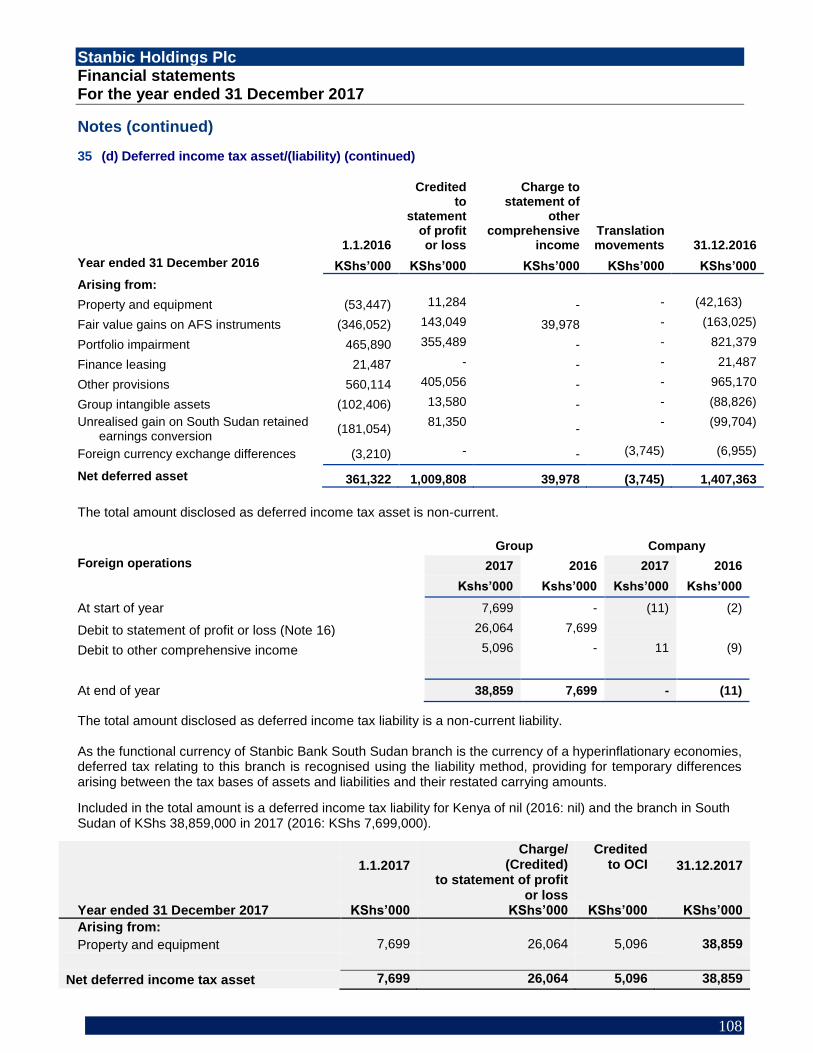
Stanbic Holdings Plc Financial statements For the year ended 31 December 2017
108
Notes (continued)
35 (d) Deferred income tax asset/(liability) (continued)
1.1.2016
Credited to
statement of profit or loss
Charge to statement of
other comprehensive
income Translation movements 31.12.2016
Year ended 31 December 2016 KShs’000 KShs’000 KShs’000 KShs’000 KShs’000
Arising from:
Property and equipment (53,447) 11,284 - - (42,163)
Fair value gains on AFS instruments (346,052) 143,049 39,978 - (163,025)
Portfolio impairment 465,890 355,489 - - 821,379
Finance leasing 21,487 - - - 21,487
Other provisions 560,114 405,056 - - 965,170
Group intangible assets (102,406) 13,580 - - (88,826)
Unrealised gain on South Sudan retained earnings conversion
(181,054) 81,350
- - (99,704)
Foreign currency exchange differences (3,210) - - (3,745) (6,955)
Net deferred asset 361,322 1,009,808 39,978 (3,745) 1,407,363
The total amount disclosed as deferred income tax asset is non-current.
Group Company
Foreign operations 2017 2016 2017 2016
Kshs’000 Kshs’000 Kshs’000 Kshs’000
At start of year 7,699 - (11) (2)
Debit to statement of profit or loss (Note 16) 26,064 7,699
Debit to other comprehensive income 5,096 - 11 (9)
At end of year 38,859 7,699 - (11)
The total amount disclosed as deferred income tax liability is a non-current liability. As the functional currency of Stanbic Bank South Sudan branch is the currency of a hyperinflationary economies, deferred tax relating to this branch is recognised using the liability method, providing for temporary differences arising between the tax bases of assets and liabilities and their restated carrying amounts. Included in the total amount is a deferred income tax liability for Kenya of nil (2016: nil) and the branch in South Sudan of KShs 38,859,000 in 2017 (2016: KShs 7,699,000).
Charge/ (Credited)
to statement of profit or loss
Credited to OCI
1.1.2017 31.12.2017
Year ended 31 December 2017 KShs’000 KShs’000 KShs’000 KShs’000
Arising from:
Property and equipment 7,699 26,064 5,096 38,859
Net deferred income tax asset 7,699 26,064 5,096 38,859

Stanbic Holdings Plc Financial statements For the year ended 31 December 2017
109
Notes (continued)
35 (d) Deferred income tax asset/(liability) (continued)
Charge/
(Credited) Credited
1.1.2016 to statement of profit or
loss
to OCI 31.12.2016
Year ended 31 December 2016 KShs’000 KShs’000 KShs’000 KShs’000
Arising from:
Property and equipment - 7,699 - 7,699
Net deferred income tax asset - 7,699 - 7,699
36 Notes to the cash flow statement
(a) Reconciliation of profit before income tax to net cash generated from operating activities
Group Company
2017 2016 2017 2016
Kshs'000 Kshs'000 Kshs'000 Kshs'000
Net income before income tax 5,401,248 6,049,086 1,878,230 2,839,223
Adjusted for:
- Depreciation - property and equipment (Note 26) 377,316 346,980 - -
- Amortisation of intangible assets (Note 28) 232,663 167,568 - -
- Amortisation of prepaid operating lease (Note 27) 2,954 2,952 - -
- Impairment - property and equipment (Note 13) - 76,853 - -
- Change in fair value of derivatives (Note 31) (552,410) 1,604,628 - -
- Share based payment reserve (Note 41) 2,143 1,098 - -
- Hyperinflation (5,497) - - -
- Loss on disposal of property and equipment 3,341 7,399 - -
Cash flow from operating activities 5,461,758 8,256,564 1,878,230 2,839,223
(b) Analysis of balances of cash and cash equivalents as shown in the statement of cash flows
Group Company
2017 2016 2017 2016
Kshs'000 Kshs'000 Kshs'000 Kshs'000
Unrestricted cash and balances with CBK (Note 19) 3,704,261 2,561,793 - -
Treasury bills 14,852,342 8,934,432 - -
Loans and advances to banks (Note 23 (a)) 12,743,630 16,988,881 111,803 100,662
Amounts due to other banks (Note 32 (a)) (5,443,779) (3,499,101) - -
Cash and cash equivalent at the end of the year 25,856,454 24,986,005 111,803 100,662

Stanbic Holdings Plc Financial statements For the year ended 31 December 2017
110
Notes (continued) 36. Notes to the cash flow statement (continued)
(b) Analysis of balances of cash and cash equivalents as shown in the statement of cash flows
(continued)
For the purposes of the statement of cash flows, cash equivalents include short term liquid investments which
are readily convertible into known amounts of cash and which were within three months of maturity when
acquired, less advances from banks repayable within three months from the date of the advances.
37 Fair value of financial instruments
Valuation process
All financial instruments carried at fair value, regardless of classification, are marked to market using models that
have been validated independently by the Group’s model validation unit and approved by the market risk
methodologies committee. This control applies to both off-the-shelf models as well as those developed internally
by the Group. Further, all inputs into the valuation models are subject to independent price validation procedures
carried out by the market risk unit. Such price validation is performed on at least a monthly basis and daily where
possible given the liquidity of the underlying price inputs. Less liquid risk drivers, which are typically used to mark
level 3 assets and liabilities to market, are carefully validated and tabled at the monthly price validation forum to
ensure these are reasonable and used consistently. Sensitivities arising from exposures to such drivers are
similarly scrutinised, together with movements in level 3 fair values. They are also disclosed monthly to the
market risk committee and ALCO.
Level hierarchy
The table that follows analyses financial instruments carried at fair value, by level of fair value hierarchy. The
different levels are based on the extent that available market data is used in the calculation of the fair value of
the financial instruments. The levels have been defined as follows:
Level 1 – fair value is based on quoted market prices (unadjusted) in active markets for identical instruments.
Level 2 – fair value is determined through valuation techniques based on observable inputs, either directly, such
as quoted prices, or indirectly, such as derived from quoted prices. This category includes instruments valued
using quoted market prices in active markets for similar instruments, quoted prices for identical or similar
instruments in markets that are considered less than active or other valuation techniques where all significant
inputs are directly or indirectly observable from market data.
Level 3 – fair value is determined through valuation techniques using significant unobservable inputs. This
category includes all instruments where the valuation technique includes inputs not based on observable data
and the unobservable inputs have a significant effect on the instrument’s valuation. This category includes
instruments that are valued based on quoted prices for similar instruments where significant unobservable
adjustments or assumptions are required to reflect differences between the assets and liabilities.
Significant unobservable inputs The fair value of level 3 assets and liabilities is determined using valuation techniques that include reference to recent arm’s length transactions, discounted cash flow analyses, pricing models and other valuation techniques commonly used by market participants. However, such techniques typically have unobservable inputs that are subject to management judgement. These inputs include credit spreads on illiquid issuers, implied volatilities on thinly traded stocks, correlation between risk factors, prepayment rates and other illiquid risk drivers. Exposure to such illiquid risk drivers is typically managed by:
• using bid-offer spreads that are reflective of the relatively low liquidity of the underlying risk driver
• raising day one profit provisions in accordance with IFRS
• quantifying and reporting the sensitivity to each risk driver
• limiting exposure to such risk drivers and analysing this exposure on a regular basis.
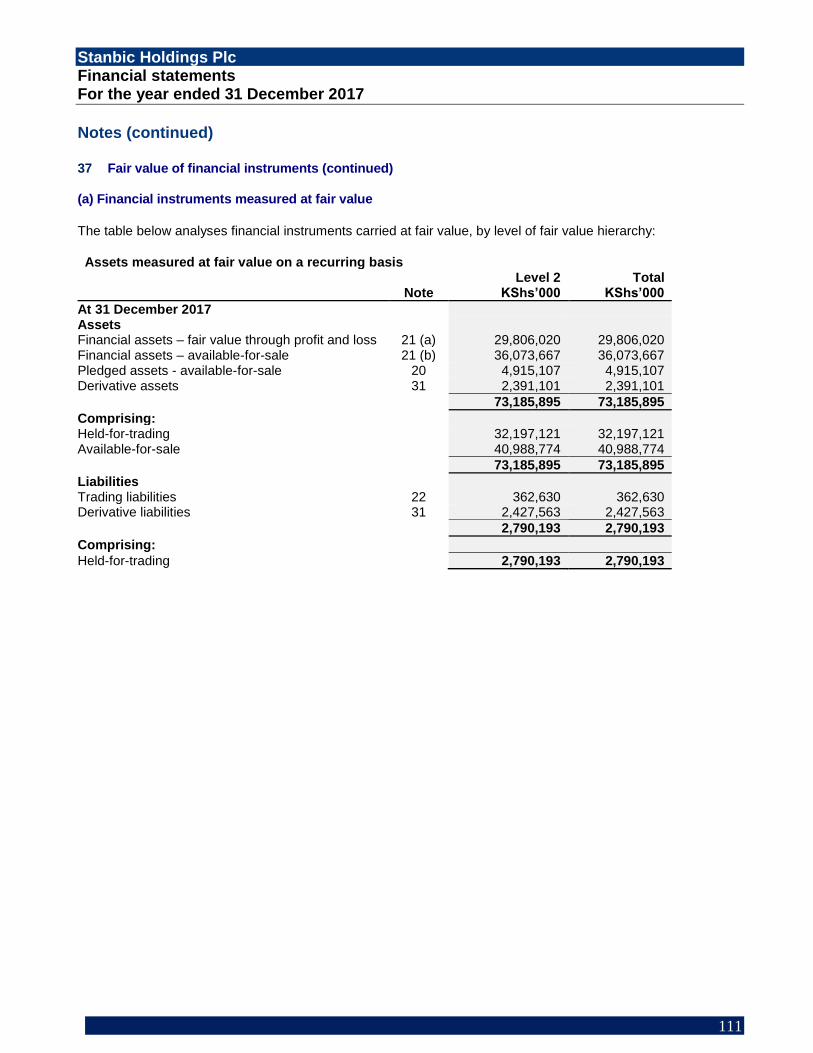
Stanbic Holdings Plc Financial statements For the year ended 31 December 2017
111
Notes (continued) 37 Fair value of financial instruments (continued) (a) Financial instruments measured at fair value
The table below analyses financial instruments carried at fair value, by level of fair value hierarchy:
Assets measured at fair value on a recurring basis
Level 2 Total
Note KShs’000 KShs’000
At 31 December 2017
Assets
Financial assets – fair value through profit and loss 21 (a) 29,806,020 29,806,020 Financial assets – available-for-sale 21 (b) 36,073,667 36,073,667 Pledged assets - available-for-sale 20 4,915,107 4,915,107 Derivative assets 31 2,391,101 2,391,101
73,185,895 73,185,895
Comprising:
Held-for-trading
32,197,121 32,197,121
Available-for-sale
40,988,774 40,988,774
73,185,895 73,185,895
Liabilities
Trading liabilities 22 362,630 362,630 Derivative liabilities 31 2,427,563 2,427,563
2,790,193 2,790,193
Comprising:
Held-for-trading
2,790,193 2,790,193

Stanbic Holdings Plc Financial statements For the year ended 31 December 2017
112
Notes (continued)
37 Fair value of financial instruments (continued)
(a) Financial instruments measured at fair value (continued)
Assets measured at fair value on a recurring basis
Level 2 Total
Note KShs’000 KShs’000
At 31 December 2016
Assets
Financial assets – fair value through profit and loss 21 (a) 15,995,194 15,995,194 Financial assets – available-for-sale 21 (b) 34,037,538 34,037,538 Pledged assets - available-for-sale 20 2,894,456 2,894,456 Derivative assets 31 2,472,191 2,472,191
55,399,379 55,399,379
Comprising:
Held-for-trading
18,467,385 18,467,385
Available-for-sale
36,931,994 36,931,994
55,399,379 55,399,379
Liabilities
- - Trading liabilities 22 3,867,718 3,867,718 Derivative liabilities 31 3,061,063 3,061,063
6,928,781 6,928,781
Comprising:
Held-for-trading
6,928,781 6,928,781
There were no financial assets measured at fair value in level 3 as at 31 December 2017 and 31 December 2016.
There were no transfers between financial assets and fair value hierarchy in the year 2017 and 2016.
Financial instruments in level 1
The fair value of financial instruments traded in active markets is based on quoted market prices at the
balance sheet date. A market is regarded as active if quoted prices are readily and regularly available
from an exchange, dealer, broker, industry group, pricing service, or regulatory agency, and those
prices represent actual and regularly occurring market transactions on an arm’s length basis. The
quoted market price used for financial assets held by the Group is the current bid price. These
instruments are included in level 1. Instruments included in level 1 comprise primarily of cash and
subordinated debt listed on the Nairobi Securities Exchange (NSE).

Stanbic Holdings Plc Financial statements For the year ended 31 December 2017
113
Notes (continued) 37 Fair value of financial instruments (continued) (a) Financial instruments measured at fair value (continued)
Sensitivity of fair value of level 2 financial instruments
The fair value of level 2 financial instruments is determined using valuation techniques which
incorporate assumptions that are not supported by prices from observable current market transactions
in the same instruments and are not based on available observable market data. Such assumptions
include risk premiums, liquidity discount rates, credit risk, volatilities and correlations. Changes in these
assumptions could affect the reported fair values of these financial instruments.
Level 2 financial assets and financial liabilities Valuation basis/technique Main assumptions1
Derivative instruments Discounted cash flow model Discount rate
Black-Scholes model Risk-free rate, volatility rate
Multiple valuation technique Valuation multiples
Trading assets Discounted cash flow model Discount rate, liquidity discount rate
Black-Scholes model Risk-free rate, volatility rate
Pledged assets Discounted cash flow model Discount rate, liquidity discount rate
Financial investments Discounted cash flow model Discount rate, liquidity discount rate
Multiple valuation technique Valuation multiples
Quoted exit price adjusted for notice period
Discount rate
Loans and advances to customers Discounted cash flow model Discount rate, liquidity discount rate
Trading liabilities Discounted cash flow model Discount rate, liquidity discount rate
Deposits from Banks Discounted cash flow model Discount rate, liquidity discount rate
Deposits from customers Discounted cash flow model Discount rate, liquidity discount rate
Other financial liabilities Discounted cash flow model Discount rate, liquidity discount rate
(b) Financial instruments not measured at fair value
Cash and balances with Central Bank of Kenya (CBK)
The carrying amount of cash and balances with CBK is a reasonable approximation of fair value
Loans and advances to banks
Loans and advances to banks include inter-bank placements and items in the course of collection.
The carrying amount of floating rate placements and overnight loans is a reasonable approximation of
fair value. The estimated fair value of fixed interest-bearing loans is based on discounted cash flows
using prevailing money-market interest rates for debts (ranging from 9% to 11.75%) with similar credit
risk and remaining maturity.
1 The main assumptions for all instruments include applicable credit spreads.
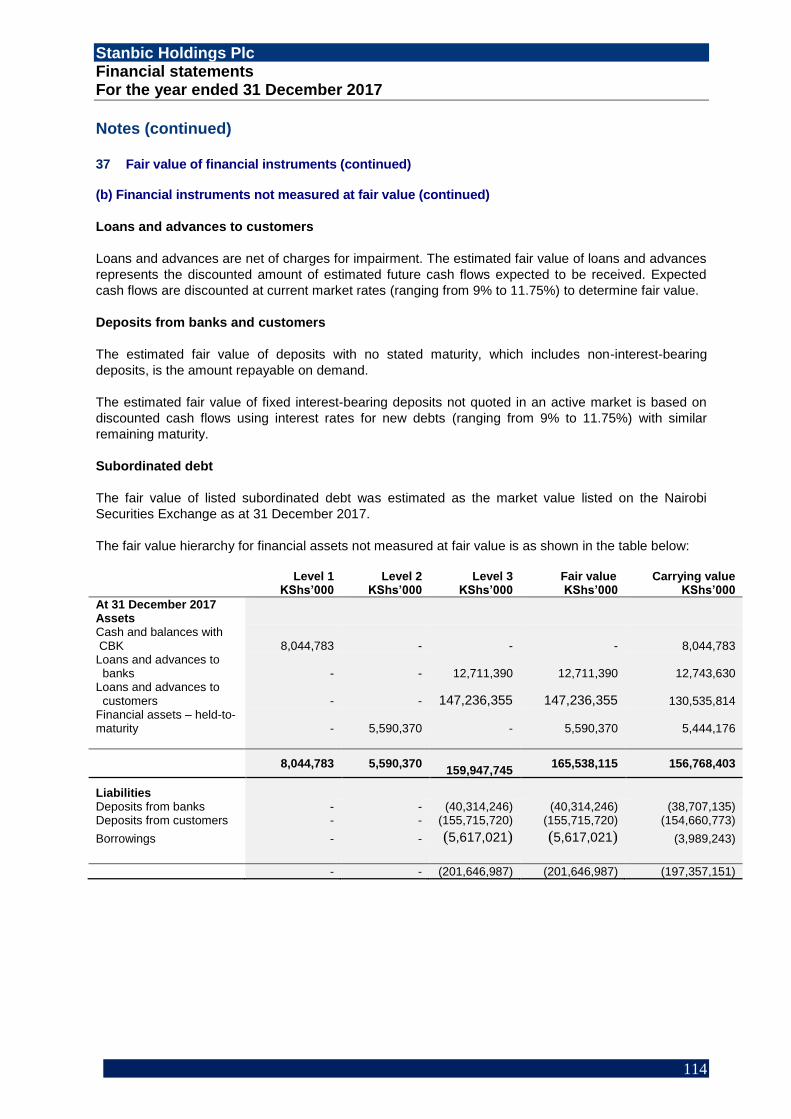
Stanbic Holdings Plc Financial statements For the year ended 31 December 2017
114
Notes (continued) 37 Fair value of financial instruments (continued) (b) Financial instruments not measured at fair value (continued)
Loans and advances to customers
Loans and advances are net of charges for impairment. The estimated fair value of loans and advances
represents the discounted amount of estimated future cash flows expected to be received. Expected
cash flows are discounted at current market rates (ranging from 9% to 11.75%) to determine fair value.
Deposits from banks and customers
The estimated fair value of deposits with no stated maturity, which includes non-interest-bearing
deposits, is the amount repayable on demand.
The estimated fair value of fixed interest-bearing deposits not quoted in an active market is based on
discounted cash flows using interest rates for new debts (ranging from 9% to 11.75%) with similar
remaining maturity.
Subordinated debt
The fair value of listed subordinated debt was estimated as the market value listed on the Nairobi
Securities Exchange as at 31 December 2017.
The fair value hierarchy for financial assets not measured at fair value is as shown in the table below:
Level 1 Level 2 Level 3 Fair value Carrying value
KShs’000 KShs’000 KShs’000 KShs’000 KShs’000
At 31 December 2017 Assets Cash and balances with CBK 8,044,783 - - - 8,044,783 Loans and advances to banks - -
12,711,390
12,711,390 12,743,630
Loans and advances to customers - - 147,236,355 147,236,355 130,535,814 Financial assets – held-to-maturity - 5,590,370 - 5,590,370 5,444,176
8,044,783 5,590,370
159,947,745
165,538,115 156,768,403
Liabilities Deposits from banks - - (40,314,246) (40,314,246) (38,707,135) Deposits from customers - - (155,715,720) (155,715,720) (154,660,773)
Borrowings - - (5,617,021) (5,617,021) (3,989,243)
- - (201,646,987) (201,646,987) (197,357,151)

Stanbic Holdings Plc Financial statements For the year ended 31 December 2017
115
Notes (continued) 37 Fair value of financial instruments (continued)
(b) Financial instruments not measured at fair value (continued)
The valuation techniques used in determining the fair value of financial assets and liabilities classified within level 2 and level 3. The table below indicates the valuation techniques and main assumptions used in the determination of the fair value of the level 2 and level 3 assets and liabilities not measured at fair value but for which fair value is disclosed: Valuation basis/technique Main assumptions
Loans and advances to banks Discounted cash flow model Discount rate, liquidity discount rate Loans and advances to
customers Discounted cash flow model Discount rate, liquidity discount rate
Deposits from banks Discounted cash flow model Discount rate, liquidity discount rate Deposits from customers Discounted cash flow model Discount rate, liquidity discount rate Subordinated debt Discounted cash flow model Discount rate, liquidity discount rate
There were no transfers between financial assets and fair value hierarchy in the year 2017 and 2016.
Level 1 Level 2 Level 3 Fair value
Carrying value
KShs’000 KShs’000 KShs’000 KShs’000 KShs’000
At 31 December 2016
Assets Cash and balances with
CBK 8,621,228 - - 8,621,228 8,621,228 Loans and advances to
banks - - 17,372,706 17,372,706 16,988,881
Loans and advances to customers - - 132,057,370 132,057,370 115,587,723
8,621,228 - 149,430,076 149,430,076 141,197,832
Liabilities
Deposits from banks - 28,864,081 28,864,081 36,506,824
Deposits from customers - 111,039,158 111,039,158 119,328,219
Subordinated debt - - 6,095,080 6,095,080 3,986,138
129,062,093 - 16,936,226 145,998,319 159,821,181
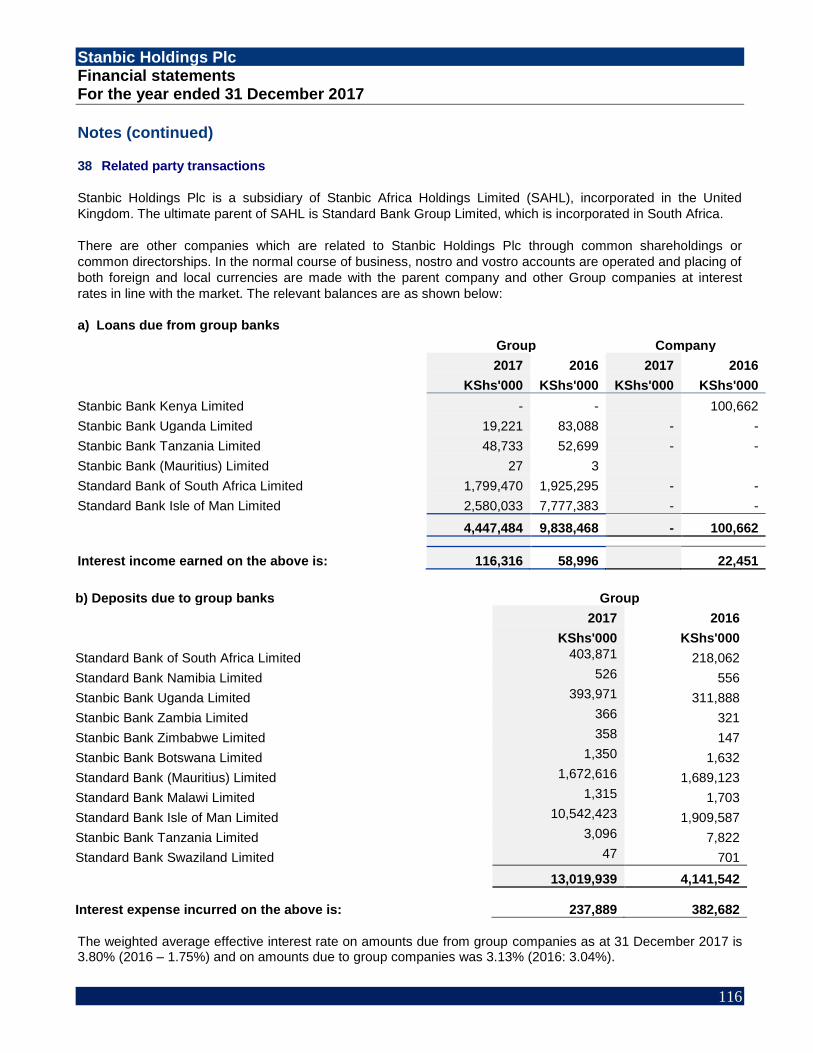
Stanbic Holdings Plc Financial statements For the year ended 31 December 2017
116
Notes (continued)
38 Related party transactions
Stanbic Holdings Plc is a subsidiary of Stanbic Africa Holdings Limited (SAHL), incorporated in the United
Kingdom. The ultimate parent of SAHL is Standard Bank Group Limited, which is incorporated in South Africa.
There are other companies which are related to Stanbic Holdings Plc through common shareholdings or
common directorships. In the normal course of business, nostro and vostro accounts are operated and placing of
both foreign and local currencies are made with the parent company and other Group companies at interest
rates in line with the market. The relevant balances are as shown below:
a) Loans due from group banks
Group Company
2017 2016 2017 2016
KShs'000 KShs'000 KShs'000 KShs'000
Stanbic Bank Kenya Limited - - 100,662
Stanbic Bank Uganda Limited 19,221 83,088 - -
Stanbic Bank Tanzania Limited
48,733 52,699 - -
Stanbic Bank (Mauritius) Limited 27 3
Standard Bank of South Africa Limited
1,799,470 1,925,295 - -
Standard Bank Isle of Man Limited
2,580,033 7,777,383 - -
4,447,484 9,838,468 - 100,662
Interest income earned on the above is: 116,316 58,996
22,451
b) Deposits due to group banks Group
2017 2016
KShs'000 KShs'000
Standard Bank of South Africa Limited
403,871 218,062
Standard Bank Namibia Limited
526 556
Stanbic Bank Uganda Limited
393,971 311,888
Stanbic Bank Zambia Limited
366 321
Stanbic Bank Zimbabwe Limited
358 147
Stanbic Bank Botswana Limited
1,350 1,632
Standard Bank (Mauritius) Limited
1,672,616 1,689,123
Standard Bank Malawi Limited
1,315 1,703
Standard Bank Isle of Man Limited
10,542,423 1,909,587
Stanbic Bank Tanzania Limited
3,096 7,822
Standard Bank Swaziland Limited
47 701
13,019,939 4,141,542
Interest expense incurred on the above is: 237,889 382,682
The weighted average effective interest rate on amounts due from group companies as at 31 December 2017 is 3.80% (2016 – 1.75%) and on amounts due to group companies was 3.13% (2016: 3.04%).

Stanbic Holdings Plc Financial statements For the year ended 31 December 2017
117
Notes (continued)
38. Related party transactions (continued)
c) Deposits due to group companies non-bank Heritage
479,109 110,147
Stanblib Kenya Limited 150,296 - Liberty Life
110,851 2,015
740,256 112,162
(d) Key management compensation
Key management personnel include: the members of the Stanbic Holdings Plc board of directors and prescribed officers effective for 2017 and 2016. Non-executive directors are included in the definition of key management personnel as required by IAS 24 Related Party Disclosures. The definition of key management includes the close family members of key management personnel and any entity over which key management exercise control or joint control. Close members of family are those family members who may be expected to influence, or be influenced by that person in their dealings with the Group. They include the person’s domestic partner and children, the children of the person’s domestic partner, and dependants of the person or the person’s domestic partner.
Key management have transacted with the Group as indicated in note 38 (e) and 38 (f);
e) Loans and advances
Included in loans and advances are amounts advanced to certain companies in which directors are involved
either as shareholders or directors (associated companies). In addition, there are contingent liabilities including
guarantees and letters of credit, which have been issued to associated companies. The balances as at 31
December 2017 and 31 December 2016 are as shown below:
Loans and advances to key management
The aggregate amount of loans to directors, affiliates and their families on the statement of financial position is Kshs 588,641,000 (2016: KShs 369,256,000).
No specific credit impairments have been recognised in respect of loans granted to key management (2016:
KShs nil). The mortgage loans and instalment sale and finance leases are secured by the underlying assets. All
other loans are unsecured.

Stanbic Holdings Plc Financial statements For the year ended 31 December 2017
118
Notes (continued)
38. Related party transactions (continued)
f) Key management compensation
Group Company
2017 2016 2017 2016
KShs'000 KShs'000 KShs'000 KShs'000
Fees for services as a director
36,947 37,895 7,165 8,800
Salaries and other short-term employment benefits 87,872 127,680 - -
Post-employment pension 3,036 2,748 - -
Share-based payments
15,864 13,104 - -
143,719 181,427 7,165 8,800
g) Other receivable due from related companies
Group
2017 2016
KShs'000 KShs'000
Liberty Life Assurance Limited 172 1,580
The Heritage Insurance Company Limited
- 175
Standard Bank Jersey Limited
3,017 4,543
Stanbic Bank Uganda Limited
12,177 9,394
Stanbic Bank Tanzania Limited
297,735 297,920
Standard Bank of South Africa Limited
265,678 925,228
Stanbic Bank Zambia Limited
- 1,265
Standard Bank Malawi Limited
3,199 630
Standard Bank RDC SARL
655 412
Standard Bank Isle of Man Limited
1,872 500
Standard Bank Swaziland Limited
- 332
Standard Bank de Angola S.A.
27,040 23,156
Standard Advisory London Limited
- 99
611,545 1,265,234
Provisions on regional costs balances
(275,290) (276,159)
Net receivables due from related companies
336,255 989,075

Stanbic Holdings Plc Financial statements For the year ended 31 December 2017
119
Notes (continued)
38. Related party transactions (continued) h) Other payables due to related companies
Group Company 2017 2016 2017 2016 KShs’000 KShs’000 KShs’000 KShs’000
Stanbic Bank Kenya Limited - - 8,675 1,550 Standard Bank Malawi Limited 1,353 3,185 - - Standard Bank of South Africa Limited 458,654 987,264 - - Stanbic Bank Uganda Limited 2,384 1,025 - - Stanbic Bank Tanzania Limited 816 816 - - Stanbic Bank Jersey Limited 162 - - - 463,369 992,290 8,675 1,550
There is no interest accruing for these outstanding liabilities i) The Group incurred the following related party expenses payable to Standard Bank of South Africa:
2017 2016
Kshs’000 Kshs’000
Standard Bank South Africa
Franchise fees 551,226
540,690
Information technology 93,963
27,771
Other operating costs 67,327
3,627
712,516
572,088
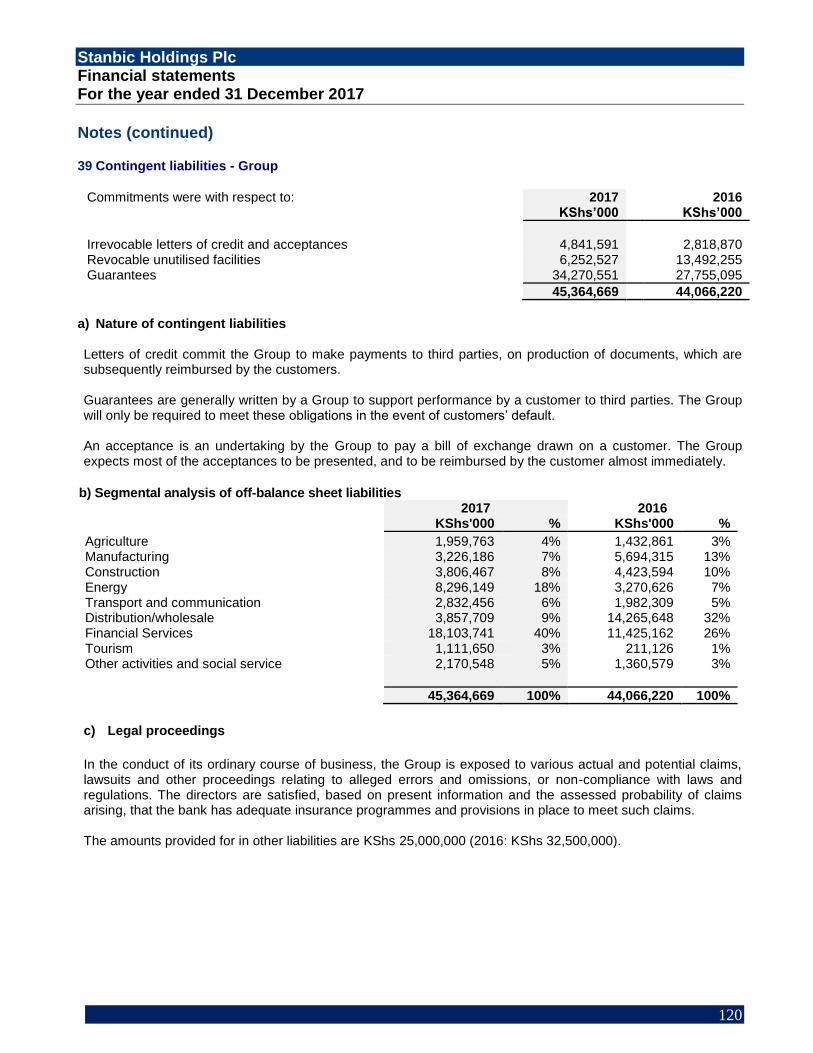
Stanbic Holdings Plc Financial statements For the year ended 31 December 2017
120
Notes (continued)
39 Contingent liabilities - Group
Commitments were with respect to: 2017 2016 KShs’000 KShs’000
Irrevocable letters of credit and acceptances 4,841,591
2,818,870
Revocable unutilised facilities 6,252,527
13,492,255 Guarantees 34,270,551
27,755,095
45,364,669
44,066,220
a) Nature of contingent liabilities Letters of credit commit the Group to make payments to third parties, on production of documents, which are subsequently reimbursed by the customers. Guarantees are generally written by a Group to support performance by a customer to third parties. The Group will only be required to meet these obligations in the event of customers’ default. An acceptance is an undertaking by the Group to pay a bill of exchange drawn on a customer. The Group expects most of the acceptances to be presented, and to be reimbursed by the customer almost immediately.
b) Segmental analysis of off-balance sheet liabilities
2017 2016
KShs'000 % KShs'000 %
Agriculture 1,959,763 4% 1,432,861 3% Manufacturing 3,226,186 7% 5,694,315 13% Construction 3,806,467 8% 4,423,594 10% Energy 8,296,149 18% 3,270,626 7% Transport and communication 2,832,456 6% 1,982,309 5% Distribution/wholesale 3,857,709 9% 14,265,648 32% Financial Services 18,103,741 40% 11,425,162 26% Tourism 1,111,650 3% 211,126 1% Other activities and social service 2,170,548 5% 1,360,579 3%
45,364,669 100% 44,066,220 100%
c) Legal proceedings
In the conduct of its ordinary course of business, the Group is exposed to various actual and potential claims, lawsuits and other proceedings relating to alleged errors and omissions, or non-compliance with laws and regulations. The directors are satisfied, based on present information and the assessed probability of claims arising, that the bank has adequate insurance programmes and provisions in place to meet such claims. The amounts provided for in other liabilities are KShs 25,000,000 (2016: KShs 32,500,000).

Stanbic Holdings Plc Financial statements For the year ended 31 December 2017
121
Notes (continued)
40 Other reserves
Group
2017 2016
Note KShs'000 KShs'000
Statutory reserve
(11,112) 54,335
Fair value reserve
448,806 150,161
Foreign currency translation reserve
(1,024,625) (1,099,023)
Share based payment reserve
41 16,017 13,871
Revaluation reserve
122,598 122,598
At end of year
(448,316) (758,058)
The revaluation reserve solely represents the surplus on the revaluation of buildings and freehold land net of deferred income tax. The revaluation reserve arose from the merger of CfC Bank Limited and Stanbic Bank Kenya Limited in 2008. The Group policy was adopted to state all its assets using the historical cost model. No revaluation has been undertaken since the merger. The revaluation reserve is non-distributable. Fair value reserve represents the surplus or losses arising on fair valuation of available-for-sale financial instruments and is non-distributable. Currency translation reserve represents exchange differences arising on the translation of the net investment in foreign entities and is non-distributable. The statutory reserve represents an appropriation from retained earnings to comply with the Central Bank of Kenya’s Prudential Regulations. The balance in the reserve represents the excess of impairment provisions determined in accordance with the Prudential Regulations over the impairment provisions recognised in accordance with the Company’s accounting policy. The reserve is not distributable.
41. Share-based payment reserve
Group 2017 2016
KShs’000 KShs’000
At start of year 13,871 42,393
Options exercised during the year
- (29,620)
Equity growth scheme for the year 2,146 1,098
At end of year 16,017 13,871
The Group's share incentive scheme enables key management personnel and senior employees of the Group to benefit from the performance of SBG shares.
The Group has two equity-settled schemes, namely the Group Share Incentive Scheme and the Equity Growth Scheme. The Group Share Incentive Scheme confers rights to employees to acquire ordinary shares at the value of the SBG share price at the date the option is granted. The Equity Growth Scheme represents appreciation rights allocated to employees. The eventual value of the right is effectively settled by the issue of shares equivalent in value to the value of the rights. The share appreciation rights granted during the year were valued using a Black-Scholes option pricing model. Each grant was valued separately. At 31 December 2017, the total amount included in staff costs for Group Share Incentive Scheme was KShs. 6,085,000 (2016: KShs 793,000) and for Equity Growth Scheme was KShs 3,941,000 (2016: KShs 360,000).

Stanbic Holdings Plc Financial statements For the year ended 31 December 2017
122
Notes (continued) 41. Share-based payment reserve (continued) The two schemes have five different sub-types of vesting categories as illustrated by the table below:
Year % vesting Expiry
Type A 3, 4, 5 50, 75, 100 10 Years
Type B
5, 6, 7 50, 75, 100 10 Years
Type C
2, 3, 4 50, 75, 100 10 Years
Type D
2, 3, 4 33, 67, 100 10 Years
Type E 3, 4, 5 33, 67, 100 10 Years
A reconciliation of the movement of share options and appreciation rights is detailed below:
Option price range
(ZAR) Number of options
Group Share Incentive Scheme 2017 2017 2016
Options outstanding at beginning of the year 117,563 347,783
Transfers 62.39 – 111.94 34,126 (75,876)
Exercised 62.39 – 111.94 (74,750) (115,286)
Lapsed 98.8 (4,688) (39,058)
Options outstanding at end of the year 72,251 117,563
The following options granted to employees had not been exercised at 31 December 2017:
Number of ordinary shares
Option price range (ZAR)
Weighted average price (ZAR) Option expiry period
10,750 104.53 – 111.94 109.27 Year to 31 December 2020
61,501 98.80 - 99.97 98.94 Year to 31 December 2021
72,251

Stanbic Holdings Plc Financial statements For the year ended 31 December 2017
123
Notes (continued) 41. Share-based payment reserve (continued) The following options granted to employees had not been exercised at 31 December 2016:
Number of ordinary shares
Option price range (ZAR)
Weighted average price (ZAR) Option expiry period
5,000 98.00 98.00 Year to 31 December 2017
17,875 92.00 92.00 Year to 31 December 2018
18,750 62.39 62.39 Year to 31 December 2019
34,688 104.53 – 111.94 109.27 Year to 31 December 2020
41,250 98.80 – 99.97 98.94 Year to 31 December 2021
117,563
Appreciation right price range (ZAR)
Number of rights
Equity Growth Scheme 2017 2017 2016
Rights outstanding at beginning of the year 21,375 26,200
Transfers 62.39-111.94 26,013 72,725
Exercised 62.39-105.60 - -
Lapsed (5,575) (77,550)
Rights outstanding at end of the year 41 813 21 375
The following rights granted to employees had not been exercised at 31 December 2017:
Number of rights Option price range
(ZAR) Weighted average
price (ZAR) Option expiry period
1,375 62.39 62.39 Year to 31 December 2019 16,250 105,60 – 111.94 111.45 Year to 31 December 2020 24,188 98.80-96.68 98.54 Year to 31 December 2021
41,813
The following rights granted to employees had not been exercised at 31 December 2016:
Number of rights Option price range
(ZAR) Weighted average
price (ZAR) Option expiry period
5,125 62,39 62.39 Year to 31 December 2019 3,750 105,60 - 111,94 109.83 Year to 31 December 2020
12,500 98,80 98.80 Year to 31 December 2021
21,375

Stanbic Holdings Plc Financial statements For the year ended 31 December 2017
124
Notes (continued) 42. Capital commitments The Group has entered into a number of commercial leases for it premises and office equipment. These leases have an average life of between six years with a renewal option included in the contracts. There are no restrictions placed upon the lessee by entering into these leases such as those concerning dividends or additional debt. Capital commitments for the acquisition of property and equipment are summarised below:
2017 2016
KShs’000 KShs’000
Authorised and contracted for 237,506 388,948
Authorised but not contracted for 704,750 -
43. Operating leases The Group has entered into a number of commercial leases for its premises and office equipment under operating leases. These leases have an average life of between six years with a renewal option included in the contracts. There are no restrictions placed upon the lessee by entering into these leases such as those concerning dividends or additional debt. At 31 December, the future minimum lease payments under non-cancellable operating leases were payable as follows; 2017 2016
KShs’000 KShs’000
Less than one year 260,421 285,375 Between one and five years 788,827 882,767 More than five years 9,852 2,157,668
1,059,100 3,325,810
44. Fiduciary activities The assets held on behalf of individuals, trusts, retirement benefit plans and other institutions: 2017 2016 KShs’000 KShs’000
Assets held on behalf of individual’s trusts and other institutions 266,101,243 214,868,507
---000---