Ethics of Randomized Clinical Trial - University of Manitoba

Evaluation of Stalosan F, Vilomin ZLL and X-Zelit on Commercial Dairy Farms
in Trakia, under Turkey Condition
Prof. Dr. Alper ÖNENÇ
Animal Science Dept, Agriculture Fac.
Namık Kemal University, Tekirdağ, TURKEY

Commercial dairy farms in Trakya region are faced to high somatic cell count related with subclinic mastitis. Also hypocalcaemia is most common metabolic disorder.
Objectives
For minimizing these problems, it is important to research alternatives solutions under Turkish conditions.
With this approach, keeping dry bedding area and increase immunity towards infectious may accepted effective methods.
In this study, the effects of Stalosan (effective hygiene product for eleminating the growth of bacteria, fungi, viruses, fly larvae and coccidia) and Vilomix (feed additive for improving animal immune system) on somatic cell count were investigated.
To reduce hypocalcaemia risk for cow in early lactation, x-zelit was used in dry cow prior 14 days to gestation.

Materials and Methods

The farms were selected by the research team and with Witfoss field stuff. Field stuff gave a seminer on products to the technical stuff of two farm. After determining
experimental design and number of animals, pre-studies were carried out in two farms and labour traffic and daily work routine and sampling date were determined.

Experiments were conducted at two Commercial Dairy Farms
• Doğamar farm
• Ertan farm
3500 head cattle capacity1000 head cattle capacity

Doğamar farm
Selecting barn for trial
Application
Randomizing animals
Determining cows in Control and Treatment groups
Sampling for tank milk
Scoring the locomotion
Assigning new borned calves to groups
Scoring the fecal fluidity
Recording diarrea case
Flowchart of study plan in Doğamar Farm
the study was set on the barn where the most hoof and mastitis problem were exist.
Groups Number of cows
Control 40Stalosan 40
Groups Number of calves
Control 10Stalosan 10
A total of 80 cows used in trial. For cows in treatment groups

Stalosan application on bed using atomizer/ spreader

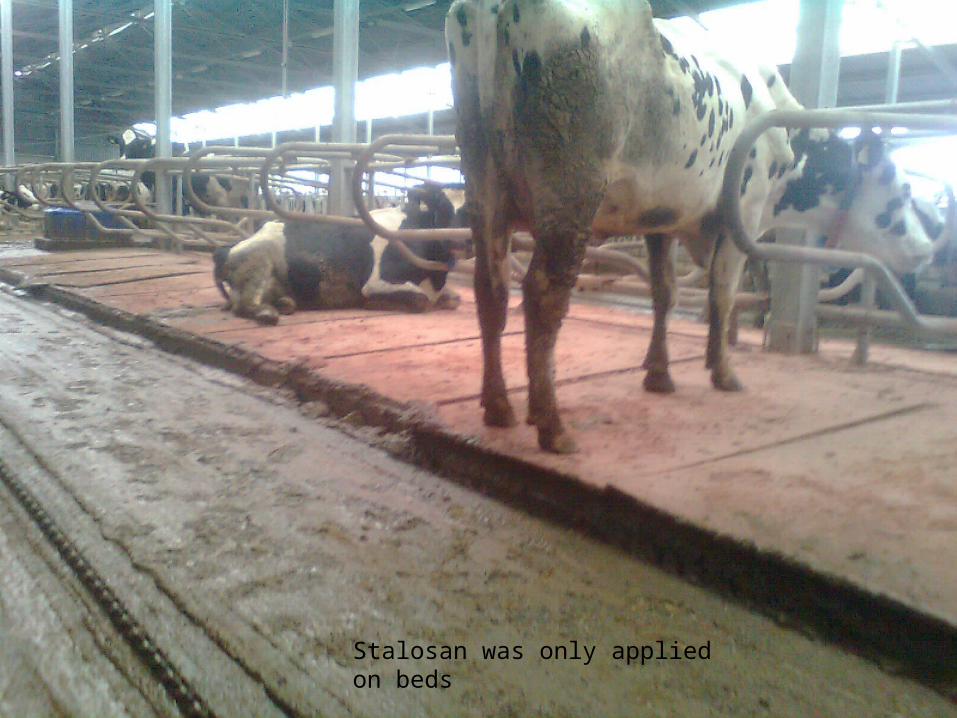
Stalosan was only applied on beds

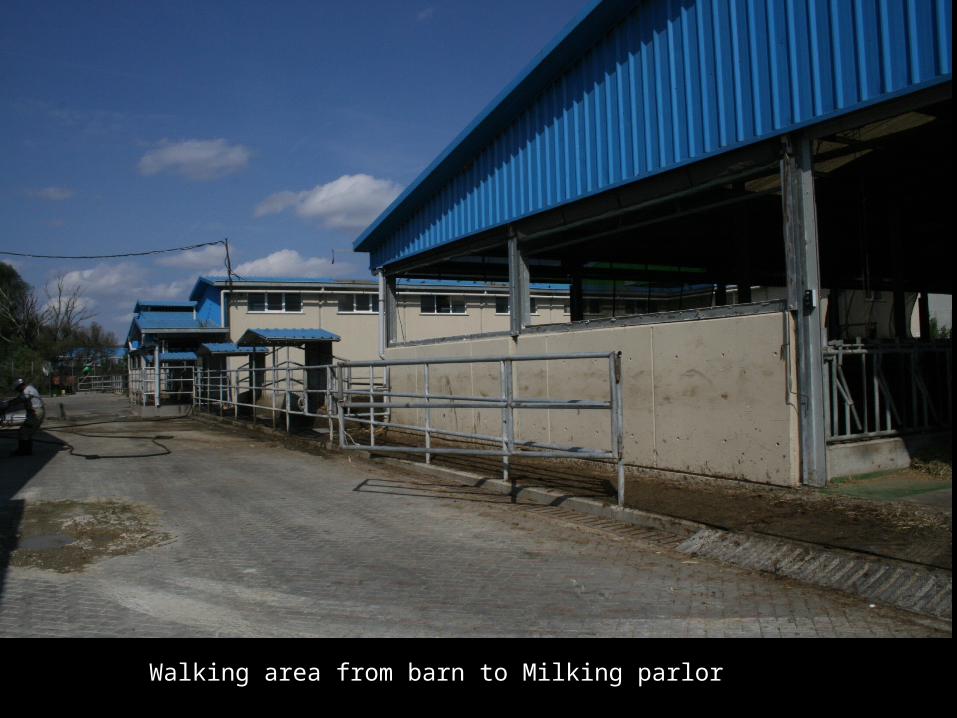
Walking area from barn to Milking parlor


Milking system (2x12)

Calf unit in farm

Stalosan application on calf pen


Ertan farm
Selecting barns for trial
Application
Randomizing animals
Determining cows in Control and Treatments
Control, Stalosan, Vilomin ZLL, S+V
Sampling milk
SCC and milk pH measurement
Determining cows in Control and Treatment
Control, X-Zelit
Sampling blood
Serum Ca level analysis
Waiting 1 lactation periodTermal image from mammary gland
Groups Number of cowsControl 40Stalosan 40Vilomin ZLL 40Stalosan+Vilomix 40
Groups Number of cows
Observation number for milk sample and
thermal imagerControl 40 20
X-Zelit 40 20

Dairy cows barns of Ertan farm

Control group: farm standard program was applied to dairy cows.

Stalosan (on right) and S+V groups (on left)
Animal in group 1: Stalosan was applied to bed and manure alleyAnimal in group 2: Stalosan was applied to bed and manure alley and Vilomin ZLL was added to TMR

Vilomin ZLL group
Animal in group 3: Vilomix was added to TMR
Vilomin ZLL was served animal 200g/head/day in the first ten days and 100g/head/day in the second ten days with TMR.

Stalosan application in barns
Stalosan F was applied to stalls, manure alley, area of waterer on days of 1, 2, 3, 10, 17, 24 and 31 with 50 g/m2


For determination SCC milk samples were taken from the tank five times at seven days intervals and analyzed using De Laval SCC device

Group control and milk sampling
.Individual milk samples were taken manually from each quarter of the same 40 cows randomized selected for each group after teats are cleaned with a firmly wrung cotton cloth and the first squirt of milk is discarded, final of
the milking.
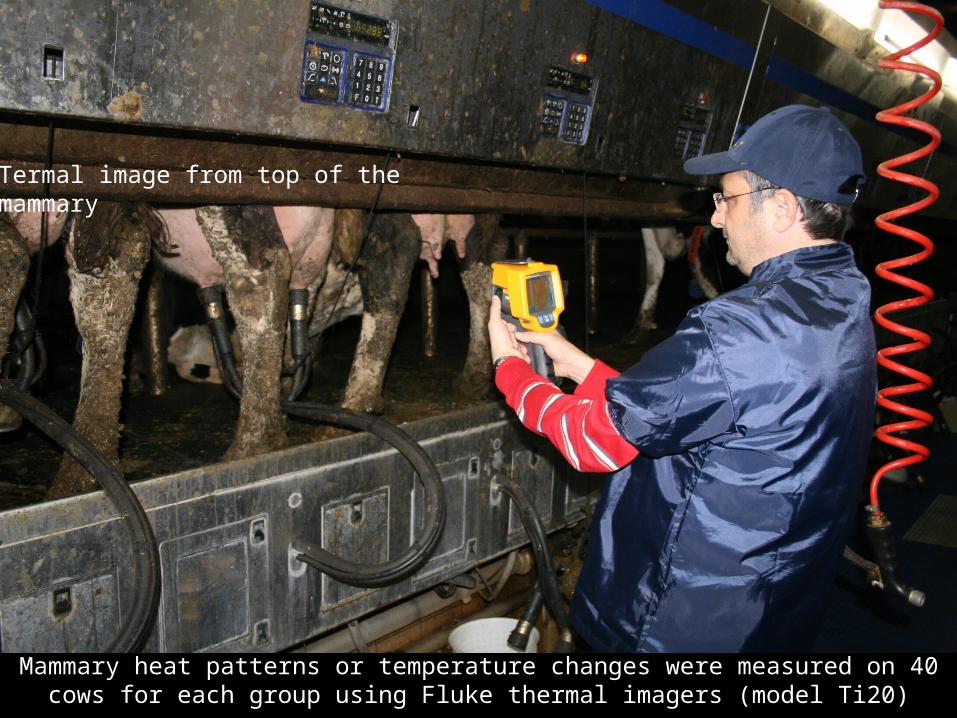
Termal image from top of the mammary
Mammary heat patterns or temperature changes were measured on 40 cows for each group using Fluke thermal imagers (model Ti20)

Loaded images to computer
images were loaded to computer and analyzed using SmartView 3.1.89 Insight packet programme

Images were analyzed using SmartView 3.1.89 Insight packet programme

Groups Number of cows
Observation number for milk sample and
thermal imagerControl 40 20X-Zelit 40 20
To test the X-Zelit, fourty dairy cows at second lactations divided
into two groups (control and treatment). X-Zelit was given to
animals 500g per day at the period of 14 days before calving.
Two parallel blood samples were taken from cow was taken before calving at 5, 10 days and at calving day and after calving at 5 and 10 days. Serum Ca level
was determined by using Clinical Analyzer wit test kit
Reproduction and milk parameters were calculated after lactation period from herd management software system. These some of parameters are; service
period, calving interval, calving difficulty, mortality, hypocalcaemia and ketosis cases, 100 and 305 day lactation yields.

Results

Dogamar Farm Results

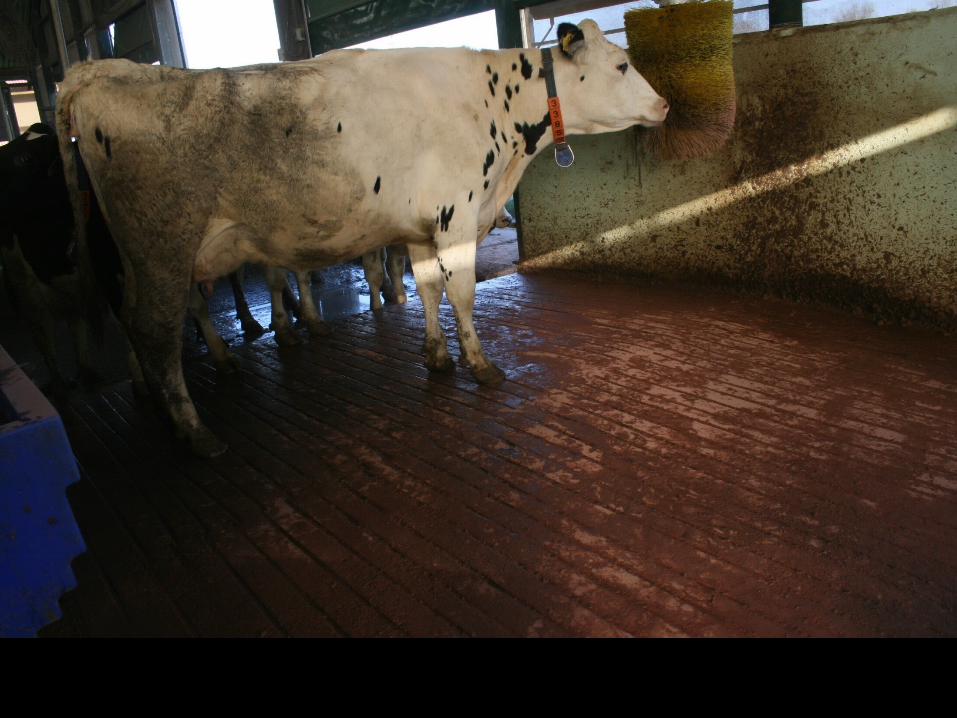
After Stalosan application, teats surface did not touch by wet materials

493512463
579
400
546
372
588
354
1298
0
200000
400000
600000
800000
1000000
1200000
1400000
Ta
nk
so
ma
tic
ce
ll c
ou
nt
Initial Period 1 Period 2 Period 3 Period 4
Control Stalosan
Group Somatic cell count
Control 752.750
Stalosan 397.259
P 0,05
During all trial period. SCC mean of all trial period in stalosan group was approximately 2 times lower than control group
The study showed that Stalosan has affected the tank SCC during all trial period.

Cows in stalosan group hooves were covered with powder and did not touch so much by manure and wet surface

2,95 3,00 3,05
2,40
0
1
2
3
4
5
Lo
co
mo
tio
n s
co
re (
sc
ale
1 -
5)
Initial Final
Control Stalosan
After 30 days stalosan application, it was shown that locomotion scores were improved compared to control group
Decrease in locomotion score was 0.60 in stalosan group. However locomotion score had a tendency to increase in control group

Cow preferred to stay more time on beds after feeding

Cow spended more time lying on beds after feeding

The bed was dry and clean in calf pen after Stalosan application

2,65 2,602,70
2,35
2,65
2,252,50
2,05
0
1
2
3
4
Fe
ca
l flu
idit
y s
co
re (
sc
ale
1 -
4)
Initial 5d 15d 25d
Control Stalosan
During the trial, severe diarrea rate was %30, %10 and %5 for control group in period 1, 2 and 3 respectively. Severe diarrea incidence did not observed in stalosan group
during trial.
Average fecal fluidity scores of calves descreased from the initial until final of the trial
Fecal fluidity score in stalosan group were significantly lower than those of calves on control for period 3

Ertan Farm Results
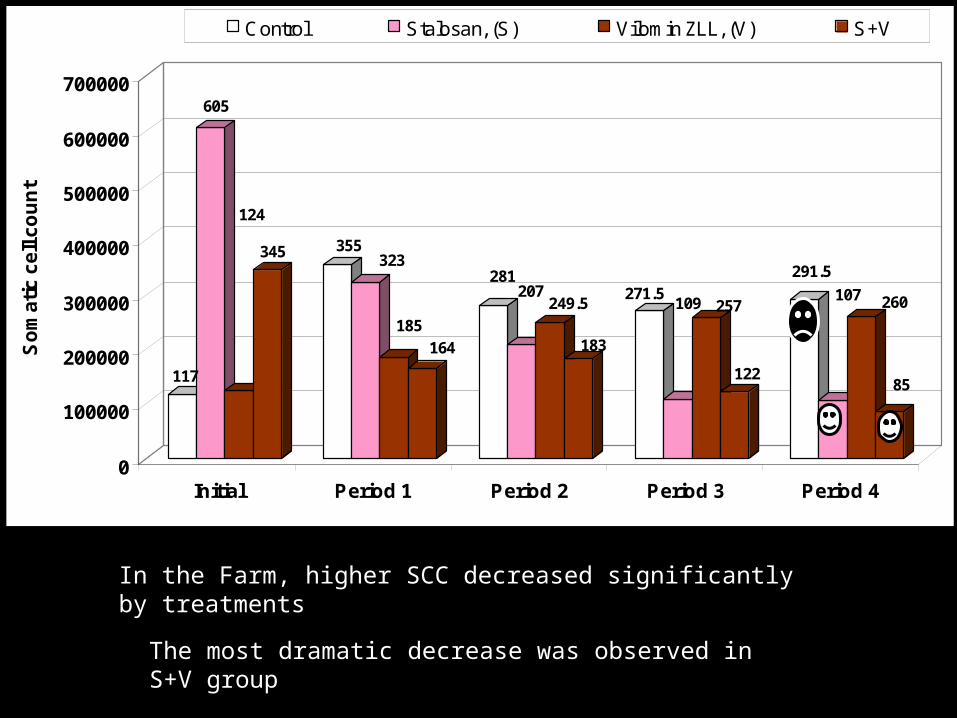
117
605
124
345 355323
185164
281207
249.5
183
271.5109 257
122
291.5
107 260
85
0
100000
200000
300000
400000
500000
600000
700000
So
ma
tic
ce
ll c
ou
nt
Initial Period 1 Period 2 Period 3 Period 4
Control Stalosan, (S) Vilomin ZLL, (V) S+V
In the Farm, higher SCC decreased significantly by treatments
The most dramatic decrease was observed in S+V group

6,99
6,85
6,81
6,98
6,84
6,65
6,75
6,636,72
6,61
6,656,57
6,82
6,62
6,78
6,62
6,78
6,55
6,586,52
5,00
5,50
6,00
6,50
7,00
Milk
pH
Initial Period 1 Period 2 Period 3 Period 4
Control Stalosan, (S) Vilomin ZLL, (V) S+V
Milk pH is the other parameters show the mastitis incidence
At the end of the four weeks, milk pH value closed to ideal limits in.stalosan and S+V groups

27,1
25,0
26,6
26,2
26,3
27,2
27,2
27,5
26,0
27,8
27,3
27,5
26,3
28,9
27,6
30,1
25,2
29,4
27,3
30,2
0,00
5,00
10,00
15,00
20,00
25,00
30,00
35,00
Av
era
ge
da
ily m
ilk y
ield
, kg
Initial Period 1 Period 2 Period 3 Period 4
Control Stalosan, (S) Vilomin ZLL, (V) S+V
In the study, average daily milk production of each treatment group was obtained for each trial period.
According to data, it is seen that cows in three treatmens produced more milk than control. Among treatments, average daily milk per cows was higher in S+V gorups final
of the trials

+0.51 C
-2.51 C-1.65 C
-2.75 C
33
34
35
36
37
38
39
40
Mam
mar
y g
lan
d t
emp
erat
ure
, C
(to
p im
age)
Initial Final
Control Stalosan Vilomin ZLL S + V
To determine the effects of treatments on mammary health, termal images were taken at initial and final of the trial from top and bottom of the mammary. So, mammary gland
temperature changes were obtained.

+0.27 C
-2.21 C
-1.46 C
-2.48 C
34
35
36
37
38
39
40
Mam
mar
y g
lan
d t
emp
erat
ure
, C
(bo
tto
m im
age)
Initial Final
Control Stalosan Vilomin ZLL S + V
Acccording to data, it might say that treatments affected mammary gland temperatures. Rate of decrease was higher in Stalosan and S+V groups

8,93 9,04 9,00
9,78
7,88 8,51 8,30
9,298,78
9,74
0,00
2,00
4,00
6,00
8,00
10,00
12,00S
eru
m C
a m
g/D
L
10 d prior tocalving
5 d prior tocalving
Calving 5 d aftercalving
10 d aftercalving
Control X-Zelit
In the farm, X-Zelit application prior to 14 days had possitive effect on serum calcium level. Differences between groups were also found significant
Serum calcium level until calving had a tendency to inrease however the level decreased during calving then the level started to increased 5 days after calving. However, rate of decrease was significantly higher in control compared to X-Zelit. At 10 days after calving, the amount of increase was siginificantly higher in X-Zelit group. In addition, it was obtained from veterinary records, milk fever case was %8, the ketosis case was %13 in Control group. There was no any milk fever and ketosis cases in X-Zelit group.

28633385
8345
8976
0
1000
2000
3000
4000
5000
6000
7000
8000
9000
Milk
Yie
ld, k
g
L-100d L-305d
Control X-Zelit
Treatment had positively affacted milk production and reproduction parameters. Differences between groups were found significant.
Cow in treatment group produced approximately 521 kg more milk at first 100 days, and 630 kg more milk at 305 days compared to control group,

13597
416 378
0
100
200
300
400
500
Da
ys
Service Period Calving Interval
Control X-Zelit
Cows fed ration added X-Zelit had lower open days, calving interval was shorter and number of service per conception was lower
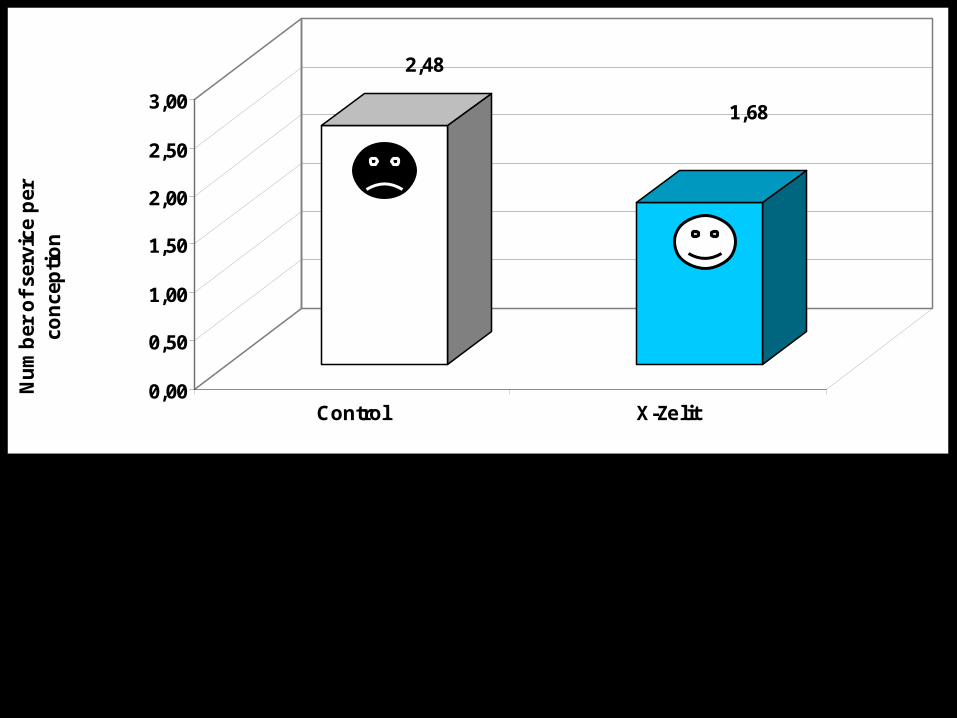
2,48
1,68
0,00
0,50
1,00
1,50
2,00
2,50
3,00
Nu
mb
er o
f se
rvic
e p
er
con
cep
tio
n
Control X-Zelit

Conclusion

The results showed that Stalosan decreased hoof and mastitis problems. Animals spend more time in front of feed alley. Stalosan had also positive effect on calf health.
Cow spended more time lying on beds after feeding

Combine effect of Stalosan and Vilomin ZLL was better than Stalosan

X-Zelit using, increased the Ca level in serum. After calving, cows fed TMR added X-Zelit had better reproduction and milk performance compared to control.

THANKS YOU FOR YOUR ATTENTION

Treatment calendar in farms
• Doğamar farm • Ertan farm
• Start: 08.11.2010
Measurements• Initial samples: 09.11.2010• Period 1: 22.11.2010• Period 2: 29.11.2010• Period 3: 07.12.2010
• Start: 18.10.2010
Measurements• Initial samples:25.10.2010• Period 1: 02.11.2010• Period 2: 08.11.2010• Period 3: 14.11.2010• Period 4: 23.11.2010• Period 5: 30.11.2010
• Start: 10.12.2010
Measurements• Initial samples: 17.12.201• Period 3: 17.02.2011