Stakeholder Beliefs, Satisfaction and Assessments of ...
202
East Tennessee State University Digital Commons @ East Tennessee State University Electronic eses and Dissertations Student Works 12-2001 Stakeholder Beliefs, Satisfaction and Assessments of School Climate aſter Implementation of a Year- Round Calendar. Robin Lee Adams East Tennessee State University Follow this and additional works at: hps://dc.etsu.edu/etd Part of the Educational Psychology Commons is Dissertation - Open Access is brought to you for free and open access by the Student Works at Digital Commons @ East Tennessee State University. It has been accepted for inclusion in Electronic eses and Dissertations by an authorized administrator of Digital Commons @ East Tennessee State University. For more information, please contact [email protected]. Recommended Citation Adams, Robin Lee, "Stakeholder Beliefs, Satisfaction and Assessments of School Climate aſter Implementation of a Year-Round Calendar." (2001). Electronic eses and Dissertations. Paper 92. hps://dc.etsu.edu/etd/92
Transcript of Stakeholder Beliefs, Satisfaction and Assessments of ...

East Tennessee State UniversityDigital Commons @ East
Tennessee State University
Electronic Theses and Dissertations Student Works
12-2001
Stakeholder Beliefs, Satisfaction and Assessments ofSchool Climate after Implementation of a Year-Round Calendar.Robin Lee AdamsEast Tennessee State University
Follow this and additional works at: https://dc.etsu.edu/etd
Part of the Educational Psychology Commons
This Dissertation - Open Access is brought to you for free and open access by the Student Works at Digital Commons @ East Tennessee StateUniversity. It has been accepted for inclusion in Electronic Theses and Dissertations by an authorized administrator of Digital Commons @ EastTennessee State University. For more information, please contact [email protected].
Recommended CitationAdams, Robin Lee, "Stakeholder Beliefs, Satisfaction and Assessments of School Climate after Implementation of a Year-RoundCalendar." (2001). Electronic Theses and Dissertations. Paper 92. https://dc.etsu.edu/etd/92

Stakeholder Beliefs, Satisfaction, and Assessments of
School Climate after Implementation of a Year-Round Calendar
________________________________________
A dissertation presented to the
faculty of the Department of Educational Leadership and Policy Analysis East Tennessee State University
In partial fulfillment of the requirements for the degree
Doctor of Education in Educational Leadership
_________________________
by Robin Lee Adams December 2001
_________________________
Dr. Russ West Dr. Louise MacKay
Dr. Terrence Tollefson Dr. Al Spritzer
Keywords: Year-Round Schooling, School Satisfaction Surveys, School Climate Surveys, School Calendars

2
ABSTRACT
Stakeholder Beliefs, Satisfaction, and Assessments of School Climate after Implementation of a Year-Round Calendar
by Robin Lee Adams
Year-Round Schooling (YRS), a calendar or scheduling concept, has become quite common in this country over the past 30 years. Generally schools have adopted YRS scheduling in an effort to: (1) increase efficiency in the operation of the schools and (2) enhance student development and learning. The University School at East Tennessee State University (ETSU), a public K-12 school located on the ETSU campus, implemented a YRS calendar in the Summer of 1996. Over a period of 6 years, data were collected to assess the effectiveness of YRS at University School. Study participants (students, parents, and teachers) were surveyed initially in the early spring (Phase 1) and early summer (Phase 2) of 1996 (prior to implementation of YRS) to establish a baseline for data collection. Identical Phase 1 and 2 surveys were conducted in 1997, 1999, 2000, and 2001. A final Phase 3 survey consisted of a series of interviews conducted at the end of the 2000-2001 school year. During the spring a series of standardized surveys developed by the National Association of Secondary School Principals (NASSP) were used to assess the school climate and stakeholder satisfaction. The summer survey, locally developed by the College of Education (COE), focused on the reactions to YRS. The final survey consisted of structured interviews with the stakeholder groups. During each year of the study, over 92% of the students, 80% of the teachers, and 39% of the parents responded. A select group of teachers, parents, and students participated in the final interviews. The data analysis conducted for Phases 1 and 2 consisted of a comparison of each pair of yearly results, 96, 97, 99, 2000, and 2001, using an Analysis of Variance (ANOVA). Phase 1 comparisons indicated that satisfaction levels increased after the implementation of YRS and school climate improved. Phase 2 surveys indicated stakeholders were more positive in their beliefs about teaching and learning and opinions of YRS after implementation. The results of the personal interviews reinforced the beliefs and opinions reported in Phases 1 and 2. Additional comparisons of students by grade levels and cohorts indicate a positive acceptance of YRS.

3
Copyright Robin Lee Adams, 2001 All rights reserved

4
DEDICATION
The completion of this dissertation comes at a most difficult time in my life. In May of
2001 my eighteen-year-old son was killed in an automobile accident. He was William Paul
Adams and his accomplishments in eighteen short years were remarkable. He was a Christian
boy and a true friend and companion to many. He was an AIM Scholar, an Eagle Scout, an
Assistant Scout Master, a hard working employee at Pal’s and Sam’s Wholesale, and had
completed his freshman year at East Tennessee State University. Billy was an obedient, loyal,
and loving son and an absolute dedicated big brother to his younger sister, Victoria, and younger
brother, Roy. He was an inspiration and constant source of pride to his mother, Diane, and me.
His accomplishments still inspire each of us daily and he is in our every thought and action. This
dissertation is dedicated to my son, whom I miss terribly, William (Billy) Paul Adams (1982-
2001).

5
ACKNOWLEDGEMENTS
I would like to thank my advisor and committee chair, Dr. Russ West. His counsel has
kept me focused and his guidance has provided me reassurance that I was on track. Several
people were instrumental in survey administration and data collection used in this work.
Rosemary Lowe, University School secretary, distributed surveys to teachers and staff at the
school. Judy Bragg, Dean Collins’ secretary, provided many student assistants to copy and
collate survey forms. I thank those many student workers who spent many hours helping prepare,
sort and mail survey packages. I thank Dean Martha Collins for her support and assistance in
conducting this lengthy survey process in the University School.
I would especially like to thank my committee Dr. Al Spritzer, Dr. Louise MacKay, Dr.
Terrence Tollefson, and my chair, Dr. Russ West. Their questions were probing, their guidance
was direct, and their patience was endless. I admire all of their works and dedication to the
University and I truly appreciate the support and freedom they allowed me in this project.
Additionally, I thank each of them for the support they provided to my family and me following
the loss of our son.
I would like to acknowledge the support of my entire family: my step-daughter Mitzi and
her daughter Mattie, my son Joseph and his wife Josie and son Joey, my daughter Michelle and
her husband Tony, my son Michael and his son Michael, my son Lee, my son Billy who is no
longer with us, my daughter Victoria, and my youngest son Roy. My eight children and three
grandchildren have all inspired me. One special person has always been there for me and kept
me on task, my wife, Diane, whom I love so dearly. Without her I would be nothing. Thank you
all.

6
CONTENTS
Page
ABSTRACT ....................................................................................................................................2
COPYRIGHT ..................................................................................................................................3
DEDICATION.................................................................................................................................4
ACKNOWLEDGEMENTS….........................................................................................................5
LIST OF TABLES.........................................................................................................................10
Chapter
1. INTRODUCTION............................................................................................................14
Year-Round Plans........................................................................................................14
Year-Round Schooling at University School ..............................................................16
Statement of the Problem.............................................................................................17
Significance of Study...................................................................................................17
Assumptions ................................................................................................................18
Limitations...................................................................................................................18
Research Questions......................................................................................................19
Phase One ..............................................................................................................19
Phase Two..............................................................................................................20
Phase Three............................................................................................................22
Operational Definitions ...............................................................................................23
Procedures ...................................................................................................................24
Organization of Study..................................................................................................25
2. REVIEW OF LITERATURE .........................................................................................26
Introduction of YRS in the United States ...................................................................26
Growth of YRS ............................................................................................................27
Types of YRS Programs ..............................................................................................28
Studies of the Effects of YRS......................................................................................29
Performance...........................................................................................................29
Absenteeism...........................................................................................................31
Tardiness and Suspensions ....................................................................................31
Discipline Problems...............................................................................................31
7
Chapter Page
Quality of Life/Work Life ...........................................................................................32
Intersession Programs..................................................................................................32
Physical Considerations of YRS..................................................................................32
Building Use and Cost Efficiency ...............................................................................32
Overcrowding ..............................................................................................................33
Summary ...................................................................................................................34
3. METHODS AND PROCEDURES ...................................................................................35
Study Description ........................................................................................................35
Population of Survey ...................................................................................................35
Phase One ..............................................................................................................35
Phase Two..............................................................................................................36
Phase Three............................................................................................................36
Research Design ..........................................................................................................36
Instrument ...................................................................................................................37
Phase One ..............................................................................................................37
Phase Two..............................................................................................................39
Phase Three............................................................................................................39
Number of Participants ................................................................................................39
Phase One ..............................................................................................................39
Phase Two..............................................................................................................40
Phase Three............................................................................................................40
Survey Procedure.........................................................................................................41
Phase One ..............................................................................................................41
Phase Two..............................................................................................................41
Phase Three............................................................................................................42
Data Analysis...............................................................................................................42
Research Hypotheses (Phases One and Two) and Questions (Phase Three)...............43
Phase One ..............................................................................................................43
Phase Two..............................................................................................................43
Phase Three Questions...........................................................................................44

8
Chapter Page
Summary ...................................................................................................................44
4. PRESENTATION AND ANALISIS OF DATA ..............................................................45
Introduction..................................................................................................................45
Data Analysis...............................................................................................................45
Phase One ....................................................................................................................46
Parent Responses to Satisfaction Survey...............................................................46
Parent Responses to Climate Survey.....................................................................47
Teacher Responses to Satisfaction Survey............................................................50
Teacher Responses to Climate Survey ..................................................................51
Student Responses to Satisfaction Survey.............................................................53
Student Responses to Climate Survey...................................................................56
Patterns of Satisfaction Responses Across Grade Levels......................................59
Patterns of Climate Responses Across Grade Levels ............................................ 62
Patterns of Response Within Cohorts....................................................................65
Phase One Conclusions................................................................................................70
Phase Two....................................................................................................................72
Parent Responses to May Survey .............................................................................. 72
Teacher Responses to May Survey............................................................................ 76
Student Responses to May Survey ............................................................................ 82
Patterns of Response Across Grade Levels ...........................................................88
Beliefs About Teaching and Learning.............................................................88
Opinions About Year-round Schooling ...........................................................90
Comparison of Three Subject Groups ....................................................................... 93
Phase Two Conclusions...............................................................................................96
Phase Three..................................................................................................................97
Personal Interviews ...............................................................................................97
Parents ...................................................................................................................98
Teachers...............................................................................................................101
Students ...............................................................................................................104
5. SUMMARY, CONCLUSIONS, AND RECOMMENDATIONS ..................................108

9
Chapter Page
Summary .................................................................................................................108
Findings .................................................................................................................109
Phase One ............................................................................................................109
Phase Two............................................................................................................110
Phase Three..........................................................................................................112
Conclusions................................................................................................................114
Recommendations for Practice ..................................................................................115
Recommendations for Future Research.....................................................................116
REFERENCES .......... .................................................................................................................117
APPENDICES ........... .................................................................................................................120
APPENDIX A: Letters and Instructions..........................................................................121
APPENDIX B: Survey Response Chart ..........................................................................127
APPENDIX C: May Surveys and Interview Questions ..................................................129
APPENDIX D: Satisfaction and Climate Graphs............................................................143
APPENDIX E: Graphs by Grades ...................................................................................156
APPENDIX F: Cohort Graphs.........................................................................................161
APPENDIX G: Beliefs and Opinions Graphs .................................................................178
APPENDIX H: Student Comparisons by Grade by Year Belief and Opinions ..............195
VITA............................................................................................................................................201

10
LIST OF TABLES
Table Page
1. A Collection of YRS Programs with Descriptions…………... .................................................. 28
2. Scale Titles, Number of Items, and Alpha Coefficients for the NASSP Satisfaction
and Climate Surveys .......................................................................................................37
3. Analysis of University School Parent Responses to the NASSP Parent Satisfaction Survey
During Spring, 1996, 1997, 1999, 2000, and 2001. Part 1 .............................................46
4. Analysis of University School Parent Responses to the NASSP Parent Satisfaction Survey
During Spring, 1996, 1997, 1999, 2000, and 2001. Part 2 .............................................47
5. Analysis of University School Parent Responses to the NASSP School Climate Survey
During Spring, 1996, 1997, 1999, 2000, and 2001. Part 1 .............................................48
6. Analysis of University School Parent Responses to the NASSP School Climate Survey
During Spring, 1996, 1997, 1999, 2000, and 2001. Part 2 .............................................49
7. Analysis of University School Teacher Responses to the NASSP Teacher Satisfaction
Survey During Spring, 1996, 1997, 1999, 2000, and 2001. Part 1.................................50
8. Analysis of University School Teacher Responses to the NASSP Teacher Satisfaction
Survey During Spring, 1996, 1997, 1999, 2000, and 2001. Part 2.................................51
9. Analysis of University School Teacher Responses to the NASSP School Climate Survey
During Spring, 1996, 1997, 1999, 2000, and 2001. Part 1 .............................................52
10. Analysis of University School Teacher Responses to the NASSP School Climate Survey
During Spring, 1996, 1997, 1999, 2000 and 2001. Part 2 ..............................................53
11. Analysis of Combined University School Student Responses to the NASSP School
Satisfaction Survey During Spring, 1996, 1997, 1999, 2000, and 2001. Part 1. ...........54
12. Analysis of Combined University School Student Responses to the NASSP School
Satisfaction Survey During Spring, 1996, 1997, 1999, 2000, and 2001. Part 2.............55
13. Analysis of University School Student Responses to the NASSP School Climate Survey
During Spring, 1996, 1997, 1999, 2000 and 2001. Part 1 ..............................................57
14. Analysis of University School Student Responses to the NASSP School Climate Survey
During Spring, 1996, 1997, 1999, 2000 and 2001. Part 2 ..............................................58
15. Patterns of Significant Differences on the NASSP Student Satisfaction Survey Where Data
Were Collected in Each Grade During Spring, 1996, 1997, 1999, 2000 and 2001........60

11
Table Page
16. Patterns of Significant Differences on the NASSP School Climate Survey, Where Data Were
Collected in Each Grade During Spring, 1996, 1997, 1999, 2000, and 2001. ...............63
17. Patterns of Significant Differences on the NASSP School Satisfaction Survey When
Comparisons are Made Between Responses from Spring of 1996, 1997, 1999, 2000,
and 2001 from the Same Cohort .....................................................................................67
18. Patterns of Significant Differences on the NASSP School Climate Survey When
Comparisons are Made Between Responses from the Spring of 1996, 1997, 1999, 2000,
and 2001 from the Same Cohort. ...................................................................................69
19. Analysis of University School Parent Responses to the May Survey in 1996, 1997, 1999,
2000, and 2001. Part I: Beliefs About Teaching and Learning at University School
(Questions 1-6) ...............................................................................................................72
20. Analysis of University School Parent Responses to the May Survey in 1996, 1997, 1999,
2000, and 2001. Part I: Beliefs About Teaching and Learning at University School
(Questions 7-12) ............................................................................................................73
21. Analysis of University School Parent Responses to the May Survey in 1996, 1997, 1999,
2000, and 2001. Part II: Parent Opinions About Year-Round Schooling (Questions
13-18) .............................................................................................................................74
22. Analysis of University School Parent Responses to the May Survey in 1996, 1997, 1999,
2000, and 2001. Part II: Parent Opinions About Year-Round Schooling (Questions
19-24) ..............................................................................................................................75
23. Analysis of University School Parent Responses to the May Survey in 1996, 1997, 1999,
2000, and 2001. Part II: Parent Opinions About Year-Round Schooling (Questions
25-27) ..............................................................................................................................76
24. Analysis of University School Teacher Responses to the May Survey in 1996, 1997, 1999,
2000, and 2001. Part I: Beliefs About Teaching and Learning at University School
(Questions 1-6) ...............................................................................................................77
25. Analysis of University School Teacher Responses to the May Survey in 1996, 1997, 1999,
2000, and 2001. Part I: Beliefs About Teaching and Learning at University School
(Questions 7-12) .............................................................................................................78

12
Table Page
26. Analysis of University School Teacher Responses to the May Survey in 1996, 1997, 1999,
2000, and 2001. Part II: Teacher Opinions About Year-Round Schooling (Questions
13-18) ..............................................................................................................................79
27. Analysis of University School Teacher Responses to the May Survey in 1996, 1997, 1999,
2000, and 2001. Part II: Teacher Opinions About Year-Round Schooling (Questions
19-24) ..............................................................................................................................80
28. Analysis of University School Teacher Responses to the May Survey in 1996, 1997, 1999,
2000, and 2001. Part II: Teacher Opinions About Year-Round Schooling (Questions
13-18) ..............................................................................................................................81
29. Analysis of University School Teacher Responses to the May Survey in 1996, 1997, 1999,
2000, and 2001. Part III: Educator Survey (Questions 29-50)............................................ 82
30. Analysis of University School High School Student Responses to the May Survey in 1996,
1997, 1999, 2000, and 2001. Part I: Beliefs About Teaching and Learning at University
School (Questions 1-6) ...................................................................................................83
31. Analysis of University School High School Student Responses to the May Survey in 1996,
1997, 1999, 2000, and 2001. Part I: Beliefs About Teaching and Learning at University
School (Questions 7-12) .................................................................................................84
32. Analysis of University School High School Student Responses to the May Survey in 1996,
1997, 1999, 2000, and 2001. Part II: Student Opinions About Year-Round Schooling
(Questions 13-18) ...........................................................................................................85
33. Analysis of University School High School Student Responses to the May Survey in 1996,
1997, 1999, 2000, and 2001. Part II: Student Opinions About Year-Round Schooling
(Questions 19-24) ............................................................................................................86
34. Analysis of University School High School Student Responses to the May Survey in 1996,
1997, 1999, 2000, and 2001. Part II: Student Opinions About Year-Round Schooling
(Questions 25-27) ............................................................................................................87
35. Analysis of University School High School Student Responses to the May Survey in 1996,
1997, 1999, 2000, and 2001. Part III: Work Activities (Question 29) and Part VI:
Access to Courses (Question 35)....................................................................................88

13
Table Page
36. Analysis of University School High School Student Responses to Part I: Beliefs About
Teaching and Learning (Questions 1-6). Comparing Grades Within Years ..................89
37. Analysis of University School High School Student Responses to Part I: Beliefs About
Teaching and Learning (Questions 7-12). Comparing Grades Within Years ................90
38. Analysis of University School High School Student Responses to Part II: Student Opinions
About Year-Round Schooling (Questions 13-18). Comparing Grades Within Years....91
39. Analysis of University School High School Student Responses to Part II: Student Opinions
About Year-Round Schooling (Questions 19-24). Comparing Grades Within Years....92
40. Analysis of University School High School Student Responses to Part II: Student Opinions
About Year-Round Schooling (Questions 25-27). Comparing Grades Within Years....93
41. Analysis of University School High School Parents, Students, and Teachers Overall Surveys
for Responses of Beliefs About Teaching and Learning 1996 Through 2001 ...............94
42. Analysis of University School High School Parents, Students, and Teachers Overall Surveys
for Responses of Opinions About YRS 1996 Through 2001 .........................................95

14
CHAPTER 1
INTRODUCTION
Year-round schooling (YRS) is a calendar or scheduling concept that has grown in
popularity in this country over the past 30 years. The pros and cons of the year-round education
were discussed initially during the common school era of the 1830s and 1840s. Two gentlemen
openly debated this issue, Charles Mann and Orestes Brownson. Mann was a proponent of state-
controlled schools, while Brownson considered it the right and privilege of the local communities to
decide on the schooling cycle. Mann advocated teaching the Christian truths in conjunction with
state control of schools. (Tozer, Violas, & Senese, 1998). Brownson was more provocative with his
approach stating:
Education, such as it is, is ever going on. Our children are educated in the streets,
by the influence of their associates, in the fields and on the hillsides, by the influence of the surrounding scenery and overshadowing skies, in the bosom of the family, by the love and gentleness or wrath and fretfulness of parents, by the passions or affections they see manifested, the conversations to which they listen, and above all by the general pursuits, habits, and moral tone of the community. (Tozer et al., 1998, p.74).
In many areas of the country student populations have increased without significant
increases in funding. In some cases funding has actually decreased. These financial constraints
have placed hardships on school districts as they try to do more with less. This burden has been
particularly evident in large urban centers. Year-round schooling has allowed some school districts
to maximize the use of their physical facilities and avoid the high costs associated with the
construction of new facilities (Herman, 1991).
Year-Round Plans
A calendar year has a maximum number of 247 days available for school outside weekends
and holidays and most states require students to attend school for 180 days. Two types of plans are
available for administrators, single-track and multi-track.
A multiplicity of choices is available for administrators to select the best scheme to suit their
environment. The school year is most commonly divided into two periods (called the 90/30 plan),
three periods (called the 60/20 plan or the 60/15 plan) or four periods (called the 45/15 plan).

15
In schools with a single-track YRS schedule, all students are in and out of school at the same
time, so there are times when regular school sessions are not being held. Creative organizations
develop intersession-learning experiences to enhance students’ educational opportunities often
during these vacant facility periods.
To maximize the use of a system’s choice of learning days, the multi-track year-round
education programs have been instituted. In multi-track systems, not all students attend and take
breaks at the same time. Because less than all students are in attendance at any given time under
such a multi-track program, the stress due to overcrowding is reduced.
In addition to the more "efficiency-oriented” reasons to adopt a year-round schedule, a
number of different reasons have been given that focus on the learning outcomes in schools and the
potential for year-round schooling to enhance student development and learning. One of the most
commonly cited reasons for moving to a year-round school schedule is that such a schedule will
eliminate the loss of knowledge that has been thought to occur over the course of the "traditional"
summer vacation. YRS allows for continuous learning and it reduces the classroom time generally
required for review of material that was taught in the previous session. (White, 1998). Those who
advocate YRS on these grounds suggest that this benefit accrues disproportionately to students from
economically disadvantaged backgrounds (Campbell, 1994; Haenn, 1996). White suggested that
these children do not have access to enriching, out-of-school learning activities during the vacation
breaks and that YRS enrichment activities could assist in closing the learning gaps. Prohm and
Baenen (1996) suggested that the shorter breaks associated with YRS make it easier to offer
enrichment activities and remedial instruction. Others have suggested that if smaller class sizes
result from the implementation of a multi-track system, learning will be enhanced due to lower
teacher-student ratio (Herman, 1991). Some supporters of YRS suggested that the year-round
schedule leads to greater student attendance since they are not as likely to suffer from "burnout".
This is thought to make it easier for students to stay "caught up" or current. Proponents have also
suggested that teachers are also likely to be more effective when teaching in a YRS program since
they have time to plan throughout the school year and are less likely to suffer from burnout
(Campbell, 1994; Prohm & Baenen). Still others have argued that year-round schooling may lead to
the development of a more positive school climate and a higher level of morale among students and
parents (Campbell). YRS may also provide some relief for overcrowded buildings in areas where

16
adequate expansion funds are not available. (Fahy, 1990). Although these claims are all individually
supported, they may not all apply to any particular school system.
Year-round schooling may be implemented for a variety of reasons. The structure of the
program will inevitably require changes in the students’, parents’, and teachers’ environments.
These changes will not always be perceived as positive. As the program develops, all participants
in the system must make sacrifices. The beliefs and opinions of all participants about the
program and the benefits of the new system will inevitably change over time.
Year-Round Schooling at University School
One of the many schools that have recently implemented a year-round schedule is
University School (US), a public K-12 school located on the campus of East Tennessee State
University (ETSU) in Johnson City, Tennessee. University School is a "laboratory school" and an
integral part of the College of Education (COE) at ETSU. As a laboratory school, it provides a
learning environment where emphasis is placed on academic achievement, teacher preparation,
and university research. Parents submit applications to send their children to University School
and selection is made using a lottery system.
The initial discussion for the University School (US) to explore year-round education
culminated in the 1994-96 University School Plan for Renewal that was completed in November
1994. This initial plan was the product of a committee made up of parents, US teachers, and
departmental faculty in the COE. The group’s primary suggestion was that University School
become a model laboratory school that was integral to the success of the College of Education
and the entire university. During spring 1995, COE Dean Martha Collins appointed stakeholders
to 10 new committees and charged each committee with addressing a particular aspect of year-
round schooling at University School. During the spring 1995 term there was also a major
change in the leadership at US, as the long-time principal was replaced with a new interim
principal. This switch in leadership had been quite controversial in the months leading up to the
implementation of the new calendar and had become quite a media event. During the 1995-96
academic year, committees worked out the details necessary to implement the YRS program, and
the resulting report provided the COE with parent and faculty input to transition into the year-
round schedule (College of Education, 1996). A part of that report included provisions for

17
administering the instruments used in this study to track changes in satisfaction with University
School.
In June 1996 the interim director concluded her year as the school's leader and a national
search was conducted. A new director was selected as the school prepared for implementation of
the year-round program on July 10, 1996. During the summer 1996 term, the long-time assistant
principal left the school and two new assistant principals were hired. The new calendar followed
the basic 45/15 plan, with four nine-week quarters and a three-week break (intersession) between
each quarter called Breaks A.L.I.V.E. (Active Learning In Voluntary Environments). The school
has continued to operate under this 45/15 plan and is currently in its fifth year of operation.
Given the continuing interest in year-round schooling in this country, the varied findings
related to outcomes of such programs at other schools, and the uniqueness of the setting for the
implementation at University School, this study was undertaken to determine if there were changes
in the satisfaction levels of parents, students, and faculty after implementing a year-round education
program during the 1996-97 school year.
Statement of the Problem
The purpose of this study was to compare and contrast the continuum of satisfaction,
climate, beliefs in teaching and learning, and opinions about year-round schooling over a five-year
period for the University School (K-12) at East Tennessee State University. The general research
hypothesis guiding this study was as follows: There will be an increase in stakeholder satisfaction,
climate, beliefs, and opinions at University School after the implementation of year-round
schooling.
Significance of the Study
There is a continuing interest in year-round schooling in the country. Many school districts
in Northeast Tennessee have either converted their systems to year-round schedules or are
discussing that as a possibility in the near future. This regional movement, regardless of how
widespread it may become, could have long-term implications for our entire educational system.
Since the University School at East Tennessee State University decided to implement year-
round schooling to begin in July 1996, the decision was made to survey the affected population over
a period of five years to evaluate this implementation, thus providing some baseline data for future

18
reference. The set of surveys used in this undertaking would measure the satisfaction levels of all
participants.
The National Association of Secondary School Principals (NASSP) designed several of
the instruments selected for this study. The survey consisted of a standardized set of survey
questions designed to measure satisfaction and climate levels. The second survey form was
locally designed to measure program participants’ beliefs about teaching and learning and
opinions about year-round schooling. A third instrument, an interview guide, was a collection of
questions from the topics covered in the two previous surveys. These questions were the focus of
personal interviews conducted with participants who had experienced all five years of YRS
implementation.
Assumptions
1. January or February was assumed to be the best timeframe for evaluating
satisfaction levels for all concerned because it would mark the beginning of the third school learning
period of the year.
2. May or June was assumed to be the best timeframe for a separate survey to measure
the beliefs about teaching and learning and opinions about year-round schooling because it was near
the end of the fourth and final learning period of the year.
Limitations
1. The measure of satisfaction was limited to the questions provided by the selected
survey instruments.
2. The population of parents, teachers, and students at University School were
continuously changing over the course of the study due to relocation of families, teacher-turnover,
the entrance of new families, and administration policy changes due to staff turnover. These
changes had the potential to impact aggregate levels of satisfaction and climate.
3. The results of the study conducted at University School should not be generalized to
project the impact of YRS implemented elsewhere.
4. Response rates for teachers and students were fairly high due to the “captive
audience” concept. Parent responses over the five years varied greatly but generally averaged nearly
40% after a second mail-out. For the purposes of this study a 40% response rate was considered

19
acceptable.
Research Questions
The general research question addressed in this study was: Was there an increase in the
satisfaction level, the climate level, the beliefs about teaching and learning, the opinions about YRS
and the overall opinions of the stakeholders after the implementation of YRS? These changes were
assessed for teachers, parents, and students. Phases One and Two consisted of a quantitative
assessment and Phase Three included a qualitative approach.
Phase One
1. Has there been a change in the parent satisfaction level at University School from 1996 to
2001 with reference to: parental involvement; curriculum; student activities; teachers; support
services; school buildings, supplies, and maintenance; student discipline; school administration; and
school information services.
2. Has there been a change in the parents’ perception of school climate at University School
from 1996 to 2001 with reference to: teacher-student relations, security and maintenance,
administration, student academic orientation, student behavioral values, guidance, student-peer
relationships, parent and community school relations, instructional management, and student
activities?
3. Has there been a change in the teacher satisfaction level at University School from 1996 to
2001 with reference to: school administration; the compensation program; opportunity for
advancement; student responsibility and discipline; curriculum and job tasks; satisfaction with co-
workers; parent and community involvement; school buildings, supplies, and maintenance; and
communications?
4. Has there been a change in the teachers’ perception of school climate at University School
from 1996 to 2001 with reference to: teacher-student relations, security and maintenance,
administration, student academic orientation, student behavioral values, guidance, student-peer
relationships, parent and community school relations, instructional management, and student

20
activities?
5. Has there been a change in the student satisfaction level at University School from 1996 to
2001 with reference to: teachers; fellow students; schoolwork; student activities; student discipline;
decision-making opportunities; school buildings, supplies, and maintenance; and communications?
6. Has there been a change in the students’ perception of school climate at University School
from 1996 to 2001 with reference to: teacher-student relations, security and maintenance,
administration, student academic orientation, student behavioral values, guidance, student-peer
relationships, parent and community school relations, instructional management, and student
activities?
Phase Two
7. Has there been a change in the parents’ beliefs about teaching and learning at University
School from 1996 to 2001 with reference to:
Can the students achieve the goals that have been set for them?
Has the school set high standards for academic performance?
Has the school provided an atmosphere in which the students learn effectively?
Do the teachers believe that their students have the ability to achieve academically?
Is academic achievement recognized and acknowledged by the school?
Is the learning environment orderly and serious?
Does the instruction at this school prepare students for the future?
8. Has there been a change in the parents’ opinion about year-round schooling at University
School from 1996 to 2001 with reference to the fact that year-round schooling:
Promotes effective teaching and learning?
Enables students to overcome learning problems?
Helps students improve test scores?
Leads to greater retention of learned material?
Reduces student stress?
Keeps students engaged in learning the entire year?

21
Motivates students to attend school?
9. Has there been a change in the teachers’ beliefs about teaching and learning at University
School from 1996 to 2001 with reference to:
Can the students achieve the goals that have been set for them?
Has the school set high standards for academic performance?
Has the school provided an atmosphere in which the students learn effectively?
Do the teachers believe that their students have the ability to achieve academically?
Is academic achievement recognized and acknowledged by the school?
Is the learning environment orderly and serious?
Does the instruction at this school prepare students for the future?
10. Has there been a change in the teachers’ opinion about year-round schooling at University
School from 1996 to 2001 with reference to the fact that year-round schooling:
Promotes effective teaching and learning?
Enables students to overcome learning problems?
Helps students improve test scores?
Leads to greater retention of learned material?
Reduces student stress?
Keeps students engaged in learning the entire year?
Motivates students to attend school?
11. Has there been a change in the students’ beliefs about teaching and learning at University
School from 1996 to 2001 with reference to:
Can the students achieve the goals that have been set for them?
Has the school set high standards for academic performance?
Has the school provided an atmosphere in which the students learn effectively?
Do the teachers believe that their students have the ability to achieve academically?
Is academic achievement recognized and acknowledged by the school?
Is the learning environment orderly and serious?
Does the instruction at this school prepare students for the future?

22
12. Has there been a change in the students’ opinion about year-round schooling at University
School from 1996 to 2001 with reference to the fact that year-round schooling:
Promotes effective teaching and learning?
Enables students to overcome learning problems?
Helps students improve test scores?
Leads to greater retention of learned material?
Reduces student stress?
Keeps students engaged in learning the entire year?
Motivates students to attend school?
Phase Three
13. What are parents’ overall opinions of year-round schooling after experiencing the changes
in the past 5 years with reference to the following questions:
What where your initial impressions when the decision was announced in 1996 for the
impending transition to year-round schooling?
What difficulties were encountered adjusting to the four nine-week learning periods / three-
week vacation periods from the straight six six-week periods?
Do you feel that your child has benefited from the YRS program over the last 5 years?
Do you feel the YRS schedule provides a better environment to promote effective
learning for your child?
Do you know if any parents who removed their children from US as a result of the
implementation of YRS?
Has the implementation of YRS satisfied your original expectation of the program?
What one thing would you recommend to improve the YRS program at US?
Are there any other factors that may have influenced your feelings about the Year Round
School?
14. What are teachers’ overall opinions of year-round schooling after experiencing the changes
in the past 5 years with reference to the following questions:
What where your initial impressions when the decision was announced in 1996 for the
impending transition to year-round schooling?

23
What difficulties were encountered adjusting to the four nine-week learning periods / three-
week vacation periods from the straight six six-week periods?
Do you feel that your effectiveness as a teacher has improved over the last 5 years?
Do you feel the YRS schedule provides a better environment to promote effective
learning for your students?
Do you know if any of your colleagues left US as a result of the implementation of YRS?
Has the implementation of YRS satisfied your original expectation of the program?
What one thing would you recommend to improve the YRS program at US?
Are there any other factors that may have influenced your feelings about the Year Round
School?
15. What are students’ overall opinions of year-round schooling after experiencing the changes
in the past 5 years with reference to the following questions:
What where your initial impressions when the decision was announced in 1996 for the
impending transition to year-round schooling?
What difficulties were encountered adjusting to the four nine-week learning periods / three-
week vacation periods from the straight six six-week periods?
Do you feel that instruction and learning opportunities have been better or worse over the
last 5 years?
Do you feel the YRS has provided you a better environment to promote effective
learning?
Do you know if any of your classmates left US as a result of the implementation of YRS?
Has the implementation of YRS satisfied your original expectation of the program?
What one thing would you recommend to improve the YRS program at US?
Are there any other factors that may have influenced your feelings about the Year Round
School?
Operational Definitions
Teacher - an employee of the University School who is assigned teaching duties during the
period of a survey. In some survey periods, the additional administrative personnel were included in
this category therefore N varies with each year.

24
Parent - a parent of a child enrolled in University School during the period of the study.
Student - a student enrolled in the University School grades 6 through 12 during the period
of the study.
Procedures
The following procedures were conducted in this study:
1. In 1996 and 1997 previous students and staff of the Educational Leadership and
Policy Analysis Department completed the surveys and data collection.
2. The survey administration and data collection for the 1999, 2000, and 2001 school
years were completed as part of this study.
3. The NASSP survey instruments were previously selected by the College of
Education for the study.
4. The beliefs about teaching and learning and the opinion about YRS surveys
instruments were designed by the College of Education.
5. Proper permission and authorization were obtained to conduct the study.
6. The surveys were administered for satisfaction and climate in February or March of
each survey year and the beliefs and opinions surveys were administered in May of each year.
7. Interviews were conducted in March/April of the final year.
8. No surveys were conducted in 1998.

25
Organization of Study
This study is organized into five chapters. Chapter 1 contains the introduction, year-round
plans, year-round schooling at University School, statement of problem, significance of the study,
assumptions, limitations, research questions, operational definitions, procedures, and organization of
study.
Chapter 2 provides a review of the literature related to year-round schooling, introduction of
year-round schooling to the University School, growth of year-round schooling, types of year-round
school programs, studies of the effects of year-round schooling to include changes anticipated by
year-round schooling in absenteeism, building use, tardiness, suspensions, discipline problems,
quality of life/ work life, and intersession programs and the chapter concludes with a summary.
Chapter 3 describes the methodology and procedures used in the study and data collection. It
describes the research design, population, measurement instrument, data analysis techniques, and
the research hypotheses are identified in this chapter.
Chapter 4 describes how the data analysis was performed, Phase 1 findings on each
participant group, Phase 1 conclusions, Phase 2 findings on each participant group, Phase 2
conclusions and Phase 3 personal interview questions and results.
Chapter 5 provides a summary, findings for each of the three phases, conclusions, and
recommendations.

26
CHAPTER 2
REVIEW OF LITERATURE
Literature and research relating to year-round schooling (YRS) are reviewed in this
chapter.
Introduction of YRS in the United States
YRS is a legitimate concept that began as far back as colonial days when the town of
Dorchester, Massachusetts, implemented the first YRS program (Zykowski, Mitchell, Hough, &
Gavin, 1991). According to Zykowski et al., in 1888 the U.S. Commissioner of Education
endorsed the concept of creating "summer schools" to augment the "traditional" school program
and by the early 1900s YRS programs were being initiated in towns such as Bluffton, Indiana
(1904); Gary, Indiana (1907); Amarillo, Texas (1910); Newark, New Jersey (1912); Minot,
North Dakota (1917); Omaha, Nebraska (1918); Nashville, Tennessee (1925); Aliquippa,
Pennsylvania (1928); and Ambridge, Pennsylvania (1931) (Baker, 1990; Merino, 1983;
Zykowski et al.).
Traditional school programs were initially designed to give children time off during the
harvest season. This would allow them to work in the fields gathering the crops that were critical
to the existence of their pioneer families of early America (Ballinger, 1985). The realities of
urban and suburban societies today do not support the rationale for traditional schooling because
few children today have the responsibility of gathering the crops for their families’ livelihood.
According to Ballinger, in present day society, the three-month-long summer break is
detrimental to most students, especially to those scoring below the 50 percentile on standardized
tests. Disadvantaged students classified as low-income, limited English-speaking, and students in
need of additional educational support, in the opinion of several authors, are in jeopardy of a
significant loss of knowledge during the summer months (Alcorn, 1992; Weaver, 1992).
YRS proposals initially addressed two purposes: 1) the development of a more efficient
use of the current school facilities and 2) a system for maximizing the outcomes of student
learning (Mutchler, 1993). These YRS recommendations should not be viewed as a threat to the
traditional school scheduling but as an opportunity to move toward more methods and options
required by changing lifestyles, community involvement and work patterns of a changing
population (Glines, 1987).

27
There were numerous plans for YRS used throughout the nation between 1917 and 1938.
These plans were designed to use space efficiently, improve the quality of education, teach
immigrant children English, and provide access to vocational training year-round.
In the two decades following World War II, the YRS effort was halted to allow additional
people the opportunity to work on farms and in factories to support the war effort. After WWII,
returning soldiers were taking advantage of the “G I Bill” to gain their high school diplomas and
college education (Baker, 1990). YRS was discussed, but no significant movement in that
direction took place until 1968 (Marino, 1983; NAYRE, 2000). In 1968, the Hayward Unified
School District in California developed California's first YRS program. YRS was purported to
provide a means for improving the quality of life for individuals and society as a whole and to
offer the potential for alternative schedules for learning (Ritter, 1992). There was an early flurry
of schools adopting the YRS schedule.
Growth of YRS
Programs of YRS grew between 1968 and 1973, peaked in 1973, and then dropped
steadily until 1978 (Zykowski et al., 1991). Beginning in the mid-1980s, however, there was a
resurgence of interest in year-round schooling as school districts searched for answers to those
who were calling for significant educational reform and greater accountability in public
education. This interest has not waned in the 1990s.
By 1990 there were 859 schools in YRS covering 22 states with 152 school districts and
they served 733,660 students. (NAYRE, 2000). Bradford (1995) reported that in the 1991-1992
school year there were 23 states with YRS programs involving 204 school districts and 1,668
year-round schools serving 1,349,835 students. Gandara and Fish (1994) reported that in
California the percentage of children on YRS schedules increased from 7.7% in 1988 to 25% in
1992. Winters (1994) reported "in 1994 there were over 2,200 schools in over 440 school
districts with over 1,600,000 students participating in year-round educational programs in this
country" (p. 1). According to the statistics from the Conference 2000 Highlights of National
Association for Year-Round Education (NAYRE), YRS enrollments reached 1.8 million students
during school year 1996-97 with 2,460 schools in 41 states involved. In the 1999-2000 school
year, there were 43 states and the District of Columbia operating YRS schools with the total
number of students in excess of 2 million and the number of schools in excess of 3,000.

28
(NAYRE, 2000). The rationales typically given for movement to a YRS schedule have fallen
into one of two categories; 1) increased efficiency in the operation of the schools or 2) enhanced
student development and learning (Mutchler, 1993).
Types of YRS Programs
A number of YRS plans are described in the literature. There are over 30 year-round
calendar configurations (Glines, 1995). More popular programs are summarized in Table 1:
TABLE 1
A Collection of YRS Programs with Descriptions
TYPE DESCRIPTION
Concept 6 - Six 40-44 day learning blocks - Students attend four of the six blocks with two blocks in succession - Students have two 40-44 day vacations
- Plan requires overlapping days or longer school days to meet required 180 days of school
Modified Concept 6
- Same plan as Concept 6 except units are divided into four weeks instead of six - Students must attend eight weeks then have a four-week vacation
Concept 8 - Eight six-week terms - Voluntary programs - students select six - Mandatory programs – students are assigned their weeks
Block 45-15 - Only one group of students - Everyone follows the same nine-week learning and three-week vacation program - Program in place at the University School
Flexible 45-15 - Nine-week learning and three-week vacation periods - Exception - instruction and curriculum may be individualized - Students may be allowed to jump tracks for special reasons
Staggered 45-15 - Students are divided into four groups A, B, C, and D - Groups rotate through school with three in attendance and the fourth group on vacation - Students will attend school 45 days and vacation 15 days four times a year
Block 60-20 - One group of students - Students attend school in 60-day learning blocks and 20-day vacation blocks
Staggered 60-20 - Students are divided into four groups A, B, C, and D - Students rotate through three-60 day periods each followed by a 20-day vacation period - One of the four groups will always be on vacation
Staggered, Block, Flexible 90-30
- Students are in same configuration as the 45-15 and 60-20 - Students attend two 90-day learning blocks followed by two 30-day vacation blocks
Extended School Year
- Contains more than 180 days of learning - Consists of four 50-day learning blocks and four 15-day vacation all staggered
Glines, 1995

29
These programs in Table 1 are only a few of the available plans. Each plan includes
holidays, parent employment plans, community activities, staff planning days, geography, climate,
teacher union support, and additional related factors (Glines, 1995). Each school plan may contain
advantages and disadvantages but must be selected to satisfy local communities and cultures. If
none of the plans fit a community’s needs then they should design their own customized plan.
Studies of the Effects of YRS
There have been many studies published on the effects of year-round education. Many of
these were published during the 1970s and 1980s. The first major review of these studies was
completed by Merino (1983) who found that only three of nine studies with an experimental and
matched control group showed gains in academic achievement in favor of YRS. According to
Winters (1994) the technical quality of the studies on year-round schooling is now better than it was
prior to 1985, with the recent evidence being more favorable toward YRS over the traditional
program. In this work, only studies published after 1990 are considered. Although most of the study
designs are quasi-experimental or pre-experimental in nature and the results have been mixed, it is
useful to consider the patterns of findings.
Performance
In a study of one elementary school that had implemented YRS in Ohio, Campbell (1994)
found no difference in achievement gains, numbers of books read, or reading level, among
academically at-risk students, when compared to a matched group from schools with a traditional
calendar. The parents and students from the school, however, indicated that they were performing at
a higher level as a result of the YRS calendar. In a comparison of children in two schools, one with
a traditional calendar and one with a YRS calendar, Roby (1995) reported that students in a YRS
program showed increases from the traditional group in terms of their math and reading
achievement scores, although most of the differences were not statistically significant.
In a study of elementary schools in Wake County, North Carolina, Prohm and Baenen
(1996) found that elementary students in year-round schools were performing at about the same
levels as similar students in other schools in the district, when equated via an "effectiveness index"
in reading and math. Haenn (1996) compared two elementary schools in Durham, North Carolina,
that had developed single-track year-round programs. After the end of the first year of

30
implementation, Haenn suggested that implementation of the YRS program had a positive effect on
student achievement. Herman (1991) found that students in year-round education programs
performed at a higher level on the state assessment tests than those with more traditional school
schedules, although this difference did not hold up for the CTBS scores in reading and math.
In a study comparing schools on a year-round schedule in the San Diego Unified School
District to those with a traditional schedule from the same district, Alcorn (1992) reported that
students in year-round schools exceeded those in traditional schools in reading, math and language
in grades three, five, and six during the period 1982-1990. Gandara and Fish (1994) reported that
there were few differences between experimental (year-round) schools and their matched controls
on standardized tests of reading and math, after controlling for initial differences. In a policy brief,
Kreitzer and Glass (1993) summarized what they had discovered as evidence relating YRS and
achievement. In that brief they suggested that "year-round schools, then, seem to stimulate
development of individualized, flexible curricula, but the change is not reflected directly in student
achievement" (p.4). Zykowski et al. (1991) reviewed the literature on achievement effects and
reported "although conflicting achievement effects are reported, most reviewers conclude that there
does not appear to be harmful achievement effects when students attend YRS" (p. 31).
Grotjohn and Banks (1993) presented a review of 27 studies on the impact of YRS on
achievement. These researchers concluded that the research evidence suggested that YRS certainly
did not have a negative impact on achievement and that in 12 of the 27 studies there was a positive
affect. Six (1993) reviewed 13 studies on the effects of YRS on educational achievement and noted
that the results, while mixed, favored YRS over the traditional program. Winters (1994) updated the
study by Six and reviewed 19 more recent studies on the effects of YRS on achievement. Winters
reported that out of 58 possible categories where comparisons were made, 48 (or 83%) showed
findings that were favorable to YRS programs. An additional seven showed mixed results. Winters
concluded, "It may be concluded that in this particular review of academic studies that the
achievement of students participating in a year-round educational setting performed better on tests
than did their counterparts in a traditional calendar setting" (p. 36).
A review of a number of studies was completed by Kneese (1996), who looked at the impact
of YRS on student learning. In that review, 13 studies met the criteria for selection, and Kneese
reported that the research procedures employed varied greatly. She found a weighted overall effect
size of +.12 standard deviation for studies reporting NCE mean scores as the outcome measure and

31
an overall effect of +.15 standard deviation in studies reporting mean scales scores as the outcome
measure. While Kneese cautioned that these performance results should be viewed tentatively,
because some of the studies in the review did not adjust for initial differences between the year-
round school and traditional calendar groups, she did conclude that YRS has a positive, yet very
small effect on academic achievement. The studies reviewed by Kneese also showed tremendous
variation because 6 of the 13 studies showed gains in favor of the traditional programs.
Absenteeism
Campbell (1994) found no differences in absences between year-round and traditional
programs. Prohm and Baenen (1996) found elementary students in year-round schools to be only
one percentage point higher in their attendance than students following a traditional calendar.
Likewise, Herman (1991) found no differences in the absentee rates of Concept 6 year-round
schools, multi-track year-round schools, and schools with traditional schedules. The findings were
corroborated by Gandara and Fish (1994), who found little difference in the absence rates of
experimental (year-round) and control schools in either student or teacher absenteeism. Haenn
(1996) reported that there were slight decreases in the mean school absences in two elementary
schools that developed single-track year-round programs, although they were not tested for
statistical significance.
Tardiness and Suspensions
Haenn (1996) found that there were no clear patterns regarding the impact of YRS on
tardiness and suspensions. One of the schools studied showed a decrease in the number of students
that were tardy, while the other showed an increase. The number of student suspensions increased in
both schools after the implementation of YRS.
Discipline Problems
In contrast, Campbell (1994) found that administrators in a school with a year-round
schedule indicated that there were no fewer discipline problems under the YRS arrangement. He
reported students, parents, and administrators in a school with a year-round calendar also indicated
that they had an advantage by being in such a school. Campbell opined that a YRS calendar could
contribute to the morale of students and parents, while decreasing the level of teacher burnout.

32
Quality of Life/Work Life
Campbell (1994) found that parents of children in a YRS indicated that the year-round
schedule enhanced the quality of family life. Prohm and Baenen (1996) found that parents and staff
members in multi-track year-round schools scored higher on a survey of school climate than did
parents and staff members in schools with more traditional scheduling patterns. In a study
comparing Concept 6 year-round schools, multi-track year-round schools, and schools with
traditional schedules, Herman (1991) found no significant differences between teachers in the
traditional and year-round programs in terms of their ratings of the quality of work life. Likewise,
there were no differences in the school attitude scores of students. Gandara and Fish (1994) stated
that parents, teachers, and students reported high levels of satisfaction with the implementation of a
year-round school calendar.
Intersession Programs
Gandara and Fish (1994) reported that each experimental group (year-round school) in their
study did show significant gains for the most highly targeted "at-risk" students who had participated
in remedial intersession courses. Haenn (1996) found good initial participation in intersession
programs but noted that this participation declined over time. He also reported that students from
low socioeconomic backgrounds did not have access to the intersession programs.
Physical Considerations of YRS
Interested parties have addressed several other issues with reference to YRS. Rodgers
(1993) suggested that greater academic achievement gains for YRS students were not conclusively
found in the majority of the studies to date. In general, there were only moderate savings in building
costs and maintenance, concern has been raised about increases in salaries and benefits of teachers
and some parents and communities oppose YRS. She also indicated that the majority of the
difficulties centered on the assessment and implementation of YRS.
Building Use and Cost Efficiency
School districts in traditional schedules across the nation are faced with the fact that for
several months throughout the year their buildings are either underused or completely vacant.

33
One of the studies reviewed by Ballinger, Kirschenbaum, and Poimbrauf (1987) described a
school district in Oxnard, California, that claimed to have saved $1,000,000 in annual operating
costs and $5,000,000 in capital outlay for schools by instituting year-round schooling. Their
estimated savings over a four-year period was $10,000,000. In a separate study of Oxnard,
Natale (1992) wrote that the district had increased the capacity of an existing building by about
2,000 students and in doing so saved the district the cost of building additional buildings to
accommodate the growing student population. A comparative analysis of simulated budgets
indicated a school system could save up to 15% of its operating budget (Merino, 1983).
Educators no longer have the luxury of allowing buildings to sit vacant 3 months out of 12,
according to some fiscal experts (Ballinger et al., 1987; Glines, 1994), schools must operate at top
capacity. The start-up costs of implementing YRS are high, but once operational, the annual
expenditures become substantially lower (Greenfield, 1994). Gandara and Fish (1994) reported
findings that facility use had increased as a result of YRS and class size had decreased.
Overcrowding
The problem of overcrowding is becoming a more prevalent concern of communities across
the nation. The institution of YRS in school systems has been credited with alleviating some of
these problems. Some school districts have been capable of better use of classrooms with smaller
class sizes using creative flexible schedules associated with YRS. Some school districts have been
able to eliminate temporary classrooms (trailers) on school grounds and discontinue use of unsafe,
makeshift, antiquated classrooms by the use of YRS scheduling (Alcorn, 1992; Gandara & Fish,
1994). Herman (1991) and Smith (1992) conducted studies and indicated that by using a multi-track
YRS program a school could increase student capacity anywhere from 20% to 50% in a given
facility.
Not all YRS stories were positive. Virginia Beach school officials stated that the YRS
program attempted in their area was abandoned after only a few years because there were no
particular increases in student achievement over the nine month students and the savings were only
$8 per pupil due to the additional costs of staff salaries (Sincoff & Reid, 1975). Rasberry (1994)
concluded in a cost effectiveness study in Seminole County, Florida, that there were no short-term
or long-term savings connected to YRS. The increased operational costs involved with supporting

34
YRS was more than the long-term new-building costs that would be required to provide classroom
overcrowding relief.
Summary
The preponderance of literature indicates there is no conclusive evidence to support or
dispute the value of year-round schooling. The data addressed areas such as academic performance,
attendance, discipline, tardiness, suspensions, class size, morale, quality of life, and teacher and
student burnout. It appears that parents, students and teachers engaged in year-round education
generally have positive feelings about it. While it is still not clear whether year-round schooling
improves student achievement, it appears that it does not bring about significant decline in
achievement. There are little data that address the perceived measure of a change in climate after
implementation of YRS.
Studies on the physical effects of YRS are also inconclusive. Building use appears to be
more positive than negative and with the variety of different types of scheduling concepts school
districts can be very creative in administering YRS. The financial aspect of YRS is possibly the
product of regional location and the cost of materials and salaries. Some areas are pleased with the
savings of YRS operations, whereas others contend it is a break-even situation with no appreciable
benefit to the students’ learning.

35
CHAPTER 3
METHODS AND PROCEDURES
This chapter contains a description of the methods and procedures used to conduct this
study. The study was segregated into three separate phases. In the following paragraphs, the
study design, the selection of participants, the instruments used, procedures used in the data
collection, and the statistical analysis of the data, are presented for each phase of the study.
Study Description
This study was based upon data collected in three phases. The first two phases consisted
of comprehensive written surveys. The third phase consisted of personal interviews of
participants who were present during the entire five years of the study.
Phase one consisted of the participants responding to a school assessment package
designed by the National Association of Secondary School Principals (NASSP). Its title was
“Comprehensive Assessment of School Environments Satisfaction”. The several surveys with
the assessment package measured the satisfaction level of participants in 8 or 9 categories and
the climate level in 10 categories.
Phase two consisted of the participants responding to a University School Evaluation
Committee Survey designed by the College of Education at East Tennessee State University. This
survey measured the respondents’ beliefs about teaching and learning and opinions about year-
round schooling at University School.
Phase three consisted of a structured interview process. The interview guide contains
questions covering general topics addressed in the first two surveys and was designed to solicit
opinions of selected participants about key areas of year-round schooling implementation. These
questions are found in Appendix C. Participants for these interviews were in the University School
system for the entire 5 years of this study.
Population of Survey
Phase One
The survey was conducted at the University School (K-12) to measure the impact of
implementing YRS. All teachers at the school were one respondent group; the students in the 6th
through 12th grades were another respondent group; and the parents of those students were the third

36
respondent group. In the first three surveys the teachers mailed their responses to the COE office
and the final two years staff members were included and all surveys were collected in the University
School office providing a higher response rate. I administered the last two yearly surveys, although
data from all five years were used in the analysis. No sampling strategies were used because an
effort was made to administer surveys to all those in the participating groups.
Phase Two
Teachers at the school constituted one respondent group; the students in the high school, 9th
through 12th grades, were another respondent group; and the parents of those students were the third
respondent group. In the first three surveys the teachers mailed their responses to the COE office
and the final two years staff members were included and all surveys were collected in the University
School office (providing a higher response rate). I administered the last two yearly surveys,
although data from all five years were used in the analysis. No sampling strategies were used since
an effort was made to administer surveys to all those in the participating groups.
Phase Three
All teachers who were continuously employed at the University School from 1996 to 2001
were selected for interviews. A random selection of an equal number of parents who had children in
University School for the same timeframe and students who attended University School
continuously from 1996 to 2001 was made for the interviews.
Research Design
Quasi-experimental research studies are less efficient than true experiments where control
groups are utilized. In the case of the University School, the subject of this study, the measurement
of a satisfaction level, beliefs and opinions, and overall opinions, was considered a time-series
design because experimental isolation was not possible from the beginning (Campbell & Stanley,
1963).
In a quasi-experimental interrupted time-series design, a continuous effect over time
indicates a shift in slope over a continuum after a treatment has been applied (implementation of
YRS) (Cook & Campbell, 1979). For this study only a single survey was conducted prior to
implementation of the YRS program. The majority of the data from the last four years of data
collection describes the environment after implementation of YRS. There is only one year of pre-
implementation data. The 1996 data provides an indication of satisfaction, climate, beliefs, and

37
opinions immediately prior to implementation of YRS. The overall subsequent data indicate the
level of acceptance of the change to YRS since its implementation.
Instrument
Phase One
The NASSP school satisfaction and climate surveys were used in Phase one of this study.
The forms for teacher, students, and parents varied in content and length and when combined took
approximately 45 minutes to one hour to administer. Groups of questions, from as few as four to the
largest group of eight, were combined to indicate categorical scale titles as indicated in Table 2.
Responses were on a five-point likert-type scale. The survey responses ranged from “Very
Dissatisfied” to “Very Satisfied”, with three intermediate selections and an optional “Don’t know”
response.
A summary of the survey forms is indicated in Table 2. The information in the table
includes the scale titles for the satisfaction surveys and climate surveys along with the number of
items and an estimate of internal consistency reliability. These reliability coefficients were taken
from the Technical Manual for the instruments (Halderson, Kelley, Keefe, & Berge, 1989).
Test-retest reliabilities for the scales and validity coefficients can be found in the Technical
Manual and were considered adequate for the purpose of this study.

38
TABLE 2
Scale Titles, Number of Items, and Alpha
Coefficients for the NASSP Satisfaction and Climate Surveys
Teacher Satisfaction Survey
Parent Satisfaction Survey
Student Satisfaction Survey
School Climate Survey
Administration 8 items alpha=.92
Parent Involvement 5 items alpha=.72
Teachers 7 items alpha=.82
Teacher-Student Relations 12 items alpha=.87-.92
Compensation 5 items alpha=.87
Curriculum 7 items alpha=.83
Fellow Students 5 items alpha=.78
Security and Maintenance 7 items alpha=.84-.88
Opportunities for Advancement 4 items alpha=.93
Student Activities 8 items alpha=.88
Schoolwork 6 items alpha=.76
Administration 6 items alpha=.82-.90
Student Responsibility and Discipline 5 items alpha=.89
Teachers 7 items alpha=.91
Student Activities 5 items alpha=.81
Student Academic Orientation 4 items alpha=.75-.83
Curriculum and Job Tasks 7 items alpha=.80
Support Services 6 items alpha=.77
Student Discipline 6 items alpha=.83
Student Behavioral Values 3 items alpha=.67-.79
Co-Workers 7 items alpha=.89
School Buildings, Supplies, and Maintenance 4 items alpha=.83
Decision-Making Opportunities 5 items alpha=.83
Guidance 4 items alpha=.78-.88
Parents and Community 6 items alpha=.88
Student Discipline 8 items alpha=.91
School Buildings, Supplies, and Upkeep 6 items alpha=.82
Student-Peer Relationships 4 items alpha=.80-.85
School Buildings, Supplies, and Maintenance 7 items alpha=.85
School Administrators 7 items alpha=.92
Communication 6 items alpha=.82
Parent and Community-School Relationships 4 items alpha=.74-.79
Communication 7 items alpha=.85
School Information Services 6 items alpha=.86
Instructional Management 7 items alpha=.79-.85
Student Activities 4 items alpha=.72-.79 Halderson et al., 1989

39
Phase Two
The University School Evaluation Committee Survey (Appendix C) was used in Phase two
of this study. The survey addressed beliefs about teaching and learning, opinions about year-round
schooling, and students’ access to courses for teachers (Teacher Survey), parents (Parent Survey), and
students (Student Survey). Additionally teachers were asked to respond to an educator survey and list
innovative teaching practices. Students were asked additional questions concerning work activities,
co-curricular and extra-curricular activities, and volunteerism.
In beliefs about teaching and learning there were 12 items. While all 12 items were reported
in the tables, only seven were selected for more extensive analysis in the conclusions based on the
greater relevance to the research questions.
In opinions about year-round schooling there were 15 items. While all 15 items were
reported in the tables, only seven were selected for more extensive analysis in the conclusions based
on the greater relevance to the research questions.
Phase Three
A final evaluation of the overall opinions of the survey populations was determined
through a personal interview of selected participants. Each selected candidate participated in a 20
to 30 minute interview with questions covering topics such as: what did they expect with the
implementation of YRS, what difficulties did you encounter, did teacher effectiveness improve
or decline, has YRS satisfied original expectations, and what would they do to improve the
school? (See interview questions: teacher, parent, & student.)
Number of Participants
Phase One
The entire population of students in grades 6 - 12 at University School was surveyed in the
spring of 1996 (N =397), 1997 (N=403), 1999 (N=391), 2000 (N= 395), and 2001 (N= 398).
Teachers were asked to complete the survey instruments during spring 1996 (N=38), 1997 (N=38),
1999 (N=36) and all teachers, administrators, and staff members were asked to complete the survey
instruments during spring 2000 (N=45) and 2001 (N=40). One copy of each of the survey
instruments was also sent to each household. The number of households represented at the school
was 413 in 1996, 416 in 1997, 393 in 1999, 380 in 2000, and 358 in 2001. These survey results are
presented in Appendix B (see Chart). A total of 374 students responded in 1996 (94.2%), 371

40
responded in 1997 (92.1%), 347 responded in 1999 (88.7%), 375 responded in 2000 (94.9 %), and
329 responded in 2001 (82.7 %). Among households surveyed, 153 returned questionnaires in 1996
(37.0%), 175 in 1997 (42.1%), 57 in 1999 (14.5%), 191 in 2000 (50.3%), and 114 in 2001 (31.8 %).
Thirty five (92.0%) teachers, administrators, and staff members returned surveys in 1996, 20 in
1997 (52.6%), 20 in 1999 (55.6%), 41 in 2000 (91.1 %), and 33 in 2001 (82.5 %). The teacher
responses were lower in 1997 and 1999. In 2000 and 2001 the University School office collected
the completed surveys.
Phase Two
The high school students only, grades 9 – 12, at University School were surveyed in May
with the following numbers: 1996 (N =236), 1997 (N=262), 1999 (N=222), 2000 (N=270), and
2001 (N=272). Likewise, teachers, administrators, and staff members were asked to complete the
survey instruments in May 1996 (N=24), 1997 (N=38), 1999 (N=24), 2000 (N=31), and 2001
(N=40). One copy of each of the survey instruments was also sent to each high school household.
The number of high school households represented at the school was approximately 235 in 1996,
237 in 1997, 224 in 1999, 258 in 2000, and 241 in 2001. These survey results are presented in
Appendix B (see Chart). A total of 224 students responded in 1996 (94.2%), 248 responded in 1997
(94.7%), 205 responded in 1999 (92.3%), 253 responded in 2000 (93.7 %), and 257 responded in
2001 (94.5 %). Among households surveyed, 125 returned questionnaires in 1996 (52.7%), 120 in
1997 (50.6%), 80 in 1999 (35.7%), 128 in 2000 (49.6 %), and 75 in 2001 (31.1 %). Fourteen
(58.3%) teachers, administrators, and staff members returned surveys in 1996, 33 in 1997 (86.8%),
20 in 1999 (83.8%), 27 in 2000 (87.1 %), and 30 in 2001 (75.0 %).
Phase Three
The size of the pool of participants interviewed was determined by the number of eligible
members in the smallest group, the teachers. The University School staff agreed to identify all
teachers who were continuously employed by University School from 1996 to 2001. Only one
third of the actual teachers who were employed in 1996 were teaching in 2001 (McLean &
Adams, 2001), but the number who were continuously employed was only six and they were
selected for interviews. The 2001 survey indicated 36 parents had children continuously enrolled
at University School from 1996 to 2001, and six names were purposefully selected by the
University School staff to participate in interviews. Lastly, the 2001 survey indicated 32 seniors

41
had been enrolled continuously in University School from 1996 to 2001, and six names were
purposefully selected by University School staff to participate in interviews.
Survey Procedures
Phase One
During February 1996, five months prior to the implementation of the new year-round
school calendar, all students in grades 6 - 12 were asked to complete the Student Satisfaction and
Climate Surveys in their English classes. A standardized set of instructions in Appendix A (See
instructions) was given to the teachers who administered the surveys. During that same week one
copy of the Parent Satisfaction and Climate Surveys was mailed to each household with children at
the school, (See sample letter) along with a return envelope and a postcard with both the parents
name and a return address on it. Parents were asked to mail in the questionnaire separately from the
postcard. The postcard was then used to identify those who had turned in surveys so that they were
not included in the follow-up mailing (See sample letter) that occurred two weeks later. The
Teacher Satisfaction and Climate Surveys, along with a return envelope, were administered to the
teachers and administrators during a faculty meeting during the same week (See instructions).
Teachers were encouraged to turn their envelopes in to the office for return to the College of
Education and were monitored to see that they responded.
The responses from the 1996 survey were kept confidential during the next year as the YRS
program was implemented. The identical survey process was then initiated during February, 1997,
February, 1999, February, 2000,and February, 2001 to collect data from students, parents, and
teachers seven months, two years seven months, three years seven months, and four years seven
months, respectively, after implementation. During the five surveys an average of 91.4% of the
students, 80.4% of the faculty and staff, and 35.1% of the parents responded. See Chart
Phase Two
During the May 1996 survey, two months prior to the implementation of the new year-round
school calendar, only high school students in grades 9 - 12 were asked to complete the University
School Evaluation Committee Survey in their English classes. A standardized set of instructions
was given to the teachers who administered the surveys. During that same week, one copy of the
Parent Survey was mailed to each household with children at the high school level, along with a
return envelope and a postcard with both the parents name and a return address on it. Parents were

42
asked to mail in the questionnaire separately from the postcard. The postcard was then used to
identify those who had turned in surveys so that they were not included in the follow-up mailing
that occurred two weeks later. The Teacher Survey, along with a return envelope, was administered
to the teachers and administrators during a faculty meeting during the same week. Teachers were
encouraged to turn their envelopes in to the office for return to the College of Education and were
monitored to see that they had turned them in.
The first set of responses, school year 1995-1996, was kept confidential during the next year
as the YRS program was implemented. The identical survey process was then initiated during May,
1997, May, 1999, May, 2000,and May, 2001 to collect data from students, parents and teachers 10
months, two years 10 months, three years 10 months, and four years 10 months, respectively, after
implementation. During the five surveys an average of 93.9% of the students, 78.1% of the faculty
and staff, and 44.0% of the parents responded. See Chart
Phase Three
A set of interview questions was derived primarily from topics explored in the satisfaction,
climate, and belief and opinion surveys (Appendix C) and was intended to assist in obtaining a more
in-depth perspective of the selected participants of the YRS implementation. Interview participants
were those teachers in grades 6 – 12 who had been employed at University School for the entire
timeframe 1996 to 2001. Only about one third of the 1996 faculty remained at University School
through 2001 (McLean & Adams, 2001), and of those only six remained continuously; therefore,
only six participants from each category were selected for interviews. The six students and parents
were selected only if they fulfilled the same criteria, i.e. having been continuously enrolled or
having children continuously enrolled at University School from 1996 to 2001.
Data Analysis
Differences in pre-to-post implementation scores were assessed on each of the scales on
the satisfaction and climate inventories using the Analysis of Variance, comparing each year to
the others for significant differences. Data from the instruments were interpreted and analyzed
using the SPSS software. All null hypotheses were tested at a .05 level of significance and
summaries of all those categories indicating significant differences were provided. Categories
not specifically listed or commented upon may have shown differences but those differences
were not significant.

43
This analysis was completed for each scale title for each group. Student responses were
further broken down by grade level to ascertain whether there were certain differences that
occurred across all grade levels and whether there were patterns of change that occurred.
The means for the surveys indicated in each of the tables in Chapter 4 are based on early
field studies from 1985 undertaken by NASSP in 29 middle and high schools representing
various geographical locations, population sizes, student characteristics, and governance
structures (public and private). These means were taken from the Technical Manual (Halderson
et al., 1989). Given that these norms are 16 years old and from middle and high schools only, any
comparisons to the current data should be made with caution.
Research Hypotheses (Phases One and Two) and Questions (Phase Three)
Phase One
Across the five data collection points (years):
Ho1: There is no difference in parents’ satisfaction in nine specific categories.
Ho2: There is no difference in parents’ perception of the climate in 10 specific categories.
Ho3: There is no difference in teachers’ satisfaction level in nine specific categories.
Ho4: There is no difference in teachers’ perception of the climate level in 10 specific categories.
Ho5: There is no difference in students’ satisfaction level in eight specific categories.
Ho6: There is no difference in students’ perception of the climate level in 10 specific categories.
Phase Two
Across the five data collection points (years):
Ho7: There is no difference in parents’ beliefs about teaching and learning in seven specific
categories.
Ho8: There is no difference in parents’ opinions about year-round schooling in seven specific
categories.
Ho9: There is no difference in teachers’ beliefs about teaching and learning in seven specific
categories.
Ho10: There is no difference in teachers’ opinions about year-round schooling in seven specific
categories.
Ho11: There is no difference in students’ beliefs about teaching and learning in seven specific
categories.

44
Ho12: There is no difference in students’ opinions about year-round schooling in seven specific
categories.
Phase Three Questions
13. Has the year-round schooling system influenced the parents’ overall opinion about the
University School during the first five years?
14. Has the year-round schooling system influenced the teachers’ overall opinion about the
University School during the first five years?
15. Has the year-round schooling system influenced the students’ overall opinion about the
University School during the first five years?
Summary
This chapter presented the methodology and procedures that were used in conducting this
study. The population of the surveys consisted of a mix of the parents, students, and teachers of the
University School grades 6 through 12 over a period of five years. Although the individuals in these
groups were continuously changing over the survey period, their satisfaction levels, climate
perceptions, and beliefs and opinions, as groups, were relevant to the environment where they
existed. Data collection for the first three years of the survey period were completed by the College
of Education, and I completed the final two years, collecting, collating, and analyzing the data from
all five years and conducting the personal interviews of the selected participants.
The research hypotheses were based upon the research questions measuring satisfaction
levels, climate perceptions, beliefs about teaching and learning, opinions about year-round
schooling, and overall opinions of year-round schooling implementation and required testing for
each of the respondent groups. There were 12 hypotheses and three questions containing 122
subcategories that required testing or analysis for this study.
45
CHAPTER 4
PRESENTATION AND ANALYSIS OF DATA
Introduction
The purpose of the study was to examine the effects of the implementation of Year-Round
schooling at University School. The examination took place in three phases: a written survey
conducted with all participants near the first part of the calendar year in February, a written survey
conducted with all participants near the end of the school year in May, and an interview of selected
parents, teachers and senior students conducted during the last school session of the five-year
project. The years that surveys were conducted were 1996, 1997, 1999, 2000, and 2001.
Phases one and two also include analyses of climate, students by grade, and students as
cohorts compared to other cohorts as they moved through the grades 6 through 12. Graphic
representations of all comparisons are available through internal hyperlinks throughout the
document.
Data Analysis
Differences in pre-to-post implementation scores were assessed on each of the scales on the
Satisfaction Inventories and the School Climate Inventories using the Analysis of Variance of tests
comparing each year to the other for significant differences. This analysis was completed for each
group. Student responses were further broken down by grade level to ascertain whether there were
certain differences that occurred across all grade levels and whether there were patterns of change
that occurred. Additionally, scores were sorted and analyzed separately for four specific cohorts of
students: Cohort One were Freshmen in 1996, Cohort Two were eighth graders in 1996, Cohort
Three were seventh graders in 1996, and Cohort Four were sixth graders in 1996. Although not a
part of the analysis undertaken in this report, the norm group mean on each of the scales is provided
for comparison purposes. The means for the School Climate Survey were aggregated with schools
as the unit of analysis, rather than the individual respondents. They are based on early field studies
from 1985 undertaken by NASSP in 29 middle and high schools representing various geographical
locations, population sizes, student characteristics, and governance structures (public and private).
These means were taken from the Technical Manual (Halderson et al., 1989). Given that these
norms are 16 years old and from middle and high schools only, any comparisons to the current data
should be made with caution.

46
Phase One
Parent Responses to Satisfaction Survey
Parent Responses to Satisfaction Surveys are graphically demonstrated in Appendix D
and the results are shown in Tables 3 and 4.
TABLE 3
Analysis of University School Parent Responses to the NASSP
Parent Satisfaction Survey During Spring, 1996, 1997, 1999, 2000, and 2001. Part 1.
1996 M SD
n
1997
M SD N
1999
M SD N
2000
M SD N
2001
M SD n
F
Paired
Comparisons
Norm Group
M Parent Involve-ment
16.97 3.47 126
17.39 3.78 138
17.24 3.96 38
17.45 4.33 144
18.77 3.22 93
3.29 96 < 01 97 < 01 99 < 01 00 < 01
18.1
Curricu-lum
23.59 5.80 118
24.07 5.40 134
25.61 4.82 44
25.19 5.42 145
Graphics
25.17 5.42 69
2.31 96 < 00 96 < 01
27.4
Student Activities
26.91 5.99 95
27.41 6.18 113
26.54 7.04 39
27.33 6.17 128
27.75 6.27 69
.34 * 29.9
Teachers
25.69 5.54 124
26.56 6.32 151
28.04 5.74 46
26.78 6.20 166
28.36 5.20 86
3.16 96 < 99 96 < 01 00 < 01
26.6
Support Services
17.25 4.40 93
17.79 4.98 110
18.03 4.57 35
18.99 5.28 115
18.90 5.02 63
1.66 96 < 00 96 < 01
22.0
* No significant differences Note: Scale Ranges: Parent Involvement=5-20; Curriculum=7-35; Student Activities=8-40; Teachers=7-35; Support Services=6-30.
As shown in Tables 3 and 4, although all of the means, except one, changed in a more
positive direction from 1996 to 1997, the only statistically significant difference was on the parents’
satisfaction with the school administration Table 4, where ratings changed from a mean of 24.79 to
27.22. Comparing 1996 to 1999 one area stands out as significantly different, parents satisfaction
with teachers in Table 3 (25.69 to 28.04). Comparing 1996 to 2000 three areas stand out as
significantly different: parents satisfaction with curriculum in Table 3 (23.59 to 25.19), and in Table
4 the parents satisfaction with school administrators (24.79 to 26.90) and parents satisfaction with
support services (17.25 to 18.99). Parents appeared more satisfied with the school administration
after the implementation of YRS.

47
TABLE 4
Analysis of University School Parent Responses to the NASSP
Parent Satisfaction Survey During Spring, 1996, 1997, 1999, 2000, and 2001. Part 2. Scale (See Note)
1996
M SD N
1997
M SD N
1999
M SD N
2000
M SD N
2001
M SD n
F
Paired
Comparisons
Norm Group
M School Buildings Supplies & Maintenance
14.18 3.35 136
14.57 3.31 162
14.27 3.60 52
14.51 3.67 174
14.87 2.99 98
.67 * 16.1
Student Discipline
29.01 5.50 88
28.74 6.82 107
27.86 6.72 36
29.48 5.79 131
Graphics
29.92 6.29 75
.91 * 31.0
School Administrators
24.79 6.75 111
27.22 5.86 116
26.54 7.46 39
26.90 5.75 148
28.06 4.72 90
4.22 96 < 97 96 < 00 96 < 01
27.7
School Info Services
18.51 5.28 126
19.08 5.26 138
19.72 5.69 39
18.99 5.49 140
20.72 4.98 85
2.43 96 < 01 97 < 01 00 < 01
21.5
* No significant differences Note: Scale Ranges: School Building, Supplies & Maintenance=4-20; Student Discipline 8-40; School Administrators=7-35; School Information Services=6-30.
Comparing 1996 to 2001, every area was greater in 2001 and seven of them were
significantly greater. Parents’ satisfaction showed a slight but not significant decline in three areas
from 1997 to 1999 but recovered in each in the 2000 survey and the 2001 surveys all ended greater
than all previous years with 6 of the 9 categories significantly greater than 1996: parents
involvement, curriculum, teachers, support services, school administrators, and school information
services. Parents’ satisfaction showed a steady decline, again not significant, over the three
reporting periods 1996 to 1999 but recovered in 2000 and achieved a top score in 2001 in student
discipline.
Parent Responses to Climate Survey
Parent responses to the School Climate Survey are in Table 5 & 6 and are graphically
demonstrated in Appendix D.

48
TABLE 5
Analysis of University School Parent Responses to the NASSP
School Climate Survey During Spring, 1996, 1997, 1999, 2000, and 2001. Part 1. Scale (See Note)
1996
M SD n
1997
M SD n
1999
M SD n
2000
M SD n
2001
M SD n
F
Paired
Comparisons
Norm Group
M
Teacher-Student Relation-ships
42.94 7.79 90
44.05 9.11 105
45.30 10.40 37
44.34 10.32 123
46.06 8.03 71
1.27 96 < 01 43.6
Security and Mainten-ance
26.86 4.94 103
27.39 4.57 117
27.32 4.44 38
27.34 4.50 131
Graphics
27.49 4.65 77
.27 * 29.0
Adminis-tration
20.34 5.76 80
22.47 5.58 101
22.13 5.87 38
22.02 5.29 124
23.94 3.53 80
4.84 96 < 97 96 < 00 96 < 01
22.9
Student Academ Orienta-tion
16.07 2.54 124
15.92 2.84 138
15.36 2.89 44
15.79 2.69 147
15.75 2.36 97
.66 * 15.6
Student Behavior Values
7.89 2.58 96
8.17 2.57 99
8.31 2.70 35
8.56 2.93 116
9.10 2.55 78
2.51 96 < 01 97 < 01
8.6
* No significant differences Note: Scale Ranges: Teacher-Student Relationships=12-60; Security and Maintenance=7-35; Administration=6-35; Student Academic Orientation=s=4-20; Student Behavioral Values=3-15.
Parents’ responses to climate variables showed an increase in all categories from 1996 to
1997 except student activities (15.86 to 15.41), indicating a slight decline, and the increase in
administration (20.34 to 22.47) was significantly greater than 1996. Responses showed a slight
but not significant decline in six areas from 1997 to 1999: security and maintenance (27.39 to
27.32), administration (22.47 to 22.13), students’ academic orientation (15.92 to 15.36), student
to peer relationships (15.06 to 14.06), parent and community to school relationships (12.30 to
11.68), and student activities (15.41 to 15.12). Five of these six categories recovered from 1999
to 2000: security and maintenance (27.32 to 27.34), students’ academic orientation (15.36 to
15.79), student to peer relationships (14.06 to 15.08), parent and community to school
relationships (11.68 to 12.40), and student activities (15.12 to 15.83). Administration continued
to decline in 2000 but was still significantly greater than 1996 (23.94 to 20.34). There was a
steady decline, again not significant, over the first three reporting periods in student academic
orientation (16.07 to 15.92 to 15.36) and student activities (15.86 to 15.41 to 15.12) but both
categories recovered slightly in 2000 (15.79 and 15.83 respectively) then declined slightly in

49
2001 (15.75 and 15.72 respectively). These were the only two categories that did not finish in
2001 higher than they began in 1996.
TABLE 6
Analysis of University School Parent Responses to the NASSP
School Climate Survey During Spring, 1996, 1997, 1999, 2000, and 2001. Part 2. Scale (See Note)
1996
M SD n
1997
M SD n
1999
M SD n
2000
M SD n
2001
M SD n
F
Paired
Comparisons
Norm Group
M
Guidance
13.48 4.01 97
14.03 3.74 109
15.10 3.73 41
14.93 3.42 134
15.30 3.14 84
4.17 96 < 99 96 < 00 96 < 01 97 < 01
15.3
Student-Peer Relation-ships
14.98 3.13 128
15.06 2.97 144
14.06 3.52 47
15.08 3.35 165
Graphics
15.02 2.82 104
1.06 * 15.1
Parent & Community School Relations
12.15 3.02 108
12.30 3.50 105
11.68 3.82 41
12.40 3.75 133
12.27 3.66 82
.36 * 14.3
Instructional Mgmt
25.37 4.64 79
26.39 4.77 83
26.65 4.87 31
26.87 4.79 92
26.79 3.99 61
1.35 96 < 00 27.8
Student Activities
15.86 2.88 96
15.41 2.74 111
15.12 3.18 41
15.83 2.76 127
15.72 2.35 75
.88 * 15.6
* No significant differences Note: Scale Ranges: Guidance=4-20; Student-Peer Relationships=4-20; Parent & Community-School Relations=4-20; Instructional Management=7-35; Student Activities=4-20. Approval with the guidance climate was the only category that was significantly greater
in 1999 than 1996 (15.10 to 13.48). In addition to administration, guidance and instructional
management were significantly greater in 2000 than 1996 (15.30 to 13.48 and 26.79 to 25.37
respectively). Four categories were significantly greater in 2001 than 1996: teacher to student
relations (46.06 to 42.94), administration (23.94 to 20.34), student behavioral values (9.10 to
7.89), and guidance (15.30 to 13.48). A significant point to be made here is that Parents felt more
positive about the school administration after the implementation of YRS, although this also
coincided with the hiring of a new administrative staff at University School and may not be
exclusively as a result of YRS implementation. Additionally, the 2001 results may be
representative of an even newer administration in the final year of surveys. There were two
additional categories that were significantly greater in 2001 than 1997: student behavioral values
(9.10 to 8.17) and guidance (15.30 to 14.03).

50
Teacher Responses to Satisfaction Survey
Teacher responses to the Teacher Satisfaction Survey are graphically demonstrated in
Appendix D and the results are shown in Tables 7 & 8.
TABLE 7
Analysis of University School Teacher Responses to the NASSP
Teacher Satisfaction Survey During Spring, 1996, 1997, 1999, 2000, and 2001. Part 1. Scale (See Note)
1996
M SD n
1997
M SD n
1999
M SD n
2000
M SD n
2001
M SD n
F
Paired Compari-sons
Norm Group
M Administration
30.18 6.58 33
30.24 7.40 17
32.65 7.62 20
32.00 5.69 36
33.88 5.85 32
1.68 96 < 01 28.8
Compensation
15.50 4.47 34
17.82 3.63 17
14.47 4.30 19
13.44 3.47 34
Graphs
13.17 4.75 30
4.46 00/01 <96
99/00/01 <97
14.7
Opportun for Advance-ment
12.55 3.62 22
14.50 2.24 12
11.50 2.00 16
10.74 3.48 23
11.16 3.50 25
3.36 99/00/01 <97
10.9
Student Responsi-bility and Discipline
15.79 4.45 34
14.22 5.13 18
14.95 4.89 20
16.21 4.01 39
17.16 3.59 31
1.64 97 < 01 16.3
Curriculum and Job Tasks
26.73 4.68 33
28.24 4.04 17
28.10 3.95 20
27.12 4.21 33
26.87 4.00 31
.63 * 25.7
* No significant differences Note: Scale Ranges: Administration=8-40; Compensation=5-25; Opportunities for Advancement=4-20; Student Responsibility and Discipline=5-25; Curriculum and Job Tasks=7-35.
As shown in Table 7, the score for teacher satisfaction for administration was significantly
higher in 2001 than in 1996 (33.88 to 30.18), and there were no statistically significant differences
between mean satisfaction scores in 1996 and those in 1997 in any category. In the category of
compensation, the scores in 1996 were significantly higher than those in 2000 and 2001 (15.50 vs.
13.44 and 13.17 respectively) and the score in 1997 was significantly larger than those in 1999,
2000, and 2001 (17.82 vs. 14.47, 13.44 and 13.17 respectively). A second category, opportunity for
advancement, showed 1997 significantly greater than those in 1999, 2000 and 2001 (14.50 to 11.50,
10.74 and 11.16 respectively). The teachers’ satisfaction level for student responsibility and
discipline was significantly greater in 2001 than in 1997 (17.16 to 14.22).

51
TABLE 8
Analysis of University School Teacher Responses to the NASSP
Teacher Satisfaction Survey During Spring, 1996, 1997, 1999, 2000, and 2001. Part 2. Scale (See Note)
1996
M SD N
1997
M SD n
1999
M SD n
2000
M SD n
2001
M SD n
F
Paired Compari-sons
Norm Group
M Co-Workers
30.79 4.19 34
30.84 4.23 19
33.05 3.39 20
31.82 3.39 38
30.18 4.50 33
1.98 96/01<99
28.6
Parents and Community
22.70 4.30 27
21.31 5.03 16
23.21 4.21 19
21.06 4.27 33
21.41 4.79 29
1.06 * 18.9
School Building, Supplies and Mainten-ance
20.06 5.81 32
18.82 5.94 17
22.10 6.21 20
19.82 4.71 39
Graphics
19.98 3.93 29
1.17 * 25.4
Communi-cation
25.61 5.69 23
24.67 4.98 12
25.59 4.23 17
25.4 4.53 35
38.72 3.84 32
3.14 96/97/99/00 <01
24.6
* No significant differences Note: Scale Ranges: Co-Workers=5-35; Parents and Community=6-30; School Building, Supplies & Maintenance=7-35; Communication 7-35.
Teachers’ satisfaction level with their coworkers in Table 8 was significantly greater in 1999
than the first year 1996 and the last year 2001 (33.05 to 30.79 and 30.18 respectively). The most
significant finding was that in 2001 teachers were significantly more satisfied with communications
than any other year, 1996, 1997, 1999 or 2000, (38.72 vs. 25.61, 24.67, 25.59, and 24.4
respectively). Four of the categories had an overall increasing trend over the five reporting periods
ending with a higher value than they began with and the remaining five categories had a generally
decreasing trend and ended lower. Perhaps some of this difference was due to the very different
response rates from the teachers in 1996 (when the director monitored the collection of surveys),
1997 (when no record was kept of who had turned them in) and in 1999, 2000, and 2001 an accurate
account of who returned the evaluations was maintained.
Teacher Responses to Climate Survey
Teacher responses to Climate Surveys are shown in Tables 9 and 10 and are graphically
demonstrated in Appendix D.

52
TABLE 9
Analysis of University School Teacher Responses to the NASSP
School Climate Survey During Spring, 1996, 1997, 1999, 2000, and 2001. Part 1. Scale*
1996
M SD n
1997
M SD n
1999
M SD n
2000
M SD n
2001
M SD n
F
Paired Comparisons
Norm Group
M Teacher-Student Relation-ships
49.61 6.97 33
50.56 9.69 18
54.94 4.30 18
53.0 5.70 31
51.56 6.64 31
2.25 96<99/00
47.7
Security and Mainten-ance
26.09 3.53 32
24.89 4.31 18
27.63 5.96 19
26.85 5.06 39
Graphics
28.12 3.31 33
1.94 97<01 28.4
Adminis-tration
25.19 2.99 31
26.26 3.40 19
25.58 2.76 19
25.73 3.09 33
26.69 2.87 32
1.21 * 22.8
Student Academ Orienta-tion
14.94 2.57 33
15.39 3.40 18
15.00 2.71 19
14.95 2.35 40
15.66 2.48 32
.46 * 14.1
Student Behavior Values
8.06 2.19 34
8.29 2.82 17
8.16 2.14 19
8.45 2.37 38
9.38 2.35 32
1.54 96<01 9.0
*No significant differences Scale Ranges: Teacher-Student Relationships=12-60; Security and Maintenance=7-35; Administration=6-35; Student Academic Orientations=4-20; Student Behavioral Values=3-15.
As shown in Table 9, there were no statistically significant differences between the means in
1996 and 1997 but 1999 and 2000 were significantly greater than 1996 in teacher-student
relationships (54.94 and 53.0 to 49.61 respectively). In 2001 the security and maintenance climate
was significantly greater than in 1997 (28.12 to 24.89). In 2001 the student behavioral values was
significantly greater than in 1996 (9.38 to 8.06).

53
TABLE 10
Analysis of University School Teacher Responses to the NASSP
School Climate Survey During Spring, 1996, 1997, 1999, 2000 and 2001. Part 2. Scale*
1996
M SD n
1997
M SD n
1999
M SD n
2000
M SD n
2001
M SD n
F
Paired Comparisons
Norm Group
M
Guidance
16.22 2.04 32
16.63 2.43 19
18.26 1.59 19
17.10 1.98 39
17.60 1.94 30
3.86 96<01 96/97/00
<99
16.1
Student-Peer Relation-ships
14.91 1.91 33
15.94 2.90 18
15.39 1.97 18
15.0 2.48 40
Graphics
15.75 2.50 32
1.02 * 14.8
Parent & Community School Relations
13.53 3.48 30
13.59 3.57 17
14.53 1.68 15
13.49 2.85 35
14.38 3.24 29
.69 * 13.2
Instructional Manage-ment
27.19 4.04 31
26.63 4.40 16
26.26 3.69 19
26.57 4.15 37
27.64 3.89 28
.48 * 27.4
Student Activities
17.66 2.04 29
18.22 1.70 18
18.35 1.54 17
17.20 2.21 35
17.68 2.37 31
1.22 * 16.2
*No significant differences Scale Ranges: Guidance=4-20; Student-Peer Relationships=4-20; Parent & Community-School Relations=4-20; Instructional Management=7-35; Student Activities=4-20.
In 2001 the guidance climate in Table 10 was significantly greater than 1996 (17.60 to
16.22). 1999 was the most significant year for guidance where it finished significantly greater than
1996, 1997 and 2000 (18.26 to 16.22, 16.63 and 17.10 respectively). Most categories vacillated over
the five surveys and all categories ended higher in 2001 than in the original survey in 1996. The only
two areas that were significantly different from start to finish were student behavioral values and
guidance. Six of the 10 categories had no significant differences over the five years.
Student Responses to Satisfaction Survey
The overall (all grades combined) responses to the NASSP Student Satisfaction Survey are
shown in Tables 11 & 12 and are graphically demonstrated in Appendix D.

54
TABLE 11
Analysis of Combined University School Student Responses to the NASSP
School Satisfaction Survey During Spring, 1996, 1997, 1999, 2000, and 2001. Part 1. Scale (See Note)
1996
M SD n
1997
M SD n
1999
M SD n
2000
M SD n
2001
M SD n
F
Paired
Comparisons
Norm Group
M Teachers 22.00 5.32
300
23.17 5.89 271
23.55 5.16 256
23.09 5.35 277
24.69 5.77 251
8.45 96< 97/99/00/01 96/97/99/00
<01
24.0
Fellow Students
16.46 4.22 308
16.51 4.53 283
17.09 4.13 270
17.01 4.12 298
18.25 3.80 275
8.42 96/97/99/00 <01
17.2
School-work
16.53 4.29 304
16.93 5.40 275
17.35 4.30 259
16.81 4.53 271
Graphics
17.61 5.01 257
2.29 96<99 96<01
18.8
Student Activities
15.46 4.37 297
16.12 4.54 270
13.64 4.19 257
13.81 4.32 278
15.17 4.29 263
16.59 99/00<96 99/00/01<97
99/00<01
18.1
* No significant differences Note: Scale Ranges: Teachers=7-35; Fellow Students=5-25; Schoolwork=6-30; Student Activities=5-25;
The students’ satisfaction survey showed the second most significant changes in all
categories. Seven of the eight categories ended with significantly higher numbers in 2001 than
they began with in 1996. The only category that ended lower was satisfaction with student
activities and it was only slightly lower. Satisfaction with teachers was significantly greater in
1997, 1999, 2000, and 2001 over 1996 (22.0 to 23.17, 22.55, 23.09, and 24.69 respectively).
Satisfaction with fellow students was significantly higher in 2001 than in 1996, 1997, 1999, and
2000 (18.25 to 16.46, 16.51, 17.09, and 17.01 respectively). Schoolwork was significantly
greater in 1999 over 1996 (17.35 to 16.53) and in 2001 over 1996 (17.61 to 16.53). Satisfaction
with student activities was significantly higher in 1996 over 1999 and 2000 (15.46 to 13.64 and
13.81 respectively), was significantly higher in 1997 over 1999, 2000, and 2001 (16.12 to 13.64,
13.81, and 15.17), and in 2001 was significantly greater than 1999 and 2000 (15.17 to 13.64 and
13.81 respectively).

55
TABLE 12
Analysis of Combined University School Student Responses to the NASSP
School Satisfaction Survey During Spring, 1996, 1997, 1999, 2000, and 2001. Part 2. Scale (See Note)
1996
M SD n
1997
M SD n
1999
M SD n
2000
M SD n
2001
M SD n
F
Paired
Comparisons
Norm Group
M Student Discipline
18.68 4.76 313
19.47 4.83 277
19.36 4.28 271
19.36 4.87 282
20.75 4.80 264
7.07 96<99 96/97/99/00
<01
20.1
Decision-making Opportun-ities
11.56 4.10 230
14.46 4.94 222
12.27 4.60 209
12.31 4.59 222
14.26 4.74 211
17.77 96/99/00 <97
96/99/00 <01
15.0
School Building, Supplies & Upkeep
18.40 4.94 324
18.27 5.49 280
19.46 4.68 285
18.66 5.00 311
Graphics
19.82 5.02 260
5.15 96/97<99 96/97/00
<01
21.9
Communi-cation
15.03 4.00 300
16.37 4.58 295
15.08 4.01 276
14.99 4.43 291
17.04 4.26 250
13.03 96/99/00 <97
96/99/00 <01
20.5
* No significant differences Note: Scale Ranges: Student Discipline=6-30; Decision-making Opportunities=5-25; School Building, Supplies & Upkeep=6-30; Communication=6-30.
Satisfaction with student discipline was significantly greater in 1997 than in 1996 (18.68
to 19.47), and in 2001 the value was significantly greater than all four years 1996, 1997, 1999,
and 2000 (20.75 to 18.68, 19.47, 19.36, and 19.36 respectively). Satisfaction with decision-
making was significantly greater in 1997 than in 1996, 1999, and 2000 (14.46 to 11.56, 12.27,
and 12.31 respectively) and 2001 was significantly greater than 1996, 1999, and 2000 (14.26 to
11.56, 12.27, and 12.31 respectively). Students’ satisfaction with school building, supplies, and
upkeep was significantly greater in 1999 than that in 1996 and 1997 (19.46 to 18.40 and 18.27
respectively) and in 2001 it was significantly greater than 1996, 1997, and 2000 (19.82 to 18.40,
18.27, and 18.66 respectively). Students’ satisfaction with communications was significantly
greater in 1997 than that in 1996, 1999, and 2000 (16.37 to 15.03, 15.08, and 14.99 respectively)
and in 2001 it was significantly greater than 1996, 1999, and 2000 (17.04 to 15.03, 15.08, and
14.99 respectively).
To recap, in three areas satisfaction levels fell off significantly between 1997 and 1999
and remained significantly low in 2000. Two of those areas recovered significantly in 2001,
decision-making opportunities and communications and student activities recovered slightly.
Satisfaction increased significantly between 1996 and 1997 in four areas, teachers, discipline,

56
decision-making opportunities, and communications. Satisfaction showed a significant increase
between 1996 and 1999 in three areas, teachers, schoolwork, and school buildings supplies and
upkeep. Satisfaction showed a significant increase between 1996 and 2000 in one area, teachers.
Satisfaction showed a significant increase between 1996 and 2001 in seven areas, all but student
activities.
Overall there were 44 statistically significant differences in the students’ surveys. There
were only 13 statistically significant differences that were decreasing over time, and 7 of those
were in the category of student activities. The remaining 31 statistically significant differences
were positive over time. This showed a positive trend of acceptance of YRS by the students at
US.
Overall it appears that students were less satisfied with the student activities, student
discipline, decision-making opportunities, and communications in their second and third years of
YRS but were very satisfied with all but student activities by the end of the survey process in
2001. In most other areas students’ satisfaction increased significantly showing a high level of
satisfaction for teachers, schoolwork, student discipline, and the school building, supplies, and
upkeep after the implementation of YRS although most categories fell off slightly after the initial
evaluation.
Student Responses to Climate Survey
Responses to the School Climate Survey are presented in Table 13 & 14 and are
graphically demonstrated in Appendix D.

57
TABLE 13
Analysis of University School Student Responses to the NASSP
School Climate Survey During Spring, 1996, 1997, 1999, 2000 and 2001. Part 1. Scale (See Note)
1996
M SD n
1997
M SD n
1999
M SD n
2000
M SD n
2001
M SD n
F
Paired
Compari-sons
Norm Group
M Teacher-Student Relationships
36.12 8.54 259
37.38 10.10 223
37.56 8.90 225
35.83 9.85 235
39.95 9.29 199
6.55 00<99 96/97/99/00
<01
39.2
Security and Maintenance
25.25 5.48 229
25.05 5.63 218
25.87 4.69 197
23.97 6.06 201
Graphics
25.61 5.31 208
3.64 00< 96/97/99/01
26.5
Administration
16.99 5.60 221
21.33 5.81 208
17.89 5.41 204
17.59 5.58 216
20.02 4.94 216
23.87 96/99/00/01 <97
96/99/00 <01
20.3
Student Academic Orientation
12.24 3.61 289
12.41 3.42 258
12.35 3.19 260
11.65 3.36 272
12.80 3.32 243
3.91 00< 96/97/99/01
13.5
Student Behavioral Values
6.32 2.49 339
6.76 2.69 318
7.18 2.69 311
7.34 2.84 312
8.13 2.81 283
19.27 96< 97/99/00/01
97<00 96/97/99/00
<01
7.6
* No significant differences Scale Ranges: Teacher-Student Relationships=12-60; Security and Maintenance=7-35; Administration=6-35; Student Academic Orientation=s=4-20; Student Behavioral Values=3-15.
The students’ climate survey showed the most significant changes in all categories. Six of
the 10 categories ended with significantly higher and three ended with higher numbers in 2001
than they began with in 1996. The only category that ended lower was student activities climate.
The climate survey of the students showed a significantly greater climate in teacher-student
relations in 1999 than that of 2000 (37.56 to 35.83) and the climate in 2001 was significantly
greater than the other four years 1996, 1997, 1999, and 2000 (39.95 to 36.12, 37.38, 37.56, and
35.83 respectively). Security and maintenance in 2000 was significantly less than in 1996, 1997,
1999, or 2001 (23.97 to 25.25, 25.05, 25.87, and 25.61 respectively). The administration climate
was significantly greater in 1997 than 1996, 1999, 2000, and 2001 (21.33 to 16.99, 17.89, 17.59,
and 20.02 respectively) and administration climate was significantly greater in 2001 than 1996,
1999, and 2000 (20.02 to 16.99, 17.89, and 17.59 respectively). The student academic orientation
climate was significantly less in 2000 than in 1996, 1997, 1999, and 2001 (11.65 to 12.24, 12.41,
12.35, and 12.80 respectively). There was a significant increase each year in student behavioral
values from 1996 to 1997 (6.32 to 6.76), 1997 to 1999 (6.76 to 7.18) and 1999 to 2000 (7.18 to
7.34) and from 2000 to 2001 (7.34 to 8.13). This was the only category that showed significant
increases for all follow-on surveys.

58
TABLE 14
Analysis of University School Student Responses to the NASSP
School Climate Survey During Spring, 1996, 1997, 1999, 2000 and 2001. Part 2. Scale (See Note)
1996
M SD n
1997
M SD n
1999
M SD n
2000
M SD n
2001
M SD n
F
Paired
Compari-sons
Norm Group
M Guidance
13.30 4.18 275
14.89 3.72 289
14.37 3.59 250
13.53 3.85 274
14.47 3.66 240
8.53 96< 97/99/01
00< 97/99/01
15.1
Student-Peer Relationships
12.74 3.83 290
13.10 3.89 280
12.94 3.56 267
12.68 4.21 285
13.61 3.63 263
2.57 96/99/00 <01
13.7
Parent & Community School Relations
12.05 3.66 177
11.98 3.56 177
11.36 3.62 168
11.46 3.61 193
Graphics
12.48 3.55 194
3.01 99/00<01 13.9
Instructional Management
23.65 4.45 304
24.16 4.62 267
23.48 4.23 257
23.34 4.39 266
24.54 5.02 253
3.18 00<97 96/99/00
<01
26.2
Student Activities
14.65 3.39 243
14.51 3.79 236
13.50 3.61 222
12.85 3.84 225
13.81 3.66 225
9.52 99/00/01 <96/97
14.7
* No significant differences Scale Ranges: Guidance=4-20; Student-Peer Relationships=4-20; Parent & Community-School Relations=4-20; Instructional Management=7-35; Student Activities=4-20.
The guidance climate was significantly greater in 1997, 1999, and 2001 over 1996
(14.89, 14.37, and 14.47 respectively to 13.30) and the climate in 1997, 1999, and 2001 was
significantly greater than in 2000 (14.89, 14.37, and 14.47 respectively to 13.53). The student-
peer relations climate in 2001 was significantly greater than in 1996, 1999, and 2000 (13.61 to
12.74, 12.94, and 12.68 respectively). The parent-community school relations’ climate was
significantly greater in 2001 than 1999 and 2000 (12.48 to 11.36 and 11.46 respectively). The
instructional management climate in 1997 was significantly greater than 2000 (24.16 to 23.34)
and 2001 was significantly greater than 1996, 1999, and 2000 (24.54 to 23.65, 23.48, and 23.34
respectively). The student activities climate steadily declined from 14.65 in 1996 to 14.51 in
1997 to 13.50 in 1999, to 12.85 in 2000 but recovered slightly to 13.81 in 2001. 1996 and 1997
were significantly greater than 1999, 2000, and 2001.
There were slight declines, yet not significant, indicated between 1997 and 1999 in five
categories: student academic orientation, guidance, student-peer relations, parent & community
school relations, and instructional management. Three of those five became significant declines
from 1997 to 2000: student academic orientation, guidance, and instructional management.
Student-peer relations declined slightly between 1999 and 2000 but it was not significant. There

59
was a steady decline over the first four periods in only one category, student activities,
recovering slightly in 2001. Only three climate areas increased between 1997 and 1999: teacher-
student relations, security and maintenance, and student behavioral values and only one area
increased significantly and consistently over the four years, student behavioral values. It appears
that the 1997 time frame survey indicated the students’ excitement of a new process then in the
1999 and 2000 surveys they demonstrated a more informed and less enthusiastic evaluation of
the YRS. Of the ten categories examined with the survey, nine finished above the original value
in 1996 and only one finished below, student activities. Of these nine categories six of them
finished significantly greater than the 1996 values indicating an overwhelming acceptance of the
climate created by the YRS conversion.
Patterns of Satisfaction Responses Across Grade Levels
In an effort to determine if the overall responses of students were due to a weighting
based on responses from a particular class, an analysis was undertaken to look for significant
differences within each grade level over the four survey periods. Analyses for each grade are
summarized in Table 15 and graphically demonstrated in Appendix E, where only the
statistically significant differences are shown. The focus of this table is on the overall pattern of
student differences across grade levels. As shown in the table, there were fewer differences in the
6th and 10th grade levels. The grades with the most differences were the 12th, 9th and 7th
respectively. The only two instances where the level of satisfaction actually was lowered
between 1996 and 1997 occurred during the seventh grade, where students scored lower on the
scales relating to their fellow students, student discipline and school Buildings, Supplies and
Upkeep. Thus seventh grade students appeared to be less satisfied with their peer group relations,
the student discipline system, the quality and availability of resources at the school and the
upkeep of the facilities in 1997. It is interesting to note that these two decreases occurred at the
grade level where roughly one-half the student body doubles each year, as US selects
approximately 30 new students each year, via a lottery system, to join the existing cohort that is
moving into the 7th grade.

60
TABLE 15
Patterns of Significant Differences on the NASSP
Student Satisfaction Survey Where Data Were Collected in Each Grade During
Spring, 1996, 1997, 1999, 2000 & 2001. (Graphics available for high school students only). Comparison
Teachers Fellow Students
School Work
Student Activities
Student Discipline
Decision-Making Opportunity
School Building, Supplies, Upkeep
Communica- tion
All 6th Grades
00 < 96 00 < 97
00<97 99 < 97 00 < 99 96 < 01 96 < 99 00 < 99
All 7th Grades
97 < 00 97 < 01 99 < 01
97 < 96 97 < 00 97 < 01 99 < 01
99 < 96 99 < 01 00 < 96 00 < 01
97 < 00 97 < 01 99 < 01
96 < 01 97 < 01 99 < 01 00 < 01
97 < 96 97 < 99 97 < 00 97 < 01
96 < 01 97 < 01 99 < 01 00 < 01
All 8th Grades
96 < 99 96 < 00 96 < 01 97 < 99 97 < 00 97 < 01
96 < 99 96 < 01 97 < 01
96 < 00 96 < 01 97 < 00 97 < 01 99 < 00
99 < 96 99 < 97
96 < 01
97 < 99 97 < 01
All 9th Grades
96 < 97 96 < 99 96 < 01
Graphics
96 < 01 00 < 99 00 < 01
96 < 97 99 < 97 00 < 97 01 < 97
96 < 00 96 < 01
Graphics
96 < 97 96 < 01 99 < 97 99 < 01 00 < 97 00 < 01
96 < 97 96 < 00 96 < 01 99 < 97 99 < 01 00 < 01
96 < 97 96 < 01 99 < 97 99 < 01 00 < 97
All 10th Grades
00 < 97 99 < 97 00 < 97
00 < 97 00 < 97 00 < 96
99 < 97 00 < 96 00 < 97
All 11th Grades
96 < 97 96 < 99 96 < 00
96 < 99 96 < 00 96 < 01
96 < 00 96 < 01 97 < 00
96 < 97 96 < 99 99 < 97 00 < 97 01 < 97
96 < 97 96 < 99 96 < 01
All 12th Grades
96 < 97 96 < 99 96 < 00 96 < 01 97 < 01 99 < 01 00 < 01
96 < 01 97 < 01
96 < 01 99 < 96 99 < 97 99 < 01 00 < 96 00 < 97 00 < 01
00 < 97 96 < 01 97 < 01 99 < 01 00 < 01
96<00 96<01 99<97 99<01 00<97 00<01
96 < 97 96 < 01 99 < 97 99 < 01 00 < 97 00 < 01
Comparisons are [ First #] is significantly greater (>) or significantly smaller (<) than the [Second #] Shaded areas ------- indicate that 1997 figures were significantly greater than 1996, 1999 and 2000 Scale Ranges: Teachers=7-35; Fellow Students=5-25; Schoolwork=6-30; Student Activities=5-25; Student Discipline=6-30; Decision-making Opportunities=5-25; School Building, Supplies & Upkeep=6-30; Communication=6-30.
This table also reveals what appears to be a pattern of change that is most pronounced on the
teachers, decision-making opportunity and communication scales as students move through the high
school years from 1996 to 2001. These positive changes also appear to increase from the 9th to the

61
12th grade. Overall, however, it appears that the grade level exhibiting the most difference was the
9th grade, where significant changes were seen in five of eight categories from 1996 to 1997 and all
eight categories from 1996 to 2001. Students seemed to be more satisfied with the professional
behaviors of teachers, with the opportunity to provide input into decision-making at the school and
with the availability of information and opportunity to communicate with others about school events
and issues after the implementation of YRS.
The surveys in 2001 accumulated an overwhelming majority of the significantly positive
results where 60 out of a total 142 significant differences were recorded. Conversely, there were
only 2 significantly negative responses for 2001. In 1996 there were 52 significantly negative
differences and only 10 significantly positive differences. This isolated comparison of 1996 and
2001data indicates an overwhelming positive response to the transition to YRS. 1997 had the
second largest number of positively significant differences with 40 and all the rest of the years were
below 18. Over the five survey periods the single area where students indicated they were
significantly less satisfied from start to finish was in student activities, but it did mount a small
recovery in 2001. All but the 11th graders indicated that satisfaction was significantly less in 1999,
2000, or 2001 than in 1996 or 1997. It appears that the implementation of YRS has, in the opinion
of the students, significantly affected, in the negative direction, the amount and/or quality of student
activities.
The grades that were the most overall dissatisfied in the year 2000 were the 9th, 10th, and 12th
grades and the grade most overall dissatisfied in 1997 was the 7th grade. The 12th grade showed the
most improvement from 1996 to 2001 and the 9th grade showed the second most.
The category with the least amount of changes over the five periods was schoolwork with
only 8 values, 6 that were positive. The category with the most significant changes was teachers and
22 of the 25 values were in the positive direction. The second category for most significant changes
was decision-making and 16 of 24 values were positive. The category with the least positive-to-
negative ratio was student activities where only 5 of 19 significant differences were positive.
Overall there were 142 significant differences in the student satisfaction surveys and 100 of those
were positive for YRS.
One final analysis is worthy of mention for the satisfaction surveys: 1996 was indicated as
the least satisfying year with a total of 52 significantly negative results and the year 2000 was listed
a distant second with 34. The most significantly satisfying year was 2001 where 60 times a

62
significantly positive indication was listed with only 2 times as least satisfying with the next closest
year to that, 1997, having 40 positive significantly satisfying values.
Patterns of Climate Responses Across Grade Levels
A similar analysis of patterns was completed on the School Climate Survey. Detailed graphs
for these comparisons are provided in Appendix E and the significant results only are shown here in
Table 16. Graphics are only available for high school students.

63
TABLE 16
Patterns of Significant Differences on the NASSP
School Climate Survey Where Data Were Collected in Each Grade During Spring
1996, 1997, 1999, 2000, & 2001. (Graphs available for high school students only). Comparison
Teacher-Student Relations
Security and Main-tenance
Admin-istration
Student Academ Orienta- Tion
Student Behavioral Values
Guid-ance
Student-Peer Rela- tions
Parent, Commu nity, School Relations
Instruc -tional Management
Student Activi- ties
All 6th Grades
00 < 96
96 < 99 96 < 01 00 < 99 00 < 01
96 < 97 96 < 01
00 < 99 96 < 99 97 < 99 00 < 99 01 < 99
00 < 96 00 < 97 01 < 96 01 < 97
00 < 97 99 < 96 00 < 96 00 < 01
00 < 96 00 < 97
00 < 96 00 < 97 00 < 99 00 < 01
All 7th Grades
96 < 01 97 < 96 97 < 99 97 < 00 97 < 01 99 < 01 00 < 01
97 < 96 97 < 99 97 < 00 97 < 01
96 < 01 97 < 01 99 < 01 00 < 01
97 < 96 97 < 99 97 < 00 97 < 01
96 < 00 96 < 01 97 < 00 97 < 01 99 < 00 99 < 01
97 < 96 97 < 99 97 < 01 00 < 99 00 < 01
97 < 96 97 < 99 97 < 00 97 < 01
97 < 96
96 < 01 97 > 99 97 < 00 97 < 01 99 < 01 00 < 01
97 < 96 00 < 96
All 8th Grades
97 < 01 00 < 97
96 < 01 96 < 01 00 < 01
99 < 96 00 < 96 01 < 96
All 9th Grades
96 < 01 00 < 01 Graphics
99 < 97 96 < 97 96 < 01 99 < 97 99 < 01 00 < 97 00 < 01
96 < 97 96 < 01
96 < 97 96 < 00 96 < 01 97 < 01 99 < 01 00 < 01
99 < 97 99 < 00 99 < 01 Graphics
96 < 97 96 < 00 96 < 01
96 < 01 99 < 01 00 < 01
All 10th Grades
96 < 97 00 < 97
00 < 96 00 < 97 00 < 99 01 < 96 01 < 97 01 < 99
96 < 97 99 < 97 00 < 97 01 < 97
96 < 97 96 < 00 96 < 01 97 < 01 99 < 01 00 < 01
96 < 97 96 < 99 00 < 97 00 < 99 01 < 97 01 < 99
00 < 96 00 < 97
00 < 97 01 < 97
99 < 97 00 < 96 00 < 97 00 < 99 01 < 97
All 11th Grades
01 < 99 96 < 97 99 < 97 00 < 97 01 < 97
99 < 96 96 < 01 97 < 00 97 < 01
96 < 97 96 < 99 00 < 97 00 < 99 01 < 97
96 < 97 99 < 97 00 < 97
01 < 96
All 12th Grades
96 < 97 96 < 99 96 < 00 96 < 01
96 < 97 96 < 99 96 < 00 96 < 01 99 < 97 00 < 97
96 < 01 00 < 97 00 < 01
96 < 99 96 < 00 96 < 01 97 < 01
96 < 97 96 < 99 96 < 01 00 < 97 00 < 01
96 < 01 00 < 01
99 < 01 96 < 97 96 < 01 99 < 97 99 < 01
99 < 97 99 < 01 00 < 97 00 < 01
Comparisons are [ First #] is significantly greater (>) or significantly smaller (<) than the [Second #] Scale Ranges: Teacher-Student Relationships=12-60; Security and Maintenance=7-35; Administration=6-35; Student Academic Orientation=4-20; Student Behavioral Values=3-15; Guidance=4-20; Student-Peer Relationships=4-20; Parent & Community-School Relations=4-20; Instructional Management=7-35; Student Activities=4-20.

64
As shown in Table 16, students in 7th grade indicated they were less satisfied on eight of the
ten school climate dimensions from 1996 to 1997 and were significantly more satisfied with the
climate in five of those from 1997 to 1999. Students in high school showed 14 significant positive
changes in climate from 1996 to 1997, seven significant positive changes in climate from 1996 to
1999, only one significant positive change from 1999 to 2000, and 9 from 2000 to 2001. There were
55 significantly negative changes in the year 2000 and 54 in 1996. Administration climate appears
to have been significantly better in 1997 than the other four years for the sixth graders and all four
grades in high school. 2001 was significantly better for 7th graders plus three other grades. The only
other area where this occurred is for juniors in parent-community school relations and seniors for
instructional management where 1997 and 2001 were significantly greater. For other high school
grades significant positive climates existed in teacher-student relations, student academic
orientation, student behavioral values, student peer relations, and parent community school
relations. Again there were nine indications that 1997 was better than 1999 in school climate, five of
those indicators falling within the administration category. It seems clear that students, particularly
high school age students, were more positive about the extent that the administration was
communicating with them, the quality of the guidance program initially (1997), and administration
in 2000. The most significant year for high school student behavioral values was 2001 where every
grade level felt 2001 was significantly greater than at least two other years and in the case of the
freshmen and sophomores it was greater than all four years. They also seemed to indicate higher
level of satisfaction with their interpersonal and professional relationships with teachers and the
extent that students exhibited self-tolerance and tolerance for others.
A breakdown by grade indicates some very interesting results. The 8th grade demonstrated
the least number of changes over all categories and the 7th grade had the most significant changes
over the five surveys. The administration climate was significantly better in 1997 over all other
years in all grades except 7th and 8th, but student behavioral values was the category with the most
significant differences. As in the Satisfaction survey, the 7th grade rated 1997 lower than every other
year in all categories except administration and they had the largest number of significant
differences for all grades.
The 6th grade was the only grade that showed significant differences in every category, and
in each category they indicated a significant decline in the year 2000 from previous years. The 10th
and 12th grades tied for the second largest number of significant differences of all grades.

65
The overall trend was that the year 2000 was the least significant of all the years with a total
indication of 55 significantly negative comparisons. The next less satisfied year was prior to
implementation of YRS in 1996 with 54. The most significantly satisfactory year in all categories
appears to be 2001 by a margin greater than 2:1 against every year but 1997. The student behavioral
values climate was a narrow margin winner over guidance and administration. Therefore, for
satisfaction and climate, 2001 was the most positive year of the five years surveyed and the year
2000 was the most negative.
Patterns of Response Within Cohorts
Data from all five reporting periods were sorted by cohorts to provide a different
perspective of the results. Four cohorts were established to identify those students who
experienced this transformation to YRS along with their fellow students and a comparison was
made between group results. Cohorts were established as follows:
Cohort One Two Three Four
1996 9th 8th 7th 6th
1997 10th 9th 8th 7th
1999 12th 11th 10th 9th
2000 12th 11th 10th
2001 12th 11th
Although pre-to-post changes could not be determined in individual students because the
questionnaire was anonymous, an attempt was made to examine the responses of the same group
or cohort of students at all five points in time. Thus, the scores of 6th graders in 1996 were
compared to the scores of the same cohort as 7th graders in 1997, 9th graders in 1999, 10th graders
in 2000, and 11th graders in 2001. Clearly, there were some student additions and deletions from
the cohorts from one year to the next. The analysis does, however, provide some indication of
any "shifts" that might have occurred in the cohorts as a whole. The results for the Student
Satisfaction Surveys are shown in Table 17 and are graphically demonstrated in Appendix F.
This table indicates that there were a number of positive changes in the levels of
satisfaction expressed within these cohorts of students, particularly those in high school such as
Cohort One. As the senior cohort (graduating in 1999 therefore no responses in the 2000 & 2001

66
surveys), Cohort One indicated a significantly positive change in six of the eight categories. In
1996 to 1997 comparison there were significantly positive changes by at least one cohort in all
categories except fellow students and school buildings, supplies, and upkeep. A significantly
positive change from 1997 to 2001 was indicated 12 times, the most frequent, covering six of the
eight categories. Excluded were student activities and decision-making opportunities. An
increase from 1999 to 2001 occurred eight times being the second greatest category. Cohorts
Three and Four showed significant increases in every category in the year 2001 from at least one
previous year. An increase from 1997 to 1999 was made in four categories by at least one cohort
and two cohorts agreed for an increase in schoolwork. Overall the teacher category showed the
most consistent increases with all four cohorts showing a significant increase in satisfaction
through each cohort’s final survey (Cohort One’s final was 1999 and Cohort Two’s in 2000).
Another category, schoolwork, showed three of the four cohorts significantly satisfied over the
entire period. The 2000 survey tended to show some dissatisfaction across the board in six
categories with two categories having multiple cohorts dissatisfied. Overall the surveys showed
the cohorts were satisfied with the YRS in 1997 and 1999, not as satisfied in 2000 but
overwhelmingly satisfied in 2001, and only two Cohorts were surveyed in 2001. The analysis is
overall very positive for YRS with 1996 being less satisfying in 26 responses and 2001 being
more satisfying in 34 responses.
A breakdown of the satisfaction levels of cohorts is included below in Table17.

67
TABLE 17
Patterns of Significant Differences on the NASSP
School Satisfaction Survey When Comparisons are Made Between
Responses from Spring of 1996, 1997, 1999, 2000, and 2001 from the Same Cohort Comparison
Teachers
Fellow Students
School Work
Student Activities
Student Discipline
Decision-Making Opportunity
School Building, Supplies, Upkeep
Commun-ication
Cohort One
96 < 97 96 < 99 Graphics
96 < 97 99 < 97
96 < 97 Graphics
96 < 97 99 < 97
96 < 99 96 < 97
Cohort Two
96 < 97 96 < 99 96 < 00 Graphics
96 < 99 96 < 97 96 < 99 96 < 00
00 < 97
00 < 99 Graphics
00 < 97 00 < 99
Cohort Three
96 < 01 97 < 00 97 < 01 99 < 01 00 < 01 Graphics
97 < 01 99 < 01
96 < 99 96 < 00 96 < 01 97 < 99 97 < 00 97 < 01
99 < 01
96 < 00 96 < 01 97 < 01 99 < 01 Graphics
96 < 99 96 < 01 00 < 01
97 < 96 97 < 00 97 < 01
96 < 00 96 < 01 97 < 00 97 < 01 99 < 01 00 < 01
Cohort Four
97 < 96 97 < 99 97 < 01 00 < 96 00 < 99 01 < 96 Graphics
97 < 99 97 < 01 00 < 01
97 < 96 97 < 99 97 < 00 97 < 01 00 < 01
99 < 01
96 < 01 97 < 99 97 < 01 00 < 01 Graphics
96 < 01 97 < 01 99 < 01 00 < 01
97 < 01 99 < 01 00 < 01
Scale Ranges: Teachers=7-35; Fellow Students=5-25; Schoolwork=6-30; Student Activities=5-25; Student Discipline=6-30; Decision-making Opportunities=5-25; School Building, Supplies & Upkeep=6-30; Communication=6-30.
This table also indicates that as the cohort moves into higher grades, the magnitude of the
differences becomes larger, indicating a greater change. It is difficult to know whether this is due to
a more positive reaction to YRS at the higher grade levels or if the observed patterns are due to
developmental changes that occur as youth mature through high school.
Some of the results for this type of comparison have provided an interesting perspective to
the implementation of the YRS.
Cohort one had higher satisfaction levels in 99 than 96 in all categories and in 4 of the 8
steadily increased over their three periods. Only student activities finished lower in 99 than 96.
Cohort two peaked in 97 in 4 categories and ended below the 96 value in the 2000 surveys
in 2 categories (student activities and communications). It peaked in the other 4 categories in 99
with only one category finishing below 96 (student discipline). Cohort two, the graduating seniors
in 2000, had 11 significant changes and found 2000 less significant in 3 categories (student
activities, discipline, and communications).

68
Cohort three had the most significant changes with 30 and 17 of those indicated 2001 was
significantly better than previous years. This cohort was juniors in the 2000 survey and had the most
confused results. Three categories dipped in 97 and increased through 2000, three declined through
99 and recovered in 2000, but all ended higher in 2001.
Cohort four was very impressed with their sixth grade teachers and that high level held
through 2001. One-half of their 26 significant differences indicated that the later years were
significantly better than 1997 and 16 of their 26 positive significant differences indicated 2001 was
the best year.
Only considering the significant differences, 99 was significantly greater than the other
years 16 times and 97 was significantly greater 14 times. 96 was significantly less 17 times and
2000 was significantly less 12 times. The most significantly positive year was 99 and the least
significant was before implementation in 96.
The same type of analysis was completed for the School Climate Survey. The results are
reported in Table 18 and are graphically demonstrated in Appendix F.

69
TABLE 18
Patterns of Significant Differences on the NASSP
School Climate Survey When Comparisons are Made Between Responses
from the Spring of 1996, 1997, 1999, 2000, and 2001from the Same Cohort. Compar- ison
Teacher-Student Relations
Security and Main-tenance
Admin-istration
Student Academic Orienta Tion
Student Behavior Al Values
Guid-ance
Student-Peer Relations
Parent, Community, School Relations
Instruc tional Management
Student Activities
Cohort One
96 < 97 96 < 99 Graphics
96 < 97 96 < 99 99 < 97
96 < 97 96 < 99
96 < 97 Graphics
96 < 97 96 < 99
96 < 97 96 < 97 99 < 97
96 < 97 99 < 97
Cohort Two
Graphics
96 < 99 99 < 97 00 < 97 96 < 00
Graphics
00 < 96
Cohort Three
96 < 01 97 < 00 97 < 01 Graphics
97 < 01 96 < 01 97 < 01 99 < 01 00 < 01
99 < 01
96 < 00 96 < 01 97 < 00 97 < 01 99 < 00 99 < 01
00 < 99 00 < 01 Graphics
99 < 01 99 < 96 00 < 96 00 < 01
96 < 01 97 < 01 00 < 01
97 < 01
Cohort Four
97 < 96 97 < 99 97 < 01 99 < 96 00 < 96 01 < 96 Graphics
96 < 99 96 < 01 97 < 99 97 < 01 00 < 01
96 < 97 96 < 99 96 < 00 96 < 01
97 < 99 97 < 01
96 < 00 96 < 01 97 < 00 97 < 01
97 < 96 97 < 01 99 < 96 00 < 96 Graphics
97 < 01 97 < 96 99 < 96 00 < 96 01 < 06
97 < 96 97 < 99 97 < 00 97 < 01
Scale Ranges: Teacher-Student Relationships=12-60; Security and Maintenance=7-35; Administration=6-35; Student Academic Orientation=4-20; Student Behavioral Values=3-15; Guidance=4-20; Student-Peer Relationships=4-20; Parent & Community-School Relations=4-20; Instructional Management=7-35; Student Activities=4-20.
This table indicates 79 significant differences over the 10 climate categories.
Cohort one had only 15 significant differences and showed that 96 had a significantly less
appealing climate over 97 in 8 of the 10 categories. They also had no significant differences in two
categories (security and maintenance and student academic orientation). Five categories were
significantly less in 96 than in 99 and only 3 were less in 99 than 97.
Cohort two had the least number of significant differences with 5. There were no strong
indications of any real patterns for cohort two.
Cohort three had 25 significant differences and 18 of those indicated that 2001 had a
significantly better climate than 96, 97, 99, and 2000. Their student behavioral value was less all 3
of the first three years than in 2000 and 2001.
Cohort four had the largest number of significantly different values with 34. In 12 of these,
96 had a significantly better value than the other years, the reverse of cohort one. 97 was less

70
significant than the other years in 17 of the 34 indicators. The 2001 scores were significantly greater
than at least one year in all categories except parent, community-school relations.
The overall trend including all differences revealed: for cohort one all 10 categories the 97
value was higher than the 96 value. In 3 categories it continued to climb in 99 and the other 7 it
decreased. Only 1 category fell below the 96 value in 99 and that was instructional management.
Cohort two increased all five years in behavioral values and teacher relations and declined all five
years in student activities. Three categories peaked in 99 and one in 97. Two categories vacillated
and one dipped in 99 with no significance. Cohort three had two categories dip in 97 and recover
and two categories dip to 99 and recover. One category declined over the periods, parent school
community relations, and the other 5 categories vacillated over the four years but not significantly.
All categories ended higher in 2001 than 1996. Cohort four had 7 categories dip from 96 to 97 and 4
increased through 2000, while 3 increased in 99 and declined in 2000. Six categories finished lower
in 2000 than 96 and four of those recovered in 2001. Only two categories finished significantly
lower in 2001 than 1996, teacher-student relations and parent community-school relations. Only one
category increased consistently over the 5 periods, behavioral values.
Phase One Conclusions
These results provide evidence that the implementation of YRS at University School was
associated with increases in the level of student satisfaction with several aspects of the school. It
seems clear that there was a positive change in the level of satisfaction with the ability of the
school's administration to communicate effectively with different groups and with the guidance
services provided at the school. There also was a change in the belief that students were exhibiting
more self-discipline and tolerance for others. This was coupled with a positive change in satisfaction
with the channels of communication that exists at the school. Clearly, there were significant shifts in
the level of student satisfaction with University School from the pre-implementation of YRS to 8
months into the first year of the new calendar through the two year eight month, three year eight
month, and four year eight month time frame. It is also clear that students in the 7th and 8th grade
became less satisfied with aspects of the school. School personnel may want to examine the reasons
for this shift and determine if there are interventions or programmatic changes that might help these
students through these difficult years. The indications also exist that in the 2000 survey the overall
satisfaction level and climate may have fallen off but in the 2001 survey most indicators were strong

71
again. This could be the result of repeated surveys in the school and the reluctance to provide
meaningful answers due to the seemingly never-ending survey process then the exuberance of
having the final survey in hand.
It is not clear from these findings, however, whether these changes were the direct result of
the change to a year-round school calendar or due to additional "confounding" factors like the
change in the administrative staff, new student migrations into the school (and emigrations out),
changes in teaching personnel were about 60% over the five years, or natural change in maturity
level of teenagers from pre-teen. Obviously, just the fact that students felt "different" or special
could have lead to changes in satisfaction. Most of the significant changes centered around issues
related to school communication processes, relationships between different groups and improved
student behaviors. There were fewer changes on scales related to "academic orientation",
"instructional management processes", "student activities", or "curriculum". These are things that
might be considered more directly related to a change to a YRS. It should be noted, however, that
although there were not statistically significant changes on all scales, it was only in the seventh
grade that there were any significant decreases in satisfaction. In the vast majority of comparisons
across grade levels, the changes were slightly positive, if not statistically significant.
It is clear that parents indicated they were more positive about the school leadership and the
fact that the administration was communicating with them. It is practically important that nearly all
the parent changes were in a positive direction, although many of them were not statistically
significant. This is also true for the teachers, who expressed slightly higher levels of satisfaction on
most scales, although they were not considered statistically significant due, in part, to the small
number of cases.
The findings gave empirical evidence that, at least in this somewhat unique, K-12 public
school, the change from a traditional calendar to a year-round education program was associated
with a positive change in student and parent satisfaction with the school. In those areas where
statistically significant differences were not identified, there was at least no significant decrease in
satisfaction, indicating that the change to YRS was not dissatisfying. The evidence suggests that the
YRS program was associated with an overall positive change in the level of satisfaction with the
school.

72
Phase Two
Parent Responses to May Survey
Parent responses to the Parent May Survey are shown in Table 19 through 23 and are
graphically demonstrated in Appendix G. Only topics in bold are subject of this study.
TABLE 19
Analysis of University School Parent Responses
to the May Survey in 1996, 1997, 1999, 2000, and 2001.
Part I: Beliefs About Teaching and Learning at University School (Questions 1-6)
Scale (See Note)
1996
M SD n
1997
M SD n
1999
M SD n
2000
M SD n
2001
M SD n
F
Paired
Comparisons
Can achieve goals
3.21 .67 121
3.29 .66 116
3.23 .58 79
3.18 .72 127
3.53 .62 75
3.66 ALL 4 <01
School sets high standards
3.30 .77 122
3.35 .74 115
3.29 .70 79
Graphics
3.22 .86 128
3.24 .87 75
.48 *
Learning is fun 2.66 .79 121
2.72 .74 117
2.82 .71 79
2.94 .80 126
3.11 .73 75
5.22 96/97<00 96/97/99
<01 Students respect good grades
2.69 .78 117
2.88 .61 116
2.77 .70 78
2.92 .81 124
3.12 .75 75
4.36 96<00 96/97/99
<01 Students seek extra work
2.45 .73 119
2.69 .75 115
2.61 .91 77
2.60 .87 125
2.71 .72 75
1.73 96<97/01
Effective learning atmosphere
2.80 .78 121
2.98 .64 117
2.86 .71 80
2.98 .90 127
3.17 .70 75
3.14 96/99<01
* No significant differences In Paired comparisons: “<” means “Significantly Less Than”. Note: Scale Ranges: 1-5.
As shown in Table 19, Part I of the survey where parents were questioned about their beliefs
about teaching and learning at the University School. Nine of the 12 categories showed a significant
difference between 1996 and 2001. Two categories steadily increased over the five-year period,
learning is fun (a significant increase) and students are prepared for the future (not significant). The
three categories that had no significant increases are schools set high standards, academic
achievement improvement, and students prepared for the future. Parents indicated that students’
respected good grades significantly more in 2001 than 1996, 1997, and 1999. It was also indicated

73
that students sought extra work to help their grades significantly more in 1997 and 2001 than in
1996 plus the students tried to improve themselves in 1997, 2000, and 2001 more than in 1996 or
1999.
TABLE 20
Analysis of University School Parent Responses
to the May Survey in 1996, 1997, 1999, 2000, and 2001.
Part I: Beliefs About Teaching and Learning at University School (Questions 7-12)
Scale (See Note)
1996
M SD n
1997
M SD n
1999
M SD n
2000
M SD n
2001
M SD n
F
Paired
Comparisons
Teachers believe in student ability
3.13 .74 121
3.25 .66 117
3.21 .57 80
3.21 .79 127
3.41 .64 75
1.94 96/00<01
Academic achievement recognized
3.20 .75 122
3.26 .70 116
3.15 .75 79
3.07 .83 127
3.27 .88 75
1.21 *
Proud to have child attend
3.27 .84 121
3.43 .78 115
3.33 .74 80
Graphics
3.37 .85 128
3.55 .66 75
1.58 96<01
Students try to improve
2.76 .75 119
2.98 .72 117
2.78 .66 78
2.95 .78 125
3.04 .56 75
3.04 96< 97/00/01 99<01
Environment is orderly
2.73 .76 122
2.92 .72 117
2.68 .73 79
2.89 .86 127
2.99 .78 75
2.57 99<97 96/99<01
Students prepared for future
3.05 .79 121
3.08 .88 117
3.10 .72 80
3.13 .82 127
3.19 .87 75
.40 *
* No significant differences In Paired comparisons: “<” means “Significantly Less Than”.
The environment was more orderly and serious in 2001 than 1996 and 1999. In nine of the
12 categories the analysis showed the satisfaction level was better in 1997 than in 1996 or 1999 and
eight of those were better in 1997 than 2000. Only one category was larger in 1997 than 2001,
school sets high standards. The overall analysis is positive for the YRS implementation with all 12
categories showing an increase in 2001 with nine of those significantly positive.
Parent responses to the Part II are shared opinions of year-round schooling. These results are
shown in Table 21 and are graphically demonstrated in Appendix G.
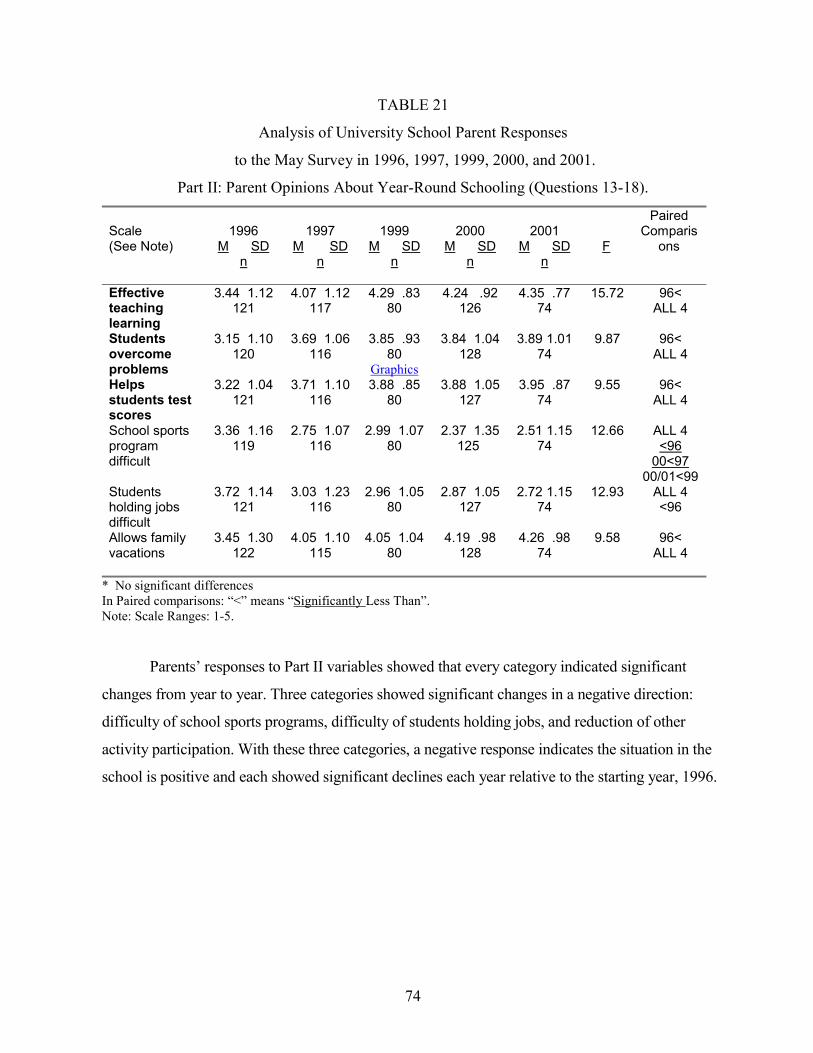
74
TABLE 21
Analysis of University School Parent Responses
to the May Survey in 1996, 1997, 1999, 2000, and 2001.
Part II: Parent Opinions About Year-Round Schooling (Questions 13-18).
Scale (See Note)
1996
M SD n
1997
M SD n
1999
M SD n
2000
M SD n
2001
M SD n
F
Paired Comparis
ons
Effective teaching learning
3.44 1.12 121
4.07 1.12 117
4.29 .83 80
4.24 .92 126
4.35 .77 74
15.72 96< ALL 4
Students overcome problems
3.15 1.10 120
3.69 1.06 116
3.85 .93 80
Graphics
3.84 1.04 128
3.89 1.01 74
9.87 96< ALL 4
Helps students test scores
3.22 1.04 121
3.71 1.10 116
3.88 .85 80
3.88 1.05 127
3.95 .87 74
9.55 96< ALL 4
School sports program difficult
3.36 1.16 119
2.75 1.07 116
2.99 1.07 80
2.37 1.35 125
2.51 1.15 74
12.66 ALL 4 <96
00<97 00/01<99
Students holding jobs difficult
3.72 1.14 121
3.03 1.23 116
2.96 1.05 80
2.87 1.05 127
2.72 1.15 74
12.93 ALL 4 <96
Allows family vacations
3.45 1.30 122
4.05 1.10 115
4.05 1.04 80
4.19 .98 128
4.26 .98 74
9.58 96< ALL 4
* No significant differences In Paired comparisons: “<” means “Significantly Less Than”. Note: Scale Ranges: 1-5.
Parents’ responses to Part II variables showed that every category indicated significant
changes from year to year. Three categories showed significant changes in a negative direction:
difficulty of school sports programs, difficulty of students holding jobs, and reduction of other
activity participation. With these three categories, a negative response indicates the situation in the
school is positive and each showed significant declines each year relative to the starting year, 1996.

75
TABLE 22
Analysis of University School Parent Responses
to the May Survey in 1996, 1997, 1999, 2000, and 2001.
Part II: Parent Opinions About Year-Round Schooling (Questions 19-24).
Scale (See Note)
1996
M SD n
1997
M SD n
1999
M SD n
2000
M SD n
2001
M SD n
F
Paired Comparis
ons
Presents single parents obstacles
3.28 1.18 118
2.99 1.03 116
3.06 1.00 80
3.09 2.84 124
2.73 .96 74
1.28 01<96
Allows enrichment classes
3.65 .91 115
3.97 .99 115
4.13 .72 80
4.15 .85 128
4.26 .84 74
7.66 96< ALL 4 97<01
Greater learned mat’l retention
3.57 1.04 122
3.97 1.02 117
4.06 .96 80
Graphics
4.12 .89 128
4.24 .81 74
7.93 96< ALL 4
Class review time reduced
3.52 .91 121
3.87 1.03 117
4.04 .89 80
3.97 .97 127
4.14 .88 74
6.27 96< ALL 4
Other activity participation reduced
3.47 1.13 121
3.02 1.19 117
3.00 1.10 80
2.96 1.07 127
2.89 1.14 73
4.68 ALL 4 <96
Reduces student stress
3.03 1.02 119
3.54 1.00 117
3.47 .98 79
3.60 1.02 127
3.74 1.01 73
7.68 96< ALL 4
* No significant differences In Paired comparisons: “<” means “Significantly Less Than”. Note: Scale Ranges: 1-5.
Only one category showed a positive trend that may indicate a problem area. Parents
indicated class review time was reduced significantly over the five surveys and that may
adversely affect the students.

76
TABLE 23
Analysis of University School Parent Responses
to the May Survey in 1996, 1997, 1999, 2000, and 2001.
Part II: Parent Opinions About Year-Round Schooling (Questions 25-27).
Scale (See Note)
1996
M SD n
1997
M SD n
1999
M SD n
2000
M SD n
2001
M SD n
F
Paired Comparis
ons
Students learn most effectively
3.30 1.04 119
3.65 .97 115
3.75 .88 79
3.74 .93 128
3.91 .86 74
5.81 96< ALL 4
Keeps students engaged
3.79 .90 120
4.05 .84 117
4.16 .74 79
Graphics
4.11 .86 128
4.24 .77 74
4.39 96< ALL 4
Motivates student attendance
2.93 1.07 120
3.48 1.10 116
3.54 .98 79
3.66 .98 126
3.96 .97 74
13.77 96< ALL 4 ALL 4 <01
Overall satisfaction
3.08 1.16 73
3.54 1.11 72
3.78 .94 49
3.39 1.11 127
3.49 1.11 75
3.44
96< 97/99/01 00<99
* No significant differences In Paired comparisons: “<” means “Significantly Less Than”. Note: Scale Ranges: 1-5.
One other negatively written category, presents single parents obstacles, was significantly
less in 2001 than 1996. Fifteen of the 16 categories therefore indicated a significantly positive
atmosphere over the five reporting periods. The overall results have major positive implications for
the implementation of YRS.
Teacher Responses to May Survey
Teacher responses to the Teacher May Survey are shown in Tables 24 through 29 and are
graphically demonstrated in Appendix G. Only topics in bold are subject of this study.

77
TABLE 24
Analysis of University School Teacher Responses
to the May Survey in 1996, 1997, 1999, 2000, and 2001.
Part I: Beliefs About Teaching and Learning at University School (Questions 1-6).
Scale (See Note)
1996
M SD n
1997
M SD n
1999
M SD n
2000
M SD n
2001
M SD n
F
Paired Comparisons
Students achieve goals
3.43 .51 14
3.31 .55 26
3.60 .68 20
3.50 .51 26
3.67 .48 30
1.73 97<01
School sets high acad standards
3.57 .51 14
3.42 .50 46
3.65 .49 20
3.33 .68 27
3.27 .69 30
1.59 01<99
Learning is fun
3.00 .71 14
3.00 .69 26
3.15 .49 20
Graphics
3.15 .66 27
3.17 .79 30
.34 *
Students respect good grades
3.14 .66 14
2.92 .74 26
3.15 .59 20
3.15 .66 27
3.17 .59 30
.64 *
Seek extra work for grades
2.64 .63 14
2.39 .66 23
2.50 .76 20
2.58 .81 26
2.33 .88 30
.60 *
Effective learning atmosphere
3.14 .77 14
3.08 .69 26
3.30 .80 20
3.44 .58 27
3.30 .79 30
.98 *
* No significant differences In Paired comparisons: “<” means “Significantly Less Than”. Note: Scale Ranges: 1-5.

78
TABLE 25
Analysis of University School Teacher Responses
to the May Survey in 1996, 1997, 1999, 2000, and 2001.
Part I: Beliefs About Teaching and Learning at University School (Questions 7-12).
Scale (See Note)
1996
M SD n
1997
M SD n
1999
M SD n
2000
M SD n
2001
M SD n
F
Paired Comparisons
Teachers believe in stud ability
3.57 .51 14
3.46 .58 26
3.90 .31 20
3.78 .42 27
3.83 .38 30
3.94 96<99 97<
99/00/01
Academic achievement recognized
3.57 .51 14
3.50 .76 26
3.50 .69 20
3.63 .56 27
3.70 .53 30
.50 *
Proud to be a teacher
3.43 .76 14
3.46 .76 26
3.80 .52 20
Graphics
3.70 .61 27
3.60 .72 30
1.08 *
Students try hard to improve
2.57 .76 14
2.52 .71 25
2.80 .77 20
2.81 .74 27
2.70 .65 30
.77 *
Environment orderly & serious
3.14 .77 14
3.65 .80 26
3.10 .79 20
2.89 .70 27
2.93 .87 30
1.29 *
Students prepared for future
3.57 .51 14
3.19 .63 26
3.35 .59 20
3.48 .51 27
3.40 .62 30
1.28
*
* No significant differences In Paired comparisons: “<” means “Significantly Less Than”. Note: Scale Ranges: 1-5.
As shown in Table 24, Part I for teachers indicated a stark contrast to those indications by
parents for the same time frame and questions. Teachers disagreed with parents in 11 of 12
categories and indicated that 1997 was less effective than 1996 or 1999. Two factors that may have
contributed to this finding are: (1) there was a substantial change in administration between the
1996 and 1997 surveys and (2) the 1997 survey possibly included teachers not teaching high school
students because of the total number of teachers submitting surveys. No differences between 1996
and 1997 were deemed significant and the only category that showed significance between 1997
and 1999 was “teachers beliefs in students abilities”. This significance was more positive in 1999
and 1997 was significantly less than 1999, 2000, and 2001. Teachers indicated the academic
standards set in 1999 were significantly greater than in 2001. In final analysis of Part I for teachers,
it is refreshing that the teachers did not perceive a problem in administration change and they
indicated that they were overall very positive about YRS implementation.

79
Teacher responses to Part II are shown in Table 26 through 28 and are graphically
demonstrated in Appendix G.
TABLE 26
Analysis of University School Teacher Responses
to the May Survey in 1996, 1997, 1999, 2000, and 2001.
Part II: Teacher Opinions About Year-Round Schooling (Questions 13-18).
Scale*
1996
M SD n
1997
M SD n
1999
M SD n
2000
M SD n
2001
M SD n
F
Paired Comparisons
Effective teaching learning
3.57 .85 14
4.23 .71 26
4.25 .85 20
4.56 .70 27
4.03 1.07 30
3.37 96< 97/99/00 00<01
Students overcome problems
3.36 .63 14
3.69 .84 26
4.00 .79 20
Graphics
4.15 .73 26
3.67 .96 30
2.83 96<99/00 97/01<00
Helps improve test scores
3.36 .63 14
3.44 .77 25
3.65 .81 20
3.85 .99 27
3.60 1.00 30
1.04 *
School sports program difficult
3.07 .83 14
2.65 1.29 26
2.95 1.15 20
2.00 .96 27
2.90 1.21 30
3.45 00< ALL 4
Difficult for students to hold jobs
3.21 .89 14
2.73 1.08 26
2.75 1.02 20
2.26 .86 27
2.57 .94 30
2.47 00/01<96
Allows family vacations
3.93 1.07 14
4.31 .79 26
4.45 .60 20
4.48 .89 27
4.07 1.11 30
1.42 *
* No significant differences In Paired comparisons: “<” means “Significantly Less Than”. Scale Ranges: 1-5.

80
TABLE 27
Analysis of University School Teacher Responses
to the May Survey in 1996, 1997, 1999, 2000, and 2001.
Part II: Teacher Opinions About Year-Round Schooling (Questions 19-24).
Scale*
1996
M SD n
1997
M SD n
1999
M SD n
2000
M SD n
2001
M SD n
F
Paired Comparisons
Presents single parents obstacles
2.71 .91 14
2.92 1.09 26
2.75 .79 20
2.26 .86 27
2.70 .84 30
1.95 00<97
Allows enrichment classes
4.29 .61 14
4.35 .89 26
4.35 .75 20
4.46 .71 26
4.27 .64 30
.27 *
Better Retention
3.64 .74 14
3.81 .80 26
3.80 1.15 20
Graphics
4.00 .92 27
3.50 1.22 30
.95 *
Class review time reduced
3.57 1.02 14
3.65 1.02 26
3.90 1.07 20
4.07 .87 27
3.70 1.29 30
.83 *
Other activity participation reduced
2.93 1.14 14
2.65 1.20 26
2.55 .89 20
2.19 1.08 27
2.67 1.09 30
1.32 00<96
Reduces student stress
3.07 .73 14
3.62 .85 26
3.40 .94 20
3.48 1.05 27
3.63 1.16 30
.93 *
* No significant differences In Paired comparisons: “<” means “Significantly Less Than”. Scale Ranges: 1-5.

81
TABLE 28
Analysis of University School Teacher Responses
to the May Survey in 1996, 1997, 1999, 2000, and 2001.
Part II: Teacher Opinions About Year-Round Schooling (Questions 13-18).
Scale*
1996
M SD n
1997
M SD n
1999
M SD n
2000
M SD n
2001
M SD n
F
Paired Comparisons
Students learn most effectively
3.71 .91 14
3.81 .69 26
3.79 .85 19
Graphics
3.93 .78 27
3.57 1.01 30
.67 *
Keeps students engaged
3.85 .69 13
4.08 .86 25
4.15 .75 20
4.19 .74 27
3.90 1.18 30
.57 *
Motivates student attendance
3.38 .87 13
3.36 .86 25
3.30 ,92 20
3.30 1.03 27
3.27 1.14 30
.05 *
* No significant differences In Paired comparisons: “<” means “Significantly Less Than”. Scale Ranges: 1-5.
The teachers’ responses to the YRS survey Part II were very different from Part I. Only
two categories indicated a significant change from 1996 to 1999, both positive, effective
teaching and learning and students ability to overcome problems. Ten of the 15 categories
indicated a positive trend, including four categories written in the negative; the difficulty of
sports programs, the difficulty for students to hold jobs, presents single parents obstacles, and
participation in other activities reduced. Four categories showed a slightly higher level in 1997
over that in 1996 and 1999; better retention, reduced student stress, students learn most
effectively, and motivates student attendance. The categories that flag attention, but not
significantly, in this section are: allows enrichment classes, better retention, class review time
reduced, students learn most effectively, and motivates students’ attendance where all categories
were down slightly in 2001. Again, none of these categories were significantly different and the
overall results of Part II for teachers had a substantial positive theme for the implementation of
YRS. Teachers were asked 22 additional questions about how they personally felt about specific
items. These questions were arranged randomly within the survey and the responses were sorted
according to the following three categories: emotional exhaustion, depersonalization, and
personal accomplishment. The results of these questions are summarized in Table 29.

82
TABLE 29
Analysis of University School Teacher Responses
to the May Survey in 1996, 1997, 1999, 2000, and 2001.
Part III: Educator Survey (Questions 29-50).
Scale (See Note)
1996
M SD n
1997
M SD n
1999
M SD n
2000
M SD n
2001
M SD n
F
Paired Comparisons
Emotional Exhaustion Graphics
27.14 7.92 14
22.96 11.45 23
25.20 10.60 20
20.81 10.50 27
22.89 8.40 28
1.14 *
Deperson-alization
5.08 4.57 13
5.18 4.65 22
3.70 3.88 20
3.65 4.86 26
4.46 4.65 28
.52 *
Personal Accomp-lishment
38.64 6.53 11
39.68 6.09 19
42.05 4.76 20
41.68 5.83 25
41.07 6.71 28
.87 *
* No significant differences In Paired comparisons: “<” means “Significantly Less Than” Note: Scale Ranges: Emotional exhaustion 9-54, depersonalization 5-30, & personal accomplishment 8-48.
The evaluation of Part III for teachers shows no significant changes over the five reporting
periods for all three categories. Although emotional exhaustion increased slightly in 1999 it
continued to decline through 2001. Depersonalization increased slightly in 1997 and again in 2001,
but changes were not significant. The overall trend was positive for all three categories, again
supporting the implementation of YRS.
Student Responses to the May Survey
The overall (all grades combined) responses to the May Survey are shown in Table 30 & 31
and are graphically demonstrated in Appendix G. Only topics in bold are subject of this study.

83
TABLE 30
Analysis of University School High School Student
Responses to the May Survey in 1996, 1997, 1999, 2000, and 2001.
Part I: Beliefs About Teaching and Learning at University School (Questions 1-6).
Scale (See Note)
1996
M SD n
1997
M SD n
1999
M SD n
2000
M SD n
2001
M SD n
F
Paired
Comparisons
Students can achieve goals
2.80 .71 223
2.74 .72 247
2.88 .65 204
2.80 .63 254
3.02 .60 257
6.52 97<99 ALL 4 <01
School sets high academic standards
3.05 .81 222
3.16 .78 246
3.08 .76 203
3.11 .77 253
3.21 .67 257
1.70 96<01
Learning is fun
1.96 .80 222
2.18 .86 247
2.22 .80 204
Graphics
2.14 .80 252
2.42 .89 255
9.38 96< ALL 4 ALL 4 <01
Students respect good grades
2.32 .91 222
2.51 .92 246
2.53 .84 204
2.59 .84 254
2.80 .84 257
9.26 96< ALL 4 ALL 4 <01
Students seek extra work for grades
2.13 .89 222
2.29 .92 244
2.30 .87 204
2.31 .83 253
2.38 .78 255
2.64 96< 99/00/01
Effective learning atmosphere
2.47 .77 222
2.61 .79 246
2.60 .71 201
2.69 .77 253
2.76 .72 257
4.92
96<00 96/97/99
<01 * No significant differences In Paired comparisons: “<” means “Significantly Less Than” and “>” means “Significantly Greater Than”. Note: Scale Ranges: 1-5.

84
TABLE 31
Analysis of University School High School Student
Responses to the May Survey in 1996, 1997, 1999, 2000, and 2001.
Part I: Beliefs About Teaching and Learning at University School (Questions 7-12).
Scale (See Note)
1996
M SD n
1997
M SD n
1999
M SD n
2000
M SD n
2001
M SD n
F
Paired
Comparisons
Teachers believe in student ability
2.81 .89 223
3.00 .82 243
3.10 .74 205
2.96 .83 253
3.07 .73 256
4.53 96< ALL 4
Academic achievement recognized
3.00 .89 223
3.04 .84 246
2.94 .80 205
2.89 .78 254
3.13 .76 257
3.47 00<97 99/00<01
Student pride
2.49 .86 218
2.82 1.02 245
2.63 .97 205
2.67 .90 252
2.82 .90 257
4.79 96< 97/00/01 97<99
Students try hard to improve
2.29 .75 223
2.44 .73 246
2.36 .70 205
Graphics
2.44 .65 250
2.57 .72 256
5.11 96< 97/00/01
ALL 4 <01
Environment orderly & serious
2.35 .84 223
2.47 .77 247
2.49 .74 201
2.45 .75 251
2.61 .69 255
3.56 96/97/00 <01
Students prepared for future
2.78 .91 223
2.92 .86 246
2.91 .80 203
2.85 .79 252
2.97 .78 254
1.83 96<01
* No significant differences In Paired comparisons: “<” means “Significantly Less Than” and “>” means “Significantly Greater Than”. Note: Scale Ranges: 1-5.
The students’ results for Part I indicated an overall positive response. In 11 of the 12
areas 2001 was significantly greater than 1996. In three areas 2001 was significantly better than
all previous years, learning is fun, students respect good grades, and the environment is orderly
and serious. Six areas were significantly higher in 1999 over 1996. Five of the other areas
increased in 1997 and declined slightly in 1999 but the 1999 results were higher than the original
figures in 1996. Only one area fell below the original figures in 1996 and that was the
recognition of academic achievement, lower in 1999 and 2000 but increased above the original
value in 2001. Part I for all high school students indicate a very positive result of implementation
of YRS.
Responses to the Part II questions by the high school are presented in Table 32-34 and are
demonstrated in Appendix G.

85
TABLE 32
Analysis of University School High School Student
Responses to the May Survey in 1996, 1997, 1999, 2000, and 2001.
Part II: Student Opinions About Year-Round Schooling (Questions 13-18).
Scale (See Note)
1996
M SD n
1997
M SD n
1999
M SD n
2000
M SD n
2001
M SD n
F
Paired
Comparisons
Promotes teaching & learning
3.06 1.16 220
3.68 1.02 247
3.66 .92 203
3.76 .87 254
3.75 1.00 241
19.63 96< ALL 4
Overcome learning problems
2.87 1.09 221
3.18 1.03 247
3.19 .97 205
3.38 .94 254
3.44 .94 241
11.40 96< ALL 4 97/99< 00/01
Students improve test scores
2.94 1.10 220
3.16 1.08 247
3.27 1.00 205
Graphics
3.28 1.02 254
3.42 .97 241
6.87 96< ALL 4 97<01
Difficult to have sports programs
3.98 1.12 222
3.20 1.23 245
2.92 1.18 204
2.87 1.2 254
3.00 1.13 241
34.23 ALL 4 <96
99/00<97
Difficult for students to hold jobs
4.20 1.03 222
3.35 1.24 246
3.18 1.28 205
2.95 1.22 254
3.09 1.26 241
37.80 ALL 4 <96
00/01<97
Allows vacations opportunities
2.95 1.36 221
3.46 1.32 246
3.64 1.19 204
3.68 1.27 254
3.71 1.22 241
13.78 96< ALL 4 97<01
* No significant differences In Paired comparisons: “<” means “Significantly Less Than” Scale Ranges: 1-5.

86
TABLE 33
Analysis of University School High School Student
Responses to the May Survey in 1996, 1997, 1999, 2000, and 2001.
Part II: Student Opinions About Year-Round Schooling (Questions 19-24).
Scale (See Note)
1996
M SD n
1997
M SD n
1999
M SD n
2000
M SD n
2001
M SD n
F
Paired
Comparisons
Obstacles for single parents
3.79 .98 221
3.31 .95 245
3.117 .82 204
3.15 .80 252
3.02 .81 241
26.73 ALL 4 <96
00/01<97 Allows enrich-ment during intersessions
3.38 .97 219
3.84 .96 245
3.81 .77 203
3.73 .86 254
3.63 .96 239
9.30 96< ALL 4
01<97/99 Greater retention of material
3.21 1.10 220
3.42 1.10 244
3.47 .93 202
Graphics
3.47 .91 252
3.59 .98 241
4.28 96< ALL 4
Reduces review time
3.15 1.08 220
3.23 1.17 246
3.19 1.08 203
3.31 1.03 252
3.31 1.10 241
.97 *
Reduces other Activities
3.79 1.03 220
3.18 1.11 246
3.14 1.07 204
3.06 1.05 251
2.99 1.08 239
20.06 ALL 4 <96
Reduces student Stress
2.78 1.19 220
2.97 1.29 246
2.90 1.20 205
2.85 1.23 254
3.02 1.17 240
1.38 96<01
* No significant differences In Paired comparisons: “<” means “Significantly Less Than” Scale Ranges: 1-5.

87
TABLE 34
Analysis of University School High School Student
Responses to the May Survey in 1996, 1997, 1999, 2000, and 2001.
Part II: Student Opinions About Year-Round Schooling (Questions 25-27).
Scale (See Note)
1996
M SD n
1997
M SD n
1999
M SD n
2000
M SD n
2001
M SD n
F
Paired
Comparisons
Based on effective learning
2.94 .95 221
3.24 .97 245
3.20 .73 203
3.17 .82 253
3.27 .84 241
5.08 96< ALL 4
Keeps students engaged in learning
3.34 1.11 219
3.56 1.03 245
3.53 .93 205
Graphics
3.55 .90 254
3.64 ,93 239
2.74 96< ALL 4
Motivates student attendance
2.38 1.08 220
2.70 .97 244
2.77 .97 203
2.77 1.05 250
2.98 .96 236
9.95
96< ALL 4 ALL 4 <01
* No significant differences In Paired comparisons: “<” means “Significantly Less Than” Scale Ranges: 1-5.
The students Part II results indicated that 2001 was significantly greater than 1996 in 14
of the 15 categories. The 15th category, reduces review time, was only slightly greater in 2001.
Each year, 1997, 1999, and 2000, had only four categories each with a slight decline and none
were significant. Only one category had no significant differences across the five surveys,
reduction in review time. The overall results again were very positive for the implementation of
YRS.
A couple of additional isolated areas were explored with the student population. They
were asked if they worked outside the school during the year and if they had any difficulty
enrolling in the classes they needed. Table 35 contains the results of these two questions.

88
TABLE 35
Analysis of University School High School Student
Responses to the May Survey in 1996, 1997, 1999, 2000, and 2001.
Part III: Work Activities (Question 29) and Part VI: Access to Courses (Question 35).
Scale (See Note)
1996
M SD n
1997
M SD n
1999
M SD n
2000
M SD n
2001
M SD n
F
Paired
Comparisons
Worked outside school this year
1.55 .50 221
1.55 .52 246
1.41 .49 200
1.51 .50 252
1.61 .49 254
5.01 99< ALL 4 00<01
Able to enroll in needed courses
2.78 1.07 214
3.15 1.12 233
3.05 1.16 184
2.89 1.08 254
2.76 1.03 251
5.72 96/01< 97/99 00<97
* No significant differences In Paired comparisons: “<” means “Significantly Less Than”
The students indicated the opportunity to work outside the school was significantly less
in 1999 than in any other year. They also indicated it was significantly easier to enroll in needed
subjects in 1997 and 1999 than in 1996 and in 1997 than in 2000. These continue to indicate a
positive response to the implementation of YRS.
Patterns of Response Across Grade Levels
In an effort to determine if the overall responses of high school students in May were due
to a weighting based on responses from a particular class, an analysis was undertaken to look for
significant differences within each grade level over the five May survey periods. Analyses results
are summarized in Tables 36 through 40, where only the statistically significant differences are
shown. The focus of these tables is on the overall pattern of student differences across grade
levels in high school only. As shown in the tables, there are fewer differences across the board.
With these analyses there were 27 categories with responses from each of 4 grade levels each
year yielding 540 individual responses.
Beliefs About Teaching and Learning. The overall results indicate that 9th graders were
significantly lower in 20 instances, the 10th graders in 7 instances, the 11th graders only in 2
instances, and the 12th graders had 3 instances. None of these figures indicate any particular problem
areas or any particular concerns for the implementation of YRS. Tables 36 & 37 results are

89
indicated here and are graphically demonstrated in Appendix H. Only topics in bold are subject of
this study.
TABLE 36
Analysis of University School High School Student Responses to Part I:
Beliefs About Teaching and Learning (Questions 1-6). Comparing Grades Within Years.
Category
1996
9 10 11 12
1997
9 10 11 12
1999
9 10 11 12
2000
9 10 11 12
2001
9 10 11 12 Students can achieve goals
-- >9 >9 >9
<12 -- <12 --
-- -- -- --
-- -- -- --
-- -- -- --
School sets high academic standards
-- -- -- --
-- -- <9 --
-- -- >9 --
-- -- -- --
-- -- -- --
Learning is fun
-- -- -- --
-- -- -- --
-- -- -- --
Graphics
-- -- -- >9
-- -- -- --
Students respect good grades
-- -- >9 >9
-- -- -- --
-- -- >9 --
<11 <11 -- --
-- -- >9 >9
Students seek extra work for grades
-- >9 >9 --
-- -- -- --
-- <11 -- <11
-- -- -- <11
-- -- -- --
Students able to learn effectively
-- -- -- --
-- -- -- --
-- -- >10 --
<12 <12 -- --
-- -- -- --
In Comparisons: The grade at the top of the column is (“<”) “Significantly Less Than” or ( “>”) “Significantly Greater Than” the grade beside the symbol.

90
TABLE 37
Analysis of University School High School Student Responses to Part I:
Beliefs About Teaching and Learning (Questions 7-12). Comparing Grades Within Years.
Category
1996
9 10 11 12
1997
9 10 11 12
1999
9 10 11 12
2000
9 10 11 12
2001
9 10 11 12 Teachers believe in stud ability
-- -- -- --
-- -- -- --
-- -- -- --
-- <12 -- --
-- -- -- --
Academic achievement improvement
-- >9 -- --
-- -- -- --
-- -- -- --
<10 -- -- --
-- -- -- --
Student pride
-- -- -- --
-- -- -- --
-- -- -- --
Graphics
<11 <12 -- >9
-- -- -- --
Students try hard to improve
-- -- <10 --
-- -- -- --
-- -- -- --
-- -- -- --
-- -- -- <9
Environment orderly & serious
-- -- -- --
-- -- -- --
-- <11 -- <11
-- -- -- --
-- -- -- --
Students prepared for future
-- -- -- --
-- -- -- --
-- -- -- --
-- -- -- --
-- -- -- --
In Comparisons: The grade at the top of the column is (“<”) “Significantly Less Than” or ( “>”) “Significantly Greater Than” the grade beside the symbol. Opinions About Year-round Schooling. Tables 38 through 40 will compare grade level
responses for questions 13 through 27 and are graphically demonstrated in Appendix H.

91
TABLE 38
Analysis of University School
High School Student Responses to Part II: Student Opinions About
Year-Round Schooling (Questions 13-18). Comparing Grades Within Years.
Category
1996
9 10 11 12
1997
9 10 11 12
1999
9 10 11 12
2000
9 10 11 12
2001
9 10 11 12 Promotes teaching & learning
-- -- -- --
-- -- -- --
-- -- >10 --
-- -- -- --
-- -- -- --
Students overcome learning problems
-- >12 -- --
-- -- -- --
-- <11 -- <11
<12 -- -- --
-- -- -- --
Students improve test scores
-- >12 -- --
-- -- -- --
-- -- -- --
Graphics
-- -- -- --
-- -- -- --
Difficult to have sports programs
-- -- -- --
-- -- -- --
>11 -- -- >11
>11 >11 -- -- >12 >12 -- --
>10 -- >10 --
Difficult for students to hold jobs
-- -- -- --
>11 >11 -- -- >12 >12 -- --
-- -- -- --
>11 >11 -- -- >12 >12 -- --
-- <12 <12 --
Allows vacations opportunities
>12 >12 -- --
-- -- -- --
<11<11 -- <11
<11 -- -- --
-- -- -- --
In Comparisons: The grade at the top of the column is (“<”) “Significantly Less Than” or ( “>”) “Significantly Greater Than” the grade beside the symbol.

92
TABLE 39
Analysis of University School
High School Student Responses to Part II: Student Opinions About
Year-Round Schooling (Questions 19-24). Comparing Grades Within Years.
Category
1996
9 10 11 12
1997
9 10 11 12
1999
9 10 11 12
2000
9 10 11 12
2001
9 10 11 12 Obstacles for single parents
-- <12 -- --
-- -- -- --
-- -- -- --
-- <12 -- --
<11 -- -- --
Allows enrich- ment during intersessions
-- >12 -- --
-- -- -- --
<11 -- -- --
-- -- -- --
>11 -- -- >11
Greater retention of material
-- >12 -- --
-- -- -- --
-- <11 -- --
Graphics
-- -- -- --
-- -- -- --
Reduces review time
-- -- -- --
-- -- -- --
-- <9 -- --
-- -- -- --
-- -- -- --
Reduces other Activities
-- -- -- --
>12 >12 >12--
-- -- -- --
-- >11 -- --
-- >12 >12 --
Reduces student Stress
<10 -- -- <10
-- -- -- --
-- -- <9 --
-- -- -- --
-- -- -- --
In Comparisons: The grade at the top of the column is (“<”) “Significantly Less Than” or ( “>”) “Significantly Greater Than” the grade beside the symbol.
Some observations are worthy of mention. The ninth graders had the highest opinion on
their ability to achieve their goals. The older students, juniors and seniors, indicated they felt it
was less difficult for students to hold jobs probably because they were nearer the legal working
age. It appears in many categories that the 11th grade students, particularly in 1999, respond in a
more positive manner than any other grade level. These students were eighth graders at the
implementation of YRS. The 12th graders indicated they felt the YRS reduced other activities
significantly more than the other three grades in 1999. In 2000 the juniors and seniors had the
most significantly large scores in a number of categories and in 2001 it appears that all grades
had basically the same opinion on their beliefs about YRS.

93
TABLE 40
Analysis of University School
High School Student Responses to Part II: Student Opinions About
Year-Round Schooling (Questions 25-27). Comparing Grades Within Years.
Category
1996
9 10 11 12
1997
9 10 11 12
1999
9 10 11 12
2000
9 10 11 12
2001
9 10 11 12 Based on effective learning
-- -- -- --
-- -- -- --
-- -- -- --
-- -- -- --
-- -- -- --
Keeps students engaged in learning
-- -- -- --
-- -- -- --
-- -- -- --
Graphics
-- <11 -- --
-- -- <12 --
Motivates student attendance
-- >11 -- --
-- -- -- >10
-- -- -- --
-- <11 -- --
<10 -- -- --
In Comparisons: The grade at the top of the column is (“<”) “Significantly Less Than” or ( “>”) “Significantly Greater Than” the grade beside the symbol.
The results of these comparisons indicate the opinions about YRS are fairly even across all
grades. No single grade has a distinct advantage over any other grade. The students appear to be
overall satisfied and indicate a positive result for the implementation of the YRS.
Comparison of Three Subject Groups
The last two Tables 41 and 42 are composites of all May tables showing trends of each
group surveyed as compared to each other.

94
TABLE 41
Analysis of University School High School Parents, Students, and Teachers
Overall Surveys for Responses of Beliefs About Teaching and Learning 1996 Through 2001
Beliefs about teaching and learning Category
Parents Teachers Students
Students can achieve goals / \ \ / \ / \ / \ / \ /
School sets high academic standards / \ \ / B \ / \ \ B / \ / /
Learning is fun / / / / _ / _ / / / \ /
Students respect good grades / \ / / _ / _ / / / / /
Students seek extra work for grades / \ \ / \ / / \ B / / / /
Students able to learn effectively / \ / / \ / / \ / \ / /
Teachers believe in student ability / \ _ / \ / \ / / / \ /
Academic achievement improvement / \ \ / \ _ / / / \ \ /
Student pride / \ / / / / \ \ / \ / /
Students try hard to improve / \ / / \ / / \ / \ / /
Environment orderly & serious / \ / / / \ / / B / / \ /
Students prepared for future / / / / \ / / \ B / \ \ /
/ Indicates an increase between consecutive years. \ Indicates a decrease between consecutive years. _ Indicates no change between years. B Indicates that the 2001 score was below the 1996 score. Example: / / \ / B means – increased from 96 to 97, increased from 97 to 99, decreased from 99 to 2000, increased from 2000 to 2001, and 2001 was lower than 1996.

95
TABLE 42 Analysis of University School High School Parents, Students, and
Teachers Overall Surveys for Responses of Opinions About YRS 1996 through 2001
Opinions about YRS Category
Parents Teachers Students
Promotes teaching & learning / / \ / / / / \ / \ / \
Students overcome learning problems
/ / \ / / / / \ / / / /
Students improve test scores / / _ / / / / \ / / / /
Difficult to have sports programs \ / \ / B ok \ / \ / B ok \ \ \ / B ok
Difficult for students to hold jobs \ \ \ \ B ok \ / \ / B ok \ \ \ / B ok
Allows vacations opportunities / _ / / / / / \ / / / /
Obstacles for single parents \ / / \ B ok / \ \ / B ok \ \ / \ B ok
Allows enrichment during intersessions
/ / / / / _ / \ B / \ \ \
Greater retention of material / / / / / \ / \ B / / _ /
Reduces review time / / \ / / / / \ / \ / _ B ok
Reduces other activities \ \ \ \ B ok \ \ \ / B ok \ \ \ \ B ok
Reduces student stress / \ / / / \ / / / \ \ /
Based on effective learning / / \ / / \ / \ B / \ \ /
Keeps students engaged in learning / / \ / / / / \ / \ / /
Motivates student attendance / / / / \ \ _ \ B / / _ /
Highlighted items indicate those questions written in the negative. / Indicates an increase between consecutive years. \ Indicates a decrease between consecutive years. _ Indicates no change between years. B Indicates that the 2001 score was below the 1996 score. B ok Indicates a final lower score on a negatively written question that is positive. Example: / / \ / B means – increased from 96 to 97, increased from 97 to 99, decreased from 99 to 2000, increased from 2000 to 2001, and 2001 was lower than 1996.
The analysis of the teaching and learning section indicates that all of the parents’
responses were positive from 1996 to 1997 and from 2000 to 2001. Only one of those scores
finished below the starting score. Nine of the 12 teacher responses were negative from 1996 to
1997, half were positive from 2000 to 2001, but four finished lower than their initial scores in
1996. All of the students’ responses except one began positive and all finished positive.
The analysis of the opinion about YRS section indicates that parents’ responses were all
positive except one in 1996 to 1997 and finished with only one negative response in reduces review

96
time. Teachers’ 1996 to 1997 responses were all positive except three; obstacles for single parents,
reduced review time, and motivates student attendance. Their 2000 to 2001 responses were all in a
negative direction except one; reduces student stress. The student responses were all positive from
1996 to 1997 except reduced review time and all but two were positive in 2000 to 2001 and they
were promotes teaching and learning and enrichment during intersession. Depending upon the
perspective, reduction of review time may be considered negative as a teacher may feel review is
necessary or it may be a positive for the parent and student considering it wastes valuable time for
learning new material. This could explain the variances in scores for that particular subject. Overall,
again there is an overwhelming acceptance for YRS.
Phase Two Conclusions
This particular survey conducted at the end of the school year has provided another
indication that the YRS implementation at the University School has been well received and
accepted by students, their parents, teachers, and administrators. Several points are worthy of
mention. All of the parents and students surveys had more positive scores in 2001 than 1996
indicating an acceptance for the change in their learning system. On the other hand, teachers had
lower final scores in 8 of the 27 categories indicating their different perspective on the YRS system.
None of these negatives were extreme, but, nevertheless, they were slightly negative. There were
fewer parent respondents the last year and some comments indicated they were tired of surveys, a
point that is understandable for an environment such as University School since they are subjects of
numerous surveys from the college.
Two of the positive aspects of YRS, as indicated by student surveys, are that it provided
students the ability to overcome their learning problems and have more vacation opportunities. The
intersession activities provided additional enrichment opportunities for the students but may need
some fine-tuning to be fully effective. The organization adjusted well to the YRS concept by
adjusting the sports programs and making it possibly for students to hold jobs.
There were 27 categories in the survey administered to the three subject groups providing 51
sets of data each year and 255 sets of data for the five-year project to be considered. In 25 of those
1997 data sets, the majority from parents and students, there was an indication that the groups were
more satisfied with the YRS in 1997 than in either 1996 or 1999. The teachers indicated they were
less satisfied in 1997 in 14 of the 27 categories and that may be directly related to two significant

97
factors. There was a significant change in administration between 1996 and 1997 and some of the
participants may not have had the advantage of the pre-implementation indoctrination process that
would have better prepared them for the change. In addition, only high school teachers responded in
1996 and 1999 but the numbers of respondents in 1997 indicates that teachers from all levels
responded.
Overall there were 214 positive scores, 97 negative scores, and 13 unchanged scores. Of the
97 negative scores the teachers had 45, the students had 28, and the parents had 24. Of the 51
categories 42 ended positively with a score higher that the original 1996 score yielding an 82%
approval rating for the May survey over a five-year period.
The end result of the survey process has an overall overwhelmingly positive theme with
respect to the primary recipients of the system, the students. They appeared pleased with the
academics, the environment, the activities, the learning process, intersession activities, and vacation
opportunities. They were pleased with their test scores and they were motivated to attend class. The
findings give empirical evidence that the change from a traditional calendar to a year-round
education program was associated with a positive change in student and parent satisfaction levels
with the school.
Phase Three
Personal Interviews
Personal interviews were conducted with a representative selection of each survey group.
The number of participants was determined by selecting the teachers who had been employed
continuously at University School from 1996 until 2001. The number of teachers was six. An
equal number of parents and students was selected for interviews. Parent responses to the 2001
survey indicated there were 36 out of 75 who were continuously at University School from 1996
to 2001 and there were 32 out of 55 seniors. Six candidates from each group were purposefully
selected for interview. The interview questions were designed to cover each area in the original
surveys and allowed for additional comments and reflections by the participants. The questions
are repeated here along with each analysis. The full interview questionnaire is provided in
Appendix C.
98
Parents 1. When the decision to implement Year-Round Schooling at University School was
announced, what were your initial impressions of the system?
The initial impressions were evenly mixed with the parents. Two were very positive
about YRS implementation, two were very negative, and two had no feelings either way. On the
positive side, one of the parents served on the committee that researched YRS scheduling. This
parent was excited about the implementation. Another parent indicated it was something that was
needed and was very positive about YRS. The two with no feelings either way were interested in
year-round schooling but did not hold strong feelings.
The parents with negative views did not like the idea of moving to YRS at all and would
have been happy if implementation had not occurred. They suggested this was just another
school program that was forced upon them. They indicated they had no control over their
children’s education.
2. What difficulties did you encounter adjusting from six consecutive six-week learning
periods to four separate nine-week learning periods and the associated vacation schemes?
Two parents had no problems with the new schedule and were able to adapt easily. One
family had difficulty finding day-care during the breaks because both parents worked. One
parent said the cost of the Intersession was exorbitant with $50 dollars for one week and $100 for
two weeks, when they were not even certain it was actually long enough to help their child.
Another parent was concerned that her children would miss summer camps they generally
attended, and a different parent was concerned his son could not attend out of town baseball
tournaments that he had enjoyed in previous years due to July and August classes.
3. Over the period of the last five years, did you feel that your child has benefited from the
YRS program? Why?
Five parents agreed that their children had benefited from the YRS conversion. In the
beginning children had to adjust because their friends enrolled in traditional school had a
different schedule. They managed to adjust to the separations from their friends and made the
best of it. The two most recurring benefits were the reduction of review time required when
students began a new session and the reduction of boredom generally experienced with a 10-
week summer vacation period. The schedule was easier for athletes when away trips were
scheduled during breaks. The students appeared to have greater retention, less burnout, less

99
dropout, and easier transitions from one grade to another with the YRS schedule. Two parents
said they would never go back.
One parent stated this was just a change in calendar and was not beneficial if it did not
affect everyone. Even with that her children did enjoy the new system.
4. Do you feel the YRS schedule provides a better environment to promote effective
learning for your child?
Four parents stated the new environment does promote effective learning for children. It
was felt that students experience less stress with the schedule. They are more prone to look at
their books with three weeks off than they would during the previous 10-week summer
vacations. According to parents, teachers, and students seem more energized and dealing with
problems is not so intense with these breaks. The short breaks mean less review time, higher
retention, and continuous learning for children.
Two parents said they could not measure the difference in the environment or their
children but both parents said their children seemed happier with the new schedule.
5. Do you know if any parents removed their children from US as a result of the
implementation of YRS? If so, how many?
Two parents said that they knew of no families who left because of the YRS. Four
parents knew of several families that left for different reasons. One said that six families left
because of the YRS change. Another parent said at least three families left because they did not
give the new system enough time to see if they would like it. The third knew of three families
and some teachers that did not want the YRS system. The last parent knew of five families who
left but had no real understanding of their reasons for leaving.
6. In your opinion has the implementation of YRS satisfied your original expectation of the
program?
Five parents stated that the implementation of YRS had far exceeded their own
expectations of what the system had to offer. They tried to be open-minded and accept the
changes as they occurred with a non-critical attitude. They stated that this has been important to
their children’s acceptance of the program. One parent reported her acceptance of the program
because of her children’s enthusiasm for all that has happened. Another said the family enjoys
the great vacation times and would never go back the traditional schedule. One parent said she

100
did not know if it made any difference in opinion but added that her daughter enjoys it
tremendously.
7. What one thing would you recommend to improve the YRS program at US?
Half of the parents recommended changes to the Intersession periods. Their concerns
centered on the cost of Intersession and their effectiveness. Initially the sessions focused on the
particular problems facing the students and actually helped them overcome their deficiencies
while earning a higher grade in the subject. The effectiveness of the sessions, according to the
parents, is suspect because they do not have the same teachers. The benefit to the children is in
jeopardy. There is no continuity of learning or individual attention for focused help. They were
also concerned that successful completion of Intersession classes did not raise grades of children
to passing. They had to work harder in the next class.
A separate issue concerned children who played sports. Parents stated that athletes did
not get a break when other students were out and they would like to see the coaches take this
issue into consideration for their children. One parent would like to see the vacations and breaks
to continue as scheduled but would ask that teachers respect it as time off and not make
assignments for the students to complete during their off time. One parent requested longer
summer breaks.
8. Are there any other factors that may have influenced your feelings about the Year Round
School?
One parent stated that University School is a leader school with this program. She said
that more should be done to educate other area schools about the benefits of YRS. She indicated
that if the benefits were shared, the acceptance level of the program would improve, helping
everyone. One parent stated that there are now better teachers at University School. Another
parent stated that the parents were well educated on the aspects of the YRS system before it was
introduced and were prepared for the changes. Another positive factor reported was that during
the breaks the students do not have too much idle time, preventing them from getting into the
wrong types of activities. One parent said that once she served on the committee organizing
YRS, she was convinced it was the right thing to do. One parent stated that YRS was forced
upon the parents and students and they had no say in the outcome. Having said that, she stated
that YRS has been a great experience and she would never go back to the traditional calendar.

101
Teachers
1. When the results of the College of Education decision to implement Year-Round
Schooling at University School was announced, what were your initial impressions of the
system?
Four respondents were in favor of the YRS program. They indicated that points made in
the organizational discussions prior to the implementation were very positive. Traditional
remediation required students to wait a whole year before beginning and with YRS it could be
immediately following their failures between nine-week sessions, much more helpful. They were
also told there would be an academic advantage for students in YRS. One teacher worked on the
pre-implementation school committee and was pleased to see the fruits of her labor. One teacher
was excited about the three-week vacation periods between sessions.
One teacher was originally against YRS, and a second had a wait-and-see attitude. They
expressed concern about the impact on active sports programs and were concerned about being
required to give up vacation time to participate in Intersession classes. A great deal of
information had been disseminated about the program and this brought about cause for concern.
2. What difficulties did you encounter adjusting from six consecutive six-week learning
periods to four separate nine-week learning periods and the associated vacation schemes?
Thorough planning was required to make the new nine-week sessions productive and
concise and avoid any carry-over of subject material from one session to the next. Teachers had
to adjust their textbook ordering schedules to coincide with the new scheme. Three teachers were
disappointed about losing their long summer breaks for several reasons; one teacher lost the
ability to develop new courses during the summer, another was not able to take professional
development classes at the university, and the third was concerned about losing traditional
summer school for the students. Several teachers indicated they spent one week wrapping up
paperwork from the ending session and another week preparing for the upcoming session leaving
them with only one week of vacation.
Remediation was the concern for two teachers. They were required to evaluate their
students in the fourth week of a session to determine if they would possibly have candidates for
remediation during the Intersession. If they identified those weak students, they were required to
spend some time preparing a course of study for them for the Intersession and re-evaluating them
at the seven week point. Several teachers expressed their displeasure in beginning the summer

102
session in July but each said that after the first couple of weeks, things stabilized for them and
the students.
3. Over the period of the last five years, did you feel your effectiveness as a teacher has
improved or declined? Why?
All teachers stated their effectiveness had improved with the YRS schedule. According to
the teachers, they had more time for preparation and presentation of material, their schedules
were more flexible, were able to plan more effectively, and had less stress in the classroom. The
time off allowed them to be more reflective in their planning and preparation and more concise
in their presentations. Generally they stated they were able to get more rest and that the students
were well rested at the start of the sessions.
The only drawback indicated by one teacher was that she said she felt more stress in the
class to complete prescribed subject matter by the end of the semester, two nine-week periods
combined. In traditional six-week classes they were comfortable allowing material to carry over.
4. Do you feel the YRS schedule provides a better environment to promote effective
learning for your students?
Four of the six teachers said that the new YRS environment did promote effective learning
for their students. Their teaching nine-week units provided the opportunity to teach more
comprehensively and produce a more finite session. In the six-week sessions there was a tendency to
allow carry-over of material. They indicated the enrichment activities during the breaks were great
when used effectively. They also indicated that the Intersession periods should be explored to better
help the curriculum and the students. The point was made also that for those students who were
having a difficult time academically or were discipline problems, the three-week break allowed them
to begin with a clean slate in the next session. After the breaks the students generally came back to
school charged up and ready to go. Their enthusiasm was productive and they generally maintained it
for the nine weeks.
Negative comments included the fact there was not a better environment because the
students had the same number of days and hours and still got tired of school. Another teacher
inndicated it was not effective because the students she recommended to attend Intersession
classes would not attend. They were not required to attend, and the cost of classes may have been
part of the reason some of them did not. It was stated that a one-week session cost $50 and a
two-week session cost $100.

103
5. Do you know if any of your colleagues left US as a result of the implementation of
YRS? If so, how many?
Five of the six said they did not know of any teachers who left as a result of YRS
implementation. There had been a large teacher turnover, but some of the reasons were salary
oriented, spousal work out of the area, or conflict with personal plans. One teacher knew two
teachers who left but now had regrets for leaving. One teacher said she felt the principal did not
care for the YRS schedule.
6. In your opinion has the implementation of YRS satisfied your original expectation of the
program?
Two teachers said the YRS schedule exceeded their expectations. They stated the faculty
and students were much happier than they expected. One of them had adopted a wait-and-see
attitude prior to implementation and was very happy with the results. Two teachers were simply
satisfied personally and professionally with YRS. One said the breaks during the year allowed
her to visit traditional schools still in session and helped her to grow professionally while
working on her Educational Specialist Degree. The other said the YRS experience was pretty
much as she had expected and had been explained to her.
One teacher said the YRS program fell short of her expectations, and another said it was
unsatisfactory for student remediation. She was concerned that students requiring remediation do
not get what they need. Originally the remediation was supposed to allow students to bring up
failing grades to a score of 70 with successful completion. After the initial years, students would
only get the training and their grades were unaffected. When they returned to classes the next
session the pressure was on them to bring their grades back to a passing average. She was not
certain that was productive for the student.
7. What one thing would you recommend to improve the YRS program at US?
Five of six teachers elaborated on the need to improve the Intersession periods. Most
importantly the teachers for Intersession must be certified in their selected area and must know
the particular shortcomings of each student. Subjects may include U.S. History, all types of
math, and government. Intersession teachers should be required to work with regular teachers to
target problems for students. A possible solution would be to place at-risk students identified at
the four-week point immediately into remediation classes and to allow them the remaining five
weeks to improve. Intersession could be made more productive with projects and field trips.
104
Teachers stated that if students are not forced to participate in Intersession classes they will
return the next regular session with the same problems compounding their overall problem in
school. The one non-Intersession related recommendation was to expand classroom time to 60
minutes to compensate for the required administration time in each class.
8. Are there any other factors that may have influenced your feelings about the Year Round
School?
Facing retirement age, one teacher stated that YRS has enabled him to teach longer than
he had ever thought possible because he can rejuvenate during breaks. He stated that YRS can
extend teachers’ lives and usefulness. YRS provides greater opportunity for professional
development and growth. Fellow teachers appear to enjoy the schedule and have adjusted their
off time with their family to their benefit. One teacher accepted YRS as a new concept and grew
with the program.
Several teachers stated that enrichment classes are great for the elementary students but
noted that remediation classes for high school students must become more useful. They stated
that if the Intersession periods are not helping students then the school should not be spending
the extra money required to keep them going. One teacher stated that she missed the hot summer
time off. Another was not totally sold on losing her summers, although her family has adjusted to
the new schedule. Another would be less enthusiastic about YRS if new concepts were added,
such as block scheduling.
Students
1. When the results of the College of Education decision to implement Year-Round
Schooling at University School was announced, what were your initial impressions of the
system?
The initial impression of every student was negative. Reasons for disapproval of the YRS
implementation included the understanding that they would loose their summer vacations and be
attending school all year. These misconceptions about break times and vacation times were the
primary items of concern for all students. Two students also indicated they would not like the
new schedule and they did not like change in general.
2. What difficulties did you encounter adjusting from six consecutive six-week learning
periods to four separate nine-week learning periods and the associated vacation schemes?

105
One student had difficulties because he played baseball all summer and with a session
beginning in July this took away his ability to fully participate in all of the baseball related
activities such as tournament play and away games. Another student had difficulties because his
friends were enrolled in traditional schools, but this was no longer a problem when he was on
break in September.
3. Over the period of the last five years, did you feel the instruction and learning
opportunities have been better or worse? Why?
Five of the six students said the instruction and learning opportunities were better in the
YRS system. The majority cited the fact that there was little review time required when they
started a session, allowing more time to learn the new material. This led to better continuity in
the learning process and with that they learned a lot more material. They said it was an advantage
to have the shorter breaks, reducing the usual boredom experienced with traditional summer
vacations. One of the students stated that the Intersession periods prevented him from failing two
different subjects.
One student stated that the instruction and the learning opportunities were similar to those
provided prior to YRS, although things were “no worse”. Another student indicated it was more
difficult to prepare for a final exam on a yearlong course because the time difference from July
to May was longer than the traditional school year of September to May. She suggested testing
by semester only and averaging final grades for course completion.
4. Do you feel the YRS schedule has provided you a more effective learning environment?
Five of the six students said the learning environment is more effective in the YRS
system. They indicated that after a break they only had to work hard for nine weeks until the next
break and that was fairly easy because they were refreshed. After only a three-week break they
were always ready to get back to learning and studying. They stated they were always more
relaxed and the teachers seemed more relaxed with the new schedule. They indicated there was a
better flow of subject material once back in school after a break. Only one student said the
learning environment was the same as before.
5. Do you know if any of your classmates over the years have left US as a result of the
implementation of YRS? If so, how many?
Half of the students did not know anyone who left University School because of the YRS
system implementation. The other three knew several students that may have left because of the

106
YRS system. They indicated that several students also left because of the sports programs. They
said those students were not able to get the recognition as an athlete while at University School
and went to schools where they could be recognized for their talents. These students were
looking for post-secondary athletic scholarships that would not be available to students at
University School.
6. In your opinion has the implementation of YRS satisfied the your original expectation of
the program?
Four of the six students claimed that the experience far exceeded their expectations for
YRS. Many reasons were listed; e.g., they really enjoyed YRS scheduling, it was more like
college, they were pleasantly surprised, it was better than they thought it would be, and it beat all
expectations they ever had for the YRS system. Two students said that the transition simply met
their expectations.
7. What one thing would you recommend to improve the YRS program at US?
Several good recommendations came from these interviews. The scheduling of athletic
events away from the school should be done to coincide with the break periods so the students
did not miss regular classes. The administration should take a critical look at the interim teachers
assigned because the quality of teaching was deficient. Testing by semester was also mentioned
as a problem. Students must be allowed to demonstrate their proficiency by semester and have
their grades averaged as opposed to a final exam. Several students stated that the system could
not be improved and was all right as it was.
8. Are there any other factors that may have influenced your
feelings about the Year Round School?
One student expressed concerns about personal friendships suffering because of the break
schedules and that his time off does not coincide with traditional schools. This was a problem he
finally “got used to”. Another student said that people in her church must schedule events in the
summer to accommodate her schedule because she is in school during the summer. A third
student claimed she “liked taking family vacations in September because it is the off-season and
we get great rates for vacation. We have been to Disney four times in the past five years.”
Another student initially thought “you had to be smarter to be in YRS but actually you just have
to study a little harder”. The fifth student really liked the breaks and she said she felt more
refreshed and relaxed and thought that the teachers did also. The last student was “sick and tired”

107
of the review process in the traditional school environment each year and was pleased with the
opportunity to “get right to learning”.

108
CHAPTER 5
SUMMARY, CONCLUSIONS, AND RECOMMENDATIONS
Summary
This study was conducted to measure the effects of the implementation of Year Round
Schooling at University School (K-12) at East Tennessee State University. The initial survey was
conducted prior to implementation but after the announcement of the upcoming change in the
school system. Briefings were conducted for faculty and parent groups to explain the organization
of a year-round system.
The decision was made to survey all participants at two different points of time each school
year with two different surveys. The first survey was to be administered at the beginning of the third
nine-week study period and the second survey was to be administered at the end of the fourth nine-
week study period. Originally the surveys were to cover five school years but because no surveys
were conducted in 1998, the five surveys covered six calendar years, 1996 to 2001.
The survey instrument used for the spring surveys was a standardized survey designed by
the National Association of Secondary School Principals. The summer survey was designed by the
College of Education at East Tennessee State University. The third measure of opinions was
collected through personal interviews of individuals that had experienced the entire six years of
year-round schooling at University School.
The population for the surveys included teachers, parents, and students of University School
and varied in number from year to year. The spring surveys were administered to all teachers, all
students in grades 6 through 12, and all parents of those children. The summer surveys were
administered to all teachers, all students in the four high school grades, and their parents. Due to
staff turnover there were only six faculty members who had been at University School continuously
for the entire period 1996 through 2001. That same number of students and parents who had been at
University School continuously from 1996 to 2001 were interviewed. The overall participation of
teachers was 80.1%, of students was 92.6%, and of parents was 39.6%, all are considered adequate
numbers for the purposes of this study.
The study addressed 15 questions, 12 that were derived from survey results and 3 from
interview results. The 12 research questions required testing of 12 general research hypotheses. The
decisions to accept or reject the 12 general hypotheses were based on the testing of 98 specific sub-
hypotheses. Then all 98 sub-hypotheses were tested at the .05 level of significance. If any one sub-

109
hypotheses was rejected the more general research hypothesis was rejected. Data were analyzed by
using a one-way analysis of variance (ANOVA) to test for significant differences. A posthoc test,
Least Significant Differences (LSD) test, was used to determine the differences between years. The
interviews provided data from 8 questions for each of the three groups. This required analysis of 24
sets of responses.
Findings
The findings for this study will be discussed in three phases to correspond to the two
surveys and one interview. Each null hypothesis will be repeated then analyzed based upon the data.
Phase One
Across the five data collection points (years):
Ho1. There is no difference in parents’ satisfaction level in nine specific categories.
The satisfaction of parents is slightly higher in 2001 than in 1996 in three categories (student
activities, school buildings, supplies and maintenance, and student discipline). In the remaining six
categories the 2001 level is significantly higher than 1996. Parents have been overwhelmingly
satisfied with YRS. The null hypothesis was rejected.
Ho2. There is no difference in parents’ perception of the climate level in 10 specific categories.
The two categories of student academic orientation and student activities were the only two
categories that scored lower in 2001 than 1996 but they were not significantly lower. Four
categories were higher in 2001 than 1996 and the remaining four categories were significantly
higher in 2001 than 1996. Instructional management increased steadily from 1996 to 2001. Parents
demonstrated an overall positive perception of climate over the reporting periods. The null
hypothesis was rejected.
Ho3. There is no difference in teachers’ satisfaction level in nine specific categories.
Four of the nine categories (opportunity for advancement, coworkers, parents and
community, and school buildings, supplies, and maintenance) were slightly lower in 2001 than 1996
but differences were not significantly lower. Each of those categories varied over the five years.
One category (compensation) was significantly lower in 2001 than 1996. Two categories (student

110
responsibility and discipline and curriculum and job tasks) had slight increases over the five years
but were not significantly higher. Two categories (administration and communication) were
significantly greater in 2001 than 1996. Given that 1999 was significantly greater in one category
and 1997 was significantly greater in two, the overall trend was increasing in seven of the nine
categories. The null hypothesis was rejected.
Ho4. There is no difference in teachers’ perception of the climate level in 10 specific categories.
There were 6 of 10 categories where no significant differences were recorded but finished
greater in 2001 than 1996. Two categories, teacher-student relationships and security and
maintenance, finished higher in 2001 than 1996, but not significantly. The remaining two
categories, guidance and student behavioral values, were significantly greater in 2001 than 1996.
There were no significant decreases in perception of climate over all categories. The null hypothesis
was rejected.
Ho5. There is no difference in students’ satisfaction level in eight specific categories.
The satisfaction of students was significantly greater in 2001 than 1996 in 7 of 8 categories
and slightly less in one, student activities. The null hypothesis was rejected.
Ho6. There is no difference in students’ perception of the climate level in 10 specific categories.
The category of student activities was the only category that finished significantly lower in
2001 than 1996. Of the remaining nine categories, three were higher and six were significantly
higher in 2001 than 1996. The null hypothesis was rejected.
Phase Two
Across the five data collection points (years):
Ho7. There is no difference in parents’ beliefs about teaching and learning in seven specific
categories.
Parents’ beliefs about the school setting high academic standards were slightly less in 2001
than in 1996. There were slightly higher scores “the recognition for academic achievement” and
“students are prepared for the future” categories between 1996 and 2001. The remaining four
categories (students achieve goals, effective learning atmosphere, teachers believe in student

111
abilities, and environment is serious and orderly) were all significantly greater in 2001 than in 1996.
The null hypothesis was rejected.
Ho8. There is no difference in parents’ opinion about year-round schooling in seven specific
categories.
Parents indicated their opinion in all seven categories was significantly greater in 2001 than
1996. The results were overwhelmingly positive. The null hypothesis was rejected.
Ho9. There is no difference in teachers’ beliefs about teaching and learning in seven specific
categories.
There were no significant differences between 1996 and 2001 results. Three of the seven
categories had slight decreases in values and four had slight increases. YRS had no significant effect
on the teachers’ beliefs about teaching and learning. The null hypothesis was retained.
Ho10. There is no difference in teachers’ opinion about year-round schooling in seven specific
categories.
Teachers indicated they felt slightly less convinced that students had better retention of
learned material and were less motivated in 2001 than in 1996. The other five categories were all
slightly higher in 2001 than in 1996. Effective teaching and learning and students overcome
learning problems were both significantly greater in 1999 and 2000 than in the beginning year. The
general indications across the seven categories are positive. The null hypothesis was rejected.
Ho11. There is no difference in students’ beliefs about teaching and learning in seven specific
categories.
Students indicated only a slightly greater response to academic achievement is recognized
between 1996 and 2001. All six of the other categories were significantly greater in 2001 than in
1996. The null hypothesis was rejected.
Ho12. There is no difference in students’ opinion about year-round schooling in seven specific
categories.
Students’ opinions about YRS were significantly greater in 2001 than 1996 in all seven

112
selected categories. The null hypothesis was rejected.
Phase Three
13. Has the year-round schooling system influenced the parents’ overall opinion about the
University School during the first five years?
Two parents were very positive about the implementation of YRS, two had no feelings, and
two were negative initially. The two that had no feelings wanted to “wait and see”. Five of the six
parents indicated that their children had benefited from YRS and the two “best” benefits were the
reduction of review time and the reduction of boredom during the long summer breaks. This
schedule was better for athletes when away trips were scheduled during breaks and students had less
burnout, greater retention, and easier transitions from grade to grade. Four parents stated the new
environment promoted effective learning, teachers and students were more energized, and students
had less review time, higher retention, and continuous learning. The two parents with no opinion
said their children were happier. Five parents said the change far exceeded their expectations, and
some cited their children’s enthusiasm and enjoyment for school. Other comments included; the
University School was a true community leader, other schools could benefit from their example, the
school had better teachers, parents were well informed of the changes, and parents were well
prepared.
Negative responses included; the change to YRS was being forced upon them, they had no
control over what happened to their children, and they did not like it. Other particular problems
included; difficulty finding day-care facilities to accommodate new schedule, the cost of
intersession courses was exorbitant, and children would miss summer camp and summer baseball
schedules. Four parents knew of six families total that left because of YRS. Concerns expressed
about intersession courses were; the additional expense required, the need to improve continuity of
learning, the lack of individual attention to students, and they wanted to ensure completion would
affect student’s grade. Parents also stressed that teachers should respect breaks as “time off” for the
students and not assign work.
14. Has the year-round schooling system influenced the teachers’ overall opinion about the
University School during the first five years?
Teachers had positive comments on several aspects of YRS. They said that they were well

113
prepared for the transition with school briefings, they liked the three-week vacation periods and the
fact that remediation for students was immediate. The nine-week sessions required thorough
planning and they were satisfied with that. They thought their effectiveness had improved, they had
more prep time, schedules were more flexible, and students were more rested at the start of sessions.
They also said they felt their teaching was more effective and comprehensive and the students were
more enthusiastic and productive.
Five of the six teachers said they did not know anyone who had left because of YRS. Two
teachers said YRS had exceeded their expectations, two said it just met theirs and two said it fell
short of their expectations primarily because of the intersession program setup. The nine-week
learning sessions and three-week breaks allow teachers to rejuvenate more readily and may allow
them to extend their teaching careers.
Negative aspects included concern for athletic programs and giving up long summer
vacations. With shorter breaks some teachers lose professional development time, course
development time, and the traditional summer school. There was some concern for the time required
to evaluate students by the fourth week as candidates for remediation and the extra time required to
develop a plan for remediation by the seventh week. More stress was placed upon them to complete
prescribed subject matter in the allotted time. Intersession classes were costly and ineffective if
students were not required to attend.
15. Has the year-round schooling system influenced the students’ overall opinion about the
University School during the first five years?
Students stated that instruction and learning opportunities were better, little review time was
required, more time was allotted to learn new material, and there was better continuity in the
learning process. The shorter breaks reduced boredom and the intersession periods initially helped
students pass subjects. A strong suggestion was made for testing by semester for yearlong courses
instead of a comprehensive final exam covering material learned over ten months. The students
indicated the learning environment was more efficient, they were more refreshed with the three-
week breaks, and they were ready to learn. A number of students felt YRS far exceeded their
expectations.
Negative comments included the fact that every student’s initial impression was negative.
They all thought they would go to school year-round and lose their vacations. They learned

114
quickly these were misconceptions and began to enjoy the new system. They indicated that the
intersession teachers should be better suited for the class they teach. Some were concerned about
missing summer sports such as baseball and camps and some missed their friends who were
enrolled in traditional schools. A few students said it was more difficult to prepare for final
exams for yearlong courses. Some students knew of fellow students who left due to YRS.
Because of the summer classes some students’ churches and community groups were required to
reschedule events to accommodate their YRS schedule.
Conclusions
Results and findings of the study lead to the following conclusions concerning the
implementation of year-round schooling at University School:
1. Parents were influenced positively by the implementation of YRS. Of the 33 categories
measured and evaluated for this study in Phases One and Two, the parents had significantly greater
scores in 21 of those categories, slightly higher scores in 9, and only 3 categories had a slightly
lower score from start to finish. The interviews in Phase Three confirmed these results with the
majority of the comments being positive.
2. Teachers were the least influenced group of participants. The majority of the categories (18
of 33) for Phases One and Two contained no significant differences. Teachers had the most
categories (9) that showed a slight decline between 1996 and 2001 but the majority of their results
were positive for the implementation of YRS with 23 out of 33 categories. Teachers were the only
group that had a significant decline in only one category, compensation, which may be a problem
that is related to larger school funding issues and not necessarily to YRS. They only had four
significantly greater categories in both phases. Teacher results may have been lower than parents or
students because of the small number of cases, the two changes in administration in the five-year
period, and the large turnover rate for teachers for the testing period. The interviews with teachers
confirmed their acceptance of YRS and overall enthusiasm.
3. Students appeared the least informed group prior to implementation but emerged as the most
influenced by the new system. Students indicated a significant positive difference in 25 of their 32
categories, a slight increase in 5 categories, a slight decline in 1 category and a significant decrease
in 1 category, student activities. The students interviewed in Phase Three indicated they would
never want to revert to the old traditional system and they truly enjoy YRS.
115
4. The school system and administration had gone to great lengths to prepare everyone for the
change to YRS. Briefings conducted for teachers and parent groups appear to have been extremely
effective and the use of parents on action groups prior to implementation assisted greatly in the
overall acceptance. The student briefings possibly had some aspects that could have provided more
information to raise the comfort level of more students.
5. The two significant changes in administration over the testing periods may have had the
greatest impact on the teachers and administrative personnel with reference to these surveys.
Students and parents seemed less affected by these changes and the influence of YRS was more
substantial to those two groups.
6. The perception of climate for all three subject groups improved over the survey period.
Teachers were the smallest group, had the largest turnover rate and showed only slight improvement
in several categories. Parents showed improvement in the majority of the categories and the students
who actually experienced the transition daily showed significant improvement in all categories.
7. The most significant finding during Phase Three was the general feeling that with the
scheme of nine weeks on and three weeks off, teachers seemed more refreshed and capable of doing
their job.
8. Possibly the most significant statement that came from the interviews was that even though
there was apprehension initially for the change to YRS, many parents and students would never
want to return to the traditional system.
9. The intersession courses appear to need improvement. Initially they counted for credit and
improved course grades then they only counted for advancement to the next level of a subject.
Concerns were also raised about the cost of the classes and the quality of assigned teachers.
Recommendations for Practice
Based upon the findings and conclusions of this study the following recommendations for
practice are offered:
1. A thorough and comprehensive study of YRS was conducted by the University School
organization including administrators, teachers, and parents and their findings should provide
interested schools valuable pre-implementation information.
2. A complete review of the Intersession policies and procedures may be required to determine
its cost effectiveness, academic effectiveness, and long-term value to the students. In some cases it

116
appeared to be cost-prohibitive to some families.
3. The scheduling of away competitions for the athletic programs during breaks may be a
consideration worthy some attention as well as compensatory time off for athletes during school
sessions.
4. The survey form designed by the College of Education for use during the May surveys is an
excellent and thorough tool to be shared with other school systems considering YRS.
Recommendations for Future Research
Other possible studies to collect future feedback on the effectiveness of YRS could be:
1. A comparative study of teacher verses principal on acceptance of YRS.
2. A post graduation follow-up of students’ comparing their academic progress to that of
students from a traditional school background conducted after their second year of college.
3. Compare students’ ACT and other standardized test scores with students in traditional
schools.

117
REFERENCES
Alcorn, R. D. (1992). Test scores: Can Year-round school raise them? Thrust for Educational
Leadership, 21(6), 12-15.
Baker, G. (1990). Parent satisfaction with year-round and traditional school calendars in
Conroe Independent School District. (Master’s Thesis, Sam Houston State University,
1990). (ERIC Document Reproduction Service No. ED 331 137)
Ballinger, C. (1985). Year-round education: an overview, 1985. Paper presented at the annual
meeting of the National Council on Year-Round Education, Los Angeles, California
(ERIC Document Reproduction Service No. ED 265 635).
Ballinger, C., Kirschenbaum, N., & Poimbrauf, R. P. (1987). The year-round school: Where
learning never stops. Fastback 259, IN. Butler University, Indiana Chapter of Phi Delta
Kappa. (ERIC Document Reproduction Service No. ED 290 210).
Bradford, J. C.,(1995). Year-round schools: A national perspective. Reports-
Evaluation/Feasibility (ERIC Document Reproduction Service No. ED 343 259).
Campbell, W. D. (1994, Summer). Year-round schooling for academically at-risk students:
Outcomes and perceptions of participants in an elementary program. ERS Spectrum, 20-
24.
Campbell, D. T., & Stanley, J. C. (1963). Experimental and quasi-experimental designs for
research. Chicago. Rand McNally.
College of Education. (1996, April). University school year-round education report.
Unpublished manuscript, East Tennessee State University.
Cook, T. D., & Campbell, D. T., (1979). Quasi-experimentation design and analysis issues for
field settings. Boston. Houghton Mifflin.
Fahy, B. R. (1990, October). Year-round school nothing new in P.W., Weekly Messenger. 1-3.
Gandara, P., & Fish, J. (1994). Year-round schooling as an avenue to major structural reform.
Educational Evaluation and Policy Analysis. 16(1), 67-85.
Glines, D. (1987). Year-round education: A philosophy. Thrust for Educational Leadership,
16(7), 14-17.
Glines, D. (1994). Philosophical rationale for year-round education. Paper presented at the
Annual Meeting of the National Association for Year-Round Education, San Diego, CA.
(ERIC Document Reproduction Service No. ED 386 075).

118
Glines, D. (1995). Year-round education: History, philosophy, future. San Diego, CA. National
Association for Year-Round Education.
Greenfield, T. A. (1994). Year-round education: A case for change. Educational forum, 58, 252-
262.
Grotjohn, D. K., & Banks, K. (1993, April). An evaluation synthesis: Year-round schools and
achievement. Paper presented at the annual meeting of the American Educational
Research Association, Atlanta, GA.
Haenn, J. E. (1996, Fall). Evaluating the promise of single-track year-round schools. ERS
Spectrum, 27-35.
Halderson, C., Kelley, E., Keefe, J., & Berge, P.(1989) Technical Manual: School climate
survey, student satisfaction survey, teacher satisfaction survey, parent satisfaction
survey. Reston, VA. National Association of Secondary School Principles.
Herman, J. (1991). Novel approaches to relieve overcrowding: The effects of concept 6 year-
round schools. Urban Education, 26, 195-213.
Kneese, C. C. (1996). Review of research on student learning in year-round education. Journal
of Research and Development in Education, 29. 60-72.
Kreitzer, A., & Glass, G. (1993). Policy considerations in conversion to year-round schools
(Policy Brief #1). Tempe. Arizona State University. Education Policy Studies Laboratory.
McLean, J. E., & Adams, R. L. (2001) An evaluation of the transition to year-round school at the
University School. ETSU internal report 07/26/2001.
Merino, B. J. (1983). The impact of year-round schooling: A review. Urban Education, 18, 289-
316.
Mutchler, S. E. (1993). Year-round education. Southwest Educational Development Laboratory.
Austin, TX. (ERIC Document Reproduction Service No. ED 363 966).
Natale, J. A. (1992). Success stories in year-round schooling. American School Board Journal
179(7), 29-30.
NAYRE (2000). Specializing in time and learning. [On-line]. Available:
http://www.NAYRE.org
Prohm, B., & Baenen, N. (1996, Spring). Are year-round, multi-track elementary schools
effective? An analysis of schools in Wake County, North Carolina. ERS Spectrum, 42-47.
Rasberry, Q. (1994). Research summary: Year-round may not be the answer. Paper presented at
119
the Conference for Private Child Care Centers and Preschools, Orlando, FL. (ERIC
Document Reproduction Service No. ED 369 548).
Ritter, C. (1992). Effects of year-round calendar on gifted and talented students. Master’s
Thesis, Sam Houston State University. (ERIC Document Reproduction Service No. ED
350 739).
Rodgers, L. (1993). The pros and cons of year-round education at the elementary public school
level. Master of Early Childhood Education Project. California State University, Long
Beach, CA. (ERIC Document Reproduction Service No. ED 370 160).
Roby, D. E. (1995, Winter). Comparison of year-round school and a traditional school: Reading
and mathematics achievement. ERS Spectrum, 7-10.
Sincoff, M., & Reid, T. (1975). Year-round school: in Phoenix it’s plodding forward on solid
ground, but in Virginia Beach it has been tried and scuttled. American School Journal
162, 50-51.
Six, L. (1993). A review of recent studies relating to the achievement of students enrolled in
year-round education programs. San Diego, CA: National Association for Year-Round
Education.
Smith, D. B. (1992). Finding room for California’s children. Thrust for Educational Leadership,
21, 8-11.
Tozer, S., Violas, P., & Senese, G. (1998). School and society: Historical and contemporary
perspectives. 3rd edition, McGraw Hill, p.71.
Weaver, T. (1992). Year-round education. ERIC Clearinghouse on Educational Management,
Eugene, OR. (ERIC Document Reproduction Service No. ED 342 107).
White, K. A. (1998, July). The heat is on as big districts expand summer school. Education
Weekly, 17-42.
Winters, W. L. (1994). A review of recent studies relating to the achievement of students
enrolled in year-round education programs (2nd Ed). San Diego, CA: National
Association for Year-Round Education.
Zykowski, J. L., Mitchell, D. E., Hough, D. & Gavin, S. E. (1991). A review of year-round
education research. Riverside, CA: California Educational Research Cooperative.
(ERIC Document Reproduction Service No. ED 330 040).

120
APPENDICES

121
APPENDIX A
LETTERS AND INSTRUCTIONS

122
April 23, 2001
Dear Parent(s): Since 1996 the University School students, teachers and parents have participated in nine surveys to measure the acceptance and usefulness of the implement of Year-Round Schooling. The final survey is enclosed. This survey will be the last of ten surveys required for the five-year evaluation. This is the last opportunity for students, teachers, and parents to share their feelings about Year-Round schooling as part of this formal survey instrument. This survey of parents is being conducted to determine current feelings about University School. One questionnaire packet is being sent to each family with children in high school at University School. Similar surveys are being sent to teachers, staff members, and students in grades 9 through 12. Along with this letter you should find a copy of the Parent’s May Survey, a Written Comments Form, a return envelope, and a return postcard. We want to accurately represent the thinking of parents who have children at University School. This is the fifth and final year in which this set of assessment tools has been used to evaluate the University School learning environment. The data from this “final wave” of data collection will be added to the results from the previous years to develop a longitudinal profile. This new report and profile should be available by August 1, 2001 and shortly after that time the results will be disseminated to parent groups. Will you please help us gain a complete picture of the school by responding to the survey instruments and returning them along with the enclosed comments sheet by May 15, 2001. You may be assured of complete anonymity. No name or ID should be placed on the materials. There are no right or wrong answers. In responding to the Benefits and Opinions Survey, please put your answers on the actual surveys. You are encouraged to make written comments on the Written Comments Form. More specific directions are given on the forms. Please remember to return both survey forms and comment sheets. Once you have prepared your answer sheets for return please drop the return postcard in the mail separately to have your name removed from the second mailing list for forms not returned. Please note that in an effort to keep the costs of this evaluation down, we will not be sending a complete second survey package to those who do not respond to this first request, so we urge you to take the few minutes necessary to complete them and send them back upon receipt of this letter. This will assure that future decisions are made upon the best information available. Your input is truly valued. We would be most happy to answer any questions you might have. Please write or call. The telephone number is (423) 439-4430. Thank you for your assistance. Your help with the evaluation is appreciated! We look forward to disseminating the results to you in early August. Sincerely, Robin Adams Doctoral Candidate/Evaluation Specialist
Return to text

123
April 12, 2000 Dear Parent(s): On March 7, 2000 the College of Education mailed out the first of two surveys of the University School ongoing evaluation program to evaluate the Year-Round schooling. Our records indicate that we have not received the return post card from you indicating that you had mailed the evaluation answer sheet back to our office. To date we have received nearly 50% of the completed survey forms but we would like to be a little closer to our goal of 100% response. We have received more answer sheets than return post cards so some parents may have inadvertently forgotten the post card. If you have mailed in you survey answer sheet and failed to mail the response card, thank you and we do not need any further response from you at this time. If you had forgotten to complete your survey form it is not too late. Please complete the survey form within the next two weeks and return it to the College of Education. The information provided by this survey will assist the administration in planning and decision-making for the next five years. Your opinion matters and your vote counts…. if we have it in the data base. Please help us make University School even better in the future. Some of the responses to date have been enlightening and wonderful. Maybe your responses will be something we haven’t considered. We will close out this part of our survey on April 26, 2000. If you have any questions please call (423) 439-4430 and leave a message for me. I will return all calls. Sincerely, Robin Adams Doctoral Fellow/Evaluation Specialist
Return to text

124
SCHOOL YEAR 2000-2001 GUIDELINES FOR COMPLETING TEACHER / ADMINISTRATIVE STAFF
SURVEYS AT UNIVERISTY SCHOOL
The purpose of these surveys is to assess the current health of University School and to provide information to be used in future planning. In order to assure anonymity, the data, including any written comments, will be summarized and made part of a written report that will be given to the school leaders. No individual responses will be identified. The surveys, which include one to measure satisfaction and one to measure climate, are being administered to students, teachers, and parents. You will be responsible for completing your own surveys and for administering surveys to students in Grades 6-12. Please follow the instructions below. TEACHER SURVEYS (Administered to teachers and administrative staff.) You should have a package including two surveys, one answer sheet, one comment sheet and an envelope. Please note that one side of the answer sheet is for Satisfaction Survey and the other is for School Climate Survey. All answers should be marked on the answer sheet. 1) Begin by filling in your background information. Use the codes listed on the front of the school
Climate Survey except for block 5 as listed here: Questions 1, 2, & 3 -(DO NOT ANSWER) Question 4 Role (indicate — 2 = Teacher, 3 = Staff (anyone who is NOT either a building administrator or
certified teacher), or 4 = School Administrator) Question 5 Class Code ("right justify you answer i.e. "___ 1")(indicate the year in which you joined
University School — 1 before 1996, 2 = 1996, 3 = 1997, 4 = 1998, 5 = 1999, & 6 = 2000) Question 6 Sex — 1 = Female & 2 = Male Question 7 Race — 1 American Indian, 2 = Asian American, 3 = Black, 4 = Hispanic, 5 = White, or 6 =
Other. Question 8 Special Codes — (DO NOT ANSWER)
2). Answer questions 1-56 of the Teacher Satisfaction Survey. Note the answers for this survey go on the same side as the background information just completed. This survey is asking you what you think? Respond using the coded responses 1-6 listed on the front of the survey. Please note that option number 6 is "I don't know". 3.) Answer questions 1-55 of the School Climate Survey. Note the answers for this survey go on the opposite side from the background information. This survey is asking you what most people think? Respond using the coded responses 1-6 listed on the front of the survey. Please note that option number 6 is "I don't know". 4.) Answer the questions on the Written Comments Form. Use the back of the sheet if you have any additional comment. In order to ensure anonymity, all comments will be summarized together. The original comments will only be seen by the College of Education researcher compiling the data. 5.) Once you have completed the surveys, please seal the answer sheet and comment sheet in the attached envelope and turn the envelope and survey forms into the University School Office by Wednesday, February 14, 2001. Also, please let us know that you have returned your surveys by signing the completed survey sheets list available in the office.
Return to text

125
FEBRUARY 2001 SURVEY SOME GUIDELINES FOR ADMINISTERING THE STUDENT ASSESSMENTS
AT UNIVERSITY SCHOOL 1. Tell students that the University School Committee put together a plan for the collection of school climate
and satisfaction information from all students in grades 6-12. We want to paint a picture of how students feel about the University School. The information will be used to assess the current health of University School and to provide a benchmark that will be used in the future planning. The instruments were developed by the National Association of Secondary School Principals (NASSP),
Tell the students that two similar NASSP surveys are being sent to all parents in the system and all teacher/staff members. The responses from students are extremely important. An evaluation specialist from the Department of Educational Leadership will summarize the results and provide a summary report back to leaders in the school and to parents.
2. Please tell the students that there are two separate survey forms; a NASSP School Climate Survey, and NASSP Student Satisfaction Inventory. In addition, there is a separate machine scoreable answer sheet. They can also complete the Written Comments Form.... if they choose to do so. Show them each of the survey forms as you mention them. Tell the group that the surveys measure different aspects of the University School.
A. Show the students how the NASSP Answer Sheet contains places to code demographic
information as well as responses to the School Climate and School Satisfaction Surveys.
B. Please talk the students through this part of the document. This demographic information is critical for accurate survey results. Have them fill in the Questions in the Background Information Section as indicated below:
Questions 1, and 2 —(DO NOT ANSWER) Question 3 Grade — (indicate the appropriate grade level 6 thru 12) Question 4 Role (indicate 1 = Student) Question 5 Class Code ("right justify you answer i.e. "___1 ")(indicate the year in which you
joined University School) 1 =before 1996, 2=1996, 3=1997, 4=1998, 5= 1999, & 6=2000
Question 6 Sex —1 = Female & 2 = Male Question 7 Race — 1 = American Indian, 2 = Asian American, 3 = Black, 4 = Hispanic, 5 = White, or 6 = Other. Question 8 Special Codes — (DO NOT ANSWER)
C. PLEASE HAVE EACH STUDENT RECHECK THEIR GRADE LEVEL. THIS INFORMATION IS CRITICAL TO ACCURATE DATA ANALYSIS.
3. Make sure that the students realize that each NASSP Survey matches up with a particular side of the
NASSP Answer Sheet. Make sure they understand that one side of the answer sheet is for the School Climate responses while the other is for the School Satisfaction responses.
4. IMPORTANT!!! Make sure the students understand that the survey forms, the School Climate Inventory
and Student Satisfaction Inventory are designed to get THEIR assessment of the University School and the School Leadership. They should think of University School and the school leadership when responding to these instruments.
5. It is suggested that the instruments be completed in the following order:
1) Complete the answer sheet and code in the appropriate information 2) Student Satisfaction Inventory

126
3) School Climate Inventory 4) Written Comments Form.
It is suggested you pass out all forms and list the preferred order of completion on the board. 6. Remember to go over the directions for each of the inventories. Students should know that the School
Climate Inventory asks them "what most people think" and the Satisfaction Inventory asks them "what I think". This distinction is important. Read aloud the six possible responses on each inventory and highlight the fact that there is an "I don't know" response available.
7. Do not force anyone to take the surveys. If you run into resistance, stress that we are not here to evaluate
anyone. All we can do is assure them that we will keep responses confidential and that no one at the school will see the individual answer sheets. Names or ID numbers are not to be given. If they still are resistant after you have given our position on "neutrality" and "confidentiality", then do not try to force them into completing the forms.
8. Let them know that written comments are welcome on the back of any of the forms as well as on a separate
sheet of paper. If written comments are made, they will be summarized with all others. Only ETSU College of Education staff will see written comments in their "raw" form.
9. Have fun! Remember to pick up the pencils. Please check all your responses after
collecting the information to make sure that ROLE correct and GRADE is coded correctly. It would be really helpful if you could group all like surveys together prior to turning them back in to the office; e.g., clip all School Climate Inventories together, Student Satisfaction Inventories together, etc. Please determine how many are in each class. KEEP A COUNT OF HOW MANY SURVEYS WERE HANDED OUT OF EACH TYPE AND HOW MANY WERE RETURNED. WE WOULD LIKE TO HAVE SOME ESTIMATE OF A RESPONSE RATE FOR EACH GRADE LEVEL.
10. Last but not least, remember to let the students know that we are NOT trying to "evaluate" anyone. We
were asked to help collect data that will help the school with future planning. This is a POSITIVE survey that will provide POSITIVE information and help the University School become even better in the future!
Return to text

127
APPENDIX B
SURVEY RESPONSE CHART

128
Survey Response Chart Return to Phase 1 Phase 2 1996 1997 1999 2000 2001 Feb May Feb May Feb May Feb May Feb May
Total 38 24 38 38 24 24 45 31 40 40 Returned 35 14 20 33 20 20 41 27 33 30
Te a Percentage 92.0 58.3 53.0 86.8 83.3 83.3 91.1 87.1 82.5 75.0
Total 397 236 403 262 391 222 395 270 398 272 Returned 374 224 371 248 348 205 375 253 329 257
S t u Percentage 94.2 94.2 96.0 94.7 89.0 92.3 94.9 93.7 82.7 94.5
Total 413 235 416 237 393 224 380 258 358 241 Returned 153 125 175 120 57 80 191 128 114 75
P a r Percentage 37.0 53.2 42.1 50.6 14.5 35.7 50.3 49.6 31.8 31.1 Overall Responses Percentages Overall % FEB MAY Teacher 80.38 78.10 80.10 Student 91.36 93.88 92.62 Parent 35.14 44.04 39.59
Return to Phase 1 text Return to Phase 2 text

129
APPENDIX C
MAY SURVEYS AND INTERVIEW QUESTIONS

130
University School
Teacher Survey May, 2001
Directions: This survey is being conducted at the request of the University School Evaluation Committee. It has been designed to assess teacher opinions about elements of the teaching-learning environment at University School and year-round schooling. Please complete each of the sections on the questionnaire. Some of the questions require that you simply select a best response, while other questions require a written response. Thank you for completing this questionnaire. When you complete the survey, please return it to your office for pick up. Please do not identify yourself on the questionnaire. Please indicate what year you joined the University School System Before 1996_____ 1996_____ 1997_____ 1998_____ 1999_____ 2000_____ 2001______ Part I. Beliefs About Teaching and Learning at University School Use the following scale in responding to questions 1 through 12: RO = rarely occurs, SO = sometimes occurs, O = often occurs, VFO = very frequently occurs (circle one response). 1. The students in this school can achieve the goals that have been set for them. RO SO O VFO 2. The school sets high standards for academic performance. RO SO O VFO 3. Learning at this school is fun. RO SO O VFO 4. Students respect others who get good grades. RO SO O VFO 5. Students seek extra work so they can get good grades. RO SO O VFO 6. This school has an atmosphere in which students learn effectively. RO SO O VFO 7. Teachers at this school believe that their students have the ability RO SO O VFO to achieve academically. 8. Academic achievement is recognized and acknowledged by the school. RO SO O VFO 9. I am proud to be a teacher at this school. RO SO O VFO 10. Students try hard to improve on previous work. RO SO O VFO 11. The learning environment is orderly and serious. RO SO O VFO 12. Instructions at this school is preparing students for the future. RO SO O VFO Part II. Teacher Opinions About Year-Round Schooling Use the following scale in responding to questions 13 through 28: SD = strongly disagree, D = disagree, U = undecided, A = agree, SA =strongly agree. Year-Round Schooling: 13. promotes effective teaching and learning. SD D U A SA 14. enables students to overcome learning problems. SD D U A SA 15. helps students to improve test scores. SD D U A SA 16. makes it difficult to have a school sports program. SD D U A SA 17. makes it difficult for students to hold jobs. SD D U A SA 18. allows families opportunities to take vacations. SD D U A SA 19. presents obstacles for single parents. SD D U A SA 20. allows students to take enrichment classes during intersessions. SD D U A SA 21. leads to greater retention of learned material. SD D U A SA 22. reduces the amount of time spent in class review. SD D U A SA 23. reduces opportunities to participate in other activities. SD D U A SA

131
24. reduces student stress. SD D U A SA 25. is based on information about how students learn most effectively. SD D U A SA 26. keeps students engaged in learning during the entire year. SD D U A SA 27. motivates students to attend school. SD D U A SA 28. List any other comments that you may have about year-round schooling. ___________________________________________________________________________________________________ ___________________________________________________________________________________________________ ___________________________________________________________________________________________________ ___________________________________________________________________________________________________ ___________________________________________________________________________________________________ ___________________________________________________________________________________________________ ___________________________________________________________________________________________________ Part III. Educator Survey Please respond to questions 29 through 50 using the following scale. HOW OFTEN: 0 1 2 3 4 5 6 Never A few Once a A few Once a A few Every times month times week times day a year or less a month a week or less __________________________________________________________________________________________________
HOW OFTEN Statements:
29. ______ I feel emotionally drained from my work.
30. ______ I feel used up at the end of the workday.
31. ______ I feel fatigued when I get up in the morning and have to face another day on the job. 32. ______ I can easily understand how my students feel about things. 33. ______ I feel that I treat some students as if they were impersonal objects. 34. ______ Working with people all day is really a strain for me. 35. ______ I deal very effectively with the problems of my students. 36. ______ I feel burned out from my work. 37. ______ I feel I’m positively influencing other people’s lives through my work. 38. ______ I’ve become more callous toward people since I took this job. 39. ______ I worry that this job is hardening my emotionally. 40. ______ I feel very energetic. 41. ______ I feel frustrated by my job. 42. ______ I feel I’m working too hard on my job. 43. ______ I don’t really care what happens to some students. 44. ______ Working with people directly puts too much stress on me. 45. ______ I can easily create a relaxed atmosphere with my students. 46. ______ I feel exhilarated after working closely with my students.

132
47. ______ I have accomplished many worthwhile things in this job. 48. ______ I feel like I’m at the end of my rope. 49. ______ In my work, I deal with emotional problems vary calmly. 50. ______ I feel students blame me for some of their problems. Part IV. Teacher Teaching Practices 51. In the following spaces, list any new or innovative instructional practices that you have used during this school year.
Instructional Practice
a) ________________________________________________________________________________________________
b) ________________________________________________________________________________________________ c) ________________________________________________________________________________________________ d) ________________________________________________________________________________________________ e) ________________________________________________________________________________________________ f) ________________________________________________________________________________________________ g) ________________________________________________________________________________________________ h) ________________________________________________________________________________________________ i) ________________________________________________________________________________________________ j) ________________________________________________________________________________________________ k) ________________________________________________________________________________________________ l) ________________________________________________________________________________________________ Part V. High School Students Access to Courses (Part V should only be completed by teachers who feel that they have a good understanding of the course offerings that are available for high school students. If you don’t feel knowledgeable of high school course offerings, please leave this section blank.) 52. Rate your current level of satisfaction with the extent to which high school students are able to enroll in needed courses (circle one response). Very Dissatisfied………………Dissatisfied…………….Neutral……………….Satisfied………………Very Satisfied 53. Please describe your feelings about the extent to which students at University School have access to the courses that they want to take or need to take. Use the back of the page if more space is needed. ___________________________________________________________________________________________________ ___________________________________________________________________________________________________ ___________________________________________________________________________________________________ ___________________________________________________________________________________________________ ___________________________________________________________________________________________________ ___________________________________________________________________________________________________ ___________________________________________________________________________________________________
54. What are the strengths that currently exist with regard to student access to courses? ___________________________________________________________________________________________________ ___________________________________________________________________________________________________ ___________________________________________________________________________________________________

133
___________________________________________________________________________________________________
55. What suggestions do you have for improving student access to courses? ___________________________________________________________________________________________________ ___________________________________________________________________________________________________ ___________________________________________________________________________________________________ ___________________________________________________________________________________________________
This is the end of the University School Teacher Survey
Thank you for your participation!
Return to text

134
University School
Parent Survey May, 2001
Directions: This survey is being conducted at the request of the University School Evaluation Committee. It has been designed to assess parent opinions about elements of the teaching-learning environment at University School and year-round schooling. Please complete each of the sections on the questionnaire. Some of the questions require that you simply select a best response, while other questions require a written response. Thank you for completing this questionnaire. When you complete the survey, please put it in the attached envelope and return it to Warf-Pickel Hall. Please do not identify yourself on the questionnaire. Please indicate what year you joined the University School System Before 1996_____ 1996_____ 1997_____ 1998_____ 1999_____ 2000_____ 2001______ Part I. Beliefs About Teaching and Learning at University School Use the following scale in responding to questions 1 through 12: RO = rarely occurs, SO = sometimes occurs, O = often occurs, VFO = very frequently occurs (circle one response). 1. The students in this school can achieve the goals that have been set for them. RO SO O VFO 2. The school sets high standards for academic performance. RO SO O VFO 3. Learning at this school is fun. RO SO O VFO 4. Students respect others who get good grades. RO SO O VFO 5. Students seek extra work so they can get good grades. RO SO O VFO 6. This school has an atmosphere in which students learn effectively. RO SO O VFO 7. Teachers at this school believe that their students have the ability RO SO O VFO to achieve academically. 8. Academic achievement is recognized and acknowledged by the school. RO SO O VFO 9. I am proud to be a parent of a child in this school. RO SO O VFO 10. Students try hard to improve on previous work. RO SO O VFO 11. The learning environment is orderly and serious. RO SO O VFO 12. Instructions at this school is preparing students for the future. RO SO O VFO Part II. Parents Opinions About Year-Round Schooling Use the following scale in responding to questions 13 through 28: SD = strongly disagree, D = disagree, U = undecided, A = agree, SA =strongly agree. Year-Round Schooling: 13. promotes effective teaching and learning. SD D U A SA 14. enables students to overcome learning problems. SD D U A SA 15. helps students to improve test scores. SD D U A SA 16. makes it difficult to have a school sports program. SD D U A SA 17. makes it difficult for students to hold jobs. SD D U A SA 18. allows families opportunities to take vacations. SD D U A SA 19. presents obstacles for single parents. SD D U A SA 20. allows students to take enrichment classes during intersessions. SD D U A SA 21. leads to greater retention of learned material. SD D U A SA 22. reduces the amount of time spent in class review. SD D U A SA 23. reduces opportunities to participate in other activities. SD D U A SA

135
24. reduces student stress. SD D U A SA 25. is based on information about how students learn most effectively. SD D U A SA 26. keeps students engaged in learning during the entire year. SD D U A SA 27. motivates students to attend school. SD D U A SA 29. List any other comments that you may have about year-round schooling. ___________________________________________________________________________________________________ ___________________________________________________________________________________________________ ___________________________________________________________________________________________________ ___________________________________________________________________________________________________ ___________________________________________________________________________________________________ ___________________________________________________________________________________________________ ___________________________________________________________________________________________________ Part III. High School Students Access to Courses (Part III is for parents who have children in high school. If you do not have a child in high school, please leave this section blank.)
30. Rate your current level of satisfaction with the extent to which high school students are able to enroll in needed courses (circle one response). Very Dissatisfied………………Dissatisfied…………….Neutral……………….Satisfied………………Very Satisfied 31. Please describe your feelings about the extent to which students at University School have access to the courses that they want to take or need to take. Use the back of the page if more space is needed. ___________________________________________________________________________________________________ ___________________________________________________________________________________________________ ___________________________________________________________________________________________________ ___________________________________________________________________________________________________ ___________________________________________________________________________________________________ ___________________________________________________________________________________________________ ___________________________________________________________________________________________________ 32. What are the strengths that currently exist with regard to student access to courses? ___________________________________________________________________________________________________ ___________________________________________________________________________________________________ ___________________________________________________________________________________________________ ___________________________________________________________________________________________________ 33. What suggestions do you have for improving student access to courses? ___________________________________________________________________________________________________ ___________________________________________________________________________________________________ ___________________________________________________________________________________________________
This is the end of the University School Parent Survey
Thank you for your participation! Return to text

136
University School
Student Survey May, 2001
Directions: This survey is being conducted at the request of the University School Evaluation Committee. It has been designed to assess student opinions about University School and year-round schooling. The survey also asks for information about student work, co-curricular/extra-curricular, and volunteer activities. Please complete each of the sections on the questionnaire. Some of the questions require that you simply select a best response, while other questions require a written response. Please do not put your name on the survey. Thank you for completing this questionnaire. Please indicate what year you joined the University School System Before 1996_____ 1996_____ 1997_____ 1998_____ 1999_____ 2000_____ 2001______ Part I. Beliefs About Teaching and Learning at University School Use the following scale in responding to questions 1 through 12: RO = rarely occurs, SO = sometimes occurs, O = often occurs, VFO = very frequently occurs (circle one response). 1. The students in this school can achieve the goals that have been set for them. RO SO O VFO 2. The school sets high standards for academic performance. RO SO O VFO 3. Learning at this school is fun. RO SO O VFO 4. Students respect others who get good grades. RO SO O VFO 5. Students seek extra work so they can get good grades. RO SO O VFO 6. This school has an atmosphere in which students learn effectively. RO SO O VFO 7. Teachers at this school believe that their students have the ability RO SO O VFO to achieve academically. 8. Academic achievement is recognized and acknowledged by the school. RO SO O VFO 9. I am proud to be a student at this school. RO SO O VFO 10. Students try hard to improve on previous work. RO SO O VFO 11. The learning environment is orderly and serious. RO SO O VFO 12. Instructions at this school is preparing students for the future. RO SO O VFO Part II. Teacher Opinions About Year-Round Schooling Use the following scale in responding to questions 13 through 28: SD = strongly disagree, D = disagree, U = undecided, A = agree, SA =strongly agree. Year-Round Schooling: 13. promotes effective teaching and learning. SD D U A SA 14. enables students to overcome learning problems. SD D U A SA 15. helps students to improve test scores. SD D U A SA 16. makes it difficult to have a school sports program. SD D U A SA 17. makes it difficult for students to hold jobs. SD D U A SA 18. allows families opportunities to take vacations. SD D U A SA 19. presents obstacles for single parents. SD D U A SA 20. allows students to take enrichment classes during intersessions. SD D U A SA 21. leads to greater retention of learned material. SD D U A SA 22. reduces the amount of time spent in class review. SD D U A SA 23. reduces opportunities to participate in other activities. SD D U A SA

137
24. reduces student stress. SD D U A SA 25. is based on information about how students learn most effectively. SD D U A SA 26. keeps students engaged in learning during the entire year. SD D U A SA 27. motivates students to attend school. SD D U A SA 34. List any other comments that you may have about year-round schooling. ___________________________________________________________________________________________________ ___________________________________________________________________________________________________ ___________________________________________________________________________________________________ ___________________________________________________________________________________________________ ___________________________________________________________________________________________________ ___________________________________________________________________________________________________ ___________________________________________________________________________________________________ Part III. Work Activities of Students 35. During the school year have you worked for a wage outside of school?
(Do not include work at home or work for your parents) Yes _________________ No ________________ (check one)
If you have worked outside the school, please answer question 30. If you have not worked during this school year, skip to question 31.
36. In the following spaces, indicate the job(s) you held, the employer(s), the starting month(s) and ending month(s) and the average number of
hours worked per week. Also indicate whether you worked during the WEEK (Monday through Friday), the WEEKEND (Saturday and/or Sunday), or
BOTH (both weekdays and weekends).
Job Employer Start Month End Month Hours/Week When Worked
a.) _________________ __________________ _____________ ____________ _____________ ______________
b.) _________________ __________________ _____________ ____________ _____________ ______________
c.) _________________ __________________ _____________ ____________ _____________ ______________
d.) _________________ __________________ _____________ ____________ _____________ ______________
e.) _________________ __________________ _____________ ____________ _____________ ______________
f.) _________________ __________________ _____________ ____________ _____________ ______________
37. Now, think back to last summer. During Summer, 2000, did you work for a wage? (Do not include work at home or work completed for
parents).
Yes _______________ No _____________ (check one)
If you worked for a wage last summer please answer question 32.
32. In the following spaces, indicate the job(s) held last summer (Summer 2000), the employer(s), the starting month(s) and ending month(s) and the
average number of hours worked per week. Also indicate whether you worked during the WEEK (Monday through Friday), the WEEKEND (Saturday
and/or Sunday), or BOTH (both weekdays and weekends).

138
Job Employer Start Month End Month Hours/Week When Worked
a.) _________________ __________________ _____________ ____________ _____________ ______________
b.) _________________ __________________ _____________ ____________ _____________ ______________
c.) _________________ __________________ _____________ ____________ _____________ ______________
d.) _________________ __________________ _____________ ____________ _____________ ______________
e.) _________________ __________________ _____________ ____________ _____________ ______________
f.) _________________ __________________ _____________ ____________ _____________ ______________
Part IV. Student Participation in Co-curricular and Extra-curricular Activities 33. In the following spaces, list the co-curricular and extra-curricular activities you have been involved in during the past academic year and write the starting months and ending months, if completed. Also indicate the average number of hours spent each week in each of these activities. Co-curricular activities include activities that originate at the school, such as mathathon, OM, Reflections, Clubs, Basketball, etc. Extra-curricular activities are defined here as any clubs, teams or organizations that do not originate at school. For example, if you were on a local swimming team, it should be listed as an extra-curricular activity, even though it was not a school team. Religious clubs and organizations are also examples of extra-curricular activities. Co-curricular/Extra curricular Activity Starting Month Ending Month Hours Per Week a.) ____________________________ ______________ _____________ ______________ b.) ____________________________ ______________ _____________ ______________ c.) ____________________________ ______________ _____________ ______________ d.) ____________________________ ______________ _____________ ______________ e.) ____________________________ ______________ _____________ ______________ f.) ____________________________ ______________ _____________ ______________ g.) ____________________________ ______________ _____________ ______________ h.) ____________________________ ______________ _____________ ______________ i.) ____________________________ ______________ _____________ ______________ j.) ____________________________ ______________ _____________ ______________ k.) ____________________________ ______________ _____________ ______________ l.) ____________________________ ______________ _____________ ______________ m.) ____________________________ ______________ _____________ ______________ n.) ____________________________ ______________ _____________ ______________ Part V. Student Volunteerism 34. In the following spaces, list any volunteer activities that you have been involved in during this past academic year, either at school or in the community. Please write in the starting months and ending months, if completed. Also indicate the average number of hours spent each week in these volunteer activities. List those activities in which you donated your time and services to assist others.
Volunteer Activity Starting Month Ending Month Hours Per Week a.) ____________________________ ______________ _____________ ______________ b.) ____________________________ ______________ _____________ ______________ c.) ____________________________ ______________ _____________ ______________ d.) ____________________________ ______________ _____________ ______________

139
e.) ____________________________ ______________ _____________ ______________ f.) ____________________________ ______________ _____________ ______________ g.) ____________________________ ______________ _____________ ______________ h.) ____________________________ ______________ _____________ ______________ Part VI. High School Students Access to Courses (Part V should only be completed by teachers who feel that they have a good understanding of the course offerings that are available for high school students. If you don’t feel knowledgeable of high school course offerings, please leave this section blank.) 35. Rate your level of satisfaction with the extent to which high school students are able to enroll in needed courses (circle one response). Very Dissatisfied………………Dissatisfied…………….Neutral……………….Satisfied………………Very Satisfied 36. Please describe your feelings about the extent to which students at University School have access to the courses that they want to take or need to take. Use the back of the page if more space is needed. ___________________________________________________________________________________________________ ___________________________________________________________________________________________________ ___________________________________________________________________________________________________ ___________________________________________________________________________________________________ ___________________________________________________________________________________________________ ___________________________________________________________________________________________________
37. What are the strengths that currently exist with regard to student access to courses? ___________________________________________________________________________________________________ ___________________________________________________________________________________________________ ___________________________________________________________________________________________________ ___________________________________________________________________________________________________
38. What suggestions do you have for improving student access to courses? ___________________________________________________________________________________________________ ___________________________________________________________________________________________________ ___________________________________________________________________________________________________ ___________________________________________________________________________________________________ Part VII. Student Characteristics
39. What grade are you now completing? (check one)
____________ 9th grade ___________ 10th grade ___________11th grade ___________12th grade
40. What is you age? ____________ 41. What is you gender? (check one) __________ Female __________ Male
This is the end of the University School Student Survey
Thank you for your participation!
Return to text

140
University School Year-Round Schooling Interview Questions
Teachers
1. When the results of the College of Education decision to implement Year-Round Schooling at University School was announced, what were your initial impressions of the system?
2. What difficulties did you encounter adjusting from six consecutive six-week learning
periods to four separate nine-week learning periods and the associated vacation schemes?
3. Over the period of the last five years, did you feel your effectiveness as a teacher has
improved or declined? Why?
4. Do you feel the YRS schedule provides a better environment to promote effective learning for your students?
5. Do you know if any of your colleagues left US as a result of the implementation of
YRS? If so, how many?
6. In your opinion has the implementation of YRS satisfied your original expectation of the program?
7. What one thing would you recommend to improve the YRS program at US?
8. Are there any other factors that may have influenced your feelings about the Year Round
School? Return to text

141
University School Year-Round Schooling Interview Questions
Parents 1. When the results of the College of Education decision to implement Year-Round Schooling
at University School was announced, what were your initial impressions of the system? 2. What difficulties did you encounter adjusting from six consecutive six-week learning periods
to four separate nine-week learning periods and the associated vacation schemes? 3. Over the period of the last five years, did you feel that your child has benefited from
the YRS program? Why? 4. Do you feel the YRS schedule provides a better environment to promote effective
learning for your child? 5. Do you know if any parents removed their children from US as a result of the
implementation of YRS? If so, how many? 6. In your opinion has the implementation of YRS satisfied your original expectation of
the program? 7. What one thing would you recommend to improve the YRS program at US? 8. Are there any other factors that may have influenced your feelings about the Year Round
School? Return to text

142
University School Year-Round Schooling Interview Questions
Students
1. When the results of the College of Education decision to implement Year-Round Schooling
at University School was announced, what were your initial impressions of the system? 2. What difficulties did you encounter adjusting from six consecutive six-week learning
periods to four separate nine-week learning periods and the associated vacation schemes?
3. Over the period of the last five years, did you feel the instruction and learning
opportunities have been better or worse? Why? 4. Do you feel the YRS schedule has provided you a more effective learning
environment? 5. Do you know if any of your classmates over the years have left US as a result of the
implementation of YRS? If so, how many? 6. In your opinion has the implementation of YRS satisfied the your original expectation
of the program? 7. What one thing would you recommend to improve the YRS program at US? 8. Are there any other factors that may have influenced your feelings about the Year Round
School? Return to text
143
APPENDIX D
SATISFACTION AND CLIMATE GRAPHS

144
Parents Satisfaction Graphs
Significant differences No significant differences
PARENT INVOLVEMENT
20012000999796
19.0
18.5
18.0
17.5
17.0
16.5
CURRICULUM
20012000999796
26.0
25.5
25.0
24.5
24.0
23.5
23.0
STUDENT ACTIVITIES
20012000999796
28.0
27.8
27.6
27.4
27.2
27.0
26.8
26.6
26.4
26.2
TEACHERS
20012000999796
29.0
28.5
28.0
27.5
27.0
26.5
26.0
25.5
25.0
SUPPORT SERVICES
20012000999796
19.5
19.0
18.5
18.0
17.5
17.0
Return to text

145
Parents Satisfaction Graphs (continued)
Significant differences No significant differences
SCHOOL BUILDINGS SUPPLIES & MAINTENANCE
20012000999796
15.0
14.8
14.6
14.4
14.2
14.0
STUDENT DISCIPLINE
20012000999796
30.5
30.0
29.5
29.0
28.5
28.0
27.5
ADMINISTRATORS
20012000999796
29
28
27
26
25
24
SCHOOL INFORMATION SERVICES
20012000999796
21.0
20.5
20.0
19.5
19.0
18.5
18.0
Return to table

146
Parents Climate Graphs
Significant differences No significant differences
TEACHER-STUDENT RELATIONS
20012000999796
47
46
45
44
43
42
SECURITY & MAINTENANCE
20012000999796
27.6
27.4
27.2
27.0
26.8
26.6
ADMINISTRATION
20012000999796
25
24
23
22
21
20
19
STUDENT ACADEMIC ORIENTATION
20012000999796
16.2
16.0
15.8
15.6
15.4
15.2
STUDENT BEHAVIORAL VALUES
20012000999796
9.2
9.0
8.8
8.6
8.4
8.2
8.0
7.8
7.6
Return to table

147
Parents Climate Graphs (continued)
Significant differences No significant differences
GUIDANCE
20012000999796
15.5
15.0
14.5
14.0
13.5
13.0
STUDENT-PEER RELATIONS
20012000999796
15.2
15.0
14.8
14.6
14.4
14.2
14.0
13.8
PARENT & COMMUNITY-SCHOOL RELATIONS
20012000999796
12.6
12.4
12.2
12.0
11.8
11.6
11.4
INSTRUCTIONAL MANAGEMENT
20012000999796
27.0
26.5
26.0
25.5
25.0
STUDENT ACTIVITIES
20012000999796
16.0
15.8
15.6
15.4
15.2
15.0
Return to table

148
Teacher Satisfaction Graphs
Significant differences No significant differences
ADMINISTRATION
20012000999796
35
34
33
32
31
30
29
COMPENSATION
20012000999796
19
18
17
16
15
14
13
12
OPPORTUNITY FOR ADVANCEMENT
20012000999796
15
14
13
12
11
10
STUDENT RESPONSIBILITY & DISCIPLINE
20012000999796
17.5
17.0
16.5
16.0
15.5
15.0
14.5
14.0
13.5
CURRICULUM & JOB TASKS
20012000999796
28.5
28.0
27.5
27.0
26.5
Return to text

149
Teacher Satisfaction Graphs (continued)
Significant differences No significant differences
COWORKER
20012000999796
33.5
33.0
32.5
32.0
31.5
31.0
30.5
30.0
29.5
PARENTS & COMMUNITY
20012000999796
23.5
23.0
22.5
22.0
21.5
21.0
20.5
SCHOOL BUILDING & UPKEEP
20012000999796
23
22
21
20
19
18
COMMUNICATIONS
20012000999796
29
28
27
26
25
24
Return to table

150
Teacher Climate Graphs
Significant differences No significant differences
TEACHER-STUDENT RELATIONS
20012000999796
56
55
54
53
52
51
50
49
48
SECURITY & MAINTENANCE
20012000999796
29
28
27
26
25
24
ADMINISTRATION
20012000999796
27.0
26.5
26.0
25.5
25.0
STUDENT ACADEMIC ORIENTATION
20012000999796
15.8
15.6
15.4
15.2
15.0
14.8
STUDENT BEHAVIORAL VALUE
20012000999796
9.6
9.4
9.2
9.0
8.8
8.6
8.4
8.2
8.0
7.8
Return to table

151
Teacher Climate Graphs (continued)
Significant differences No significant differences
GUIDANCE
20012000999796
18.5
18.0
17.5
17.0
16.5
16.0
15.5
STUDENT-PEER RELATIONSHIPS
20012000999796
16.2
16.0
15.8
15.6
15.4
15.2
15.0
14.8
14.6
PARENT COMMUNITY-SCHOOL RELATIONS
20012000999796
14.8
14.6
14.4
14.2
14.0
13.8
13.6
13.4
13.2
INSTRUCTIONAL MANAGEMENT
20012000999796
28.0
27.5
27.0
26.5
26.0
STUDENT ACTIVITIES
20012000999796
18.6
18.4
18.2
18.0
17.8
17.6
17.4
17.2
17.0
Return to table

152
Student Satisfaction Graphs
Significant differences No significant differences
TEACHERS
20012000999796
25.0
24.5
24.0
23.5
23.0
22.5
22.0
21.5
FELLOW STUDENTS
20012000999796
18.5
18.0
17.5
17.0
16.5
16.0
SCHOOLWORK
20012000999796
17.8
17.6
17.4
17.2
17.0
16.8
16.6
16.4
STUDENT ACTIVITIES
20012000999796
16.5
16.0
15.5
15.0
14.5
14.0
13.5
13.0
Return to table
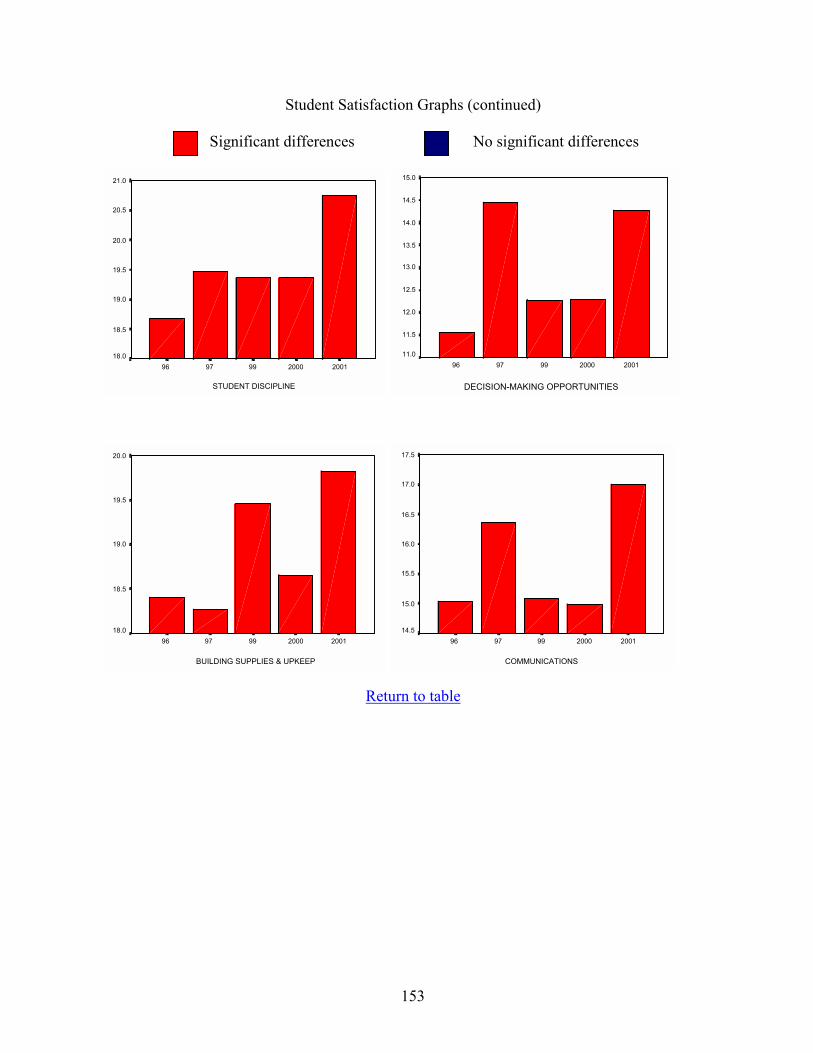
153
Student Satisfaction Graphs (continued)
Significant differences No significant differences
STUDENT DISCIPLINE
20012000999796
21.0
20.5
20.0
19.5
19.0
18.5
18.0
DECISION-MAKING OPPORTUNITIES
20012000999796
15.0
14.5
14.0
13.5
13.0
12.5
12.0
11.5
11.0
BUILDING SUPPLIES & UPKEEP
20012000999796
20.0
19.5
19.0
18.5
18.0
COMMUNICATIONS
20012000999796
17.5
17.0
16.5
16.0
15.5
15.0
14.5
Return to table

154
Student Climate Graphs
Significant differences No significant differences
TEACHER-STUDENT RELATIONS
20012000999796
41
40
39
38
37
36
35
SECURITY & MAINTENANCE
20012000999796
26.0
25.5
25.0
24.5
24.0
23.5
ADMINISTRATIONS
20012000999796
22
21
20
19
18
17
16
STUDENT ACADEMIC ORIENTATION
20012000999796
13.0
12.8
12.6
12.4
12.2
12.0
11.8
11.6
11.4
STUDENT BEHAVIORAL VALUES
20012000999796
8.5
8.0
7.5
7.0
6.5
6.0
Return to table

155
Student Climate Graphs (continued)
Significant differences No significant differences
GUIDANCE
20012000999796
15.0
14.5
14.0
13.5
13.0
STUDENT-PEER RELATIONS
20012000999796
13.8
13.6
13.4
13.2
13.0
12.8
12.6
12.4
PARENT & COMMUNITY SCHOOL RELATIONS
20012000999796
12.6
12.4
12.2
12.0
11.8
11.6
11.4
11.2
INSTRUCTIONAL MANAGEMENT
20012000999796
24.8
24.6
24.4
24.2
24.0
23.8
23.6
23.4
23.2
23.0
STUDENT ACTIVITIES
20012000999796
15.0
14.5
14.0
13.5
13.0
12.5
Return to text

156
APPENDIX E
GRAPHS BY GRADES

157
High School Students
Satisfaction Charts by Grade
TEACHER SATISFACTION BY GRADE
1211109
28
26
24
22
20
18
YEAR
96
97
99
2000
2001
FELLOW STUDENTS
1211109
20
19
18
17
16
15
YEAR
96
97
99
2000
2001
SCHOOLWORK
1211109
20
19
18
17
16
15
YEAR
96
97
99
2000
2001
STUDENT ACTIVITIES
1211109
18
17
16
15
14
13
12
YEAR
96
97
99
2000
2001
Return to text

158
High School Students Satisfaction Charts by Grade
(continued)
STUDENT DISCIPLINE
1211109
24
23
22
21
20
19
18
17
YEAR
96
97
99
2000
2001
DECISION-MAKING OPPORTUNITY
1211109
17
16
15
14
13
12
11
10
9
YEAR
96
97
99
2000
2001
BUILDING SUPPLIES & UPKEEP
1211109
21
20
19
18
17
16
15
YEAR
96
97
99
2000
2001
COMMUNICATIONS
1211109
20
19
18
17
16
15
14
13
YEAR
96
97
99
2000
2001
Return to text

159
High School Students Climate Charts by Grade (continued)
TEACHER-STUDENT RELATIONSHIP
1211109
44
42
40
38
36
34
32
YEAR
96
97
99
2000
2001
SECURITY & MAINTENANCE
1211109
28
27
26
25
24
23
22
21
20
YEAR
96
97
99
2000
2001
ADMINISTRATION
1211109
26
24
22
20
18
16
14
YEAR
96
97
99
2000
2001
STUDENT ACADEMIC ORIENTATION
1211109
14.0
13.5
13.0
12.5
12.0
11.5
11.0
10.5
YEAR
96
97
99
2000
2001
STUDENT BEHAVIORAL VALUES
1211109
10
9
8
7
6
5
YEAR
96
97
99
2000
2001
Return to text

160
High School Students Climate Charts by Grade (continued)
GUIDANCE
1211109
17
16
15
14
13
12
11
YEAR
96
97
99
2000
2001
STUDENT-PEER RELATIONS
1211109
15
14
13
12
11
10
YEAR
96
97
99
2000
2001
PARENT COMMUNITY-SCHOOL RELATIONS
1211109
Mea
n 20
01 C
lim P
aren
t & C
omm
un-S
ch R
el
14
13
12
11
10
9
YEAR
96
97
99
2000
2001
INSTRUCTIONAL MANAGEMENT
1211109
27
26
25
24
23
22
YEAR
96
97
99
2000
2001
STUDENT ACTIVITIES
1211109
17
16
15
14
13
12
11
YEAR
96
97
99
2000
2001
Return to text

161
APPENDIX F
COHORT GRAPHS

162
Cohort One Satisfaction Graphs
Significant differences No significant differences
TEACHERS
999796
25.0
24.5
24.0
23.5
23.0
22.5
22.0
21.5
21.0
FELLOW STUDENTS
999796
17.5
17.0
16.5
16.0
15.5
15.0
SCHOOLWORK
999796
18.5
18.0
17.5
17.0
16.5
STUDENT ACTIVITIES
999796
16.5
16.0
15.5
15.0
14.5
14.0
13.5
13.0
Return to table

163
Cohort One Satisfaction Graphs (continued)
Significant differences No significant differences
STUDENT DISCIPLINE
999796
20.5
20.0
19.5
19.0
18.5
18.0
17.5
DECISION-MAKING OPPORTUNITIES
999796
16
15
14
13
12
11
BUILDING SUPPLIES AND UPKEEP
999796
20
19
18
17
16
15
COMMUNICATIONS
999796
18
17
16
15
14
13
Return to table

164
Cohort One Climate Graphs
Significant differences No significant differences
TEACHER-STUDENT RELATIONS
999796
40
39
38
37
36
35
34
33
SECURITY & MAINTENANCE
999796
27.0
26.5
26.0
25.5
25.0
24.5
ADMINISTRATION
999796
24
22
20
18
16
14
STUDENT ACADEMIC ORIENTATION
999796
13.0
12.5
12.0
11.5
11.0
10.5
STUDENT BEHAVIORAL VALUES
999796
8.5
8.0
7.5
7.0
6.5
6.0
5.5
Return to table
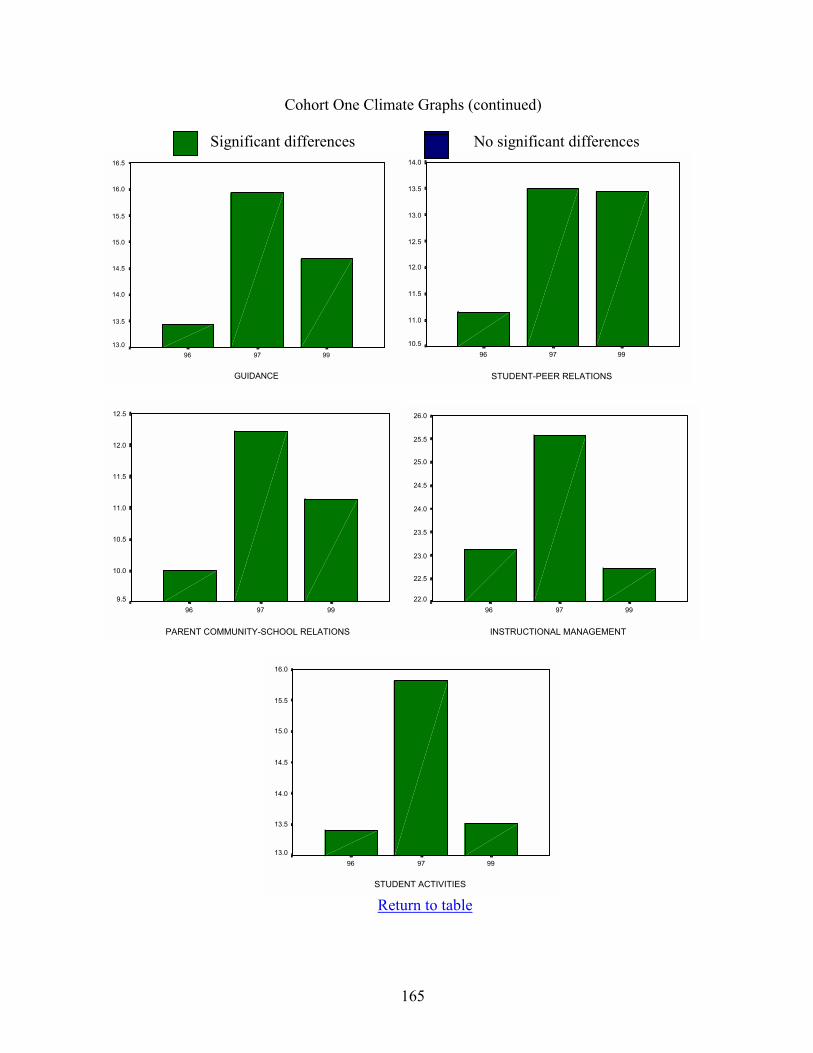
165
Cohort One Climate Graphs (continued)
Significant differences No significant differences
GUIDANCE
999796
16.5
16.0
15.5
15.0
14.5
14.0
13.5
13.0
STUDENT-PEER RELATIONS
999796
14.0
13.5
13.0
12.5
12.0
11.5
11.0
10.5
PARENT COMMUNITY-SCHOOL RELATIONS
999796
12.5
12.0
11.5
11.0
10.5
10.0
9.5
INSTRUCTIONAL MANAGEMENT
999796
26.0
25.5
25.0
24.5
24.0
23.5
23.0
22.5
22.0
STUDENT ACTIVITIES
999796
16.0
15.5
15.0
14.5
14.0
13.5
13.0
Return to table

166
Cohort Two Satisfaction Graphs
Significant differences No significant differences
TEACHERS
2000999796
25
24
23
22
21
20
19
18
FELLOW STUDENTS
2000999796
18.0
17.5
17.0
16.5
16.0
15.5
15.0
SCHOOLWORK
2000999796
19
18
17
16
15
14
13
12
STUDENT ACTIVITIES
2000999796
17.0
16.5
16.0
15.5
15.0
14.5
14.0
13.5
13.0
Return to table

167
Cohort Two Satisfaction Graphs (continued)
Significant differences No significant differences
STUDENT DISCIPLINE
2000999796
20.5
20.0
19.5
19.0
18.5
18.0
17.5
DECISION-MAKING OPPORTUNITIES
2000999796
15.5
15.0
14.5
14.0
13.5
13.0
12.5
12.0
BUILDING SUPPLIES AND UPKEEP
2000999796
20.5
20.0
19.5
19.0
18.5
18.0
17.5
COMMUNICATIONS
2000999796
17.5
17.0
16.5
16.0
15.5
15.0
14.5
14.0
13.5
Return to table

168
Cohort Two Climate Graphs
Significant differences No significant differences
TEACHER-STUDENT RELATIONS
2000999796
39.5
39.0
38.5
38.0
37.5
37.0
36.5
SECURITY AND MAINTENANCE
2000999796
27.5
27.0
26.5
26.0
25.5
25.0
24.5
24.0
23.5
ADMINISTRATION
2000999796
22
21
20
19
18
17
STUDENT ACADEMIC ORIENTATION
2000999796
13.5
13.0
12.5
12.0
11.5
11.0
STUDENT BEHAVIORAL VALUES
2000999796
8.0
7.5
7.0
6.5
6.0
Return to table

169
Cohort Two Climate Graphs (continued)
Significant differences No significant differences
GUIDANCE
2000999796
15.5
15.0
14.5
14.0
13.5
13.0
STUDENT-PEER RELATIONS
2000999796
13.6
13.4
13.2
13.0
12.8
12.6
12.4
PARENT COMMUNITY-SCHOOL RELATIONS
2000999796
12.6
12.4
12.2
12.0
11.8
11.6
11.4
11.2
INSTRUCTIONAL MANAGEMENT
2000999796
25.0
24.8
24.6
24.4
24.2
24.0
23.8
STUDENT ACTIVITIES
2000999796
16.0
15.5
15.0
14.5
14.0
13.5
13.0
12.5
Return to table

170
Cohort Three Satisfaction Graphs
Significant differences No significant differences
TEACHERS
20012000999796
28
26
24
22
20
18
FELLOW STUDENTS
20012000999796
19.0
18.5
18.0
17.5
17.0
16.5
16.0
SCHOOLWORK
20012000999796
20
19
18
17
16
15
14
13
STUDENT ACTIVITIES
20012000999796
16.5
16.0
15.5
15.0
14.5
14.0
13.5
Return to table

171
Cohort Three Satisfaction Graphs (continued)
Significant differences No significant differences
STUDENT DISCIPLINE
20012000999796
24
23
22
21
20
19
18
DECISION-MAKING OPPORTUNITIES
20012000999796
16
15
14
13
12
11
10
BUILDINGS SUPPLIES AND UPKEEP
20012000999796
21
20
19
18
17
16
COMMUNICATIONS
20012000999796
20
19
18
17
16
15
14
13
Return to table

172
Cohort Three Climate Graphs
Significant differences No significant differences
TEACHER-STUDENT RELATIONS
20012000999796
44
42
40
38
36
34
32
SECURITY AND MAINTENANCE
20012000999796
27.0
26.5
26.0
25.5
25.0
24.5
24.0
23.5
23.0
ADMINISTRATION
20012000999796
23
22
21
20
19
18
17
STUDENT ACADEMIC ORIENTATION
20012000999796
14.0
13.5
13.0
12.5
12.0
11.5
STUDENT BEHAVIORAL VALUES
20012000999796
9.0
8.5
8.0
7.5
7.0
6.5
6.0
5.5
Return to table

173
Cohort Three Climate Graphs (continued)
Significant differences No significant differences
GUIDANCE
20012000999796
15.5
15.0
14.5
14.0
13.5
13.0
STUDENT-PEER RELATIONS
20012000999796
15.0
14.5
14.0
13.5
13.0
12.5
12.0
PARENT COMMUNITY-SCHOOL RELATIONS
20012000999796
14.0
13.5
13.0
12.5
12.0
11.5
11.0
10.5
INSTRUCTIONAL MANAGEMENT
20012000999796
27
26
25
24
23
22
21
STUDENT ACTIVITIES
20012000999796
16.0
15.5
15.0
14.5
14.0
13.5
13.0
Return to table
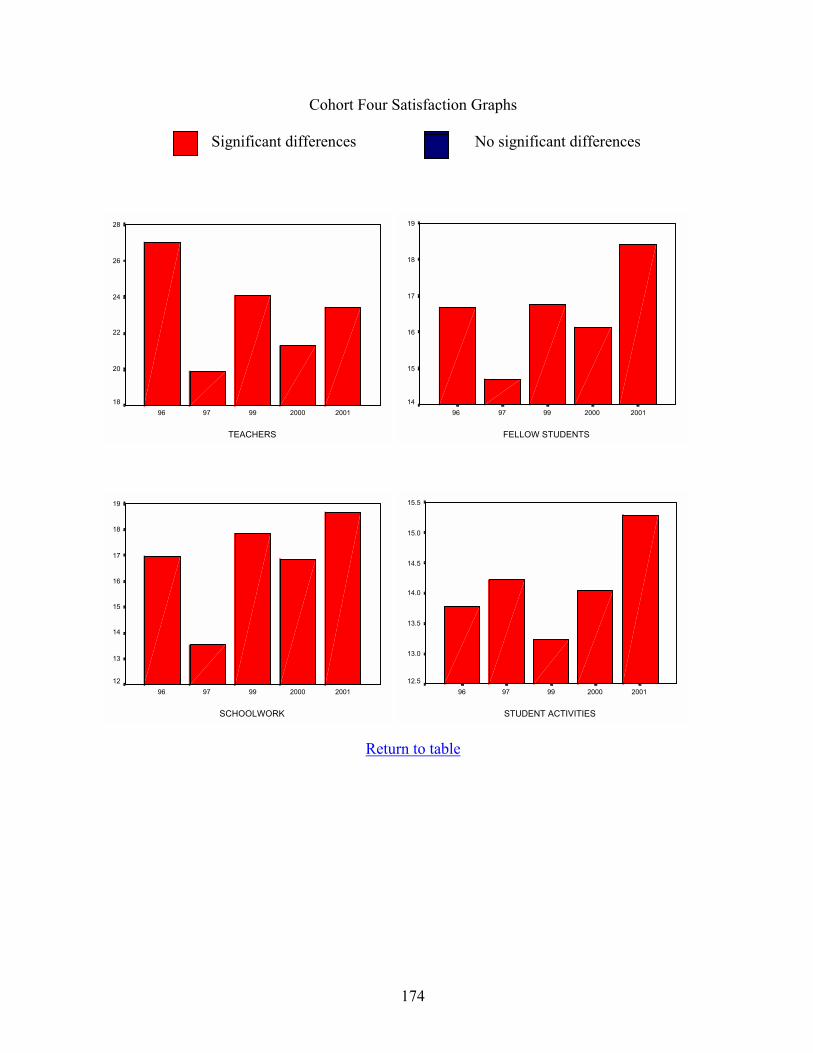
174
Cohort Four Satisfaction Graphs
Significant differences No significant differences
TEACHERS
20012000999796
28
26
24
22
20
18
FELLOW STUDENTS
20012000999796
19
18
17
16
15
14
SCHOOLWORK
20012000999796
19
18
17
16
15
14
13
12
STUDENT ACTIVITIES
20012000999796
15.5
15.0
14.5
14.0
13.5
13.0
12.5
Return to table

175
Cohort Four Satisfaction Graphs (continued)
Significant differences No significant differences
STUDENT DISCIPLINE
20012000999796
21
20
19
18
17
16
DECISION-MAKING OPPORTUNITIES
20012000999796
14
13
12
11
10
9
8
7
BUILDINGS SUPPLIES AND UPKEEP
20012000999796
20
19
18
17
16
15
COMMUNICATIONS
20012000999796
18
17
16
15
14
13
Return to table

176
Cohort Four Climate Graphs
Significant differences No significant differences
TEACHER-STUDENT RELATIONS
20012000999796
50
40
30
20
SECURITY AND MAINTENANCE
20012000999796
26
25
24
23
22
21
20
19
18
ADMINISTRATION
20012000999796
20
18
16
14
12
10
STUDENT ACADEMIC ORIENTATION
20012000999796
13.0
12.5
12.0
11.5
11.0
10.5
10.0
STUDENT BEHAVIORAL VALUES
20012000999796
8.5
8.0
7.5
7.0
6.5
6.0
5.5
5.0
Return to table

177
Cohort Four Climate Graphs (continued)
Significant differences No significant differences
GUIDANCE
20012000999796
16
15
14
13
12
11
10
STUDENT-PEER RELATIONS
20012000999796
13.5
13.0
12.5
12.0
11.5
11.0
10.5
10.0
PARENT COMMUNITY-SCHOOL RELATIONS
20012000999796
15
14
13
12
11
10
9
INSTRUCTIONAL MANAGEMENT
20012000999796
26
25
24
23
22
21
20
STUDENT ACTIVITIES
20012000999796
15.0
14.5
14.0
13.5
13.0
12.5
12.0
11.5
Return to table

178
APPENDIX G
BELIEFS AND OPINIONS GRAPHS

179
Parents Beliefs About Teaching and Learning Graphs
Significant differences No significant differences
CAN ACHIEVE GOALS
20012000999796
3.6
3.5
3.4
3.3
3.2
3.1
SSCHOOL SETS HIGH STANDARDS
20012000999796
3.36
3.34
3.32
3.30
3.28
3.26
3.24
3.22
3.20
LEARNING IS FUN
20012000999796
3.2
3.1
3.0
2.9
2.8
2.7
2.6
STUDENTS RESPECT GOOD GRADES
20012000999796
3.2
3.1
3.0
2.9
2.8
2.7
2.6
STUDENTS SEEK EXTRA WORK
20012000999796
2.8
2.7
2.6
2.5
2.4
EFFECTIVE LEARNING ATHMOSPHERE
20012000999796
3.2
3.1
3.0
2.9
2.8
2.7
Return to table
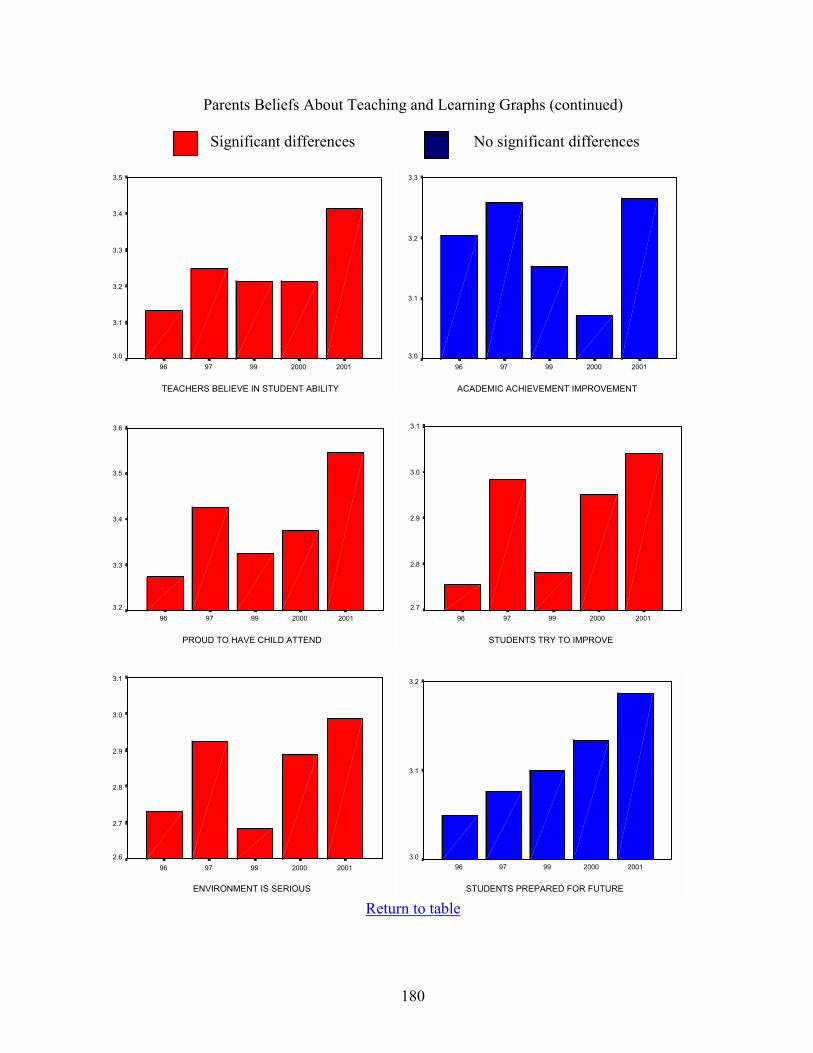
180
Parents Beliefs About Teaching and Learning Graphs (continued)
Significant differences No significant differences
TEACHERS BELIEVE IN STUDENT ABILITY
20012000999796
3.5
3.4
3.3
3.2
3.1
3.0
ACADEMIC ACHIEVEMENT IMPROVEMENT
20012000999796
3.3
3.2
3.1
3.0
PROUD TO HAVE CHILD ATTEND
20012000999796
3.6
3.5
3.4
3.3
3.2
STUDENTS TRY TO IMPROVE
20012000999796
3.1
3.0
2.9
2.8
2.7
ENVIRONMENT IS SERIOUS
20012000999796
3.1
3.0
2.9
2.8
2.7
2.6
STUDENTS PREPARED FOR FUTURE
20012000999796
3.2
3.1
3.0
Return to table

181
Parents Opinions About YRS Graphs
Significant differences No significant differences
EFFECTIVE TEACHING AND LEARNING
20012000999796
4.6
4.4
4.2
4.0
3.8
3.6
3.4
3.2
STUDENTS OVERCOME PROBLEMS
20012000999796
4.0
3.8
3.6
3.4
3.2
3.0
HELPS STUDENTS' TEST SCORES
20012000999796
4.0
3.8
3.6
3.4
3.2
3.0
SCHOOL SPORTS PROGRAM DIFFICULT
20012000999796
3.6
3.4
3.2
3.0
2.8
2.6
2.4
2.2
STUDENTS HOLDING JOBS DIFFICULT
20012000999796
3.8
3.6
3.4
3.2
3.0
2.8
2.6
2.4
ALLOWS FOR FAMILY VACATIONS
20012000999796
4.4
4.2
4.0
3.8
3.6
3.4
3.2
Return to table

182
Parents Opinions About YRS Graphs (continued)
Significant differences No significant differences
PRESENTS SINGLE PARENTS OBSTACLES
20012000999796
3.4
3.3
3.2
3.1
3.0
2.9
2.8
2.7
2.6
ALLOWS ENRICHMENT CLASSES
20012000999796
4.4
4.2
4.0
3.8
3.6
3.4
GREATER LEARNED MATERIAL RETENTION
20012000999796
4.4
4.2
4.0
3.8
3.6
3.4
CLASS REVIEW TIME REDUCED
20012000999796
4.2
4.0
3.8
3.6
3.4
OTHER ACTIVITY PARTICIPATION REDUCED
20012000999796
3.6
3.5
3.4
3.3
3.2
3.1
3.0
2.9
2.8
REDUCES STUDENT STRESS
20012000999796
3.8
3.6
3.4
3.2
3.0
2.8
Return to table

183
Parents Opinions About YRS Graphs (continued)
Significant differences No significant differences
STUDENTS LEARN MORE EFFECTIVELY
20012000999796
4.0
3.8
3.6
3.4
3.2
KEEPS STUDENTS ENGAGED
20012000999796
4.3
4.2
4.1
4.0
3.9
3.8
3.7
MOTIVATES STUDENT ATTENDANCE
20012000999796
4.2
4.0
3.8
3.6
3.4
3.2
3.0
2.8
Return to table

184
Teachers Beliefs About Teaching and Learning Graphs
Significant differences No significant differences
STUDENTS CAN ACHIEVE GOALS
20012000999796
3.7
3.6
3.5
3.4
3.3
3.2
SCHOOL SETS HIGH ACADEMIC STANDARDS
20012000999796
3.7
3.6
3.5
3.4
3.3
3.2
LEARNING IS FUN
20012000999796
3.2
3.1
3.0
2.9
STUDENTS RESPECT GOOD GRADES
20012000999796
3.2
3.1
3.0
2.9
2.8
SEEK EXTRA WORK FOR GRADES
20012000999796
2.7
2.6
2.5
2.4
2.3
2.2
EFFECTIVE LEARNING ATHMOSPHERE
20012000999796
3.5
3.4
3.3
3.2
3.1
3.0
Return to table

185
Teachers Beliefs About Teaching and Learning Graphs (continued)
Significant differences No significant differences
TEACHERS BELIEVE IN STUDENTS' ABILITIES
20012000999796
4.0
3.9
3.8
3.7
3.6
3.5
3.4
ACADEMIC ACHIEVEMENT RECOGNIZED
20012000999796
3.8
3.7
3.6
3.5
3.4
PROUD TO BE A TEACHER
20012000999796
3.9
3.8
3.7
3.6
3.5
3.4
3.3
STUDENTS TRY HARD TO IMPROVE
20012000999796
2.9
2.8
2.7
2.6
2.5
2.4
ENVIRONMENT IS ORDERLY AND SERIOUS
20012000999796
3.2
3.1
3.0
2.9
2.8
2.7
2.6
2.5
STUDENTS ARE PREPARED FOR THE FUTURE
20012000999796
3.6
3.5
3.4
3.3
3.2
3.1
Return to table

186
Teachers Opinions About YRS Graphs
Significant differences No significant differences
EFFECTIVE TEACHING AND LEARNING
20012000999796
4.8
4.6
4.4
4.2
4.0
3.8
3.6
3.4
STUDENTS OVERCOME PROBLEMS
20012000999796
4.4
4.2
4.0
3.8
3.6
3.4
3.2
HELPS IMPROVE TEST SCORES
20012000999796
3.9
3.8
3.7
3.6
3.5
3.4
3.3
3.2
SCHOOL SPORTS PROGRAM DIFFICULT
20012000999796
3.2
3.0
2.8
2.6
2.4
2.2
2.0
1.8
DIFFICULT FOR STUDENTS TO HOLD JOBS
20012000999796
3.4
3.2
3.0
2.8
2.6
2.4
2.2
2.0
ALLOWS FAMILY VACATIONS
20012000999796
4.6
4.5
4.4
4.3
4.2
4.1
4.0
3.9
3.8
Return to table

187
Teachers Opinions About YRS Graphs (continued)
Significant differences No significant differences
PRESENTS SINGLE PARENTS OBSTACLES
20012000999796
3.0
2.8
2.6
2.4
2.2
2.0
ALLOWS ENRICHMENT CLASSES
20012000999796
4.5
4.4
4.3
4.2
BETTER RETENTION
20012000999796
4.1
4.0
3.9
3.8
3.7
3.6
3.5
3.4
CLASS REVIEW TIME REDUCED
20012000999796
4.2
4.1
4.0
3.9
3.8
3.7
3.6
3.5
OTHER ACTIVITIY PARTICIPATION REDUCED
20012000999796
3.0
2.8
2.6
2.4
2.2
2.0
REDUCES STUDENT STRESS
20012000999796
3.7
3.6
3.5
3.4
3.3
3.2
3.1
3.0
Return to table
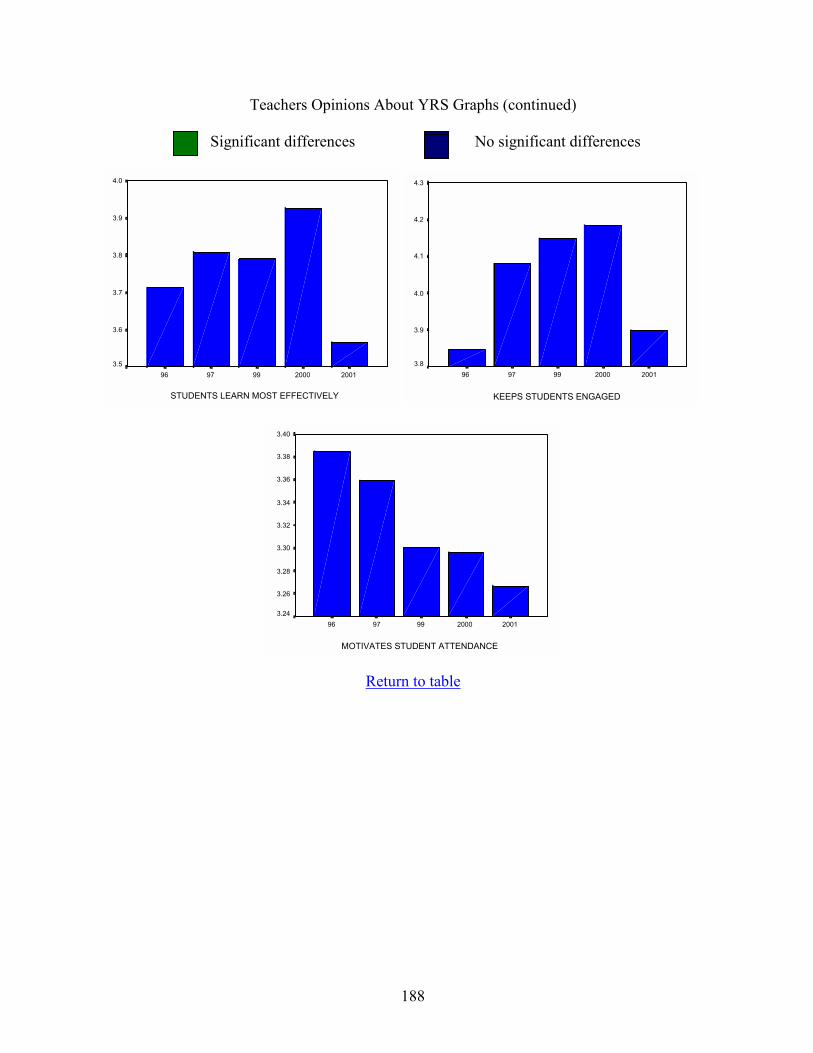
188
Teachers Opinions About YRS Graphs (continued)
Significant differences No significant differences
STUDENTS LEARN MOST EFFECTIVELY
20012000999796
4.0
3.9
3.8
3.7
3.6
3.5
KEEPS STUDENTS ENGAGED
20012000999796
4.3
4.2
4.1
4.0
3.9
3.8
MOTIVATES STUDENT ATTENDANCE
20012000999796
3.40
3.38
3.36
3.34
3.32
3.30
3.28
3.26
3.24
Return to table
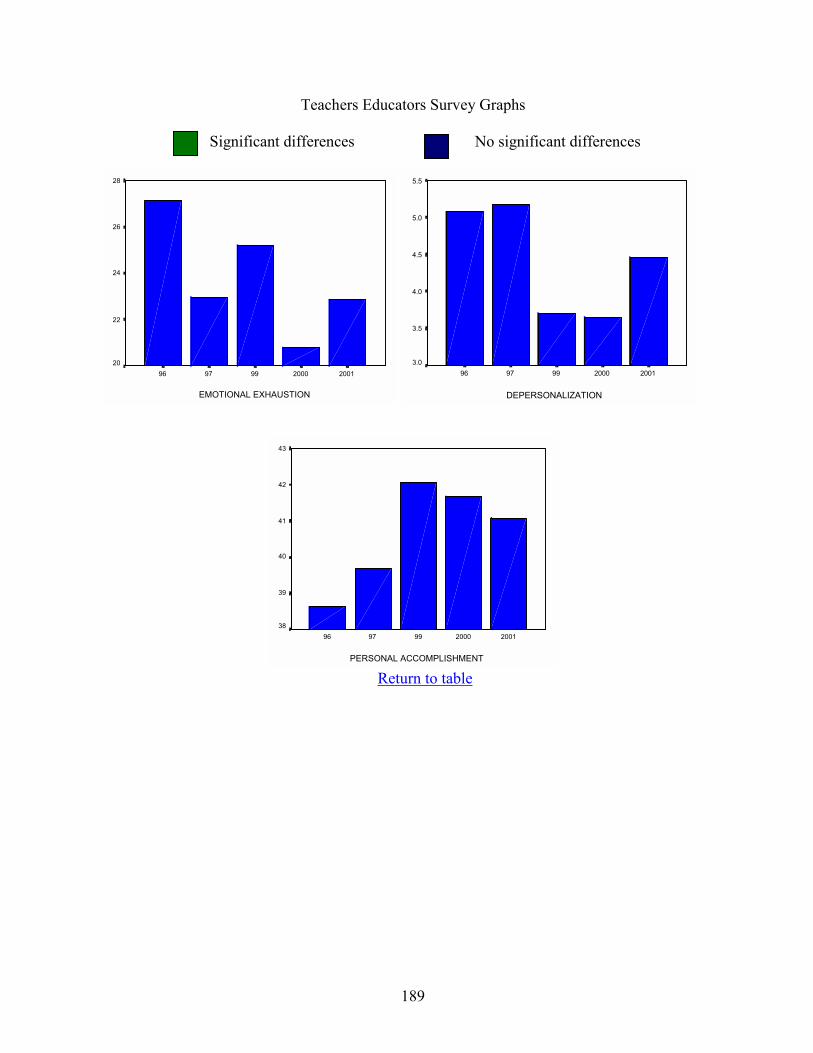
189
Teachers Educators Survey Graphs
Significant differences No significant differences
EMOTIONAL EXHAUSTION
20012000999796
28
26
24
22
20
DEPERSONALIZATION
20012000999796
5.5
5.0
4.5
4.0
3.5
3.0
PERSONAL ACCOMPLISHMENT
20012000999796
43
42
41
40
39
38
Return to table

190
Students Beliefs About Teaching and Learning Graphs
Significant differences No significant differences
CAN ACHIEVE GOALS
20012000999796
3.1
3.0
2.9
2.8
2.7
SCHOOL SETS HIGH ACADEMIC STANDARDS
20012000999796
3.3
3.2
3.1
3.0
LEARNING IS FUN
20012000999796
2.5
2.4
2.3
2.2
2.1
2.0
1.9
STUDENTS RESPECT GOOD GRADES
20012000999796
2.9
2.8
2.7
2.6
2.5
2.4
2.3
2.2
STUDENTS SEEK EXTRA WORK FOR GRADES
20012000999796
2.4
2.3
2.2
2.1
EFFECTIVE LEARNING ATHMOSPHERE
20012000999796
2.8
2.7
2.6
2.5
2.4
Return to table

191
Students Beliefs About Teaching and Learning Graphs (continued)
Significant differences No significant differences
TEACHERS BELIEVE IN STUDENTS' ABILITY
20012000999796
3.2
3.1
3.0
2.9
2.8
2.7
ACADEMIC ACHIEVEMENT RECOGNIZED
20012000999796
3.2
3.1
3.0
2.9
2.8
STUDENT PRIDE
20012000999796
2.9
2.8
2.7
2.6
2.5
2.4
STUDENTS TRY HARD TO IMPROVE
20012000999796
2.6
2.5
2.4
2.3
2.2
ENVIRONMENT IS ORDERLY AND SERIOUS
20012000999796
2.7
2.6
2.5
2.4
2.3
STUDENTS ARE PREPARED FOR THE FUTURE
20012000999796
3.0
2.9
2.8
2.7
Return to table

192
Students Opinions About YRS Graphs
Significant differences No significant differences
PROMOTES TEACHING AND LEARNING
20012000999796
3.8
3.6
3.4
3.2
3.0
2.8
STUDENTS OVERCOME LEARNING PROBLEMS
20012000999796
3.5
3.4
3.3
3.2
3.1
3.0
2.9
2.8
STUDENTS IMPROVE TEST SCORES
20012000999796
3.5
3.4
3.3
3.2
3.1
3.0
2.9
2.8
DIFFICULT TO HAVE SPORTS PROGRAMS
20012000999796
4.2
4.0
3.8
3.6
3.4
3.2
3.0
2.8
2.6
DIFFICULT FOR STUDENTS TO HOLD JOBS
20012000999796
4.4
4.2
4.0
3.8
3.6
3.4
3.2
3.0
2.8
ALLOWS VACATION OPPORTUNITIES
20012000999796
3.8
3.6
3.4
3.2
3.0
2.8
Return to table

193
Students Opinions About YRS Graphs (continued)
Significant differences No significant differences
OBSTACLES FOR SINGLE PARENTS
20012000999796
4.0
3.8
3.6
3.4
3.2
3.0
2.8
ALLOWS ENRICHMENT DURING INTERCESSIONS
20012000999796
3.9
3.8
3.7
3.6
3.5
3.4
3.3
GREATER RETENTION OF MATERIAL
20012000999796
3.7
3.6
3.5
3.4
3.3
3.2
3.1
REDUCES REVIEW TIME
20012000999796
3.4
3.3
3.2
3.1
REDUCES OTHER ACTIVITIES
20012000999796
4.0
3.8
3.6
3.4
3.2
3.0
2.8
REDUCES STUDENT STRESS
20012000999796
3.1
3.0
2.9
2.8
2.7
Return to table

194
Students Opinions About YRS Graphs (continued)
Significant differences No significant differences
BASED ON EFFECTIVE LEARNING
20012000999796
3.3
3.2
3.1
3.0
2.9
KEEPS STUDENTS ENGAGED IN LEARNING
20012000999796
3.7
3.6
3.5
3.4
3.3
MOTIVATES STUDENT ATTENDANCE
20012000999796
3.2
3.0
2.8
2.6
2.4
2.2
Return to table

195
APPENDIX H
STUDENT COMPARISON BY YEAR BY GRADE
BELIEFS AND OPINIONS

196
Student Comparisons by Grade by Year
Beliefs About Teaching and Learning
CAN ACHIEVE GOALS
12 th11 th10th9 th
3.2
3.1
3.0
2.9
2.8
2.7
2.6
2.5
2.4
YEAR
96
97
99
2000
2001
SCHOOL SETS HIGH ACADEMIC STANDARDS
12 th11 th10 th9 th
3.4
3.3
3.2
3.1
3.0
2.9
2.8
YEAR
96
97
99
2000
2001
LEARNING IS FUN
12 th11 th10 th9 th
2.6
2.4
2.2
2.0
1.8
1.6
YEAR
96
97
99
2000
2001
STUDENTS RESPECT GOOD GRADES
12 th11 th10 th9 th
3.0
2.8
2.6
2.4
2.2
2.0
1.8
YEAR
96
97
99
2000
2001
STUDENTS SEEK EXTRA WORK FOR GRADES
12 th11 th10 th9 th
2.6
2.4
2.2
2.0
1.8
1.6
YEAR
96
97
99
2000
2001
EFFECTIVE LEARNING ATHMOSPHERE
12 th11 th10 th9 th
3.0
2.9
2.8
2.7
2.6
2.5
2.4
2.3
YEAR
96
97
99
2000
2001
Return to table

197
Student Comparisons by Grade by Year Beliefs About Teaching and Learning (continued)
TEACHERS BELIEVE IN STUDENTS' ABILITY
12 th11 th10 th9 th
3.3
3.2
3.1
3.0
2.9
2.8
2.7
2.6
YEAR
96
97
99
2000
2001
ACADEMIC ACHIEVEMENT RECOGNIZED
12 th11 th10 th9 th
3.3
3.2
3.1
3.0
2.9
2.8
2.7
YEAR
96
97
99
2000
2001
STUDENT PRIDE
12 th11 th10 th9 th
3.2
3.0
2.8
2.6
2.4
2.2
YEAR
96
97
99
2000
2001
STUDENTS TRY HARD TO IMPROVE
12 th11 th10 th9 th
2.8
2.6
2.4
2.2
2.0
YEAR
96
97
99
2000
2001
ENVIRONMENT ORDERLY AND SERIOUS
12 th11 th10 th9 th
2.8
2.7
2.6
2.5
2.4
2.3
2.2
YEAR
96
97
99
2000
2001
STUDENTS PREPARED FOR THE FUTURE
12 th11 th10 th9 th
3.1
3.0
2.9
2.8
2.7
2.6
YEAR
96
97
99
2000
2001
Return to table

198
Student Comparisons by Grade by Year Opinion About YRS
PROMOTES TEACHING AND LEARNING
12 th11 th10 th9 th
4.0
3.8
3.6
3.4
3.2
3.0
2.8
2.6
YEAR
96
97
99
2000
2001
STUDENTS OVERCOME LEARNING PROBLEMS
12 th11 th10 th9 th
3.8
3.6
3.4
3.2
3.0
2.8
2.6
2.4
YEAR
96
97
99
2000
2001
STUDENTS IMPROVE TEST SCORES
12 th11 th10 th9 th
3.8
3.6
3.4
3.2
3.0
2.8
2.6
YEAR
96
97
99
2000
2001
DIFFICULT TO HAVE SPORTS PROGRAMS
12 th11 th10 th9 th
4.5
4.0
3.5
3.0
2.5
2.0
YEAR
96
97
99
2000
2001
DIFFICULT FOR STUDENTS TO HOLD JOBS
12 th11 th10 th9 th
4.5
4.0
3.5
3.0
2.5
2.0
YEAR
96
97
99
2000
2001
ALLOWS VACATION OPPORTUNITIES
12 th11 th10 th9 th
4.5
4.0
3.5
3.0
2.5
2.0
YEAR
96
97
99
2000
2001
Return to table
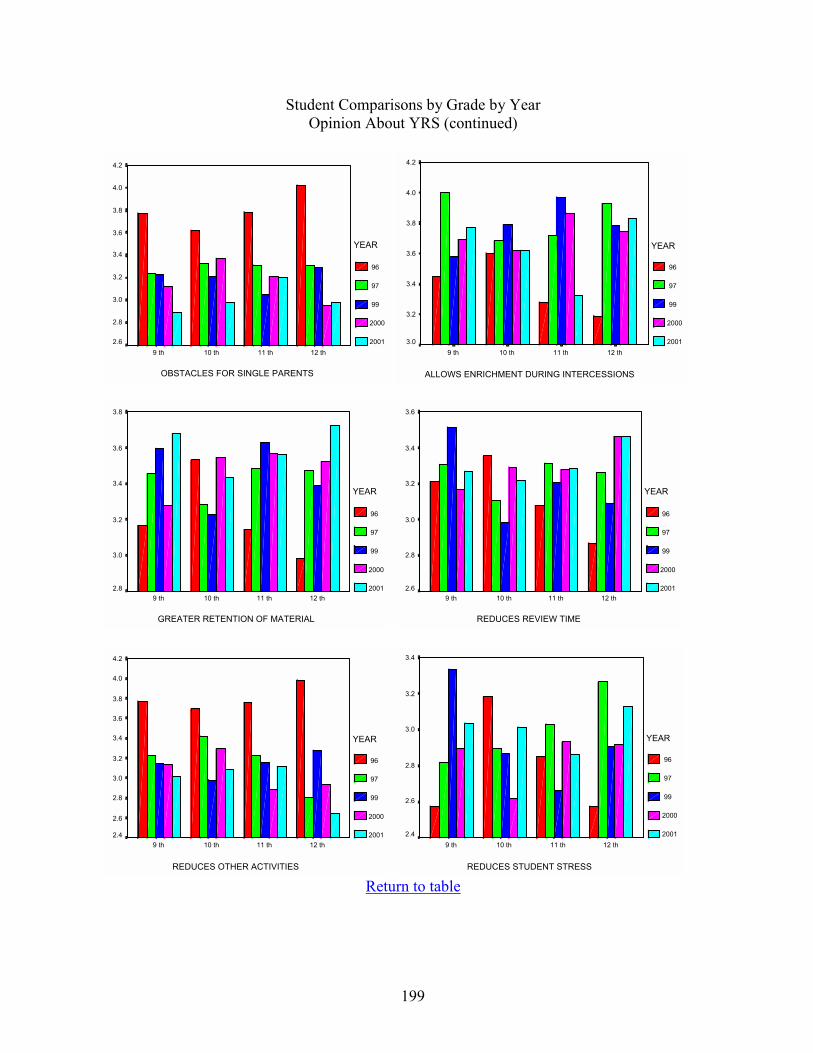
199
Student Comparisons by Grade by Year Opinion About YRS (continued)
OBSTACLES FOR SINGLE PARENTS
12 th11 th10 th9 th
4.2
4.0
3.8
3.6
3.4
3.2
3.0
2.8
2.6
YEAR
96
97
99
2000
2001
ALLOWS ENRICHMENT DURING INTERCESSIONS
12 th11 th10 th9 th
4.2
4.0
3.8
3.6
3.4
3.2
3.0
YEAR
96
97
99
2000
2001
GREATER RETENTION OF MATERIAL
12 th11 th10 th9 th
3.8
3.6
3.4
3.2
3.0
2.8
YEAR
96
97
99
2000
2001
REDUCES REVIEW TIME
12 th11 th10 th9 th
3.6
3.4
3.2
3.0
2.8
2.6
YEAR
96
97
99
2000
2001
REDUCES OTHER ACTIVITIES
12 th11 th10 th9 th
4.2
4.0
3.8
3.6
3.4
3.2
3.0
2.8
2.6
2.4
YEAR
96
97
99
2000
2001
REDUCES STUDENT STRESS
12 th11 th10 th9 th
3.4
3.2
3.0
2.8
2.6
2.4
YEAR
96
97
99
2000
2001
Return to table

200
Student Comparisons by Grade by Year Opinion About YRS (continued)
BASED ON EFFECTIVE LEARNING
12 th11 th10 th9 th
3.5
3.4
3.3
3.2
3.1
3.0
2.9
2.8
2.7
YEAR
96
97
99
2000
2001
KEEPS STUDENTS ENGAGED IN LEARNING
12 th11 th10 th9 th
4.0
3.8
3.6
3.4
3.2
3.0
YEAR
96
97
99
2000
2001
MOTIVATES STUDENT ATTENDANCE
12 th11 th10 th9 th
3.4
3.2
3.0
2.8
2.6
2.4
2.2
2.0
YEAR
96
97
99
2000
2001
Return to table
201
VITA
ROBIN LEE ADAMS
Personal Data: Date of Birth: October 14, 1946 Place of Birth: Kingsport, Tennessee Education: Auburn University, Auburn, Alabama; Mathematics, B. S., 1971 University of Tennessee, Knoxville, Tennessee; Human Resource Management, M. S., 1997
East Tennessee State University, Johnson City, Tennessee; Educational Leadership and Policy Analysis, Ed. D., 2001
Professional Career Naval Officer - 28 years service - Retired Commander Experience: Tech Prep Coordinator, Northeast State Technical Community College
Business & Industry Technical Training Coordinator, Northeast State Technical Community College
Doctoral Fellow, East Tennessee State University Professional Eastern Education Research Association Memberships: Retired Officers Association (Tennessee Chapter) First Tennessee Development District Assist Team Regional Safety Council Phi Kappa Phi Veterans of Foreign War Fleet Reserve Association Boy Scouts of America Honors Navy Achievement Medal, Vietnam service and Awards: Presidential Meritorious Service Medal, Desert Storm Operations