Staffordshire County Council and Stoke-on-Trent City ... · Staffordshire County Council and...
46
Staffordshire County Council and Stoke-on-Trent City Council Joint Municipal Waste Management Strategy Waste Management Options Appraisal November 2007 SLR Ref: 402-1395-00001
Transcript of Staffordshire County Council and Stoke-on-Trent City ... · Staffordshire County Council and...

Staffordshire County Council and Stoke-on-Trent City CouncilJoint Municipal Waste Management Strategy
Waste Management Options Appraisal
November 2007SLR Ref: 402-1395-00001

Staffordshire and Stoke-on-Trent i 402-1395-00001 Options Assessment Report November 2007
SLR Consulting Limited i
EXECUTIVE SUMMARY SLR Consulting Limited (SLR) has been commissioned by the Staffordshire County and Stoke-on-Trent City Council (Staffordshire and Stoke-on-Trent herein) to provide an options appraisal for the long term management of the County and City’s municipal solid waste (MSW). This report summarises the assessment of long term (for the year 2020) integrated waste options for MSW management in Staffordshire and Stoke-on-Trent. The aim of the option selection process is to enable an assessment of potential waste management solutions for the County and City when compared to a range of sustainability indicators. The assessment process is designed to be auditable, consistent and robust, and, assist in the identification of a preferred waste management option(s) for all municipal wastes arising in Staffordshire and Stoke-on-Trent for the long term. An assessment methodology following Government guidance has been applied, to provide an assessment of a range of viable waste management options for the year 2020, the assessment year. For ease of understanding the three tier options process is characterised pictorially in Figure ES1 below and reflects the way in which the preferred option is derived and describes the 3 tier sequential assessment process for assessing; minimisation and re-use (tier 1), recycling and composting (tier 2) and then residual waste treatment (tier 3).
Figure ES1 Schematic of options appraisal method
Tier 1
Tier 2
Tier 3
Waste Minimisation and Re-use
Recycling and Composting Targets
Residual Treatment
Option 3Exceed national target
Option 2Meet national target
Option 1Conservative target
Option 0Do nothing
Growth Scenarios
Tier 3bCapacity requirements
to meet and exceed LATS
Tier 3aAnalysis of treatment
facilities
Tier 1Tier 1
Tier 2Tier 2
Tier 3Tier 3
Waste Minimisation and Re-use
Recycling and Composting Targets
Residual Treatment
Option 3Exceed national target
Option 2Meet national target
Option 1Conservative target
Option 0Do nothing
Growth Scenarios
Tier 3bCapacity requirements
to meet and exceed LATS
Tier 3aAnalysis of treatment
facilities
Summary descriptions of the waste management options which have been developed within this report are given below. It should be noted however that these descriptions are limited in how accurately they can reflect the principal differences between each option1. The descriptors used at each tier within this report include:
1 See Glossary of Terms for a more detailed definition of the technical terms used. At this stage however EfW=Energy from Waste and MBT=Mechanical Biological Treatment.

Staffordshire and Stoke-on-Trent ii 402-1395-00001 Options Assessment Report November 2007
SLR Consulting Limited ii
Tier 1 assessment - minimisation and re-use (analysis of growth rates) Table ES1 shows the results of the Tier 1 assessment of differing growth rates and municipal waste arisings forecasted for Staffordshire and Stoke-on-Trent for the year 2020. Of the 4 possible growth scenarios modelled, the adopted MSW forecast used in tier 2 and 3 assessment stages is summarised in Tables ES1 and ES2 and reflect how growth patterns may change over time as a result of interactions between increased waste minimisation, household forecasts and per capita waste generation changes.
Table ES1 Adopted MSW growth scenarios for Stoke City and Staffordshire
Year Growth
2006 - 2010 1.4%
2011 - 2013 1%
2014 - 2020 0.5%
Table ES2
Predicted tonnages at key target years for Stoke City and Staffordshire
Year MSW
(tonnes)
2010 640,107
2013 659,246
2015 672,148
2020 693,070
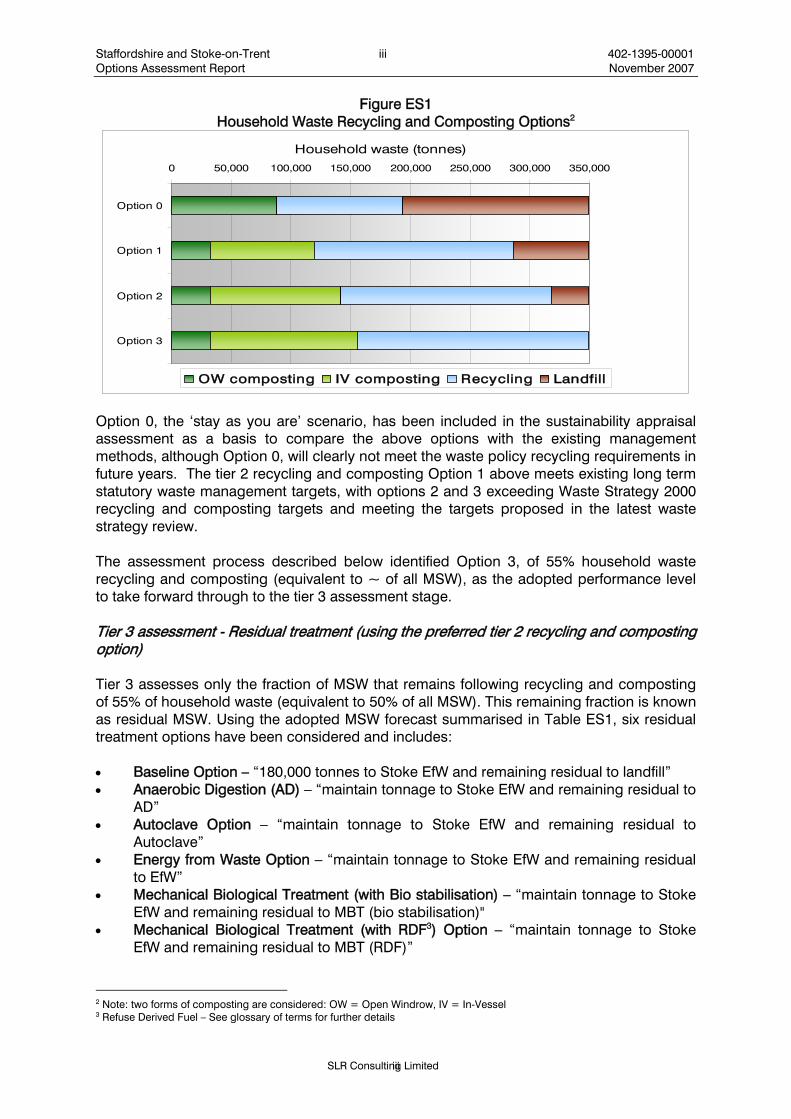
Tier 2 assessment - Recycling and composting Tier 2 assesses only the fraction of MSW that is recycled and composted. Using the adopted MSW forecast summarised in Table ES2, four recycling and composting options have been considered within the Tier 2 assessment stage using household waste performance targets. These four options include: • Option 0 – “Stay as you are target of 31% for household waste (equivalent to 28% of
MSW)” • Option 1 – “Conservative target of 45% for household waste (equivalent to 41% of
MSW)” • Option 2 – “Meet proposed National target of 50% for household waste (equivalent to
46% of MSW)” • Option 3 – “Exceed proposed National target 55% for household waste (equivalent to
50% of MSW)” Figure ES1 details the tier 2 recycling and composting options including the baseline ‘stay as you are’ option for comparison.
Staffordshire and Stoke-on-Trent iii 402-1395-00001 Options Assessment Report November 2007
SLR Consulting Limited iii
Figure ES1 Household Waste Recycling and Composting Options2
0 50,000 100,000 150,000 200,000 250,000 300,000 350,000
Option 0
Option 1
Option 2
Option 3
Household waste (tonnes)
OW composting IV composting Recycling Landfill
Option 0, the ‘stay as you are’ scenario, has been included in the sustainability appraisal assessment as a basis to compare the above options with the existing management methods, although Option 0, will clearly not meet the waste policy recycling requirements in future years. The tier 2 recycling and composting Option 1 above meets existing long term statutory waste management targets, with options 2 and 3 exceeding Waste Strategy 2000 recycling and composting targets and meeting the targets proposed in the latest waste strategy review. The assessment process described below identified Option 3, of 55% household waste recycling and composting (equivalent to ~ of all MSW), as the adopted performance level to take forward through to the tier 3 assessment stage. Tier 3 assessment - Residual treatment (using the preferred tier 2 recycling and composting option) Tier 3 assesses only the fraction of MSW that remains following recycling and composting of 55% of household waste (equivalent to 50% of all MSW). This remaining fraction is known as residual MSW. Using the adopted MSW forecast summarised in Table ES1, six residual treatment options have been considered and includes: • Baseline Option – “180,000 tonnes to Stoke EfW and remaining residual to landfill” • Anaerobic Digestion (AD) – “maintain tonnage to Stoke EfW and remaining residual to
AD” • Autoclave Option – “maintain tonnage to Stoke EfW and remaining residual to
Autoclave” • Energy from Waste Option – “maintain tonnage to Stoke EfW and remaining residual
to EfW” • Mechanical Biological Treatment (with Bio stabilisation) – “maintain tonnage to Stoke
EfW and remaining residual to MBT (bio stabilisation)" • Mechanical Biological Treatment (with RDF3) Option – “maintain tonnage to Stoke
EfW and remaining residual to MBT (RDF)”
2 Note: two forms of composting are considered: OW = Open Windrow, IV = In-Vessel 3 Refuse Derived Fuel – See glossary of terms for further details

Staffordshire and Stoke-on-Trent iv 402-1395-00001 Options Assessment Report November 2007
SLR Consulting Limited iv
Figure ES2 details the tier 3 residual treatment options including a baseline ‘stay as you are’ option for comparison.
Figure ES2 Residual Treatment Options
AD
Autoclave
EfW
MBT (Bio)
MBT (RDF)
Primary Landfill
- 100,000 200,000 300,000 400,000 500,000
Resi
dual
Tre
atm
ent P
roce
ss
Non recycled and composted MSW (tonnes)
Stoke IncineratorResidual TreatmentPrimary LandfillSecondary Landfill
The final stage of the options appraisal is to assess the relative implications on a cost basis of either meeting or exceeding LATS. The assessment process described below identified Option EfW and Option Autoclave jointly as the most preferred tier 3 residual treatment stage. Assessment process An appraisal methodology, involving a seven-stage process, has been applied where possible to each of the options in tier 2 and 3. The seven stages of this methodology are as follows: • Step 1 – Set overall goals for decision making for waste management, subsidiary
objectives and the criteria against which all options will be measured • Step 2 – Identify all viable options • Step 3 – Assess the performance of options identified within Step 2 against the criteria
identified within Step 1 • Step 4 – Value the performance scores for each option • Step 5 – Weighting. Balance the different objectives or criteria against one another. • Step 6 – Evaluate and rank the different options • Step 7 – Sensitivity analysis. Analyse how sensitive the results are to variations in the
assumptions made or the data used Each option has been assessed against 21 sustainability indicators to generate overall performance scores.

Staffordshire and Stoke-on-Trent v 402-1395-00001 Options Assessment Report November 2007
SLR Consulting Limited v
Assessment results Performance scores for each indicator have been derived through a combination of quantitative evaluation and professional judgement. Valued performance scores have then been derived by ‘normalising’ the overall performance scores on a scale of 0 to 1, where 0 represents worst and 1 represents best. Results of the valued performance scores are shown in Table ES3 for tier 2, recycling and composting and Table ES4 for residual treatment and recovery. Using this methodology, the higher the score the more sustainable the option is considered to be.
Table ES3 Total Valued Performance Scores and Ranked Position for Recycling and Composting
Tier 2 Options Opt ion
0Opt ion
1Opt ion
2Opt ion
3
5.00 13.00 14.02 17.41TOTAL VALUED PERFORMANCE SCORES
Opt ion 0
Opt ion 1
Opt ion 2
Opt ion 3
4 3 2 1RANKED PERFORMANCE SCORES The results of the sustainability assessment indicate that in tier two, recycling and composting, Option 3 is the highest scoring waste management option followed by Option 2. Option 0 is the lowest scoring option relative to all other options and this result was expected given it is the option with the lowest recycling rate therefore having greatest impact in the life cycle analysis calculations. To test the robustness of the methodology, each option has been taken through a sensitivity analysis which still shows Option 3 to achieve the highest score. Option 3 assumes an increased recycling and composting diversion that exceeds targets set out in the Review of England’s Waste Strategy – A Consultation Document, February 20064. Combined household recycling and composting performance is significantly improved from the present rate of 31% to 55% by the year 2020.
Table ES4
Total Valued Performance Scores and Ranked Position for Residual Treatment Tier 3 Options
Baseline EfW AD MBT (Bio) MBT (RDF) Autoclave
6.1 16.0 15.0 11.3 13.3 16.0
Baseline EfW AD MBT (Bio) MBT (RDF) Autoclave
6 1 3 5 4 1
TOTAL VALUED PERFORMANCE SCORES
RANKED PERFORMANCE SCORES Tier 3 of the options assessment process uses the highest ranking recycling and composting option and is assessed each of the chosen residual treatment options to provide an optimum recycling and recovery strategy for Staffordshire and Stoke-on-Trent. The results of the residual treatment and recovery assessment stage shows Option 3 with
4 This document has now been superseded by the Waste Strategy 2007 however there has been no change to the targets proposed in the consultation document.

Staffordshire and Stoke-on-Trent vi 402-1395-00001 Options Assessment Report November 2007
SLR Consulting Limited vi
EfW and Option 3 with Autoclave scoring equally high with both processes ranked as number 1. It should be noted that the assessment developed has not weighted the 21 criteria in order of importance. Indeed, it is probable that different criteria will be considered to have varying levels of importance. An example of how different weightings may impact on the final chosen outcome is discussed and presented within this report, although our conclusions are based upon un-weighted valued performance scores. Staffordshire and Stoke-on-Trent may wish to consider if such a weightings exercise should be undertaken. The overarching strategy framework for MSW It is clear from the options assessment undertaken that the higher recycling performance option will conform to the highest ranking option. The conclusion therefore at this stage, in the absence of any local weighting, is that high recycling should form an essential part of the overarching framework for the Staffordshire and Stoke-on-Trent Municipal Waste Management Strategy, with little or no untreated waste to landfill and the remainder of the waste sent to a recovery process. This framework can be summarised as follows: • Increased recycling: Combined household recycling and composting target of 55%
(equivalent to 50% of all MSW) • Recovering benefit from all remaining MSW: Sending approximately 50%5 of all MSW
for recovery • Zero waste to Landfill: Minimising all forms of waste to landfill through increased
recycling followed by maximum recovery of all remaining residual waste, thus placing landfill as the last and final option
Agreement on the above outline strategic framework will enable development of the final MSW strategy. Assessment of the short to medium term needs with respect to improvements in recycling and composting can then also be made. The development of the strategy provides essential support to future contract procurement for MSW management.
5 5% of the MSW total is rubble which is recycled at HWRCs, and therefore does not require further residual treatment. Government definitions exclude rubble from household waste recycling figures.
Staffordshire and Stoke-on-Trent vii 402-1395-00001 Options Assessment Report November 2007
SLR Consulting Limited vii
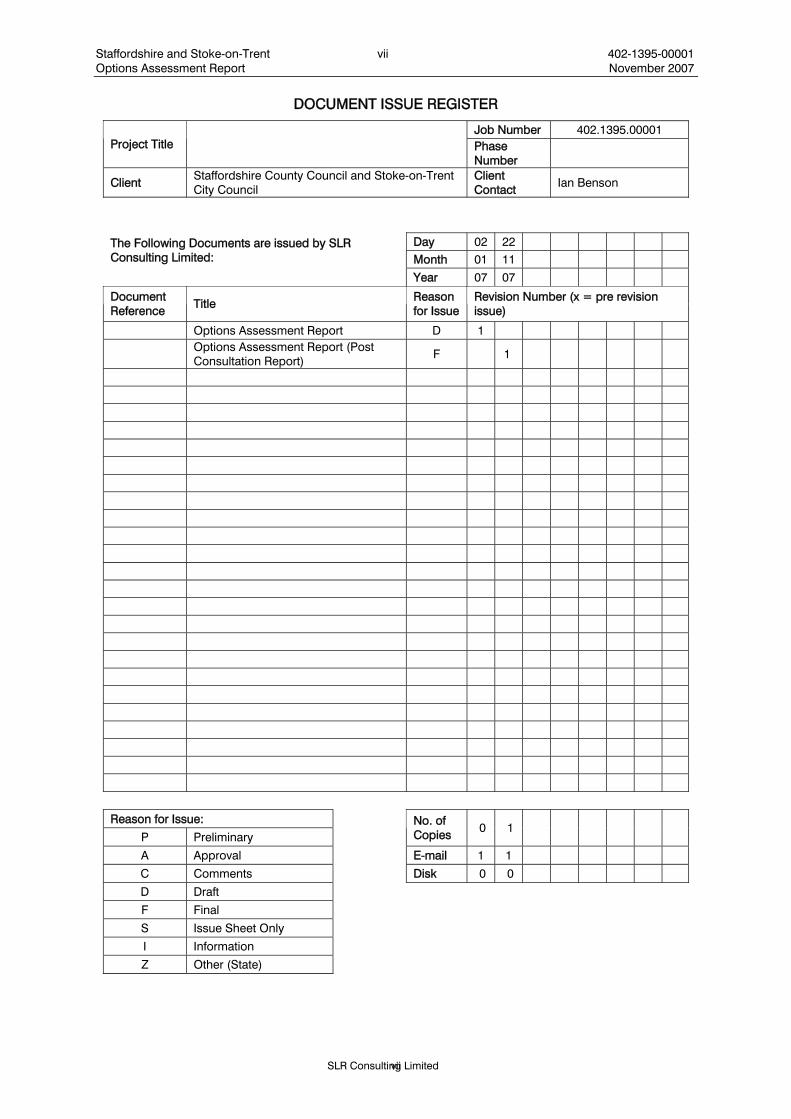
DOCUMENT ISSUE REGISTER
Job Number 402.1395.00001 Project Title Phase
Number
Client Staffordshire County Council and Stoke-on-Trent City Council
Client Contact Ian Benson
Day 02 22 The Following Documents are issued by SLR Consulting Limited: Month 01 11
Year 07 07
Document Reference
Title Reason for Issue
Revision Number (x = pre revision issue)
Options Assessment Report D 1
Options Assessment Report (Post Consultation Report) F 1
Reason for Issue: P Preliminary
No. of Copies
0 1
A Approval E-mail 1 1
C Comments Disk 0 0
D Draft F Final S Issue Sheet Only I Information Z Other (State)
Staffordshire and Stoke-on-Trent 1 402-1395-00001 Options Assessment Report November 2007
SLR Consulting Limited
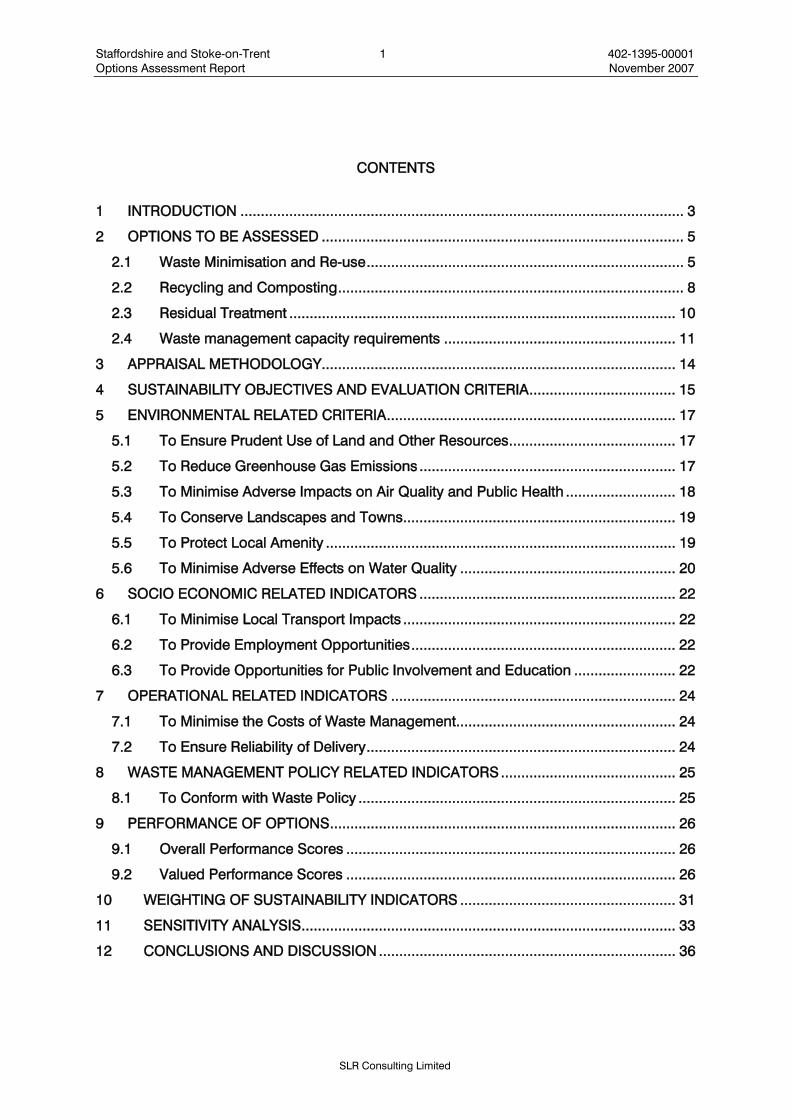
CONTENTS
1 INTRODUCTION ............................................................................................................. 3 2 OPTIONS TO BE ASSESSED ......................................................................................... 5
2.1 Waste Minimisation and Re-use.............................................................................. 5 2.2 Recycling and Composting..................................................................................... 8 2.3 Residual Treatment ............................................................................................... 10 2.4 Waste management capacity requirements ......................................................... 11
3 APPRAISAL METHODOLOGY....................................................................................... 14 4 SUSTAINABILITY OBJECTIVES AND EVALUATION CRITERIA.................................... 15 5 ENVIRONMENTAL RELATED CRITERIA....................................................................... 17
5.1 To Ensure Prudent Use of Land and Other Resources......................................... 17 5.2 To Reduce Greenhouse Gas Emissions ............................................................... 17 5.3 To Minimise Adverse Impacts on Air Quality and Public Health ........................... 18 5.4 To Conserve Landscapes and Towns................................................................... 19 5.5 To Protect Local Amenity ...................................................................................... 19 5.6 To Minimise Adverse Effects on Water Quality ..................................................... 20
6 SOCIO ECONOMIC RELATED INDICATORS ............................................................... 22 6.1 To Minimise Local Transport Impacts ................................................................... 22 6.2 To Provide Employment Opportunities................................................................. 22 6.3 To Provide Opportunities for Public Involvement and Education ......................... 22
7 OPERATIONAL RELATED INDICATORS ...................................................................... 24 7.1 To Minimise the Costs of Waste Management...................................................... 24 7.2 To Ensure Reliability of Delivery............................................................................ 24
8 WASTE MANAGEMENT POLICY RELATED INDICATORS........................................... 25 8.1 To Conform with Waste Policy .............................................................................. 25
9 PERFORMANCE OF OPTIONS..................................................................................... 26 9.1 Overall Performance Scores ................................................................................. 26 9.2 Valued Performance Scores ................................................................................. 26
10 WEIGHTING OF SUSTAINABILITY INDICATORS ..................................................... 31 11 SENSITIVITY ANALYSIS............................................................................................ 33 12 CONCLUSIONS AND DISCUSSION ......................................................................... 36

Staffordshire and Stoke-on-Trent 2 402-1395-00001 Options Assessment Report November 2007
SLR Consulting Limited
APPENDICIES Appendix A Life Cycle Analysis (LCA) Modelling Appendix B Options Assessment Guide Appendix C Options Assessment Tables

Staffordshire and Stoke-on-Trent 3 402-1395-00001 Options Assessment Report November 2007
SLR
1 INTRODUCTION
SLR Consulting Limited (SLR) has been commissioned by Staffordshire County Council and Stoke-on-Trent City Council (Staffordshire and Stoke-on-Trent herein) to provide a Waste Strategy for the long term management of the City and County’s municipal waste. As part of the strategy, an appraisal has been undertaken on a range of viable waste management options. This report summarises the sustainability assessment of the long term (for the year 2020) integrated waste management options for Staffordshire and Stoke-on-Trent. Planning Policy Statement 10: Planning for Sustainable Waste Management, herein referred to as PPS10, supports the overall Government Policy Objective of sustainable development. Through a step change in the way waste is handled and investment in new facilities, the Government aims to break the link between economic growth and waste growth; and develop sustainable waste management by driving waste up the ‘waste hierarchy’ of reduce, reuse, recycle and recover. DEFRA’s ‘Practice Guide for the Development of Municipal Waste Management Strategies’6 is consistent with the Key Planning Objectives of PPS10 and provides an opportunity to align the MWMS and SEA processes. A Strategic Environmental Assessment (SEA) is being developed in unison with the production of the Staffordshire and Stoke-on-Trent MWMS to assess the associated impacts of the plan. The DEFRA guide highlights the need to evaluate options for future waste management, the options assessment process has developed from the previous principles of BPEO7 to incorporate assessment of social, economic and policy factors in addition to environmental criteria which can be used to feed the SEA/SA (sustainability appraisal) process. The decision making principles outlined in PPS10 involve “robust analysis of available data and information, and an appraisal of options”. The DEFRA practice guide for development of MWMS states the “method by which Authorities assess options needs to be transparent and robust”. The detailed methodology is described below and follows Government guidance. The process incorporates social, economic, policy and environmental objectives and indicators and is a robust and transparent process. The following seven steps are generally accepted as fulfilling the requirements of an options appraisal process are as follows: • Step 1 – Set overall goals for decision making for waste management, subsidiary
objectives and the criteria against which all options will be measured • Step 2 – Identify all viable options • Step 3 – Assess the performance of these options against the criteria identified within
Step 1 • Step 4 – Value the performance scores for each option • Step 5 – Weighting. Balance the different objectives or criteria against one another. • Step 6 – Evaluate and rank the different options • Step 7 – Sensitivity analysis. Analyse how sensitive the results are to variations in the
assumptions made or the data used The aim of the option selection process is to enable an assessment of potential waste management solutions for the City and County when compared to a range of sustainability 6 November 2005 DEFRA. http://www.defra.gov.uk/environment/waste/localauth/practice-guidance/pdf/practice-guide.pdf#search=%22defra%20guide%20to%20municipal%20waste%20strategies%22 7 Best Practicable Environmental Option; the process underpinning the decision making process in Waste Strategy 2000.

Staffordshire and Stoke-on-Trent 4 402-1395-00001 Options Assessment Report November 2007
SLR
indicators. The assessment process is designed to be auditable, consistent and robust, and, assist in the identification of a preferred waste management option for all municipal wastes arising in Staffordshire and Stoke-on-Trent in the long term. For this reason the assessment process summarised in this Report assesses each option for the year 2020 as this is seen as an acceptable long term planning horizon and has been used during the regional plan development work. In subsequent reviews the planning horizon may require extending in order to reflect new policy and legislative drivers as well as to reflect increase certainty levels with respect to data and technology developments.
Staffordshire and Stoke-on-Trent 5 402-1395-00001 Options Assessment Report November 2007
SLR
2 OPTIONS TO BE ASSESSED
Revisions of municipal waste strategies have changed and evolved in a relatively short space of time as a result of greater understanding of the waste management industry and its associated impacts. In recent years the LCA process has been refined and developed to include the ever evolving and changing practices within the waste management industry. In line with these changes the development of municipal waste management strategies has also evolved and rather than a single LCA approach the new preferred method of assessment is to adopt a three tier system comprised of waste minimisation and re-use, recycling and composting, and residual treatment.
2.1 Waste Minimisation and Re-use
Previous waste strategies contained little mention of waste minimisation and re-use despite its inclusion at the very top of the waste hierarchy, however in recent years there has been an increasing emphasis on ‘breaking the link between economic growth and the amount of waste produced’8. Waste minimisation and re-use has the potential to; • reduce costs associated with waste collection and management; • reduce the size and/or number of waste management facilities needed in the future; • avoid environmental impacts of materials extraction and use; • improve the authorities’ balance of landfill allowances under the Landfill Allowance
Trading Scheme (LATS); and • could assist in generating significant social and economic benefits Much of the success of waste minimisation and re-use initiatives can be achieved through increased awareness of community recycling schemes and sustainable purchasing policies.
2.1.1 Growth rate scenarios
The success of waste minimisation and re-use strategies will have a direct impact on the total amount of waste arisings and these initiatives will need to be considered when calculating forecasted growth rates. The forecasted waste arisings for Staffordshire and Stoke-on-Trent are based upon projected household growth and the projected growth in waste per household. Tier 1, waste minimisation (see Figure 2-1) compares a range of MSW forecasts based upon the following: • projected housing growth, • the UK trend in increasing MSW per household – with a simple 1.5% growth scenario, • previous household growth based scenario employing Regional Spatial Strategy
(RSS) data.
8 Defra (2005) Guidance on Municipal Waste Management Strategies

Staffordshire and Stoke-on-Trent 6 402-1395-00001 Options Assessment Report November 2007
SLR
Figure 2-1 Forward waste projections based on waste produced per household
550,000
600,000
650,000
700,000
750,000
800,000
2000
2001
2002
2003
2004
2005
2006
2007
2008
2009
2010
2011
2012
2013
2014
2015
2016
2017
2018
2019
2020
2021
Was
te (t
)
1.5% continual growth Previous household-basedNew household-based Historical dataDistricts & Stoke 2006/7 estimate
Historical data Staffs + Stoke
1.5% annual growth
Growth scenario base
on previous household
New growth scenario based on update household
predictions
Discussion of how the adopted growth scenario used throughout this report incorporates forecasted interactions between increasing waste minimisation, household forecasts and per capita waste generation changes is given below. Household Growth Forecasts: Table 2-1 shows the total projected new households in Staffordshire and Stoke-on-Trent as provided in Option 2 of the Regional Planning Guidance 2006 (working draft) and the average annual increase in dwellings over the 25 year projection period.
Table 2-1 Projected household growth for Staffordshire and Stoke-on-Trent to 2026
New dwellings, 2001
to 2006 Years for increase
Average annual dwellings built
Staffordshire 67,900 2,716 Stoke-on-Trent 21,000
25 840
Source: latest (21/11/2006) working draft of the regional planning guidance, provided by Bruce Braithwaite
Average annual dwellings built are calculated to 2020 (allowing for annual demolitions as set out in Regional Spatial Strategy9 and a vacancy rate of 3%10). 9 Annual demolitions for Stoke = 500 dwellings per year and for Staffordshire = 50 dwellings per year until 2011 and 110 dwellings per year until 2026 10 As discussed with Bruce Braithwaite

Staffordshire and Stoke-on-Trent 7 402-1395-00001 Options Assessment Report November 2007
SLR
Per Capita Consumption: Table 2-2 shows assumed annual growth in MSW per household up to 2020.
Table 2-2 Assumed annual growth in MSW per household up to 2020
Until 2010
2011 to 2015
2016 onwards
Growth in MSW per household (kg/hh/yr) 10 5 0
The preferred growth rate scenario assumes that the annual growth in MSW per household will start to decline after 2010 and from 2016 it is anticipated that there will no longer be an increase in waste arisings per household per year. Adopted MSW profile: It is assumed that minimisation and re-use initiatives, as part of the waste strategy will encourage the reduction of waste being created and any increase in total household waste will be attributable to the increase in houses built. Using the above analysis a forecast of MSW has been adopted for use throughout this report and is considered both realistic and achievable. This forecast is summarised in Table 2.3 below:
Table 2-3
Adopted MSW growth scenarios for Stoke City and Staffordshire Year Growth
2006 – 2010 1.4%
2011 – 2013 1%
2014 – 2020 0.5%
2.1.2 Minimisation and re-use initiatives
The introduction of waste minimisation and re-use initiatives can be co-ordinated at the County level so as to take advantage of an integrated public awareness campaign which would demonstrate clear and unified messages across the Districts and deliver potential cost savings associated with solitary communication campaigns and marketing materials. A number of waste minimisation and re-use initiatives have been successfully implemented and typical examples11 are shown below in Table 2-4.
11 As suggested in Defra ‘Practice Guide for the Development of Municipal Waste Management Strategies’ (2005) Information Sheet 10

Staffordshire and Stoke-on-Trent 8 402-1395-00001 Options Assessment Report November 2007
SLR
Table 2-4 Waste Minimisation and Re-use Initiatives
Initiative Type Examples
Purchasing
Promote durable/reusable items (vs disposable) Reusable shopping bags Encourage ‘smart shopping’ – buying goods with less packaging Join Mailing Preference Service to reduce junk mail
Diverting material from waste stream
Home Composting Re-usable nappies
Education and awareness Market campaigns at schools and through community centres
Waste reduction in the work place
Promote energy efficient practices Sustainable purchasing
Financial incentives Pay as you throw schemes to reduce residual waste
Targets and monitoring
Set per household or per capita arisings and residual targets Monitor progress of targets and effectiveness of initiatives
Re-use
Furniture WEEE Paint Scrap metal Wood Community Recycling Networks
Although waste minimisation and re-use initiatives have been utilised for a number of years it is only recently that they have been specifically introduced as part of a strategy tool. Subsequently, there is little in the way of data collected to be able to quantify or accurately attribute an actual reduction in waste with minimisation and re-use strategies. For this reason the growth rate scenario for Tier 1 uses an estimated tonnage reduction in waste produced per household per year and assumes the above initiatives will help to achieve these targets.
2.2 Recycling and Composting
Tier 2 of the options appraisal focuses on improving the capture of materials for recycling and composting. Recycling and composting is placed below minimisation and reuse in the waste hierarchy. The aim of improving recycling and composting rates historically was to divert potential resources from landfill which have a market value, thus recovering revenue from a potential waste, reducing the need for virgin resources, and in many cases reducing the energy requirements to process materials (the latter two representing an environmentally beneficial practice). The introduction of the EU Landfill Directive provides the second driver for improving recycling and composting rates, as the UK must reduce its landfill of biodegradable wastes to landfill, or face fines from the European Union. The Landfill Directive has arguably become primary driver for Local Authorities to obtain high recycling (of biodegradable materials) and composting rates, due to the concerns of facing heavy fines for failing to meet the diversion targets.
Staffordshire and Stoke-on-Trent 9 402-1395-00001 Options Assessment Report November 2007
SLR
2.2.1 Targets for recycling and composting options
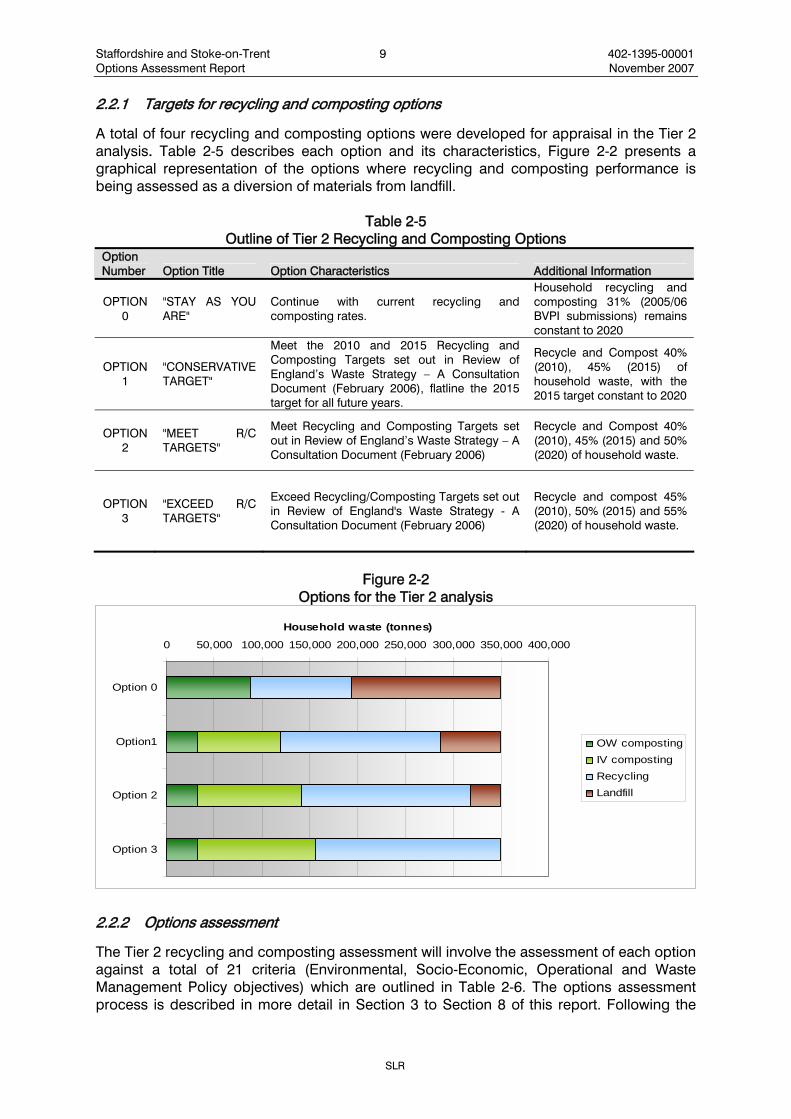
A total of four recycling and composting options were developed for appraisal in the Tier 2 analysis. Table 2-5 describes each option and its characteristics, Figure 2-2 presents a graphical representation of the options where recycling and composting performance is being assessed as a diversion of materials from landfill.
Table 2-5 Outline of Tier 2 Recycling and Composting Options
Option Number Option Title Option Characteristics Additional Information
OPTION 0
"STAY AS YOU ARE"
Continue with current recycling and composting rates.
Household recycling and composting 31% (2005/06 BVPI submissions) remains constant to 2020
OPTION 1
"CONSERVATIVE TARGET"
Meet the 2010 and 2015 Recycling and Composting Targets set out in Review of England’s Waste Strategy – A Consultation Document (February 2006), flatline the 2015 target for all future years.
Recycle and Compost 40% (2010), 45% (2015) of household waste, with the 2015 target constant to 2020
OPTION 2
"MEET R/C TARGETS"
Meet Recycling and Composting Targets set out in Review of England’s Waste Strategy – A Consultation Document (February 2006)
Recycle and Compost 40% (2010), 45% (2015) and 50% (2020) of household waste.
OPTION 3
"EXCEED R/C TARGETS"
Exceed Recycling/Composting Targets set out in Review of England's Waste Strategy - A Consultation Document (February 2006)
Recycle and compost 45% (2010), 50% (2015) and 55% (2020) of household waste.
Figure 2-2
Options for the Tier 2 analysis
0 50,000 100,000 150,000 200,000 250,000 300,000 350,000 400,000
Option 0
Option1
Option 2
Option 3
Household waste (tonnes)
OW compostingIV compostingRecyclingLandfill
2.2.2 Options assessment
The Tier 2 recycling and composting assessment will involve the assessment of each option against a total of 21 criteria (Environmental, Socio-Economic, Operational and Waste Management Policy objectives) which are outlined in Table 2-6. The options assessment process is described in more detail in Section 3 to Section 8 of this report. Following the

Staffordshire and Stoke-on-Trent 10 402-1395-00001 Options Assessment Report November 2007
SLR
Tier 2 assessment process and the identification of the highest scoring recycling and composting option, this level of recycling and composting will inform the next Tier of the assessment process.
Table 2-6 Assessment Objectives and Indicators/Criteria
OBJECTIVES INDICATORS/CRITERIAEnvironmental Objectives Environmental Indicators/Criteria
a) Depletion of resources, such as wood, water, fuels and ores b) Landtake
2. To reduce greenhouse gas emissions c) Greenhouse gases emitted d) Emissions which are injurious to public healthe) Emisions contributing to air acidificationf) Emissions contributing to depletion of the ozone layer g) Extent of odour problemsh) Extend of dust problems
4. To conserve landscapes and townscapes i) Extent of visual and landsacpe impactsj) Extent of noise problems k) Extent of litter and vermin problems l) Emissions contributing to eutrophication m) Extent of water pollution
Socio-economic Objectives Socio-economic Indicators/Criterian) Total waste kilometres (by mode)o) Transport along roads other than motorways
8. To provide employment opportunities p) Number of jobs likely to be created
Operational Objectives Operational Indicators/Criteria
Waste Management Policy Objectives Waste Management Policy Indicators/Criteriat) Percentage landfill u) Percentage recycled/composted
12. To conform to waste policy
9. To provide opportunities for public involvement and education
s) Likelihood of implementation wihtin required timescale, taking account of maturity of technology, necessary level of public participation, and the need for planning permission (taking account of scale of development and likely perceived adverse impacts)
r) Costs of collection, management and disposal, including material and energy revenues
1. To ensure prudent use of land and other resources
3. To minimise adverse impacts on air quality and public health
q) Extent of opportunitites for public involvement and education (concerning sustainable waste management practices)
11. To ensure reliability of delivery
5. To protect local amenity
6. To minimise adverse effects on water quality
7. To minimise local transport impacts (congestion, severence, fear and intimidation, physical damage)
10. To minimise the increased costs of waste management
2.3 Residual Treatment
Following the recycling and composting of waste, there is an element of the residual waste stream remaining. The waste hierarchy states that the treatment and recovery of waste to recover value, heat and/or power is more beneficial than the disposal (the lowest level of the waste hierarchy) of residual waste. Tier 3 of the options appraisal focuses on identifying the technology process with the highest score, or lowest environmental, socio-economic, operational and policy impacts.
2.3.1 Residual treatment options
The range of technology processes assessed includes landfill (as the baseline situation) plus all other technology process that are deemed to be operational and achievable in the UK market. Currently, a significant proportion (circa 180,000 tonnes) of residual waste is treated at the Stoke-on-Trent incinerator. This incinerator, will be part of all future waste management options, and therefore has been included as a constant in the Tier 3 assessment. The non recycled and composted proportion of the waste stream, minus that residual waste sent Stoke is assessed with the technologies identified below: • Energy from Waste; • Mechanical Biological Treatment (MBT) (RDF); • Mechanical Biological Treatment (Biostabilisation);

Staffordshire and Stoke-on-Trent 11 402-1395-00001 Options Assessment Report November 2007
SLR
• Anaerobic Digestion; and • Autoclave A graphical representation (based on a 55% recycling and composting rate) is presented in Figure 2-3.
Figure 2-3 Tier 3 Scenarios for Assessment
AD
Autoclave
EfW
MBT (Bio)
MBT (RDF)
Primary Landfill
- 100,000 200,000 300,000 400,000 500,000
Resi
dual
Tre
atm
ent P
roce
ss
Non recycled and composted MSW (tonnes)
Stoke IncineratorResidual TreatmentPrimary LandfillSecondary Landfill
2.3.2 Options assessment
The Tier 3 residual treatment technology process appraisal involves the assessment of each technology against 21 criteria (Environmental, Socio-Economic, Operational and Waste Management Policy objectives) which are outlined in Table 2-6, above. The options assessment process is described in more detail in Section 3 to Section 8 of this report.
2.4 Waste management capacity requirements
An assessment of total capacity requirements for Staffordshire and Stoke-on-Trent for composting and recycling (tier 2) and residual treatment (tier 3) has been made and is summarised in Table 2-7 and Table 2-8.

Staffordshire and Stoke-on-Trent 12 402-1395-00001 Options Assessment Report November 2007
SLR Consulting Limited
Table 2-7
Tier 2 - Recycling and Composting Options Capacity Requirements
88,301 105,425 0 155,575 349,301
32,485 166,479 87,095 63,242 349,301
32,485 175,839 109,187 31,790 349,301
32,485 193,699 123,116 0 349,301
0
1
2
3
PRIMARY WASTE HANDLING
OW Compost
Plant
RESIDUAL TREATMENT
DESCRIPTION
Option Waste Stream
PRIMARY SOURCE SEGREGATION
Total plant for
ini tial treatment
(tpa)
Direct to Landfi l l
31% recycling and composting rate achieved by 2020
45% recycling and composting rate achieved by 2020
50% recycling and composting rate achieved by 2020
55% recycling and composting rate achieved by 2020
MRF Plant
IV Plant
Note: Assessment year is taken as 2020
Tonnage data includes Stoke City and Staffordshire

Staffordshire and Stoke-on-Trent 13 402-1395-00001 Options Assessment Report November 2007
SLR Consulting Limited
Table 2-8 Tier 3 - Residual Treatment Scenario Capacity Requirements
DESCRIPTION
178,935 132,593 311,528 53,681 365,208
311,528 311,528 93,458 404,986
132,593 178,935 311,528 22,597 53,681 44,566 432,371
132,593 178,935 311,528 53,681 34,932 55,302 455,442
132,593 178,935 311,528 53,681 15,258 21,598 31,111 433,175
132,593 178,935 311,528 53,681 20,153 43,104 428,465
SECONDARY WASTE HANDLINGPRIMARY WASTE HANDLINGCapacity for total waste
handled (tpa)
Landfill for ash
from EfW
Landfill for MBT
ash
Landfill for MBT
stabilised material
Landfill capacity for MBT rejects
RESIDUAL TREATMENT
MBT plant Total
Waste Stream
Total plant for initial treatment
(tpa)
Landfill for AD
ResidueDirect to Landfill
Baseline
EfW
AD
Energy from
waste plant
MBT (Bio)
AD Plant
MBT (RDF)
Autoclave
Note: Assessment year is taken as 2020 Tonnage data includes Stoke City and Staffordshire

Staffordshire and Stoke-on-Trent 14 402-1395-00001 Options Assessment Report November 2007
SLR Consulting Limited
3 APPRAISAL METHODOLOGY
To ensure a consistent approach in assessing each future long term option for Staffordshire and Stoke-on-Trent, an appraisal methodology has been used which is consistent with Government guidance. The five principal stages of this methodology can be summarised as follows: • Establishing sustainability objectives and indicators • Identifying overall performance scores for each sustainability indicator • Establishing a valued performance score for each sustainability indicator • Applying a weighting to each sustainability indicator to generate a final score • Undertaking a sensitivity analysis of the results The performance of Options within each tier using the above methodology is assessed in this report with the aim of identifying a preferred waste management option for Staffordshire and Stoke-on-Trent. Performance scores for each option have been developed from two main sources; • Life Cycle Assessment (LCA), using the Environment Agency WISARD software to
generate potential environmental impacts. A description of LCA methodology and the WISARD software is provided in Appendix A of this report.
• Professional judgement based on experience within the UK, rest of Europe and elsewhere. A description of the methodology is presented in Appendix B.

Staffordshire and Stoke-on-Trent 15 402-1395-00001 Options Assessment Report November 2007
SLR Consulting Limited
4 SUSTAINABILITY OBJECTIVES AND EVALUATION CRITERIA
Government guidance12 has been used to identify the sustainability objectives and criteria against which all options are to be measured. A summary of which is given in Table 4-1. The sustainability objectives and indicators established are divided into four categories; environmental criteria, socio-economic criteria, operational criteria and waste management policy criteria. A brief review of each sustainability objective follows. At this stage each sustainability indicator should be regarded as having equal importance. The application of weighting, by way of an example, to each indicator is discussed in Section 10 of this report.
12 http://www.communities.gov.uk/index.asp?id=1145890 [Site accessible December 2006]

Staffordshire and Stoke-on-Trent 16 402-1395-00001 Options Assessment Report November 2007
SLR Consulting Limited
Table 4-1 Sustainability Assessment Objectives and Evaluation Criteria
OBJECTIVES INDICATORS/CRITERIA METHOD OF MEASUREMENTEnvironmental Object ives Environmental Indicators/Criteria Method of Measurement
a) Depletion of resources, such as wood, water, fuels and ores WISARD output resultb) Landtake Professional judgement based on performance of existing facilities
2. To reduce greenhouse gas emissions c) Greenhouse gases emitted WISARD output resultd) Emissions which are injurious to public health WISARD output resulte) Emisions contributing to air acidification WISARD output resultf) Emissions contributing to depletion of the ozone layer WISARD output resultg) Extent of odour problems Professional judgement based on performance of existing facilitiesh) Extend of dust problems Professional judgement based on performance of existing facilities
4. To conserve landscapes and townscapes i) Extent of visual and landsacpe impacts Professional judgement based on performance of existing facilitiesj) Extent of noise problems Professional judgement based on performance of existing facilitiesk) Extent of litter and vermin problems Professional judgement based on performance of existing facilitiesl) Emissions contributing to eutrophication WISARD output resultm) Extent of water pollution Professional judgement based on performance of existing facilities
Socio-economic Object ives Socio-economic Indicators/Criteria Method of Measurementn) Total waste kilometres (by mode) WISARD input datao) Transport along roads other than motorways WISARD input data
8. To provide employment opportunities p) Number of jobs likely to be created Professional judgement based on performance of existing facilities
Operat ional Object ives Operat ional Indicators/Criteria Method of Measurement
Waste Management Policy Object ives Waste Management Policy Indicators/Criteria Method of Measurementt) Percentage landfill WISARD input datau) Percentage recycled/composted WISARD input data
Professional judgement based on performance of existing facilities
11. To ensure reliability of delivery
5. To protect local amenity
6. To minimise adverse effects on water quality
7. To minimise local transport impacts (congestion, severence, fear and intimidation,
10. To minimise the increased costs of waste management
Professional judgement based on performance of existing facilities
Professional judgement based on performance of existing facilities
12. To conform to waste policy
9. To provide opportunities for public involvement and education
s) Likelihood of implementation wihtin required timescale, taking account of maturity of technology, necessary level of public participation, and the need for planning permission (taking account of scale of development and likely perceived adverse impacts)
r) Costs of collection, management and disposal, including material and energy revenues
1. To ensure prudent use of land and other resources
3. To minimise adverse impacts on air quality and public health
q) Extent of opportunitites for public involvement and education (concerning sustainable waste management practices)
Staffordshire and Stoke-on-Trent 17 402-1395-00001 Options Assessment Report November 2007
SLR Consulting Limited
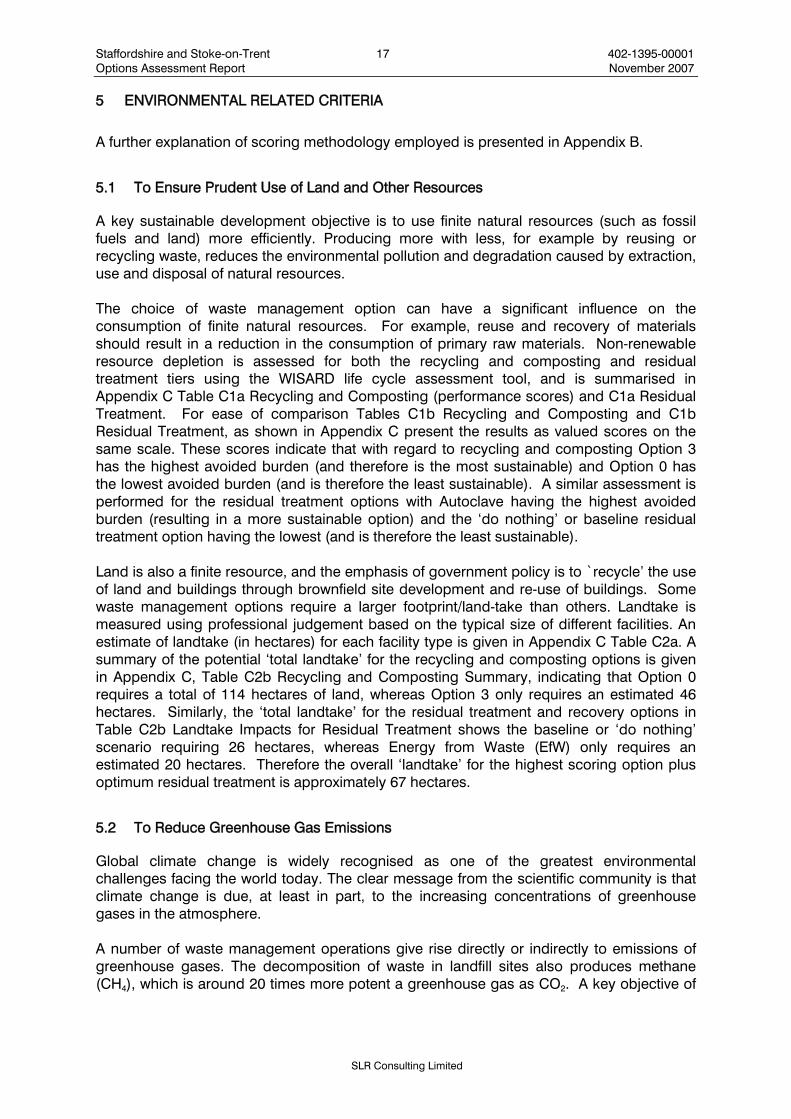
5 ENVIRONMENTAL RELATED CRITERIA
A further explanation of scoring methodology employed is presented in Appendix B.
5.1 To Ensure Prudent Use of Land and Other Resources
A key sustainable development objective is to use finite natural resources (such as fossil fuels and land) more efficiently. Producing more with less, for example by reusing or recycling waste, reduces the environmental pollution and degradation caused by extraction, use and disposal of natural resources.
The choice of waste management option can have a significant influence on the consumption of finite natural resources. For example, reuse and recovery of materials should result in a reduction in the consumption of primary raw materials. Non-renewable resource depletion is assessed for both the recycling and composting and residual treatment tiers using the WISARD life cycle assessment tool, and is summarised in Appendix C Table C1a Recycling and Composting (performance scores) and C1a Residual Treatment. For ease of comparison Tables C1b Recycling and Composting and C1b Residual Treatment, as shown in Appendix C present the results as valued scores on the same scale. These scores indicate that with regard to recycling and composting Option 3 has the highest avoided burden (and therefore is the most sustainable) and Option 0 has the lowest avoided burden (and is therefore the least sustainable). A similar assessment is performed for the residual treatment options with Autoclave having the highest avoided burden (resulting in a more sustainable option) and the ‘do nothing’ or baseline residual treatment option having the lowest (and is therefore the least sustainable). Land is also a finite resource, and the emphasis of government policy is to `recycle’ the use of land and buildings through brownfield site development and re-use of buildings. Some waste management options require a larger footprint/land-take than others. Landtake is measured using professional judgement based on the typical size of different facilities. An estimate of landtake (in hectares) for each facility type is given in Appendix C Table C2a. A summary of the potential ‘total landtake’ for the recycling and composting options is given in Appendix C, Table C2b Recycling and Composting Summary, indicating that Option 0 requires a total of 114 hectares of land, whereas Option 3 only requires an estimated 46 hectares. Similarly, the ‘total landtake’ for the residual treatment and recovery options in Table C2b Landtake Impacts for Residual Treatment shows the baseline or ‘do nothing’ scenario requiring 26 hectares, whereas Energy from Waste (EfW) only requires an estimated 20 hectares. Therefore the overall ‘landtake’ for the highest scoring option plus optimum residual treatment is approximately 67 hectares.
5.2 To Reduce Greenhouse Gas Emissions
Global climate change is widely recognised as one of the greatest environmental challenges facing the world today. The clear message from the scientific community is that climate change is due, at least in part, to the increasing concentrations of greenhouse gases in the atmosphere.
A number of waste management operations give rise directly or indirectly to emissions of greenhouse gases. The decomposition of waste in landfill sites also produces methane (CH4), which is around 20 times more potent a greenhouse gas as CO2. A key objective of

Staffordshire and Stoke-on-Trent 18 402-1395-00001 Options Assessment Report November 2007
SLR Consulting Limited
the Landfill Directive is to reduce our reliance on landfill and to thereby cut methane emissions. Measurement of this sustainability objective is made through assessing greenhouse gas emissions for both the recycling and composting options and residual treatment and recovery options using the WISARD life cycle assessment tool. Scores are summarised in Appendix C, Table C1a Recycling and Composting (Performance Scores) and Table C1b Recycling and Composting (Valued Scores) indicating that for tier two, recycling and composting, Option 3 has the highest avoided burden (and therefore is the most sustainable) and Option 0 has the lowest avoided burden (and is therefore the least sustainable). Scores for the tier three, residual treatment as shown Tables C1a Residual Treatment (Performance Scores) and C1b Residual Treatment (Value Scores) indicate that Autoclave has the highest avoided burden (and therefore is the most sustainable) and the ‘do nothing’ or baseline scenario has the lowest avoided burden (and is therefore the least sustainable).
5.3 To Minimise Adverse Impacts on Air Quality and Public Health
A key sustainable development objective is to control air pollution in order to reduce the risks to human health, the natural environment and quality of life. Pollutants that raise more concerns to Government include: Nitrogen Dioxide; Sulphur Dioxide; Carbon Monoxide; particles (PM10); and Ozone. Measurement of these indicators is made for Options in tier two, recycling and composting and tier three, residual treatment and recovery using the WISARD life cycle assessment tool, and summarised in Appendix C, Table C1a (Performance Scores) and Table C1b (Valued Scores) for the following impact assessment categories: human toxicity, air acidification and ozone depletion. Human toxicity has been used as a proxy measure for public health. Tables C1a Recycling and Composting (Performance Scores) and C1b Recycling and Composting (Value Scores), and Tables C1a Residual Treatment and C1b Residual Treatment indicate the Options that have the highest avoided burden (and therefore are the most sustainable) through to the lowest avoided burden (and are therefore the least sustainable). For the recycling and composting tier Option 3 had the highest avoided burden and for the residual treatment and recovery tier Autoclave had the highest avoided burden. Air acidification, also summarised in Tables C1a and C1b and indicate that Option 3 for the recycling and composting, and Autoclave for residual treatment and recovery, have the highest avoided burden (and therefore are the most sustainable). Ozone depletion as summarised in Tables C1a and C1b and indicate that Option 3 for recycling and composting and EfW for residual treatment have the highest avoided burden (and therefore would be the most sustainable). The soiling of property through dust emission is a common cause of complaint. Dust is defined as small particles in the range 1-75 microns in diameter. Small particles of dust (PM10) are prejudicial to public health. A range of waste management processes potentially give rise to dust, particularly where mechanical operations and storage of waste take place in open air. Vehicle movements can also be a significant dust generator, both on and off site. Professional judgement based on experience of existing facilities is used to measure (on a nominal scale) the dust generation for each facility type, as shown in Table C3a, indicating that large landfills are 100 times more likely to have an adverse dust impact than a large transfer station. A summary of performance scores for dust for the recycling and

Staffordshire and Stoke-on-Trent 19 402-1395-00001 Options Assessment Report November 2007
SLR Consulting Limited
composting options are given in Appendix C, Table C3b Recycling and Composting, indicating that Option 0 scores worst and Option 3 scores best. Similarly, summary performances for the residual treatment and recovery options are presented in Table C3b, indicating that the ‘do nothing’ or baseline option scores worst and EfW scores best. Odour is a common cause of public concern in relation to waste management. Like dust, odours can be particularly acute where mechanical operations and storage of waste take place in open air. Odours are difficult and expensive to abate. Measurement of this indicator is made using professional judgement based on experience of existing facilities. A qualitative scoring allocation for each facility type is given in Table C3a. A summary of the total ‘dust and odour’ scores for recycling and composting Options and the residual treatment Options are given in Table C3b Recycling and Composting and C3b Residual Treatment, respectively, indicating Option 0 scores worst and Option 3 scores best for recycling and composting, and for residual treatment ’do nothing’ or baseline scenario scores worst and EfW scores best.
5.4 To Conserve Landscapes and Towns
Landscapes and townscapes have strong economic, social and community value. All waste management options involve the development of components such as buildings, processing plant, access roads, lighting/signage, storage mounds and perimeter bunds. These can generate impact on landscape (effects on the general landscape character and quality of the surrounding area) and visual impacts (including changes in available views, the effect of those changes on people and the overall impact on visual amenity). Whilst the extent of landscape and visual impacts is strongly influenced by the nature of the receiving environment, concern is likely to be greatest where options involve emissions stacks, large enclosed facilities or significant storage/disposal of waste above ground level. In this report measurement of this sustainability objective is made using professional judgement based on the typical nature, size and number of facilities proposed for each of the options considered. A qualitative scoring allocation for each facility type is given in Appendix C, Table C4a suggesting that landfills have a far greater impact than any other facility type. A summary of the total ‘landscape impact’ scores for recycling and composting, and residual treatment and recovery options are given in Table C4b Recycling and Composting and C4b Residual Treatment respectively. The tables indicate that Option 3 scores best for recycling and composting and EfW scores best for residual treatment and recovery.
5.5 To Protect Local Amenity
Living and working environments make an important contribution to ‘quality of life.’ In addition to attractive streets and buildings, access to green spaces, and community safety, low levels of noise and litter are also important considerations. All waste management options generate noise and litter, as they involve the storage, treatment and transport of waste. However, litter is most likely to be of concern where the waste is stored or processed/deposited in the open. Noise is most likely to be of concern in relation to sites that operate outside standard working hours, or use particularly noisy unenclosed plant (e.g. screening/crushing machinery). In this report measurement of this sustainability objective is made using professional judgement based on the current performance of existing facilities proposed for each of the options considered. For ‘noise impacts’ a qualitative scoring allocation for each facility type

Staffordshire and Stoke-on-Trent 20 402-1395-00001 Options Assessment Report November 2007
SLR Consulting Limited
is given in Appendix C, Table C5a. The table suggests that EfW and MBT facilities score noticeably worse than composting. A summary of the total ‘noise impact’ scores for recycling and composting is given in Appendix C, Table C5b Recycling and Composting, indicating Option 0 scores best and Options 2 and 3 score worst. A similar assessment is also conducted for the residual treatment impacts and is shown in Table C5b Residual Treatment in which the ‘do nothing’ or baseline options scores best with MBT and Autoclave scoring worst. For ‘litter impact’ a qualitative scoring allocation for each facility type is assumed to be the same for dust and odour impacts and therefore summarised in Table C3a. A summary of the total ‘litter impact’ scores for the recycling and composting options is given in Table C3b Recycling and Composting, indicating Option 0 scores worst and Option 3 scores best. Table C3b Residual Treatment shows a similar assessment for the residual treatment options, indicating that the ‘do nothing’ or baseline option scores worst and EfW scores best.
5.6 To Minimise Adverse Effects on Water Quality
All waste management options will create potential impacts on water as they involve the following: • The storage of waste (e.g. run off from rain and dust suppression sprays, leaching of
contaminants) • The transport of waste (e.g. run off from the delivery and tipping of materials, wheel
washing) • The operation of plant and vehicles (e.g. potential pollution from oil and solvents,
including the risk of accidental spillage). However, some waste management options present a greater risk to water quality than others, for example with recycling and composting options: • Composting: Leachate may be generated as part of the process. The liquor may
contain heavy metals and other contaminants. Similar assessments are also conducted for the residual treatment and recovery options • Anaerobic digestion: The process results in a digestate liquor which may contain high
levels of metals and other contaminants. • Incineration: Cooling and cleaning water may contain high levels of contaminants, whilst
the storage and disposal of ash and air pollution control residues poses a further threat to water quality.
• Landfill/landraising: The risk of pollution depends on the characteristics of the wastes, the standard of site engineering, the underlying geology and the proximity of water courses and abstraction points. The Environment Agency’s advice is that, however well engineered a landfill site, there is a risk of leachate release to the water environment.
In this report, WISARD has been used to quantify water eutrophication as a measure of water contamination and is summarised for recycling and composting in Appendix C, Table C1a Recycling and Composting (Performance Scores) and Table C1b Recycling and Composting (Valued Scores), indicating Option 0 scores worst and Option 3 scores best. A summary of the same test is also available for residual treatment in Table C1a Residual Treatment (Performance Scores) and C1b Residual Treatment (Value Scores), indicating that AD scores worst and Autoclave scores best.

Staffordshire and Stoke-on-Trent 21 402-1395-00001 Options Assessment Report November 2007
SLR Consulting Limited
Professional judgement has also been used to determine the current performance of the existing facilities. A qualitative scoring allocation for each facility type is given in Appendix C, Table C6a, suggesting the adverse impact of landfill is far greater than for all other facility types. A summary of the potential ‘water contamination impact’ scores for recycling and composting options is given in Table C6b Recycling and Composting, indicating Option 0 scores worst and Option 3 scores best. Scores for residual treatment options are presented in Table C6b Residual Treatment and indicate that the ‘do nothing’ or baseline scenario scores worst and EfW scores best.

Staffordshire and Stoke-on-Trent 22 402-1395-00001 Options Assessment Report November 2007
SLR Consulting Limited
6 SOCIO ECONOMIC RELATED INDICATORS
A further explanation of the scoring methodology employed is presented in Appendix B.
6.1 To Minimise Local Transport Impacts
An efficient transport system is needed to support a strong and prosperous economy and to maintain and improve people’s quality of life. However, congestion and unreliability of journeys add to the costs of business, and undermine competitiveness. Major traffic arteries cause ‘severance’ within a community when people become separated from places and other people; and ‘fear and intimidation’ amongst pedestrians. Heavy levels of traffic also damage towns and cities, and harm the countryside. All waste management options have local transport impacts as they involve some degree of off-site movement of waste. The scale of impacts will be influenced by factors such as vehicle size, frequency of vehicle movements, road/pavement width, and traffic speeds. The scope to mitigate or avoid impacts (e.g. by avoiding sensitive receptors, restricting hours of operation and ‘backloading’ vehicles) is also important. Measurement of this sustainability objective uses total waste kilometres travelled for each recycling and composting option. This information is estimated from input data to the WISARD modelling undertaken and the total distance travelled for each of the Options 0 - 3 is presented in Appendix C, Table C7 Recycling and Composting. As the recycling rate increases so does the relative distance travelled due to an increase in the number of recyclables collected and requiring distribution.
6.2 To Provide Employment Opportunities
A high employment rate is one of the key objectives of sustainable development. It is considered that employment enables people to meet their needs and improve their living standards, and thereby to help tackle poverty and social exclusion. Development of new waste management facilities will create temporary construction employment, which may be available to local people, and their long-term operation will create jobs, the nature of which will depend on the facility. Professional judgement based on experience of job creation at existing facilities is made to measure this sustainability objective. A qualitative scoring allocation for the recycling and composting options is presented in Appendix C, Table C8a Recycling and Composting with Option 3 scoring best which suggests that the greater the recycling the greater number of jobs created. A similar qualitative scoring allocation is also calculated for each facility type and is given in Table C8a, suggesting facilities employing greater than 10 staff include all MBT, most EfW and large MRFs and large In-Vessel Composting facilities. A summary of the ‘total jobs’ estimated for residual treatment is given in Table C8b Residual Treatment, indicating that the ‘do nothing’ or baseline scenario scores worst and MBT (biostabilisation) scores best.
6.3 To Provide Opportunities for Public Involvement and Education
Public participation is at the heart of sustainable development. Indeed, the notion of ‘thinking globally, acting locally’ underpins the Local Agenda 21 process.

Staffordshire and Stoke-on-Trent 23 402-1395-00001 Options Assessment Report November 2007
SLR Consulting Limited
In this context it is important for the Government, locally and regionally, to ‘send the right signals’ to the public in order to encourage changes in behaviour and lifestyles. Measurement of this sustainability objective is made using professional judgement based on experience of existing facilities and the extent to which they are likely to provide opportunities for positive public involvement. A qualitative scoring allocation for each facility type is given in Table C9a, suggesting the facilities with least opportunity include landfill, transfer stations, EfW and AD. A summary of the potential ‘public involvement’ scores for recycling and composting options is given in Appendix C, Table C9b Recycling and Composting, indicating Option 0 scores worst and Option 3 scores best. Scores for public involvement associated with residual treatment are shown in Table C9b with the ‘do nothing’ or baseline option scoring worst and AD, MBT (Bio), MBT (RDF) and Autoclave scoring best.

Staffordshire and Stoke-on-Trent 24 402-1395-00001 Options Assessment Report November 2007
SLR Consulting Limited
7 OPERATIONAL RELATED INDICATORS
A further explanation of the scoring methodology employed is presented in Appendix B.
7.1 To Minimise the Costs of Waste Management
Costs are clearly a key concern for local authorities, waste contractors and the general public and can have a significant impact in determining the nature of waste management to be developed. The principal costs relate to waste collection and waste treatment/disposal. It should be noted that no account of any potential LATS fines have been considered within this assessment. Professional judgement based on experience of waste management costs is made to measure this sustainability indicator. Unit costs and their derivation are provided for each waste treatment, disposal and transfer route and are generally based on current costs. The exception to this is landfill tax for active wastes which has been assumed to increase to £35/t prior to 2020, the assessment year. Unit costs assumed within this assessment are summarised within Appendix C, Table C10a. A detailed assessment of the costs for each recycling and composting option is summarised in Appendix C, Table C10b Recycling and Composting, indicating Option 3 to be the most expensive and Option 0 the least expensive. A similar assessment for the residual treatment options is summarised in Table C10b Residual Treatment, indicating the ‘do nothing’ or baseline scenario to be most expensive and EfW the least expensive.
7.2 To Ensure Reliability of Delivery
Although a waste management option may perform well against a range of indicators, it may not be possible to implement the option due to practical constraints. Such constraints may include: • Availability of financial resources. • Technological issues, related to the availability of the appropriate plant and machinery • Difficulties in obtaining planning consents These constraints are extremely difficult to predict. Nonetheless, measurement of this objective in this report is made using a qualitative assessment based on planning likelihood, hours of operation, and perceived adverse environmental and health impacts. Planning likelihood takes into consideration the existing Stoke Energy from Waste facility. A qualitative scoring allocation for each facility type is given in Appendix C, Table C11a, suggesting MBT facilities are least likely to be deliverable. A summary of the total ‘deliverability’ scores for the recycling and composting options are given in Appendix C, Table C11b Recycling and Composting, indicating Options 0 is the most deliverable whereas Option 2 is least likely to be delivered. A similar assessment for the residual treatment options is summarised in Table C11b Residual Treatment indicating that the ‘do nothing’ baseline scenario is most likely to be deliverable and MBT (RDF) and Autoclave are least likely to be deliverable.

Staffordshire and Stoke-on-Trent 25 402-1395-00001 Options Assessment Report November 2007
SLR Consulting Limited
8 WASTE MANAGEMENT POLICY RELATED INDICATORS
A further explanation of the scoring methodology employed is presented in Appendix B.
8.1 To Conform with Waste Policy
The Government actively promotes the waste hierarchy, including (in the following order of preference) waste reduction, re-use, recycling and composting, energy recovery, with disposal as a last resort. The Government also wishes to see waste managed in line with the proximity principle which states that waste should generally be disposed of as near to its source as possible. This is in part to ensure that waste problems are not simply exported to other regions or countries, and also recognises that the transportation of wastes can have significant environmental impacts.
The principal aim of this waste assessment process is to comply with local, national and European waste policy. A range of statutory and non statutory targets have been used to develop the options described earlier in this report. Measurement of this sustainability objective is through assessment of the percentage landfill and recycling achieved for each option considered. A summary of performance for each recycling and composting option is summarised in Table C12a Recycling and Composting. Options 3 achieves 55% recycling and source segregated composting of municipal wastes by 2020, followed by Options 2 and 1 achieving 50% and 45% respectively, and Option 0 only 31%. The highest landfill requirement is for Option 0. The tier 3 residual treatment options stage will only be assessed using the preferred option from tier 2 and therefore this assessment criteria will only compare the percentage to landfill. Table C12a Residual Treatment shows EfW with the least amount of waste to landfill at 15% and the ‘do nothing’ or baseline scenario sending the highest amount at 29%.

Staffordshire and Stoke-on-Trent 26 402-1395-00001 Options Assessment Report November 2007
SLR Consulting Limited
9 PERFORMANCE OF OPTIONS
The assessment criteria discussed in previous sections represents a comprehensive sustainability and environmental appraisal framework for assessment of the three tiers, minimisation and re-use, recycling and composting, and residual waste treatment. Wherever possible, the performance of each option against the above criteria has been quantified, for example through the use of the Environment Agency’s WISARD life cycle assessment tool. Where this is not possible a qualitative assessment of performance has been made.
9.1 Overall Performance Scores
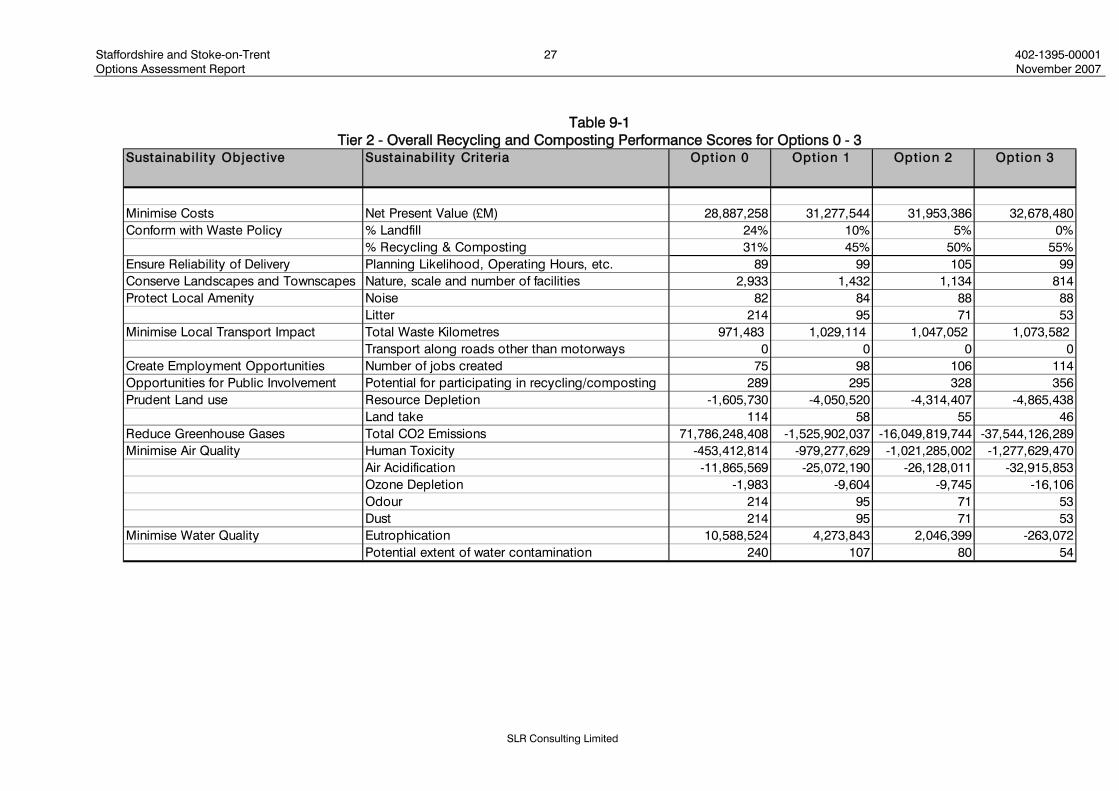
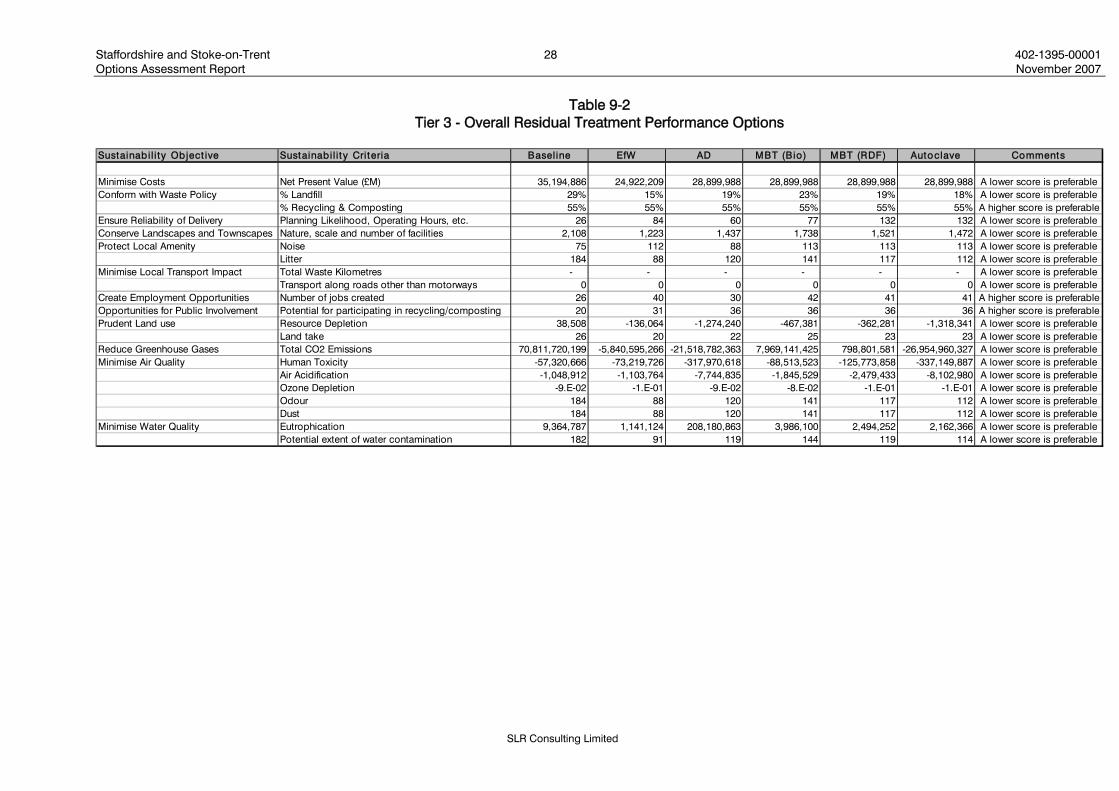
The purpose of appraising the performance of Options in tier two and three against the objectives and indicators summarised in Section 8 is to inform decision makers about their relative advantages and disadvantages. The appraisal undertaken in this report is systematic in scoring each option within the tier against each indicator. The overall performance scores for Options in tier two and tier three are presented in Table 9-1 and Table 9-2 respectively. Analysis of Tables 9.1 and 9.2 is difficult because of the matrix’s complexity and the use of different units for each sustainability criterion. Establishing ‘valued’ performance scores provides a possible solution to this problem and thus is discussed in the next section.
9.2 Valued Performance Scores
‘Valued’ performance scores interpret overall performance scores on a scale of 0 to 1, where 0 is the worst performance, and 1 the best. This enables the discrepancy between scores to be retained, whilst allowing the performance of options against all criteria to be placed on a common scale. In this report it is assumed that a linear relationship exists between the best and worst ‘value’ scores. This approach is used to apply a linear function relationship to the performance scores and the resulting ‘valued’ performance scores for recycling and composting and residual treatment are summarised in Table 9-3 and Table 9-4 respectively. Tables 9.3 and indicates that should each evaluation criteria be given equal weighting the higher scoring recycling and composting option is Option 3, the higher recycling rate of 55% and the lowest scoring option is the baseline, Option 0 therefore indicating preference for higher recycling and composting and a higher diversion away from landfill. The ‘valued’ performance scores for tier 3 are summarised in Table 9.4 and shows an equal preference for both EfW and Autoclave based on the 21 assessment criteria with the ‘do nothing’ scenario scoring the lowest and therefore also indicating preference for higher diversion away from landfill.
Staffordshire and Stoke-on-Trent 27 402-1395-00001 Options Assessment Report November 2007
SLR Consulting Limited
Table 9-1
Tier 2 - Overall Recycling and Composting Performance Scores for Options 0 - 3 Sustainabil i ty Object ive Sustainabil i ty Criteria Opt ion 0 Opt ion 1 Opt ion 2 Opt ion 3
Minimise Costs Net Present Value (£M) 28,887,258 31,277,544 31,953,386 32,678,480Conform with Waste Policy % Landfill 24% 10% 5% 0%
% Recycling & Composting 31% 45% 50% 55%Ensure Reliability of Delivery Planning Likelihood, Operating Hours, etc. 89 99 105 99Conserve Landscapes and Townscapes Nature, scale and number of facilities 2,933 1,432 1,134 814Protect Local Amenity Noise 82 84 88 88
Litter 214 95 71 53Minimise Local Transport Impact Total Waste Kilometres 971,483 1,029,114 1,047,052 1,073,582
Transport along roads other than motorways 0 0 0 0Create Employment Opportunities Number of jobs created 75 98 106 114Opportunities for Public Involvement Potential for participating in recycling/composting 289 295 328 356Prudent Land use Resource Depletion -1,605,730 -4,050,520 -4,314,407 -4,865,438
Land take 114 58 55 46Reduce Greenhouse Gases Total CO2 Emissions 71,786,248,408 -1,525,902,037 -16,049,819,744 -37,544,126,289Minimise Air Quality Human Toxicity -453,412,814 -979,277,629 -1,021,285,002 -1,277,629,470
Air Acidification -11,865,569 -25,072,190 -26,128,011 -32,915,853Ozone Depletion -1,983 -9,604 -9,745 -16,106Odour 214 95 71 53Dust 214 95 71 53
Minimise Water Quality Eutrophication 10,588,524 4,273,843 2,046,399 -263,072Potential extent of water contamination 240 107 80 54
Staffordshire and Stoke-on-Trent 28 402-1395-00001 Options Assessment Report November 2007
SLR Consulting Limited
Table 9-2 Tier 3 - Overall Residual Treatment Performance Options
Sustainabil i ty Object ive Sustainabil i ty Criteria Baseline EfW AD MBT (Bio) MBT (RDF) Autoclave Comments
Minimise Costs Net Present Value (£M) 35,194,886 24,922,209 28,899,988 28,899,988 28,899,988 28,899,988 A lower score is preferableConform with Waste Policy % Landfill 29% 15% 19% 23% 19% 18% A lower score is preferable
% Recycling & Composting 55% 55% 55% 55% 55% 55% A higher score is preferableEnsure Reliability of Delivery Planning Likelihood, Operating Hours, etc. 26 84 60 77 132 132 A lower score is preferableConserve Landscapes and Townscapes Nature, scale and number of facilities 2,108 1,223 1,437 1,738 1,521 1,472 A lower score is preferableProtect Local Amenity Noise 75 112 88 113 113 113 A lower score is preferable
Litter 184 88 120 141 117 112 A lower score is preferableMinimise Local Transport Impact Total Waste Kilometres - - - - - - A lower score is preferable
Transport along roads other than motorways 0 0 0 0 0 0 A lower score is preferableCreate Employment Opportunities Number of jobs created 26 40 30 42 41 41 A higher score is preferableOpportunities for Public Involvement Potential for participating in recycling/composting 20 31 36 36 36 36 A higher score is preferablePrudent Land use Resource Depletion 38,508 -136,064 -1,274,240 -467,381 -362,281 -1,318,341 A lower score is preferable
Land take 26 20 22 25 23 23 A lower score is preferableReduce Greenhouse Gases Total CO2 Emissions 70,811,720,199 -5,840,595,266 -21,518,782,363 7,969,141,425 798,801,581 -26,954,960,327 A lower score is preferableMinimise Air Quality Human Toxicity -57,320,666 -73,219,726 -317,970,618 -88,513,523 -125,773,858 -337,149,887 A lower score is preferable
Air Acidification -1,048,912 -1,103,764 -7,744,835 -1,845,529 -2,479,433 -8,102,980 A lower score is preferableOzone Depletion -9.E-02 -1.E-01 -9.E-02 -8.E-02 -1.E-01 -1.E-01 A lower score is preferableOdour 184 88 120 141 117 112 A lower score is preferableDust 184 88 120 141 117 112 A lower score is preferable
Minimise Water Quality Eutrophication 9,364,787 1,141,124 208,180,863 3,986,100 2,494,252 2,162,366 A lower score is preferablePotential extent of water contamination 182 91 119 144 119 114 A lower score is preferable

Staffordshire and Stoke-on-Trent 29 402-1395-00001 Options Assessment Report November 2007
SLR Consulting Limited
Table 9-3 Tier 2 - Valued Recycling and Composting Scores for Options 0 – 3
Sustainabil i ty Object ive Sustainabil i ty Criteria Opt ion 0 Opt ion 1 Opt ion 2 Opt ion 3
Minimise Costs Net Present Value (£M) 1.00 0.37 0.19 0.00Conform with Waste Policy % Landfill 0.00 0.59 0.80 1.00
% Recycling & Composting 0.00 0.59 0.80 1.00Ensure Reliability of Delivery Planning Likelihood, Operating Hours, etc. 1.00 0.40 0.00 0.36Conserve Landscapes and Townscapes Nature, scale and number of facilities 0.00 0.71 0.85 1.00Protect Local Amenity Noise Impact 1.00 0.65 0.00 0.05
Litter Impact 0.00 0.74 0.89 1.00Minimise Local Transport Impact Total Waste Kilometres 1.00 0.44 0.26 0.00
Transport along roads other than motorways 1.00 1.00 1.00 1.00Create Employment Opportunities Number of jobs created 0.00 0.59 0.82 1.00Opportunities for Public Involvement Potential for participating in recycling/composting 0.00 0.09 0.58 1.00Prudent Land use Resource Depletion 0.00 0.75 0.83 1.00
Land take 0.00 0.83 0.87 1.00Reduce Greenhouse Gases Total CO2 Emissions 0.00 0.67 0.80 1.00Minimise Air Quality Impact Human Toxicity 0.00 0.64 0.69 1.00
Air Acidification 0.00 0.63 0.68 1.00Ozone Depletion 0.00 0.54 0.55 1.00Odour 0.00 0.74 0.89 1.00Dust 0.00 0.74 0.89 1.00
Minimise Water Quality Impact Eutrophication 0.00 0.58 0.79 1.00Potential extent of water contamination 0.00 0.71 0.86 1.00
TOTAL VALUED PERFORMANCE SCORES 5.0 13.0 14.0 17.4Note: A score of 1 represents the best option … a score of 0 represents the worst of options

Staffordshire and Stoke-on-Trent 30 402-1395-00001 Options Assessment Report November 2007
SLR Consulting Limited
Table 9-4 Tier 3 - Valued Scores for Residual Treatment Options
Sustainabili ty Object ive Sustainabili ty Criteria Baseline EfW AD MBT (Bio) MBT (RDF) Autoclave
Minimise Costs Net Present Value (£M) 0.00 1.00 0.61 0.61 0.61 0.61Conform with Waste Policy % Landfill 0.00 1.00 0.70 0.46 0.70 0.75
% Recycling & Composting 1.00 1.00 1.00 1.00 1.00 1.00Ensure Reliability of Delivery Planning Likelihood, Operating Hours, etc. 1.00 0.45 0.68 0.52 0.00 0.00Conserve Landscapes and Townscapes Nature, scale and number of facilities 0.00 1.00 0.76 0.42 0.66 0.72Protect Local Amenity Noise Impact 1.00 0.04 0.67 0.01 0.00 0.01
Litter Impact 0.00 1.00 0.66 0.45 0.70 0.75Minimise Local Transport Impact Total Waste Kilometres 1.00 1.00 1.00 1.00 1.00 1.00
Transport along roads other than motorways 1.00 1.00 1.00 1.00 1.00 1.00Create Employment Opportunities Number of jobs created 0.00 0.90 0.25 1.00 0.96 0.96Opportunities for Public Involvement Potential for participating in recycling/composting 0.00 0.66 0.98 1.00 0.98 0.98Prudent Land use Resource Depletion 0.00 0.13 0.97 0.37 0.30 1.00
Land take 0.00 1.00 0.70 0.26 0.49 0.55Reduce Greenhouse Gases Total CO2 Emissions 0.00 0.78 0.94 0.64 0.72 1.00Minimise Air Quality Impact Human Toxicity 0.00 0.06 0.93 0.11 0.24 1.00
Air Acidification 0.00 0.01 0.95 0.11 0.20 1.00Ozone Depletion 0.13 1.00 0.19 0.00 0.65 0.47Odour 0.00 1.00 0.66 0.45 0.70 0.75Dust 0.00 1.00 0.66 0.45 0.70 0.75
Minimise Water Quality Impact Eutrophication 0.96 1.00 0.00 0.99 0.99 1.00Potential extent of water contamination 0.00 1.00 0.69 0.42 0.69 0.74
TOTAL VALUED PERFORMANCE SCORES 6.1 16.0 15.0 11.3 13.3 16.0
Staffordshire and Stoke-on-Trent 31 402.1395.00001 Options Assessment Report November 2007
SLR Consulting Limited
10 WEIGHTING OF SUSTAINABILITY INDICATORS
It is unlikely that each assessment criterion is of equal significance. It is therefore necessary to apply additional weight to those criteria which are of greater importance. At present there is no national guidance on the relative significance of each performance criteria. A weightings consultation exercise has not as yet been carried out for Staffordshire and Stoke-on-Trent. In order to provide an example of such assessment, the results from a consultation exercise undertaken by the East Midlands Region Technical Advisory Board have been used and a summary of responses is given in Table 10.1.

Staffordshire and Stoke-on-Trent 32 402.1395.00001 Options Assessment Report November 2007
SLR Consulting Limited
Table 10-1 Weighting of EMRTAB Consultation Evaluation Criteria
Environmental Object ives Weight ing Ranking Weight ing Rankinga) Depletion of resources, such as wood, w 7.07% 3b) Landtake 5.05% 7
2. To reduce greenhouse gas emissions 6.1% 8 c) Greenhouse gases emitted 6.06% 5d) Emissions which are injurious to public h 8.08% 1e) Emisions contributing to air acidification 4.04% 12f) Emissions contributing to depletion of the 5.05% 7g) Extent of odour problems 3.03% 16h) Extend of dust problems 3.03% 16
4. To conserve landscapes and townscapes 4.0% 10 i) Extent of visual and landsacpe impacts 4.04% 12j) Extent of noise problems 2.02% 20k) Extent of litter and vermin problems 2.02% 20l) Emissions contributing to eutrophication 3.03% 16m) Extent of water pollution 4.04% 12
Socio-economic Object ives Weight ing Ranking Weight ing Rankingn) Total waste kilometres (by mode) 5.05% 7o) Transport along roads other than motorw 4.04% 12
8. To provide employment opportunities 3.0% 12 p) Number of jobs likely to be created 3.03% 16
Operat ional Object ives Weight ing Ranking Weight ing Ranking
Waste Management Policy Object ives Weight ing Ranking Weight ing Rankingt) Percentage landfill 5.05% 7u) Percentage recycled/composted 6.06% 5
q) Extent of opportunitites for public involvement and education (concerning
Socio-economic Indicators
1
5. To protect local amenity
6. To minimise adverse effects on water quality
3. To minimise adverse impacts on air quality and public health
23.2%
INDICATORS/CRITERIAOBJECTIVESEnvironmental Indicators
12.1% 21. To ensure prudent use of land and other resources
Waste Management Policy Indicators
s) Likelihood of implementation wihtin required timescale, taking account of maturity of technology, necessary level of public participation, and the need for
r) Costs of collection, management and disposal, including material and energy
Operat ional Indicators
12. To conform to waste policy
9. To provide opportunities for public involvement and education
9.1%
5.1%
8.1%
7.1%11. To ensure reliability of delivery
7. To minimise local transport impacts (congestion, severence, fear and
10. To minimise the increased costs of waste management
3
5
4.0%
7.1%
11.1%
6
9
6
10
4
5.05% 7
7.07% 3
8.08% 1

Staffordshire and Stoke-on-Trent 33 402.1395.00001 Options Assessment Report November 2007
SLR Consulting Limited
11 SENSITIVITY ANALYSIS
The adopted approach for identifying the preferred option ensures that a number of significant indicators are addressed explicitly in arriving at a choice of option. However, the process has inherent uncertainties, associated with the choice of options, the chosen indicators and the weights derived for the indicators. To examine the robustness of the overall results, an examination of their sensitivity to these uncertainties should be undertaken. Sensitivity analysis has been carried out by: • Sum all of the criteria or some of the criteria. The eight options for consideration have
been assessed by considering all the selected assessment criteria. A form of sensitivity analysis is to remove criteria and assess if and how the results change. This process has been undertaken by reducing the number of criteria from 21 (the assessment described and undertaken above) to a reduced number of 10. The assessment included in this sensitivity analysis comprise the WISARD related factors (eutrophication, acidification, depletion of resources, human toxicity, ozone depletion and global warming), deliverability, cost and conforming to waste policy. The results of this analysis are discussed below.
Further sensitivity analysis could be undertaken by:
• Change weightings applied to each indicator. This could be carried out by inverting the
weightings, such that the highest weighted indicator becomes the lowest weighted indicator and vice versa. This analysis has been undertaken using EMRTAB weightings as an example; the results of this analysis are discussed below.
• Addition of indicators. Further indicators could be added if considered an issue by stakeholders, for example, aerosol emmissions from composting or dioxins from incineration. We have not included this type of sensitivity analysis in this study as it is considered the 21 criteria used reflect the full scope of sustainability objectives required for an assessment fo this type.
The results of a sensitivity analysis using inverted weightings for recycling and composting are presented in Table 11-1 and Table 11-2 Comparison of the ranked scores in, given in Table 11-1, shows that a weightings inversion has no effect on the ranked performance with regards to the preferred option assessment – Option 3 remains the preferred options and Option 0 remains as the least preferable option. Table 11-2 shows detailed overall valued performance scores determined on the basis of inverted weightings. A similar assessment for the residual treatment options is also presented in Tables 11-3 and 11-4 and show that a weightings inversion puts the Autoclave option as the preferred option with EfW as second preference with all other residual treatment options remaining the same. The difference in scores between Autoclave and EfW is minimal with only 0.2 of a point between each facility type.

Staffordshire and Stoke-on-Trent 34 402.1395.00001 Options Assessment Report November 2007
SLR Consulting Limited
Table 11-1 Tier 2 - Sensitivity Assessment of Recycling and Composting Options using Inverted
Regional Weightings Option 0 Option 1 Option 2 Option 3
23.91 62.33 66.55 84.23
Option 0 Option 1 Option 2 Option 3
4 3 2 1
TOTAL INVERTED REGIONAL WEIGHTED PERFORMANCE SCORES
RANKED INVERTED REGIONAL WEIGHTED SCORES
Table 11-2 Tier 2 - Sensitivity Analysis Weighted Performance Scores for Recycling and Composting Options Sustainability Objective Sustainability Criteria Option 0 Option 1 Option 2 Option 3
Minimise Costs Net Present Value (£M) 4.04 1.49 0.77 0.00Conform with Waste Policy % Landfill 0.00 1.80 2.41 3.03
% Recycling & Composting 0.00 1.80 2.41 3.03Ensure Reliability of Delivery Planning Likelihood, Operating Hours, etc. 5.05 2.03 0.00 1.82Conserve Landscapes and Townscapes Nature, scale and number of facilities 0.00 4.77 5.72 6.73Protect Local Amenity Noise Impact 4.71 3.08 0.00 0.25
Litter Impact 0.00 1.50 1.80 2.02Minimise Local Transport Impact Total Waste Kilometres 4.04 1.76 1.05 0.00
Transport along roads other than motorways 6.06 6.06 6.06 6.06Create Employment Opportunities Number of jobs created 0.00 2.96 4.12 5.05
Opportunities for Public InvolvementPotential for participating in recycling/composting 0.00 0.43 2.74 4.71
Prudent Landuse Resource Depletion 0.00 1.52 1.68 2.02Landtake 0.00 5.59 5.83 6.73
Reduce Greenhouse Gases Total CO2 Emissions 0.00 2.71 3.25 4.04Minimise Air Quality Impact Human Toxicity 0.00 3.22 3.48 5.05
Air Acidification 0.00 5.07 5.48 8.08Ozone Depletion 0.00 3.63 3.70 6.73Odour 0.00 3.74 4.49 5.05Dust 0.00 3.49 4.19 4.71
Minimise Water Quality Impact Eutrophication 0.00 3.53 4.77 6.06Potential extent of water contamination 0.00 2.15 2.60 3.03
TOTALVALUED PERFORMANCE SCORES 23.91 62.33 66.55 84.23
Table 11-3 Tier 3 - Sensitivity Assessment of Residual Treatment Options using Inverted Regional
Weightings Baseline EfW AD MBT (Bio) MBT (RDF) Autoclave
29.60 75.18 69.33 51.34 61.99 75.38
Baseline EfW AD MBT (Bio) MBT (RDF) Autoclave
6 2 3 5 4 1
TOTAL INVERTED REGIONAL WEIGHTED PERFORMANCE SCORES
RANKED INVERTED REGIONAL WEIGHTED SCORES

Staffordshire and Stoke-on-Trent 35 402.1395.00001 Options Assessment Report November 2007
SLR Consulting Limited
Table 11-4 Tier 3 - Sensitivity Analysis Weighted Performance Scores for Residual Treatment Options
Sustainability Objective Sustainability Criteria Baseline EfW AD MBT (Bio) MBT (RDF) Autoclave
Minimise Costs Net Present Value (£M) 0.00 4.04 2.48 2.48 2.48 2.48Conform with Waste Policy % Landfill 0.00 3.03 2.14 1.38 2.11 2.26
% Recycling & Composting 3.03 3.03 3.03 3.03 3.03 3.03Ensure Reliability of Delivery Planning Likelihood, Operating Hours, etc. 5.05 2.26 3.42 2.63 0.00 0.01Conserve Landscapes and Townscapes Nature, scale and number of facilities 0.00 6.73 5.11 2.81 4.46 4.84Protect Local Amenity Noise Impact 4.71 0.20 3.18 0.03 0.00 0.05
Litter Impact 0.00 2.02 1.34 0.90 1.41 1.51Minimise Local Transport Impact Total Waste Kilometres 4.04 4.04 4.04 4.04 4.04 4.04
Transport along roads other than motorways 6.06 6.06 6.06 6.06 6.06 6.06Create Employment Opportunities Number of jobs created 0.00 4.56 1.26 5.05 4.87 4.83
Opportunities for Public InvolvementPotential for participating in recycling/composting 0.00 3.10 4.62 4.71 4.62 4.60
Prudent Landuse Resource Depletion 0.00 0.26 1.95 0.75 0.60 2.02Landtake 0.00 6.73 4.70 1.76 3.27 3.71
Reduce Greenhouse Gases Total CO2 Emissions 0.00 3.17 3.82 2.60 2.89 4.04Minimise Air Quality Impact Human Toxicity 0.00 0.29 4.70 0.56 1.24 5.05
Air Acidification 0.00 0.06 7.67 0.91 1.64 8.08Ozone Depletion 0.89 6.73 1.27 0.00 4.37 3.19Odour 0.00 5.05 3.34 2.26 3.51 3.77Dust 0.00 4.71 3.12 2.11 3.28 3.52
Minimise Water Quality Impact Eutrophication 5.82 6.06 0.00 5.98 6.02 6.03Potential extent of water contamination 0.00 3.03 2.08 1.29 2.10 2.25
TOTALVALUED PERFORMANCE SCORES 29.60 75.18 69.33 51.34 61.99 75.38
Staffordshire and Stoke-on-Trent 36 402.1395.00001 Options Assessment Report November 2007
SLR Consulting Limited
12 CONCLUSIONS AND DISCUSSION
By adopting the methodology described in this report it is possible to compare different options against a number of different assessment criteria. This assessment has considered a number of options within each of the three assessment tiers for management of waste in 2020 (assessment year) and are comprised of: • Minimisation and re-use - Tier 1; • Recycling and composting – Tier 2; and • Residual treatment - Tier 3 Minimisation and Re-use The preferred growth rate scenario assumes that the annual growth in MSW per household will start to decline after 2010 and from 2016 it is anticipated that there will no longer be an increase in waste arisings per household per year. It is assumed that minimisation and re-use initiatives, as part of the waste strategy will encourage the reduction of waste being created and any increase in total household waste will be attributable to the increase in houses built. The introduction of waste minimisation and re-use initiatives can be co-ordinated at the County level so as to take advantage of an integrated public awareness campaign which would demonstrate clear and unified messages across the Districts and deliver potential cost savings associated with solitary communication campaigns and marketing materials. Recycling and Composting A total of four recycling and composting options were developed for appraisal in the Tier 2 analysis; • Option 0 – “Stay as you are target of 31% for household waste (equivalent to 28% of
MSW)” • Option 1 – “Conservative target of 45% for household waste (equivalent to 41% of
MSW)” • Option 2 – “Meet proposed National target of 50% for household waste (equivalent to
46% of MSW)” • Option 3 – “Exceed proposed National target 55% for household waste (equivalent to
50% of MSW)” The Tier 2 recycling and composting assesses of each options against a total of 21 criteria (Environmental, Socio-Economic, Operational, and Waste Management Policy objectives). The result of the options assessment process identifies Option 3, 55% household recycling rate (50% MSW) as the preferred option with Option 0 31% recycling and composting scoring lowest of all options assessed. Option 3, 55% recycling and composting has been taken forward to the third tier (residual treatment) of the options assessment process. Residual Treatment Following the recycling and composting of waste, there is an element of the residual waste stream remaining. The waste hierarchy states that the treatment and recovery of waste to

Staffordshire and Stoke-on-Trent 37 402.1395.00001 Options Assessment Report November 2007
SLR Consulting Limited
recover value, heat and/or power is more beneficial than the disposal (the lowest level of the waste hierarchy) of residual waste. Tier 3 of the options appraisal focuses on identifying the technology process with the highest score, or lowest environmental, socio-economic, operational and policy impacts. The range of technology processes assessed includes landfill (as the baseline situation) plus all other technology process that are deemed to be operational and achievable in the UK market. Currently, a significant proportion (circa 180,000 tonnes) of residual waste is treated at the Stoke-on-Trent incinerator. This incinerator, will be part of all future waste management options, and therefore has been included as a constant in the Tier 3 assessment. The non recycled and composted proportion of the waste stream, minus that residual waste sent Stoke is assessed with the technologies identified below: • Energy from Waste; • Mechanical Biological Treatment (MBT) (RDF); • Mechanical Biological Treatment (Biostabilisation); • Anaerobic Digestion; and • Autoclave The performance scores for the tier 3 assessment show an equal preference for both EfW and Autoclave based on the 21 assessment criteria with the baseline scenario scoring the lowest and therefore also indicating preference for higher diversion away from landfill. Following this extensive three tier assessment process the final results for the preferred joint waste strategy option for Staffordshire and Stoke-on-Trent suggest a recycling and composting target of 55% of household waste (equivalent to 50% total MSW) by 2020 with all remaining residual waste13 to either an energy from waste (EfW) or Autoclave facility. The preparation of the final waste strategy will require a decision as to which of these facilities is taken forward as the preferred option. There are a number of comparisons which the City and County may wish to analyse when considering which technology is the preferred and most appropriate residual treatment option. Factors to consider may include; • the extent to which the preferred technology is established and proven within this
country; • the predicted availability of sustainable markets for residual treatment output
(autoclave RDF and EfW bottom ash); • the ability to divert BMW from landfill; • number of treatment stages and percentage of material requiring secondary landfill;
and • direct cost comparison It is clear from the options assessment undertaken that the higher recycling performance option will conform to the highest ranking option. The conclusion therefore at this stage, in the absence of any local weighting, is that high recycling should form an essential part of the overarching framework for the Staffordshire and Stoke-on-Trent Municipal Waste Management Strategy, with little or no untreated waste to landfill and the remainder of the waste sent to a recovery process. This framework can be summarised as follows:
13 Excluding rubble

Staffordshire and Stoke-on-Trent 38 402.1395.00001 Options Assessment Report November 2007
SLR Consulting Limited
• Increased recycling: Combined household recycling and composting target of 55% (equivalent to 50% of all MSW)
• Recovering benefit from all remaining MSW: Sending approximately 50%14 of all MSW for recovery
• Zero waste to Landfill: Minimising all forms of waste to landfill through increased recycling followed by maximum recovery of all remaining residual waste, thus placing landfill as the last and final option
Agreement on the above outline strategic framework will enable development of the final MSW strategy. Assessment of the short to medium term needs with respect to improvements in recycling and composting can then also be made. The development of the strategy provides essential support to future contract procurement for MSW management.
14 5% of the MSW total is rubble which is recycled at the HWRCs, and therefore does not require further residual treatment. Government definitions exclude rubble from household waste recycling figures.